Attached files
| file | filename |
|---|---|
| 8-K - CURRENT REPORT - PennyMac Mortgage Investment Trust | pmt_8k.htm |
| EX-99.1 - PRESS RELEASE - PennyMac Mortgage Investment Trust | pmt_8k-ex9901.htm |
Exhibit 99.2

PennyMac Mortgage Investment Trust February 4, 2015 Fourth Quarter 2014 Earnings Report

4Q14 Earnings Report 2 This presentation contains forward - looking statements within the meaning of Section 21 E of the Securities Exchange Act of 1934 , as amended, regarding management’s beliefs, estimates, projections and assumptions with respect to, among other things, the Company’s financial results, future operations, business plans and investment strategies, as well as industry and market conditions, all of which are subject to change . Words like “believe,” “expect,” “anticipate,” “promise,” “plan,” and other expressions or words of similar meanings, as well as future or conditional verbs such as “will,” “would,” “should,” “could,” or “may” are generally intended to identify forward - looking statements . Actual results and operations for any future period may vary materially from those projected herein, from past results discussed herein, or illustrative examples provided herein . Factors which could cause actual results to differ materially from historical results or those anticipated include, but are not limited to : changes in our investment objectives or investment or operational strategies ; volatility in our industry, the debt or equity markets, the general economy or the residential finance and real estate markets ; changes in general business, economic, market, employment and political conditions or in consumer confidence ; declines in residential real estate or significant changes in U . S . housing prices or activity in the U . S . housing market ; availability of, and level of competition for, attractive risk - adjusted investment opportunities in residential mortgage loans and mortgage - related assets that satisfy our investment objectives ; concentration of credit risks to which we are exposed ; the degree and nature of our competition ; our dependence on our manager and servicer, potential conflicts of interest with such entities, and the performance of such entities ; availability, terms and deployment of short - term and long - term capital ; unanticipated increases or volatility in financing and other costs ; the performance, financial condition and liquidity of borrowers ; incomplete or inaccurate information or documentation provided by customers or counterparties, or adverse changes in the financial condition of our customers and counterparties ; the quality and enforceability of the collateral documentation evidencing our ownership and rights in the assets in which we invest ; increased rates of delinquency, default and/or decreased recovery rates on our investments ; increased prepayments of the mortgages and other loans underlying our mortgage - backed securities and other investments ; the degree to which our hedging strategies may protect us from interest rate volatility ; our failure to maintain appropriate internal controls over financial reporting ; our ability to comply with various federal, state and local laws and regulations that govern our business ; changes in legislation or regulations or the occurrence of other events that impact the business, operations or prospects of government agencies, mortgage lenders and/or publicly - traded companies ; the creation of the Consumer Financial Protection Bureau, or CFPB, and enforcement of its rules ; changes in government support of homeownership ; changes in government or government - sponsored home affordability programs ; changes in governmental regulations, accounting treatment, tax rates and similar matters (including changes to laws governing the taxation of real estate investment trusts, or REITs ; limitations imposed on our business and our ability to satisfy complex rules for us to qualify as a REIT for U . S . federal income tax purposes and qualify for an exclusion from the Investment Company Act of 1940 and the ability of certain of our subsidiaries to qualify as REITs or as taxable REIT subsidiaries for U . S . federal income tax purposes and our ability and the ability of our subsidiaries to operate effectively within the limitations imposed by these rules ; and the effect of public opinion on our reputation . You should not place undue reliance on any forward - looking statement and should consider all of the uncertainties and risks described above, as well as those more fully discussed in reports and other documents filed by the Company with the Securities and Exchange Commission from time to time . The Company undertakes no obligation to publicly update or revise any forward - looking statements or any other information contained herein, and the statements made in this presentation are current as of the date of this presentation only . Forward - Looking Statements
3 Fourth Quarter Highlights • Net income of $26.5 million on net investment income of $53.1 million – Diluted earnings per share of $0.34; return on equity of 7% – Dividend of $ 0.61 per share declared on December 10, 2014 – Book value per share declined to $21.18 at December 31, 2014 • Segment pretax income: Investment Activities: $11.0 million; Correspondent Production: $0.9 million • New investments in distressed whole loans, mortgage servicing rights (MSRs), and excess servicing spread (ESS) during the quarter: – Acquired a pool of nonperforming loans totaling $331 million in unpaid principal balance (UPB) – MSR and ESS investments, related to $63 billion in UPB, grew to $549 million at December 31 o Added $32 million in new MSR investments resulting from correspondent production activities o Invested $17 million in ESS on mini - bulk and flow acquisitions of Agency MSRs by PennyMac Financial Services, Inc. (PFSI) related to $2.3 billion in UPB • Generated $103.8 million of cash proceeds from the liquidation of mortgage loans and REO Notable activity after quarter end: • Acquired a pool of nonperforming whole loans totaling $ 310 million in unpaid principal balance (UPB) • Expected to enter into agreements with PFSI relating to the acquisition of approximately $175 million in ESS from Agency MSRs totaling $21 billion in UPB that PFSI is expected to acquire (1) 4 Q14 Earnings Report (1) The MSR acquisitions by PFSI and the Company’s purchase of excess servicing spread are subject to the negotiation and execution of definitive docu men tation, continuing due diligence and customary closing conditions, including required regulatory approvals. There can be no assurance that the committed amounts will ultimately be acquired or that the transactions will be completed at all.
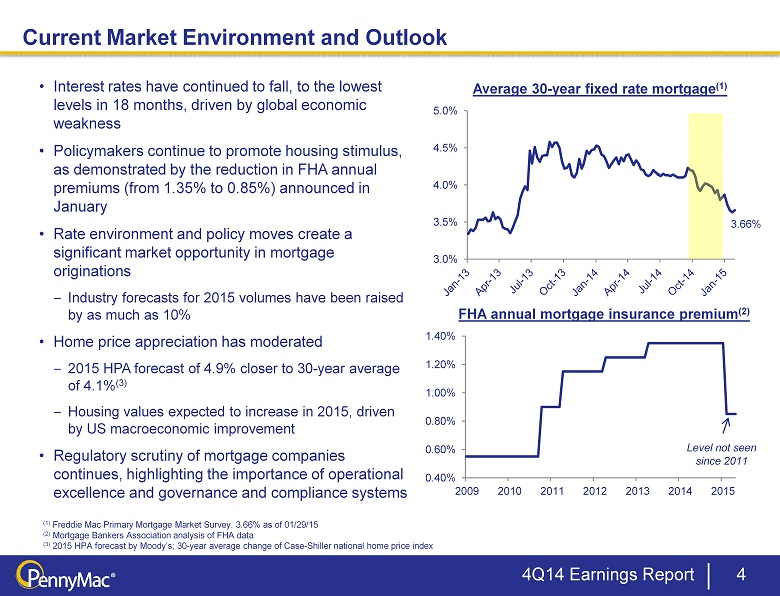
4 Current Market Environment and Outlook 4 Q14 Earnings Report 3.66% 3.0% 3.5% 4.0% 4.5% 5.0% Average 30 - year fixed rate mortgage (1) • Interest rates have continued to fall, to the lowest levels in 18 months, driven by global economic weakness • Policymakers continue to promote housing stimulus, as demonstrated by the reduction in FHA annual premiums (from 1.35% to 0.85%) announced in January • Rate environment and policy moves create a significant market opportunity in mortgage originations – Industry forecasts for 2015 volumes have been raised by as much as 10% • Home price appreciation has moderated – 2015 HPA forecast of 4.9% closer to 30 - year average of 4.1% (3) – Housing values expected to increase in 2015, driven by US macroeconomic improvement • Regulatory scrutiny of mortgage companies continues, highlighting the importance of operational excellence and governance and compliance systems (1) Freddie Mac Primary Mortgage Market Survey. 3.66% as of 01/29/15 (2) Mortgage Bankers Association analysis of FHA data (3) 2015 HPA forecast by Moody’s; 30 - year average change of Case - Shiller national home price index 0.40% 0.60% 0.80% 1.00% 1.20% 1.40% 2009 2010 2011 2012 2013 2014 2015 FHA annual mortgage insurance premium (2) Level not seen since 2011

PMT Aims to Deliver Superior Long - Term Returns to Shareholders 5 MSRs and ESS Prime Non - Agency Loans Agency and Non - Agency MBS Distressed Residential Whole Loans Correspondent Loan Aggregation • Strategies enabled by our relationship with PFSI, e.g.: – Loan fulfillment for correspondent aggregation – Loan servicing, including MSRs and ESS – Sourcing and management of investments, including commercial mortgage loans • Multiple strategies together expected to deliver attractive long - term return on equity even with shifts in the market environment (e.g., fluctuations in interest rates) • Returns to shareholders enhanced through financing, including securitization structures • Quarterly dividend based on performance outlook and expected taxable income for the year 4 Q14 Earnings Report GSE Risk Transfers on PMT’s Production Newer strategies Commercial Real Estate Loans Mortgage - related investments that require specialized operational capabilities

$3,886 $3,827 $4,402 $4,160 $4,358 $0 $500 $1,000 $1,500 $2,000 $2,500 $3,000 $3,500 $4,000 $4,500 $5,000 4Q13 1Q14 2Q14 3Q14 4Q14 6 PMT's Investment Portfolio Continues to Grow and Diversify • More than half of PMT’s investments are distressed whole loans and REO – expected to continue delivering attractive returns • Growing MSRs and ESS and pursuing other new investments • Prudent expansion of debt financing Leverage ratio (1) 1.8x 1.6x 2.0x 1.8x 2.0x (1) All borrowings, including exchangeable senior notes and asset - backed secured financing of the variable interest entity, divided by shareholders’ equity at period end Mortgage Assets ($ in millions) PMT’s L ong - Term Investments Ŷ Retained interests from private - label securitizations Ŷ MSRs and ESS Ŷ Agency and non - Agency RMBS Ŷ Distressed whole loans and REO 4 Q14 Earnings Report Correspondent loan inventory

4Q14 Earnings Report 7 Expansion Into Commercial Real Estate Finance Opportunities New Commercial Loan Originations Legacy Commercial Whole Loan Acquisitions ▪ Market opportunity for a non - bank specialist focused on lending within the nation’s 50 largest MSAs ▪ Nonperforming and sub - performing loans – include classified assets from banks and smaller pools sold by financial institutions and other investors ▪ Maximize returns by actively managing and restructuring loans (e.g., borrowers facing imminent maturity) Highly Fragmented Market (1) 100% = $160bn • PFSI recently launched a new division focused on loans with balances of $1mm - $10mm that finance multifamily and smaller office, retail and mixed - use properties • Complements PFSI and PMT’s existing businesses in residential mortgages and has the potential for attractive returns • PMT is expected to aggregate newly originated loans for eventual securitization and invest in legacy whole loans, leveraging PFSI’s operating platform (e.g., for special servicing) (2) • Current focus of highly experienced management team is building the platform at PFSI (1) Source : SmallBalance.com National Overview – 3rd Quarter, 2013 (2) Agreements between PFSI and PMT remain subject to negotiation 5% 4% 2% 2% 1% 1% <1% <1% <1% <1% <1% <1% <1% <1% <1% All others 79% JP Morgan Wells Fargo Bank of America New York Community Bank BB&T US Bank Signature Bank First Republic Bank TD Bank PNC Bank M&T Bank Bank of the West First Citizens Bank & Trust Regions Bank Astoria Bank FSB All Others

Mortgage Investment Activities

• Two NPL pools; first significant NPL acquisitions by PMT since 1Q14 • Both pools acquired from large banks • Generally have attractive characteristics for PMT’s portfolio strategy, including: – High average property value – Properties located in or close to major cities – Large percentage of borrowers that have equity in the property – Significant modification / reperformance opportunities • Supply of distressed whole loan opportunities remains strong; we remain disciplined in pursuing new investments Opportunistic Distressed Whole Loan Investments 4Q14 Earnings Report 9 (1) Estimated based on broker price opinions in general using “quick sale” values Pool 1 Pool 2 Pool UPB..................................$331mm $310 mm Seller........................................ Large bank Large bank Acquired in................................4Q14 1Q15 Average loan balance............... $459,000 $288,000 Average current LTV .............. 105% 110% % of pool with positive equity .. 53% 49% % that made payment(s) in the last year................................ 32% 36% % of pool previously modified... 29% 60% Top Four States: California................................ 35% 24% New York................................ 14% 15% New Jersey............................ 10% 12% Florida.................................... 6% 14% Selected Pool Attributes (1) (1)
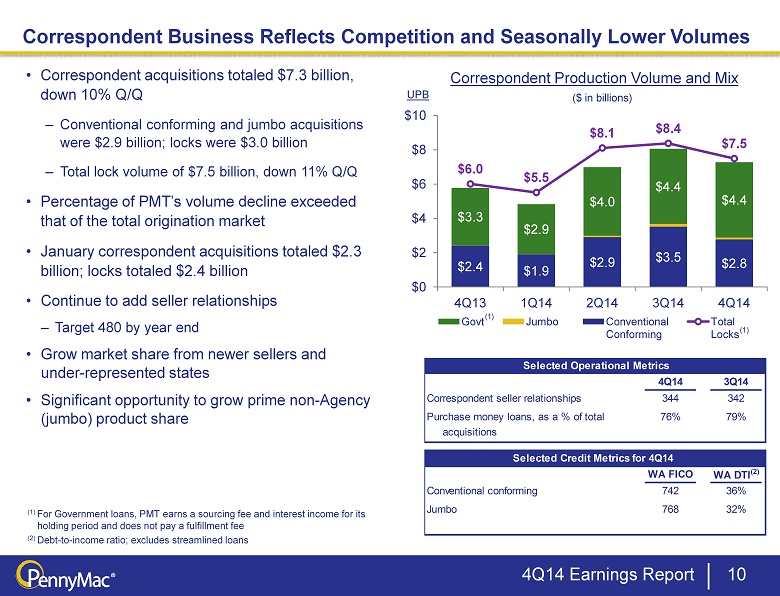
$2.4 $1.9 $2.9 $3.5 $2.8 $3.3 $2.9 $4.0 $4.4 $4.4 $6.0 $5.5 $8.1 $8.4 $7.5 $0 $2 $4 $6 $8 $10 4Q13 1Q14 2Q14 3Q14 4Q14 Govt Jumbo Conventional Conforming Total Locks Correspondent Production Volume and Mix 10 Correspondent Business Reflects Competition and Seasonally Lower Volumes (1) For Government loans, PMT earns a sourcing fee and interest income for its holding period and does not pay a fulfillment fee (2) Debt - to - income ratio; excludes streamlined loans ($ in billions) UPB • Correspondent acquisitions totaled $7.3 billion, down 10% Q/Q – Conventional conforming and jumbo acquisitions were $2.9 billion; locks were $3.0 billion – Total lock volume of $7.5 billion, down 11% Q/Q • Percentage of PMT’s volume decline exceeded that of the total origination market • January correspondent acquisitions totaled $2.3 billion; locks totaled $2.4 billion • Continue to add seller relationships – Target 480 by year end • Grow market share from newer sellers and under - represented states • Significant opportunity to grow prime non - Agency (jumbo ) product share (1) (1) 4 Q14 Earnings Report 4Q14 3Q14 Correspondent seller relationships 344 342 Purchase money loans, as a % of total 76% 79% acquisitions WA FICO WA DTI (2) Conventional conforming 742 36% 41 Jumbo 768 32% Selected Operational Metrics Selected Credit Metrics for 4Q14
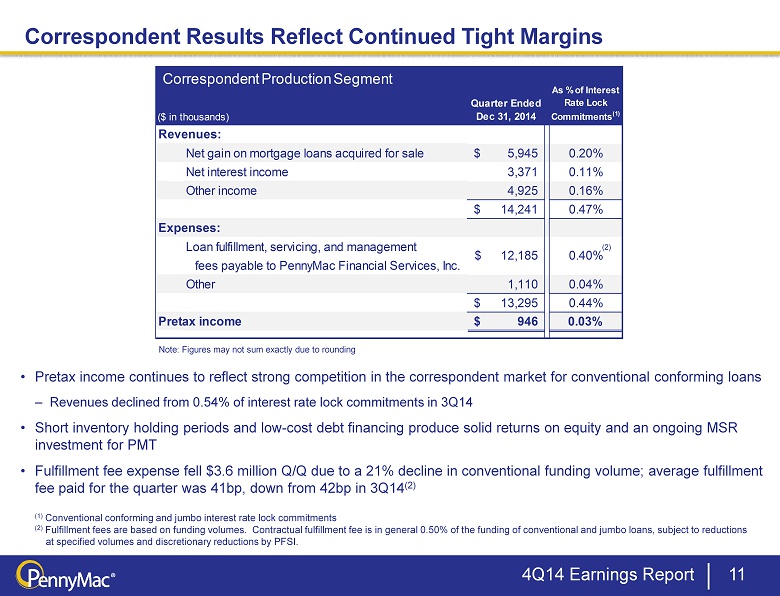
($ in thousands) Quarter Ended Dec 31, 2014 As % of Interest Rate Lock Commitments (1) Revenues: Net gain on mortgage loans acquired for sale 5,945$ 0.20% Net interest income 3,371 0.11% Other income 4,925 0.16% 14,241$ 0.47% Expenses: Loan fulfillment, servicing, and management fees payable to PennyMac Financial Services, Inc. Other 1,110 0.04% 13,295$ 0.44% Pretax income 946$ 0.03% 12,185$ 0.40% Correspondent Production Segment Correspondent Results Reflect Continued Tight Margins 11 • Pretax income continues to reflect strong competition in the correspondent market for conventional conforming loans – Revenues declined from 0.54% of interest rate lock commitments in 3Q14 • Short inventory holding periods and low - cost debt financing produce solid returns on equity and an ongoing MSR investment for PMT • Fulfillment fee expense fell $3.6 million Q/Q due to a 21% decline in conventional funding volume; average fulfillment fee paid for the quarter was 41bp, down from 42bp in 3Q14 (2) (1) Conventional conforming and jumbo interest rate lock commitments (2) Fulfillment fees are based on funding volumes. Contractual fulfillment fee is in general 0.50% of the funding of conventional and jumbo loans, subject to reductions at specified volumes and discretionary reductions by PFSI . Note: Figures may not sum exactly due to rounding 4 Q14 Earnings Report (2)

$429 $452 $506 $533 $549 $0 $10,000 $20,000 $30,000 $40,000 $50,000 $60,000 $70,000 $0 $100 $200 $300 $400 $500 $600 4Q13 1Q14 2Q14 3Q14 4Q14 MSR and ESS Investments Continue to Grow 12 ($ in millions) • Continued portfolio growth as investments in MSR and ESS reached $549 million, related to underlying loans with a UPB of $63 billion, at December 31, 2014 – Organic growth in MSR investments resulting from correspondent production activity – New investments in ESS totaling $17 million resulting from mini - bulk and flow MSR acquisitions by PFSI MSR and ESS Assets at Period End Fair value on balance sheet Related UPB Ŷ MSRs Ŷ Excess servicing spread (ESS) Ŷ UPB (right axis) 4 Q14 Earnings Report See slides 22 and 23 in the appendix for additional information.

13 Expected Investments in ESS Related to $21bn of Agency MSR Acquisitions 4 Q14 Earnings Report See slides 22 and 23 in the appendix for additional information. ▪ Seasoned, high - quality Agency loans ▪ Low mortgage rate environment results in refinance recapture opportunities ▪ Co - investment by PMT in the excess servicing spread cash flows ▪ Pending acquisitions reflect PFSI’s track record in successfully transferring bulk MSR portfolios and best - in - class operational platform that is well - positioned for further growth opportunities Summary of Pending Acquisitions (1) Unpaid Principal Balance $20.8 billion Weighted Avg. Note Rate 3.86% Delinquent Loans 4.25% Weighted Avg. Time Since Origination 20 months Total Servicing Fee 33.4 bp Excess Servicing Fee 17.5 bp Expected Investment $175 million (1) The MSR acquisitions by PFSI and the Company’s purchase of excess servicing spread are subject to the negotiation and execution of definitive docu men tation, continuing due diligence and customary closing conditions, including required regulatory approvals. There can be no assurance that the committed amounts will ultimately be acquired or that the transactions will be completed at all.

Financial Results

Investment Correspondent Total Pretax ($ in millions) Activities Lending Income 4Q13 48.4$ 6.3$ 54.7$ 1Q14 33.1$ 3.1$ 36.3$ 2Q14 70.9$ 2.4$ 73.3$ 3Q14 55.1$ 2.8$ 57.9$ 4Q14 11.0$ 0.9$ 11.9$ 15 Pretax Income by Operating Segment Note: Figures may not sum exactly due to rounding 4 Q14 Earnings Report ▪ Fourth quarter net income included a tax benefit of $14.6 million – Benefit related to a loss in the taxable REIT subsidiary and an improvement in that entity’s estimated tax rate
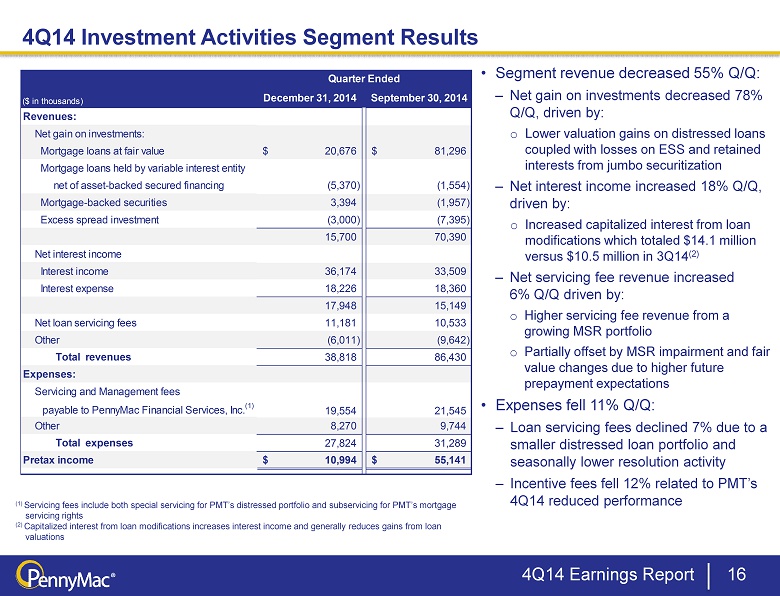
16 4 Q14 Investment Activities Segment Results • Segment revenue decreased 55% Q/Q: – Net gain on investments decreased 78% Q/Q, driven by: o Lower valuation gains on distressed loans coupled with losses on ESS and retained interests from jumbo securitization – Net interest income increased 18% Q/Q, driven by: o Increased capitalized interest from loan modifications which totaled $14.1 million versus $10.5 million in 3Q14 (2) – Net servicing fee revenue increased 6% Q/Q driven by: o Higher servicing fee revenue from a growing MSR portfolio o Partially offset by MSR impairment and fair value changes due to higher future prepayment expectations • Expenses fell 11% Q/Q: – Loan servicing fees declined 7 % due to a smaller distressed loan portfolio and seasonally lower resolution activity – Incentive fees fell 12% related to PMT’s 4Q14 reduced performance (1) Servicing fees include both special servicing for PMT’s distressed portfolio and subservicing for PMT’s mortgage servicing rights (2) Capitalized interest from loan modifications increases interest income and generally reduces gains from loan valuations 4 Q14 Earnings Report Quarter Ended ($ in thousands) December 31, 2014 September 30, 2014 Revenues: Net gain on investments: Mortgage loans at fair value 20,676$ 81,296$ Mortgage loans held by variable interest entity net of asset-backed secured financing (5,370) (1,554) Mortgage-backed securities 3,394 (1,957) Excess spread investment (3,000) (7,395) 15,700 70,390 Net interest income Interest income 36,174 33,509 Interest expense 18,226 18,360 17,948 15,149 Net loan servicing fees 11,181 10,533 Other (6,011) (9,642) Total revenues 38,818 86,430 Expenses: Servicing and Management fees payable to PennyMac Financial Services, Inc. (1) Other 8,270 9,744 Total expenses 27,824 31,289 Pretax income 10,994$ 55,141$ 19,554 21,545

($ in thousands) Quarter ended December 31, 2014 Gain on Proceeds liquidation (2) Mortgage loans 44,130$ 6,349$ 3,191$ REO 59,673 3,732 4,013 103,803$ 10,081$ 7,204$ Accumulated gains (1) ($ in thousands) December 31, 2014 September 30, 2014 Valuation Changes: Performing loans 4,831$ 23,255$ Nonperfoming loans 12,653 51,913 17,484 75,168 Payoffs 3,191 5,866 Sales - 262 20,675$ 81,296$ Quarter ended 17 Investment Gains and Cash Flows from the Distressed Loan Portfolio • Net gains on distressed loans totaled $20.7 million, a decrease from $81.3 million in 3Q14 – During the quarter, valuation gains were adversely impacted by a decrease in current home price levels versus prior forecasts and lowered expectation for future price appreciation – Seasonally lower reperformance and other resolution activities also contributed to the decline in valuation gains compared to the prior quarter – Investor demand for performing and nonperforming loans remained strong during the quarter • Cash proceeds from liquidation activity on loans and REO totaled $103.8 million – Accumulated gains on assets liquidated during the quarter were $10.1 million, and gains on liquidation were $7.2 million Net Gains on Mortgage Loans Cash Proceeds and Gain on Liquidation (1) Represents valuation gains and losses recognized during the period we held the respective asset, but excludes the gain or los s r ecorded upon sale or repayment of the respective asset (2) Represents the gain or loss recognized as of the date of sale or repayment of the respective asset 4 Q14 Earnings Report
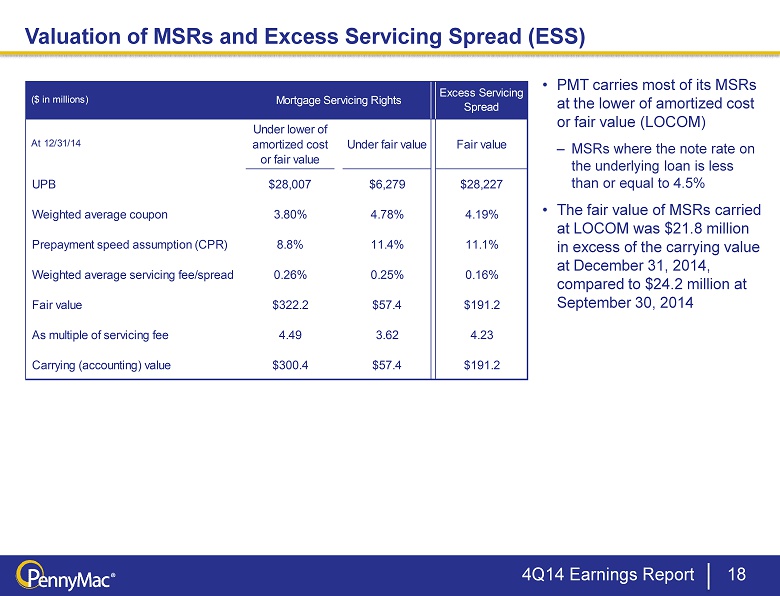
At 12/31/14 Under lower of amortized cost or fair value Under fair value Fair value UPB $28,007 $6,279 $28,227 Weighted average coupon 3.80% 4.78% 4.19% Prepayment speed assumption (CPR) 8.8% 11.4% 11.1% Weighted average servicing fee/spread 0.26% 0.25% 0.16% Fair value $322.2 $57.4 $191.2 As multiple of servicing fee 4.49 3.62 4.23 Carrying (accounting) value $300.4 $57.4 $191.2 ($ in millions) Mortgage Servicing Rights Excess Servicing Spread 18 Valuation of MSRs and Excess Servicing Spread (ESS) • PMT carries most of its MSRs at the lower of amortized cost or fair value (LOCOM) – MSRs where the note rate on the underlying loan is less than or equal to 4.5% • The fair value of MSRs carried at LOCOM was $ 21.8 million in excess of the carrying value at December 31, 2014, compared to $ 24.2 million at September 30 , 2014 4 Q14 Earnings Report

19 4Q14 Correspondent Production Segment Results • Segment revenue totaled $14.2 million, a 29% decline from 3 Q14 – Net gain on mortgage loans declined 37% Q/Q due to: o Conventional conforming loan market remained highly competitive o Seasonal decline in volume • Expenses declined 23% from 3Q14 : – Fulfillment fee expense decreased due to lower volume of conventional conforming and jumbo loan acquisitions, in addition to a lower average fulfillment fee o Average fulfillment fee decreased to 41bp in 4Q14 from 42bp in 3Q14 Quarter Ended ($ in thousands) December 31, 2014 September 30, 2014 Revenues: Net gain on mortgage loans acquired for sale 5,945$ 9,509$ Net interest income Interest income 7,074 7,727 Interest expense 3,703 3,660 3,371 4,067 Other income 4,925 6,524 Total revenues 14,241 20,100 Expenses: Loan fulfillment fees and management fees payable to PennyMac Financial Services, Inc Other 1,110 1,410 Total expenses 13,295 17,310 Pretax income 946$ 2,790$ 12,185 15,900 4 Q14 Earnings Report

Appendix

$0.81 $0.83 $0.90 $0.86 $0.57 $0.69 $0.50 $0.93 $0.69 $0.34 $0.57 $0.57 $0.57 $0.57 $0.57 $0.59 $0.59 $0.59 $0.61 $0.61 $21.18 $18.00 $19.00 $20.00 $21.00 $22.00 $0.00 $0.25 $0.50 $0.75 $1.00 3Q12 4Q12 1Q13 2Q13 3Q13 4Q13 1Q14 2Q14 3Q14 4Q14 Diluted EPS (left axis) Dividend (left axis) Book value per share (right axis) 21 PMT Dividends and Book Value Over Time 17% 18% 18% 11% 14% 10% 19% 7 % Return on Equity (2) (1) At period end. Book value per share in 4Q13 was reduced by two dividends declared in that quarter. ( 2) Return on average equity during the respective quarter; return on average equity is calculated based on annualized quarterly net income as a percentage of monthly average shareholders’ equity during the period. 14% 16% Book value per share (1) EPS & Dividend 4 Q14 Earnings Report
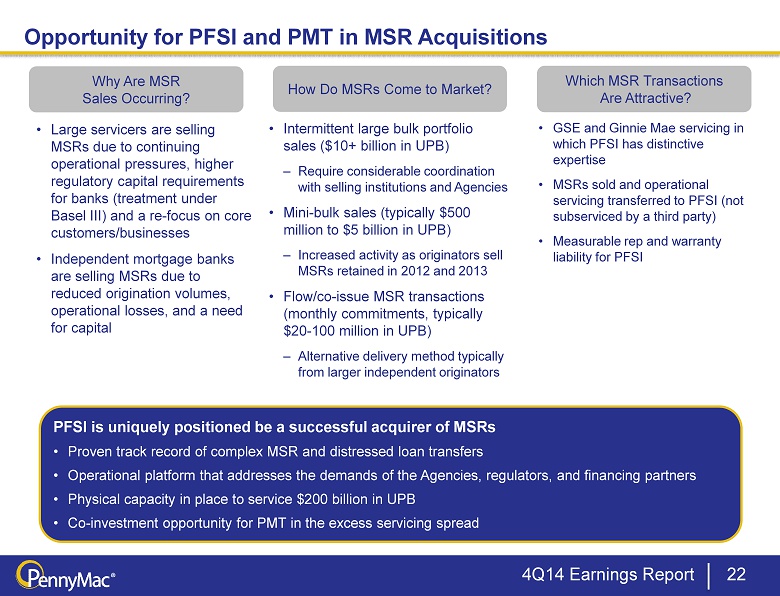
Opportunity for PFSI and PMT in MSR Acquisitions 22 Why Are MSR Sales Occurring? How Do MSRs Come to Market? • Large servicers are selling MSRs due to continuing operational pressures, higher regulatory capital requirements for banks (treatment under Basel III) and a re - focus on core customers/businesses • Independent mortgage banks are selling MSRs due to reduced origination volumes, operational losses, and a need for capital • Intermittent large bulk portfolio sales ($10+ billion in UPB) – Require considerable coordination with selling institutions and Agencies • Mini - bulk sales (typically $500 million to $5 billion in UPB) – Increased activity as originators sell MSRs retained in 2012 and 2013 • Flow/co - issue MSR transactions (monthly commitments, typically $ 20 - 100 million in UPB) – Alternative delivery method typically from larger independent originators Which MSR Transactions Are Attractive? • GSE and Ginnie Mae servicing in which PFSI has distinctive expertise • MSRs sold and operational servicing transferred to PFSI (not subserviced by a third party) • Measurable rep and warranty liability for PFSI PFSI is uniquely positioned be a successful acquirer of MSRs • Proven track record of complex MSR and distressed loan transfers • Operational platform that addresses the demands of the Agencies, regulators, and financing partners • Physical capacity in place to service $200 billion in UPB • Co - investment opportunity for PMT in the excess servicing spread 4 Q14 Earnings Report

PMT's Excess Servicing Spread Investments in Partnership with PFSI 23 4 Q14 Earnings Report (1) The contractual servicer and MSR owner is PennyMac Loan Services, LLC, an indirect subsidiary of PennyMac Financial Services, Inc. (2) Subject and subordinate to Agency rights (under the related servicer guide); does not change the contractual servicing fee pa id by the Agency to the servicer. Excess Servicing Spread (e.g., 12.5bp) MSR Asset (e.g., 25bp servicing fee) Acquired by PFSI from Third - Party Seller (1) ▪ PMT co - invests in Agency MSR acquired from third - party sellers by PFSI ▪ PMT acquires the right to receive the excess servicing spread cash flows over the life of the underlying loans ▪ PFSI owns the MSR and services the loans Excess Servicing Spread (2) ▪ Interest income from a portion of the contractual servicing fee – Realized yield dependent on prepayment speeds and recapture Base MSR ▪ Income from a portion of the contractual servicing fee ▪ Also entitled to ancillary income ▪ Bears expenses of performing loan servicing activities ▪ Required to advance certain payments largely for delinquent loans Base MSR (e.g., 12.5bp) Acquired by PMT from PFSI (1) Example transaction: actual transaction details may vary materially
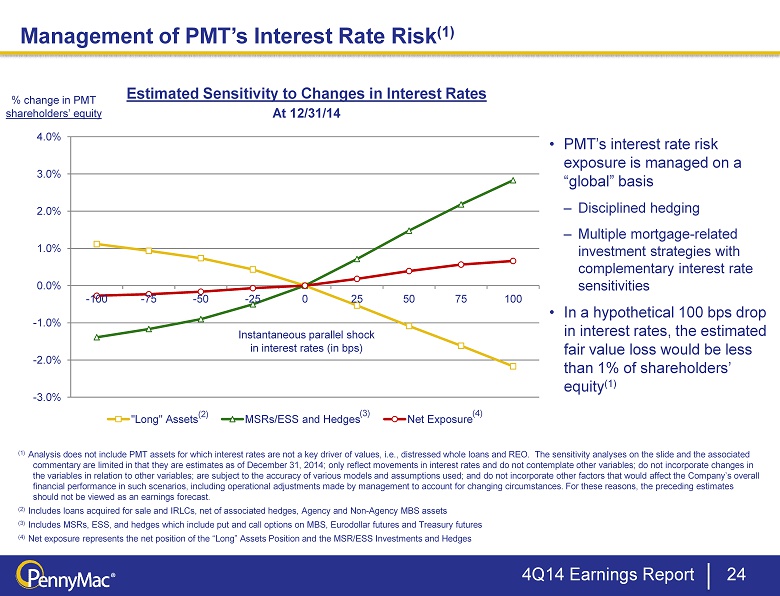
- 3.0% - 2.0% - 1.0% 0.0% 1.0% 2.0% 3.0% 4.0% - 100 - 75 - 50 - 25 0 25 50 75 100 "Long" Assets MSRs/ESS and Hedges Net Exposure (2) • PMT’s interest rate risk exposure is managed on a “global” basis – Disciplined hedging – Multiple mortgage - related investment strategies with complementary interest rate sensitivities • In a hypothetical 100 bps drop in interest rates, the estimated fair value loss would be less than 1% of shareholders’ equity (1) Management of PMT’s Interest Rate Risk (1) 24 Estimated Sensitivity to Changes in Interest Rates % change in PMT shareholders’ equity At 12/31/14 (1) Analysis does not include PMT assets for which interest rates are not a key driver of values, i.e ., distressed whole loans and REO. The sensitivity analyses on the slide and the associated commentary are limited in that they are estimates as of December 31, 2014; only reflect movements in interest rates and do not contemplate other variables; do not incorporate changes in the variables in relation to other variables; are subject to the accuracy of various models and assumptions used; and do not inc orporate other factors that would affect the Company’s overall financial performance in such scenarios, including operational adjustments made by management to account for changing circums tan ces. For these reasons, the preceding estimates should not be viewed as an earnings forecast . ( 2) Includes loans acquired for sale and IRLCs, net of associated hedges, Agency and Non - Agency MBS assets ( 3) Includes MSRs, ESS, and hedges which include put and call options on MBS, Eurodollar futures and Treasury futures (4) Net exposure represents the net position of the “Long” Assets Position and the MSR/ESS Investments and Hedges (3) (4) 4 Q14 Earnings Report Instantaneous parallel shock in interest rates (in bps)
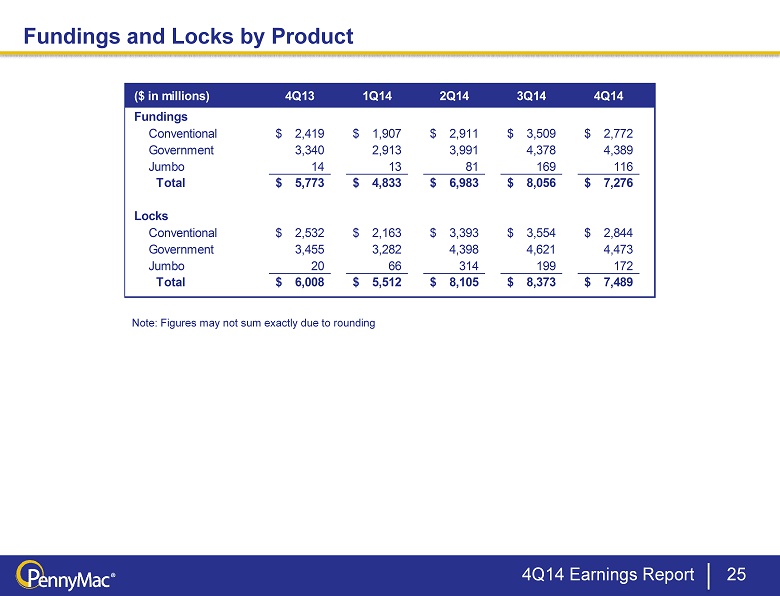
($ in millions) 4Q13 1Q14 2Q14 3Q14 4Q14 Fundings Conventional 2,419$ 1,907$ 2,911$ 3,509$ 2,772$ Government 3,340 2,913 3,991 4,378 4,389 Jumbo 14 13 81 169 116 Total 5,773$ 4,833$ 6,983$ 8,056$ 7,276$ Locks Conventional 2,532$ 2,163$ 3,393$ 3,554$ 2,844$ Government 3,455 3,282 4,398 4,621 4,473 Jumbo 20 66 314 199 172 Total 6,008$ 5,512$ 8,105$ 8,373$ 7,489$ Fundings and Locks by Product 25 Note: Figures may not sum exactly due to rounding 4 Q14 Earnings Report

Distressed Portfolio by Acquisition Period 26 (1) Ratio of unpaid principal balance remaining to unpaid principal balance at acquisition 4 Q14 Earnings Report Purchase 4Q14 Purchase 4Q14 Purchase 4Q14 Purchase 4Q14 Balance ($mm) 182.7$ 39.8 Balance ($mm) 195.5$ 32.5 Balance ($mm) 146.2$ 23.6 Balance ($mm) 277.8$ 59.8 Pool Factor (1) 1.00 0.22 Pool Factor (1) 1.00 0.17 Pool Factor (1) 1.00 0.16 Pool Factor (1) 1.00 0.22 Current 6.2% 26.8% Current 5.1% 25.4% Current 1.2% 18.1% Current 5.0% 27.4% 30 1.6% 6.7% 30 2.0% 7.7% 30 0.4% 6.8% 30 4.0% 9.9% 60 5.8% 3.8% 60 4.1% 5.0% 60 1.3% 6.8% 60 5.1% 5.2% 90+ 37.8% 12.8% 90+ 42.8% 18.7% 90+ 38.2% 23.0% 90+ 26.8% 16.9% FC 46.4% 36.9% FC 45.9% 30.2% FC 58.9% 27.7% FC 59.1% 25.4% REO 2.3% 13.0% REO 0.0% 13.0% REO 0.0% 17.5% REO 0.0% 15.1% Purchase 4Q14 Purchase 4Q14 Purchase 4Q14 Purchase 4Q14 Balance ($mm) 515.1$ 159.6 Balance ($mm) 259.8$ 89.7 Balance ($mm) 542.6$ 158.2 Balance ($mm) 49.0$ 25.7 Pool Factor (1) 1.00 0.31 Pool Factor (1) 1.00 0.35 Pool Factor (1) 1.00 0.29 Pool Factor (1) 1.00 0.53 Current 2.0% 22.8% Current 11.5% 26.2% Current 0.6% 22.4% Current 0.2% 27.0% 30 1.9% 5.0% 30 6.5% 9.0% 30 1.3% 5.5% 30 0.1% 3.9% 60 3.9% 2.9% 60 5.2% 5.0% 60 2.0% 3.3% 60 0.2% 8.2% 90+ 25.9% 19.2% 90+ 31.2% 25.6% 90+ 22.6% 22.4% 90+ 70.4% 27.9% FC 66.3% 37.6% FC 43.9% 20.2% FC 73.0% 30.8% FC 29.0% 24.2% REO 0.0% 12.6% REO 1.7% 14.0% REO 0.4% 15.5% REO 0.0% 8.7% Purchase 4Q14 Purchase 4Q14 Purchase 4Q14 Balance ($mm) 402.5$ 149.1 Balance ($mm) 357.2$ 191.6 Balance ($mm) 290.3$ 174.9 Pool Factor (1) 1.00 0.37 Pool Factor (1) 1.00 0.54 Pool Factor (1) 1.00 0.60 Current 45.0% 30.9% Current 0.0% 20.8% Current 3.1% 27.9% 30 4.0% 11.9% 30 0.0% 3.1% 30 1.3% 8.1% 60 4.3% 6.7% 60 0.1% 1.7% 60 5.4% 4.6% 90+ 31.3% 22.8% 90+ 49.1% 17.8% 90+ 57.8% 18.1% FC 15.3% 20.4% FC 50.8% 37.0% FC 32.4% 24.2% REO 0.1% 7.3% REO 0.0% 19.5% REO 0.0% 17.1% No Pools Purchased in this Quarter. 1Q12 2Q12 3Q12 4Q12 1Q10 2Q10 3Q10 4Q10 1Q11 2Q11 3Q11 4Q11
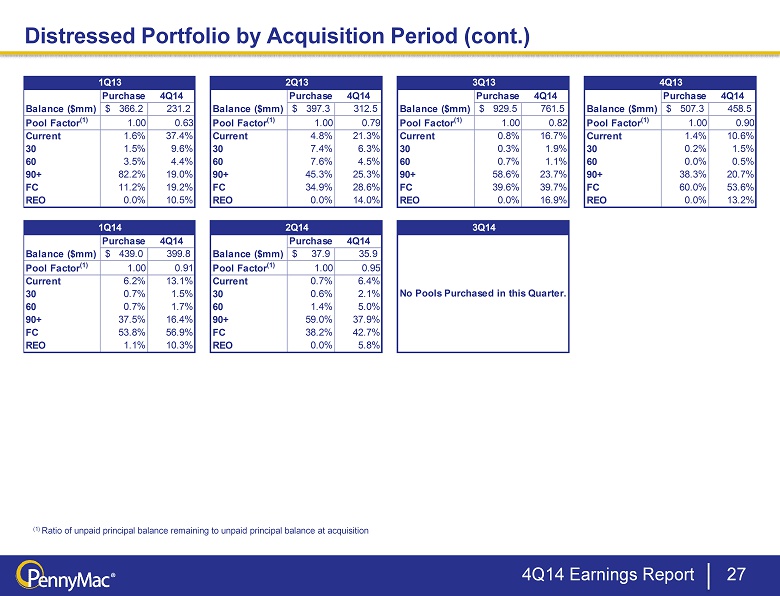
Purchase 4Q14 Purchase 4Q14 Purchase 4Q14 Purchase 4Q14 Balance ($mm) 366.2$ 231.2 Balance ($mm) 397.3$ 312.5 Balance ($mm) 929.5$ 761.5 Balance ($mm) 507.3$ 458.5 Pool Factor (1) 1.00 0.63 Pool Factor (1) 1.00 0.79 Pool Factor (1) 1.00 0.82 Pool Factor (1) 1.00 0.90 Current 1.6% 37.4% Current 4.8% 21.3% Current 0.8% 16.7% Current 1.4% 10.6% 30 1.5% 9.6% 30 7.4% 6.3% 30 0.3% 1.9% 30 0.2% 1.5% 60 3.5% 4.4% 60 7.6% 4.5% 60 0.7% 1.1% 60 0.0% 0.5% 90+ 82.2% 19.0% 90+ 45.3% 25.3% 90+ 58.6% 23.7% 90+ 38.3% 20.7% FC 11.2% 19.2% FC 34.9% 28.6% FC 39.6% 39.7% FC 60.0% 53.6% REO 0.0% 10.5% REO 0.0% 14.0% REO 0.0% 16.9% REO 0.0% 13.2% Purchase 4Q14 Purchase 4Q14 Balance ($mm) 439.0$ 399.8 Balance ($mm) 37.9$ 35.9 Pool Factor (1) 1.00 0.91 Pool Factor (1) 1.00 0.95 Current 6.2% 13.1% Current 0.7% 6.4% 30 0.7% 1.5% 30 0.6% 2.1% 60 0.7% 1.7% 60 1.4% 5.0% 90+ 37.5% 16.4% 90+ 59.0% 37.9% FC 53.8% 56.9% FC 38.2% 42.7% REO 1.1% 10.3% REO 0.0% 5.8% 1Q14 2Q14 3Q14 1Q13 2Q13 3Q13 4Q13 No Pools Purchased in this Quarter. Distressed Portfolio by Acquisition Period (cont.) 27 (1) Ratio of unpaid principal balance remaining to unpaid principal balance at acquisition 4 Q14 Earnings Report

$664 $939 $935 $0 $500 $1,000 $1,500 $2,000 $2,500 Fair Value on Balance Sheet Collateral Value Unpaid Principal Balance $1,535 $2,140 $2,247 $0 $500 $1,000 $1,500 $2,000 $2,500 Fair Value on Balance Sheet Collateral Value Unpaid Principal Balance 28 Nonperforming Loans ( at December 31, 2014) Performing Loans (at December 31, 2014) • Nonperforming loans are held on the balance sheet at fair value which is less than both the UPB and collateral value – Returns realized over time through property resolution strategies, including short sales and deeds - in - lieu of foreclosure • Performing loans are held on the balance sheet at fair value which is less than both the UPB and collateral value – Returns realized over time through interest income, restructure / refinance disposition strategies, and bulk loan sales Carrying Values for PMT’s Distressed Whole Loans (in millions) (in millions) 4 Q14 Earnings Report