Attached files
| file | filename |
|---|---|
| 8-K - FORM 8-K - PNMAC Holdings, Inc. | pfsi_8k.htm |
| EX-99.1 - PRESS RELEASE - PNMAC Holdings, Inc. | pfsi_ex9901.htm |
Exhibit 99.2

Fourth Quarter 2014 Earnings Report

Forward - Looking Statements 2 This presentation contains forward - looking statements within the meaning of Section 21 E of the Securities Exchange Act of 1934 , as amended, regarding management’s beliefs, estimates, projections and assumptions with respect to, among other things, the Company’s financial results, future operations, business plans and investment strategies, as well as industry and market conditions, all of which are subject to change . Words like “believe,” “expect,” “anticipate,” “promise,” “plan,” and other expressions or words of similar meanings, as well as future or conditional verbs such as “will,” “would,” “should,” “could,” or “may” are generally intended to identify forward - looking statements . Actual results and operations for any future period may vary materially from those projected herein, from past results discussed herein, or from illustrative examples provided herein . Factors which could cause actual results to differ materially from historical results or those anticipated include, but are not limited to : changes in federal, state and local laws and regulations applicable to the highly regulated industry in which we operate ; lawsuits or governmental actions if we do not comply with the laws and regulations applicable to our businesses ; the creation of the Consumer Financial Protection Bureau, or CFPB, and enforcement of its rules ; changes in existing U . S . government - sponsored entities, their current roles or their guarantees or guidelines ; changes to government mortgage modification programs ; the licensing and operational requirements of states and other jurisdictions applicable to our businesses, to which our bank competitors are not subject ; foreclosure delays and changes in foreclosure practices ; certain banking regulations that may limit our business activities ; changes in macroeconomic and U . S . residential real estate market conditions ; difficulties in growing loan production volume ; changes in prevailing interest rates ; increases in loan delinquencies and defaults ; our reliance on PennyMac Mortgage Investment Trust as a significant source of financing for, and revenue related to, our correspondent lending business and purchased mortgage servicing rights ; availability of required additional capital and liquidity to support business growth ; our obligation to indemnify third - party purchasers or repurchase loans that we originate, acquire or assist in with fulfillment ; our obligation to indemnify advised entities or investment funds to meet certain criteria or characteristics or under other circumstances ; decreases in the historical returns on the assets that we select and manage for our clients, and our resulting management and incentive fees ; regulation applicable to our investment management segment ; conflicts of interest in allocating our services and investment opportunities among ourselves and our advised entities ; the potential damage to our reputation and adverse impact to our business resulting from ongoing negative publicity ; and our rapid growth . You should not place undue reliance on any forward - looking statement and should consider all of the uncertainties and risks described above, as well as those more fully discussed in reports and other documents filed by the Company with the Securities and Exchange Commission from time to time . The Company undertakes no obligation to publicly update or revise any forward - looking statements or any other information contained herein, and the statements made in this presentation are current as of the date of this presentation only .

Fourth Quarter Highlights 3 ▪ Pretax income of $53.2 million; diluted earnings per common share of $0.41 – Pretax earnings contributions from each of PFSI’s segments: Production: $37.8 million; Servicing: $11.4 million; Investment Management: $2.6 million ▪ Loan production totaled $8.0 billion in UPB, down 7% from 3Q14 – Correspondent production was $7.3 billion, down 10% from 3Q14; consumer direct originations were $682 million, up 30% from 3Q14 – Production revenue of $72.4 million, up 1% from 3Q14; strong contribution from consumer direct ▪ Servicing portfolio grew to $106.0 billion in UPB, up 6% from September 30, 2014 – Continued organic growth resulting from loan production, supplemented by mini - bulk and flow acquisitions of MSRs totaling $1.7 billion in UPB – Servicing revenue of $57.6 million, up 3% from 3Q14 ▪ Net assets under management remained $2.0 billion – Revenue of $10.4 million, down 22% from 3Q14 as a result of lower incentive fees and carried interest Recent Activity After Quarter End ▪ Entered into letters of intent to acquire approximately $21 billion in UPB of Agency MSRs and expect to sell the excess servicing spread associated with these portfolios to PMT (1 ) (1) The MSR acquisitions by the Company and PMT’s purchases of excess servicing spread are subject to the negotiation and executi on of definitive documentation, continuing due diligence and customary closing conditions, including required regulatory approvals. Th ere can be no assurance that the committed amounts will ultimately be acquired or that the transactions will be completed at all.

Current Market Environment and Outlook 4 3.66% 3.0% 3.5% 4.0% 4.5% 5.0% Hundreds Average 30 - year fixed rate mortgage (1) • Interest rates have continued to fall, to the lowest levels in 18 months, driven by global economic weakness • Policymakers continue to promote housing stimulus, as demonstrated by the reduction in FHA annual premiums (from 1.35% to 0.85%) announced in January • Rate environment and policy moves create a significant market opportunity in mortgage originations – Industry forecasts for 2015 volumes have been raised by as much as 10% • Home price appreciation (HPA) has moderated – Housing values expected to continue increasing, driven by U.S. macroeconomic improvement – 2015 HPA forecast of 4.9% closer to 30 - year average of 4.1% (3 ) • Regulatory scrutiny of mortgage companies continues, highlighting the importance of operational excellence and governance and compliance systems (1) Freddie Mac Primary Mortgage Market Survey. 3.66% as of 01/29/15 (2) Mortgage Bankers Association analysis of FHA data (3) 2015 HPA forecast by Moody’s; 30 - year average change of Case - Shiller national home price index 0.40% 0.60% 0.80% 1.00% 1.20% 1.40% 2009 2010 2011 2012 2013 2014 2015 FHA annual mortgage i nsurance premium (2) Level not seen since 2011

PennyMac Financial’s Business Model Is Well Positioned for Growth • Complex and highly regulated mortgage industry requires expertise and operational excellence • PFSI’s platform has been developed organically and is highly scalable • Commitment to strong corporate governance, compliance, and risk management since inception • PFSI is well positioned for continued growth in this market and regulatory environment Loan Production Loan Servicing Investment Management • Servicing for owned MSRs and subservicing for Advised Entities • Major loan servicer for Fannie Mae, Freddie Mac and Ginnie Mae • Industry - leading capabilities in special servicing • Organic growth results from loan production, supplemented by MSR acquisitions and PMT investment activity • Serve as external manager for investment vehicles focused on investing in mortgage - related assets: – Distressed whole loans – Mortgage servicing rights – Private - label securitization interests – MBS and ABS – Commercial real estate loans and securitization interests • Synergistic partnership with PMT • Correspondent aggregation of newly originated loans from third - party sellers – PFSI earns gains on government - insured loans – Fulfillment fees for PMT’s conventional and jumbo loans • Consumer - direct origination of conventional, government - insured and jumb o loans • Newly launched commercial mortgage origination business 5

▪ Total net revenue increased 1% Q/Q as growth in mortgage banking offset decline in investment management ▪ EPS declined to $0.41 per share due to: – Investment management revenue declined 22% Q/Q due to lower incentive fees from PMT and lower carried interest from the Investment Funds – Fulfillment fees declined 23% Q/Q from decline in PMT’s conventional loan volume – Lower gain on sale revenue from Ginnie Mae early buyouts (EBOs) in 4Q14 – Compensation expense increased 8% Q/Q, primarily due to headcount growth to support increased volumes – Servicing expense increased 21% Q/Q, primarily due to increased losses and loss provisions on claims to the government agencies on defaulted loans, including loans purchased out of government agencies’ pools $90 $105 $130 $141 $142 $0 $30 $60 $90 $120 $150 4Q13 1Q14 2Q14 3Q14 4Q14 $0.32 $0.38 $0.45 $0.49 $0.41 $0.00 $0.15 $0.30 $0.45 $0.60 4Q13 1Q14 2Q14 3Q14 4Q14 Trends in PFSI Earnings and Revenue Composition Total Net Revenue ($ in millions) 6 Earnings per Share Ŷ Loan production Ŷ Loan servicing Ŷ Investment Management Ŷ Other

$1.1 trillion $1.2 trillion 0.80 0.90 1.00 1.10 1.20 As of December 2014 As of January 2015 Pending Agency Portfolio Acquisitions 16% $ 20.8bn GNMA Portfolio 40% $50.4bn FNMA/FHLMC/ Other Portfolio 44% $55.6bn 7 ▪ PennyMac is well positioned to capitalize on the opportunities presented by the low interest rate environment and FHA MIP reduction ─ Servicing portfolio provides sizeable recapture opportunity ─ Consumer direct efforts to attract non - portfolio volume are underway ─ Correspondent sellers should also see volume increases ▪ Strategically developing infrastructure for future opportunities ─ Consumer - direct fulfillment and call center staffing ─ Correspondent relationship management team growth ─ Servicing infrastructure development in Texas ─ Developing commercial real estate lending capabilities Servicing Portfolio UPB Building PFSI’s Businesses to Address Opportunity Origination Market Forecast (1) ~10% increase (1) Source: Average of Mortgage Bankers Association, Fannie Mae and Freddie Mac mortgage market forecasts

8 New Commercial Loan Originations Legacy Commercial Whole Loan Acquisitions ▪ Market opportunity for a non - bank specialist focused on lending within the nation’s 50 largest MSAs ▪ Nonperforming and sub - performing loans – include classified assets from banks and smaller pools sold by financial institutions and other investors ▪ Maximize returns by actively managing and restructuring loans (e.g., borrowers facing imminent maturity) Highly Fragmented Market (1) 100% = $160bn • Recently launched new division focused on loans with balances of $1mm - $10mm that finance multifamily and smaller office, retail and mixed - use properties • Complements PFSI and PMT’s existing businesses in residential mortgages and has the potential for attractive returns – Targeting profitability by 4Q15 • PMT is expected to aggregate newly originated loans for eventual securitization and invest in legacy whole loans, leveraging PFSI’s operating platform (e.g., for special servicing) (2) • Current focus of highly experienced management team is building the platform at PFSI Expansion Into Commercial Real Estate Finance (1) Source: SmallBalance.com National Overview – 3 rd Quarter, 2013 (2) A greements between PFSI and PMT remain subject to negotiation 5% 4% 2% 2% 1% 1% <1% <1% <1% <1% <1% <1% <1% <1% <1% All others 79% JP Morgan Wells Fargo Bank of America New York Community Bank BB&T US Bank Signature Bank First Republic Bank TD Bank PNC Bank M&T Bank Bank of the West First Citizens Bank & Trust Regions Bank Astoria Bank FSB All Others

7.67% 7.04% 0% 2% 4% 6% 8% 10% 4Q12 1Q13 2Q13 3Q13 4Q13 1Q14 2Q14 3Q14 4Q14 Trends in PennyMac Financial’s Businesses Correspondent Production (1) Market Share 0.25% 0.33% 0.00% 0.05% 0.10% 0.15% 0.20% 0.25% 0.30% 0.35% 4Q12 1Q13 2Q13 3Q13 4Q13 1Q14 2Q14 3Q14 4Q14 Market Share Consumer Direct Production (1 ) $2.02 $2.00 $0.0 $0.5 $1.0 $1.5 $2.0 $2.5 4Q12 1Q13 2Q13 3Q13 4Q13 1Q14 2Q14 3Q14 4Q14 1.02% 1.08% 0.0% 0.2% 0.4% 0.6% 0.8% 1.0% 1.2% 4Q12 1Q13 2Q13 3Q13 4Q13 1Q14 2Q14 3Q14 4Q14 Loan Servicing (1) Market Share Investment Management AUM (billions) 9 (1) Source : Inside Mortgage Finance and company estimates. Inside Mortgage Finance estimates total 4Q14 origination market of $340 billion. Correspondent production share estimate is based on PFSI and PMT acquisition volume of $7.3 billion divided by $103 billion f or the correspondent market (estimated to be 30% of total origination market). Consumer direct production share is based on PFSI originations of $682 million divided by $205 billion for the retail market (estimated to be 60% of total origination market). Loan servicing mar ket share is based on PFSI’s servicing UPB of $106.0 billion divided by $9.84 trillion in mortgage debt outstanding as of September 30, 20 14.

4Q14 3Q14 Correspondent seller relationships 344 342 Purchase money loans, as a % of total 76% 79% acquisitions WA FICO WA DTI (2) Government-insured 700 41% 41 Conventional 742 36% Selected Credit Metrics for 4Q14 Selected Operational Metrics $3.3 $2.9 $4.0 $4.4 $4.4 $2.4 $1.9 $3.0 $3.7 $2.9 $6.0 $5.5 $8.1 $8.4 $7.5 $0 $2 $4 $6 $8 $10 4Q13 1Q14 2Q14 3Q14 4Q14 (UPB in billions) ▪ Correspondent acquisitions by PMT in 4Q14 totaled $7.3 billion – 60% government - insured loans – PFSI earns gain on mortgage loans – 40% conventional loans – PFSI earns fulfillment fee from PMT ▪ January correspondent acquisitions totaled $2.3 billion; locks totaled $2.4 billion ▪ Correspondent sellers grew by 115 during 2014 Quarterly Highlights – Correspondent Production (1) Includes locks related to PMT loan acquisitions, for which PFSI earns a fulfillment fee upon loan funding (2) Debt - to - income ratio; excludes streamlined refinance loans Correspondent Volume and Mix Operational Highlights Ŷ Government - insured loans Ŷ Fulfillment fees from PMT Ŷ Total Locks (1) Strategic Initiatives ▪ Continue to add seller relationships – Target 480 by year end ▪ Grow market share from newer sellers and under - represented states ▪ Significant opportunity to grow prime non - Agency (jumbo) product share 10
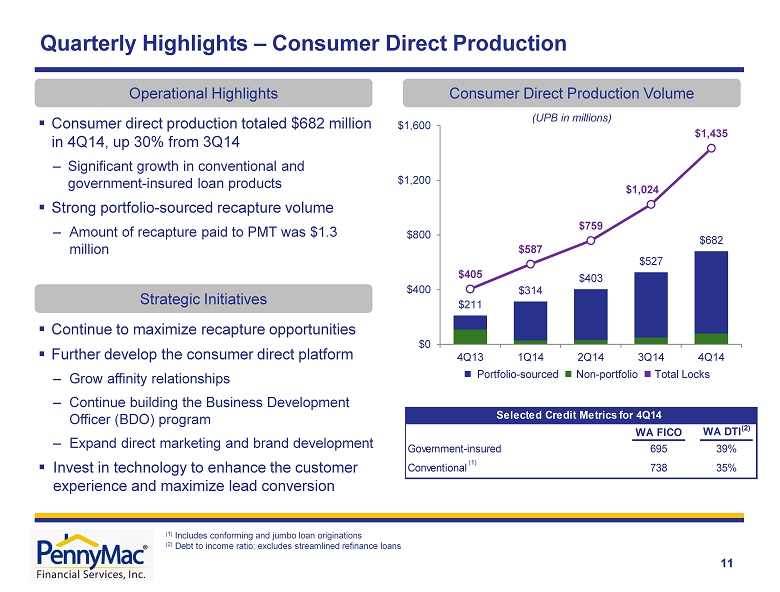
$211 $314 $403 $527 $682 $405 $587 $759 $1,024 $1,435 $0 $400 $800 $1,200 $1,600 4Q13 1Q14 2Q14 3Q14 4Q14 11 (UPB in millions ) ▪ Consumer direct production totaled $682 million in 4Q14 , up 30% from 3Q14 – Significant growth in conventional and government - insured loan products ▪ Strong portfolio - sourced recapture volume – Amount of recapture paid to PMT was $1.3 million Quarterly Highlights – Consumer Direct Production Consumer Direct Production Volume Operational Highlights Strategic Initiatives ▪ Continue to maximize recapture opportunities ▪ Further develop the consumer direct platform – Grow affinity relationships – Continue building the Business Development Officer (BDO) program – Expand direct marketing and brand development ▪ Invest in technology to enhance the customer experience and maximize lead conversion Ŷ Portfolio - sourced Ŷ Non - portfolio Ŷ Total Locks (1) Includes conforming and jumbo loan originations (2) Debt to income ratio; excludes streamlined refinance loans WA FICO WA DTI (2) Government-insured 695 39% 41 Conventional 738 35% Selected Credit Metrics for 4Q14 (1)

$100.1 $106.0 At 9/30/14 Runoff Additions from loan production MSR acquisitions At 12/31/14 $78.2 $83.8 $93.6 $100.1 $106.0 $0 $20 $40 $60 $80 $100 $120 4Q13 1Q14 2Q14 3Q14 4Q14 12 (UPB in billions ) ▪ Servicing portfolio totaled $106.0 billion in UPB at quarter end, up 6% from 3Q14 ▪ Mini - bulk and flow MSR acquisitions totaled $1.7 billion in UPB during 4Q14 – Reviewed 36 new mini - bulk and flow opportunities, bid on 5, and won 1 during the quarter ▪ Pending bulk MSR acquisitions should add to servicing platform’s scale (1) ▪ Excess servicing spread (ESS) co - investment by PMT in 4Q14 totaled $17.1 million Quarterly Highlights – Loan Servicing Loan Servicing Portfolio Composition Operational Highlights ▪ Ongoing organic servicing portfolio growth ▪ Grow volume of mini - bulk and flow MSR acquisitions to supplement organic growth; selective larger bulk MSR transactions ▪ Additional operational efficiency with increasing economies of scale Strategic Initiatives Ŷ Prime owned Ŷ Prime subserviced Ŷ Special Net Portfolio Growth ($3.7) $8.0 $1.7 (UPB in billions ) (2) (1) The MSR acquisitions by the Company and PMT’s purchases of excess servicing spread are subject to the negotiation and execution of definitive documentation, continuing due diligence and customary closing conditions, including required regulatory approva ls. There can be no assurance that the committed amounts will ultimately be acquired or that the transactions will be completed at all . (2) Includes consumer direct originations, government correspondent acquisitions, and conventional conforming and jumbo loan acquisitions subserviced for PMT

Unpaid Principal Balance $20.8 billion Weighted Avg. Note Rate 3.86% Delinquent Loans 4.25% Weighted Avg. Time Since Origination 20 months Total Servicing Fee 33.4 bp Base Servicing Fee 15.9 bp Investment in Base MSR $75 million Pending Acquisitions of Bulk MSRs with Refinance Opportunities ▪ Seasoned, high - quality Agency loans ▪ Low mortgage rate environment results in refinance recapture opportunities ▪ Co - investment by PMT in Agency MSRs through the acquisition of the excess servicing spread cash flows ▪ Pending acquisitions from multiple sellers reflect PFSI’s track record in successfully transferring bulk MSR portfolios and best - in - class operational platform that is well positioned for further growth opportunities 13 Summary of Pending Acquisitions (1) (1) The MSR acquisitions by the Company and PMT’s purchases of excess servicing spread are subject to the negotiation and executi on of definitive documentation, continuing due diligence and customary closing conditions, including required regulatory approvals. Th ere can be no assurance that the committed amounts will ultimately be acquired or that the transactions will be completed at all.

Hedging Strategy Protects MSR Despite Significant Decline in Rates ▪ PFSI seeks to protect the economic value of its MSR assets through a comprehensive hedge strategy ▪ We employ a variety of instruments to execute our strategy of moderating the impact of interest rate movements: – Forward sales of loan production pipeline – Mortgage options, swaptions and other derivatives ▪ Strategy considers company - wide impact of rate movements on revenue opportunities – Increased refinance volumes / loan recapture realized in future periods ▪ Managed through robust operational processes and governance structure – Intra - day monitoring with executive management oversight; reviewed by management and Board governance 14

15 ($ in millions) ▪ Investment management revenues were $10.4 million, down 22% from 3Q14 – Carried interest from the Investment Funds declined 86% Q/Q, due to a smaller portfolio and reduced financial performance – Incentive fees declined 31% Q/Q, due to PMT’s reduced financial performance in 4Q14 ▪ Net assets under management remained $2.0 billion at December 31, 2014 Quarterly Highlights – Investment Management Investment Management Revenues Operational Highlights Strategic Initiatives ▪ Opportunities to manage additional capital for mortgage - related investments: – Distressed whole loans – MSRs resulting from correspondent acquisitions – Excess servicing spread on MSRs – Investments in prime non - Agency loans – Agency and non - Agency MBS – GSE risk transfers on PMT’s production – CRE loans and securitization interests $14.4 $12.5 $12.8 $13.3 $10.4 $0 $3 $6 $9 $12 $15 4Q13 1Q14 2Q14 3Q14 4Q14 Carried interest & incentive fees Base management fees & other revenue
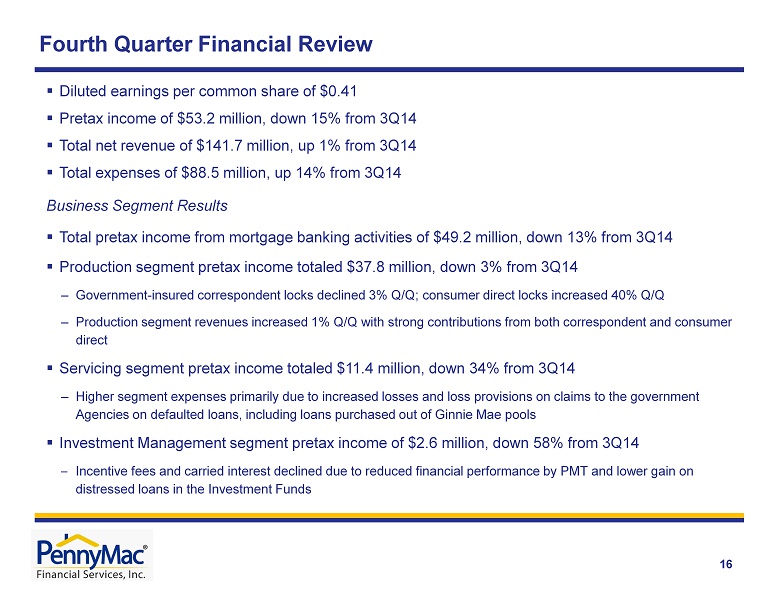
Fourth Quarter Financial Review 16 ▪ Diluted earnings per common share of $0.41 ▪ Pretax income of $53.2 million , down 15% from 3Q14 ▪ Total net revenue of $141.7 million, up 1% from 3Q14 ▪ Total expenses of $88.5 million, up 14% from 3Q14 Business Segment Results ▪ Total pretax income from mortgage banking activities of $49.2 million, down 13% from 3 Q14 ▪ Production segment pretax income totaled $37.8 million, down 3% from 3Q14 – Government - insured correspondent locks declined 3% Q/Q; consumer direct locks increased 40% Q/Q – Production segment revenues increased 1% Q/Q with strong contributions from both correspondent and consumer direct ▪ Servicing segment pretax income totaled $11.4 million, down 34% from 3Q14 – Higher segment expenses primarily due to increased losses and loss provisions on claims to the government Agencies on defaulted loans, including loans purchased out of Ginnie Mae pools ▪ Investment Management segment pretax income of $2.6 million, down 58% from 3Q14 – Incentive fees and carried interest declined due to reduced financial performance by PMT and lower gain on distressed loans in the Investment Funds
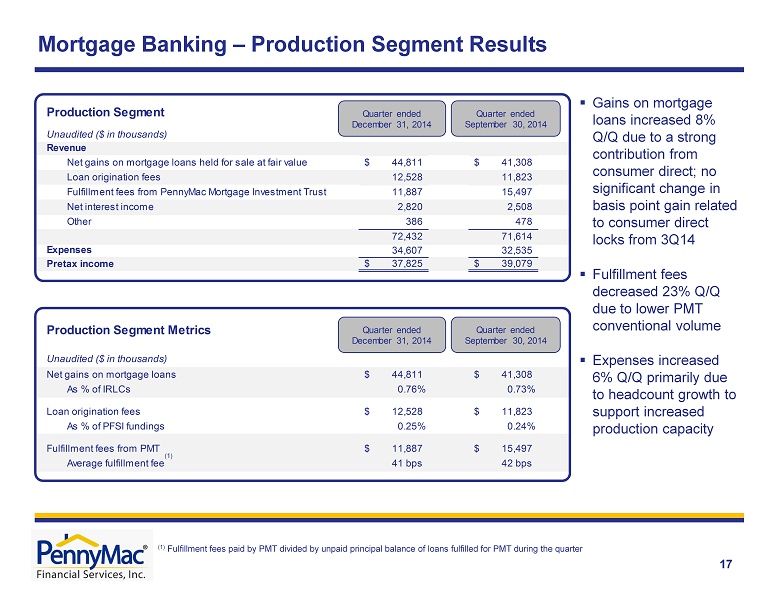
Net gains on mortgage loans held for sale at fair value 44,811$ 41,308$ Loan origination fees 12,528 11,823 Fulfillment fees from PennyMac Mortgage Investment Trust 11,887 15,497 Net interest income 2,820 2,508 Other 386 478 72,432 71,614 34,607 32,535 Pretax income 37,825$ 39,079$ Net gains on mortgage loans 44,811$ 41,308$ As % of IRLCs 0.76% 0.73% Loan origination fees 12,528$ 11,823$ As % of PFSI fundings 0.25% 0.24% Fulfillment fees from PMT 11,887$ 15,497$ Average fulfillment fee 41 bps 42 bps Expenses Production Segment Unaudited ($ in thousands) Revenue Production Segment Metrics Unaudited ($ in thousands) Quarter ended December 31 , 2014 Quarter ended September 30, 2014 Quarter ended December 31, 2014 Quarter ended September 30 , 2014 17 Mortgage Banking – Production Segment Results (1) Fulfillment fees paid by PMT divided by unpaid principal balance of loans fulfilled for PMT during the quarter (1) ▪ Gains on mortgage loans increased 8% Q/Q due to a strong contribution from consumer direct; no significant change in basis point gain related to consumer direct locks from 3Q14 ▪ Fulfillment fees decreased 23% Q/Q due to lower PMT conventional volume ▪ Expenses increased 6% Q/Q primarily due to headcount growth to support increased production capacity

Unaudited ($ in thousands) Servicing fees (1) 69,901$ 64,708$ Effect of MSRs: Amortization and realization of cash flows (21,690) (19,703) Change in fair value and (provision for) reversal of impairment of MSRs carried at lower of amortized cost or fair value (8,755) 261 Change in fair value of excess servicing spread financing 4,271 9,538 Hedging gains (losses) 18,551 (896) Total amortization, impairment and change in fair value of MSRs (7,623) (10,800) Net loan servicing fees 62,278$ 53,908$ Net Loan Servicing Fees Quarter ended December 31 , 2014 Quarter ended September 30 , 2014 Revenue Net gains on mortgage loans held for sale at fair value (162)$ 6,825$ Net servicing fees 62,278 53,908 Net interest expense (4,812) (5,246) Other 261 230 57,565 55,717 Expenses 46,143 38,286 Pretax income 11,422$ 17,431$ Servicing Segment Unaudited ($ in thousands) Quarter ended December 31 , 2014 Quarter ended September 30 , 2014 Mortgage Banking – Servicing Segment Results (1) Includes contractually - specified servicing fees 18 ▪ Net servicing fee revenue increased 16% Q/Q driven primarily by higher servicing fees and hedging gains ▪ Change in net gains on mortgage loans held for sale due to reduction in economics related to EBO sales in 4Q14 ▪ Expenses increased 21% Q/Q primarily due to a rise in losses and loss provisions on claims to the government agencies on defaulted loans

UPB $33,746 $2,718 $28,227 Weighted average coupon 3.82% 4.74% 4.19% Prepayment speed assumption (CPR) 8.5% 11.7% 11.1% Weighted average servicing fee rate 0.30% 0.31% 0.31% Fair value of MSR $416.8 $31.9 $293.4 As a multiple of servicing fee 4.17 3.84 3.40 Carrying value of MSR $405.4 $31.9 $293.4 Related excess servicing spread liability - - $191.2 December 31, 2014 Unaudited ($ in millions) Lower of amortized cost or fair value Fair value not subject to excess servicing spread Fair value subject to excess servicing spread Mortgage Servicing Rights (MSR) Asset Valuation 19 ▪ PFSI carries most of its originated MSRs at the lower of amortized cost or fair value (LOCOM) – MSRs where the note rate on the underlying loan is equal to or less than 4.5 % ▪ Purchased MSRs subject to ESS are carried at fair value and the ESS is also carried at fair value ▪ The fair value of MSRs carried at LOCOM was $11.4 million in excess of the carrying value at December 31, 2014 Note: Figures may not sum exactly due to rounding

Management fees: From PennyMac Mortgage Investment Trust 8,426$ 9,623$ From Investment Funds 1,596 1,756 10,022 11,379 Carried Interest from Investment Funds 263 1,902 Other 65 13 10,350 13,294 7,742 7,112 Pretax income 2,608$ 6,182$ Expenses Unaudited – (in thousands) Revenue Quarter ended December 31 , 2014 Quarter ended September 30 , 2014 Investment Management Segment Results 20 ▪ Carried interest from the Investment Funds declined 86% Q/Q, due to a smaller portfolio and reduced financial performance ▪ Incentive fees declined 31% Q/Q, from PMT’s reduced financial performance

Appendix

PFSI Has Developed in a Sustainable Manner for Long - Term Growth • Disciplined growth to address the demands of the GSEs, Agencies, regulators and our financing partners - Since inception, PennyMac has focused on building and testing processes and systems before adding significant transaction volumes • Highly experienced management team has created a robust corporate governance system centered on compliance, risk management and quality control 72 128 230 435 1,008 1,373 1,816 • Correspondent group established with a focus on operations development and process design • Operations launched • De novo build of legacy - free mortgage servicer • Added servicing leadership for prime portfolio and to drive scalable growth • Correspondent system launches • Expanded infrastructure with flagship operations facility in Moorpark, CA • Correspondent leadership team expands • PFSI completed initial public offering • Expanded infrastructure in Fort Worth, TX • Expanded infrastructure in Tampa, FL • Became largest non - bank correspondent aggregator 2008 2009 2010 2011 2012 2013 E mployees at year end 2014 • Continued organic growth • Servicing UPB reaches $100 bn 22

23 PennyMac Financial Is in a Unique Position Among Mortgage Specialists Industry - leading platform built organically – not through acquisitions • Not distracted by legacy/regulatory issues • Disciplined, sustainable growth for more than 7 years • Focused on building and testing processes and systems before large transaction volumes Distinctive expertise and full range of capabilities across mortgage banking and investment management Loan production , e.g., loan fulfillment systems and operations, correspondent counterparty review and management Credit , e.g., loan program development, underwriting and quality control Capital markets , e.g., pooling and securitization, hedging/interest rate risk management Servicing , e.g., customer service, default management, investor accounting Corporate functions , e.g., enterprise risk management, internal audit, treasury, finance and accounting, legal, IT infrastructure and development • Over 1,800 employees • Highly experienced management team – 60 senior - most executives have on average 23 years of relevant industry experience Strong governance and compliance culture • Led by distinguished board which includes seven independent Directors • Robust management governance structure with 10 committees that oversee key risks and controls • External oversight by regulators, business partners and other third parties Desired structure in place to compete effectively as a non - bank • Synergistic partnership with PMT, a leading residential mortgage REIT and long - term investment vehicle • Provides access to efficient capital and reduces balance sheet constraints on growth

Opportunity for PFSI and PMT in MSR Acquisitions 24 Why Are MSR Sales Occurring? How Do MSRs Come to Market? • Large servicers are selling MSRs due to continuing operational pressures, higher regulatory capital requirements for banks (treatment under Basel III) and a re - focus on core customers/businesses • Independent mortgage banks are selling MSRs due to reduced origination volumes, operational losses, and a need for capital • Intermittent large bulk portfolio sales ($10+ billion in UPB) – Require considerable coordination with selling institutions and Agencies • Mini - bulk sales (typically $500 million to $5 billion in UPB) – Increased activity as originators sell MSRs retained in 2012 and 2013 • Flow/co - issue MSR transactions (monthly commitments, typically $20 - 100 million in UPB) – Alternative delivery method typically from larger independent originators Which MSR Transactions Are Attractive? • GSE and Ginnie Mae servicing in which PFSI has distinctive expertise • MSRs sold and operational servicing transferred to PFSI (not subserviced by a third party) • Measurable rep and warranty liability for PFSI PFSI is uniquely positioned to be a successful acquirer of MSRs • Proven track record of complex MSR and distressed loan transfers • Operational platform that addresses the demands of the Agencies, regulators, and financing partners • Physical capacity in place to service $200 billion in UPB • Co - investment opportunity for PMT in the excess servicing spread

25 PFSI’s Mortgage Servicing Rights Investments in Partnership with PMT Excess Servicing Spread (e.g., 12.5bp) MSR Asset (e.g., 25bp servicing fee) Acquired by PFSI from Third - Party Seller (1) ▪ PMT co - invests in Agency MSR acquired from third - party sellers by PFSI ▪ PMT acquires the right to receive the excess servicing spread cash flows over the life of the underlying loans ▪ PFSI owns the MSR and services the loans (1) The contractual servicer and MSR owner is PennyMac Loan Services, LLC, an indirect subsidiary of PennyMac Financial Services, Inc. (2) Subject and subordinate to Agency rights (under the related servicer or issuer guide ) and, as applicable, to PFSI’s pledge of MSRs under a note payable; does not change the contractual servicing fee paid by the Agency to the servicer. Excess Servicing Spread (2) ▪ Interest income from a portion of the contractual servicing fee – Realized yield dependent on prepayment speeds and recapture Base MSR ▪ Income from a portion of the contractual servicing fee ▪ Also entitled to ancillary income ▪ Bears expenses of performing loan servicing activities ▪ Required to advance certain payments largely for delinquent loans Base MSR (e.g., 12.5bp) Acquired by PMT from PFSI (1) Example transaction: actual transaction details may vary materially
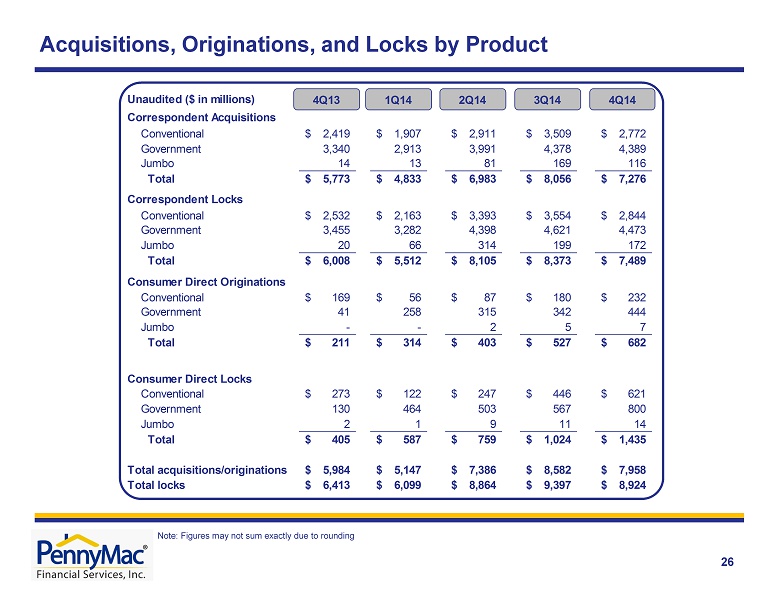
Unaudited ($ in millions) Correspondent Acquisitions Conventional 2,419$ 1,907$ 2,911$ 3,509$ 2,772$ Government 3,340 2,913 3,991 4,378 4,389 Jumbo 14 13 81 169 116 Total 5,773$ 4,833$ 6,983$ 8,056$ 7,276$ Correspondent Locks Conventional 2,532$ 2,163$ 3,393$ 3,554$ 2,844$ Government 3,455 3,282 4,398 4,621 4,473 Jumbo 20 66 314 199 172 Total 6,008$ 5,512$ 8,105$ 8,373$ 7,489$ Consumer Direct Originations Conventional 169$ 56$ 87$ 180$ 232$ Government 41 258 315 342 444 Jumbo - - 2 5 7 Total 211$ 314$ 403$ 527$ 682$ Consumer Direct Locks Conventional 273$ 122$ 247$ 446$ 621$ Government 130 464 503 567 800 Jumbo 2 1 9 11 14 Total 405$ 587$ 759$ 1,024$ 1,435$ Total acquisitions/originations 5,984$ 5,147$ 7,386$ 8,582$ 7,958$ Total locks 6,413$ 6,099$ 8,864$ 9,397$ 8,924$ 4Q13 1Q14 2Q14 3Q14 4Q14 Acquisitions, Originations, and Locks by Product 26 Note: Figures may not sum exactly due to rounding