Attached files
| file | filename |
|---|---|
| 8-K - FORM 8-K - ORRSTOWN FINANCIAL SERVICES INC | form8-kinvestorrelations.htm |

Orrstown Financial Services, Inc. Investor Presentation February 3, 2015 Exhibit 99
This presentation may contain forward-looking statements as defined in the Private Securities Litigation Reform Act of 1995. Forward-looking statements are statements that include projections, predictions, expectations, or beliefs about events or results or otherwise are not statements of historical facts, including statements related to improving credit, improving core fundamental operations, improving operational efficiency, cost savings, growing core earnings through expense reduction and revenue growth, investments in revenue generating lines of business, preserving capital, serving shareholder returns, expanding core funding, converting non-performing assets to earning assets, being well positioned for selective loan growth, our target efficiency ratio in the next 36 months, our initiatives meeting return on capital minimums, and strong reserve coverage. Actual results and trends could differ materially from those set forth in such statements and there can be no assurances we will: improve credit, improve core fundamental operations, improve operational efficiency, achieve cost savings, grow core earnings, grow our revenues, reduce expenses, expand our business, preserve capital, provide the return that our shareholders may expect, expand core funding, convert non- performing assets to earning assets, grow our loan portfolio, achieve our target efficiency ratio in the next 36 months, or that our initiatives will meet return on capital minimums or that our reserves will be adequate. Factors that could cause actual results to differ from those expressed or implied by the forward-looking statements include, but are not limited to, the following: ineffectiveness of the Company's business strategy due to changes in current or future market conditions; the effects of competition, including industry consolidation and development of competing financial products and services; changes in laws and regulations, including the Dodd-Frank Wall Street Reform and Consumer Protection Act; interest rate movements; changes in credit quality; inability to raise capital under favorable conditions, volatilities in the securities markets, deteriorating economic conditions, and other risks and uncertainties, including those detailed in Orrstown Financial Services, Inc.'s Form 10-K for the fiscal years ended December 31, 2013 and 2012 and Form 10-Qs for the quarters ended September 30, 2014, June 30, 2014, March 31, 2014, and other filings made with the Securities and Exchange Commission. The statements are valid only as of the date hereof and Orrstown Financial Services, Inc. disclaims any obligation to update this information. Forward Looking Information
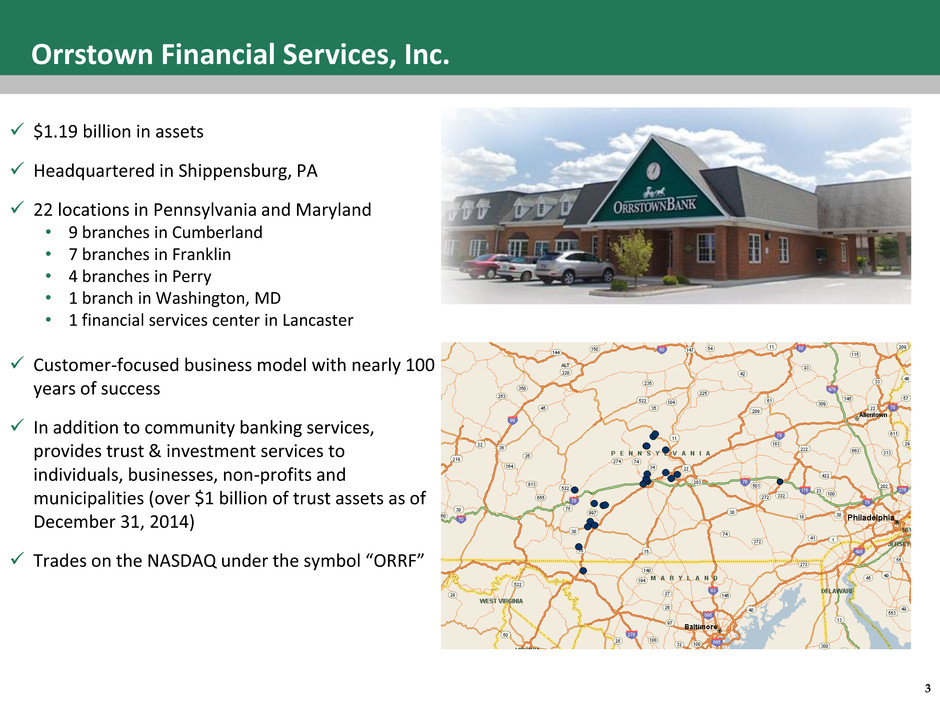
3 Orrstown Financial Services, Inc. $1.19 billion in assets Headquartered in Shippensburg, PA 22 locations in Pennsylvania and Maryland • 9 branches in Cumberland • 7 branches in Franklin • 4 branches in Perry • 1 branch in Washington, MD • 1 financial services center in Lancaster Customer-focused business model with nearly 100 years of success In addition to community banking services, provides trust & investment services to individuals, businesses, non-profits and municipalities (over $1 billion of trust assets as of December 31, 2014) Trades on the NASDAQ under the symbol “ORRF”

4 Experienced Leadership Team Name / Title Banking Experience Joined ORRF Experience / Disciplines Prior Experience Thomas R. Quinn President and CEO 24 Years 2009 CEO, Strategy, Sales, Executive Citi, Fifth Third David P. Boyle Chief Financial Officer 23 Years 2012 Finance, Treasury, Strategy, Executive PNC/National City, Wayne Bancorp Jeffrey M. Seibert Chief Operating Officer 33 Years 2012 Credit, Lending, Sales, Executive Susquehanna, Peoples, Community Banks Robert G. Coradi Chief Risk Officer 26 Years 2012 Credit, Risk, Governance Susquehanna Benjamin W. Wallace EVP Operations / Tech 12 Years 2013 Technology, Legal, Operations, Executive JPM/Chase Philip E. Fague EVP Mortgage / Trust 25 Years 1997 Mortgage, Trust, Retail, Lending, Executive Orrstown Bank

5 Investment Considerations Financial performance historically above peers Late to the credit challenge cycle (2011 - 2012) Significant management changes Dealt with issues swiftly and decisively Returned to profitability 4Q 2012 Orrstown Financial Services, Inc. (ORRF) Central Pennsylvania Community Banking Organization Total Assets $1.19B; Market Cap of ~$143M Improving performance 2013 and 2014 Continued to invest in people and technology during challenging times Long-term investment focus centered on generating shareholder value through efficient capital management Attractive relative valuation Well positioned for future growth

6 Frequently Asked Questions From Institutional and Retail Investors Institutional Investors are asking: When will you be released from regulatory enforcement actions? How will you deploy your excess capital? When will you become acquisitive and what is your growth strategy? How are you going to address your efficiency ratio issues? Retail Investors are asking: When will you resume paying dividends?

7 Operating Strategy & Strategic Initiatives Goal: Position the Company for sustained growth now and in the future • Reinvest for future growth • Maintain an acceptable risk profile • Expand market share (acquisition and new markets) • Disciplined expense control Regulatory Orders: Credit and Risk Management Operating Strategy Strategic Initiatives • Asset quality remediation drives 128% reduction in NPA’s from 2011 • New credit team with larger bank experience • ERM framework built, staffed and functioning • New hires from larger banks in compliance, cyber and enterprise risk • Continue to make progress relative to enforcement actions Improving fundamental Operations • Focused sales culture supported by data and metrics • Cost saving exercise allowed reinvestment without expense growth • Balance sheet transformation under way • Rebuilt capital levels to support future growth • Returned to profitability in late 2012 Other Strategic Initiatives • Franchise/branch rationalization and expansion • Technology investment to drive customer acquisition • Leverage retail delivery network to small business space • Expand Wealth offerings in new and existing markets • Add revenue production staff in key markets

8 Summary Financial Highlights 1. The efficiency ratio expresses noninterest expense as a percentage of tax equivalent net interest income and noninterest income, excluding securities gains, intangible amortization and impairment, and other non-recurring items. 2. The ratio of tangible common equity, or TCE, to tangible assets, or TA, is a non-GAAP-based financial measure. In order to calculate tangible common equity and tangible assets, the Company’s management subtracts intangible assets from both common equity and assets. The most directly comparable GAAP-based measure is the ratio of stockholders’ equity to assets. 3. Risk Assets defined as nonaccrual loans, restructured loans, loans past due 90 days or more and still accruing, and real estate owned. 4. NPLs include nonaccrual loans, restructured loans, loans past due 90 days or more and still accruing. (Dollars in 000's, except per share data) Year Ended December 31, Balance Sheet: 2009 2010 2011 2012 2013 2014 Total Assets $ 1,196,432 $ 1,511,722 $ 1,444,097 $ 1,232,668 $ 1,177,812 $1,190,443 Total Gross Loans 881,074 966,986 967,993 711,601 672,973 704,946 Total Deposits 915,170 1,188,377 1,216,902 1,085,039 1,000,390 949,704 Total Shareholders’ Equity 110,886 160,484 128,197 87,694 91,439 127,265 Results of Operations: Net Income (Loss) $ 13,373 $ 16,581 $ (31,964) $ (38,454) $10,004 $29,142 Diluted Earnings (Loss) Per Share $ 2.07 $ 2.17 $ (3.98) $ (4.77) $ 1.24 $3.59 Return on Average Assets 1.19% 1.21% (2.11%) (2.84%) 0.84% 2.48% Return on Average Equity 12.48% 11.22% (20.33%) (35.22%) 11.30% 28.78% Net Interest Margin (Tax Equivalent Basis) 3.66% 3.73% 3.66% 3.12% 3.03% 3.20% Efficiency Ratio (1) 58.9% 54.9% 55.2% 72.2% 83.3% 83.0% Capital Adequacy: Tangible Common Equity / Tangible Assets (2) 7.65% 9.38% 8.81% 7.05% 7.71% 10.66% Total Risk-based Capital Ratio 11.4% 14.8% 13.0% 12.2% 15.0% 16.8% Asset Quality: Risk Assets / Assets (3) 0.96% 1.22% 7.88% 1.86% 2.23% 1.16% Allowance for Loan Losses/ NPLs (4) 259.4% 106.3% 39.2% 110.1% 82.8% 111.6% Allowance for Loan Losses/ Gross Loans 1.26% 1.66% 4.53% 3.29% 3.12% 2.09%

9 Deposit Composition (12/31/2014) Non- interest bearing, 12% Now and money market, 53% Savings, 9% Time < $100,000 [VALUE] Time > $100,000 [VALUE] $949.7 million in total deposits Significant deposit franchise with nearly 90% core Limited use of wholesale and brokered deposits Effectively managing cost of funds 0.47% 0.45% 0.45% 0.44% 0.42% 0.39% 0.35% 0.40% 0.45% 0.50% 3Q13 4Q13 1Q14 2Q14 3Q14 4Q14 Cost of funds by quarter
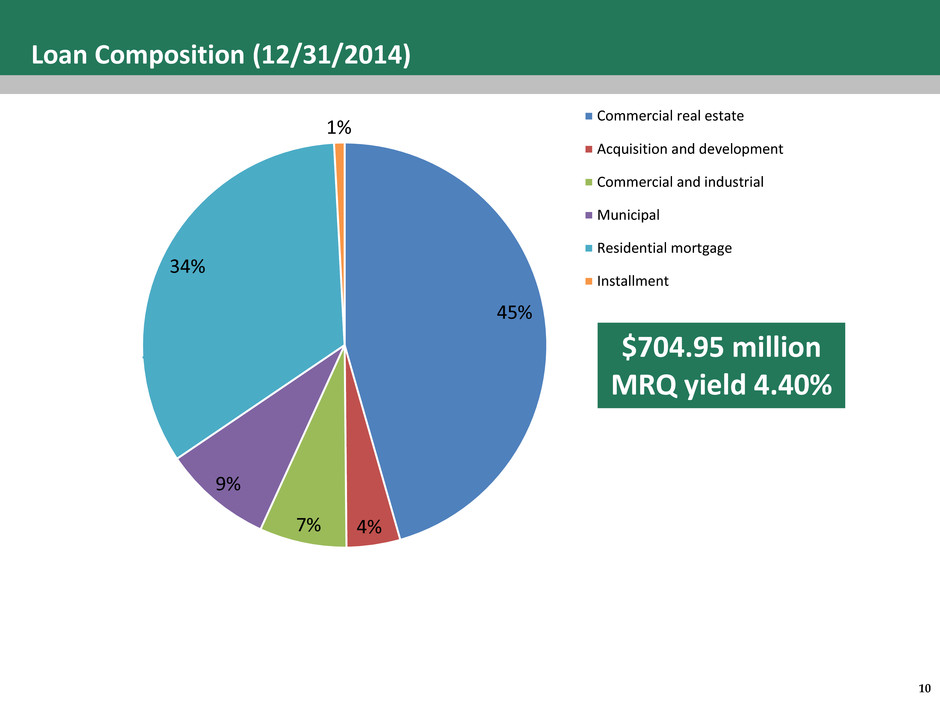
10 Loan Composition (12/31/2014) 45% 4% 7% 9% 34% 1% Commercial real estate Acquisition and development Commercial and industrial Municipal Residential mortgage Installment $704.95 million MRQ yield 4.40%
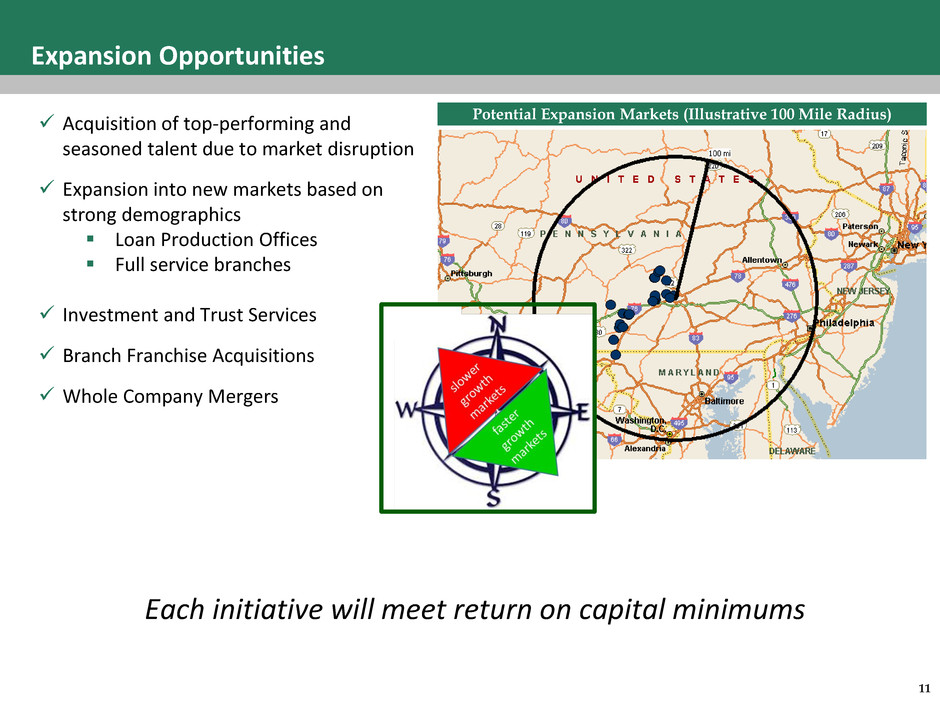
11 Acquisition of top-performing and seasoned talent due to market disruption Expansion into new markets based on strong demographics Loan Production Offices Full service branches Investment and Trust Services Branch Franchise Acquisitions Whole Company Mergers Expansion Opportunities Potential Expansion Markets (Illustrative 100 Mile Radius) Each initiative will meet return on capital minimums

12 Orrstown Bank – Organic Growth Potential Tier 1 capital capacity to grow over $200 million Business as usual of 5%-7% balance sheet growth Enhance opportunities (“budget beat”) through: Leveraging data and investments of best-in-class “tech shop” Leveraging balance sheet (current loan to deposit ratio 74%) Opportunities in new markets: 1. Start with LPO and build asset base 2. Strategic placement of full service office(s) 3. Build to critical mass over time Targeted expense reduction in 2015

13 Market Area Currently operating 21 full-service locations along the Route 81 corridor from Washington County, Maryland through Franklin, Cumberland and Perry Counties, Pennsylvania; LPO in Lancaster County The combined population of the current market area is approximately 580,000 as of June 30, 2012 The current combined market has $10.7 billion in total deposits as of June 30, 2014 Orrstown has nearly $950 million in deposits as of December 31, 2014 or approximately 9% market share 3 targeted counties to the East (Lancaster, Frederick, York,) represent growth markets of approximately $20.9 billion in deposits Harrisburg is approximately 70 miles from Baltimore, 90 miles from Philadelphia and 95 miles from Washington D.C.

14 Market Potential – Deposits Bank Three year deposit growth* Total Deposits# (000) Bank A 7.25% $800,643 Bank B 15.17% $845,724 Bank C 14.92% $2,380,672 Bank D 42.12% $739,000 Bank E 9.58% $608,130 Bank F 11.77% $954,973 Bank G 6.72% $13,367,506 Bank H 33.35% $13,721,843 Average/Total 17.62% $33,418,491 *Data from SNL using last three years total deposits. For institutions with 2014 data available used percent change 2010-2014, for institutions with 2013 available used percent change 2009-2013. # Data from SNL, used year end deposits from most recent available year; deposits are total deposits for each financial institution listed above Strong in-market deposit growth Market disruption of several in-market financial institutions presents opportunity to fund balance sheet growth
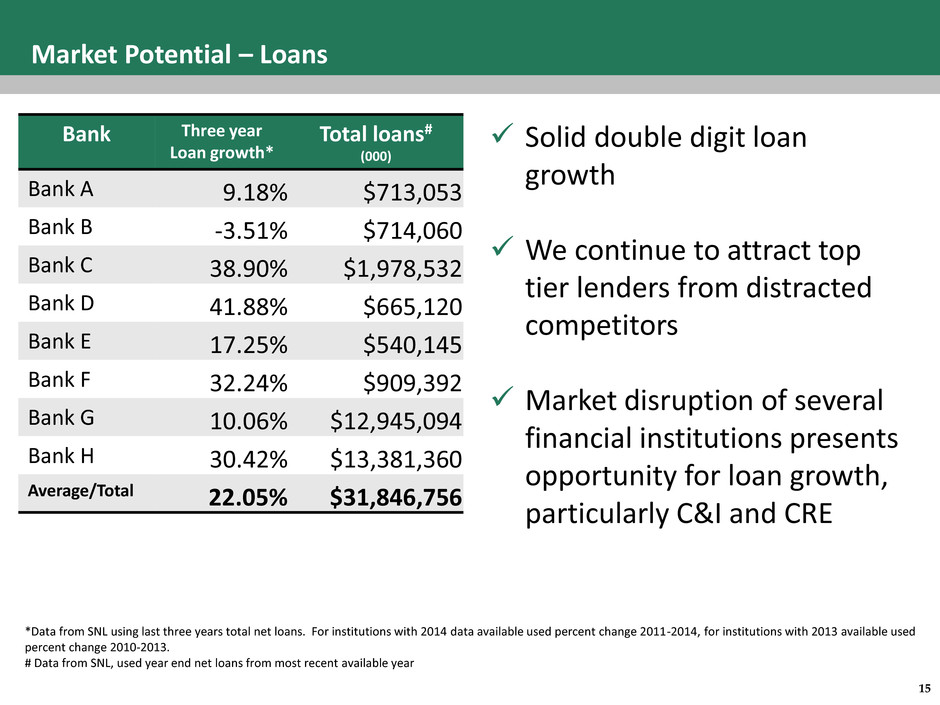
15 Market Potential – Loans Bank Three year Loan growth* Total loans# (000) Bank A 9.18% $713,053 Bank B -3.51% $714,060 Bank C 38.90% $1,978,532 Bank D 41.88% $665,120 Bank E 17.25% $540,145 Bank F 32.24% $909,392 Bank G 10.06% $12,945,094 Bank H 30.42% $13,381,360 Average/Total 22.05% $31,846,756 *Data from SNL using last three years total net loans. For institutions with 2014 data available used percent change 2011-2014, for institutions with 2013 available used percent change 2010-2013. # Data from SNL, used year end net loans from most recent available year Solid double digit loan growth We continue to attract top tier lenders from distracted competitors Market disruption of several financial institutions presents opportunity for loan growth, particularly C&I and CRE

16 Mergers in process in highly attractive markets will provide growth opportunities as fall out occurs Several other larger local players facing inflection points in 2015 100 Banks within two hour drive of Orrstown have less than $750 million in assets We have successfully overcome regulatory and asset quality issues We have already invested in scalable infrastructure to deliver efficiencies Poised to Take Advantage of Market Disruption
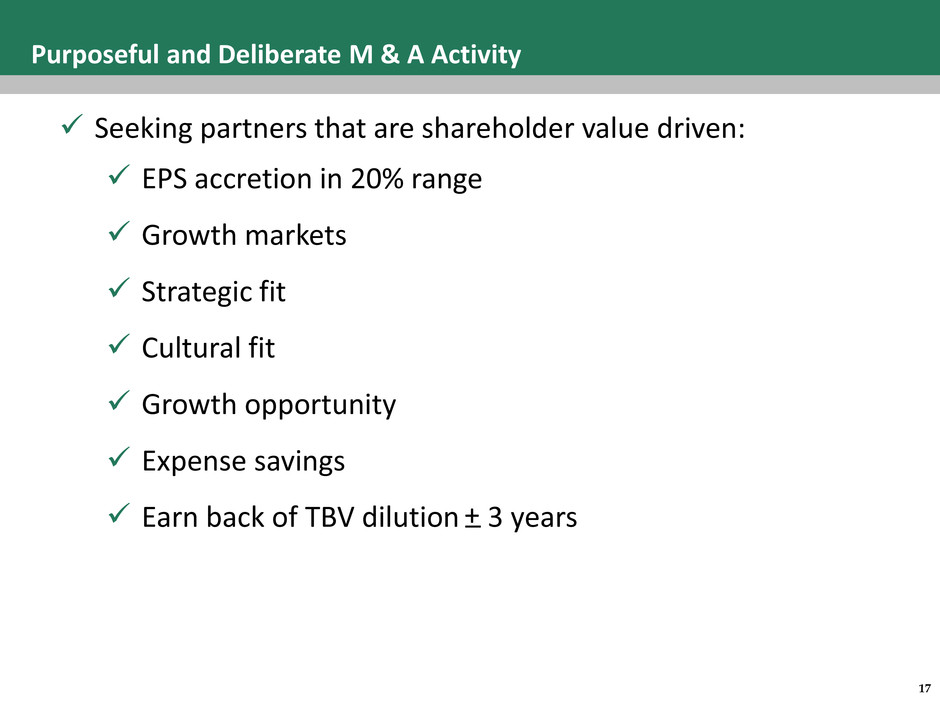
17 Purposeful and Deliberate M & A Activity Seeking partners that are shareholder value driven: EPS accretion in 20% range Growth markets Strategic fit Cultural fit Growth opportunity Expense savings Earn back of TBV dilution 3 years +_

18 Summary Highlights Established South Central Pennsylvania bank Deep and experienced Management team with strong operational ability Aggressively dealt with Regulatory/asset quality issues. Strategic plans in place to drive core earnings growth, with a return to annual profitability in 2013 and improved profitability in 2014 Well-positioned for future growth throughout the region Compelling absolute and relative valuation
