Attached files
| file | filename |
|---|---|
| 8-K - 8-K - IDEX CORP /DE/ | iex-20150204x8k.htm |
| EX-99.2 - EX 99.2 - IDEX CORP /DE/ | iex-20150204xex992.htm |
Fourth Quarter Earnings JANUARY 29, 2015
AGENDA IDEX’s Outlook Q4 & 2014 Financial Performance Q4 & 2014 Segment Performance • Fluid & Metering • Health & Science • Fire & Safety / Diversified Products 2015 Guidance Detail Q&A 1

REPLAY INFORMATION Dial toll–free: 877.660.6853 International: 201.612.7415 Conference ID: #13598705 Log on to: www.idexcorp.com 2
Cautionary Statement Under the Private Securities Litigation Reform Act This presentation and discussion will include forward-looking statements. Our actual performance may differ materially from that indicated or suggested by any such statements. There are a number of factors that could cause those differences, including those presented in our most recent annual report and other company filings with the SEC. 3
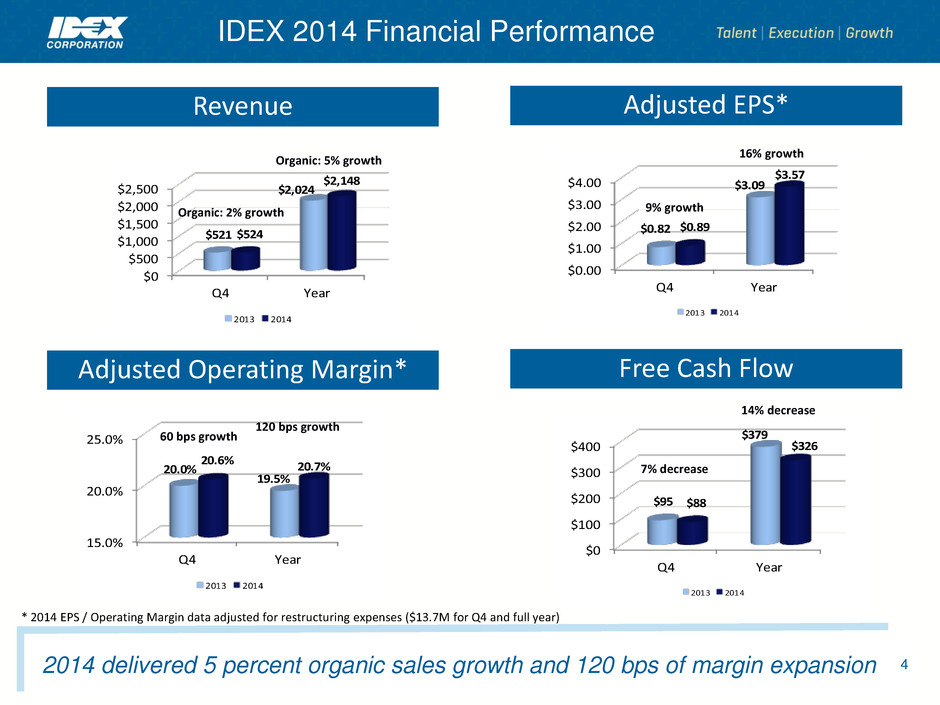
Revenue Adjusted EPS* Adjusted Operating Margin* Free Cash Flow 2014 delivered 5 percent organic sales growth and 120 bps of margin expansion IDEX 2014 Financial Performance 4 $0 $500 $1,000 $1,500 $2,00 $2,500 Q4 Year $521 $2,024 $524 $2,148 2013 2014 $0.00 $1.00 $ .00 $3.00 $4.00 Q4 Year $0.82 $3.09 $0.89 $3.57 2013 2014 15.0% 20.0% 25.0% Q4 Year 20.0% 19.5% 20.6% 20.7% 2013 2014 $0 $100 $200 $300 40 Q4 Year $95 $379 $88 $326 2013 2014 Organic: 5% growth Organic: 2% growth 60 bps growth 120 bps growth 16% growth 9% growth 7% decrease 14% decrease * 2014 EPS / Operating Margin data adjusted for restructuring expenses ($13.7M for Q4 and full year)
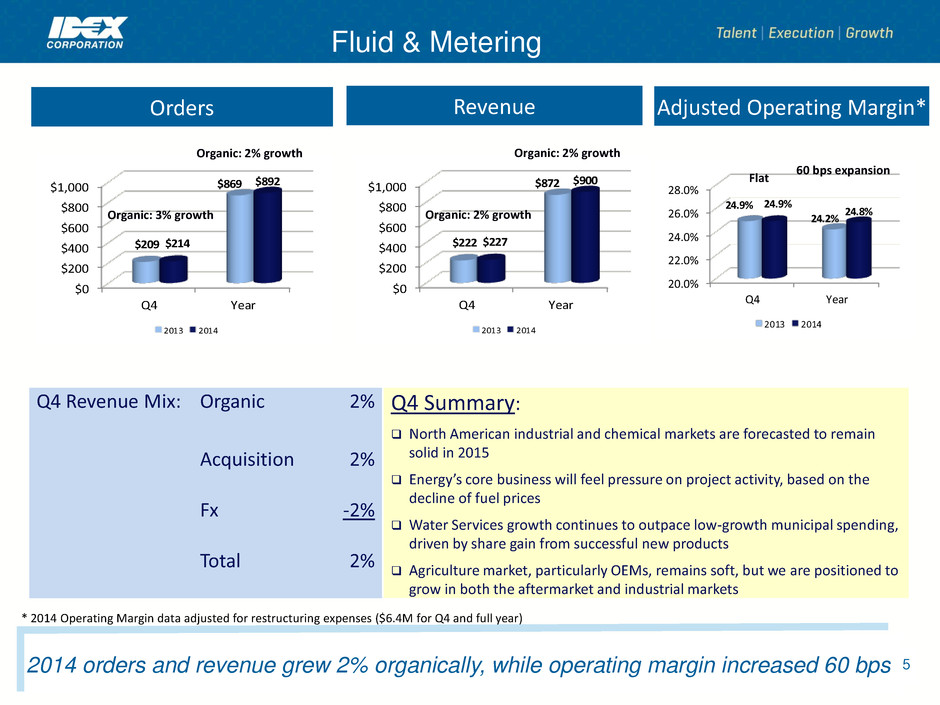
Orders Revenue Q4 Revenue Mix: Organic 2% Acquisition 2% Fx -2% Total 2% Q4 Summary: North American industrial and chemical markets are forecasted to remain solid in 2015 Energy’s core business will feel pressure on project activity, based on the decline of fuel prices Water Services growth continues to outpace low-growth municipal spending, driven by share gain from successful new products Agriculture market, particularly OEMs, remains soft, but we are positioned to grow in both the aftermarket and industrial markets Adjusted Operating Margin* Fluid & Metering 5 2014 orders and revenue grew 2% organically, while operating margin increased 60 bps $0 $200 $400 $600 $800 $1,000 Q4 Year $209 $869 $214 $892 2013 2014 20.0% 22.0% 24.0% 26.0% 28.0% Q4 Year 24.9% 24.2% 24.9% 24.8% 2013 2014 Organic: 2% growth Organic: 3% growth $0 $200 $400 $600 $800 $1,000 Q4 Year $222 $872 $227 $900 2013 2014 Organic: 2% growth Organic: 2% growth Flat 60 bps expansion * 2014 Operating Margin data adjusted for restructuring expenses ($6.4M for Q4 and full year)
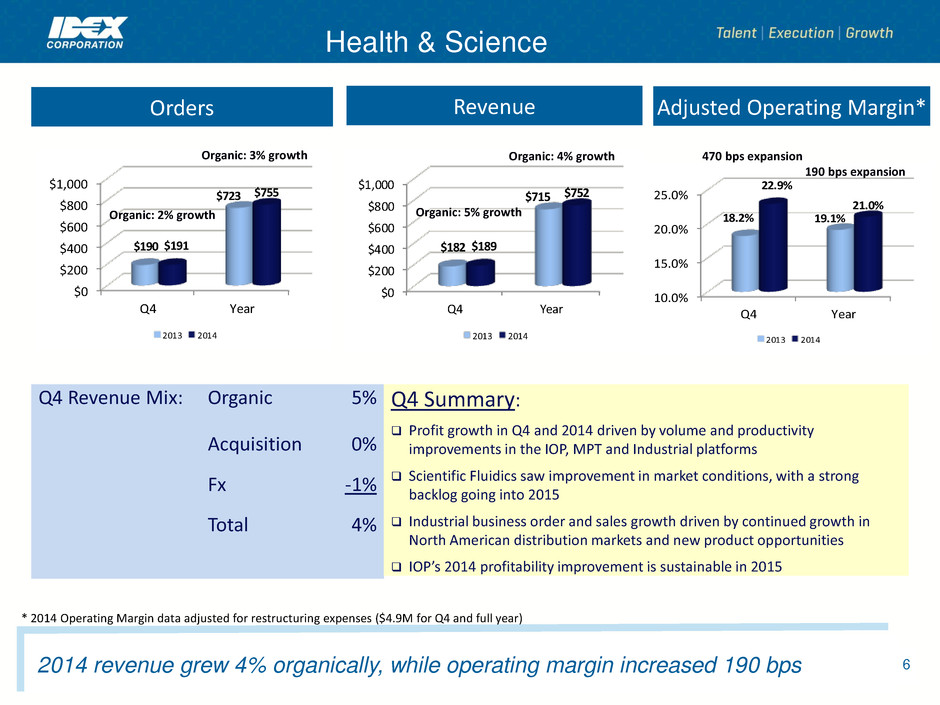
Health & Science Orders Revenue Adjusted Operating Margin* 6 2014 revenue grew 4% organically, while operating margin increased 190 bps $0 $200 $400 $600 $800 $1,000 Q4 Year $190 $723 $191 $755 2013 2014 $0 $200 $400 $600 $800 $1,000 Q4 Year $182 $715 $189 $752 2013 2014 10.0% 15.0% 20.0% 25.0% Q4 Year 18.2% 19.1% 22.9% 21.0% 2013 2014 Q4 Revenue Mix: Organic 5% Acquisition 0% Fx -1% Total 4% Q4 Summary: Profit growth in Q4 and 2014 driven by volume and productivity improvements in the IOP, MPT and Industrial platforms Scientific Fluidics saw improvement in market conditions, with a strong backlog going into 2015 Industrial business order and sales growth driven by continued growth in North American distribution markets and new product opportunities IOP’s 2014 profitability improvement is sustainable in 2015 Organic: 3% growth Organic: 2% growth Organic: 4% growth Organic: 5% growth 470 bps expansion 190 bps expansion * 2014 Operating Margin data adjusted for restructuring expenses ($4.9M for Q4 and full year)
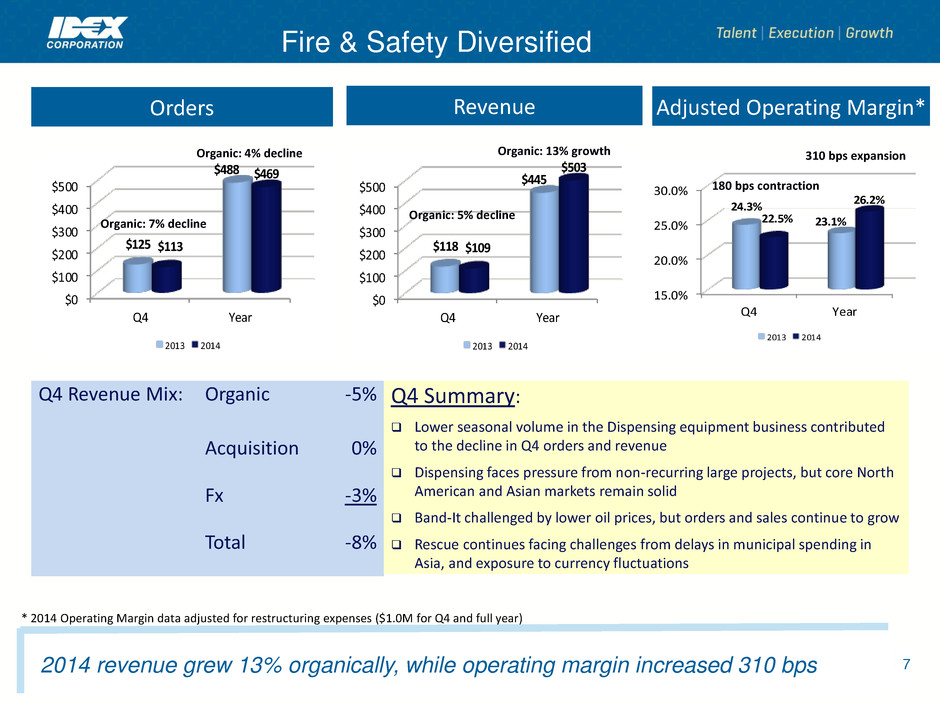
$0 $100 $200 $300 $400 $500 Q4 Year $125 $488 $113 $469 2013 2014 Orders Revenue Organic: 4% decline Adjusted Operating Margin* Q4 Revenue Mix: Organic -5% Acquisition 0% Fx -3% Total -8% Q4 Summary: Lower seasonal volume in the Dispensing equipment business contributed to the decline in Q4 orders and revenue Dispensing faces pressure from non-recurring large projects, but core North American and Asian markets remain solid Band-It challenged by lower oil prices, but orders and sales continue to grow Rescue continues facing challenges from delays in municipal spending in Asia, and exposure to currency fluctuations Fire & Safety Diversified 7 2014 revenue grew 13% organically, while operating margin increased 310 bps $0 $100 $200 $300 $400 $500 Q4 Year $118 $445 $109 $503 2013 2014 15.0% 20.0% 25.0% 30.0% Q4 Year 24.3% 23.1%22.5% 26.2% 2013 2014 Organic: 7% decline Organic: 5% decline Organic: 13% growth 180 bps contraction 310 bps expansion * 2014 Operating Margin data adjusted for restructuring expenses ($1.0M for Q4 and full year)
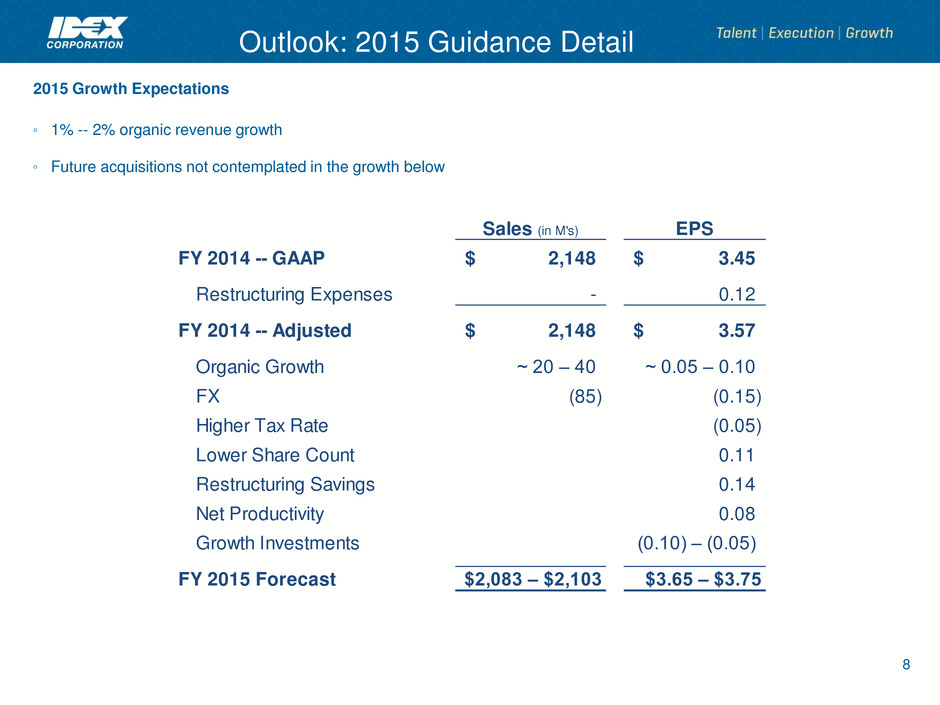
8 Outlook: 2015 Guidance Detail 2015 Growth Expectations 1% -- 2% organic revenue growth Future acquisitions not contemplated in the growth below Sales (in M's) EPS FY 2014 -- GAAP 2,148$ 3.45$ Restructuring Expenses - 0.12 FY 2014 -- Adjusted 2,148$ 3.57$ Organic Growth ~ 20 – 40 ~ 0.05 – 0.10 FX (85) (0.15) Higher Tax Rate (0.05) Low r Share Count 0.11 R structuring Savings 0.14 Net Productivity 0.08 Growth Investments (0.10) – (0.05) FY 2015 Forecast $2,083 – $2,103 $3.65 – $3.75
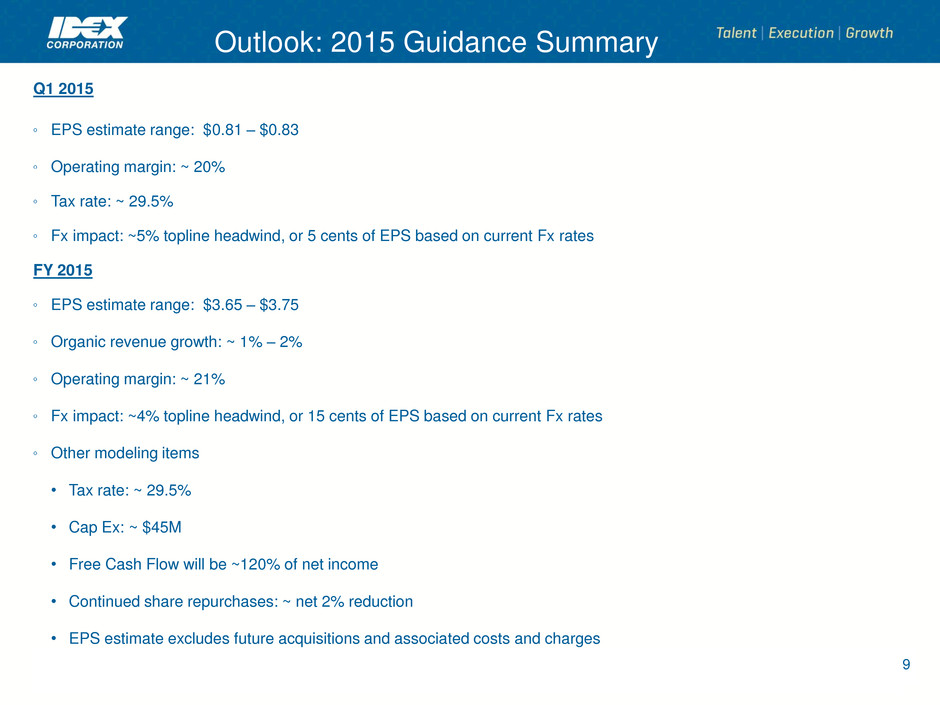
Q1 2015 EPS estimate range: $0.81 – $0.83 Operating margin: ~ 20% Tax rate: ~ 29.5% Fx impact: ~5% topline headwind, or 5 cents of EPS based on current Fx rates FY 2015 EPS estimate range: $3.65 – $3.75 Organic revenue growth: ~ 1% – 2% Operating margin: ~ 21% Fx impact: ~4% topline headwind, or 15 cents of EPS based on current Fx rates Other modeling items • Tax rate: ~ 29.5% • Cap Ex: ~ $45M • Free Cash Flow will be ~120% of net income • Continued share repurchases: ~ net 2% reduction • EPS estimate excludes future acquisitions and associated costs and charges 9 Outlook: 2015 Guidance Summary

Q&A 10
