Attached files
| file | filename |
|---|---|
| 8-K - FIRST BANCORP. 8-K - FIRST BANCORP /PR/ | a51034082.htm |
| EX-99.1 - EXHIBIT 99.1 - FIRST BANCORP /PR/ | a51034082ex991.htm |
Exhibit 99.2
1 Financial Results Fourth Quarter & Fiscal Year 2014
2 Forward-Looking Statements This presentation contains “forward-looking statements” concerning First BanCorp’s (the “Corporation”) future economic performance. The words or phrases “would be,” “will allow,” “intends to,” “will likely result,” “are expected to,” “expect,” “anticipate,” “look forward,” “should,” “believes” and similar expressions are meant to identify “forward-looking statements” within the meaning of Section 27A of the Private Securities Litigation Reform Act of 1995, and are subject to the safe harbor created by such section. The Corporation wishes to caution readers not to place undue reliance on any such “forward-looking statements,” which speak only as of the date made, and to advise readers that various factors, including, but not limited to, uncertainty about whether the Corporation and FirstBank Puerto Rico (“FirstBank” or “the Bank”) will be able to fully comply with the written agreement dated June 3, 2010 that the Corporation entered into with the Federal Reserve Bank of New York (the “FED”) and the order dated June 2, 2010 (the “Order”)that FirstBank entered into with the FDIC and the Office of the Commissioner of Financial Institutions of Puerto Rico that, among other things, require FirstBank to maintain certain capital levels and reduce its special mention, classified, delinquent and non-performing assets; the risk of being subject to possible additional regulatory actions; uncertainty as to the availability of certain funding sources, such as retail brokered CDs; the Corporation’s reliance on brokered CDs and its ability to obtain, on a periodic basis, approval from the FDIC to issue brokered CDs to fund operations and provide liquidity in accordance with the terms of the Order; the risk of not being able to fulfill the Corporation’s cash obligations or resume paying dividends to the Corporation’s stockholders in the future due to the Corporation’s inability to receive approval from the FED to receive dividends from FirstBank or FirstBank’s failure to generate sufficient cash flow to make a dividend payment to the Corporation; the strength or weakness of the real estate markets and of the consumer and commercial credit sectors and their impact on the credit quality of the Corporation’s loans and other assets, including the Corporation’s construction and commercial real estate loan portfolios, which have contributed and may continue to contribute to, among other things, the high levels of non-performing assets, charge-offs and the provision expense and may subject the Corporation to further risk from loan defaults and foreclosures; adverse changes in general economic conditions in the United States and in Puerto Rico, including the interest rate scenario, market liquidity, housing absorption rates, real estate prices and disruptions in the U.S. capital markets, which may reduce interest margins, impact funding sources and affect demand for all of the Corporation’s products and services and the value of the Corporation’s assets; an adverse change in the Corporation’s ability to attract new clients and retain existing ones; a decrease in demand for the Corporation’s products and services and lower revenues and earnings because of the continued recession in Puerto Rico and the current fiscal problems and budget deficit of the Puerto Rico government; uncertainty about regulatory and legislative changes for financial services companies in Puerto Rico, the United States and the U.S. and British Virgin Islands, which could affect the Corporation’s financial performance and could cause the Corporation’s actual results for future periods to differ materially from prior results and anticipated or projected results; uncertainty about the effectiveness of the various actions undertaken to stimulate the United States economy and stabilize the United States’ financial markets, and the impact such actions may have on the Corporation’s business, financial condition and results of operations; changes in the fiscal and monetary policies and regulations of the federal government, including those determined by the Federal Reserve System, the FDIC, government-sponsored housing agencies and regulators in Puerto Rico and the U.S. and British Virgin Islands; the risk of possible failure or circumvention of controls and procedures and the risk that the Corporation’s risk management policies may not be adequate; the risk that the FDIC may further increase the deposit insurance premium and/or require special assessments to replenish its insurance fund, causing an additional increase in the Corporation’s non-interest expense; risks of not being able to recover the assets pledged to Lehman Brothers Special Financing, Inc.; the impact on the Corporation’s results of operations and financial condition associated with acquisitions and dispositions; a need to recognize additional impairments on financial instruments or goodwill relating to acquisitions; risks that downgrades in the credit ratings of the Corporation’s long-term senior debt will adversely affect the Corporation’s ability to access necessary external funds; the impact of the Dodd-Frank Wall Street Reform and Consumer Protection Act on the Corporation’s businesses, business practices and cost of operations; and general competitive factors and industry consolidation. The Corporation does not undertake, and specifically disclaims any obligation, to update any “forward-looking statements” to reflect occurrences or unanticipated events or circumstances after the date of such statements except as required by the federal securities laws. Investors should refer to the Corporation’s Annual Report on Form 10-K for the year ended December 31, 2013 for a discussion of such factors and certain risks and uncertainties to which the Corporation is subject.

3 Agenda Fourth Quarter & Fiscal Year 2014 Highlights: Aurelio Alemán, President & Chief Executive OfficerFourth Quarter 2014 Results of Operations: Orlando Berges, Executive Vice President & Chief Financial Officer Questions & Answers

4 FOURTH QUARTER & FISCAL YEAR 2014 Highlights
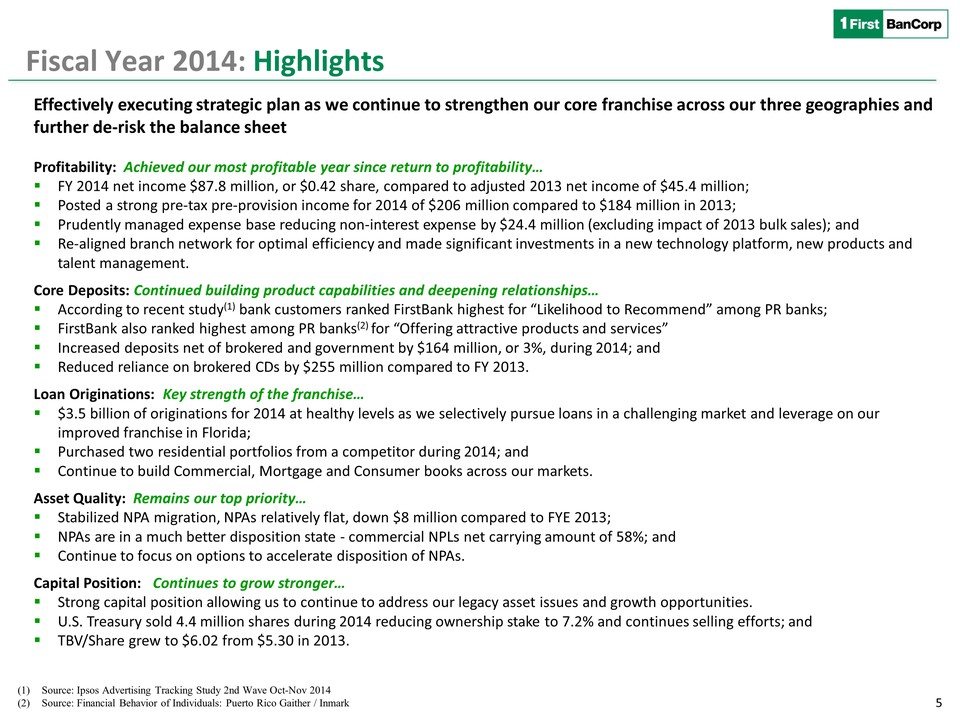
5 Fiscal Year 2014: Highlights Source: Ipsos Advertising Tracking Study 2nd Wave Oct-Nov 2014 Source: Financial Behavior of Individuals: Puerto Rico Gaither / Inmark Effectively executing strategic plan as we continue to strengthen our core franchise across our three geographies and further de-risk the balance sheet Profitability: Achieved our most profitable year since return to profitability… FY 2014 net income $87.8 million, or $0.42 share, compared to adjusted 2013 net income of $45.4 million; Posted a strong pre-tax pre-provision income for 2014 of $206 million compared to $184 million in 2013; Prudently managed expense base reducing non-interest expense by $24.4 million (excluding impact of 2013 bulk sales); and Re-aligned branch network for optimal efficiency and made significant investments in a new technology platform, new products and talent management. Core Deposits: Continued building product capabilities and deepening relationships…According to recent study(1) bank customers ranked FirstBank highest for “Likelihood to Recommend” among PR banks; FirstBank also ranked highest among PR banks(2) for “Offering attractive products and services”Increased deposits net of brokered and government by $164 million, or 3%, during 2014; andReduced reliance on brokered CDs by $255 million compared to FY 2013.Loan Originations: Key strength of the franchise… $3.5 billion of originations for 2014 at healthy levels as we selectively pursue loans in a challenging market and leverage on our improved franchise in Florida; Purchased two residential portfolios from a competitor during 2014; and Continue to build Commercial, Mortgage and Consumer books across our markets.Asset Quality: Remains our top priority…Stabilized NPA migration, NPAs relatively flat, down $8 million compared to FYE 2013; NPAs are in a much better disposition state - commercial NPLs net carrying amount of 58%; and Continue to focus on options to accelerate disposition of NPAs.Capital Position: Continues to grow stronger… Strong capital position allowing us to continue to address our legacy asset issues and growth opportunities. U.S. Treasury sold 4.4 million shares during 2014 reducing ownership stake to 7.2% and continues selling efforts; andTBV/Share grew to $6.02 from $5.30 in 2013.
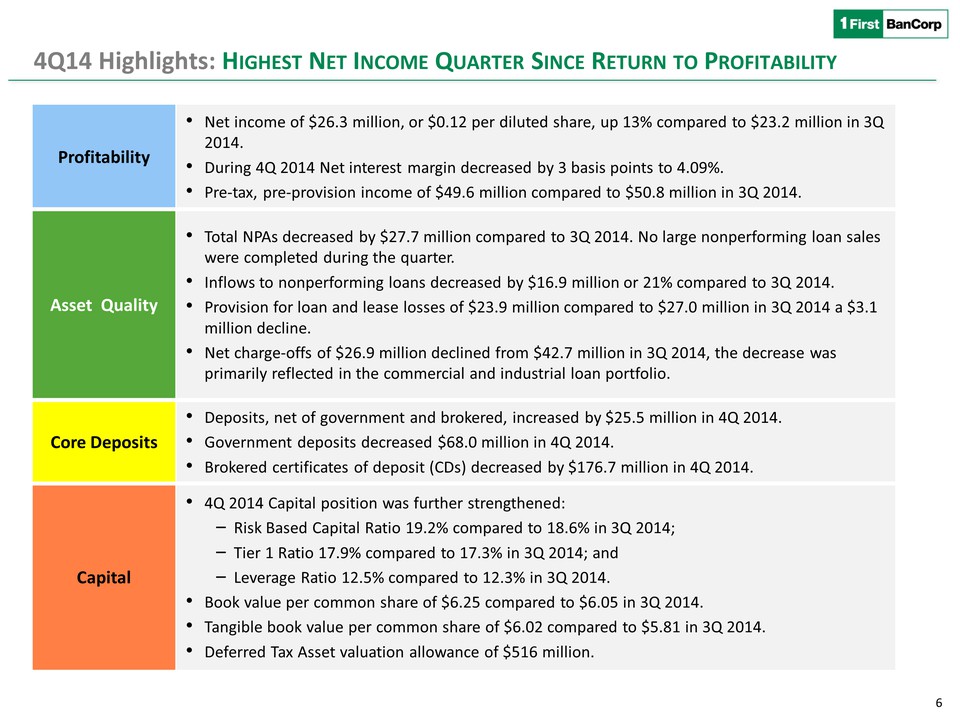
6 4Q14 Highlights: Highest Net Income Quarter Since Return to Profitability Net income of $26.3 million, or $0.12 per diluted share, up 13% compared to $23.2 million in 3Q 2014. During 4Q 2014 Net interest margin decreased by 3 basis points to 4.09%. Pre-tax, pre-provision income of $49.6 million compared to $50.8 million in 3Q 2014. Total NPAs decreased by $27.7 million compared to 3Q 2014. No large nonperforming loan sales were completed during the quarter. Inflows to nonperforming loans decreased by $16.9 million or 21% compared to 3Q 2014. Provision for loan and lease losses of $23.9 million compared to $27.0 million in 3Q 2014 a $3.1 million decline. Net charge-offs of $26.9 million declined from $42.7 million in 3Q 2014, the decrease was primarily reflected in the commercial and industrial loan portfolio. Deposits, net of government and brokered, increased by $25.5 million in 4Q 2014. Government deposits decreased $68.0 million in 4Q 2014. Brokered certificates of deposit (CDs) decreased by $176.7 million in 4Q 2014. 4Q 2014 Capital position was further strengthened: Risk Based Capital Ratio 19.2% compared to 18.6% in 3Q 2014; Tier 1 Ratio 17.9% compared to 17.3% in 3Q 2014; and Leverage Ratio 12.5% compared to 12.3% in 3Q 2014. Book value per common share of $6.25 compared to $6.05 in 3Q 2014. Tangible book value per common share of $6.02 compared to $5.81 in 3Q 2014. Deferred Tax Asset valuation allowance of $516 million. Profitability Asset Quality Core Deposits Capital
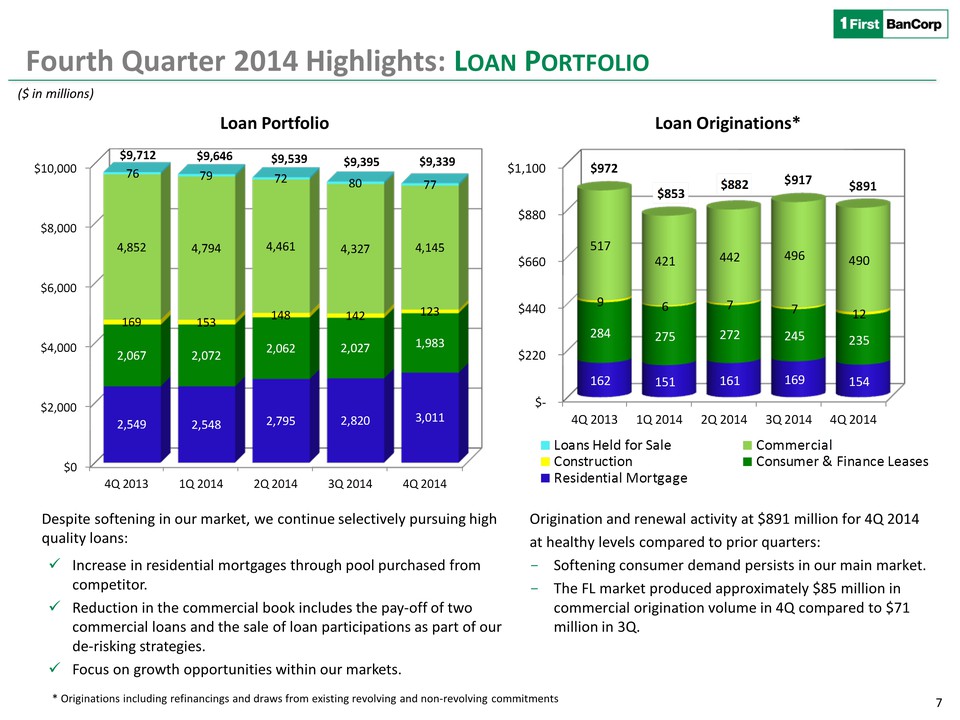
7 Fourth Quarter 2014 Highlights: Loan Portfolio Origination and renewal activity at $891 million for 4Q 2014 at healthy levels compared to prior quarters: Softening consumer demand persists in our main market. The FL market produced approximately $85 million in commercial origination volume in 4Q compared to $71 million in 3Q. ($ in millions) Loan Originations* Despite softening in our market, we continue selectively pursuing high quality loans: Increase in residential mortgages through pool purchased from competitor. Reduction in the commercial book includes the pay-off of two commercial loans and the sale of loan participations as part of our de-risking strategies. Focus on growth opportunities within our markets. * Originations including refinancings and draws from existing revolving and non-revolving commitments Loan Portfolio
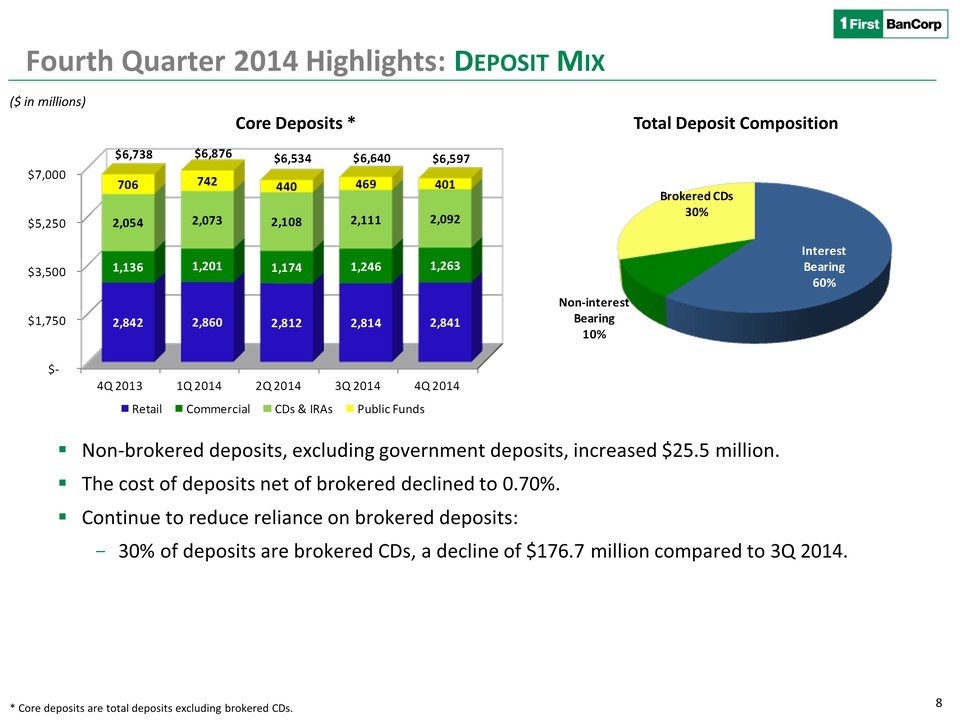
8 Non-brokered deposits, excluding government deposits, increased $25.5 million. The cost of deposits net of brokered declined to 0.70%. Continue to reduce reliance on brokered deposits: 30% of deposits are brokered CDs, a decline of $176.7 million compared to 3Q 2014. ($ in millions) Core Deposits * Total Deposit Composition Fourth Quarter 2014 Highlights: Deposit Mix * Core deposits are total deposits excluding brokered CDs.
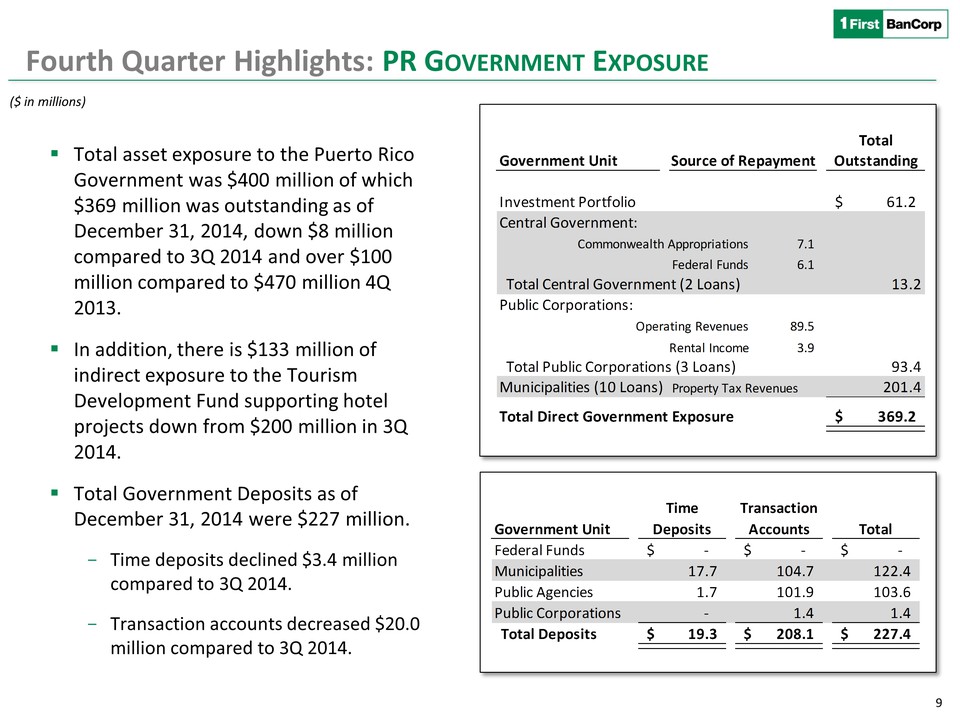
9 Total asset exposure to the Puerto Rico Government was $400 million of which $369 million was outstanding as of December 31, 2014, down $8 million compared to 3Q 2014 and over $100 million compared to $470 million 4Q 2013. In addition, there is $133 million of indirect exposure to the Tourism Development Fund supporting hotel projects down from $200 million in 3Q 2014. Total Government Deposits as of December 31, 2014 were $227 million. Time deposits declined $3.4 million compared to 3Q 2014. Transaction accounts decreased $20.0 million compared to 3Q 2014. Fourth Quarter Highlights: PR Government Exposure ($ in millions)
10 FOURTH QUARTER 2014 Results of Operations
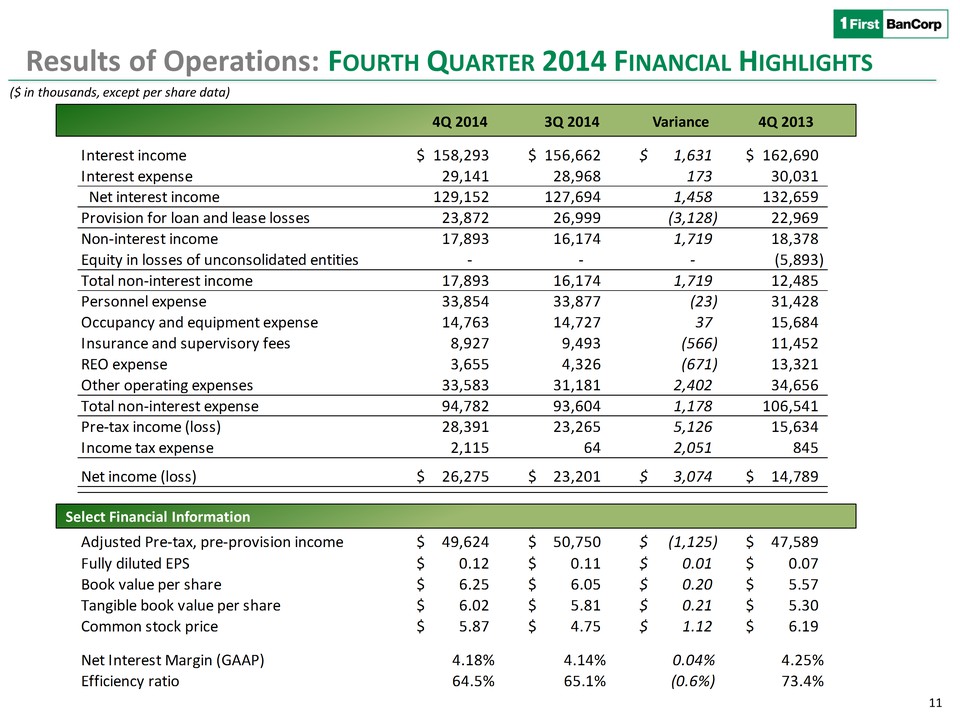
11 ($ in thousands, except per share data) Select Financial Information 4Q 2014 3Q 2014 Variance Results of Operations: Fourth Quarter 2014 Financial Highlights 4Q 2013
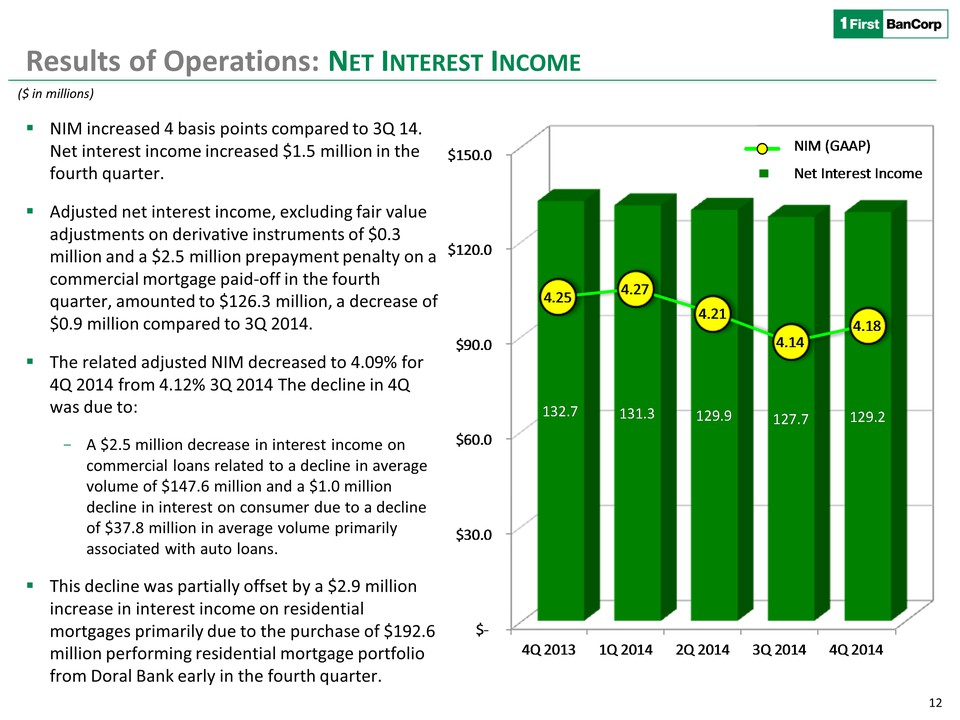
12 Results of Operations: Net Interest Income NIM increased 4 basis points compared to 3Q 14. Net interest income increased $1.5 million in the fourth quarter. Adjusted net interest income, excluding fair value adjustments on derivative instruments of $0.3 million and a $2.5 million prepayment penalty on a commercial mortgage paid-off in the fourth quarter, amounted to $126.3 million, a decrease of $0.9 million compared to 3Q 2014. The related adjusted NIM decreased to 4.09% for 4Q 2014 from 4.12% 3Q 2014 The decline in 4Q was due to: A $2.5 million decrease in interest income on commercial loans related to a decline in average volume of $147.6 million and a $1.0 million decline in interest on consumer due to a decline of $37.8 million in average volume primarily associated with auto loans. This decline was partially offset by a $2.9 million increase in interest income on residential mortgages primarily due to the purchase of $192.6 million performing residential mortgage portfolio from Doral Bank early in the fourth quarter. ($ in millions)
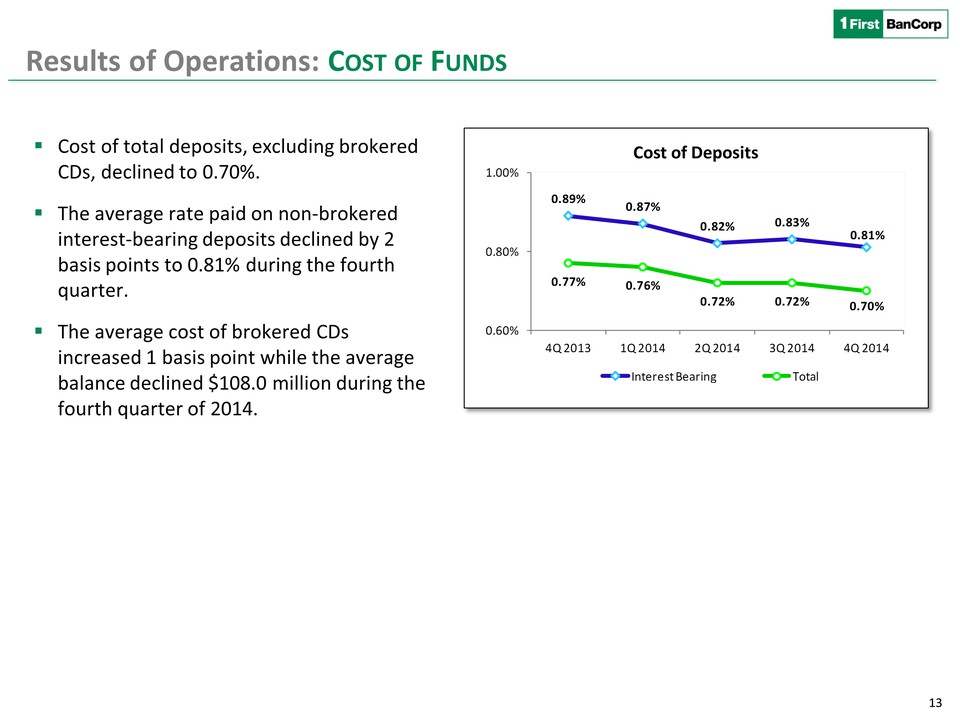
13 Results of Operations: Cost of Funds Cost of total deposits, excluding brokered CDs, declined to 0.70%. The average rate paid on non-brokered interest-bearing deposits declined by 2 basis points to 0.81% during the fourth quarter. The average cost of brokered CDs increased 1 basis point while the average balance declined $108.0 million during the fourth quarter of 2014. Cost of Deposits
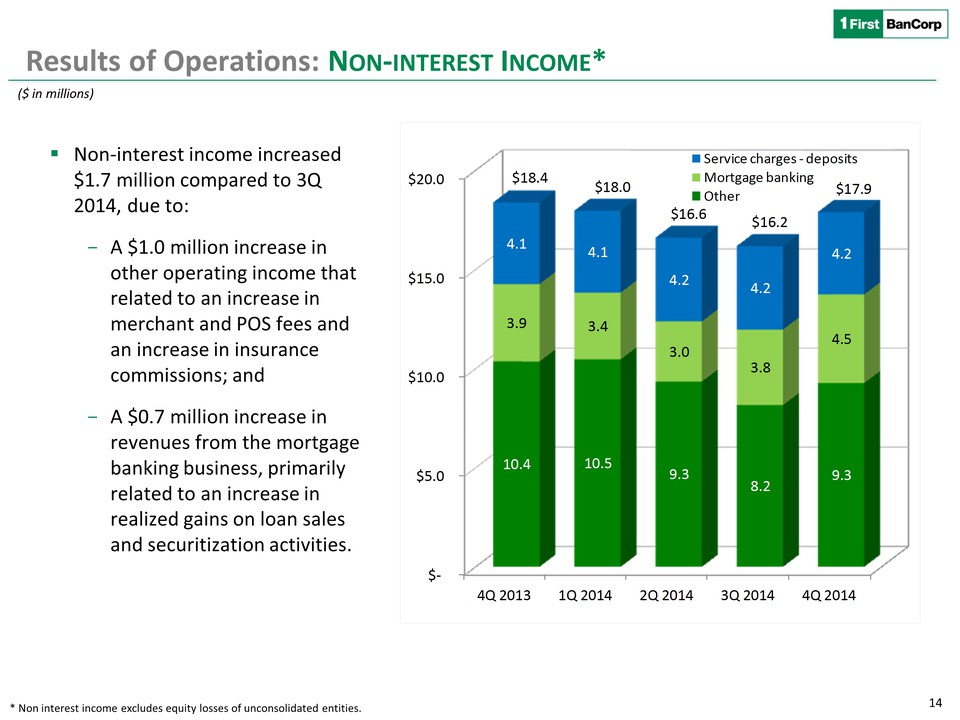
14 Results of Operations: Non-interest Income* Non-interest income increased $1.7 million compared to 3Q 2014, due to:A $1.0 million increase in other operating income that related to an increase in merchant and POS fees and an increase in insurance commissions; andA $0.7 million increase in revenues from the mortgage banking business, primarily related to an increase in realized gains on loan sales and securitization activities. * Non interest income excludes equity losses of unconsolidated entities. ($ in millions)
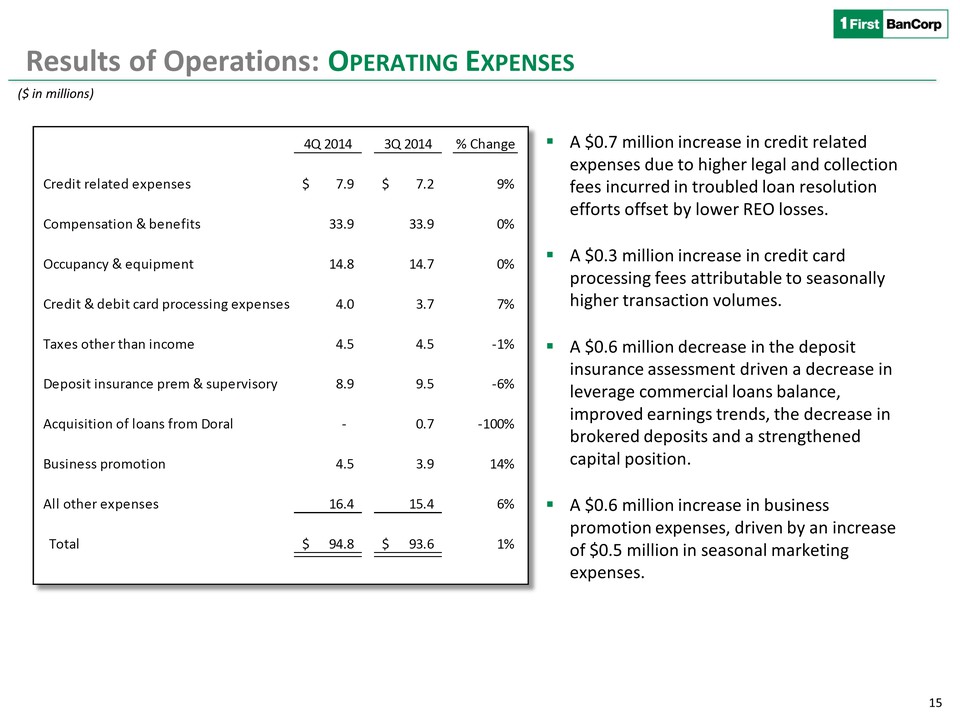
15 Results of Operations: Operating Expenses A $0.7 million increase in credit related expenses due to higher legal and collection fees incurred in troubled loan resolution efforts offset by lower REO losses. A $0.3 million increase in credit card processing fees attributable to seasonally higher transaction volumes. A $0.6 million decrease in the deposit insurance assessment driven a decrease in leverage commercial loans balance, improved earnings trends, the decrease in brokered deposits and a strengthened capital position. A $0.6 million increase in business promotion expenses, driven by an increase of $0.5 million in seasonal marketing expenses. ($ in millions)
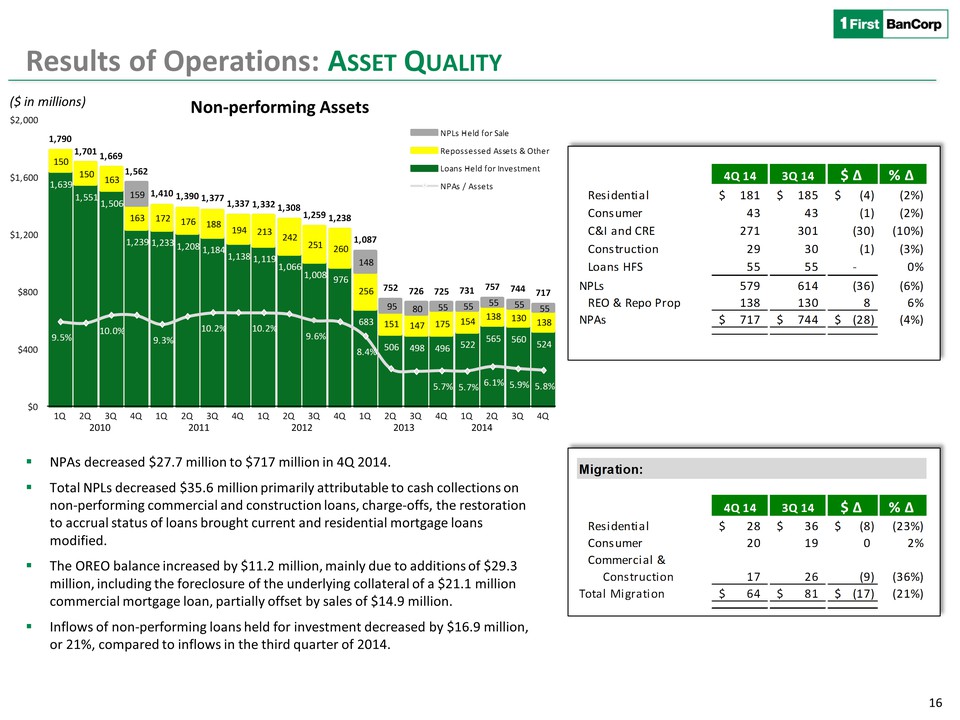
16 2010 2011 2012 2013 Results of Operations: Asset Quality NPAs decreased $27.7 million to $717 million in 4Q 2014. Total NPLs decreased $35.6 million primarily attributable to cash collections on non-performing commercial and construction loans, charge-offs, the restoration to accrual status of loans brought current and residential mortgage loans modified. The OREO balance increased by $11.2 million, mainly due to additions of $29.3 million, including the foreclosure of the underlying collateral of a $21.1 million commercial mortgage loan, partially offset by sales of $14.9 million. Inflows of non-performing loans held for investment decreased by $16.9 million, or 21%, compared to inflows in the third quarter of 2014. ($ in millions) Non-performing Assets 2014
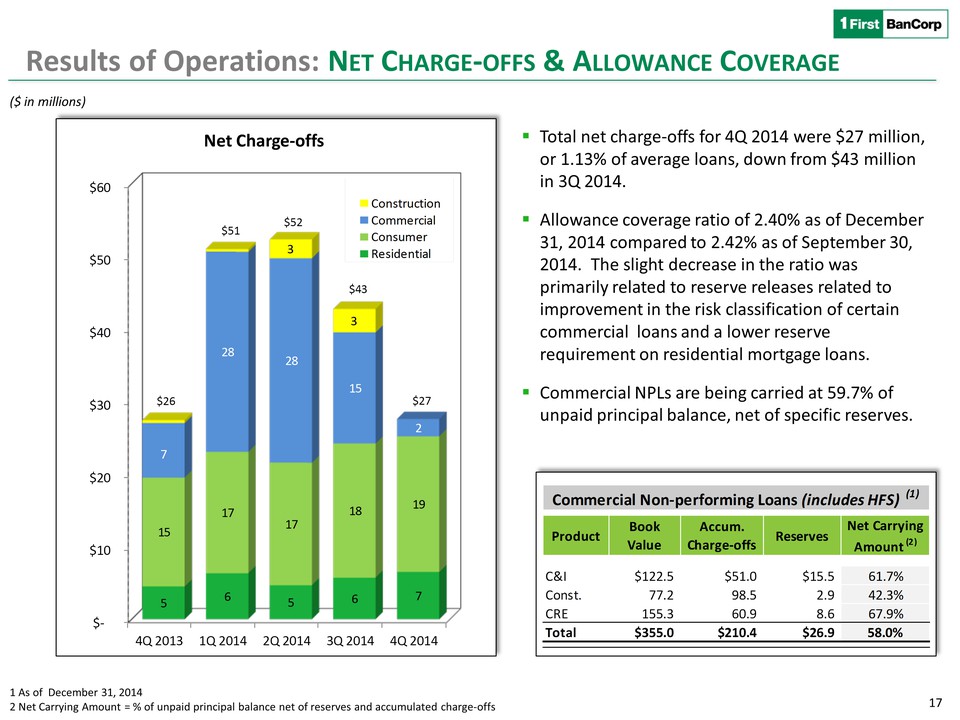
17 Results of Operations: Net Charge-offs & Allowance Coverage ($ in millions) Total net charge-offs for 4Q 2014 were $27 million, or 1.13% of average loans, down from $43 million in 3Q 2014. Allowance coverage ratio of 2.40% as of December 31, 2014 compared to 2.42% as of September 30, 2014. The slight decrease in the ratio was primarily related to reserve releases related to improvement in the risk classification of certain commercial loans and a lower reserve requirement on residential mortgage loans.Commercial NPLs are being carried at 59.7% of unpaid principal balance, net of specific reserves. Net Charge-offs 1 As of December 31, 20142 Net Carrying Amount = % of unpaid principal balance net of reserves and accumulated charge-offs
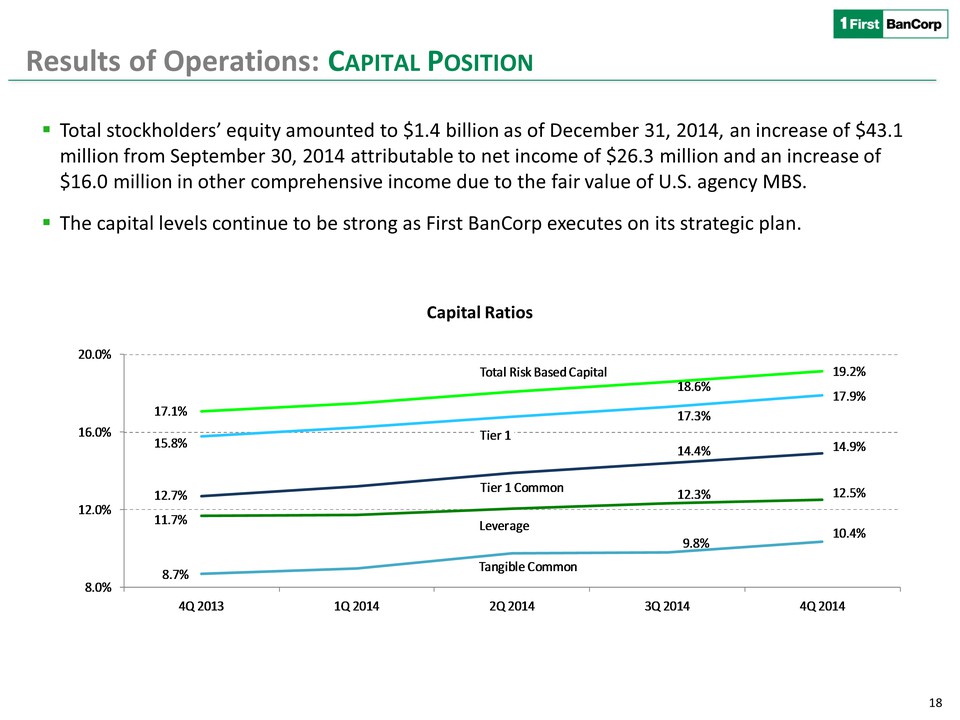
18 Results of Operations: Capital Position Total stockholders’ equity amounted to $1.4 billion as of December 31, 2014, an increase of $43.1 million from September 30, 2014 attributable to net income of $26.3 million and an increase of $16.0 million in other comprehensive income due to the fair value of U.S. agency MBS. The capital levels continue to be strong as First BanCorp executes on its strategic plan. Capital Ratios

19 FOURTH QUARTER & FISCAL YEAR 2014 Q&A

20 EXHIBITS
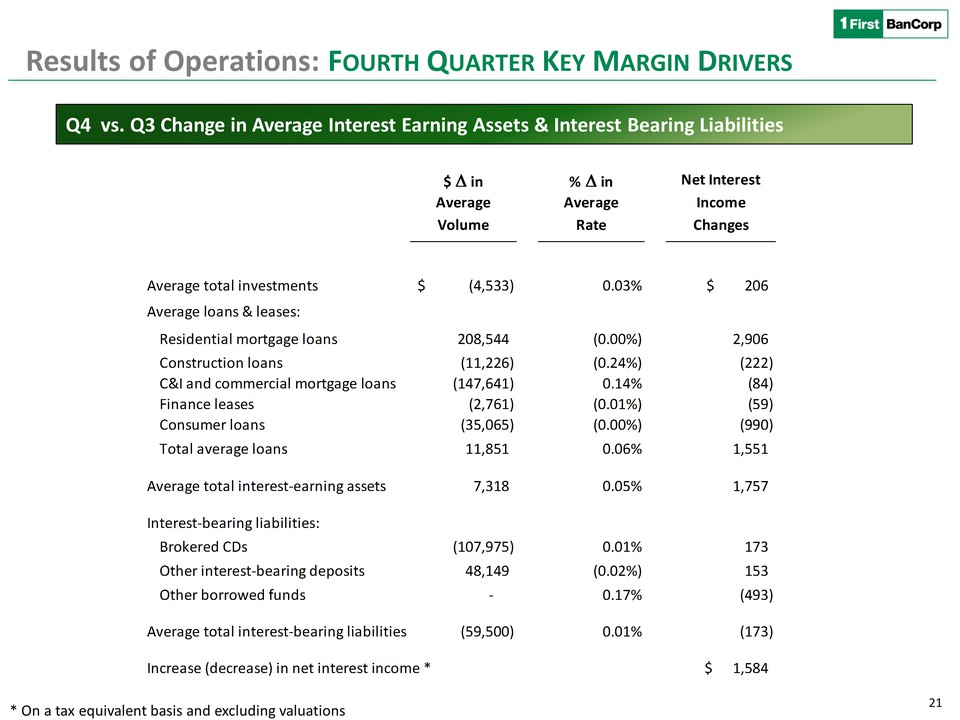
21 Results of Operations: Fourth Quarter Key Margin Drivers Q4 vs. Q3 Change in Average Interest Earning Assets & Interest Bearing Liabilities * On a tax equivalent basis and excluding valuations
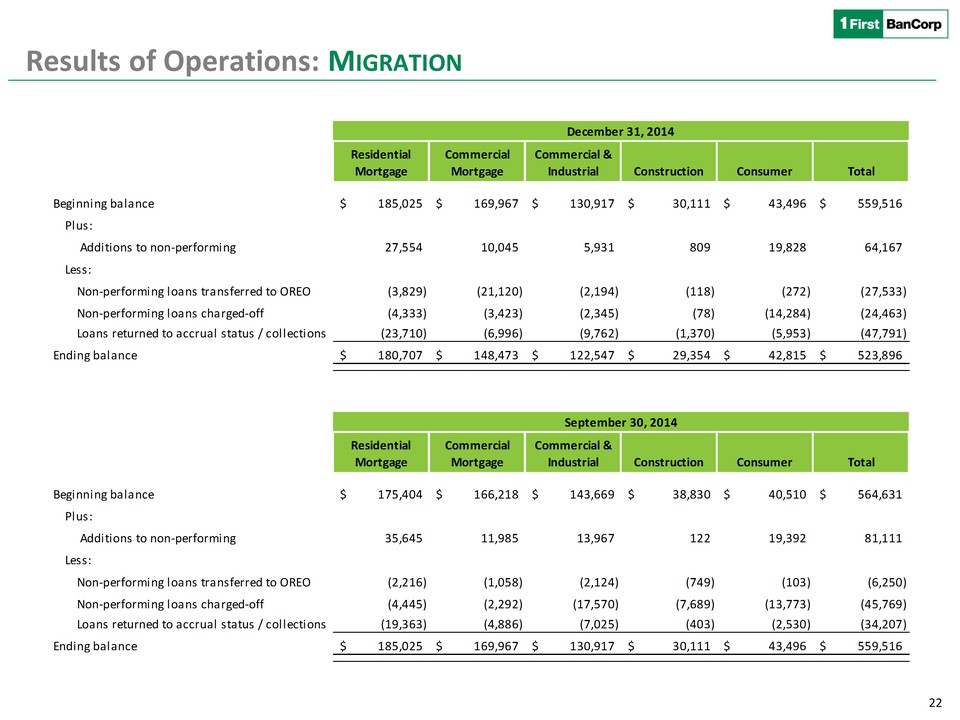
22 Results of Operations: Migration
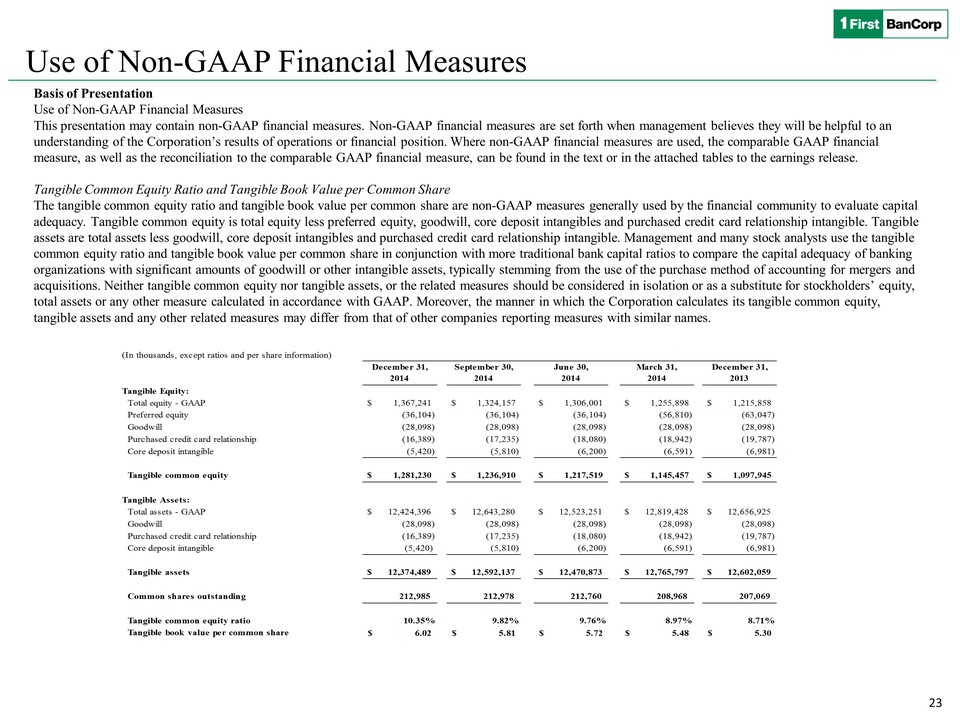
23 Use of Non-GAAP Financial Measures Basis of PresentationUse of Non-GAAP Financial Measures This presentation may contain non-GAAP financial measures. Non-GAAP financial measures are set forth when management believes they will be helpful to an understanding of the Corporation’s results of operations or financial position. Where non-GAAP financial measures are used, the comparable GAAP financial measure, as well as the reconciliation to the comparable GAAP financial measure, can be found in the text or in the attached tables to the earnings release. Tangible Common Equity Ratio and Tangible Book Value per Common Share The tangible common equity ratio and tangible book value per common share are non-GAAP measures generally used by the financial community to evaluate capital adequacy. Tangible common equity is total equity less preferred equity, goodwill, core deposit intangibles and purchased credit card relationship intangible. Tangible assets are total assets less goodwill, core deposit intangibles and purchased credit card relationship intangible. Management and many stock analysts use the tangible common equity ratio and tangible book value per common share in conjunction with more traditional bank capital ratios to compare the capital adequacy of banking organizations with significant amounts of goodwill or other intangible assets, typically stemming from the use of the purchase method of accounting for mergers and acquisitions. Neither tangible common equity nor tangible assets, or the related measures should be considered in isolation or as a substitute for stockholders’ equity, total assets or any other measure calculated in accordance with GAAP. Moreover, the manner in which the Corporation calculates its tangible common equity, tangible assets and any other related measures may differ from that of other companies reporting measures with similar names.
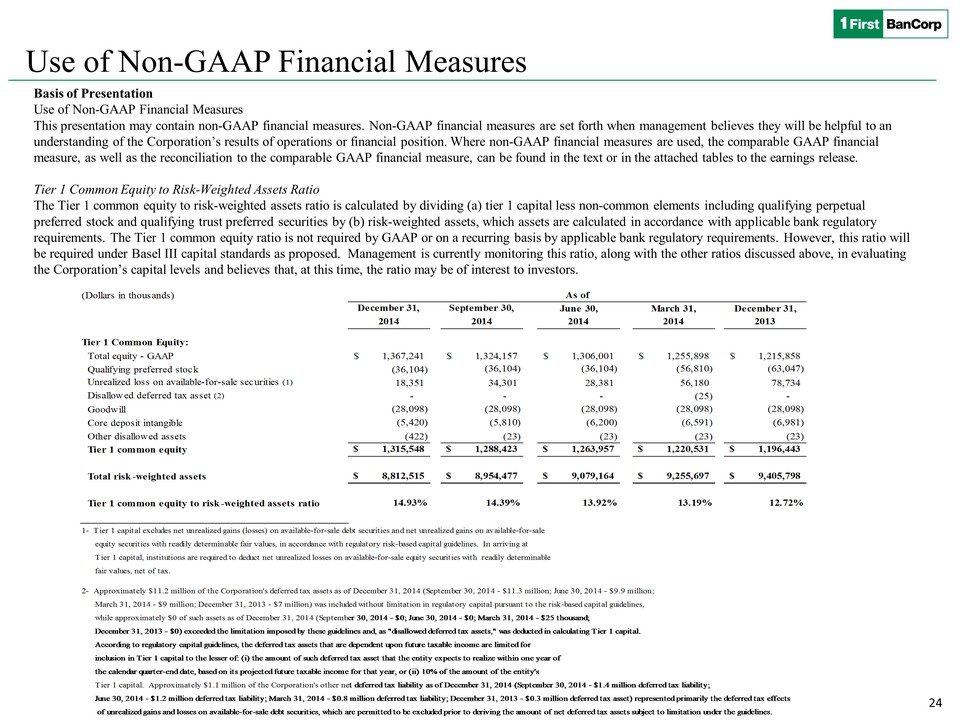
24 Use of Non-GAAP Financial Measures Basis of PresentationUse of Non-GAAP Financial Measures This presentation may contain non-GAAP financial measures. Non-GAAP financial measures are set forth when management believes they will be helpful to an understanding of the Corporation’s results of operations or financial position. Where non-GAAP financial measures are used, the comparable GAAP financial measure, as well as the reconciliation to the comparable GAAP financial measure, can be found in the text or in the attached tables to the earnings release. Tier 1 Common Equity to Risk-Weighted Assets Ratio The Tier 1 common equity to risk-weighted assets ratio is calculated by dividing (a) tier 1 capital less non-common elements including qualifying perpetual preferred stock and qualifying trust preferred securities by (b) risk-weighted assets, which assets are calculated in accordance with applicable bank regulatory requirements. The Tier 1 common equity ratio is not required by GAAP or on a recurring basis by applicable bank regulatory requirements. However, this ratio will be required under Basel III capital standards as proposed. Management is currently monitoring this ratio, along with the other ratios discussed above, in evaluating the Corporation’s capital levels and believes that, at this time, the ratio may be of interest to investors.
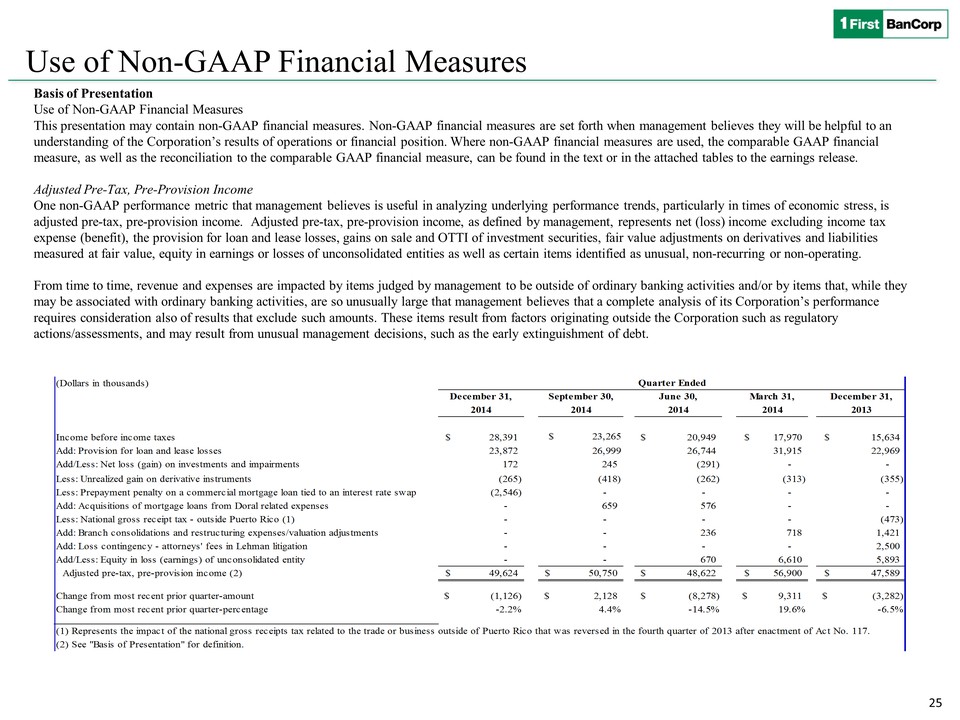
25 Use of Non-GAAP Financial Measures Basis of Presentation Use of Non-GAAP Financial Measures This presentation may contain non-GAAP financial measures. Non-GAAP financial measures are set forth when management believes they will be helpful to an understanding of the Corporation’s results of operations or financial position. Where non-GAAP financial measures are used, the comparable GAAP financial measure, as well as the reconciliation to the comparable GAAP financial measure, can be found in the text or in the attached tables to the earnings release. Adjusted Pre-Tax, Pre-Provision Income One non-GAAP performance metric that management believes is useful in analyzing underlying performance trends, particularly in times of economic stress, is adjusted pre-tax, pre-provision income. Adjusted pre-tax, pre-provision income, as defined by management, represents net (loss) income excluding income tax expense (benefit), the provision for loan and lease losses, gains on sale and OTTI of investment securities, fair value adjustments on derivatives and liabilities measured at fair value, equity in earnings or losses of unconsolidated entities as well as certain items identified as unusual, non-recurring or non-operating. From time to time, revenue and expenses are impacted by items judged by management to be outside of ordinary banking activities and/or by items that, while they may be associated with ordinary banking activities, are so unusually large that management believes that a complete analysis of its Corporation’s performance requires consideration also of results that exclude such amounts. These items result from factors originating outside the Corporation such as regulatory actions/assessments, and may result from unusual management decisions, such as the early extinguishment of debt.