Attached files
| file | filename |
|---|---|
| 8-K - FORM 8-K - ALLIANCE DATA SYSTEMS CORP | form_8k.htm |

©2015 ADS Alliance Data Systems, Inc. Confidential and Proprietary Earnings Release | February 5, 2015 Alliance Data NYSE: ADS 2014 ResultsFebruary 5, 2015 Exhibit 99.1

©2015 ADS Alliance Data Systems, Inc. Confidential and Proprietary Earnings Release | February 5, 2015 Agenda Speakers: Ed Heffernan President and CEO Charles Horn EVP and CFO Fourth Quarter and 2014 Consolidated ResultsSegment Results2014 Wrap-up2015 Guidance 1
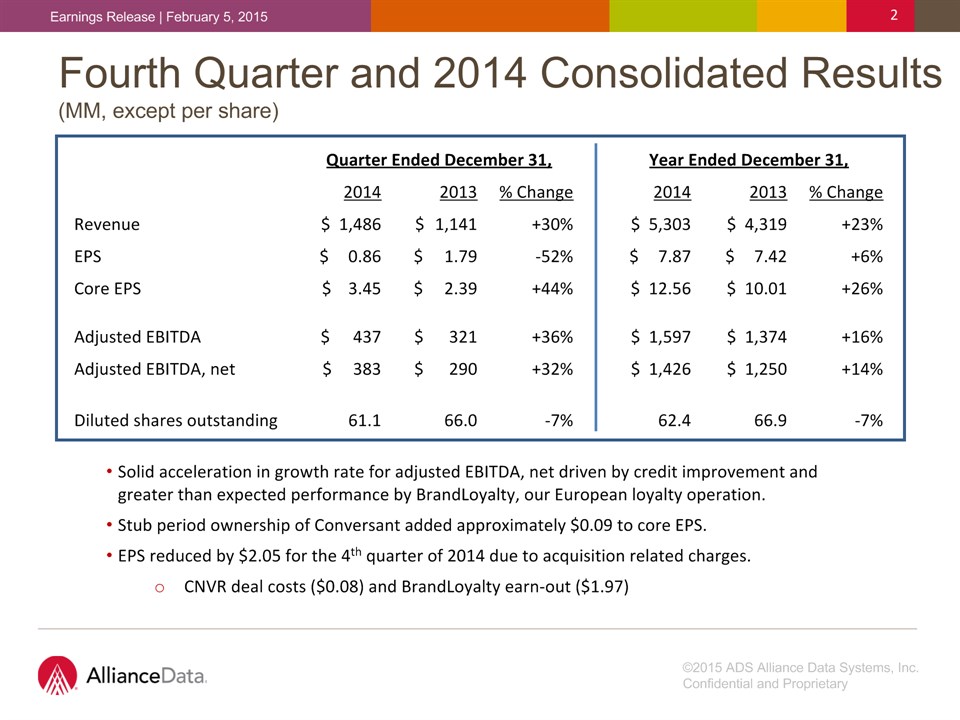
©2015 ADS Alliance Data Systems, Inc. Confidential and Proprietary Earnings Release | February 5, 2015 Fourth Quarter and 2014 Consolidated Results(MM, except per share) Quarter Ended December 31, Quarter Ended December 31, Quarter Ended December 31, Year Ended December 31, Year Ended December 31, Year Ended December 31, 2014 2013 % Change 2014 2013 % Change Revenue $ 1,486 $ 1,141 +30% $ 5,303 $ 4,319 +23% EPS $ 0.86 $ 1.79 -52% $ 7.87 $ 7.42 +6% Core EPS $ 3.45 $ 2.39 +44% $ 12.56 $ 10.01 +26% Adjusted EBITDA $ 437 $ 321 +36% $ 1,597 $ 1,374 +16% Adjusted EBITDA, net $ 383 $ 290 +32% $ 1,426 $ 1,250 +14% Diluted shares outstanding 61.1 66.0 -7% 62.4 66.9 -7% Solid acceleration in growth rate for adjusted EBITDA, net driven by credit improvement and greater than expected performance by BrandLoyalty, our European loyalty operation.Stub period ownership of Conversant added approximately $0.09 to core EPS. EPS reduced by $2.05 for the 4th quarter of 2014 due to acquisition related charges. CNVR deal costs ($0.08) and BrandLoyalty earn-out ($1.97) 2

©2015 ADS Alliance Data Systems, Inc. Confidential and Proprietary Earnings Release | February 5, 2015 LoyaltyOne (MM) Strong 4th quarter performance by BrandLoyalty, which added $47 million of adjusted EBITDA ($28 million net of non-controlling interest). Unfavorable FX rates reduced 4th quarter segment revenue and adjusted EBITDA, net by $16 million and $5 million, respectively.Solid 4th quarter issuance growth of 11 percent in Canada. Looking for more consistency in 2015. Quarter Ended December 31, Quarter Ended December 31, Quarter Ended December 31, Year Ended December 31, Year Ended December 31, Year Ended December 31, 2014 2013 % Change 2014 2013 % Change Revenue $ 398 $ 245 +62% $ 1,407 $ 919 +53% Adjusted EBITDA $ 115 $ 68 +69% $ 351 $ 259 +36% Non-controlling interest -19 0 -43 0 Adjusted EBITDA, net $ 96 $ 68 +41% $ 308 $ 259 +19% Adjusted EBITDA % 29% 28% +1% 25% 28% -3% Key Metrics: AIR MILES® reward miles issued 1,821 1,636 +11% 5,501 5,421 +1% AIR MILES reward miles redeemed 1,013 1,092 -7% 4,101 4,017 +2% Average CDN FX rate 0.88 0.95 -8% 0.91 0.97 -7% 3
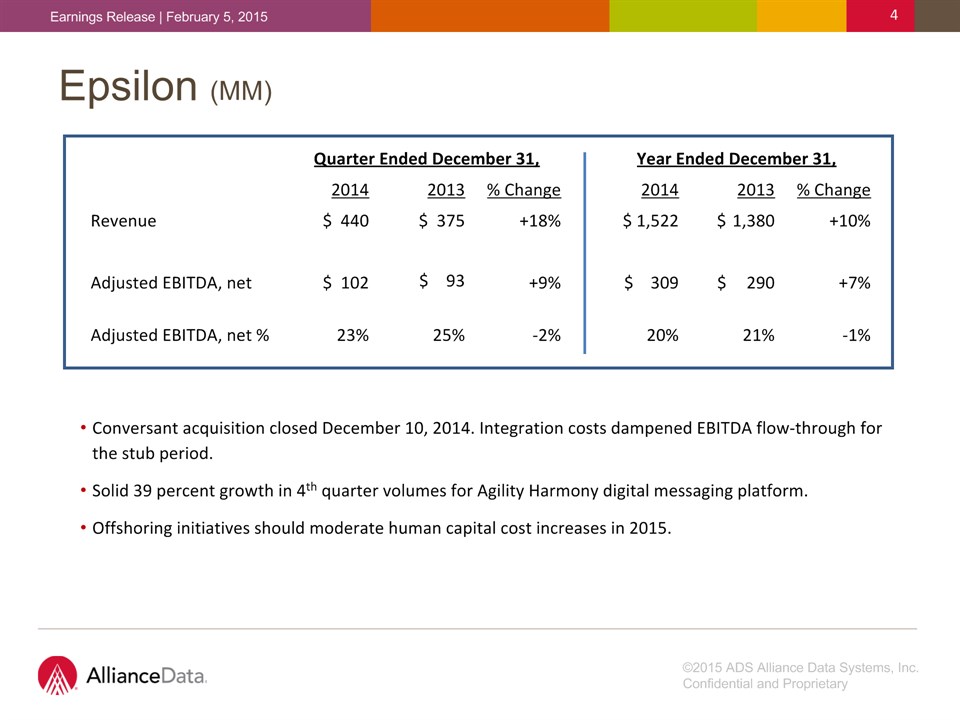
©2015 ADS Alliance Data Systems, Inc. Confidential and Proprietary Earnings Release | February 5, 2015 Epsilon (MM) Conversant acquisition closed December 10, 2014. Integration costs dampened EBITDA flow-through for the stub period. Solid 39 percent growth in 4th quarter volumes for Agility Harmony digital messaging platform. Offshoring initiatives should moderate human capital cost increases in 2015. Quarter Ended December 31, Quarter Ended December 31, Quarter Ended December 31, Year Ended December 31, Year Ended December 31, Year Ended December 31, 2014 2013 % Change 2014 2013 % Change Revenue $ 440 $ 375 +18% $ 1,522 $ 1,380 +10% Adjusted EBITDA, net $ 102 $ 93 +9% $ 309 $ 290 +7% Adjusted EBITDA, net % 23% 25% -2% 20% 21% -1% 4
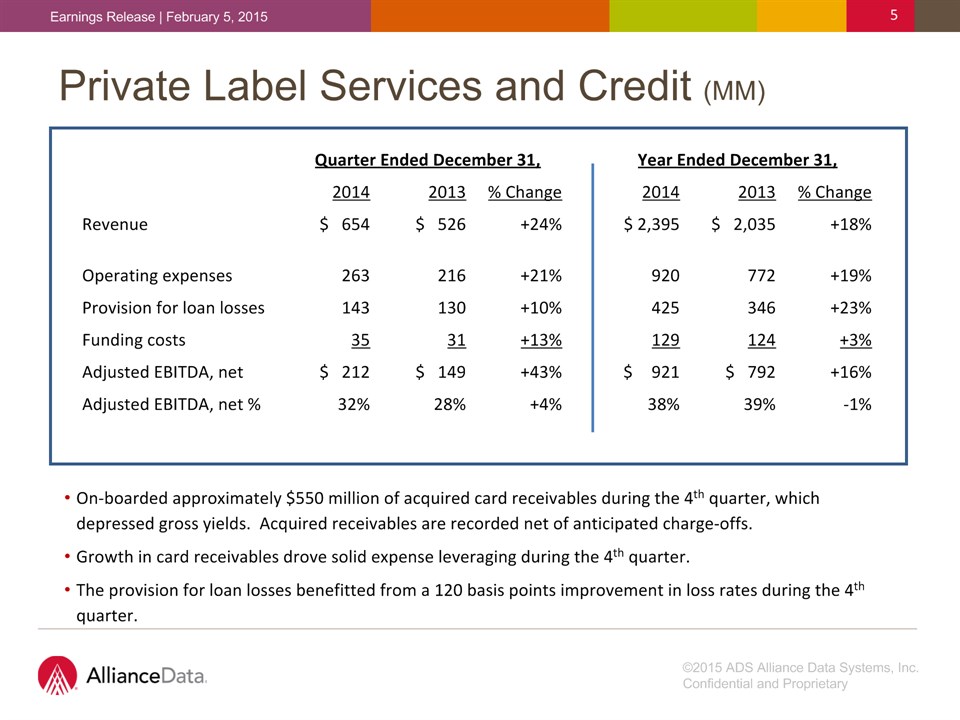
©2015 ADS Alliance Data Systems, Inc. Confidential and Proprietary Earnings Release | February 5, 2015 Private Label Services and Credit (MM) On-boarded approximately $550 million of acquired card receivables during the 4th quarter, which depressed gross yields. Acquired receivables are recorded net of anticipated charge-offs. Growth in card receivables drove solid expense leveraging during the 4th quarter. The provision for loan losses benefitted from a 120 basis points improvement in loss rates during the 4th quarter. Quarter Ended December 31, Quarter Ended December 31, Quarter Ended December 31, Year Ended December 31, Year Ended December 31, Year Ended December 31, 2014 2013 % Change 2014 2013 % Change Revenue $ 654 $ 526 +24% $ 2,395 $ 2,035 +18% Operating expenses 263 216 +21% 920 772 +19% Provision for loan losses 143 130 +10% 425 346 +23% Funding costs 35 31 +13% 129 124 +3% Adjusted EBITDA, net $ 212 $ 149 +43% $ 921 $ 792 +16% Adjusted EBITDA, net % 32% 28% +4% 38% 39% -1% 5

©2015 ADS Alliance Data Systems, Inc. Confidential and Proprietary Earnings Release | February 5, 2015 Private Label Services and Credit (MM) Active cardholder base grew 10 percent to 35 million, while average balances increased 8 percent to ~$500 in 2014.Over 25 percent of credit sales now come from digital channels.Solid tender share pick-up of approximately 150 basis points in 2014Ending reserve of 5.4 percent of reservable receivables at December 31, 2014, a spread of approximately 100 basis points to the LTM loss rate. Quarter Ended December 31, Quarter Ended December 31, Quarter Ended December 31, Year Ended December 31, Year Ended December 31, Year Ended December 31, Key metrics: 2014 2013 Change 2014 2013 Change Credit sales $ 6,357 $ 4,836 +31% $ 18,948 $ 15,252 +24% Average credit card receivables $ 10,071 $ 7,767 +30% $ 8,750 $ 7,213 +21% Total gross yield 26.0% 27.1% -1.1% 27.4% 28.2% -0.8% Normalized loss rates 4.1% 5.3% -1.2% 4.4% 4.8% -0.4% Delinquency rate 4.0% 4.2% -0.2% 4.0% 4.2% -0.2% 6
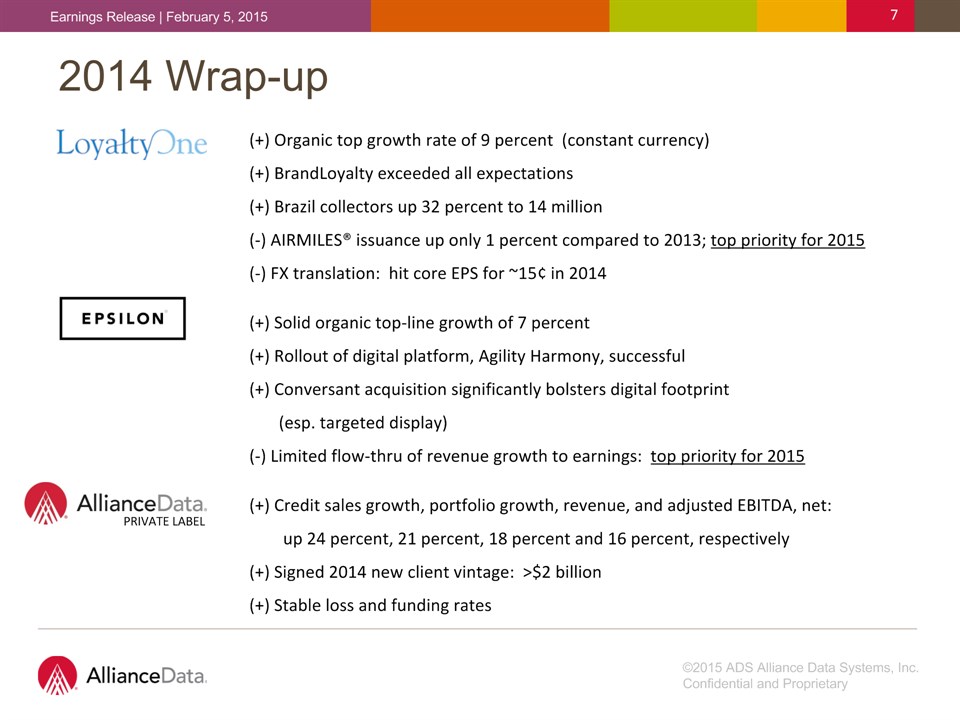
©2015 ADS Alliance Data Systems, Inc. Confidential and Proprietary Earnings Release | February 5, 2015 2014 Wrap-up (+) Organic top growth rate of 9 percent (constant currency)(+) BrandLoyalty exceeded all expectations(+) Brazil collectors up 32 percent to 14 million(-) AIRMILES® issuance up only 1 percent compared to 2013; top priority for 2015(-) FX translation: hit core EPS for ~15¢ in 2014(+) Solid organic top-line growth of 7 percent(+) Rollout of digital platform, Agility Harmony, successful(+) Conversant acquisition significantly bolsters digital footprint (esp. targeted display)(-) Limited flow-thru of revenue growth to earnings: top priority for 2015(+) Credit sales growth, portfolio growth, revenue, and adjusted EBITDA, net: up 24 percent, 21 percent, 18 percent and 16 percent, respectively(+) Signed 2014 new client vintage: >$2 billion(+) Stable loss and funding rates PRIVATE LABEL 7

©2015 ADS Alliance Data Systems, Inc. Confidential and Proprietary Earnings Release | February 5, 2015 2014 Wrap-up (+) $1 billion or +23 percent in top-line growth(+) Robust organic top- line growth of +11 percent or 4 times that of the market and GDP growth rates (+) Strong flow-thru to earnings (+26 percent)(+) Modest net debt levels (leverage ratio ~ 2x)(+) Good visibility into 2015(+) Solid beat to original core EPS guidance Overall Organic LoyaltyOne +9% Pro-forma for BrandLoyalty’s 2013 results Epsilon +7% Excludes Conversant stub period ownership Private Label +15% Excludes acquired card receivables +11% 8 Original 2014 guidance $12.20 +22% + FX hit 0.15 - CNVR stub period (0.09) + Over-performance 0.30 Final 2014 results $12.56 +26%

©2015 ADS Alliance Data Systems, Inc. Confidential and Proprietary Earnings Release | February 5, 2015 2015 Guidance($MM, except per share) 9 2014 2015 % Increase Actual Guidance Revenue $ 5,303 $ 6,5001 +23% Core EPS $ 12.56 $ 14.801 +18% Diluted shares outstanding 62.4 64 – 64.7 Q1 ‘15 Revenue (before FX) $ 1,606 +30% FX (65) Revenue $ 1,541 +25% Q1 ‘15 Core EPS(before FX) $ 3.52 +26% FX (0.12) Core EPS $ 3.40 +22% 1 Original revenue guidance was $6.625 billion or 25 percent growth. Original core EPS guidance was a range of $14.80 to $15.00. The decrease in revenue and elimination of range for core EPS are due to changes in foreign currency translation rates since the date of that guidance.

©2015 ADS Alliance Data Systems, Inc. Confidential and Proprietary Earnings Release | February 5, 2015 10 Revenue by Segment Diversification and balanceacross multiple platforms:Attracts the widest variety of verticals Enhances financial visibilityBusinesses/Platforms cycle differently 2015E Revenues - $6.5bn Financial Services | Retail | Travel Insurance | Telecom | CPG | Grocery Auto | Technology | Healthcare | B2B 44% 33% 23%

©2015 ADS Alliance Data Systems, Inc. Confidential and Proprietary Earnings Release | February 5, 2015 11 All Businesses Are Growing PRIVATE LABEL Pro-forma for BrandLoyaltyConstant Currency Pro-forma for Conversant US$ Billions US$ Billions US$ Billions INTERNATIONAL LOYALTY CARD SERVICES 10% CAGR 7% CAGR 20% CAGR

©2015 ADS Alliance Data Systems, Inc. Confidential and Proprietary Earnings Release | February 5, 2015 Q & A

©2015 ADS Alliance Data Systems, Inc. Confidential and Proprietary Earnings Release | February 5, 2015 Safe Harbor Statement and Forward Looking Statements This presentation may contain forward-looking statements within the meaning of Section 27A of the Securities Act of 1933, as amended, and Section 21E of the Securities Exchange Act of 1934, as amended. Such statements may use words such as “anticipate,” “believe,” “continue,” “could,” “estimate,” “expect,” “intend,” “may,” “predict,” “project,” “would” and similar expressions as they relate to us or our management. When we make forward-looking statements, we are basing them on our management’s beliefs and assumptions, using information currently available to us. Although we believe that the expectations reflected in the forward-looking statements are reasonable, these forward-looking statements are subject to risks, uncertainties and assumptions, including those discussed in our filings with the Securities and Exchange Commission. If one or more of these or other risks or uncertainties materialize, or if our underlying assumptions prove to be incorrect, actual results may vary materially from what we projected. Any forward-looking statements contained in this presentation reflect our current views with respect to future events and are subject to these and other risks, uncertainties and assumptions relating to our operations, results of operations, growth strategy and liquidity. We have no intention, and disclaim any obligation, to update or revise any forward-looking statements, whether as a result of new information, future results or otherwise, except as required by law. “Safe Harbor” Statement under the Private Securities Litigation Reform Act of 1995: Statements in this presentation regarding Alliance Data Systems Corporation’s business which are not historical facts are “forward-looking statements” that involve risks and uncertainties. For a discussion of such risks and uncertainties, which could cause actual results to differ from those contained in the forward-looking statements, see “Risk Factors” in the Company’s Annual Report on Form 10-K for the most recently ended fiscal year. Risk factors may be updated in Item 1A in each of the Company’s Quarterly Reports on Form 10-Q for each quarterly period subsequent to the Company’s most recent Form 10-K.

©2015 ADS Alliance Data Systems, Inc. Confidential and Proprietary Earnings Release | February 5, 2015 Financial Measures In addition to the results presented in accordance with generally accepted accounting principles, or GAAP, the Company may present financial measures that are non-GAAP measures, such as constant currency financial measures, adjusted EBITDA, adjusted EBITDA margin, adjusted EBITDA, net of funding costs and non-controlling interest, core earnings and core earnings per diluted share (core EPS). The Company believes that these non-GAAP financial measures, viewed in addition to and not in lieu of the Company’s reported GAAP results, provide useful information to investors regarding the Company’s performance and overall results of operations. These metrics are an integral part of the Company’s internal reporting to measure the performance of reportable segments and the overall effectiveness of senior management. Reconciliations to comparable GAAP financial measures are available in the accompanying schedules and on the Company’s website. The financial measures presented are consistent with the Company’s historical financial reporting practices. Core earnings and core earnings per diluted share represent performance measures and are not intended to represent liquidity measures. The non-GAAP financial measures presented herein may not be comparable to similarly titled measures presented by other companies, and are not identical to corresponding measures used in other various agreements or public filings.