Attached files
| file | filename |
|---|---|
| 8-K - GENERAL CABLE CORPORATION 8-K - GENERAL CABLE CORP /DE/ | a51033380.htm |
| EX-99.1 - EXHIBIT 99.1 - GENERAL CABLE CORP /DE/ | a51033380_ex991.htm |
Exhibit 99.2
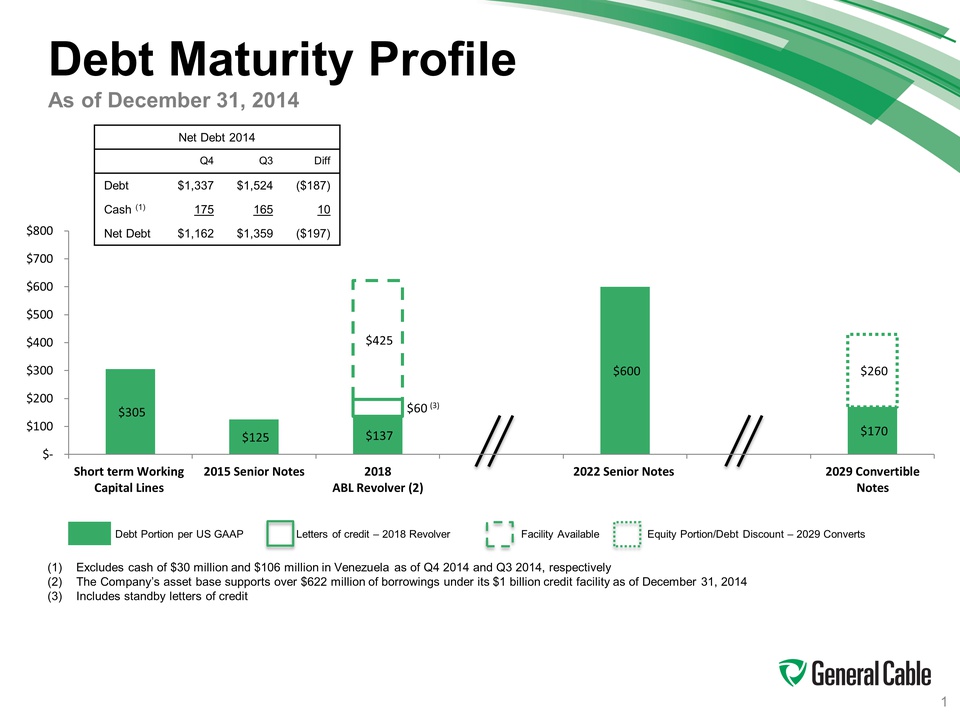
Debt Maturity Profile As of December 31, 2014 Net Debt 2014 Q4 Q3 Diff Debt $1,337 $1,524 ($187) Cash (1) 175 165 10 Net Debt $1,162 $1,359 ($197) Short term Working Capital Lines 2015 Senior Notes 2018 ABL Revolver (2) 2022 Senior Notes 2029 Convertible Notes Debt Portion per US GAAP Letters of credit – 2018 Revolver Facility Available Equity Portion/Debt Discount – 2029 Converts (1) Excludes cash of $30 million and $106 million in Venezuela as of Q4 2014 and Q3 2014, respectively (2) The Company’s asset base supports over $622 million of borrowings under its $1 billion credit facility as of December 31, 2014 (3) Includes standby letters of credit 1
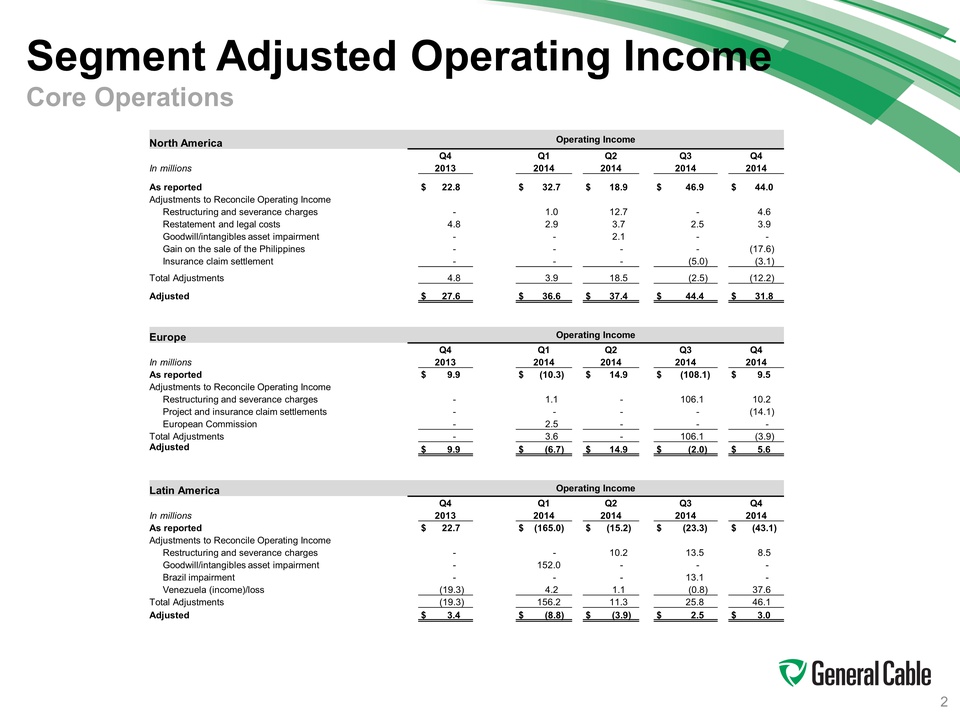
Segment Adjusted Operating Income Core Operations North America Operating Income Q4 Q1 Q2 Q3 Q4 In millions 2013 2014 2014 2014 2014 As reported $ 22.8 $ 32.7 $ 18.9 $ 46.9 $ 44.0 Adjustments to Reconcile Operating Income Restructuring and severance charges - 1.0 12.7 - 4.6 Restatement and legal costs 4.8 2.9 3.7 2.5 3.9 Goodwill/intangibles asset impairment - - 2.1 - - Gain on the sale of the Philippines - - - - (17.6) Insurance claim settlement - - - (5.0) (3.1) Total Adjustments 4.8 3.9 18.5 (2.5) (12.2) Adjusted $ 27.6 $ 36.6 $ 37.4 $ 44.4 $ 31.8 Europe Operating Income Q4 Q1 Q2 Q3 Q4 In millions 2013 2014 2014 2014 2014 As reported $ 9.9 $ (10.3) $ 14.9 $ (108.1) $ 9.5 Adjustments to Reconcile Operating Income Restructuring and severance charges - 1.1 - 106.1 10.2 Project and insurance claim settlements - - - - (14.1) European Commission - 2.5 - - - Total Adjustments - 3.6 - 106.1 (3.9) Adjusted $ 9.9 $ (6.7) $ 14.9 $ (2.0) $ 5.6 Latin America Operating Income Q4 Q1 Q2 Q3 Q4 In millions 2013 2014 2014 2014 2014 As reported $ 22.7 $ (165.0) $ (15.2) $ (23.3) $ (43.1) Adjustments to Reconcile Operating Income Restructuring and severance charges - - 10.2 13.5 8.5 Goodwill/intangibles asset impairment - 152.0 - - - Brazil impairment - - - 13.1 - Venezuela (income)/loss (19.3) 4.2 1.1 (0.8) 37.6 Total Adjustments (19.3) 156.2 11.3 25.8 46.1 Adjusted $ 3.4 $ (8.8) $ (3.9) $ 2.5 $ 3.0 2
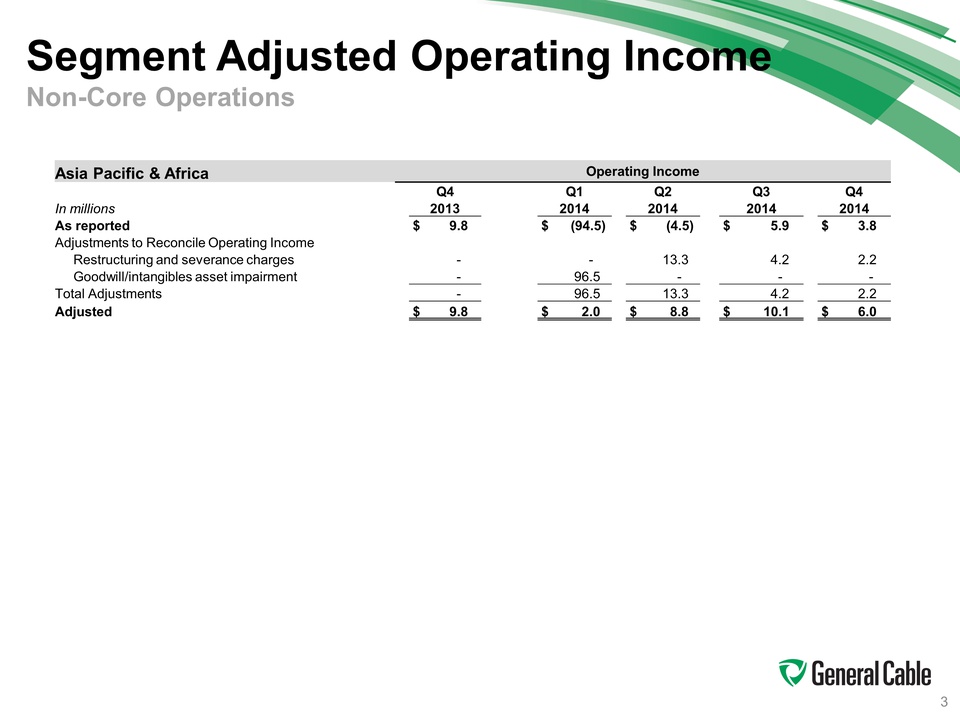
Segment Adjusted Operating Income Non-Core Operations Asia Pacific & Africa Operating Income Q4 Q1 Q2 Q3 Q4 In millions 2013 2014 2014 2014 2014 As reported $ 9.8 $ (94.5) $ (4.5) $ 5.9 $ 3.8 Adjustments to Reconcile Operating Income Restructuring and severance charges - - 13.3 4.2 2.2 Goodwill/intangibles asset impairment - 96.5 - - - Total Adjustments - 96.5 13.3 4.2 2.2 Adjusted $ 9.8 $ 2.0 $ 8.8 $ 10.1 $ 6.0 3
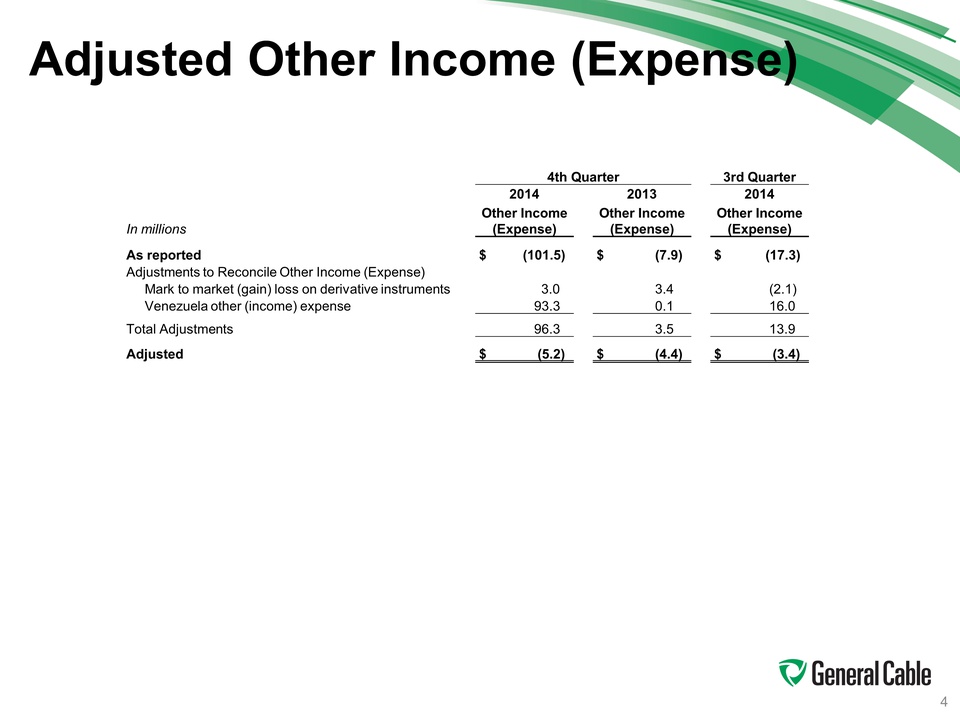
Adjusted Other Income (Expense) 4th Quarter 3rd Quarter 2014 2013 2014 In millions Other Income (Expense) Other Income (Expense) Other Income (Expense) As reported $ (101.5) $ (7.9) $ (17.3) Adjustments to Reconcile Other Income (Expense) Mark to market (gain) loss on derivative instruments 3.0 3.4 (2.1) Venezuela other (income) expense 93.3 0.1 16.0 Total Adjustments 96.3 3.5 13.9 Adjusted $ (5.2) $ (4.4) $ (3.4) 4
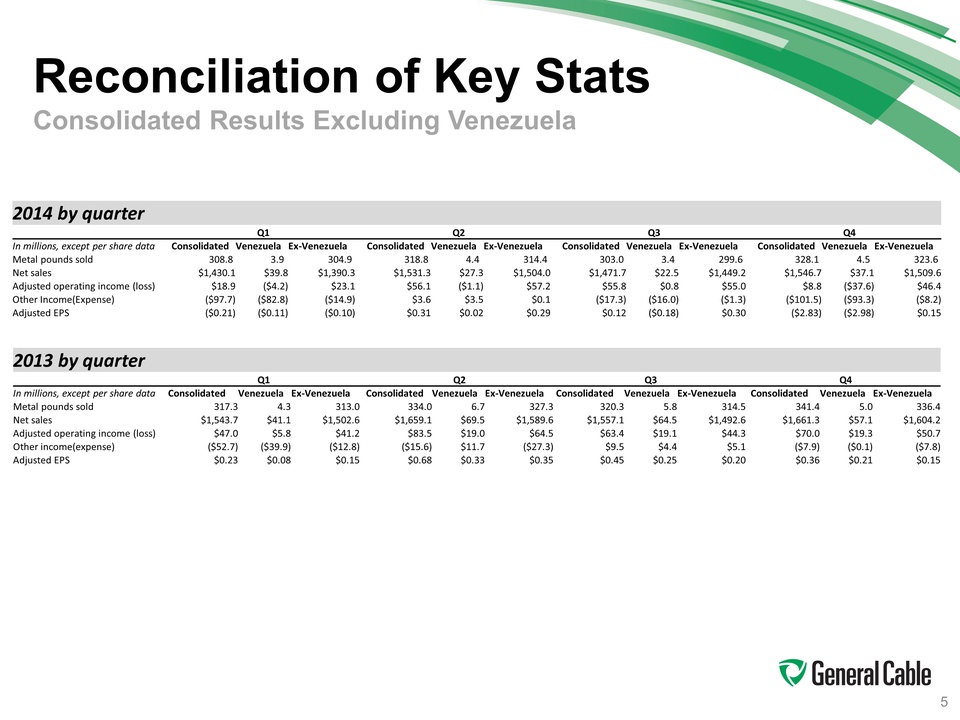
Reconciliation of Key Stats Consolidated Results Excluding Venezuela 2014 by quarter Q1 Q2 Q3 Q4 In millions, except per share data Consolidated Venezuela Ex‐Venezuela Consolidated Venezuela Ex‐Venezuela Consolidated Venezuela Ex‐Venezuela Consolidated Venezuela Ex‐Venezuela Metal pounds sold 308.8 3.9 304.9 318.8 4.4 314.4 303.0 3.4 299.6 328.1 4.5 323.6 Net sales $1,430.1 $39.8 $1,390.3 $1,531.3 $27.3 $1,504.0 $1,471.7 $22.5 $1,449.2 $1,546.7 $37.1 $1,509.6 Adjusted operating income (loss) $18.9 ($4.2) $23.1 $56.1 ($1.1) $57.2 $55.8 $0.8 $55.0 $8.8 ($37.6) $46.4 Other Income(Expense) ($97.7) ($82.8) ($14.9) $3.6 $3.5 $0.1 ($17.3) ($16.0) ($1.3) ($101.5) ($93.3) ($8.2) Adjusted EPS ($0.21) ($0.11) ($0.10) $0.31 $0.02 $0.29 $0.12 ($0.18) $0.30 ($2.83) ($2.98) $0.15 2013 by quarter Q1 Q2 Q3 Q4 In millions, except per share data Consolidated Venezuela Ex‐Venezuela Consolidated Venezuela Ex‐Venezuela Consolidated Venezuela Ex‐Venezuela Consolidated Venezuela Ex‐Venezuela Metal pounds sold 317.3 4.3 313.0 334.0 6.7 327.3 320.3 5.8 314.5 341.4 5.0 336.4 Net sales $1,543.7 $41.1 $1,502.6 $1,659.1 $69.5 $1,589.6 $1,557.1 $64.5 $1,492.6 $1,661.3 $57.1 $1,604.2 Adjusted operating income (loss) $47.0 $5.8 $41.2 $83.5 $19.0 $64.5 $63.4 $19.1 $44.3 $70.0 $19.3 $50.7 Other income(expense) ($52.7) ($39.9) ($12.8) ($15.6) $11.7 ($27.3) $9.5 $4.4 $5.1 ($7.9) ($0.1) ($7.8) Adjusted EPS $0.23 $0.08 $0.15 $0.68 $0.33 $0.35 $0.45 $0.25 $0.20 $0.36 $0.21 $0.15 5
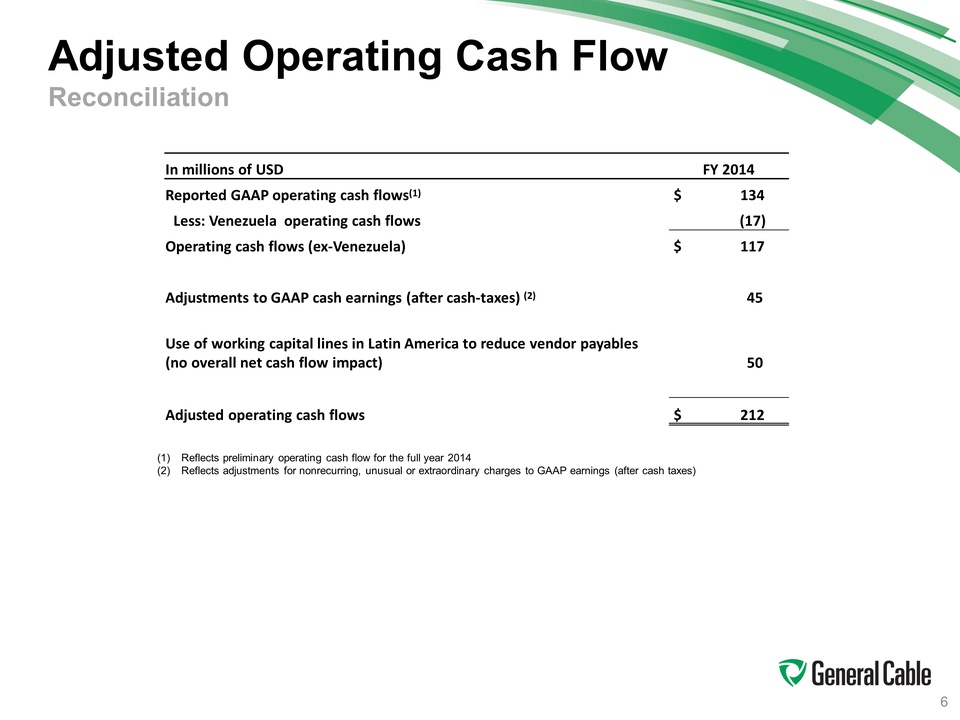
Adjusted Operating Cash Flow Reconciliation In millions of USD FY 2014 Reported GAAP operating cash flows(1) $ 134 Less: Venezuela operating cash flows (17) Operating cash flows (ex‐Venezuela) $ 117 Adjustments to GAAP cash earnings (after cash‐taxes) (2) 45 Use of working capital lines in Latin America to reduce vendor payables (no overall net cash flow impact) 50 Adjusted operating cash flows $ 212 (1) Reflects preliminary operating cash flow for the full year 2014 (2) Reflects adjustments for nonrecurring, unusual or extraordinary charges to GAAP earnings (after cash taxes) 6