Attached files
| file | filename |
|---|---|
| 8-K - 8-K - PACWEST BANCORP | a15-3431_18k.htm |
Exhibit 99.1
|
|
FIG PARTNERS 6TH ANNUAL WEST COAST BANK CEO FORUM SAN FRANCISCO, CA February 4 - 5, 2015 |
|
|
This communication contains certain “forward-looking statements” about the Company and its subsidiaries within the meaning of the Private Securities Litigation Reform Act of 1995, including certain plans, strategies, goals, and projections and including statements about our expectations regarding our profitability and credit trends. All statements contained in this communication that are not clearly historical in nature are forward-looking, and the words “anticipate,” “assume,” “intend,” “believe,” “forecast,” “expect,” “estimate,” “plan,” “continue,” “will,” “should,” “look forward” and similar expressions are generally intended to identify forward-looking statements. All forward-looking statements (including statements regarding future financial and operating results and future transactions and their results) involve risks, uncertainties and contingencies, many of which are beyond our control, which may cause actual results, performance, or achievements to differ materially from anticipated results, performance or achievements. Actual results could differ materially from those contained or implied by such forward-looking statements for a variety of factors, including without limitation: changes in economic or competitive market conditions could negatively impact investment or lending opportunities or product pricing and services; deteriorations in credit and other markets; higher than anticipated loan losses; credit quality deterioration or pronounced and sustained reduction in market values or other economic factors which adversely effect our borrowers’ ability to repay loans and leases; continued or worsening credit losses or charge-offs; higher than anticipated delinquencies and reserves; asset/liability repricing risks and liquidity risks reduces interest margins and the value of investments; higher than anticipated increases in operating expenses; increased costs to manage and sell foreclosed assets; reduced demand for our services due to strategic or regulatory reasons; legislative or regulatory requirements or changes adversely affected the Company’s business, including an increase to capital requirements; the Company’s ability to obtain regulatory approvals, complete future acquisitions, and successfully integrate acquired entities or achieve expected benefits, synergies, and/or operating efficiencies within expected time frames or at all; difficulties and delays in integrating the Company and CapitalSource businesses or fully realizing cost savings and other benefits; business disruption following the CapitalSource merger; and other risk factors described in documents filed by PacWest with the U.S. Securities and Exchange Commission (“SEC”). All forward-looking statements included in this communication are based on information available at the time of the communication. We are under no obligation to (and expressly disclaim any such obligation to) update or alter our forward-looking statements, whether as a result of new information, future events or otherwise except as required by law. Forward-Looking Statements |
|
|
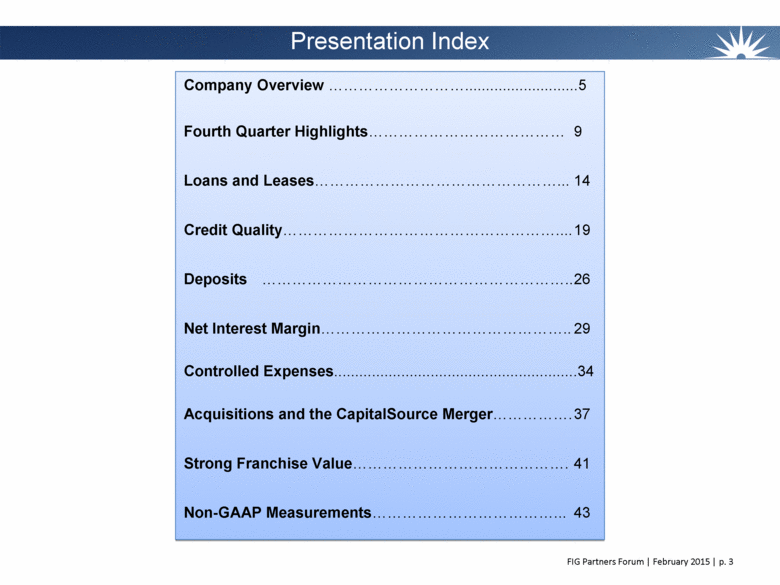
Presentation Index Company Overview 5 Fourth Quarter Highlights 9 Loans and Leases 14 Credit Quality 19 Deposits 26 Net Interest Margin 29 Controlled Expenses34 Acquisitions and the CapitalSource Merger. 37 Strong Franchise Value. 41 Non-GAAP Measurements 43 |
|
|
Company Overview |
|
|
Company Overview and Highlights Company Overview Commercial bank focused on community banking in the deposit rich Southern California market paired with a national lending platform NASDAQ traded (PACW) with a market capitalization of $4.4 billion (1) Average trading volume of 830,300 shares per day over the last year (1) Dividend: $2.00 per share, 4.60% yield (1) (2) 6th largest publicly-traded bank headquartered in California with total assets of $16.2 billion, loans and leases of $11.9 billion and deposits of $11.8 billion Profitable Growth 4Q net income, adjusted for acquisition, integration, reorganization and severance costs and certain other items, of $68.2 million, or 1.70% ROAA and 15.37% ROATE Industry leading NIM of 5.86% for 4Q14 $6.1 billion of core deposits with total cost of deposits of 34 basis points New loans and leases since 4/7/14 (CapitalSource merger date) of $2.8 billion Net loan and lease growth since 4/7/14 of $840 million, or 10.4% annualized Core deposit growth since 4/7/14 of $0.7 billion Strong credit discipline: NPAs at 1.28% of total loans and leases and foreclosed assets Adjusted efficiency ratio of 42.3% for 4Q14 Experienced acquirer with 27 bank and finance company acquisitions, including 3 FDIC-assisted transactions Analyst coverage: D.A. Davidson & Co., FIG Partners, Friedman Billings Ramsey, Keefe, Bruyette & Woods, RBC Capital Markets, Sandler O’Neill & Partners, Sterne Agee, Wunderlich Securities (1) As of January 30, 2015 (2) Regular quarterly dividend increased to $0.50 per share 11/5/14 FIG Partners Forum February 2015 p. 5 |
|
|
Company Overview and Highlights Business Model Community Banking Attractive branch network with 80 full service branches 77 in Southern California 3 in San Francisco Bay area Offers a full suite of deposit and business lending products Limited consumer lending offerings Strong focus on cross selling Borrower relationships generally include a deposit account Total cost of deposits at 34 bps for 4Q14 Efficient deposit model with average branch size of $147 million at 4Q14 Loan production of $122 million in 4Q14 at 5.09% yield National Lending Diversified by loan type, geography and industry Asset Based Lending Equipment and Lender Finance Cash Flow Lending Technology, Healthcare and Security Commercial Real Estate General, Multifamily, Healthcare and SBA Focus on middle to small market businesses Expertise in niche segments limits new competitors Loan and lease production of $828 million in 4Q14 at 5.76% yield FIG Partners Forum February 2015 p. 6 |
|
|
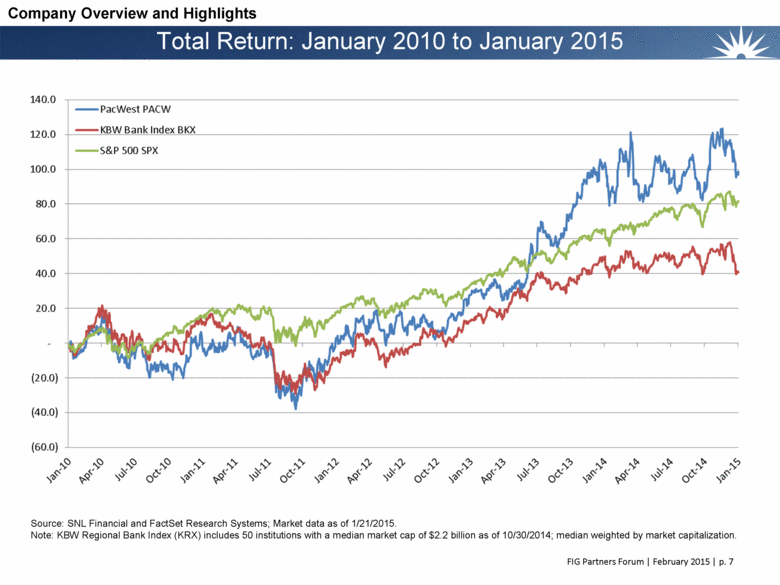
Total Return: January 2010 to January 2015 Company Overview and Highlights Source: SNL Financial and FactSet Research Systems; Market data as of 1/21/2015. Note: KBW Regional Bank Index (KRX) includes 50 institutions with a median market cap of $2.2 billion as of 10/30/2014; median weighted by market capitalization. |
|
|
Fourth Quarter Highlights |
|
|
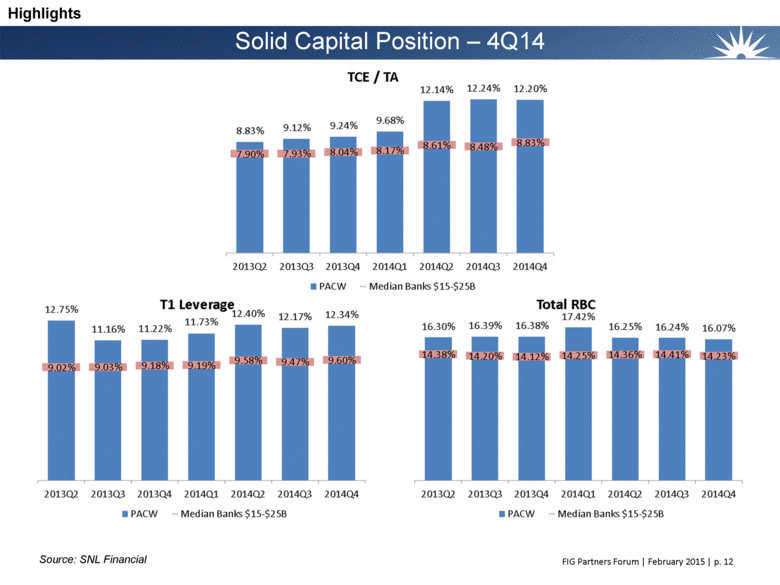
Highlights Fourth Quarter Highlights Robust Core Adjusted net income of $68.2 million Adjusted EPS of $0.66 Earnings Adjusted ROAA and ROATE of 1.70% and 15.37% Industry Leading Net interest margin: 5.86% Core net interest margin: 5.52% Net Interest Margin Low Efficiency Adjusted efficiency ratio of 42.3% Average branch size of $147 million Ratio Operating expense to average assets of 2.00% Total cost of deposits: 34 bps Low Cost Deposit $129 million organic core deposit growth Base Core deposit growth includes $72 million from CapitalSource Division borrowers ($265 million since the acquisition date) Loan and lease production of $950 million Loan and Lease Organic loan and lease growth of $308 million, or 10.6% annualized Production and NPA ratio, excluding PCI loans, of 1.09% versus 1.15% in prior quarter Solid Credit Non-PCI credit loss allowance of 0.66% and adjusted credit loss allowance of 1.98% (1) Quality Non-PCI charge-off rate of 2 bps for trailing twelve months Strong Capital Consolidated tangible common equity ratio of 12.20% Tier 1 RBC and Total RBC ratios of 13.16% and 16.07% Levels Tangible book value per share of $17.17 (1) Adds back the unamortized discount on Non-PCI loans to the loan balance and the allowance for credit losses (see page 23 for calculation). FIG Partners Forum February 2015 p. 9 |
|
|
Highlights Financial Highlights (Dollars in thousands) 4Q ‘14 3Q ‘14 Q / Q Annualized Total Assets $ 16,234,800 $ 15,938,345 2% 7% Total Non-PCI Loans and Leases $ 11,613,832 $ 11,239,964 3% 13% Total Deposits $ 11,755,128 $ 11,523,437 2% 8% Core Deposits $ 6,135,577 $ 6,006,958 2% 9% Adjusted Net Earnings (1) $ 68,200 $ 67,235 1% 6% Adjusted ROAA (1) 1.70% 1.70% - Adjusted ROATE (1) 15.37% 15.50% -0.13 Tangible Common Equity Ratio 12.20% 12.24% -0.04 Tangible Book Value Per Share $ 17.17 $ 16.86 2% Core Net Interest Margin (2) 5.52% 5.64% -0.12 Adjusted Efficiency Ratio (1) 42.3% 43.4% -1.10 (1) Acquisition, integration, reorganization and severance costs and certain other items have been excluded from net earnings, noninterest income, and noninterest expense to calcutate these amounts and ratios. See “Non-GAAP Measurements” slides (2) Excludes accelerated accretion of acquisition discounts resulting from early acquired loan payoffs. FIG Partners Forum February 2015 p. 10 |
|
|
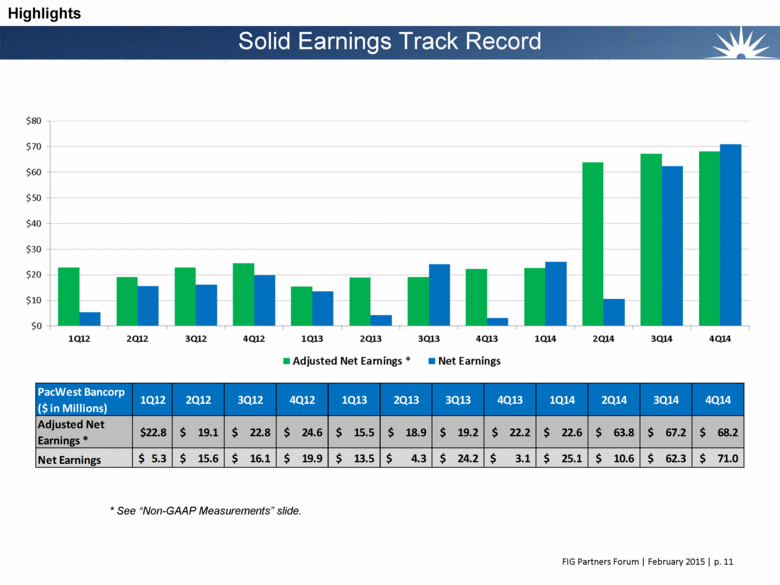
Solid Earnings Track Record * See “Non-GAAP Measurements” slide. Highlights PacWest Bancorp ($ in Millions) 1Q12 2Q12 3Q12 4Q12 1Q13 2Q13 3Q13 4Q13 1Q14 2Q14 3Q14 4Q14 Adjusted Net Earnings * 22.8 $ 19.1 $ 22.8 $ 24.6 $ 15.5 $ 18.9 $ 19.2 $ 22.2 $ 22.6 $ 63.8 $ 67.2 $ 68.2 $ Net Earnings 5.3 $ 15.6 $ 16.1 $ 19.9 $ 13.5 $ 4.3 $ 24.2 $ 3.1 $ 25.1 $ 10.6 $ 62.3 $ 71.0 $ |
|
|
Solid Capital Position – 4Q14 Source: SNL Financial Highlights |
|
|
Loans and Leases |
|
|
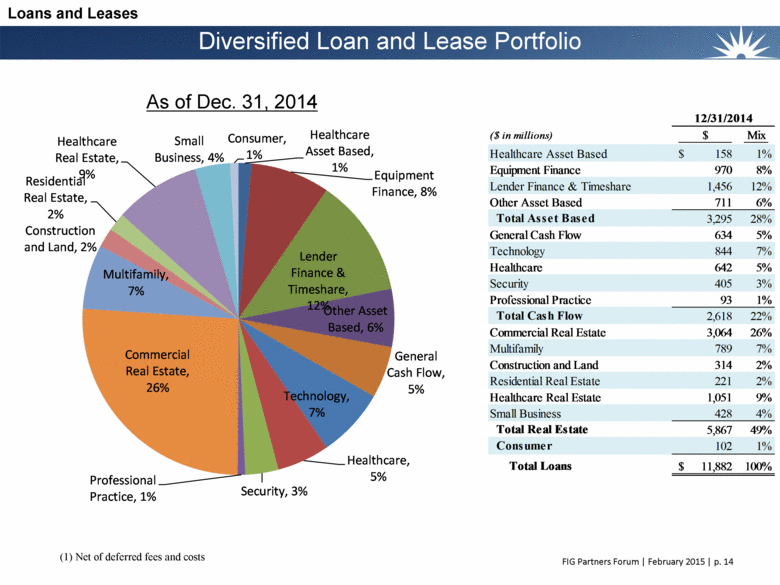
Diversified Loan and Lease Portfolio Loans and Leases As of Dec. 31, 2014 (1) Net of deferred fees and costs Healthcare Asset Based, 1% Equipment Finance, 8% Lender Finance & Timeshare, 12% Other Asset Based, 6% General Cash Flow, 5% Technology, 7% Healthcare, 5% Security, 3% Professional Practice, 1% Commercial Real Estate, 26% Multifamily, 7% Construction and Land, 2% Residential Real Estate, 2% Healthcare Real Estate, 9% Small Business, 4% Consumer, 1% ($ in millions) $ Mix Healthcare Asset Based 158 $ 1% Equipment Finance 970 8% Lender Finance & Timeshare 1,456 12% Other Asset Based 711 6% Total Asset Based 3,295 28% General Cash Flow 634 5% Technology 844 7% Healthcare 642 5% Security 405 3% Professional Practice 93 1% Total Cash Flow 2,618 22% Commercial Real Estate 3,064 26% Multifamily 789 7% Construction and Land 314 2% Residential Real Estate 221 2% Healthcare Real Estate 1,051 9% Small Business 428 4% Total Real Estate 5,867 49% Consumer 102 1% Total Loans 11,882 $ 100% 12/31/2014 |
|
|
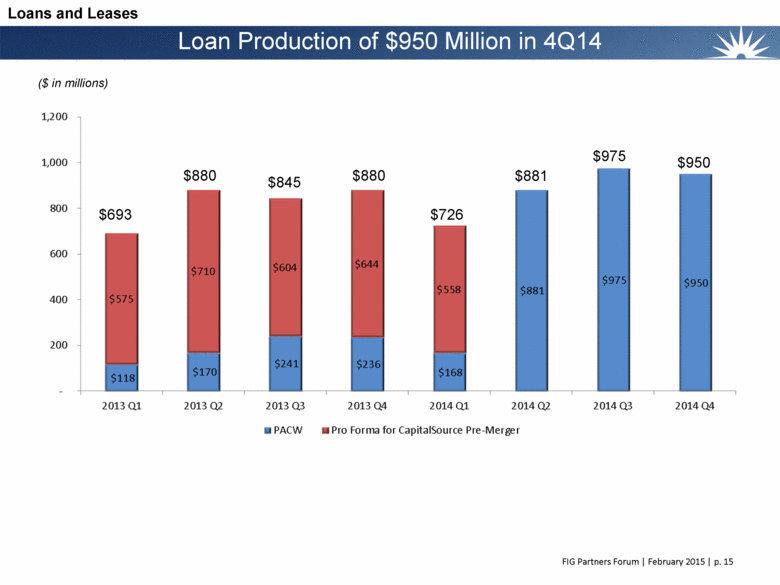
Loan Production of $950 Million in 4Q14 $693 $880 $845 $880 $726 ($ in millions) $881 Loans and Leases $975 $950 |
|
|
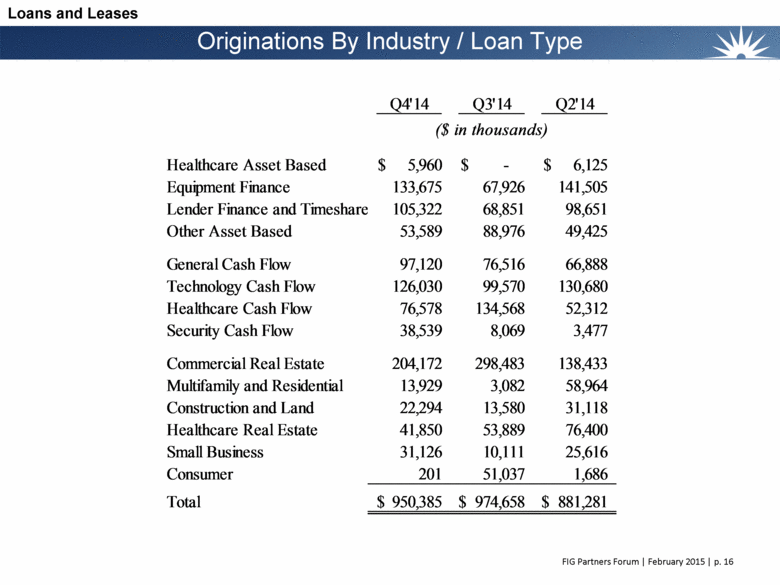
Originations By Industry / Loan Type Loans and Leases Q4'14 Q3'14 Q2'14 Healthcare Asset Based 5,960 $ - $ 6,125 $ Equipment Finance 133,675 67,926 141,505 Lender Finance and Timeshare 105,322 68,851 98,651 Other Asset Based 53,589 88,976 49,425 General Cash Flow 97,120 76,516 66,888 Technology Cash Flow 126,030 99,570 130,680 Healthcare Cash Flow 76,578 134,568 52,312 Security Cash Flow 38,539 8,069 3,477 Commercial Real Estate 204,172 298,483 138,433 Multifamily and Residential 13,929 3,082 58,964 Construction and Land 22,294 13,580 31,118 Healthcare Real Estate 41,850 53,889 76,400 Small Business 31,126 10,111 25,616 Consumer 201 51,037 1,686 Total 950,385 $ 974,658 $ 881,281 $ ($ in thousands) |
|
|
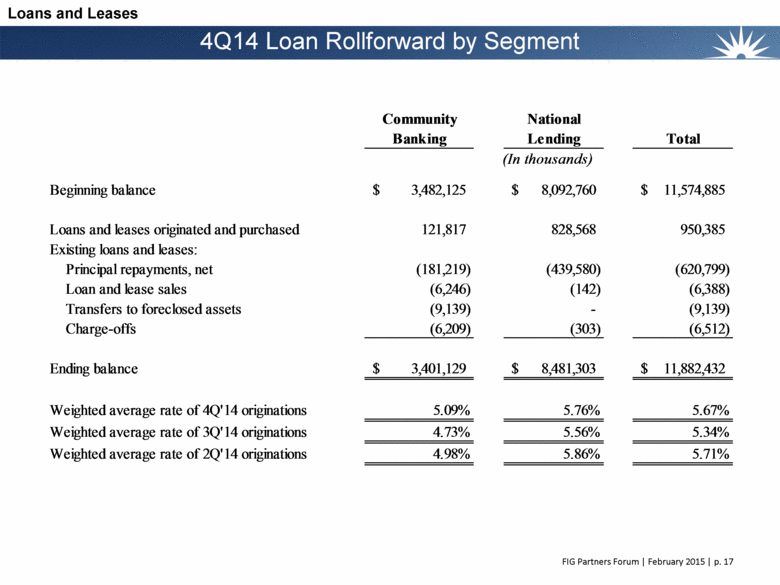
4Q14 Loan Rollforward by Segment Loans and Leases Community National Banking Lending Total Beginning balance 3,482,125 $ 8,092,760 $ 11,574,885 $ Loans and leases originated and purchased 121,817 828,568 950,385 Existing loans and leases: Principal repayments, net (181,219) (439,580) (620,799) Loan and lease sales (6,246) (142) (6,388) Transfers to foreclosed assets (9,139) - (9,139) Charge-offs (6,209) (303) (6,512) Ending balance 3,401,129 $ 8,481,303 $ 11,882,432 $ Weighted average rate of 4Q'14 originations 5.09% 5.76% 5.67% Weighted average rate of 3Q'14 originations 4.73% 5.56% 5.34% Weighted average rate of 2Q'14 originations 4.98% 5.86% 5.71% (In thousands) |
|
|
Credit Quality |
|
|
Credit Quality Non-PCI Credit Quality 4Q ‘14 3Q ‘14 2Q ‘14 1Q ‘14 (Dollars in thousands) Nonaccrual Loans $ 83,621 88,948 96,802 58,121 As a % of Loans and Leases % 0.72% 0.80% 0.90% 1.52% Nonperforming Assets $ 127,342 129,472 150,623 104,991 As a % of Total Assets % 0.78% 0.82% 0.96% 1.61% Classified Loans and Leases (1) $ 242,611 260,986 304,627 150,517 As a % of Loans and Leases % 2.09% 2.32% 2.82% 3.93% Credit Loss Provision $ 2,729 2,753 5,000 - As a % of Average Loans and Leases % 0.02% 0.02% 0.05% 0.00% TTM Charge-off $ 1,531 6,556 2,558 4,941 As a % of Average Loans and Leases % 0.02% 0.09% 0.05% 0.13% Allowance for Credit Losses (ACL) (2) $ 76,767 68,997 72,367 66,955 As a % of Loans and Leases % 0.66% 0.61% 0.67% 1.75% Adjusted ACL (3) $ 233,195 248,421 269,316 98,562 As a % of Adjusted Loans and Leases (3) % 1.98% 2.18% 2.45% 2.55% Adjusted ACL / NPL % 278.86% 279.29% 278.21% 169.58% (1) Classified loans and leases are those with a credit risk rating of substandard or doubtful (2) Allowance for credit losses includes allowance for loan and lease losses and reserves for unfunded commitments (3) Includes the remaining unamortized discount related to acquired loans (see page 23 for calculation) FIG Partners Forum February 2015 p. 19 |
|
|
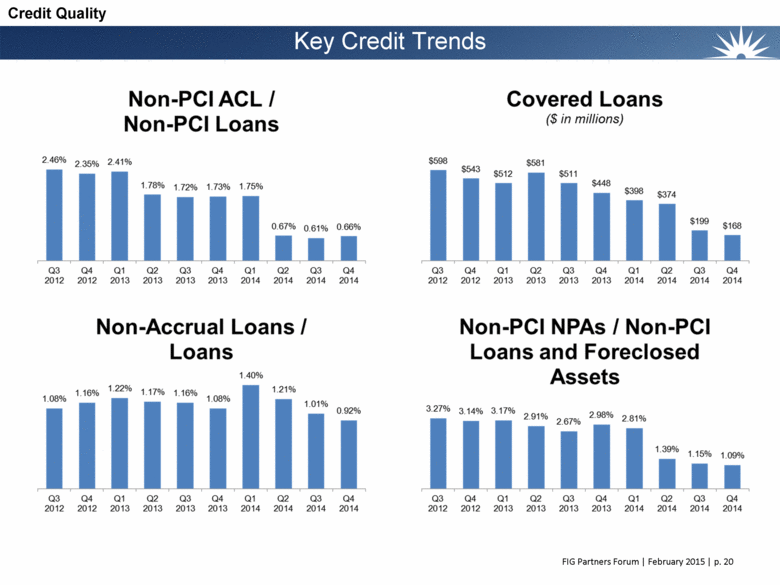
Credit Quality Key Credit Trends Non-PCI ACL / Covered Loans Non-PCI Loans ($ in millions) 2.46% 2.35% 2.41% $598 $581 $543 $512 $511 1.73% 1.75% $448 1.78% 1.72% $398 $374 $199 0.67% 0.61% 0.66% $168 Q3 Q4 Q1 Q2 Q3 Q4 Q1 Q2 Q3 Q4 Q3 Q4 Q1 Q2 Q3 Q4 Q1 Q2 Q3 Q4 2012 2012 2013 2013 2013 2013 2014 2014 2014 2014 2012 2012 2013 2013 2013 2013 2014 2014 2014 2014 Non-Accrual Loans / Non-PCI NPAs / Non-PCI Loans Loans and Foreclosed 1.40% Assets 1.22% 1.17% 1.21% 1.08% 1.16% 1.16% 1.08% 1.01% 0.92% 3.27% 3.14% 3.17% 2.91% 2.67% 2.98% 2.81% 1.39% 1.15% 1.09% Q3 Q4 Q1 Q2 Q3 Q4 Q1 Q2 Q3 Q4 Q3 Q4 Q1 Q2 Q3 Q4 Q1 Q2 Q3 Q4 2012 2012 2013 2013 2013 2013 2014 2014 2014 2014 2012 2012 2013 2013 2013 2013 2014 2014 2014 2014 FIG Partners Forum | February 2015 | p. 20 |
|
|
Credit Quality Non-Accrual Loan and Lease Detail Nonaccrual Loans and Leases Accruing and 30 -89 December 31, 2014 September 30, 2014 Days Past Due % of % of December 31, September 30, Loan Loan 2014 2014 Balance Category Balance Category Balance Balance (Dollars in thousands) Real estate mortgage: Hospitality $ 6,366 1% $ 6,451 1% $ -$ - SBA 11,141 3% 7,483 2% 3,339 529 Other 20,105 -26,575 1% 4,769 4,014 Total real estate mortgage 37,612 1% 40,509 1% 8,108 4,543 Real estate construction: Residential 381 -925 1% -- Commercial 1,178 1% 2,703 1% -1,190 Total real estate construction 1,559 1% 3,628 1% -1,190 Commercial: Collateralized 5,450 1% 5,165 1% 93 - Unsecured 639 -226 -69 1 Asset-based 4,574 -5,003 --- Cash Flow 15,964 1% 15,958 1% -- Equipment finance 11,131 1% 12,885 1% 2,339 - SBA 3,207 7% 2,039 5% 26 - Total commercial 40,965 1% 41,276 1% 2,527 1 Consumer 3,485 2% 3,535 3% 50 165 Total Non-PCI loans and leases $ 83,621 1% $ 88,948 1% $ 10,685 $ 5,899 Note: At December 31, 2014, we had 50 outstanding loan and lease relationships totaling $295.0 million to borrowers broadly involved in the energy industry. The obligors under these loans and leases either conduct mining, quarrying, oil and gas extraction or provide industrial support services to such types of businesses. The collateral for these loans and leases primarily includes equipment, such as drilling and mining equipment and transportation vehicles, used directly and indirectly in these activities. At December 31, 2014, four of these loans totaling $6.8 million were on nonaccrual status. These loans and leases are subject to our normal review procedures and allowance for credit losses methodology. FIG Partners Forum February 2015 p. 21 |
|
|
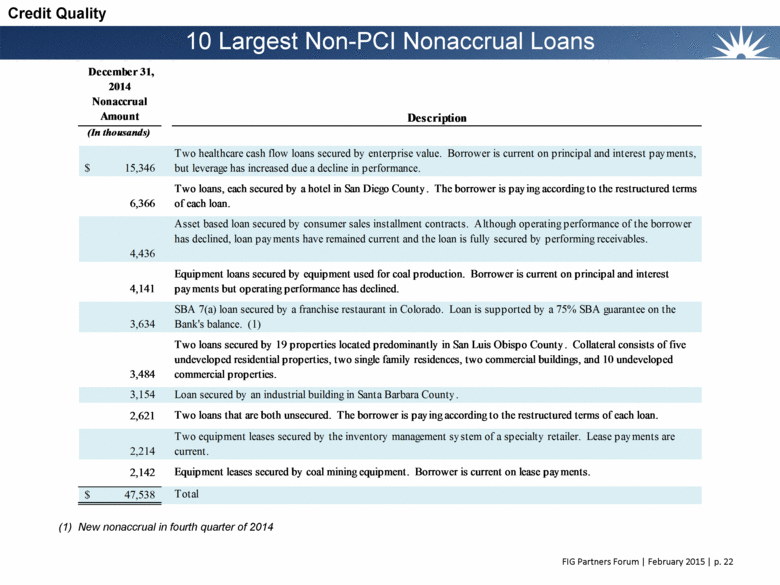
10 Largest Non-PCI Nonaccrual Loans Credit Quality New nonaccrual in fourth quarter of 2014 December 31, 2014 Nonaccrual Amount Description (In thousands) 15,346 $ Two healthcare cash flow loans secured by enterprise value. Borrower is current on principal and interest payments, but leverage has increased due a decline in performance. 6,366 Two loans, each secured by a hotel in San Diego County. The borrower is paying according to the restructured terms of each loan. 4,436 Asset based loan secured by consumer sales installment contracts. Although operating performance of the borrower has declined, loan payments have remained current and the loan is fully secured by performing receivables. 4,141 Equipment loans secured by equipment used for coal production. Borrower is current on principal and interest payments but operating performance has declined. 3,634 SBA 7(a) loan secured by a franchise restaurant in Colorado. Loan is supported by a 75% SBA guarantee on the Bank's balance. (1) 3,484 Two loans secured by 19 properties located predominantly in San Luis Obispo County. Collateral consists of five undeveloped residential properties, two single family residences, two commercial buildings, and 10 undeveloped commercial properties. 3,154 Loan secured by an industrial building in Santa Barbara County. 2,621 Two loans that are both unsecured. The borrower is paying according to the restructured terms of each loan. 2,214 Two equipment leases secured by the inventory management system of a specialty retailer. Lease payments are current. 2,142 Equipment leases secured by coal mining equipment. Borrower is current on lease payments. 47,538 $ Total |
|
|
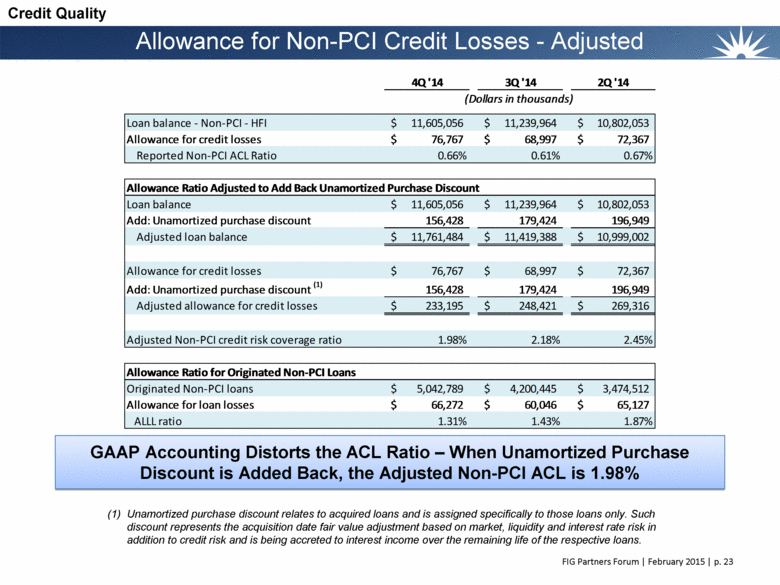
Allowance for Non-PCI Credit Losses - Adjusted GAAP Accounting Distorts the ACL Ratio – When Unamortized Purchase Discount is Added Back, the Adjusted Non-PCI ACL is 1.98% Credit Quality Unamortized purchase discount relates to acquired loans and is assigned specifically to those loans only. Such discount represents the acquisition date fair value adjustment based on market, liquidity and interest rate risk in addition to credit risk and is being accreted to interest income over the remaining life of the respective loans. 4Q '14 3Q '14 2Q '14 Loan balance - Non-PCI - HFI 11,605,056 $ 11,239,964 $ 10,802,053 $ Allowance for credit losses 76,767 $ 68,997 $ 72,367 $ Reported Non-PCI ACL Ratio 0.66% 0.61% 0.67% Allowance Ratio Adjusted to Add Back Unamortized Purchase Discount Loan balance 11,605,056 $ 11,239,964 $ 10,802,053 $ Add: Unamortized purchase discount 156,428 179,424 196,949 Adjusted loan balance 11,761,484 $ 11,419,388 $ 10,999,002 $ Allowance for credit losses 76,767 $ 68,997 $ 72,367 $ Add: Unamortized purchase discount (1) 156,428 179,424 196,949 Adjusted allowance for credit losses 233,195 $ 248,421 $ 269,316 $ Adjusted Non-PCI credit risk coverage ratio 1.98% 2.18% 2.45% Allowance Ratio for Originated Non-PCI Loans Originated Non-PCI loans 5,042,789 $ 4,200,445 $ 3,474,512 $ Allowance for loan losses 66,272 $ 60,046 $ 65,127 $ ALLL ratio 1.31% 1.43% 1.87% (Dollars in thousands) (1) |
|
|
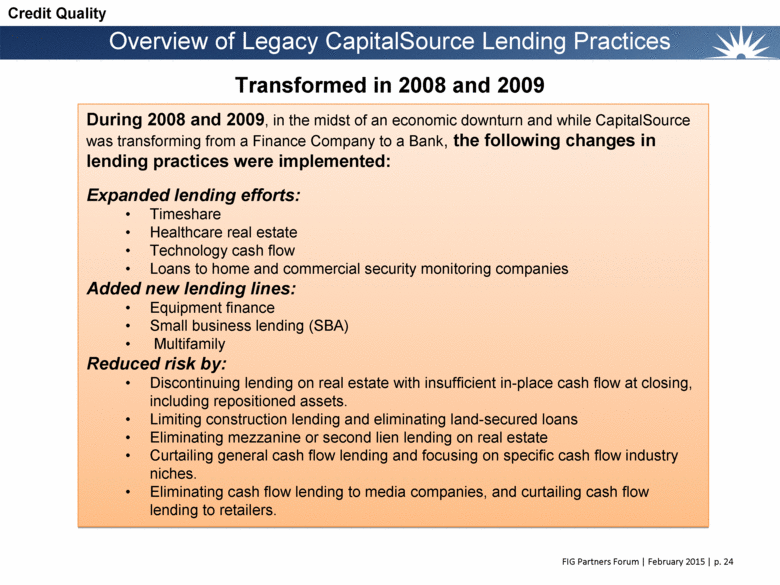
Transformed in 2008 and 2009 During 2008 and 2009, in the midst of an economic downturn and while CapitalSource was transforming from a Finance Company to a Bank, the following changes in lending practices were implemented: Expanded lending efforts: Timeshare Healthcare real estate Technology cash flow Loans to home and commercial security monitoring companies Added new lending lines: Equipment finance Small business lending (SBA) Multifamily Reduced risk by: Discontinuing lending on real estate with insufficient in-place cash flow at closing, including repositioned assets. Limiting construction lending and eliminating land-secured loans Eliminating mezzanine or second lien lending on real estate Curtailing general cash flow lending and focusing on specific cash flow industry niches. Eliminating cash flow lending to media companies, and curtailing cash flow lending to retailers. Overview of Legacy CapitalSource Lending Practices Credit Quality |
|
|
Deposits |
|
|
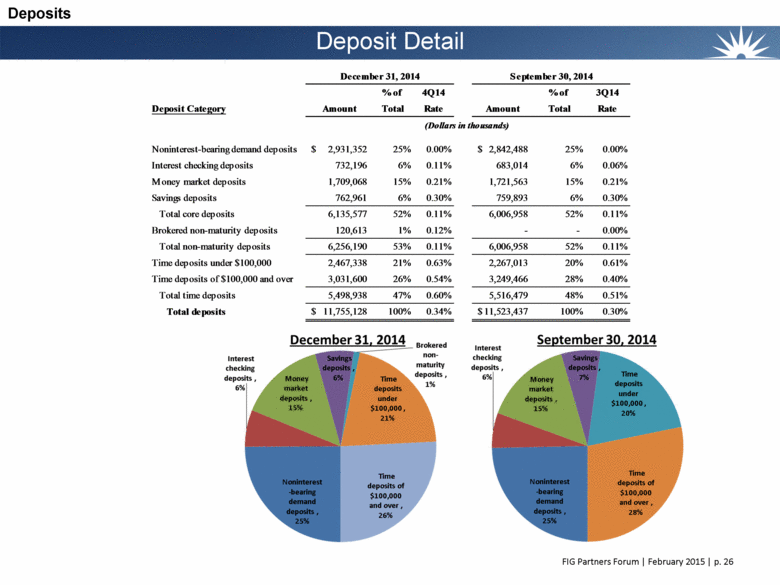
Deposit Detail Deposits % of 4Q14 % of 3Q14 Deposit Category Amount Total Rate Amount Total Rate Noninterest-bearing demand deposits 2,931,352 $ 25% 0.00% 2,842,488 $ 25% 0.00% Interest checking deposits 732,196 6% 0.11% 683,014 6% 0.06% Money market deposits 1,709,068 15% 0.21% 1,721,563 15% 0.21% Savings deposits 762,961 6% 0.30% 759,893 6% 0.30% Total core deposits 6,135,577 52% 0.11% 6,006,958 52% 0.11% Brokered non-maturity deposits 120,613 1% 0.12% - - 0.00% Total non-maturity deposits 6,256,190 53% 0.11% 6,006,958 52% 0.11% Time deposits under $100,000 2,467,338 21% 0.63% 2,267,013 20% 0.61% Time deposits of $100,000 and over 3,031,600 26% 0.54% 3,249,466 28% 0.40% Total time deposits 5,498,938 47% 0.60% 5,516,479 48% 0.51% Total deposits 11,755,128 $ 100% 0.34% 11,523,437 $ 100% 0.30% December 31, 2014 September 30, 2014 (Dollars in thousands) |
|
|
Deposits Deposit Portfolio ($ in Billions) Balance December 31, 2014 Time Deposits Time Deposits Total Estimated Under $100,000 Time Contractual Effective Time Deposit Maturities $100,000 Or More Deposits Rate Rate Due in three months or less 618,024 $ 767,160 $ 1,385,184 $ 0.70% 0.61% Due in over three months through six months 608,290 700,199 1,308,489 0.70% 0.64% Due in over six months through twelve months 1,007,390 1,257,397 2,264,787 0.75% 0.71% Due in over 12 months through 24 months 176,125 248,533 424,658 1.01% 0.88% Due in over 24 months 57,509 58,311 115,820 0.95% 0.70% Total 2,467,338 $ (1) 3,031,600 $ 5,498,938 $ 0.75% 0.69% (1) Includes brokered deposits of $593mm with a final maturity in August 2015 and a weighted-average cost of 0.52%. FIG Partners Forum February 2015 p. 27 |
|
|
Net Interest Margin |
|
|
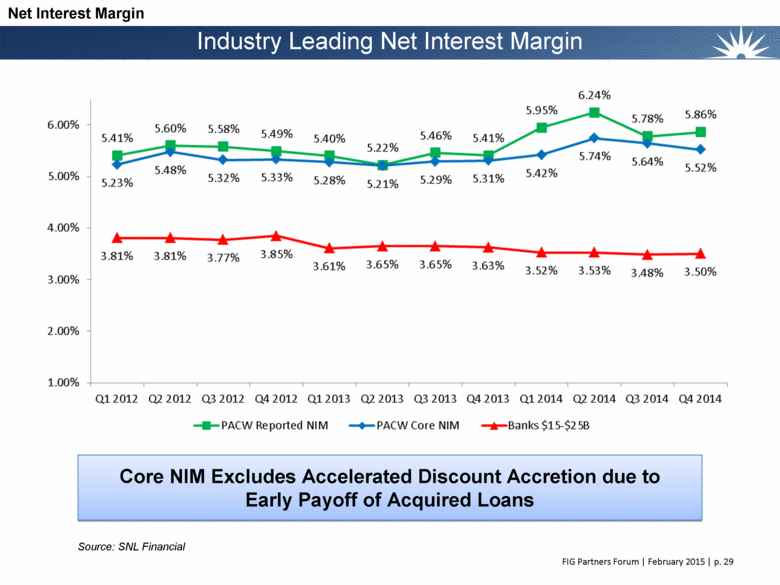
Industry Leading Net Interest Margin Core NIM Excludes Accelerated Discount Accretion due to Early Payoff of Acquired Loans Source: SNL Financial Net Interest Margin |
|
|
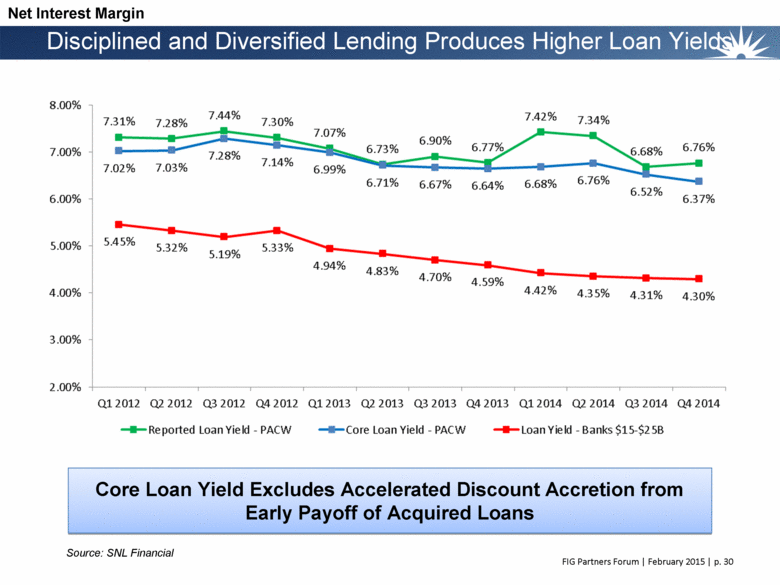
Disciplined and Diversified Lending Produces Higher Loan Yields Core Loan Yield Excludes Accelerated Discount Accretion from Early Payoff of Acquired Loans Source: SNL Financial Net Interest Margin |
|
|
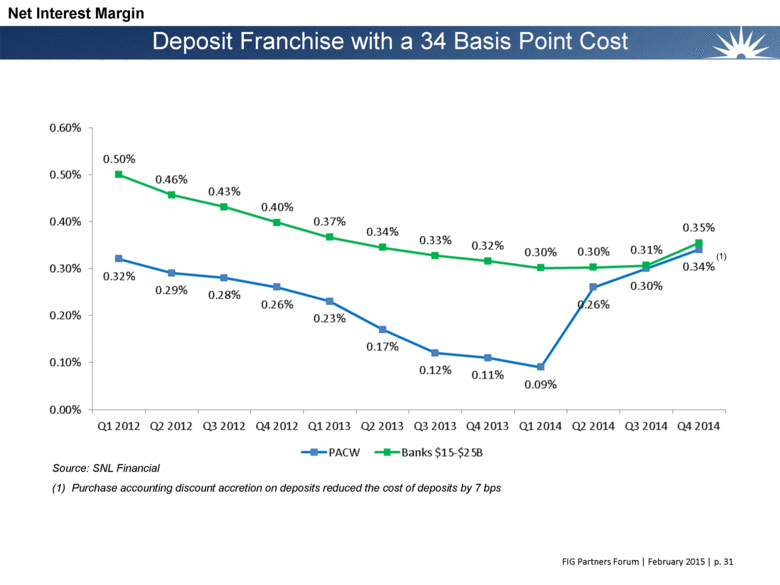
Deposit Franchise with a 34 Basis Point Cost Purchase accounting discount accretion on deposits reduced the cost of deposits by 7 bps (1) Source: SNL Financial Net Interest Margin |
|
|
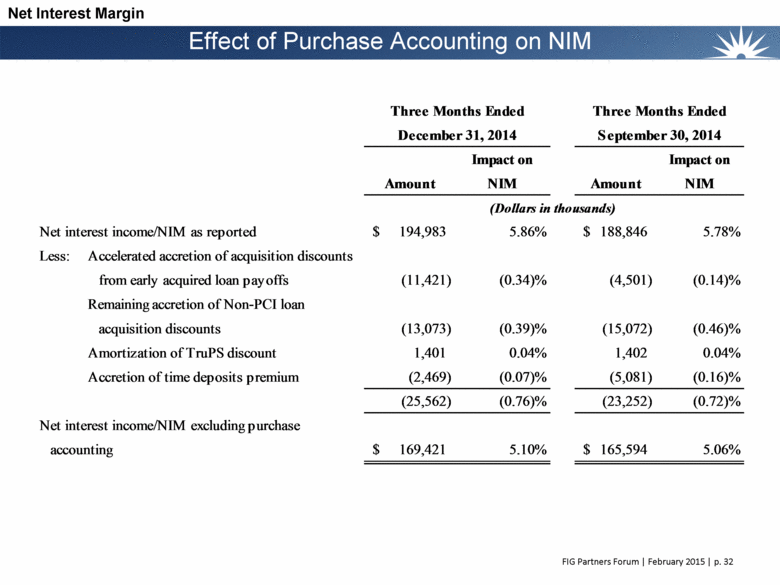
Effect of Purchase Accounting on NIM Net Interest Margin Impact on Impact on Amount NIM Amount NIM (Dollars in thousands) Net interest income/NIM as reported 194,983 $ 5.86% 188,846 $ 5.78% Less: Accelerated accretion of acquisition discounts from early acquired loan payoffs (11,421) (0.34)% (4,501) (0.14)% Remaining accretion of Non-PCI loan acquisition discounts (13,073) (0.39)% (15,072) (0.46)% Amortization of TruPS discount 1,401 0.04% 1,402 0.04% Accretion of time deposits premium (2,469) (0.07)% (5,081) (0.16)% (25,562) (0.76)% (23,252) (0.72)% Net interest income/NIM excluding purchase accounting 169,421 $ 5.10% 165,594 $ 5.06% Three Months Ended Three Months Ended December 31, 2014 September 30, 2014 |
|
|
Controlled Expenses |
|
|
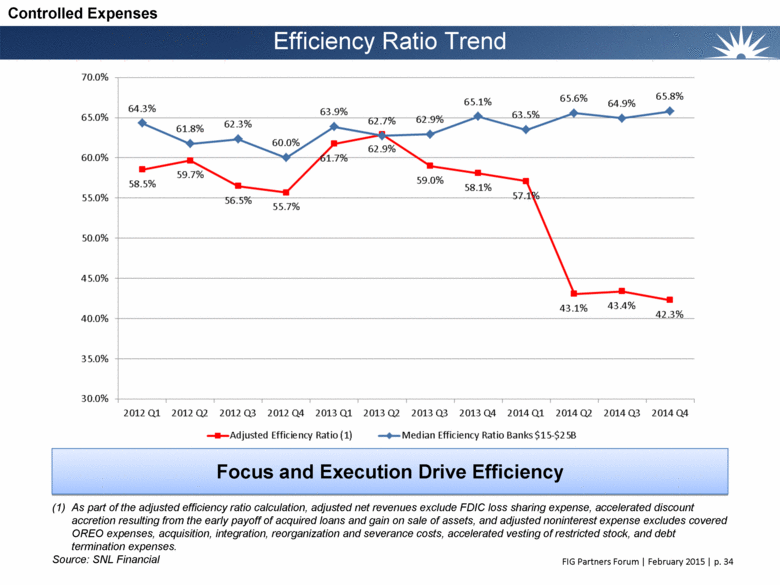
Efficiency Ratio Trend As part of the adjusted efficiency ratio calculation, adjusted net revenues exclude FDIC loss sharing expense, accelerated discount accretion resulting from the early payoff of acquired loans and gain on sale of assets, and adjusted noninterest expense excludes covered OREO expenses, acquisition, integration, reorganization and severance costs, accelerated vesting of restricted stock, and debt termination expenses. Focus and Execution Drive Efficiency Source: SNL Financial Controlled Expenses |
|
|
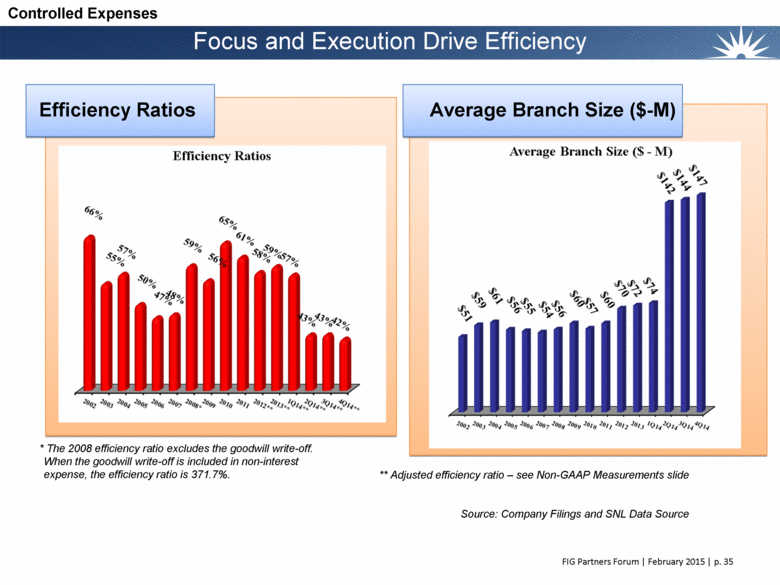
Efficiency Ratios Average Branch Size ($-M) Focus and Execution Drive Efficiency * The 2008 efficiency ratio excludes the goodwill write-off. When the goodwill write-off is included in non-interest expense, the efficiency ratio is 371.7%. ** Adjusted efficiency ratio – see Non-GAAP Measurements slide Source: Company Filings and SNL Data Source Controlled Expenses |
|
|
Acquisitions |
|
|
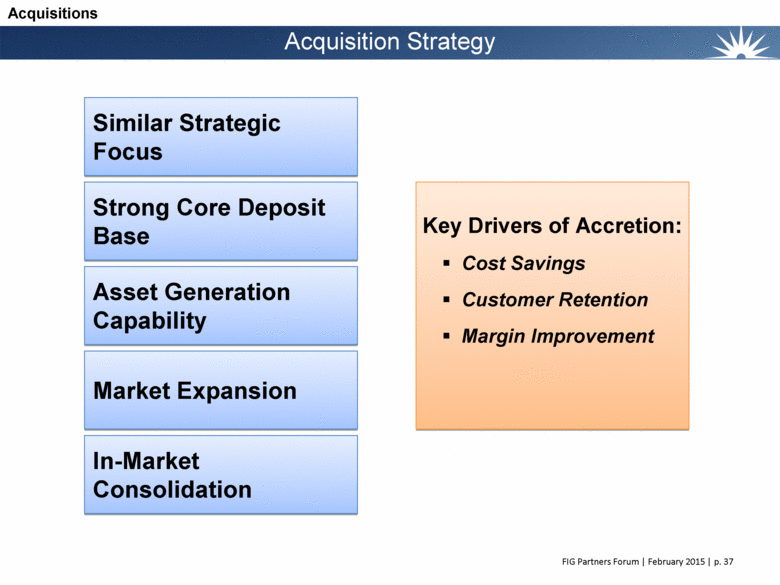
Asset Generation Capability In-Market Consolidation Strong Core Deposit Base Similar Strategic Focus Key Drivers of Accretion: Cost Savings Customer Retention Margin Improvement Acquisition Strategy Market Expansion Acquisitions |
|
|
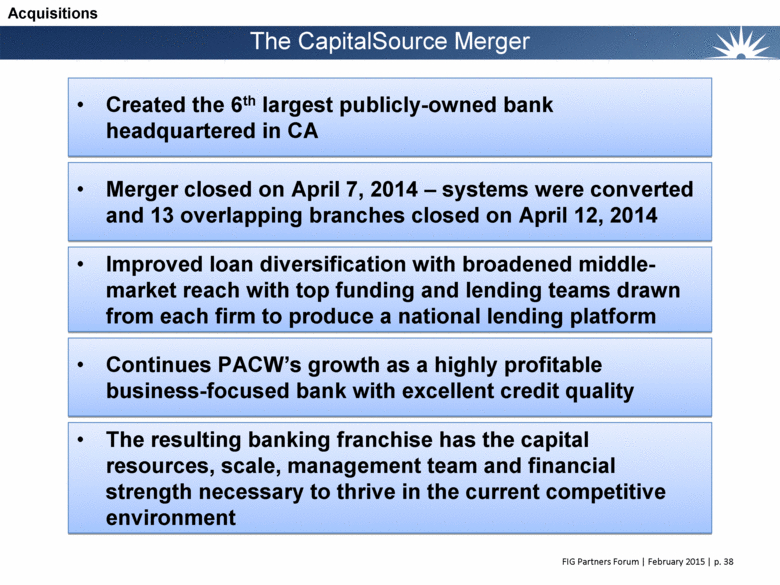
The CapitalSource Merger Acquisitions Created the 6th largest publicly-owned bank headquartered in CA Merger closed on April 7, 2014 – systems were converted and 13 overlapping branches closed on April 12, 2014 Continues PACW’s growth as a highly profitable business-focused bank with excellent credit quality Improved loan diversification with broadened middle-market reach with top funding and lending teams drawn from each firm to produce a national lending platform The resulting banking franchise has the capital resources, scale, management team and financial strength necessary to thrive in the current competitive environment |
|
|
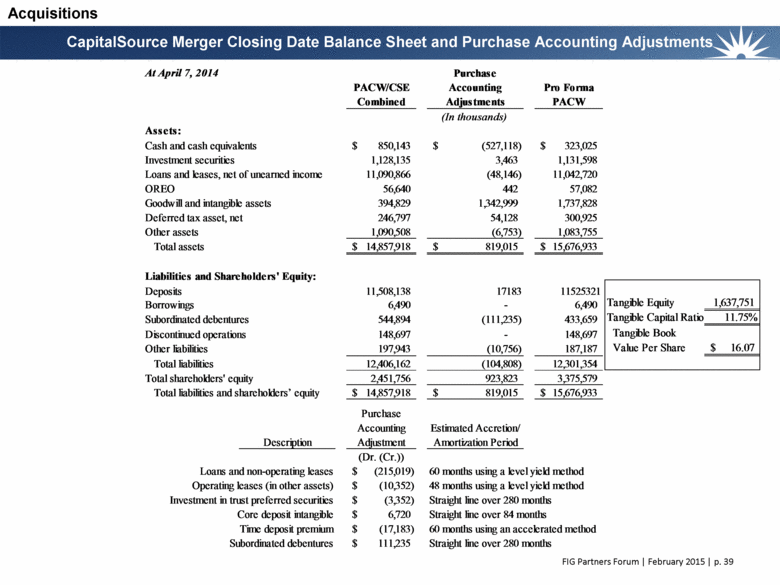
CapitalSource Merger Closing Date Balance Sheet and Purchase Accounting Adjustments Acquisitions Acquisitions At April 7, 2014 Purchase PACW/CSE Accounting Pro Forma Combined Adjustments PACW Assets: Cash and cash equivalents 850,143 $ (527,118) $ 323,025 $ Investment securities 1,128,135 3,463 1,131,598 Loans and leases, net of unearned income 11,090,866 (48,146) 11,042,720 OREO 56,640 442 57,082 Goodwill and intangible assets 394,829 1,342,999 1,737,828 Deferred tax asset, net 246,797 54,128 300,925 Other assets 1,090,508 (6,753) 1,083,755 Total assets 14,857,918 $ 819,015 $ 15,676,933 $ Liabilities and Shareholders' Equity: Deposits 11,508,138 17183 11525321 Borrowings 6,490 - 6,490 Subordinated debentures 544,894 (111,235) 433,659 Discontinued operations 148,697 - 148,697 Other liabilities 197,943 (10,756) 187,187 Total liabilities 12,406,162 (104,808) 12,301,354 Total shareholders' equity 2,451,756 923,823 3,375,579 Total liabilities and shareholders’ equity 14,857,918 $ 819,015 $ 15,676,933 $ (In thousands) Purchase Accounting Estimated Accretion/ Description Adjustment Amortization Period (Dr. (Cr.)) Loans and non-operating leases (215,019) $ 60 months using a level yield method Operating leases (in other assets) (10,352) $ 48 months using a level yield method Investment in trust preferred securities (3,352) $ Straight line over 280 months Core deposit intangible 6,720 $ Straight line over 84 months Time deposit premium (17,183) $ 60 months using an accelerated method Subordinated debentures 111,235 $ Straight line over 280 months Tangible Equity 1,637,751 Tangible Capital Ratio 11.75% Tangible Book Value Per Share 16.07 |
|
|
Strong Franchise Value |
|
|
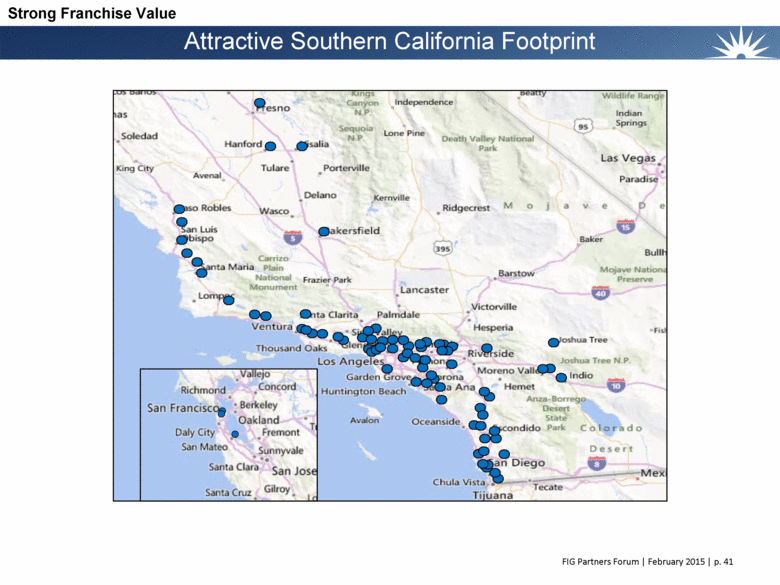
Attractive Southern California Footprint Strong Franchise Value |
|
|
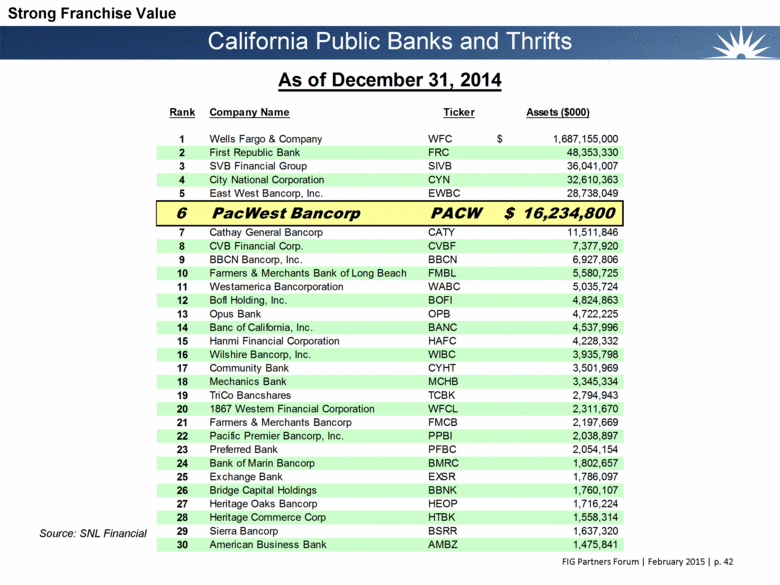
Source: SNL Financial California Public Banks and Thrifts Strong Franchise Value Rank Company Name Ticker Assets ($000) 1 Wells Fargo & Company WFC 1,687,155,000 $ 2 First Republic Bank FRC 48,353,330 3 SVB Financial Group SIVB 36,041,007 4 City National Corporation CYN 32,610,363 5 East West Bancorp, Inc. EWBC 28,738,049 6 PacWest Bancorp PACW 16,234,800 $ 7 Cathay General Bancorp CATY 11,511,846 8 CVB Financial Corp. CVBF 7,377,920 9 BBCN Bancorp, Inc. BBCN 6,927,806 10 Farmers & Merchants Bank of Long Beach FMBL 5,580,725 11 Westamerica Bancorporation WABC 5,035,724 12 BofI Holding, Inc. BOFI 4,824,863 13 Opus Bank OPB 4,722,225 14 Banc of California, Inc. BANC 4,537,996 15 Hanmi Financial Corporation HAFC 4,228,332 16 Wilshire Bancorp, Inc. WIBC 3,935,798 17 Community Bank CYHT 3,501,969 18 Mechanics Bank MCHB 3,345,334 19 TriCo Bancshares TCBK 2,794,943 20 1867 Western Financial Corporation WFCL 2,311,670 21 Farmers & Merchants Bancorp FMCB 2,197,669 22 Pacific Premier Bancorp, Inc. PPBI 2,038,897 23 Preferred Bank PFBC 2,054,154 24 Bank of Marin Bancorp BMRC 1,802,657 25 Exchange Bank EXSR 1,786,097 26 Bridge Capital Holdings BBNK 1,760,107 27 Heritage Oaks Bancorp HEOP 1,716,224 28 Heritage Commerce Corp HTBK 1,558,314 29 Sierra Bancorp BSRR 1,637,320 30 American Business Bank AMBZ 1,475,841 As of December 31, 2014 |
|
|
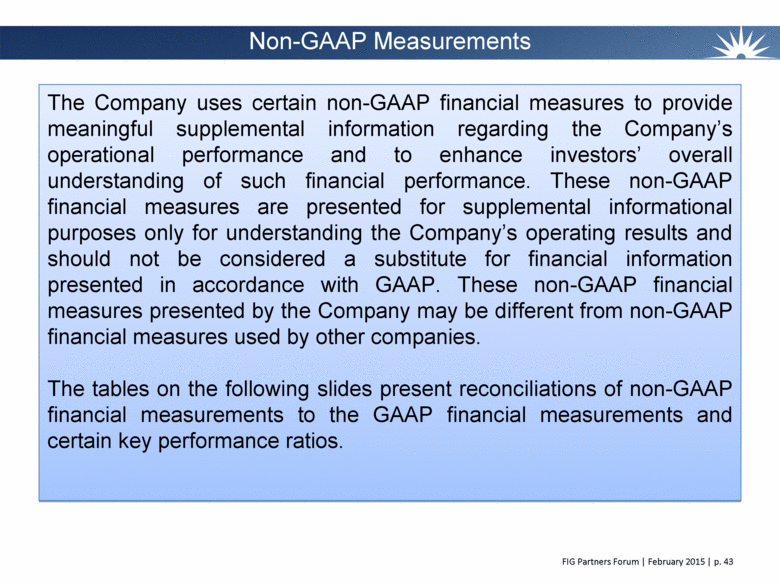
Non-GAAP Measurements The Company uses certain non-GAAP financial measures to provide meaningful supplemental information regarding the Company’s operational performance and to enhance investors’ overall understanding of such financial performance. These non-GAAP financial measures are presented for supplemental informational purposes only for understanding the Company’s operating results and should not be considered a substitute for financial information presented in accordance with GAAP. These non-GAAP financial measures presented by the Company may be different from non-GAAP financial measures used by other companies. The tables on the following slides present reconciliations of non-GAAP financial measurements to the GAAP financial measurements and certain key performance ratios. |
|
|
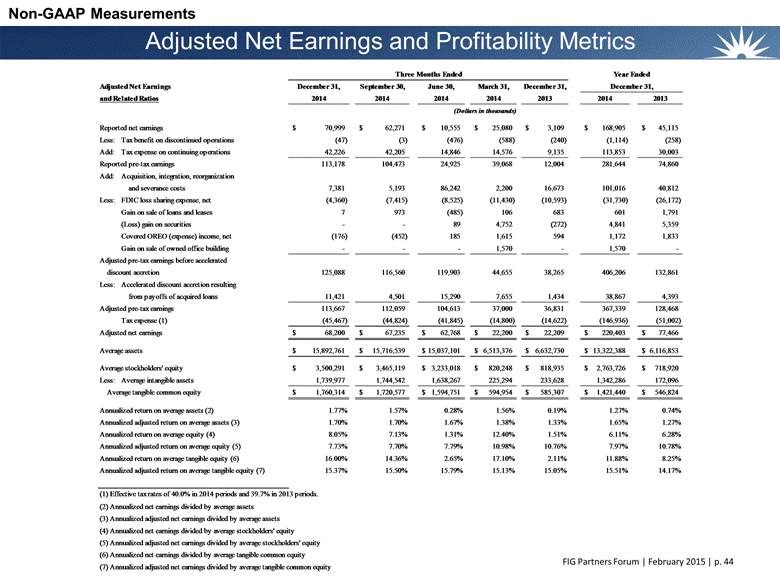
Non-GAAP Measurements Adjusted Net Earnings and Profitability Metrics FIG Partners Forum February 2015 p. 44 Three Months Ended Year Ended Adjusted Net Earnings December 31, September 30, June 30, March 31, December 31, December 31, and Related Ratios 2014 2014 2014 2014 2013 2014 2013 (Dollars in thousands) Reported net earnings 70,999 $ 62,271 $ 10,555 $ 25,080 $ 3,109 $ 168,905 $ 45,115 $ Less: Tax benefit on discontinued operations (47) (3) (476) (588) (240) (1,114) (258) Add: Tax expense on continuing operations 42,226 42,205 14,846 14,576 9,135 113,853 30,003 Reported pre-tax earnings 113,178 104,473 24,925 39,068 12,004 281,644 74,860 Add: Acquisition, integration, reorganization and severance costs 7,381 5,193 86,242 2,200 16,673 101,016 40,812 Less: FDIC loss sharing expense, net (4,360) (7,415) (8,525) (11,430) (10,593) (31,730) (26,172) Gain on sale of loans and leases 7 973 (485) 106 683 601 1,791 (Loss) gain on securities - - 89 4,752 (272) 4,841 5,359 Covered OREO (expense) income, net (176) (452) 185 1,615 594 1,172 1,833 Gain on sale of owned office building - - - 1,570 - 1,570 - Adjusted pre-tax earnings before accelerated discount accretion 125,088 116,560 119,903 44,655 38,265 406,206 132,861 Less: Accelerated discount accretion resulting from payoffs of acquired loans 11,421 4,501 15,290 7,655 1,434 38,867 4,393 Adjusted pre-tax earnings 113,667 112,059 104,613 37,000 36,831 367,339 128,468 Tax expense (1) (45,467) (44,824) (41,845) (14,800) (14,622) (146,936) (51,002) Adjusted net earnings 68,200 $ 67,235 $ 62,768 $ 22,200 $ 22,209 $ 220,403 $ 77,466 $ Average assets 15,892,761 $ 15,716,539 $ 15,037,101 $ 6,513,376 $ 6,632,730 $ 13,322,388 $ 6,116,853 $ Average stockholders’ equity 3,500,291 $ 3,465,119 $ 3,233,018 $ 820,248 $ 818,935 $ 2,763,726 $ 718,920 $ Less: Average intangible assets 1,739,977 1,744,542 1,638,267 225,294 233,628 1,342,286 172,096 Average tangible common equity 1,760,314 $ 1,720,577 $ 1,594,751 $ 594,954 $ 585,307 $ 1,421,440 $ 546,824 $ Annualized return on average assets (2) 1.77% 1.57% 0.28% 1.56% 0.19% 1.27% 0.74% Annualized adjusted return on average assets (3) 1.70% 1.70% 1.67% 1.38% 1.33% 1.65% 1.27% Annualized return on average equity (4) 8.05% 7.13% 1.31% 12.40% 1.51% 6.11% 6.28% Annualized adjusted return on average equity (5) 7.73% 7.70% 7.79% 10.98% 10.76% 7.97% 10.78% Annualized return on average tangible equity (6) 16.00% 14.36% 2.65% 17.10% 2.11% 11.88% 8.25% Annualized adjusted return on average tangible equity (7) 15.37% 15.50% 15.79% 15.13% 15.05% 15.51% 14.17% (1) Effective tax rates of 40.0% in 2014 periods and 39.7% in 2013 periods. (2) Annualized net earnings divided by average assets (3) Annualized adjusted net earnings divided by average assets (4) Annualized net earnings divided by average stockholders’ equity (5) Annualized adjusted net earnings divided by average stockholders’ equity (6) Annualized net earnings divided by average tangible common equity (7) Annualized adjusted net earnings divided by average tangible common equity |
|
|
Non-GAAP Measurements Adjusted Efficiency Ratio FIG Partners Forum February 2015 p. 45 Three Months Ended Year Ended December 31, September 30, June 30, March 31, December 31, December 31, Adjusted Efficiency Ratio 2014 2014 2014 2014 2013 2014 2013 (Dollars in thousands) Noninterest expense 92,340 $ 95,629 $ 169,906 $ 50,869 $ 66,088 $ 408,744 $ 230,687 $ Less: Acquisition, integration, reorganization and severance costs 7,381 5,193 86,242 2,200 16,673 101,016 40,812 Covered OREO expense (income), net 176 452 (185) (1,615) (594) (1,172) (1,833) Adjusted noninterest expense 84,783 $ 89,984 $ 83,849 $ 50,284 $ 50,009 $ 308,900 $ 191,708 $ Net interest income 194,983 $ 188,846 $ 192,533 $ 86,015 $ 81,258 $ 662,377 $ 297,713 $ Noninterest income 12,703 16,314 8,479 4,691 (3,926) 42,187 4,244 Net revenues 207,686 205,160 201,012 90,706 77,332 704,564 301,957 Less: FDIC loss sharing expense, net (4,360) (7,415) (8,525) (11,430) (10,593) (31,730) (26,172) Gain on sale of loans and leases 7 973 (485) 106 683 601 1,791 (Loss) gain on securities - - 89 4,752 (272) 4,841 5,359 Gain on sale of owned office building - - - 1,570 - 1,570 - Accelerated discount accretion resulting from payoffs of acquired loans 11,421 4,501 15,290 7,655 1,434 38,867 4,393 Adjusted net revenues 200,618 $ 207,101 $ 194,643 $ 88,053 $ 86,080 $ 690,415 $ 316,586 $ Base efficiency ratio (1) 44.5% 46.6% 84.5% 56.1% 85.5% 58.0% 76.4% Adjusted efficiency ratio (2) 42.3% 43.4% 43.1% 57.1% 58.1% 44.7% 60.6% (1) Noninterest expense divided by net revenues (2) Adjusted noninterest expense divided by adjusted net revenues |
|
|
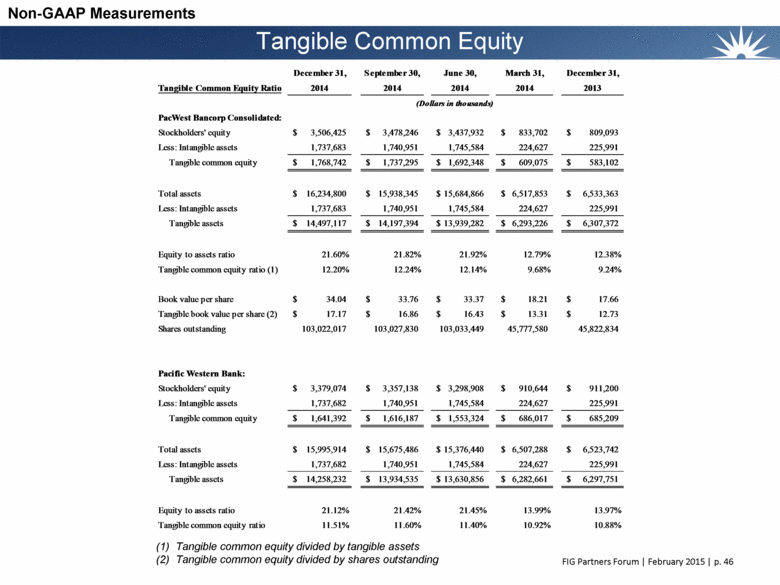
Tangible Common Equity Non-GAAP Measurements Tangible common equity divided by tangible assets Tangible common equity divided by shares outstanding December 31, September 30, June 30, March 31, December 31, Tangible Common Equity Ratio 2014 2014 2014 2014 2013 (Dollars in thousands) PacWest Bancorp Consolidated: Stockholders' equity 3,506,425 $ 3,478,246 $ 3,437,932 $ 833,702 $ 809,093 $ Less: Intangible assets 1,737,683 1,740,951 1,745,584 224,627 225,991 Tangible common equity 1,768,742 $ 1,737,295 $ 1,692,348 $ 609,075 $ 583,102 $ Total assets 16,234,800 $ 15,938,345 $ 15,684,866 $ 6,517,853 $ 6,533,363 $ Less: Intangible assets 1,737,683 1,740,951 1,745,584 224,627 225,991 Tangible assets 14,497,117 $ 14,197,394 $ 13,939,282 $ 6,293,226 $ 6,307,372 $ Equity to assets ratio 21.60% 21.82% 21.92% 12.79% 12.38% Tangible common equity ratio (1) 12.20% 12.24% 12.14% 9.68% 9.24% Book value per share 34.04 $ 33.76 $ 33.37 $ 18.21 $ 17.66 $ Tangible book value per share (2) 17.17 $ 16.86 $ 16.43 $ 13.31 $ 12.73 $ Shares outstanding 103,022,017 103,027,830 103,033,449 45,777,580 45,822,834 Pacific Western Bank: Stockholders' equity 3,379,074 $ 3,357,138 $ 3,298,908 $ 910,644 $ 911,200 $ Less: Intangible assets 1,737,682 1,740,951 1,745,584 224,627 225,991 Tangible common equity 1,641,392 $ 1,616,187 $ 1,553,324 $ 686,017 $ 685,209 $ Total assets 15,995,914 $ 15,675,486 $ 15,376,440 $ 6,507,288 $ 6,523,742 $ Less: Intangible assets 1,737,682 1,740,951 1,745,584 224,627 225,991 Tangible assets 14,258,232 $ 13,934,535 $ 13,630,856 $ 6,282,661 $ 6,297,751 $ Equity to assets ratio 21.12% 21.42% 21.45% 13.99% 13.97% Tangible common equity ratio 11.51% 11.60% 11.40% 10.92% 10.88% |


