Attached files
| file | filename |
|---|---|
| EX-4.3 - EX-4.3 - MaxPoint Interactive, Inc. | a2222730zex-4_3.htm |
| EX-3.3 - EX-3.3 - MaxPoint Interactive, Inc. | a2222730zex-3_3.htm |
| EX-3.1 - EX-3.1 - MaxPoint Interactive, Inc. | a2222730zex-3_1.htm |
| EX-4.2 - EX-4.2 - MaxPoint Interactive, Inc. | a2222730zex-4_2.htm |
| EX-10.2 - EX-10.2 - MaxPoint Interactive, Inc. | a2222730zex-10_2.htm |
| EX-10.7 - EX-10.7 - MaxPoint Interactive, Inc. | a2222730zex-10_7.htm |
| EX-21.1 - EX-21.1 - MaxPoint Interactive, Inc. | a2222730zex-21_1.htm |
| EX-23.1 - EX-23.1 - MaxPoint Interactive, Inc. | a2222730zex-23_1.htm |
| EX-10.5 - EX-10.5 - MaxPoint Interactive, Inc. | a2222730zex-10_5.htm |
| EX-10.6 - EX-10.6 - MaxPoint Interactive, Inc. | a2222730zex-10_6.htm |
As filed with the Securities and Exchange Commission on February 3, 2015.
Registration No. 333-
UNITED STATES
SECURITIES AND EXCHANGE COMMISSION
Washington, D.C. 20549
Form S-1
REGISTRATION STATEMENT
Under
The Securities Act of 1933
MAXPOINT INTERACTIVE, INC.
(Exact Name of Registrant as Specified in its Charter)
| Delaware (State or Other Jurisdiction of Incorporation or Organization) |
7370 (Primary Standard Industrial Classification Code Number) |
20-5530657 (I.R.S. Employer Identification Number) |
MaxPoint Interactive, Inc.
3020 Carrington Mill Blvd., Suite 300
Morrisville, North Carolina 27560
(800) 916-9960
(Address, including zip code and telephone number, including area code, of registrant's principal executive offices)
Joseph Epperson
Chief Executive Officer
MaxPoint Interactive, Inc.
3020 Carrington Mill Blvd., Suite 300
Morrisville, North Carolina 27560
(800) 916-9960
(Name, address, including zip code and telephone number, including area code, of agent for service)
| Copies to: | ||||
Robert V. Gunderson, Jr., Esq. Glen R. Van Ligten, Esq. Richard C. Blake, Esq. Gunderson Dettmer Stough Villeneuve Franklin & Hachigian, LLP 1200 Seaport Blvd. Redwood City, California 94063 (650) 321-2400 |
Brad R. Schomber Chief Financial Officer MaxPoint Interactive, Inc. 3020 Carrington Mill Blvd., Suite 300 Morrisville, North Carolina 27560 (800) 916-9960 |
Mark G. Borden, Esq. Erika L. Robinson, Esq. Wilmer Cutler Pickering Hale and Dorr LLP 7 World Trade Center, 250 Greenwich Street New York, New York 10007 (212) 230-8800 |
||
Approximate date of commencement of proposed sale to the public:
As soon as practicable after the effective date of this Registration Statement.
If any of the securities being registered on this Form are to be offered on a delayed or continuous basis pursuant to Rule 415 under the Securities Act of 1933, check the following box. o
If this Form is filed to register additional securities for an offering pursuant to Rule 462(b) under the Securities Act, please check the following box and list the Securities Act registration statement number of the earlier effective registration statement for the same offering. o
If this Form is a post-effective amendment filed pursuant to Rule 462(c) under the Securities Act, check the following box and list the Securities Act registration statement number of the earlier effective registration statement for the same offering. o
If this Form is a post-effective amendment filed pursuant to Rule 462(d) under the Securities Act, check the following box and list the Securities Act registration statement number of the earlier effective registration statement for the same offering. o
Indicate by check mark whether the registrant is a large accelerated filer, an accelerated filer, a non-accelerated filer, or a smaller reporting company. See the definitions of "large accelerated filer," "accelerated filer" and "smaller reporting company" in Rule 12b-2 of the Exchange Act. (Check one):
| Large accelerated filer o | Accelerated filer o | Non-accelerated filer ý (Do not check if a smaller reporting company) |
Smaller reporting company o |
CALCULATION OF REGISTRATION FEE
|
||||
| Title of Each Class of Securities to be Registered |
Proposed Maximum Aggregate Offering Price(1)(2) |
Amount of Registration Fee |
||
|---|---|---|---|---|
Common Stock, $0.00005 par value |
$75,000,000 | $8,715 | ||
|
||||
- (1)
- Estimated pursuant to Rule 457(o) under the Securities Act of 1933, as amended.
- (2)
- Includes the aggregate offering price of additional shares that the underwriters have the option to purchase to cover over-allotments, if any.
The Registrant hereby amends this Registration Statement on such date or dates as may be necessary to delay its effective date until the Registrant shall file a further amendment which specifically states that this Registration Statement shall thereafter become effective in accordance with Section 8(a) of the Securities Act of 1933 or until the Registration Statement shall become effective on such date as the Commission, acting pursuant to such Section 8(a), may determine.
The information in this preliminary prospectus is not complete and may be changed. These securities may not be sold until the registration statement filed with the Securities and Exchange Commission is effective. This preliminary prospectus is not an offer to sell nor does it seek an offer to buy these securities in any jurisdiction where the offer or sale is not permitted.
Subject to Completion. Dated , 2015.
Shares

Common Stock
This is an initial public offering of shares of common stock of MaxPoint Interactive, Inc. All of the shares of common stock are being sold by us.
Prior to this offering, there has been no public market for the common stock. It is currently estimated that the initial public offering price per share will be between $ and $ . We are applying to list our common stock on the New York Stock Exchange under the symbol "MXPT."
We are an "emerging growth company" as that term is used in the Jumpstart Our Business Startups Act of 2012 and, as such, have elected to comply with certain reduced public company reporting requirements.
See "Risk Factors" on page 13 to read about factors you should consider before buying shares of the common stock.
Neither the Securities and Exchange Commission nor any other regulatory body has approved or disapproved of these securities or passed upon the accuracy or adequacy of this prospectus. Any representation to the contrary is a criminal offense.
| |
Per Share | Total | |||||
|---|---|---|---|---|---|---|---|
Initial public offering price |
$ | $ | |||||
Underwriting discount(1) |
$ | $ | |||||
Proceeds, before expenses, to MaxPoint |
$ | $ | |||||
- (1)
- See "Underwriting" for a description of the compensation payable to the underwriters.
To the extent that the underwriters sell more than shares of common stock, the underwriters have the option to purchase up to an additional shares from MaxPoint at the initial price to public less the underwriting discount.
The underwriters expect to deliver the shares against payment in New York, New York on , 2015.
| Goldman, Sachs & Co. | Deutsche Bank Securities | Pacific Crest Securities |
| Needham & Company | William Blair |
Prospectus dated , 2015.
TABLE OF CONTENTS
Neither we nor any of the underwriters have authorized anyone to provide any information or to make any representations other than those contained in this prospectus or in any free writing prospectuses we have prepared. We take no responsibility for, and can provide no assurance as to the reliability of, any other information that others may give you. We are offering to sell, and seeking offers to buy, shares of our common stock only in jurisdictions where offers and sales are permitted. The information in this prospectus is accurate only as of the date of this prospectus, regardless of the time of delivery of this prospectus or any sale of shares of our common stock. Our business, financial condition, results of operations and prospects may have changed since that date.
Through and including , 2015 (25 days after the commencement of this offering), all dealers that effect transactions in these securities, whether or not participating in this offering, may be required to deliver a prospectus. This delivery is in addition to a dealer's obligation to deliver a prospectus when acting as an underwriter and with respect to an unsold allotment or subscription.
For investors outside the United States: Neither we nor any of the underwriters have done anything that would permit this offering or possession or distribution of this prospectus in any jurisdiction where action for that purpose is required, other than in the United States. Persons outside the United States who come into possession of this prospectus must inform themselves about, and observe any restrictions relating to, the offering of the shares of our common stock and the distribution of this prospectus outside of the United States.
This summary highlights information contained elsewhere in this prospectus and does not contain all of the information that you should consider in making your investment decision. You should read the following summary together with the more detailed information appearing in this prospectus, including our consolidated financial statements and related notes, and in the sections titled "Risk Factors" and "Management's Discussion and Analysis of Financial Condition and Results of Operations," before deciding whether to purchase shares of our common stock. Unless the context otherwise requires, we use the terms "MaxPoint," the "company," "we," "us" and "our" in this prospectus to refer to MaxPoint Interactive, Inc. and its subsidiary.
Overview
MaxPoint provides a leading business intelligence and marketing automation software service, which we refer to as our solution, that enables national brands to drive local, in-store sales. National brands use our MaxPoint Intelligence Platform to predict the most likely local buyers of a specific product at a particular retail location and then execute cross-channel digital marketing campaigns to reach these buyers. Business intelligence is at the core of our solution, which leverages high-velocity data processing and proprietary statistical models to continuously analyze more than 10 billion daily data attributes to delineate consumers' real-time purchase intent. By identifying and reaching only the most likely local buyers with digital customized product offers for local stores, national brands can more efficiently and effectively run local marketing campaigns, thereby increasing in-store sales and reducing wasted marketing spend associated with traditional approaches. We provide a technology-driven alternative to traditional local marketing methods for national brands across a number of industries where transactions take place predominantly offline, such as consumer products, retail, automotive, healthcare, telecommunications and entertainment.
The primary marketing methods traditionally utilized to engage local consumers are print media, direct mail and radio. We believe these methods have become outdated as media consumption moves online and national brands increasingly seek digital solutions to make effective local marketing decisions to drive in-store sales. Approximately 88% of total U.S. retail purchases in 2014 occurred at physical locations, according to Euromonitor. The challenges associated with the promotion of local, in-store purchasing include predicting a consumer's purchase intent and matching that consumer with the appropriate local store that currently has the desired product in stock. We believe these challenges are more pronounced for national brands because they generally operate on a centralized or regional basis, which limits their visibility into the purchase intent of local consumers.
The MaxPoint Intelligence Platform is a software service that enables national brands to predict local demand based on consumers' purchase power and intent and manage customized digital advertisements containing in-store offers and promotions to reach consumers at a local level across display, mobile, social and video channels. The MaxPoint Intelligence Platform matches the most likely communities of local buyers with a specific product at a particular retail location within a given timeframe. Through marketing automation and direct integration with real-time bidding, or RTB, exchanges, our platform delivers customized digital advertisements containing product and store-specific promotions to local consumers. National brands can then measure the offline sales impact of those digital marketing campaigns to optimize future campaigns and budgets and manage in-store supply levels. We introduced the MaxPoint Intelligence Platform in 2011 as a service primarily run by us on behalf of our customers. Since 2013, our customers have also had the ability to directly interface with the MaxPoint Intelligence Platform software service.
The foundation for our local targeting is our proprietary Digital Zip architecture, a digital grid of households organized into over 44,000 specific neighborhoods, or Digital Zips, which can be as small as a couple of city blocks. Through a combination of our proprietary and third-party data, we
1
create a profile for each Digital Zip based on shared demographic and financial traits, such as family size, income level, education, age and historical purchasing behavior.
We use our consumer purchase intent model to determine which products consumers in a particular Digital Zip are most likely to purchase. Our consumer purchase intent model uses proprietary algorithms that take into account demographic and financial characteristics of potential consumers, historical purchase patterns of potential consumers and recent consumption of online media content by consumers, each aggregated at the Digital Zip level, which relate to targeted product characteristics or brand attributes. We analyze the aggregated consumption of online media content in each Digital Zip through the use of our proprietary search-based technology. This technology crawls, indexes and analyzes webpages around-the clock to interpret the meaning of text on webpages and catalogue each webpage by key topics. We then match the Digital Zips with the highest number of views of webpages that pertain to a key topic associated with a targeted product or product category. Based on these results, we can then match a targeted product offer to specific Digital Zips that exhibit an online behavior that correlates most strongly with the likely purchase of such products at the local level. We define "local," in terms of both retail locations and buyers or consumers, as the close proximity of a targeted consumer to a targeted retail location, typically within a specific Digital Zip.
Our diverse customer base consists primarily of enterprises with national brands in the consumer products, retail, automotive, healthcare, telecommunications and entertainment industries. We sell our solution either directly to our customers or through advertising agencies that act on behalf of our customers. We have worked with each of the top 20 leading national advertisers and each of the top 10 advertising agencies in the United States as ranked in 2014 by Advertising Age. As of September 30, 2014, we had 431 enterprise customers. We define an enterprise customer to be any customer from which we have generated more than $10,000 of revenue during any trailing twelve-month period. Our customers typically pay us on a cost per thousand impression, or CPM, model based on the number of impressions we deliver through our platform for each marketing campaign.
We generated revenue of $14.7 million, $35.1 million and $66.1 million for the years ended December 31, 2011, 2012 and 2013, respectively, representing year-over-year increases of 139% and 88%, respectively. We generated revenue of $41.8 million and $67.9 million for the nine months ended September 30, 2013 and 2014, respectively, representing a period-over-period increase of 62%. Revenue less traffic acquisition costs, which we refer to as Revenue ex-TAC, was $6.9 million, $18.6 million and $38.4 million for the years ended December 31, 2011, 2012 and 2013, respectively, representing year-over-year increases of 169% and 106%, respectively. Our Revenue ex-TAC was $24.7 million and $40.3 million for the nine months ended September 30, 2013 and 2014, respectively, representing a period-over-period increase of 63%. We recorded a net loss of $5.5 million, $6.8 million and $0.2 million for the years ended December 31, 2011, 2012 and 2013, respectively. We recorded a net loss of $1.4 million and $11.5 million for the nine months ended September 30, 2013 and 2014, respectively. Our Adjusted EBITDA was $(4.6) million, $(5.1) million and $2.6 million for the years ended December 31, 2011, 2012 and 2013, respectively. Our Adjusted EBITDA was $0.6 million and $(6.9) million for the nine months ended September 30, 2013 and 2014, respectively. Revenue ex-TAC and Adjusted EBITDA are financial measures not calculated in accordance with U.S. generally accepted accounting principles, or GAAP. Please refer to "—Summary Consolidated Financial Data" for information on Revenue ex-TAC and Adjusted EBITDA and for a reconciliation of Revenue ex-TAC to revenue and Adjusted EBITDA to net income (loss), respectively, the most directly comparable GAAP financial measures.
Industry Background
Despite the growth of e-commerce over the past decade, the vast majority of consumer purchases currently is and, in the foreseeable future, is expected to be made locally in physical
2
retail stores. Approximately 88% of total U.S. retail purchases in 2014 occurred at physical store locations, representing over $2 trillion of spending, and approximately 12% of total U.S. retail purchases occurred at non-physical store locations (including e-commerce), representing over $300 billion of spending, according to Euromonitor. We believe the vast majority of these retail purchases at physical store locations are made at retail stores in close proximity to the consumer's home. By 2019, retail purchases at physical retail store locations will continue to represent approximately 85%, or nearly $3 trillion, and retail purchases at non-physical store locations (including e-commerce) will represent approximately 15%, or approximately $500 billion, of total U.S. retail spending according to Euromonitor.
National brands employ a variety of offline and online local marketing channels in an effort to target and reach consumers to promote sales of their products at physical retail locations. According to BIA/Kelsey, the U.S. marketing industry spent approximately $137 billion in 2014 and is projected to spend approximately $159 billion in 2019 on local media marketing, which includes both traditional and digital forms of marketing.
- •
- Traditional Local Marketing. Local
marketing is still predominantly conducted through traditional marketing channels, which include television, newspaper, magazine and radio advertising, as well as mailers, free-standing inserts and
coupons. According to BIA/Kelsey, spending for traditional local marketing was approximately $106 billion in 2014 and is projected to be approximately $104 billion in 2019, which would
represent a decline from approximately 77% to approximately 65% of total local marketing spend during that period.
- •
- Online/Digital Local Marketing. As consumers continue to shift their media consumption online, national brands continue to increase their digital marketing efforts. According to BIA/Kelsey, digital local marketing spending was approximately $31 billion in 2014 and is projected to be approximately $55 billion in 2019, which would represent an increase from approximately 23% to approximately 35% of total local marketing spend during that period.
National brands seeking to drive in-store sales face the following challenges with current local marketing channels:
- •
- Limited ability to predict and target the most likely
buyers. Traditional marketing methods typically lack sophisticated technology while online methods generally rely on cookies that are not
optimized for local consumer targeting and are frequently deleted.
- •
- Limited ability to efficiently reach the most likely buyers at scale and at the right
time. Many traditional methods for local marketing have shrinking audiences and lack the ability to connect consumers to a particular
product. Also, as lead times of up to eight weeks are generally required to plan and execute marketing campaigns, national brands often miss opportunities to reach consumers at the point in time when
they desire to purchase a product.
- •
- Inability to capture and analyze massive amounts of unstructured and disparate data in real
time. Most local marketing methods are unable to programmatically capture, process and analyze in real time the massive amounts of
disparate data that reflect the current purchase intent of consumers and store-level supply of products.
- •
- Inability to measure and optimize local marketing based on in-store
sales. Both offline and online media typically lack measurement and attribution tools that, at the individual store level, demonstrate
return on investment for national brands and help them determine where to allocate marketing budgets.
- •
- Inability to automate offline methods of marketing. Traditional local marketing campaigns typically have long lead times, require a significant amount of effort to manage across multiple markets and involve numerous small media purchases across multiple channels and geographies.
3
The Benefits of Our Solution
Our solution presents significant benefits to our customers, including the ability to:
- •
- predict and target the most likely local buyers for specific products based on consumers' purchase intent in real time;
- •
- reach the most likely consumers of a product efficiently, at scale, and at the right time by programmatically delivering
targeted and timely advertisements to the most likely buyers;
- •
- capture and analyze massive amounts of unstructured and disparate data in real time using our integrated proprietary
software and customized hardware platform to make 450,000 decisions per second and run more than a thousand simultaneous campaigns;
- •
- measure the impact of local, online marketing campaigns on the in-store sales of specific locations; and
- •
- automate and streamline the execution of local marketing with minimal lead time and human intervention.
Our Competitive Strengths
We believe we have the following competitive strengths:
- •
- Pioneering solution with compelling value
proposition. Our proprietary, predictive business intelligence engine identifies, in real time, consumers likely to be receptive to our
customers' advertisements, thereby focusing marketing spend on the most efficient and effective channel.
- •
- Virtuous cycle of data
aggregation. As our business intelligence engine analyzes and makes millions of predictions about consumer intent, our solution learns from
each action, enabling us to programmatically improve our algorithms and the results we deliver to our customers.
- •
- Proprietary, data-driven understanding of consumer intent and
behavior. We have developed a proprietary business intelligence engine that predicts consumer purchase intent for products generally
purchased offline.
- •
- Deep relationships with national brands across key industries. Leading national brands trust us to help them automate and execute local marketing campaigns.
Our Growth Strategies
The core elements of our growth strategy include:
- •
- Increase share of spend from existing
customers. Our goal is to capture an increasing share of our existing customers' marketing budgets by working with more of their national
brands, growing the number of physical store locations of retailers through which they sell their products, and broadening the number of regions and geographies covered by our solution.
- •
- Acquire new customers. We believe
that many national brands can benefit from our proprietary, technology-driven local marketing solution, and we plan to invest in growing our sales organization and marketing efforts in order to reach
these potential customers.
- •
- Further penetrate new industries. Historically, we have focused primarily on serving national brands in three industries—consumer products, retail and automotive—and have recently expanded into three new industries—healthcare, telecommunications and entertainment. Our plan is to continue to penetrate these new industries and pursue opportunities in additional industries.
4
- •
- Continue to innovate and invest in our
technology. We plan to continue to make substantial investments in our technology and product development to enhance the effectiveness of
our solution in an effort to deliver increasing value to our customers.
- •
- Expand internationally. We believe that our technology and solution can be adapted to other countries where national brands face similar local marketing challenges. We recently established a presence in the United Kingdom and expect to explore additional international expansion opportunities.
Key Financial and Operating Performance Metrics
The following metrics aid us in developing and refining our growth strategies and making strategic decisions:
| |
Year Ended December 31, | Nine Months Ended September 30, |
||||||||||||||
|---|---|---|---|---|---|---|---|---|---|---|---|---|---|---|---|---|
| |
2011 | 2012 | 2013 | 2013 | 2014 | |||||||||||
| |
(in thousands, except number of enterprise customers) |
|||||||||||||||
Revenue |
$ | 14,679 | $ | 35,072 | $ | 66,068 | $ | 41,817 | $ | 67,864 | ||||||
Revenue ex-TAC |
$ | 6,917 | $ | 18,587 | $ | 38,356 | $ | 24,657 | $ | 40,312 | ||||||
Adjusted EBITDA |
$ | (4,648 | ) | $ | (5,116 | ) | $ | 2,631 | $ | 621 | $ | (6,859 | ) | |||
Number of enterprise customers |
106 | 225 | 304 | 292 | 431 | |||||||||||
- •
- Revenue ex-TAC is a non-GAAP financial measure defined by us as revenue less traffic acquisition costs, which consist of
purchases of advertising impressions from RTB exchanges. This metric is meaningful because it is frequently used for internal management purposes and combines the important factors of our ability to
sustain pricing with our customers, purchase inventory at reasonable and expected prices, and to scale our business. See "—Summary Consolidated Financial Data."
- •
- Adjusted EBITDA represents our net loss before income taxes, interest expense, and depreciation and amortization, adjusted
to eliminate stock-based compensation expense and the change in the fair value of convertible preferred stock warrant liability. We evaluate Adjusted EBITDA because we believe it provides a useful
measure for period-to-period comparisons of our core business. See "—Summary Consolidated Financial Data."
- •
- We believe our ability to attract new customers onto our MaxPoint Intelligence Platform is an important component of our growth strategy. We also believe that those customers from which we have generated more than $10,000 of revenue during any trailing twelve-month period best identifies customers that are actively using our solution and contribute more meaningfully to revenue. We refer to these customers as our enterprise customers. As of December 31, 2011, 2012 and 2013 and September 30, 2014, customers from which we have generated less than $10,000 of revenue during the previous trailing twelve-month period have accounted for less than 2% of our revenue.
Risks Related to Our Business
Our business is subject to numerous risks of which you should be aware before making an investment decision, described more fully in the "Risk Factors" section immediately following this prospectus summary. These risks represent challenges to the successful implementation of our strategy and to the growth and future profitability of our business. These risks include the following:
- •
- Our limited operating history makes it difficult to evaluate our business and prospects and may increase the risks
associated with your investment.
- •
- We have a history of losses, we expect our operating expenses to continue to increase substantially and we may not achieve or sustain profitability in the future.
5
- •
- If the MaxPoint Intelligence Platform does not accurately predict the most likely local buyers for specific products, we
could lose revenue, which would have a material adverse impact on our operating results and financial condition.
- •
- Our operating results fluctuate, which make our future results difficult to predict and could cause our operating results
to fall below analysts' and investors' expectations.
- •
- If we are unable to attract new customers or our existing customers do not allocate a greater portion of their marketing
spend to us, our revenue growth will be adversely affected.
- •
- If we fail to develop new solutions and services or enhance our existing solution and services, we may not attract and
retain customers, and our revenue and results of operations may decline.
- •
- If we do not manage our growth effectively, the quality of our solution may suffer, and our operating results may be
negatively affected.
- •
- We may not be able to compete successfully against current and future competitors, which may result in declining revenue
or inability to grow our business.
- •
- We have historically relied, and expect to continue to rely, on a small number of customers for a significant portion of
our revenue, and the loss of any of these customers may significantly harm our business, results of operations and financial condition.
- •
- We rely on advertising agencies that act on behalf of our customers for a substantial majority of our revenue. Multiple
advertising agencies operating within three global advertising networks represented numerous customers accounting for approximately 18%, 13% and 10% of our revenue, respectively, for the year ended
December 31, 2013. For the nine months ended September 30, 2014, multiple advertising agencies operating within one global advertising network represented numerous customers accounting
for approximately 15% of our revenue. The loss of any such relationships or increased competition from such advertising agencies or agency trading desks could materially harm our business.
- •
- Legislation and regulation of online businesses, including privacy and data protection regimes, could create unexpected
costs, subject us to enforcement actions for compliance failures or cause us to change our technology platform or business model, which may have a material adverse effect on our business.
- •
- Our ability to generate revenue depends on our collection of significant amounts of data from various sources.
Corporate Information
We were incorporated in the state of Delaware in September 2006. Our principal executive offices are located at 3020 Carrington Mill Blvd., Suite 300, Morrisville, North Carolina 27560. Our telephone number is (800) 916-9960. Our website address is www.maxpoint.com. Information contained on our website is not incorporated by reference into this prospectus, and you should not consider information contained on our website to be part of this prospectus or in deciding whether to purchase shares of our common stock.
MaxPoint, the MaxPoint logo, MaxPoint Interactive, Digital Zip and other trademarks or service marks of MaxPoint appearing in this prospectus are the property of MaxPoint. This prospectus contains additional trade names, trademarks and service marks of ours and of other companies. We do not intend our use or display of other companies' trade names, trademarks or service marks to imply a relationship with, or endorsement or sponsorship of us by, these other companies.
6
Common stock offered |
shares | |
Common stock to be outstanding after this offering |
shares |
|
Over-allotment option |
shares |
|
Use of proceeds |
We expect to receive net proceeds from this offering of approximately $ million, after deducting the underwriting discount and commissions and estimated offering expenses payable by us. We intend to use the net proceeds from this offering for general corporate purposes, including working capital, sales and marketing activities, engineering initiatives including enhancement of our solution, investment in technology and development and capital expenditures. We also may use a portion of the net proceeds from this offering to acquire or invest in technologies, solutions or businesses that complement our business, although we have no present commitments, and have not allocated specific amounts of net proceeds, to complete any such transactions or plans. See "Use of Proceeds." |
|
Risk factors |
You should read the "Risk Factors" section of this prospectus beginning on page 13 for a discussion of factors to consider carefully before deciding to invest in shares of our common stock. |
|
Proposed symbol |
"MXPT" |
The number of shares of our common stock to be outstanding after this offering is based on 37,689,073 shares of our common stock outstanding as of September 30, 2014, and excludes:
- •
- 6,695,951 shares of common stock issuable upon the exercise of options outstanding as of September 30, 2014 under
our 2010 Equity Incentive Plan, with a weighted average exercise price of $3.23 per share;
- •
- 990,850 shares of common stock issuable upon the exercise of options granted after September 30, 2014 under our
2010 Equity Incentive Plan, with a weighted average exercise price of $7.27 per share;
- •
- 200,000 shares of common stock issuable upon the exercise of lender warrants outstanding as of September 30, 2014
with an exercise price of $5.68 per share;
- •
- 100,000 shares of common stock issuable upon the exercise of lender warrants outstanding issued after September 30, 2014
with an exercise price of $5.68 per share; and
- •
- shares of our common stock reserved for future issuance under our equity compensation plans, consisting of 974,894 shares of our common stock that were reserved for issuance under our 2010 Equity Incentive Plan as of September 30, 2014, and shares of our common stock reserved for issuance under our 2015 Equity Incentive Plan. On
7
the date immediately prior to the date of this prospectus, any remaining shares available for issuance under our 2010 Equity Incentive Plan were added to the shares reserved under our 2015 Equity Incentive Plan and we ceased granting awards under the 2010 Equity Incentive Plan. Our 2015 Equity Incentive Plan also provides for automatic annual increases in the number of shares reserved thereunder, as more fully described in "Executive Compensation—Equity Plans."
Except as otherwise indicated, all information in this prospectus assumes:
- •
- the effectiveness of our amended and restated certificate of incorporation and the adoption of our amended and restated
bylaws in connection with the completion of this offering;
- •
- the automatic conversion of our outstanding convertible preferred stock into an aggregate of 29,697,650 shares of our
common stock, the conversion of which will occur immediately prior to the completion of this offering;
- •
- no exercise of outstanding options described above; and
- •
- no exercise by the underwriters of their right to purchase up to an additional shares of common stock to cover over-allotments.
8
Summary Consolidated Financial Data
The following tables summarize our consolidated financial data. You should read this summary consolidated financial data together with the sections entitled "Selected Consolidated Financial Data," "Management's Discussion and Analysis of Financial Condition and Results of Operations" and our consolidated financial statements and related notes that are included elsewhere in this prospectus.
The consolidated statements of operations data for the years ended December 31, 2011, 2012 and 2013, and the consolidated balance sheet data as of December 31, 2011, 2012 and 2013 are derived from our audited consolidated financial statements that are included elsewhere in this prospectus. The condensed consolidated statements of operations data for the nine months ended September 30, 2013 and 2014 and the condensed consolidated balance sheet data as of September 30, 2014 are derived from our unaudited consolidated financial statements that are included elsewhere in this prospectus. The unaudited consolidated financial statements were prepared on a basis consistent with our audited consolidated financial statements and include, in management's opinion, all adjustments, consisting only of normal recurring adjustments that we consider necessary for a fair presentation of the financial information set forth in those statements. Our historical results are not necessarily indicative of the results that may be expected in the future, and our interim results are not necessarily indicative of the results to be expected for the full year or any other period.
| |
Year Ended December 31, | Nine Months Ended September 30, |
||||||||||||||
|---|---|---|---|---|---|---|---|---|---|---|---|---|---|---|---|---|
| |
2011 | 2012 | 2013 | 2013 | 2014 | |||||||||||
| |
(in thousands, except share and per share data) |
|||||||||||||||
Consolidated Statements of Operations Data: |
||||||||||||||||
Revenue |
$ | 14,679 | $ | 35,072 | $ | 66,068 | $ | 41,817 | $ | 67,864 | ||||||
Traffic acquisition costs |
7,762 | 16,485 | 27,712 | 17,160 | 27,552 | |||||||||||
Other cost of revenue |
1,295 | 2,982 | 3,904 | 2,721 | 5,360 | |||||||||||
| | | | | | | | | | | | | | | | | |
Gross profit |
5,622 | 15,605 | 34,452 | 21,936 | 34,952 | |||||||||||
Operating expenses: |
||||||||||||||||
Sales and marketing |
6,325 | 12,938 | 20,475 | 13,771 | 26,905 | |||||||||||
Research and development |
2,555 | 5,376 | 8,666 | 6,014 | 10,102 | |||||||||||
General and administrative |
2,117 | 4,043 | 5,217 | 3,342 | 8,440 | |||||||||||
| | | | | | | | | | | | | | | | | |
Total operating expenses |
10,997 | 22,357 | 34,358 | 23,127 | 45,447 | |||||||||||
(Loss) income from operations |
(5,375 | ) | (6,752 | ) | 94 | (1,191 | ) | (10,495 | ) | |||||||
Other expense (income): |
||||||||||||||||
Interest expense |
88 | 27 | 283 | 187 | 1,005 | |||||||||||
Other expense (income) |
31 | (19 | ) | (2 | ) | (2 | ) | (2 | ) | |||||||
| | | | | | | | | | | | | | | | | |
Total other expense (income) |
119 | 8 | 281 | 185 | 1,003 | |||||||||||
Loss before income taxes |
(5,494 | ) | (6,760 | ) | (187 | ) | (1,376 | ) | (11,498 | ) | ||||||
Provision for income taxes |
— | — | — | — | — | |||||||||||
| | | | | | | | | | | | | | | | | |
Net loss |
$ | (5,494 | ) | $ | (6,760 | ) | $ | (187 | ) | $ | (1,376 | ) | $ | (11,498 | ) | |
| | | | | | | | | | | | | | | | | |
| | | | | | | | | | | | | | | | | |
Net loss per share of common stock—basic and diluted |
$ | (1.11 | ) | $ | (1.07 | ) | $ | (0.03 | ) | $ | (0.19 | ) | $ | (1.49 | ) | |
| | | | | | | | | | | | | | | | | |
| | | | | | | | | | | | | | | | | |
Pro forma net loss per share of common stock—basic and diluted(1): |
$ | (0.01 | ) | $ | (0.31 | ) | ||||||||||
| | | | | | | | | | | | | | | | | |
| | | | | | | | | | | | | | | | | |
Weighted average shares of common stock used in computing net loss per share—basic and diluted |
4,965,155 |
6,340,942 |
7,417,068 |
7,398,718 |
7,737,968 |
|||||||||||
| | | | | | | | | | | | | | | | | |
| | | | | | | | | | | | | | | | | |
Weighted average shares of common stock used in computing pro forma net loss per share—basic and diluted(1): |
37,114,718 | 37,435,618 | ||||||||||||||
| | | | | | | | | | | | | | | | | |
| | | | | | | | | | | | | | | | | |
9
| |
Year Ended December 31, | Nine Months Ended September 30, |
||||||||||||||
|---|---|---|---|---|---|---|---|---|---|---|---|---|---|---|---|---|
| |
2011 | 2012 | 2013 | 2013 | 2014 | |||||||||||
| |
(in thousands) |
|||||||||||||||
Stock-based compensation expense included above: |
||||||||||||||||
Other cost of revenue |
$ | 1 | $ | 2 | $ | 6 | $ | 4 | $ | 11 | ||||||
Sales and marketing |
32 | 137 | 212 | 152 | 331 | |||||||||||
Research and development |
21 | 155 | 276 | 188 | 461 | |||||||||||
General and administrative |
230 | 259 | 85 | 64 | 651 | |||||||||||
Other financial data: |
||||||||||||||||
Revenue ex-TAC(2) |
$ | 6,917 | $ | 18,587 | $ | 38,356 | $ | 24,657 | $ | 40,312 | ||||||
Adjusted EBITDA(3) |
$ | (4,648 | ) | $ | (5,116 | ) | $ | 2,631 | $ | 621 | $ | (6,859 | ) | |||
- (1)
- Pro forma basic and diluted net loss per share of common stock have been calculated assuming the conversion of all outstanding shares of convertible preferred stock into 29,697,650 shares of common stock as of the beginning of the applicable period or at the time of issuance, if later.
- (2)
- Revenue ex-TAC is not a financial measure prepared in accordance with GAAP. We define Revenue ex-TAC as revenue less traffic acquisition costs. Traffic acquisition costs consist of purchases of advertising impressions from RTB exchanges on a CPM basis. See "—Non-GAAP Financial Measures" for more information and for a reconciliation of Revenue ex-TAC to revenue, the most directly comparable financial measure calculated in accordance with GAAP.
- (3)
- Adjusted EBITDA is not a financial measure prepared in accordance with GAAP. We define Adjusted EBITDA as net loss before income taxes, interest expense, and depreciation and amortization, adjusted to eliminate stock-based compensation expense and change in fair value of convertible preferred stock warrant liability. See "—Non-GAAP Financial Measures" for more information and for a reconciliation of Adjusted EBITDA to net loss, the most directly comparable financial measure calculated in accordance with GAAP.
| |
As of September 30, 2014 | |||||||||
|---|---|---|---|---|---|---|---|---|---|---|
| |
Actual | Pro forma(1) | Pro forma as adjusted(2) |
|||||||
| |
(in thousands) |
|||||||||
Consolidated Balance Sheet Data: |
||||||||||
Cash and cash equivalents |
$ | 12,480 | $ | 12,480 | $ | |||||
Accounts receivable, net |
29,443 | 29,443 | ||||||||
Working capital |
22,586 | 22,586 | ||||||||
Total assets |
54,702 | 54,702 | ||||||||
Long-term debt, net |
30,862 | 30,862 | ||||||||
Total liabilities |
52,645 | 52,645 | ||||||||
Total convertible preferred stock |
25,476 | — | ||||||||
Total stockholders' (deficit) equity |
(23,419 | ) | 2,057 | |||||||
- (1)
- The pro forma column reflects the conversion of all outstanding shares of convertible preferred stock into 29,697,650 shares of common stock immediately prior to the closing of this offering.
- (2)
- The pro forma as adjusted column reflects the pro forma adjustment described in footnote (1) above and the sale by us of shares of common stock in this offering at an assumed initial public offering price of $ per share, the midpoint of the price range set forth on the cover page of this prospectus, after deducting the underwriting discount and commissions and estimated offering expenses payable by us. A $1.00 increase (decrease) in the assumed initial public offering price of $ per share would increase (decrease) each of pro forma as adjusted cash and cash equivalents, working capital and total assets by $ and decrease (increase) pro forma as adjusted total stockholders' (deficit) equity by approximately $ , assuming the number of shares we are offering, as set forth on the cover page of this prospectus, remains the same, after deducting the underwriting discount and commissions and estimated offering expenses payable by us. The pro forma as adjusted information is illustrative only, and we will adjust this information based on the actual initial public offering price, number of shares offered and other terms of this offering determined at pricing.
10
Non-GAAP Financial Measures
Revenue ex-TAC
We believe that Revenue ex-TAC is a meaningful measure of operating performance because it is frequently used for internal management purposes, indicates the effectiveness of delivering results to advertisers and facilitates a more complete period-to-period understanding of factors and trends affecting our underlying revenue performance. A limitation of Revenue ex-TAC is that it is a measure that other companies, including companies in our industry that have similar business arrangements, either may not use or may calculate differently, which reduces its usefulness as a comparative measure. Because of these and other limitations, we consider, and you should consider, Revenue ex-TAC alongside other GAAP financial measures, such as revenue, gross profit and total operating expenses. The following table presents a reconciliation of Revenue ex-TAC to revenue for each of the periods indicated:
| |
Year Ended December 31, | Nine Months Ended September 30, |
||||||||||||||
|---|---|---|---|---|---|---|---|---|---|---|---|---|---|---|---|---|
| |
2011 | 2012 | 2013 | 2013 | 2014 | |||||||||||
| |
(in thousands) |
|||||||||||||||
Revenue |
$ | 14,679 | $ | 35,072 | $ | 66,068 | $ | 41,817 | $ | 67,864 | ||||||
Less: traffic acquisition costs |
(7,762 | ) | (16,485 | ) | (27,712 | ) | (17,160 | ) | (27,552 | ) | ||||||
| | | | | | | | | | | | | | | | | |
Revenue ex-TAC |
$ | 6,917 | $ | 18,587 | $ | 38,356 | $ | 24,657 | $ | 40,312 | ||||||
| | | | | | | | | | | | | | | | | |
| | | | | | | | | | | | | | | | | |
Adjusted EBITDA
We have included Adjusted EBITDA in this prospectus because it is a key measure used by our management and board of directors to understand and evaluate our core operating performance and trends, to prepare and approve our annual budget and to develop short- and long-term operating plans. In particular, we believe the exclusion of certain items in calculating Adjusted EBITDA can provide a useful measure for period-to-period comparisons of our business. Accordingly, we believe that Adjusted EBITDA provides useful information to investors in understanding and evaluating our operating results.
Our use of Adjusted EBITDA has limitations as an analytical tool, and you should not consider it in isolation or as a substitute for analysis of our results as reported under GAAP. Some of these limitations are:
- •
- although depreciation and amortization are non-cash charges, the assets being depreciated and amortized may have to be
replaced in the future, and Adjusted EBITDA does not reflect cash capital expenditure requirements for such replacements or for new capital expenditure requirements;
- •
- Adjusted EBITDA does not reflect changes in, or cash requirements for, our working capital needs;
- •
- Adjusted EBITDA does not reflect the potentially dilutive impact of equity-based compensation;
- •
- Adjusted EBITDA does not reflect interest or tax payments that may represent a reduction in cash available to us; and
- •
- other companies, including companies in our industry, may calculate Adjusted EBITDA differently, which reduces its usefulness as a comparative measure.
11
Because of these and other limitations, we consider, and you should consider, Adjusted EBITDA together with other GAAP-based financial performance measures, including various cash flow metrics, net loss and our other GAAP results. The following table presents a reconciliation of net loss to Adjusted EBITDA for each of the periods indicated:
| |
Year Ended December 31, | Nine Months Ended September 30, |
||||||||||||||
|---|---|---|---|---|---|---|---|---|---|---|---|---|---|---|---|---|
| |
2011 | 2012 | 2013 | 2013 | 2014 | |||||||||||
| |
(in thousands) |
|||||||||||||||
Net loss |
$ | (5,494 | ) | $ | (6,760 | ) | $ | (187 | ) | $ | (1,376 | ) | $ | (11,498 | ) | |
Adjustments: |
||||||||||||||||
Interest expense |
88 | 27 | 283 | 187 | 1,005 | |||||||||||
Provision for income taxes |
— | — | — | — | — | |||||||||||
Depreciation and amortization |
443 | 1,063 | 1,956 | 1,402 | 2,180 | |||||||||||
Stock-based compensation |
284 | 553 | 579 | 408 | 1,454 | |||||||||||
Change in fair value of warrant to purchase Series A convertible preferred stock |
31 | 1 | — | — | — | |||||||||||
| | | | | | | | | | | | | | | | | |
Adjusted EBITDA |
$ | (4,648 | ) | $ | (5,116 | ) | $ | 2,631 | $ | 621 | $ | (6,859 | ) | |||
| | | | | | | | | | | | | | | | | |
| | | | | | | | | | | | | | | | | |
12
Investing in our common stock involves a high degree of risk. You should consider carefully the risks and uncertainties described below, together with all of the other information in this prospectus, including the section titled "Management's Discussion and Analysis of Financial Condition and Results of Operations" and our consolidated financial statements and related notes, before deciding whether to purchase shares of our common stock. If any of the following risks actually occurs, our business, financial condition, results of operations and prospects could be materially and adversely affected. In that event, the price of our common stock could decline and you could lose part or all of your investment.
Risks Related to Our Business and Industry
Our limited operating history makes it difficult to evaluate our business and prospects and may increase the risks associated with your investment.
We commenced operations in 2006 and, as a result, have only a limited operating history upon which our business and future prospects may be evaluated. Although we have experienced substantial revenue growth in recent years, we may not be able to sustain this rate of growth or even maintain our current revenue levels. We have encountered and will continue to encounter risks and difficulties frequently experienced by growing companies in rapidly developing and changing industries. Our and our business prospects will depend in large part on our ability to:
- •
- build a reputation for a superior solution and create trust and long-term relationships with customers and advertising
agencies;
- •
- distinguish ourselves from competitors in our industry;
- •
- develop and offer a competitive technology platform and offerings that meet our customers' evolving needs;
- •
- maintain and expand our relationships with the real-time bidding, or RTB, exchanges through which we execute our
customers' digital marketing campaigns;
- •
- respond to evolving industry standards and government regulations that impact our business, particularly in the areas of
data collection and consumer privacy;
- •
- prevent or otherwise mitigate failures or breaches of security or privacy;
- •
- expand our business internationally; and
- •
- attract, hire, integrate and retain qualified and motivated employees.
We may need to adapt our current operations to scale our business and achieve long-term profitability. If we are unable to meet one or more of these objectives or fail to implement these changes effectively and on a timely basis, or if we are unable to implement them at all, our revenue may decline, we may not be able to achieve further growth or long-term profitability and our business may suffer.
We have a history of losses, we expect our operating expenses to continue to increase substantially and we may not achieve or sustain profitability in the future.
We incurred net losses of $5.5 million, $6.8 million and $0.2 million in 2011, 2012 and 2013, respectively, and a net loss of $11.5 million for the nine months ended September 30, 2014. As of September 30, 2014, we had an accumulated deficit of $27.4 million. Although our revenue has increased significantly in recent periods, we may not be able to achieve or sustain profitability or this revenue growth rate. In addition, our operating expenses have increased with our revenue
13
growth and we expect our traffic acquisition costs and operating expenses to continue to increase substantially as we expand our business, including adding sales, marketing and related support employees in existing and new territories, engineering employees to support continued investments in our technology platform and general and administrative employees to support our growth and expansion as well as our transition to being a public company. If we do not achieve and sustain profitability, our revenue growth rate declines or our expenses exceed expectations, our financial performance will be adversely affected.
If the MaxPoint Intelligence Platform does not accurately predict the most likely local buyers for specific products, we could lose revenue, which would have a material adverse impact on our operating results and financial condition.
Our solution depends on the ability of the MaxPoint Intelligence Platform to accurately predict the most likely communities of local buyers for specific products and to serve advertisements for those products to those communities. We do not have long-term commitments from our customers and it is relatively easy for our customers or the advertising agencies acting on their behalf to seek alternative providers of digital marketing solutions, as there are no significant switching costs. Thus, we must continuously deliver satisfactory results for our customers to maintain and increase revenue, which depends in part on the continued performance of the MaxPoint Intelligence Platform. Our failure to continuously innovate and improve on the algorithms underlying the MaxPoint Intelligence Platform could result in poor performance, which could in turn result in our customers ceasing to use our solution, which would have a material adverse impact on our operating results and financial condition.
Our operating results fluctuate, which make our future results difficult to predict and could cause our operating results to fall below analysts' and investors' expectations.
Our quarterly and annual operating results have fluctuated in the past, and we expect this to continue for the foreseeable future. These fluctuations could cause our performance to fall below the expectations of securities analysts and investors, and adversely affect the price of our common stock. Because our business is evolving rapidly, our historical operating results may not be useful in predicting our future operating results. Factors that may increase the volatility of our operating results include the factors set forth in this "Risk Factors" section, as well as the following:
- •
- changes in the economic prospects of our customers or the economy generally, which could alter current or prospective
customers' spending priorities, or increase the time or costs required to complete sales;
- •
- changes in demand for and pricing of our MaxPoint Intelligence Platform;
- •
- the impact of macroeconomic factors and seasonality on our customers' businesses and budgets for digital marketing
campaigns, particularly our consumer product and retail customers;
- •
- unpredictable sales cycles;
- •
- changes in our pricing policies, or the pricing policies of our competitors, RTB exchanges or other third-party service
providers;
- •
- the addition or loss of customers;
- •
- the growth or reduction of business with current customers or advertising agencies that act on their behalf;
14
- •
- changes in our customers' advertising budget allocations, agency affiliations or marketing strategies;
- •
- changes and uncertainty in the regulatory environment for us or our customers;
- •
- changes in the availability of media inventory through RTB exchanges;
- •
- the introduction of new technologies, products or service offerings by our competitors;
- •
- changes in our operating expenses and capital expenditures; and
- •
- costs related to acquisitions of people, businesses or technologies.
Based upon all of the factors described above, many of which are beyond our control, and others that we may not anticipate, we have a limited ability to forecast our future revenue, costs and expenses, and as a result, our operating results may fall below our estimates or the expectations of securities analysts and investors.
If we are unable to attract new customers or our existing customers do not allocate a greater portion of their marketing spend to us, our revenue growth will be adversely affected.
To sustain or increase our revenue, we must add new customers and encourage existing customers to allocate a greater portion of their marketing spend to us. As the digital advertising industry matures and competitors introduce lower cost or differentiated products or services, our ability to sell our solution could be impaired. Even after a successful digital marketing campaign or series of campaigns with an existing customer, we frequently must compete to win further business from that customer. We may reach a point of saturation where we cannot continue to grow our revenue from existing customers because of, among other things, internal limits that they may place on their advertising budgets for digital media, particular digital marketing campaigns, local advertising or a particular provider. If we are unable to attract new customers or obtain new business from existing customers, our revenue, growth and business will be adversely affected.
If we fail to develop new solutions and services or enhance our existing solution and services, we may not attract and retain customers, and our revenue and results of operations may decline.
We compete for customers that want to execute digital marketing campaigns. Our industry is subject to rapid changes in standards, technologies, products and service offerings, as well as advertiser expectations. We continuously need to develop new solutions and services and enhance our existing solution and services to meet advertiser demands and respond to industry changes. New customer demands, superior competitive offerings or new industry standards could render our existing solution unattractive, unmarketable or obsolete and require us to make substantial changes to our technology platform or business model. Our failure to adapt to a rapidly changing market or to anticipate customer demand could harm our business and our financial performance.
If we do not manage our growth effectively, the quality of our solution may suffer, and our operating results may be negatively affected.
We continue to experience rapid growth in our headcount and operations, which will continue to place significant demands on our management, operational and financial infrastructure. To manage our growth effectively, we must continue to improve and expand our infrastructure, including our IT systems, financial and administrative systems and controls. We must also continue to manage our employees, operations, finances, research and development and capital investments efficiently. Our productivity and the quality of our solution may be adversely affected if we do not integrate and train our new employees, particularly our sales and account management personnel,
15
quickly and effectively. If we continue our rapid growth, we may incur significant additional expenses, and our growth may continue to strain our management, resources, infrastructure and ability to maintain the quality of our solution. If the current and future members of our management team do not effectively scale with our growth, the quality of our solution may suffer and our corporate culture may be harmed. Failure to manage our future growth effectively could cause our business to suffer, which, in turn, could have an adverse impact on our results of operations and financial condition.
We may not be able to compete successfully against current and future competitors, which may result in declining revenue or inability to grow our business.
Competition for our customers' advertising budgets is intense, and we expect competition to increase in the future with more advertising occurring online. Our principal competition includes traditional advertising and direct marketing companies, such as Gannett Company, Inc., The McClatchey Company, News America Marketing, Valassis Communications, Inc. and Valpak Direct Marketing Systems, Inc. In addition, we compete or may compete with:
- •
- companies that offer demand-side platforms that allow customers to purchase inventory directly from RTB exchanges or other
third parties;
- •
- advertising networks and advertising agencies;
- •
- traditional advertising channels, such as television, radio and print;
- •
- services offered through large online portals, such as Yahoo! Inc. and Google Inc.;
- •
- companies providing online search advertising, for which we do not offer a solution;
and
- •
- technology companies providing online marketing platforms focused on local businesses.
Many current and potential competitors have advantages, such as longer operating histories, greater name recognition, larger customer bases, greater access to media inventory, more access to Internet user data and significantly greater financial, technical, sales and marketing resources. Increased competition may result in reduced pricing for our solution, longer sales cycles or a decrease of our market share, any of which could negatively affect our revenue and future operating results and our ability to grow our business.
We have historically relied, and expect to continue to rely, on a small number of customers for a substantial majority of our revenue, and the loss of any of these customers may significantly harm our business, results of operations and financial condition.
Our customers are primarily enterprises with national brands in a number of industries. We sell our solution either directly to our customers or through advertising agencies that act on behalf of our customers. A relatively small number of customers have historically accounted for a substantial majority of our revenue. For the years ended December 31, 2011, 2012 and 2013, our top ten customers accounted for approximately 57%, 31% and 36% of our revenue, respectively. For the year ended December 31, 2011, one customer accounted for approximately 28% of our revenue, and for the years ended December 31, 2012 and 2013, no single customer represented more than 10% of our revenue. For the nine months ended September 30, 2014, no single customer represented more than 10% of our revenue. We expect that we will continue to depend upon a relatively small number of customers for a substantial majority of our revenue for the foreseeable future while we continue to broaden our customer base. As a result, if we fail to successfully attract or retain customers, or if existing customers reduce or delay their marketing spend with us, our business, results of operations and financial condition would be harmed. Moreover, a significant portion of our customers' products are purchased at a limited number of large national retailers.
16
Any material decline in these customers' sales at the physical retail locations of these large national retailers may adversely impact our business.
We rely on advertising agencies that act on behalf of our customers for a substantial majority of our revenue. The loss of any such relationships or increased competition from such advertising agencies or agency trading desks could materially harm our business.
We rely on advertising agencies that act on behalf of our customers for a substantial majority of our revenue. Multiple advertising agencies operating within three global advertising networks represented numerous customers accounting for approximately 18%, 13% and 10% of our revenue, respectively, for the year ended December 31, 2013. For the nine months ended September 30, 2014, multiple advertising agencies operating within one global advertising network represented numerous customers accounting for approximately 15% of our revenue. In addition, for reasons specific to individual agencies, some agencies may not recommend us to the national brands they represent, even if our solution is more effective than alternative solutions. Certain of those agencies are creating their own competitive solutions, referred to as agency trading desks. If the agency trading desks are successful in leveraging agency relationships with our customers, we may be unable to compete successfully even if our solution is more effective.
Potential "Do Not Track" standards or government regulation could negatively impact our business by limiting our access to the anonymous user data that the MaxPoint Intelligence Platform uses to predict local purchase demand and execute the digital marketing campaigns we run, and as a result may degrade our performance for our customers, which, in turn, may have a material adverse effect on our business.
As the use of cookies and other tracking mechanisms has received ongoing media attention, and some government regulators and privacy advocates have suggested creating a "Do Not Track" standard that would allow Internet users to express a preference, independent of cookie settings in their browser, not to have website browsing recorded. In 2010, the Federal Trade Commission, or FTC, issued a staff report criticizing the advertising industry's self-regulatory efforts as too slow and lacking adequate consumer protections. The FTC emphasized a need for simplified notice, choice and transparency to consumers regarding collection, use and sharing of data, and it suggested implementing a "Do Not Track" browser setting that allows consumers to choose whether to allow "tracking" of their online browsing activities. For example, in a 2012 report, the FTC encouraged continued improvements in consumer choice with respect to behavioral advertising and full implementation of a "Do Not Track" mechanism. All of the major Internet browsers have implemented some version of a "Do Not Track" setting. Microsoft's Internet Explorer 10 includes a "Do Not Track" setting that is selected by default. However, there is no definition of "tracking," no clarity as to the specific technologies or practices that would be affected, no consensus regarding what message is conveyed by a "Do Not Track" setting and no industry standards regarding how to respond to a "Do Not Track" preference. The World Wide Web Consortium chartered a "Tracking Protection Working Group" in 2011 to convene a multi-stakeholder group of academics, thought leaders, companies, industry groups and consumer advocacy organizations, to create a voluntary "Do Not Track" standard for the web. The group has yet to agree upon a standard. The FTC has stated that it will pursue a legislative solution if the industry cannot agree upon a standard. The "Do-Not-Track Online Act of 2013" was introduced in the United States Senate in February 2013, and similar legislation has been and could be introduced at the federal and state levels. If a "Do Not Track" browser setting is adopted by many Internet users, and the standard either imposed by state or federal legislation, or agreed upon by standard setting groups, prohibits us from using non-personal data as we currently do, then that could hinder growth of advertising and content production on the web generally, cause us to change our business practices and have a material adverse effect on our business.
17
Furthermore, in the European Union, or E.U., Directive 2009/136/EC, commonly referred to as the "Cookie Directive," directs E.U. member states to ensure that accessing information on an Internet user's computer, such as through a cookie or other tracking mechanism, is allowed only if the Internet user has given his or her consent. In response, member states have adopted and implemented, and may continue to adopt and implement further legislation that negatively impacts the use of cookies and other tracking mechanisms for online advertising. Limitations on the use or effectiveness of cookies, whether imposed by E.U. member state implementation of the Cookie Directive or otherwise, may impact the performance of our solution, cause us to change our business practices and have an adverse effect on our business.
Legislation and regulation of online businesses, including privacy and data protection regimes, could create unexpected costs, subject us to enforcement actions for compliance failures, or cause us to change our technology platform or business model, which may have a material adverse effect on our business.
Legislation and government regulation, including laws and regulations that limit our ability to collect and analyze the data we use in our MaxPoint Intelligence Platform, could adversely affect our business and operating results. U.S. and foreign governments have enacted or are considering legislation related to online advertising, and we expect to see an increase in legislation and regulation related to advertising online, the use of geolocation data to inform advertising, the collection and use of anonymous Internet user data and unique device or other identifiers (such as IP addresses or mobile device identifiers), and other data protection and privacy regulation. Such legislation or regulation could affect the costs of doing business online, and may adversely affect the demand for our solution or otherwise harm our business, results of operations, and financial condition. For example, a wide variety of provincial, state, national, and international laws and regulations apply to the collection, use, retention, protection, disclosure, transfer, and other processing of personal data. While we do not collect data that traditionally has been considered personal data by U.S. regulators (such as name, email address, address, phone numbers, social security numbers, credit card numbers or individualized financial or health data), we typically do collect and store IP addresses, device identifiers, geolocation information, cookie data and other data that are or may be considered personal data in some jurisdictions or otherwise may be the subject of legislation or regulation. Evolving and changing definitions of personal data, within the European Union, the United States, and elsewhere, especially relating to classification of IP addresses, machine or device identifiers, location data, and other information, have in the past, and may cause us in the future, to change our business practices, or may limit or inhibit our ability to operate or expand our business. Similarly, the law is unsettled concerning the definition and permissible uses of "sensitive" data, including with respect to certain financial, geolocation and health data. Regulators and legislators have proposed additional limitations on the collection and use of such data, which could have a material adverse effect on our business. More generally, data protection and privacy-related laws and regulations are evolving and may result in ever-increasing regulatory and public scrutiny and escalating levels of enforcement and sanctions.
In addition, data security is of increasing concern to U.S., state and foreign regulators and, as a result, the legal standards for data security and the consequences for violating those standards continue to evolve. And the threat posed by cyber-attacks and data breaches continues to grow. While we take measures to protect the security of information that we collect, use, and disclose in the operation of our business, and to offer certain privacy protections with respect to such information, such measures may not always be effective. In addition, while we take steps to avoid collecting personally identifiable data about consumers, we may inadvertently receive this information from customers or from the advertising agencies that act on their behalf or through the process of delivering advertising.
18
In the United States, our privacy, data security and handling practices are subject to regulation at both the federal and state level, and the FTC and many states actively enforce against unfair and deceptive trade practices, including the violation of privacy policies and representations. Outside of the United States, our privacy and data handling practices are subject to regulation by data protection authorities and other regulators in the countries in which we do business. Our failure to comply with applicable laws and regulations concerning privacy or data security, or to protect personal data, could result in enforcement action against us, including fines, imprisonment of our officers, and public censure; claims for damages by consumers and other affected individuals; damage to our reputation; and loss of goodwill, any of which could have a material adverse impact on our results of operations, financial performance, and business. Moreover, even the perception of privacy or security concerns, whether or not valid, may harm our reputation and inhibit adoption of our solution by current and future customers or the advertising agencies that act on their behalf.
Our ability to generate revenue depends on our collection of significant amounts of data from various sources.
Our ability to deliver our business intelligence and marketing automation software solution depends on our ability to successfully leverage significant amounts of data, including data that we collect from our customers and acquire from third parties, as well as raw data captured by our proprietary consumer purchase intent model. The foundation of our local targeting is our proprietary Digital Zip architecture, a digital grid of households organized into over 44,000 specific neighborhoods, or Digital Zips. We create a profile for each Digital Zip by using third party data and proprietary data captured by our consumer purchase intent model, including IP addresses and consumer online browsing data, and any limit to our access or use of these types of data could impact our ability to match the most likely community of local buyers with specific products, which could have an adverse effect on our ability to successfully execute our customers' digital marketing campaigns on a real-time basis. Our customers often share with us enterprise data, such as point of sale and spending information, and certain customers provide us with supply chain management and customer relationship management, or CRM, data. If our enterprise customers do not share their data, our ability to scale and provide our solution could be adversely affected. In addition, our ability to successfully leverage vast amounts of data is dependent upon our continued ability to access and utilize up-to-date data. Our ability to access and use such data could be restricted by a number of factors, including consumer choice, restrictions imposed by our customers, changes in technology and new developments in laws, regulations and industry standards. If the data we utilize is out-of-date or stale, our predictions, recommendations and business intelligence will be ineffective and our reputation will suffer. Further, we sometimes use cookies and other tracking mechanisms to deliver our solution, and certain web browsers, including Safari, currently block or are planning to block some or all third-party cookies by default. As a result, we could be blocked from serving advertisements on the basis of cookies to users that utilize web browsers that block third-party cookies. Any limitation on our ability to collect data would make it more difficult for us to deliver effective solutions that meet the needs of national brands. This, in turn, could adversely affect our business and operating results.
We may experience outages and disruptions of our services or experience data security incidents if we fail to maintain adequate security and supporting infrastructure our systems, which may harm our brand and reputation, result in regulatory enforcement, actions or litigation and negatively impact our revenue and results of operations.
Creating the appropriate support for our technology platform, including storing large amounts of data and managing our computational infrastructure, is expensive and complex, and our failure to create and maintain such support, particularly as we scale our system to support the growth in our business, could result in operational inefficiencies, disruptions or failures and increased
19
vulnerability to cyber-attacks. Cyber-attacks could diminish the quality of our services and our performance for customers. Cyber-attacks could include denial-of-service attacks impacting service availability (including the ability to deliver advertisements) and reliability; the exploitation of software vulnerabilities in Internet-facing applications; social engineering of system administrators (tricking company employees into releasing control of their systems to a hacker) or the introduction of computer viruses or malware into our systems with a view to steal confidential or proprietary data. Cyber-attacks of increasing sophistication may be difficult to detect and could result in the theft of our intellectual property and our data or our customers' data. In addition, we are vulnerable to unintentional errors or malicious actions by persons with authorized access to our systems that exceed the scope of their access rights, or unintentionally or intentionally alter parameters or otherwise interfere with the intended operations of our platform. The steps we take to increase the reliability, integrity and security of our systems as they scale may be expensive and may not prevent system failures or unintended vulnerabilities resulting from the increasing number of persons with access to our systems, complex interactions within our technology platform, the increasing number of connections with third-party partners and vendors' technology and the increasing volume of data analyzed by our systems. If we experience a security incident involving consumer data, or we do not comply with legal requirements or industry standards concerning data security, we could face regulatory enforcement actions or private litigation. Operational errors or failures or successful cyber-attacks also could result in damage to our reputation and loss of customers and other business partners which could harm our business. In addition, we could be adversely impacted by outages and disruptions in the online platforms of our key business partners, such as the RTB exchanges, which we rely upon for access to inventory.
We use co-location facilities to deliver our services. Any disruption of service at these facilities could harm our business.
We maintain servers at co-location facilities in San Jose, California; Somerset, New Jersey; Morrisville, North Carolina; Austin, Texas; and Amsterdam, the Netherlands, and expect to add other data centers at co-location facilities in the future. Although we control the actual computers, networks and storage systems upon which our platform runs, and deploy them to the data center facilities, we do not control the operation of the facilities. The owners of the facilities have no obligation to renew their agreements with us on commercially reasonable terms, or at all. If we are unable to renew our agreements on commercially reasonable terms, we may be required to transfer to a new facility or facilities, and we may incur significant costs and possible service interruption in connection with doing so.
The facilities are vulnerable to damage or service interruption resulting from human error, intentional bad acts, earthquakes, hurricanes, tornadoes, floods, fires, war, terrorist attacks, power losses, hardware failures, systems failures, telecommunications failures and similar events. The occurrence of a natural disaster or an act of terrorism, any outages or vandalism or other misconduct, or a decision to close the facility without adequate notice or other unanticipated problems could result in lengthy interruptions in our services. If we were to lose the data stored in any of our co-location facilities, it could take several days, if not weeks, to recreate this data from multiple sources, which could result in significant negative impact on our business operations, and potential damage to our customer and advertising agency relationships. Our facilities would likely be costly to repair or replace, and any such efforts would likely require substantial time.
Any changes in service levels at the co-location facilities or any errors, defects, disruptions or other performance problems at or related to the facilities that affect our services could harm our reputation and may damage our customers' businesses. Interruptions in our services might reduce our revenue, subject us to potential liability, or result in reduced usage of our platform.
20
We also depend on third-party Internet-hosting providers and continuous and uninterrupted access to the Internet through third-party bandwidth providers to operate our business. If we lose the services of one or more of our Internet-hosting or bandwidth providers for any reason or if their services are disrupted, for example due to viruses or "denial-of-service" or other attacks on their systems, or due to human error, intentional bad acts, power loss, hardware failures, telecommunications failures, fires, wars, terrorist attacks, floods, earthquakes, hurricanes, tornadoes or similar events, we could experience disruption in our ability to offer our solution or we could be required to retain the services of replacement providers, which could increase our operating costs and harm our business and reputation.
Changes in market standards applicable to our solution could require us to incur substantial additional development costs.
Market forces, competitors' initiatives, regulatory authorities, industry organizations and security protocols are causing the emergence of demands and standards that are or could be applicable to our solution. We expect compliance with these kinds of standards to become increasingly important to our customers and the consumers they sell their products to, and conforming to these standards is expected to consume a substantial and increasing portion of our development resources. If our solution is not consistent with emerging standards, our market position and sales could be impaired. If we fail to conform with these standards, we will be at a disadvantage to our competitors, and we may face regulatory enforcement actions or private litigation.
Our historical revenue growth has masked seasonal fluctuations in advertising activity. As growth declines or seasonal patterns become more pronounced, seasonality could have a material impact on our results.
We expect our revenue, operating results, cash flow from operations and other key operating and performance metrics to vary from quarter to quarter in part due to the seasonal nature of our customers' spending on digital marketing campaigns. For example, many advertisers tend to devote a significant portion of their advertising budgets to the fourth quarter of the calendar year to coincide with consumer holiday spending. Moreover, media inventory in the fourth quarter may be more expensive due to increased demand for media inventory. Our historical revenue growth has partially masked the impact of seasonality, but if our growth rate declines or seasonal spending by our customers on marketing campaigns becomes more pronounced, seasonality could have a material impact on our revenue, operating results, cash flow from operations and other key operating and performance metrics from period to period.
We do not have long-term commitments from our customers, and we may not be able to retain customers or attract new customers to sustain or grow current revenue.
Most of our customers do business with us by placing insertion orders for particular digital marketing campaigns, either directly or through advertising agencies that act on their behalf. We rarely have any commitment from a customer beyond the campaign governed by a particular insertion order, and we frequently must compete to win further business from a customer. In accordance with the Interactive Advertising Bureau, or IAB, our insertion orders may also be cancelled by customers or their advertising agencies prior to the completion of the campaign without penalty. As a result, our success is dependent upon our ability to outperform our competitors and win repeat business from existing customers, while continually expanding the number of customers for which we provide services. Because we do not have long-term agreements, we may not accurately predict future revenue streams, and we cannot guarantee that our current customers will continue to use our solution, or that we will be able to replace departing customers with new customers that provide us with comparable revenue.
21
If mobile connected devices, their operating systems or content distribution channels, including those controlled by our competitors, develop in ways that prevent our digital marketing campaigns from being delivered to the users of these devices, our ability to grow our business will be impaired.
Our success in the mobile channel depends upon the ability of our technology platform to integrate with mobile inventory suppliers and provide advertising for most mobile connected devices, as well as integrate with the major operating systems that run on them and the thousands of applications that are downloaded onto them. The design of mobile devices and operating systems is controlled by third parties with which we do not have any formal relationships. These parties frequently introduce new devices, and from time to time they may introduce new operating systems or modify existing ones. Network carriers may also impact the ability to access specified content on mobile devices. If our solution is or becomes unable to work on these devices or operating systems, either because of technological constraints or because a maker of these devices or developer of these operating systems wishes to impair our ability to provide advertisements on them, our ability to generate revenue could be significantly harmed.
The digital advertising market is relatively new and dependent on growth in various digital advertising channels. If this market develops more slowly or differently than we expect, our business, growth prospects and financial condition would be adversely affected.
The digital advertising market is relatively new and our solution may not achieve or sustain high levels of demand and market acceptance. While display advertising has been used successfully for many years, marketing through new digital advertising channels, such as mobile, social media and digital video advertising, is not as well established. The future growth of our business depends not only on the growth of the digital display advertising market, but also the level of acceptance and expansion of emerging digital advertising channels. In addition, our growth will depend on the increased adoption by the advertising industry of automation in lieu of manual operations for order placement. Any expansion of the market for digital advertising solutions depends on a number of factors and the cost, performance and perceived value associated with digital advertising solutions. If demand for digital display advertising, the acceptance of emerging digital advertising channels and adoption of advertising automation does not continue to grow, or if digital advertising solutions or advertising automation do not achieve widespread adoption, our revenue and results of operations could be harmed.
We currently depend on display advertising. A decrease in the use of display advertising, or our inability to further penetrate display, mobile, social and video advertising channels would harm our business, growth prospects, operating results and financial condition.
Historically, our customers have predominantly used our solution for display advertising, and the substantial majority of our revenue is derived from advertisers, typically through their agencies, that use our solution for display advertising. We expect that display advertising will continue to be a primary channel for our customers. If our customers were to lose confidence in the value or effectiveness of display advertising, the demand for our solution may decline. In addition, our failure to achieve market acceptance of our solution for mobile, social and video advertising would harm our growth prospects, operating results and financial condition.
Our international expansion subjects us to additional costs and risks, may not yield returns in the foreseeable future, and may not be successful.
Currently, we have operations in the United Kingdom, which began in 2014. We expect to expand our international operations in the future, and our limited experience in operating our business internationally increases the risk that any potential future expansion efforts that we may undertake will not be successful.
22
Our international expansion presents challenges and risks to our business and requires significant attention from our management, finance, analytics, operations, sales and engineering teams to support digital marketing campaigns abroad. We may incur significant operating expenses as a result of our international expansion, and it may not be successful. Compliance with complex foreign and U.S. laws and regulations that apply to our international operations increases our cost of doing business abroad, may interfere with our ability to offer our solution competitively to customers in one or more countries and may expose us or our employees to fines and penalties. Laws and regulations that may impact us include tax laws, employment laws, regulations related to data privacy and security, U.S. laws such as the Foreign Corrupt Practices Act and local laws prohibiting corrupt payments to governmental officials and private entities, such as the U.K. Bribery Act. Violations of these laws or regulations could result in monetary damages, criminal sanctions against us, our officers or our employees, and prohibitions on the conduct of our business.
Our international business also subjects us to the impact of global and regional recessions and economic and political instability, costs and difficulties in managing a distributed workforce, potentially adverse tax consequences in the United States and abroad and restrictions on the repatriation of funds to the United States. Our failure to manage these risks and challenges successfully could materially and adversely affect our business, financial condition and results of operations.
If we fail to detect fraud or if we serve our customers' advertisements on objectionable websites, our brand and reputation will suffer, which would negatively impact our business, financial condition and results of operations.
Our business depends in part on providing our customers with a service that they trust, and we have contractual commitments to take reasonable measures to prevent customers' advertisements from appearing on undesirable websites or on certain websites that they identify. We use proprietary technology to detect click fraud and block inventory that we suspect to be fraudulent. We also use third-party services in an effort to prevent our customers' advertisements from appearing on undesirable websites. Preventing and combating fraud requires constant vigilance, and we may not always be successful in our efforts to do so. We may serve advertising on web sites that is objectionable to our customers, and we may lose the trust of our customers, which would harm our brand and reputation and negatively impact our business, financial condition and results of operations. We may also purchase inventory inadvertently that proves to be unacceptable for digital marketing campaigns, such as advertising inventory on objectionable or undesirable websites, in which case we would be responsible for the cost and could not bill that cost to any customer.
Our revenue could decline and our growth could be impeded if our access to quality media inventory or impressions is diminished or if we fail to acquire new media inventory or impressions.
Our success depends on our ability to secure quality media inventory on reasonable terms across a broad range of advertising networks and exchanges, including RTB exchanges, such as Google's DoubleClick Ad Exchange, Rubicon Project, PubMatic and AppNexus, as well as suppliers of video and mobile inventory.
The amount, quality and cost of inventory and impressions available to us can change at any time. Three RTB exchanges each provided 10% or more of our total impression purchases for the year ended December 31, 2013, and these three exchanges together accounted for approximately 88% of our total impression purchases, with the largest exchange accounting for approximately 43% of our impression purchases. If we are not able to access the impressions on any of these exchanges due to a change in our relationship with that exchange or the exchange's financial difficulty, our revenue could decline and growth could be impeded.
23
Our media inventory suppliers are generally not bound by long-term agreements. As a result, there is no guarantee that we will have access to a consistent supply of quality inventory. Moreover, the number of competing intermediaries that purchase advertising inventory from RTB exchanges continues to increase, which could put upward pressure on inventory costs. If we are unable to compete favorably for media inventory available on RTB exchanges, or if RTB exchanges decide not to make their media inventory available to us, we may not be able to place advertisements at competitive rates or find alternative sources of inventory with comparable traffic patterns and consumer demographics in a timely manner.
Suppliers control the real-time bidding process for the inventory they supply, and their processes may not always work in our favor. For example, suppliers may place restrictions on the use of their inventory, including prohibiting the placement of advertisements on behalf of certain customers. Through the bidding process, we may not win the media inventory that we have selected and may not be able to replace media inventory that is no longer made available to us. Moreover, any material changes to, or the disappearance of, the real-time bidding ecosystem could negatively impact our business by limiting our ability to target and selectively purchase impressions.
If we are unable to maintain a consistent supply of quality media inventory for any reason, our business, customer retention and loyalty, financial condition and results of operations could be harmed.
Our sales and marketing efforts require significant investment, which may not yield returns in the foreseeable future, if at all.
We have invested significant resources in our sales and marketing teams to educate potential and prospective customers, either directly or through the advertising agencies that act on their behalf, about the value of our solution. We are often required to explain how our solution can optimize digital marketing campaigns in real time. We often spend substantial time and resources responding to requests for proposals from potential customers or their advertising agencies, including developing material specific to the needs of such potential customers. We may not be successful in attracting new customers despite our investment in our business development, sales and marketing organizations.
Our sales cycle can be unpredictable, which may cause our operating results to fluctuate.
The sales cycle for our solution, from initial contact with a potential lead to agreement execution and implementation, varies widely by customer, and typically ranges from one to six months. Some of our customers undertake an evaluation process that involves not only our solution but also those of our competitors, which can delay purchase decisions. Our sales efforts involve educating our customers about the use, technical capabilities and benefits of our solution. If sales expected from a customer are not realized in the time period expected or not realized at all, or if a customer terminates its agreement with us, our business, operating results and financial condition could be adversely affected.
If we do not effectively grow and train our sales team, we may be unable to add new customers or increase sales to our existing customers and our business will be adversely affected.
We continue to be substantially dependent on our sales team to obtain new customers and to drive sales from our existing customers. We believe that there is significant competition for sales personnel with the skills and technical knowledge that we require. Our ability to achieve significant revenue growth will depend, in large part, on our success in recruiting, training, integrating and retaining sufficient numbers of sales personnel to support our growth. New hires require significant training and it may take significant time before they achieve full productivity. Our recent hires and
24
planned hires may not become productive as quickly as we expect, and we may be unable to hire or retain sufficient numbers of qualified individuals in the markets where we do business or plan to do business. In addition, as we continue to grow rapidly, a large percentage of our sales team will be new to the company and our solution. If we are unable to hire and train sufficient numbers of effective sales personnel, or the sales personnel are not successful in obtaining new customers or increasing sales to our existing customer base, either directly or through advertising agencies that act on their behalf, our business will be adversely affected.
Economic downturns and political and market conditions beyond our control could adversely affect our business, financial condition and results of operations.
Our business depends on the overall demand for advertising and on the economic health of the national brands that are our current and prospective customers. Economic downturns or instability in political or market conditions may cause current or new customers to reduce their advertising budgets. Adverse economic conditions and general uncertainty about economic recovery are likely to affect our business prospects. Concern over such downturns or economic recovery could cause customers to delay, decrease or cancel purchases of our solution; and expose us to increased credit risk on customer orders, which, in turn, could negatively impact our business, financial condition and results of operations. In addition, concern over continued geopolitical turmoil in many parts of the world have and may continue to put pressure on global economic conditions, which could lead to reduced spending on advertising.
Failure to comply with industry self-regulation could harm our reputation and our business.
We have committed to complying with the Network Advertising Initiative's Code of Conduct and the Digital Advertising Alliance's Self-Regulatory Principles for Online Behavioral Advertising in the United States, as well as similar self-regulatory principles in Europe adopted by the Interactive Advertising Bureau—Europe and the European Digital Advertising Alliance. If we make mistakes in the future, or our opt-out mechanisms fail to work as designed, or if Internet users misunderstand our technology or our commitments with respect to these principles, we may, as a result, be subject to negative publicity, government investigation, government or private litigation, or investigation by self-regulatory bodies or other accountability groups. Any such action against us could be costly and time consuming, require us to change our business practices, cause us to divert management's attention and our resources and be damaging to our reputation and our business.
Real or perceived errors or failures in our software and systems could adversely affect our operating results and growth prospects and could cause us reputational harm.
We depend upon the sustained and uninterrupted performance of our technology platform to: operate over a thousand digital marketing campaigns at any given time; manage our inventory supply; bid on inventory for each campaign; serve or direct a third party to serve advertising; collect, process and interpret data; optimize campaign performance in real time and provide billing information to our financial systems. If our technology platform cannot scale to meet demand, or if there are errors in our execution of any of these functions on our platform, then our business may be harmed. Because our software is complex, undetected errors and failures may occur, especially when new versions or updates are made. We do not have the capability to test new releases or updates to our code on a small subset of digital marketing campaigns, which means that bugs or errors in code could impact all campaigns on our platform. Despite testing by us, errors or bugs in our software have in the past, and may in the future, not be found until the software is in our live operating environment. For example, we have experienced failures in our bidding system to recognize or respond to budget restrictions for digital marketing campaigns, resulting in overspending on media inventory, and we may in the future have failures in our systems that cause
25
us to buy more media than our customers are contractually obligated to pay for, which could be costly and harm our operating results. Errors or failures in our software could also result in negative publicity, damage to our reputation, loss of or delay in market acceptance of our solution, increased costs or loss of revenue, loss of competitive position or claims by customers for losses sustained by them. In such an event, we may be required or choose to expend additional resources to help mitigate any problems resulting from errors in our software. We may make errors in the measurement of our digital marketing campaigns causing discrepancies with our customers' measurements leading to a lack in confidence in our technology platform. If measurement errors or discrepancies relate to marketing campaigns for which we have billed amounts to customers, we may have the need to provide the customer with "make-goods," or standard credits given to advertisers for campaigns that have not been delivered properly. Alleviating problems resulting from errors in our software could require significant expenditures of capital and other resources and could cause interruptions, delays or the cessation of our business, any of which would adversely impact our financial position, results of operations and growth prospects.
Our future success depends on the continuing efforts of our key employees, including our three founders, Joseph Epperson, Gretchen Joyce and Kurt Carlson, and on our ability to hire, retain and motivate additional key employees.
Our future success depends heavily upon the continuing services of our key employees, including our three founders, Joseph Epperson, our president and chief executive officer, Gretchen Joyce, our chief operating officer, and Kurt Carlson, our chief technology officer, and on our ability to attract and retain members of our management team and other highly skilled employees, including software engineers, analytics and operations employees and sales professionals. The market for talent in our key areas of operations is intensely competitive. None of our founders or other key employees has an employment agreement for a specific term, and any of our employees may terminate his or her employment with us at any time.
New employees often require significant training and, in many cases, take significant time to achieve full productivity. As a result, we may incur significant costs to attract and retain employees, including salaries, benefits and compensation expenses related to equity awards, and we may lose new employees to our competitors or other companies before we realize the benefit of our investment in recruiting and training them. Moreover, new employees may not become as productive as we expect, as we may face challenges in adequately or appropriately integrating them into our workforce and culture. In addition, as we move into new geographies, we will need to attract and recruit skilled employees in those areas. We have little experience with recruiting outside of the United States, and may face additional challenges in attracting, integrating and retaining international employees.
We may require additional capital to support growth, and such capital might not be available on terms acceptable to us, if at all, which may in turn hamper our growth and adversely affect our business.
We intend to continue to make investments to support our business growth and may require additional funds to respond to business challenges, including the need to develop new features or enhance our platform, improve our operating infrastructure or acquire complementary businesses and technologies. Accordingly, we may need to engage in additional public or private equity, equity-linked or debt financings to secure additional funds. If we raise additional funds through future issuances of equity or convertible debt securities, our existing stockholders could suffer significant dilution, and any new equity securities we issue could have rights, preferences and privileges superior to those of holders of our common stock. Any debt financing that we secure in the future could involve restrictive covenants relating to our capital raising activities and other financial and operational matters, including the ability to pay dividends. This may make it more difficult for us to
26
obtain additional capital and to pursue business opportunities, including potential acquisitions. We may not be able to obtain additional financing on terms favorable to us, if at all. If we are unable to obtain adequate financing or financing on terms satisfactory to us when we require it, our ability to continue to support our business growth and respond to business challenges could be significantly impaired, and our business may be adversely affected.
Our corporate culture has contributed to our success, and if we cannot maintain it as we grow, we could lose the innovation, creativity and teamwork fostered by our culture, and our business may be harmed.
We are undergoing rapid growth. As of September 30, 2014, we had 286 employees in the United States and five employees in the United Kingdom, compared with 155 employees as of September 30, 2013, all of whom were based in the United States. We intend to further expand our overall headcount and operations both domestically and internationally, with no assurance that we will be able to do so while effectively maintaining our corporate culture. We believe our corporate culture has been a critical component of our success as we believe it fosters innovation, teamwork, passion for customers and focus on execution, while facilitating knowledge sharing across our organization. As we grow and change, we may find it difficult to preserve our corporate culture, which could reduce our ability to innovate and operate effectively. In turn, the failure to preserve our culture could negatively affect our ability to attract, recruit, integrate and retain employees, continue to perform at current levels and effectively execute our business strategy.
We rely on advertising agencies that act on behalf of our customers, and we incur the cost of a digital marketing campaign before we bill for our services. Potential delays in payment or non-payment could have an adverse effect on our results of operations and financial condition.
A substantial majority of our revenue is sourced through advertising agencies, which act as agents for disclosed principals that are the advertisers. Typically, the advertising agency pays for our services once it has received payment from the advertiser for our services. However, we are obligated to pay for media inventory we have purchased from RTB exchanges before receiving such payments from the advertising agency. This delay in payment, which is typically more prolonged than the delay in payment we experience when we bill advertisers directly, could negatively impact our liquidity and financial condition. Contracting with these agencies could subject us to greater liquidity risk than when we contract with advertisers directly and to credit risk if an agency is unable to pay us once paid by the advertiser. These risks may vary depending on the nature of an advertising agency's aggregated advertiser base and the related timing of payment to the agency by our customer. There can be no assurance that we will not experience significant delays in payment in the future. Our agreements with advertising agencies typically provide that if the advertiser does not pay the agency, the agency is not liable to us and we must seek payment solely from the advertiser. Any such delays in payment to the agency by our customer and any failure by the advertiser to pay the agency or the agency to pay us could have a material adverse effect on our results of operations.
Because we generally bill our customers over the term of the agreement, near-term declines in new or renewed agreements generating revenue may not be reflected immediately in our operating results.
Most of our revenue in each quarter is derived from agreements entered into with our customers during the previous three months. Consequently, a decline in new or renewed customer agreements in any one quarter may not be fully reflected in our revenue for that quarter. Such declines, however, would negatively affect our revenue in future periods and the effect of significant downturns in sales and market acceptance of our solution, and potential changes in our rate of
27
renewals or renewal terms, may not be fully reflected in our results of operations until future periods. In addition, we may be unable to adjust our cost structure rapidly enough, or at all, to take account of reduced revenue. Our business model also makes it difficult for us to rapidly increase our total revenue through additional sales in any period, as revenue from new customers must be earned over the applicable agreement term based on the value of their monthly advertising spend.
Fluctuations in the exchange rates of foreign currencies could negatively impact our financial results.
We expect international sales and operations to become an increasingly important part of our business. Such sales and operational expenses may be subject to unexpected regulatory requirements and other barriers. Any fluctuation in the exchange rates of these foreign currencies may negatively impact our business, financial condition and results of operations. We have not previously engaged in foreign currency hedging. If we decide to hedge our foreign currency exposure, we may not be able to hedge effectively due to lack of experience, unreasonable costs or illiquid markets. In addition, those activities may be limited in the protection they provide us from foreign currency fluctuations and can themselves result in losses.
Our proprietary rights may be difficult to enforce, which could enable others to copy or use aspects of our solution without compensating us, thereby eroding our competitive advantages and harming our business.
Our success depends, in part, on our ability to protect proprietary methods and technologies that we develop under the intellectual property laws of the United States, so that we can prevent others from using our inventions and proprietary information. If we fail to protect our intellectual property rights adequately, our competitors might gain access to our technology, and our business might be adversely affected. We rely on trademark, copyright, trade secret and patent laws, confidentiality procedures and contractual provisions to protect our proprietary methods and technologies. Our patent strategy is still in its early stages and while we have a small number of pending patent applications, valid patents may not be issued from our pending applications, and the claims eventually allowed on any patents may not be sufficiently broad to protect our technology or offerings and services. Any issued patents may be challenged, invalidated or circumvented, and any rights granted under these patents may not actually provide adequate defensive protection or competitive advantages to us. Additionally, the process of obtaining patent protection is expensive and time-consuming, and we may not be able to prosecute all necessary or desirable patent applications at a reasonable cost or in a timely manner. Additional uncertainty may result from changes to intellectual property legislation enacted in the United States, including the recent America Invents Act, and other national governments and from interpretations of the intellectual property laws of the United States and other countries by applicable courts and agencies. Accordingly, despite our efforts, we may be unable to obtain adequate patent protection, or to prevent third parties from infringing upon or misappropriating our intellectual property.
Unauthorized parties may attempt to copy aspects of our technology or obtain and use information that we regard as proprietary. We generally enter into confidentiality and/or license agreements with our employees, consultants, vendors and customers, and generally limit access to and distribution of our proprietary information. However, we cannot assure you that any steps taken by us will prevent misappropriation of our technology and proprietary information. Policing unauthorized use of our technology is difficult. In addition, the laws of some foreign countries may not be as protective of intellectual property rights as those of the United States, and mechanisms for enforcement of our proprietary rights in such countries may be inadequate. From time to time, legal action by us may be necessary to enforce our intellectual property rights, to protect our trade secrets, to determine the validity and scope of the proprietary rights of others or to defend against claims of infringement. Such litigation could result in substantial costs and the diversion of limited
28
resources and could negatively affect our business, operating results and financial condition. If we are unable to protect our proprietary rights (including aspects of our technology platform) we may find ourselves at a competitive disadvantage to others that have not incurred the same level of expense, time and effort to create and protect their intellectual property.
We may be subject to intellectual property rights claims by third parties, which are extremely costly to defend, could require us to pay significant damages and could limit our ability to use certain technologies.
Third parties may assert claims of infringement of intellectual property rights in proprietary technology against us or against our customers for which we may be liable or have an indemnification obligation. Any claim of infringement by a third party, even those without merit, could cause us to incur substantial costs defending against the claim, limit our ability to use certain technologies and could distract our management from our business.
Although such third parties may offer a license to their technology, the terms of any offered license may not be acceptable and the failure to obtain a license or the costs associated with any license could cause our business, results of operations or financial condition to be materially and adversely affected. In addition, some licenses may be non-exclusive, and therefore our competitors may have access to the same technology licensed to us. Alternatively, we may be required to develop non-infringing technology, which could require significant effort and expense and ultimately may not be successful. Furthermore, a successful claimant could secure a judgment or we may agree to a settlement that prevents us from providing certain solutions or services or that requires us to pay substantial damages, including treble damages if we are found to have willfully infringed such claimant's patents or copyrights, royalties or other fees. Any of these events could seriously harm our business, operating results and financial condition.
Our solution relies on third-party open source software components, and failure to comply with the terms of the underlying open source software licenses could restrict our ability to sell our solution or cause us to make generally available portions of our proprietary code.
Our platform relies on software licensed to us by third-party authors under "open source" licenses. The use of open source software may entail greater risks than the use of third-party commercial software, as open source licensors generally do not provide warranties or other contractual protections regarding infringement claims or the quality of the code. Some open source licenses contain requirements that we make available source code for modifications or derivative works we create based upon the type of open source software we use. If we combine our proprietary software with open source software in a certain manner, we could, under certain open source licenses, be required to release the source code of our proprietary software to the public. This would allow our competitors to create similar solutions with lower development effort and time and ultimately put us at a competitive disadvantage.
Although we monitor our use of open source software to avoid subjecting our solution to conditions we do not intend, the terms of many open source licenses have not been interpreted by U.S. courts, and there is a risk that these licenses could be construed in a way that could impose unanticipated conditions or restrictions on our ability to commercialize our services. Moreover, we cannot guarantee that our processes for controlling our use of open source software will be effective. If we are held to have breached the terms of an open source software license, we could be required to seek licenses from third parties to continue operating our platform on terms that are not economically feasible, to re-engineer our platform or the supporting computational infrastructure to discontinue use of certain code, or to make generally available, in source code form, portions of our proprietary code, any of which could adversely affect our business, operating results and financial condition.
29
Our growth depends, in part, on the success of our strategic relationships with third parties, including ready access to hardware in key locations to facilitate the delivery of our solution and reliable management of Internet traffic.
We anticipate that we will continue to depend on various third-party relationships to grow our business. We continue to pursue additional relationships with third parties, such as technology and content providers, RTB exchanges, market research companies, co-location facilities and other strategic partners. Identifying, negotiating and documenting relationships with third parties requires significant time and resources as does integrating third-party data and services. Our agreements with providers of technology, data, computer hardware, co-location facilities and RTB exchanges are typically non-exclusive, do not prohibit them from working with our competitors or from offering competing services and do not typically have minimum purchase commitments. Our competitors may be effective in providing incentives to third parties to favor their products or services or to prevent or reduce purchases of our solution. In addition, these third parties may not perform as expected under our agreements with them, and we may have disagreements or disputes with such third parties, which could negatively affect our brand and reputation.
In particular, our continued growth depends on our ability to source computer hardware, including servers built to our specifications, and the ability to locate those servers and related hardware in co-location facilities in the most desirable locations to facilitate the timely delivery of our services. Similarly, disruptions in the services provided at co-location facilities that we rely upon can degrade the level of services that we can provide, which may harm our business. We also rely on our integration with many third-party technology providers to execute our business on a daily basis. We must efficiently direct a large amount of network traffic to and from our servers to consider tens of billions of bid requests per day, and each bid typically must take place in approximately 100 milliseconds. We rely on a third-party domain name service, or DNS, to direct traffic to our closest data center for efficient processing. If our DNS provider experiences disruptions or performance problems, this could result in inefficient balancing of traffic across our servers as well as impair or prevent web browser connectivity to our site, which may harm our business.
Legal claims resulting from the actions of our customers could damage our reputation and be costly to defend.
We do not independently verify whether the content of the advertisements we deliver is legally permitted. We receive representations from customers that the content of the advertising that we place on their behalf is lawful. We also rely on representations from our customers that they maintain adequate privacy policies that allow us to place cookies and other tracking mechanisms on their websites and collect data from users that visit those websites to aid in delivering our solution. If any of these representations are untrue and our customers do not abide by federal, state, local or foreign laws governing their content or privacy practices we may become subject to legal claims, we will be exposed to potential liability (for which we may or may not be indemnified), and our reputation may be damaged.
Indemnity provisions in various agreements potentially expose us to substantial liability for intellectual property infringement and other losses.
Our agreements with customers and other third parties may include indemnification provisions under which we agree to indemnify them for losses suffered or incurred as a result of claims of intellectual property infringement, damages caused by us to property or persons, or other liabilities relating to or arising from our solution or other contractual obligations. The term of these indemnity provisions generally survives termination or expiration of the applicable agreement. Large indemnity payments could harm our business, operating results and financial condition.
30
We may acquire other businesses, which could require significant management attention, disrupt our business, dilute stockholder value and adversely affect our results of operations.
As part of our business strategy, we may make investments in or acquisitions of complementary companies, products or technologies. However, we have not made any acquisitions to date, and as a result, our ability as an organization to acquire and integrate other companies, products or technologies in a successful manner is unproven. We may not be able to find suitable acquisition candidates, and we may not be able to complete such acquisitions on favorable terms, if at all. If we do complete acquisitions, we may not ultimately strengthen our competitive position or achieve our goals, and any acquisitions we complete could be viewed negatively by our customers, the advertising agencies that represent them, and investors or could subject us to class action lawsuits that often follow public company acquisitions. In addition, if we are unsuccessful at integrating employees or technologies acquired, our revenue and results of operations could be adversely affected. Any integration process may require significant time and resources, and we may not be able to manage the process successfully. We may not successfully evaluate or use the acquired technology or employees, or accurately forecast the financial impact of an acquisition transaction, including accounting charges. We may have to pay cash, incur debt or issue equity securities to pay for any such acquisition, each of which could adversely affect our financial condition or the value of our common stock. The sale of equity or issuance of convertible debt to finance any such acquisitions could result in dilution to our stockholders. The incurrence of indebtedness would result in increased fixed obligations, could weaken our financial position and the agreements governing such indebtedness could include covenants or other restrictions that would impede our ability to manage our operations or pay dividends on our common stock.
If our assumptions or estimates relating to our critical accounting policies change or prove to be incorrect, our operating results could fall below the expectations of securities analysts and investors, resulting in a decline in our stock price.
The preparation of financial statements in accordance with U.S. generally accepted accounting principles, or GAAP, requires management to make estimates and assumptions that affect the amounts reported in the consolidated financial statements and accompanying notes. We base our estimates on historical experience and on various other assumptions that we believe to be reasonable under the circumstances, as provided in the section entitled "Management's Discussion and Analysis of Financial Condition and Results of Operations," the results of which form the basis for making judgments about the carrying values of assets, liabilities, equity, revenue and expenses that are not readily apparent from other sources. Our operating results may be adversely affected if our assumptions change or if actual circumstances differ from those in our assumptions, which could cause our operating results to fall below the expectations of securities analysts and investors, resulting in a decline in our stock price. Significant assumptions and estimates used in preparing our consolidated financial statements include those related to revenue recognition, stock-based compensation, accrued liabilities and income taxes.
Our ability to use our net operating losses to offset future taxable income may be subject to certain limitations which could subject our business to higher tax liability.
We may be limited in the portion of net operating loss carryforwards that we can use in the future to offset taxable income for U.S. federal and state income tax purposes. At December 31, 2013, we had U.S. federal net operating loss carryforwards, or NOLs, of approximately $15.4 million and state NOLs of $8.3 million. A lack of future taxable income would adversely affect our ability to utilize these NOLs. In addition, under Section 382 of the Internal Revenue Code of 1986, as amended, or the Code, a corporation that undergoes an "ownership change" is subject to limitations on its ability to utilize its NOLs to offset future taxable income. We believe that we experienced an ownership change under Section 382 of the Code in prior years that may limit our
31
ability to utilize a portion of the NOLs. In addition, future changes in our stock ownership, including this or future offerings, as well as other changes that may be outside of our control, could result in additional ownership changes under Section 382 of the Code. Our NOLs may also be impaired under similar provisions of state law. We have recorded a full valuation allowance related to our NOLs and other net deferred tax assets due to the uncertainty of the ultimate realization of the future benefits of those assets. Our NOLs may expire unutilized or underutilized, which could prevent us from offsetting future taxable income.
The forecasts of market growth included in this prospectus may prove to be inaccurate, and even if the market in which we compete achieves the forecasted growth, we cannot assure you our business will grow at similar rates, if at all.
Growth forecasts are subject to significant uncertainty and are based on assumptions and estimates which may not prove to be accurate. The forecasts in this prospectus relating to the expected growth in the digital advertising market may prove to be inaccurate. For more information regarding the forecasts of market growth included in this prospectus, see the section entitled "Industry and Market Data."
We are subject to government regulations concerning our employees, including wage-hour laws and taxes.
We are subject to applicable rules and regulations relating to our relationship with our employees, including health benefits, unemployment and similar taxes, overtime and working conditions, immigration status and classification of employee benefits for tax purposes. Legislated increases in additional labor cost components, such as employee benefit costs, workers' compensation insurance rates, compliance costs and fines, as well as the cost of litigation in connection with these regulations, would increase our labor costs. Moreover, we are subject to various laws and regulations in federal, state and foreign jurisdictions that impose varying rules and obligations on us with respect to the classification of employee benefits for income tax and other purposes and that require us to report and/or withhold in respect of such items. In addition, many employers nationally have been subject to actions brought by governmental agencies and private individuals under wage-hour laws on a variety of claims, such as improper classification of workers as exempt from overtime pay requirements and failure to pay overtime wages properly, with such actions sometimes brought as class actions, and these actions can result in material liabilities and expenses. Should we be subject to employment litigation, such as actions involving wage-hour, overtime, break and working time, it may distract our management from business matters and result in increased labor costs.
We may be subject to governmental export, import and sanctions requirements that could subject us to liability or impair our ability to compete in international markets.
Our operations may be subject to U.S. export controls, including the Export Administration Regulations, or EAR, as well as economic sanctions enforced by the U.S. Department of the Treasury's Office of Foreign Assets Control, or OFAC. To the extent that we export proprietary software that contains or is secured by encryption technology, the EAR may require us to meet various compliance responsibilities, including complying with encryption registration, classification requests, and export licensing requirements. Furthermore, EAR and OFAC compliance requirements prohibit the shipment of certain products and services to designated countries, entities and individuals targeted by U.S. sanctions. These EAR and OFAC obligations could impact our ability to pursue business opportunities outside the United States and subject us to liability for failure to meet applicable compliance requirements.
In addition, various foreign countries regulate the import of certain encryption technology, including through import permit and license requirements, and have enacted laws that could limit
32
our ability to deploy our technology or could limit our customers' ability to use our solution in those countries. Changes in our technology or in applicable import and export regulations may create delays in the introduction or deployment of our technology in international markets, prevent our customers with international operations from using our solution globally or, in some cases, prevent certain transactions with designated countries, entities or individuals. Such changes in applicable import, export and sanctions laws, including possible shifts in the manner in which respective governments enforce such requirements, could result in decreased use of our solution by, or in our decreased ability to export our technology to, international markets. Any decreased use of our solution or limitation on our ability to export our technology or to sell our solution would likely adversely affect our business, financial condition and results of operations.
Our tax liabilities may be greater than anticipated.
The U.S. and non-U.S. tax laws applicable to our business activities are subject to interpretation. We are subject to audit by the Internal Revenue Service and by taxing authorities of the state, local and foreign jurisdictions in which we operate. Our tax obligations are based in part on our corporate operating structure, including the manner in which we develop, value, and use our intellectual property and sell our solution, the jurisdictions in which we operate, how tax authorities assess revenue-based taxes such as sales and use taxes, the scope of our international operations and the value we ascribe to our intercompany transactions. Taxing authorities may challenge our tax positions and methodologies for valuing developed technology or intercompany arrangements, as well as our positions regarding jurisdictions in which we are subject to certain taxes, which could expose us to additional taxes and increase our worldwide effective tax rate. Any adverse outcomes of such challenges to our tax positions could result in additional taxes for prior periods, interest, and penalties as well as higher future taxes. In addition, our future tax expense could increase as a result of changes in tax laws, regulations or accounting principles, or as a result of earning income in jurisdictions that have higher tax rates. An increase in our tax expense could have a negative effect on our financial position and results of operations. Moreover, the determination of our provision for income taxes and other tax liabilities requires significant estimates and judgment by management, and the tax treatment of certain transactions is uncertain. Although we believe we will make reasonable estimates and judgments, the ultimate outcome of any particular issue may differ from the amounts previously recorded in our financial statements and any such occurrence could materially affect our financial position and results of operations.
Risks Related to This Offering and Ownership of Our Common Stock
The price of our common stock may be volatile and the value of your investment could decline.
Prior to this offering, there has been no public market for our common stock, and technology stocks have historically experienced high levels of volatility. The trading price of our common stock following this offering may fluctuate substantially. Following the completion of this offering, the market price of our common stock may be higher or lower than the price you pay in the offering, depending on many factors, some of which are beyond our control and may not be related to our operating performance. These fluctuations could cause you to lose all or part of your investment in our common stock. Factors that could cause fluctuations in the trading price of our common stock include the following:
- •
- announcements of new offerings, products, services or technologies, commercial relationships, acquisitions or other events
by us or our competitors;
- •
- price and volume fluctuations in the overall stock market from time to time;
- •
- significant volatility in the market price and trading volume of technology companies in general and of companies in the digital advertising industry in particular;
33
- •
- fluctuations in the trading volume of our shares or the size of our public float;
- •
- actual or anticipated changes or fluctuations in our results of operations;
- •
- whether our results of operations meet the expectations of securities analysts or investors or those expectations change;
- •
- litigation involving us, our industry, or both;
- •
- regulatory developments in the United States, foreign countries, or both;
- •
- general economic conditions and trends;
- •
- major catastrophic events;
- •
- lock-up releases and sales of large blocks of our common stock;
- •
- departures of key employees; or
- •
- an adverse impact on the company from any of the other risks cited in this prospectus.
In addition, if the market for technology stocks or the stock market, in general, experience a loss of investor confidence, the trading price of our common stock could decline for reasons unrelated to our business, results of operations or financial condition. The trading price of our common stock might also decline in reaction to events that affect other companies in our industry even if these events do not directly affect us. In the past, following periods of volatility in the market price of a company's securities, securities class action litigation has often been brought against that company. If our stock price is volatile, we may become the target of securities litigation. Securities litigation could result in substantial costs and divert our management's attention and resources from our business. This could have a material adverse effect on our business, results of operations and financial condition.
Sales of substantial amounts of our common stock in the public markets, including when the "lock-up" or "market standoff" period ends, or the perception that sales might occur, could reduce the price of our common stock and may dilute your voting power and your ownership interest in us.
Sales of a substantial number of shares of our common stock in the public market after this offering, or the perception that these sales could occur, could adversely affect the market price of our common stock and may make it more difficult for you to sell your common stock at a time and price that you deem appropriate. Based on the total number of outstanding shares of our common stock as of September 30, 2014, upon completion of this offering, we will have shares of common stock outstanding. All of the shares of common stock sold in this offering will be freely tradable without restrictions or further registration under the Securities Act of 1933, as amended, or the Securities Act, except for any shares held by our "affiliates" as defined in Rule 144 under the Securities Act.
Subject to certain exceptions, we and all of our directors and officers and substantially all of our stockholders have agreed not to offer, sell or agree to sell, directly or indirectly, any shares of common stock without the permission of Goldman, Sachs & Co. for a period of 180 days from the date of this prospectus. When the lock-up period expires, we and our locked-up stockholders will be able to sell shares in the public market. In addition, the underwriters may, in their sole discretion, release all or some portion of the shares subject to lock-up agreements prior to the expiration of the lock-up period. See the section of this prospectus entitled "Shares Eligible for Future Sale" for more information. Sales of a substantial number of such shares upon expiration, or the perception that such sales may occur, or early release of the lock-up, could cause our share price to fall or make it more difficult for you to sell your common stock at a time and price that you deem appropriate.
34
Based on shares outstanding as of , holders of up to approximately shares, or %, of our common stock after this offering, will have rights, subject to some conditions, to require us to file registration statements covering the sale of their shares or to include their shares in registration statements that we may file for ourselves or other stockholders. We also intend to register the offer and sale of all shares of common stock that we may issue under our equity compensation plans.
We may issue our shares of common stock or securities convertible into our common stock from time to time in connection with a financing, acquisition, investments or otherwise. Any such issuance could result in substantial dilution to our existing stockholders and cause the trading price of our common stock to decline.
Insiders will continue to have substantial control over us after this offering, which could limit your ability to influence the outcome of key transactions, including a change of control.
Our directors, executive officers and each of our stockholders that own greater than 5% of our outstanding common stock, in the aggregate, will beneficially own approximately % of the outstanding shares of our common stock after this offering, based on the number of shares outstanding as of . As a result, these stockholders will be able to influence or control matters requiring approval by our stockholders, including the election of directors and the approval of mergers, acquisitions or other extraordinary transactions. They may also have interests that differ from yours and may vote in a manner that is adverse to your interests. This concentration of ownership may have the effect of deterring, delaying or preventing a change of control of our company, could deprive our stockholders of an opportunity to receive a premium for their common stock as part of a sale of our company and might ultimately affect the market price of our common stock.
We cannot assure you that a market will develop for our common stock or what the market price of our common stock will be.
We cannot assure you that an active trading market for our common stock will develop or, if developed, that any market will be sustained. We cannot predict the prices at which our common stock will trade. The initial public offering price of our common stock has been determined by negotiations with the underwriters and may not bear any relationship to the market price at which our common stock will trade after this offering or to any other established criteria of the value of our business.
We have broad discretion in the use of net proceeds that we receive in this offering, and if we do not use those proceeds effectively, your investment could be harmed.
The principal purposes of this offering are to create a public market for our common stock, obtain additional working capital and facilitate our future access to the public equity markets. We intend to use the net proceeds from this offering for general corporate purposes, including working capital, sales and marketing activities, engineering initiatives including enhancement of our solution, investment in technology and development and capital expenditures. We also may use a portion of the net proceeds from this offering to acquire or invest in technologies, solutions or businesses that complement our business, although we have no present commitments, and we have not allocated specific amounts of net proceeds, to complete any such transactions or plans. Accordingly, our management will have broad discretion in the application of the net proceeds to us from this offering. Investors in this offering will need to rely upon the judgment of our management regarding the application of the proceeds. If we do not use the net proceeds that we receive in this offering effectively, our business, results of operations and financial condition could be harmed.
35
The requirements of being a public company may strain our resources, divert our management's attention and affect our ability to attract and retain qualified board members.
As a public company, we will be subject to the reporting requirements of the Securities Exchange Act of 1934, as amended, or the Exchange Act, and will be required to comply with the applicable requirements of the Sarbanes-Oxley Act of 2002, or the Sarbanes-Oxley Act, and the Dodd-Frank Wall Street Reform and Consumer Protection Act of 2010, the listing requirements of the New York Stock Exchange and other applicable securities rules and regulations. Compliance with these rules and regulations will increase our legal and financial compliance costs, make some activities more difficult, time-consuming or costly and increase demand on our systems and resources. Among other things, the Exchange Act requires that we file annual, quarterly and current reports with respect to our business and results of operations and maintain effective disclosure controls and procedures and internal controls over financial reporting. In order to maintain and, if required, improve our disclosure controls and procedures and internal controls over financial reporting to meet this standard, significant resources and management oversight may be required. As a result, management's attention may be diverted from other business concerns, which could harm our business and results of operations. Although we have already hired additional employees to comply with these requirements, we may need to hire even more employees in the future, which will increase our costs and expenses.
We also expect that being a public company and these new rules and regulations will make it more expensive for us to obtain director and officer liability insurance, and we may be required to accept reduced coverage or incur substantially higher costs to obtain coverage. These factors could also make it more difficult for us to attract and retain qualified members of our board of directors, particularly to serve on our audit committee and compensation committee, and qualified executive officers.
If we fail to maintain proper and effective internal controls, our ability to produce accurate financial statements could be impaired.
After the completion of this offering, we will be subject to the reporting requirements of the Exchange Act, the Sarbanes-Oxley Act and the rules and regulations of the stock exchange on which our common stock is listed. The Sarbanes-Oxley Act requires, among other things, that we maintain effective disclosure controls and procedures and internal controls over financial reporting. Commencing with our fiscal year ending December 31, 2016, we must perform system and process evaluation and testing of our internal controls over financial reporting to allow management to report on the effectiveness of our internal controls over financial reporting in our Annual Report on Form 10-K for that year, as required by Section 404 of the Sarbanes-Oxley Act. This will require that we incur substantial additional professional fees and internal costs to expand our accounting and finance functions and that we expend significant management efforts. Prior to this offering, we have never been required to test our internal controls within a specified period, and, as a result, we may experience difficulty in producing accurate financial statements.
We may discover weaknesses in our system of internal financial and accounting controls and procedures that could result in a material misstatement of our financial statements. In addition, our internal control over financial reporting will not prevent or detect all errors and all fraud. A control system, no matter how well designed and operated, can provide only reasonable, not absolute, assurance that the control system's objectives will be met. Because of the inherent limitations in all control systems, no evaluation of controls can provide absolute assurance that misstatements due to error or fraud will not occur or that all control issues and instances of fraud will be detected.
If we are not able to comply with the requirements of Section 404 of the Sarbanes-Oxley Act in a timely manner, or if we are unable to maintain proper and effective internal controls, we may not be able to produce timely and accurate financial statements. If that were to happen, the market
36
price of our stock could decline and we could be subject to sanctions or investigations by the stock exchange on which our common stock is listed, the Securities and Exchange Commission, or SEC, or other regulatory authorities.
We are an "emerging growth company," and we cannot be certain if the reduced disclosure requirements applicable to emerging growth companies will make our common stock less attractive to investors.
For so long as we remain an "emerging growth company" as defined in the Jumpstart Our Business Startups Act of 2012, or the JOBS Act, we may take advantage of certain exemptions from various requirements that are applicable to public companies that are not "emerging growth companies," including not being required to comply with the independent auditor attestation requirements of Section 404 of the Sarbanes-Oxley Act, reduced disclosure obligations regarding executive compensation in our periodic reports and proxy statements and exemptions from the requirements of holding a nonbinding advisory vote on executive compensation and stockholder approval of any golden parachute payments not previously approved. We may take advantage of these exemptions for so long as we are an "emerging growth company," which could be as long as five years following the completion of this offering. Investors may find our common stock less attractive because we rely on these exemptions. If some investors find our common stock less attractive as a result, there may be a less active trading market for our common stock, and our stock price may be more volatile and may decline.
In addition, Section 107 of the JOBS Act also provides that an "emerging growth company" can take advantage of an extended transition period for complying with new or revised accounting standards. However, we chose to "opt out" of such extended transition period, and as a result, we will comply with new or revised accounting standards on the relevant dates adoption of such standards is required for non-emerging growth companies. Our decision to opt out of the extended transition period for complying with new or revised accounting standards is irrevocable.
Because the initial public offering price of our common stock will be substantially higher than the pro forma as adjusted net tangible book value per share of our outstanding common stock following this offering, new investors will experience immediate and substantial dilution.
The initial public offering price of our common stock is substantially higher than the pro forma as adjusted net tangible book value per share of our common stock immediately following this offering based on the total value of our tangible assets less our total liabilities. Therefore, if you purchase shares of our common stock in this offering, you will experience immediate dilution of $ per share, the difference between the assumed initial public offering price of $ per share, which is the midpoint of the range as set forth on the cover page of this prospectus, after deducting the underwriting discount and commissions and estimated offering expenses payable by us, and the pro forma as adjusted net tangible book value per share of our common stock as of , 2014, immediately after this offering. See the section entitled "Dilution."
If securities or industry analysts do not publish research or reports about our business, or publish unfavorable research reports about our business, our share price and trading volume could decline.
The trading market for our common stock will, to some extent, depend on the research and reports that securities or industry analysts publish about us or our business. We do not have any control over these analysts. If one or more of the analysts who cover us publishes unfavorable commentary about us or changes their opinion of our business prospects, our share price would likely decline. If one or more of these analysts ceases coverage of our company or fails to regularly publish reports on us, we could lose visibility in the financial markets, which could cause our share price or trading volume to decline.
37
We do not intend to pay dividends for the foreseeable future and, consequently, your ability to achieve a return on your investment will depend on appreciation in the price of our common stock.
We have never declared or paid any dividends on our common stock. We intend to retain any earnings to finance the operation and expansion of our business, and we do not anticipate paying any cash dividends in the future. As a result, you may only receive a return on your investment in our common stock if the market price of our common stock increases. In addition, each of our mezzanine loan and security agreement and our loan and security agreement, which we refer to as our credit facility agreements, contain restrictions on our ability to pay dividends.
Our credit facility agreements contain covenants that may restrict our business and financing activities.
Borrowings under our credit facility agreements are secured by substantially all of our assets. Our credit facility agreements also restrict our ability to, among other things:
- •
- dispose of or sell assets;
- •
- make material changes in our business or management;
- •
- consolidate or merge with or acquire other entities;
- •
- incur additional indebtedness;
- •
- incur liens on our assets;
- •
- pay dividends or make distributions on our capital stock;
- •
- make certain investments;
- •
- enter into transactions with our affiliates; and
- •
- make any payment in respect of any subordinated indebtedness.
These restrictions are subject to certain exceptions. In addition, our loan and security agreement requires us to maintain a minimum liquidity threshold, among other things.
The covenants in our credit facility agreements, as well as any future financing agreements that we may enter into, may restrict our ability to finance our operations, engage in, expand or otherwise pursue our business activities and strategies. Our ability to comply with these covenants may be affected by events beyond our control, and future breaches of any of these covenants could result in a default under our credit facility agreements. If not waived, future defaults could cause all of the outstanding indebtedness under our credit facility agreements to become immediately due and payable and terminate all commitments to extend further credit.
If we do not have or are unable to generate sufficient cash available to repay our debt obligations when they become due and payable, either upon maturity or in the event of a default, we may not be able to obtain additional debt or equity financing on favorable terms, if at all, which may negatively impact our ability to operate our business.
Our charter documents and Delaware law could discourage takeover attempts and lead to management entrenchment.
Our amended and restated certificate of incorporation and amended and restated bylaws that will be in effect upon completion of this offering contain provisions that could delay or prevent a change in control of our company. These provisions could also make it difficult for stockholders to
38
elect directors that are not nominated by the current members of our board of directors or take other corporate actions, including effecting changes in our management. These provisions include:
- •
- a classified board of directors with three-year staggered terms, which could delay the ability of stockholders to change
the membership of a majority of our board of directors;
- •
- the ability of our board of directors to issue shares of convertible preferred stock and to determine the price and other
terms of those shares, including preferences and voting rights, without stockholder approval, which could be used to significantly dilute the ownership of a hostile acquiror;
- •
- the exclusive right of our board of directors to elect a director to fill a vacancy created by the expansion of our board
of directors or the resignation, death or removal of a director, which prevents stockholders from being able to fill vacancies on our board of directors;
- •
- a prohibition on stockholder action by written consent, which forces stockholder action to be taken at an annual or
special meeting of our stockholders;
- •
- the requirement that a special meeting of stockholders may be called only by a majority vote of our entire board of
directors, the chairman of our board of directors or our chief executive officer, which could delay the ability of our stockholders to force consideration of a proposal or to take action, including
the removal of directors;
- •
- the requirement for the affirmative vote of holders of at least % of the voting power of all of the
then-outstanding shares of the voting stock, voting together as a single class, to amend the provisions of our amended and restated certificate of incorporation relating to the management of our
business or our amended and restated bylaws, which may inhibit the ability of an acquiror to effect such amendments to facilitate an unsolicited takeover attempt; and
- •
- advance notice procedures with which stockholders must comply to nominate candidates to our board of directors or to propose matters to be acted upon at a stockholders' meeting, which may discourage or deter a potential acquiror from conducting a solicitation of proxies to elect the acquiror's own slate of directors or otherwise attempting to obtain control of us.
In addition, as a Delaware corporation, we are subject to Section 203 of the Delaware General Corporation Law. These provisions may prohibit large stockholders, in particular those owning 15% or more of our outstanding voting stock, from merging or combining with us for a certain period of time.
39
SPECIAL NOTE REGARDING FORWARD-LOOKING STATEMENTS
This prospectus contains forward-looking statements that involve substantial risks and uncertainties. The forward-looking statements are contained principally in the sections titled "Prospectus Summary," "Risk Factors," "Management's Discussion and Analysis of Financial Condition and Results of Operations" and "Business," but are also contained elsewhere in this prospectus. Forward-looking statements include information concerning our possible or assumed future results of operations and expenses, business strategies and plans, market sizing, competitive position, industry environment and potential growth opportunities. Forward-looking statements include all statements that are not historical facts and, in some cases, can be identified by terms such as "anticipates," "believes," "could," "estimates," "expects," "intends," "may," "plans," "potential," "predicts," "projects," "seeks," "should," "will," "would" or similar expressions and the negatives of those terms.
Forward-looking statements involve known and unknown risks, uncertainties and other factors that may cause our actual results, performance or achievements to be materially different from any future results, performance or achievements expressed or implied by the forward-looking statements, including those described in "Risk Factors" and elsewhere in this prospectus. Given these uncertainties, you should not place undue reliance on these forward-looking statements. Also, forward-looking statements represent our beliefs and assumptions only as of the date of this prospectus. In light of the significant uncertainties in these forward-looking statements, you should not regard these statements as a representation or warranty by us or any other person that we will achieve our objectives and plans in any specified time frame, or at all. You should read this prospectus and the documents that we have filed as exhibits to the registration statement, of which this prospectus is a part, completely and with the understanding that our actual future results may be materially different from what we expect.
Some of the key factors that could cause actual results to differ from our expectations include:
- •
- our limited operating history, which makes it difficult to evaluate our current business and future prospects;
- •
- our ability to achieve or sustain profitability;
- •
- our ability to attract new customers or increase the allocation of our existing customers' marketing spend to us;
- •
- our ability to develop new products and services or enhance our existing products and services;
- •
- the effects of increased competition in our market and our ability to compete effectively;
- •
- our ability to comply with, and the effect on our business of, evolving legal standards and regulations, particularly
concerning privacy and data protection;
- •
- the seasonality of our business;
- •
- our dependence on the continued growth of the digital advertising market;
- •
- our ability to maintain a supply of media inventory or impressions;
- •
- our ability to retain key employees and attract additional key employees;
- •
- our ability to maintain effective internal controls; and
- •
- our recognition of revenue from customer subscriptions over the term of the customer agreements.
Any forward-looking statement made by us in this prospectus speaks only as of the date on which it is made. Except as required by law, we disclaim any obligation to update these forward-looking statements publicly, or to update the reasons actual results could differ materially from those anticipated in these forward-looking statements, even if new information becomes available in the future.
40
We obtained the industry, market and competitive position data used throughout this prospectus from our own internal estimates and research, industry and general publications and research, surveys and studies conducted by third parties. This information involves a number of assumptions and limitations, and while we believe that each source is reliable as of its respective date. Internal estimates are derived from publicly-available information released by industry analysts and third-party sources, our internal research and our industry experience, and are based on assumptions made by us based on such data and our knowledge of our industry and market, which we believe to be reasonable. In addition, while we believe the industry, market and competitive position data included in this prospectus is reliable and is based on reasonable assumptions, such data involves risks and uncertainties and is subject to change based on various factors, including those discussed in "Risk Factors." These and other factors could cause results to differ materially from those expressed in the estimates made by the independent parties and by us.
Certain information in the text of this prospectus is contained in independent industry publications. The source of each of these independent industry publications is provided below:
- •
- Advertising Age, 100 Leading National Advertisers 2014, June 2014.
- •
- Advertising Age, Agency Report, April 2014.
- •
- BIA/Kelsey, 2015 U.S. Local Media Forecast: Full Edition,
September 2014.
- •
- eMarketer Inc., U.S. Time Spent with Media: eMarketer's Updated Estimates for
2014, October 2014.
- •
- Euromonitor International, Retailing 2015: Euromonitor from trade sources/national
statistics, January 2015.
- •
- Planet Retail, USA—Outlets Analysis 2013-2019, June 2014.
41
We estimate that the net proceeds we receive from this offering will be approximately $ million based on the assumed initial public offering price of $ per share, which is the midpoint of the range included on the cover page of this prospectus, after deducting the underwriting discount and commissions and estimated offering expenses payable by us. If the underwriters' option to purchase additional shares in this offering from us is exercised in full, our estimated net proceeds will be approximately $ million after deducting the underwriting discount and commissions and estimated offering expenses payable by us.
A $1.00 increase or decrease in the assumed initial public offering price of $ per share would increase or decrease the net proceeds we receive from this offering by approximately $ million, assuming the number of shares offered by us as set forth on the cover page of this prospectus remains the same and after deducting the underwriting discount and commissions and estimated offering expenses payable by us. Similarly, each increase or decrease of shares offered by us would increase or decrease the net proceeds we receive from this offering by approximately $ million, assuming the assumed public offering price remains the same and after deducting the underwriting discount and commissions and estimated offering expenses payable by us.
The principal purposes of this offering are to create a public market for our common stock, obtain additional working capital and facilitate our future access to the public equity markets. Our management will have broad discretion in the application of the net proceeds to us from this offering, and investors will be relying on the judgment of our management regarding the application of the proceeds.
We intend to use the net proceeds from this offering for general corporate purposes, including working capital, sales and marketing activities, engineering initiatives including enhancement of our solution, investment in technology and development and capital expenditures. We also may use a portion of the net proceeds from this offering to acquire or invest in technologies, solutions or businesses that complement our business, although we have no present commitments, and we have not allocated specific amounts of net proceeds, to complete any such transactions or plans. Pending their use, we plan to invest our net proceeds from this offering in short-term, interest-bearing, investment-grade securities.
We have never declared or paid cash dividends on our capital stock. We currently intend to retain all available funds and any future earnings for use in the operation of our business and do not anticipate paying any cash dividends in the foreseeable future. Any future determination to declare cash dividends will be made at the discretion of our board of directors, subject to applicable laws, and will depend on our financial condition, results of operations, capital requirements, general business conditions and other factors that our board of directors may deem relevant. Additionally, our ability to pay dividends on our common stock is limited by the terms of our credit facility agreements.
42
The following table sets forth our cash and cash equivalents and capitalization as of September 30, 2014:
- •
- on an actual basis;
- •
- on a pro forma basis to give effect to (i) the automatic conversion of all outstanding shares of our convertible
preferred stock into an aggregate of 29,697,650 shares of our common stock and (ii) the amendment and restatement of our certificate of incorporation in connection with this offering;
and
- •
- on a pro forma as adjusted basis to give effect to the issuance and sale by us of shares of common stock in this offering, and the receipt of the net proceeds from our sale of these shares at an assumed initial public offering price of the common stock of $ per share, the midpoint of the price range on the cover page of this prospectus, after deducting the underwriting discount and commissions and estimated offering expenses payable by us.
The information below is illustrative only, and cash and cash equivalents, additional paid-in capital, total stockholders' (deficit) equity and total capitalization following the completion of this offering will change based on the actual initial public offering price and other terms of this offering determined at pricing. You should read this table in conjunction with the sections entitled "Management's Discussion and Analysis of Financial Condition and Results of Operations" and
43
"Description of Capital Stock" and our financial statements and related notes included elsewhere in this prospectus.
| |
As of September 30, 2014 | |||||||||
|---|---|---|---|---|---|---|---|---|---|---|
| |
Actual | Pro Forma | Pro Forma As Adjusted(1) |
|||||||
| |
(in thousands, except share data) |
|||||||||
Cash and cash equivalents |
$ | 12,480 | $ | 12,480 | ||||||
| | | | | | | | | | | |
| | | | | | | | | | | |
Convertible preferred stock: |
||||||||||
Convertible Series A preferred stock, $0.00005 par value; 4,973,014 shares authorized, 4,767,492 shares issued and outstanding, actual; no shares authorized, issued and outstanding, pro forma and pro forma as adjusted |
1,387 | — | ||||||||
Convertible Series B preferred stock, $0.00005 par value; 7,298,736 shares authorized, 7,298,736 shares issued and outstanding, actual; no shares authorized, issued and outstanding, pro forma and pro forma as adjusted |
3,089 | — | ||||||||
Convertible Series C preferred stock, $0.00005 par value; 10,813,002 shares authorized, 10,813,002 shares issued and outstanding, actual; no shares authorized, issued and outstanding, pro forma and pro forma as adjusted |
8,000 | — | ||||||||
Convertible Series D preferred stock, $0.00005 par value; 6,818,500 shares authorized, 6,818,420 shares issued and outstanding, actual; no shares authorized, issued and outstanding, pro forma and pro forma as adjusted |
13,000 | — | ||||||||
| | | | | | | | | | | |
Total convertible preferred stock |
25,476 | — | ||||||||
| | | | | | | | | | | |
| | | | | | | | | | | |
Stockholders' (deficit) equity: |
||||||||||
Common stock, $0.00005 par value; 44,000,000 shares authorized 7,991,423 shares issued and outstanding, actual; 44,000,000 shares authorized, 37,689,073 shares issued and outstanding, pro forma, shares issued and outstanding, pro forma as adjusted |
— | 2 | ||||||||
Additional paid-in capital |
3,962 | 29,436 | ||||||||
Accumulated other comprehensive loss |
(25 | ) | (25 | ) | ||||||
Accumulated deficit |
(27,356 | ) | (27,356 | ) | ||||||
| | | | | | | | | | | |
Total stockholders' (deficit) equity |
(23,419 | ) | 2,057 | |||||||
| | | | | | | | | | | |
| | | | | | | | | | | |
Total capitalization |
$ | 2,057 | $ | 2,057 | ||||||
| | | | | | | | | | | |
| | | | | | | | | | | |
- (1)
- A $1.00 increase (decrease) in the assumed initial public offering price of $ per share would increase (decrease) each of cash and cash equivalents, additional paid-in capital, total stockholders' (deficit) equity and total capitalization by $ million, assuming that the number of shares offered by us, as set forth on the cover page of this prospectus, remains the same, and after deducting the underwriting discount and commissions and estimated offering expenses payable by us. If the underwriters' option to purchase additional shares to cover over-allotments is exercised in full, the pro forma as adjusted amount of cash and cash equivalents, additional paid-in capital, total stockholders' (deficit) equity and total capitalization would increase by approximately $ million, after deducting the underwriting discount and commissions, and we would have shares of our common stock issued and outstanding, pro forma as adjusted. An increase (decrease) of shares offered by us would increase (decrease) each of cash and cash equivalents, additional paid-in capital, total stockholders' (deficit) equity and total capitalization by $ million, assuming the assumed public offering price remains the same and after deducting the underwriting discount and commissions and estimated offering expenses payable by us.
44
The table above excludes the following shares:
- •
- 6,695,951 shares of common stock issuable upon the exercise of options outstanding as of September 30, 2014 under
our 2010 Equity Incentive Plan, with a weighted average exercise price of $3.23 per share;
- •
- 990,850 shares of common stock issuable upon the exercise of options granted after September 30, 2014 under our
2010 Equity Incentive Plan, with a weighted average exercise price of $7.27 per share;
- •
- 200,000 shares of common stock issuable upon the exercise of lender warrants outstanding as of September 30, 2014
with an exercise price of $5.68 per share;
- •
- 100,000 shares of common stock issuable upon the exercise of lender warrants outstanding issued after September 30, 2014
with an exercise price of $5.68 per share; and
- •
- shares of our common stock reserved for future issuance under our equity compensation plans, consisting of 974,894 shares of our common stock that were reserved for issuance under our 2010 Equity Incentive Plan as of September 30, 2014, and shares of our common stock reserved for issuance under our 2015 Equity Incentive Plan. On the date immediately prior to the date of this prospectus, any remaining shares available for issuance under our 2010 Equity Incentive Plan were added to the shares reserved under our 2015 Equity Incentive Plan and we ceased granting awards under the 2010 Equity Incentive Plan. Our 2015 Equity Incentive Plan also provides for automatic annual increases in the number of shares reserved thereunder, as more fully described in "Executive Compensation—Equity Plans."
45
If you invest in our common stock, your interest will be diluted to the extent of the difference between the offering price per share of our common stock and the pro forma as adjusted net tangible book value per share of our common stock immediately after this offering.
Our pro forma net tangible book value (deficit) as of September 30, 2014 was $(0.7) million, or $(0.02) per share of common stock. Our pro forma net tangible book value (deficit) per share represents the amount of our total tangible assets reduced by the amount of our total liabilities and divided by the total number of shares of our common stock outstanding as of September 30, 2014, after giving effect to the automatic conversion of all outstanding shares of our convertible preferred stock into common stock in connection with this offering.
After giving effect to our sale in this offering of shares of common stock at an assumed initial public offering price of the common stock of $ per share, the midpoint of the price range on the cover page of this prospectus, after deducting the underwriting discount and commissions and estimated offering expenses payable by us, our pro forma as adjusted net tangible book value as of September 30, 2014 would have been approximately $ million, or $ per share of common stock. This represents an immediate increase in pro forma as adjusted net tangible book value of $ per share to our existing stockholders and an immediate dilution of $ per share to investors purchasing shares in this offering.
The following table illustrates this per share dilution.
Assumed initial offering price per share |
$ | ||||||
Pro forma net tangible book value (deficit) per share as of September 30, 2014 |
$ | (0.02 | ) | ||||
Increase in pro forma net tangible book value per share attributable to investors purchasing shares in this offering |
|||||||
| | | | | | | | |
Pro forma as adjusted net tangible book value per share after this offering |
|||||||
| | | | | | | | |
Dilution in pro forma net tangible book value per share to investors in this offering |
$ | ||||||
| | | | | | | | |
| | | | | | | | |
A $1.00 increase (decrease) in the assumed offering price of $ per share would increase (decrease) our pro forma as adjusted net tangible book value per share after this offering by $ , assuming that the number of shares offered by us, as set forth on the cover page of this prospectus, remains the same, and after deducting the underwriting discount and commissions and estimated offering expenses payable by us. Similarly, an increase (decrease) of shares offered by us would increase (decrease) our pro forma as adjusted net tangible book value per share after this offering by $ , assuming that the assumed public offering price remains the same and after deducting the underwriting discount and commissions and estimated offering expenses payable by us.
If the underwriters exercise their over-allotment option in full, the pro forma net tangible book value per share after giving effect to this offering would be approximately $ per share, and the dilution in pro forma net tangible book value per share to investors in this offering would be approximately $ per share.
The following table summarizes, as of September 30, 2014, the differences between the number of outstanding shares of our common stock purchased from us, after giving effect to the conversion of our convertible preferred stock into common stock, the total cash consideration paid and the average price per share (i) paid by our existing stockholders and (ii) to be paid by our new investors purchasing shares in this offering at the assumed offering price of the common stock of $ per share, the midpoint of the price range on the cover page of this prospectus, after
46
deducting the underwriting discount and commissions and estimated offering expenses payable by us:
| |
Shares Purchased | Total Consideration | |
|||||||||||||
|---|---|---|---|---|---|---|---|---|---|---|---|---|---|---|---|---|
| |
Average Price Per Share |
|||||||||||||||
| |
Number | Percent | Amount | Percent | ||||||||||||
Existing stockholders |
$ | $ | ||||||||||||||
New investors |
||||||||||||||||
| | | | | | | | | | | | | | | | | |
Total |
100 | % | $ | 100 | % | |||||||||||
| | | | | | | | | | | | | | | | | |
| | | | | | | | | | | | | | | | | |
A $1.00 increase (decrease) in the assumed initial public offering price of $ per share would increase (decrease) total consideration paid by new investors by $ million, assuming that the number of shares offered by us, as set forth on the cover page of this prospectus, remains the same, and after deducting the underwriting discount and commissions payable by us. Similarly, an increase (decrease) of shares offered by us would increase (decrease) total consideration paid by new investors by $ million, assuming that the assumed public offering price remains the same and after deducting the underwriter discount and commissions and estimated offering expenses payable by us.
If the underwriters exercise their over-allotment option in full, our existing stockholders would own % and our new investors would own % of the total number of shares of our common stock outstanding after this offering.
The table and discussions above are based on 37,689,073 shares of our common stock outstanding as of September 30, 2014, and exclude:
- •
- 6,695,951 shares of common stock issuable upon the exercise of options outstanding as of September 30, 2014 under
our 2010 Equity Incentive Plan, with a weighted average exercise price of $3.23 per share;
- •
- 990,850 shares of common stock issuable upon the exercise of options granted after September 30, 2014 under our
2010 Equity Incentive Plan, with a weighted average exercise price of $7.27 per share;
- •
- 200,000 shares of common stock issuable upon the exercise of lender warrants outstanding as of September 30, 2014
with an exercise price of $5.68 per share;
- •
- 100,000 shares of common stock issuable upon the exercise of lender warrants outstanding issued after September 30,
2014 with an exercise price of $5.68 per share; and
- •
- shares of our common stock reserved for future issuance under our equity compensation plans, consisting of 974,894 shares of our common stock that were reserved for issuance under our 2010 Equity Incentive Plan as of September 30, 2014, and shares of our common stock reserved for issuance under our 2015 Equity Incentive Plan. On the date immediately prior to the date of this prospectus, any remaining shares available for issuance under our 2010 Equity Incentive Plan were added to the shares reserved under our 2015 Equity Incentive Plan and we ceased granting awards under the 2010 Equity Incentive Plan. Our 2015 Equity Incentive Plan also provides for automatic annual increases in the number of shares reserved thereunder, as more fully described in "Executive Compensation—Equity Plans."
To the extent that any outstanding options are exercised, new investors will experience further dilution.
47
SELECTED CONSOLIDATED FINANCIAL DATA
The following tables set forth our selected consolidated financial data. The following selected consolidated statements of operations data for the years ended December 31, 2011, 2012 and 2013 and the selected consolidated balance sheet data as of December 31, 2012 and 2013 are derived from our audited consolidated financial statements appearing elsewhere in this prospectus. The selected consolidated balance sheet data as of December 31, 2011 is derived from audited financial statements not included in this prospectus. The data should be read together with "Management's Discussion and Analysis of Financial Condition and Results of Operations" and in conjunction with the consolidated financial statements, related notes and other financial information included elsewhere in this prospectus. The selected consolidated statements of operations data for the nine months ended September 30, 2013 and 2014 and the selected consolidated balance sheet data as of September 30, 2014 are derived from unaudited condensed consolidated financial statements appearing elsewhere in this prospectus.
The unaudited condensed consolidated financial data includes all adjustments, consisting of normal recurring adjustments, which management considers necessary for a fair presentation of our financial position and results of operations for these periods. Our historical results are not necessarily indicative of the results to be expected in the future, and our operating results for the nine months ended September 30, 2014 are not necessarily indicative of the results that may be expected for the year ending December 31, 2014.
| |
Year Ended December 31, | Nine Months Ended September 30, |
||||||||||||||
|---|---|---|---|---|---|---|---|---|---|---|---|---|---|---|---|---|
| |
2011 | 2012 | 2013 | 2013 | 2014 | |||||||||||
| |
(in thousands, except share and per share data) |
|||||||||||||||
Consolidated Statements of Operations Data: |
||||||||||||||||
Revenue |
$ | 14,679 | $ | 35,072 | $ | 66,068 | $ | 41,817 | $ | 67,864 | ||||||
Traffic acquisition costs |
7,762 | 16,485 | 27,712 | 17,160 | 27,552 | |||||||||||
Other cost of revenue |
1,295 | 2,982 | 3,904 | 2,721 | 5,360 | |||||||||||
| | | | | | | | | | | | | | | | | |
Gross profit |
5,622 | 15,605 | 34,452 | 21,936 | 34,952 | |||||||||||
Operating expenses: |
||||||||||||||||
Sales and marketing |
6,325 | 12,938 | 20,475 | 13,771 | 26,905 | |||||||||||
Research and development |
2,555 | 5,376 | 8,666 | 6,014 | 10,102 | |||||||||||
General and administrative |
2,117 | 4,043 | 5,217 | 3,342 | 8,440 | |||||||||||
| | | | | | | | | | | | | | | | | |
Total operating expenses |
10,997 | 22,357 | 34,358 | 23,127 | 45,447 | |||||||||||
(Loss) income from operations |
(5,375 | ) | (6,752 | ) | 94 | (1,191 | ) | (10,495 | ) | |||||||
Other expense (income): |
||||||||||||||||
Interest expense |
88 | 27 | 283 | 187 | 1,005 | |||||||||||
Other expense (income) |
31 | (19 | ) | (2 | ) | (2 | ) | (2 | ) | |||||||
| | | | | | | | | | | | | | | | | |
Total other expense (income) |
119 | 8 | 281 | 185 | 1,003 | |||||||||||
Loss before income taxes |
(5,494 | ) | (6,760 | ) | (187 | ) | (1,376 | ) | (11,498 | ) | ||||||
Provision for income taxes |
— | — | — | — | — | |||||||||||
| | | | | | | | | | | | | | | | | |
Net loss |
$ | (5,494 | ) | $ | (6,760 | ) | $ | (187 | ) | $ | (1,376 | ) | $ | (11,498 | ) | |
| | | | | | | | | | | | | | | | | |
| | | | | | | | | | | | | | | | | |
Net loss per share of common stock—basic and diluted |
$ | (1.11 | ) | $ | (1.07 | ) | $ | (0.03 | ) | $ | (0.19 | ) | $ | (1.49 | ) | |
| | | | | | | | | | | | | | | | | |
| | | | | | | | | | | | | | | | | |
Pro forma net loss per share of common stock—basic and diluted(1): |
$ | (0.01 | ) | $ | (0.31 | ) | ||||||||||
| | | | | | | | | | | | | | | | | |
| | | | | | | | | | | | | | | | | |
Weighted average shares of common stock used in computing net loss per share—basic and diluted |
4,965,155 |
6,340,942 |
7,417,068 |
7,398,718 |
7,737,968 |
|||||||||||
| | | | | | | | | | | | | | | | | |
| | | | | | | | | | | | | | | | | |
Weighted average shares of common stock used in computing pro forma net loss per share—basic and diluted(1): |
37,114,718 | 37,435,618 | ||||||||||||||
| | | | | | | | | | | | | | | | | |
| | | | | | | | | | | | | | | | | |
48
| |
Year Ended December 31, | Nine Months Ended September 30, |
||||||||||||||
|---|---|---|---|---|---|---|---|---|---|---|---|---|---|---|---|---|
| |
2011 | 2012 | 2013 | 2013 | 2014 | |||||||||||
| |
(in thousands) |
|||||||||||||||
Stock-based compensation expense included above: |
||||||||||||||||
Other cost of revenue |
$ | 1 | $ | 2 | $ | 6 | $ | 4 | $ | 11 | ||||||
Sales and marketing |
32 | 137 | 212 | 152 | 331 | |||||||||||
Research and development |
21 | 155 | 276 | 188 | 461 | |||||||||||
General and administrative |
230 | 259 | 85 | 64 | 651 | |||||||||||
Other financial data: |
||||||||||||||||
Revenue ex-TAC(2) |
$ | 6,917 | $ | 18,587 | $ | 38,356 | $ | 24,657 | $ | 40,312 | ||||||
Adjusted EBITDA(3) |
$ | (4,648 | ) | $ | (5,116 | ) | $ | 2,631 | $ | 621 | $ | (6,859 | ) | |||
- (1)
- Pro forma basic and diluted net loss per share have been calculated assuming the conversion of all outstanding shares of convertible preferred stock into 29,697,650 shares of common stock as of the beginning of the applicable period or at the time of issuance, if later.
- (2)
- We define Revenue ex-TAC as revenue less traffic acquisition costs. See "—Non-GAAP Financial Measures" for more information as to the limitations of using non-GAAP financial measures and for the reconciliation of Revenue ex-TAC to revenue, the most directly comparable financial measure calculated in accordance with GAAP.
- (3)
- We define Adjusted EBITDA as net loss before income taxes, interest expense, depreciation and amortization, stock-based compensation and change in fair value of convertible preferred stock warrant liability. See "—Non-GAAP Financial Measures" for more information and for a reconciliation of Adjusted EBITDA to net loss, the most directly comparable financial measure calculated in accordance with GAAP.
| |
As of December 31, | |
|||||||||||
|---|---|---|---|---|---|---|---|---|---|---|---|---|---|
| |
As of September 30, 2014 |
||||||||||||
| |
2011 | 2012 | 2013 | ||||||||||
| |
(in thousands) |
||||||||||||
Consolidated Balance Sheet Data: |
|||||||||||||
Cash and cash equivalents |
$ | 17,105 | $ | 9,831 | $ | 8,805 | $ | 12,480 | |||||
Accounts receivable, net |
4,603 | 15,028 | 24,233 | 29,443 | |||||||||
Restricted cash |
1,000 | 2,000 | 3,500 | — | |||||||||
Working capital |
18,001 | 16,431 | 20,611 | 22,586 | |||||||||
Total assets |
25,222 | 31,082 | 42,750 | 54,702 | |||||||||
Long-term debt, net |
3,700 | 10,718 | 17,761 | 30,862 | |||||||||
Total liabilities |
7,717 | 19,689 | 30,886 | 52,645 | |||||||||
Total convertible preferred stock |
25,475 | 25,476 | 25,476 | 25,476 | |||||||||
Total stockholders (deficit) |
(7,970 | ) | (14,083 | ) | (13,612 | ) | (23,419 | ) | |||||
Non-GAAP Financial Measures
Revenue ex-TAC
Revenue ex-TAC is a non-GAAP financial measure defined by us as revenue less traffic acquisition costs. Traffic acquisition costs consist of purchases of advertising impressions from RTB exchanges on a cost per thousand impression basis. We believe that Revenue ex-TAC is a meaningful measure of operating performance because it is frequently used for internal management purposes, indicates the effectiveness of delivering results to advertisers and facilitates a more complete period-to-period understanding of factors and trends affecting our underlying revenue performance. A limitation of Revenue ex-TAC is that it is a measure that other companies, including companies in our industry that have similar business arrangements, either may not use or may calculate differently, which reduces its usefulness as a comparative measure. Because of these and other limitations, we consider, and you should consider, Revenue ex-TAC alongside other GAAP financial measures, such as revenue, gross profit and total operating expenses. The following table presents a reconciliation of Revenue ex-TAC to revenue for each of the periods indicated:
| |
Year Ended December 31, | Nine Months Ended September 30, |
||||||||||||||
|---|---|---|---|---|---|---|---|---|---|---|---|---|---|---|---|---|
| |
2011 | 2012 | 2013 | 2013 | 2014 | |||||||||||
| |
(in thousands) |
|||||||||||||||
Revenue |
$ | 14,679 | $ | 35,072 | $ | 66,068 | $ | 41,817 | $ | 67,864 | ||||||
Less: traffic acquisition costs |
(7,762 | ) | (16,485 | ) | (27,712 | ) | (17,160 | ) | (27,552 | ) | ||||||
| | | | | | | | | | | | | | | | | |
Revenue ex-TAC |
$ | 6,917 | $ | 18,587 | $ | 38,356 | $ | 24,657 | $ | 40,312 | ||||||
| | | | | | | | | | | | | | | | | |
| | | | | | | | | | | | | | | | | |
49
Adjusted EBITDA
To provide investors with additional information regarding our financial results, we have provided within this prospectus Adjusted EBITDA, a non-GAAP financial measure. We define Adjusted EBITDA as net loss before income taxes, interest expense and depreciation and amortization, adjusted to eliminate stock-based compensation expense and change in fair value of convertible preferred stock warrant liability. We have provided a reconciliation below of Adjusted EBITDA to net loss, the most directly comparable GAAP financial measure.
We have included Adjusted EBITDA in this prospectus because it is a key measure used by our management and board of directors to understand and evaluate our core operating performance and trends, to prepare and approve our annual budget and to develop short- and long-term operating plans. In particular, we believe the exclusion of certain items in calculating Adjusted EBITDA can provide a useful measure for period-to-period comparisons of our business. Accordingly, we believe that Adjusted EBITDA provides useful information to investors in understanding and evaluating our operating results.
Our use of Adjusted EBITDA has limitations as an analytical tool, and you should not consider it in isolation or as a substitute for analysis of our results as reported under GAAP. Some of these limitations are:
- •
- although depreciation and amortization are non-cash charges, the assets being depreciated and amortized may have to be
replaced in the future, and Adjusted EBITDA does not reflect cash capital expenditure requirements for such replacements or for new capital expenditure requirements;
- •
- Adjusted EBITDA does not reflect changes in, or cash requirements for, our working capital needs;
- •
- Adjusted EBITDA does not reflect the potentially dilutive impact of equity-based compensation;
- •
- Adjusted EBITDA does not reflect interest or tax payments that may represent a reduction in cash available to us;
and
- •
- other companies, including companies in our industry, may calculate Adjusted EBITDA differently, which reduces its usefulness as a comparative measure.
Because of these and other limitations, we consider, and you should consider, Adjusted EBITDA together with other GAAP-based financial performance measures, including various cash flow metrics, net loss and our other GAAP results. The following table presents a reconciliation of net loss to Adjusted EBITDA for each of the periods indicated:
| |
Year Ended December 31, | Nine Months Ended September 30, |
||||||||||||||
|---|---|---|---|---|---|---|---|---|---|---|---|---|---|---|---|---|
| |
2011 | 2012 | 2013 | 2013 | 2014 | |||||||||||
| |
(in thousands) |
|||||||||||||||
Net loss |
$ | (5,494 | ) | $ | (6,760 | ) | $ | (187 | ) | $ | (1,376 | ) | $ | (11,498 | ) | |
Adjustments: |
||||||||||||||||
Interest expense |
88 | 27 | 283 | 187 | 1,005 | |||||||||||
Provision for income taxes |
— | — | — | — | — | |||||||||||
Depreciation and amortization |
443 | 1,063 | 1,956 | 1,402 | 2,180 | |||||||||||
Stock-based compensation |
284 | 553 | 579 | 408 | 1,454 | |||||||||||
Change in fair value of warrant to purchase Series A convertible preferred stock |
31 | 1 | — | — | — | |||||||||||
| | | | | | | | | | | | | | | | | |
Adjusted EBITDA |
$ | (4,648 | ) | $ | (5,116 | ) | $ | 2,631 | $ | 621 | $ | (6,859 | ) | |||
| | | | | | | | | | | | | | | | | |
| | | | | | | | | | | | | | | | | |
50
MANAGEMENT'S DISCUSSION AND ANALYSIS OF FINANCIAL
CONDITION AND RESULTS OF OPERATIONS
You should read the following discussion and analysis of our financial condition and results of operations together with our consolidated financial statements and the related notes and other financial information included elsewhere in this prospectus. Some of the information contained in this discussion and analysis or set forth elsewhere in this prospectus, including information with respect to our plans and strategy for our business, includes forward-looking statements that involve risks and uncertainties. You should review the "Risk Factors" section of this prospectus for a discussion of important factors that could cause actual results to differ materially from the results described in or implied by the forward-looking statements contained in the following discussion and analysis.
Overview
We provide a leading business intelligence and marketing automation software service, which we refer to as our solution, that enables national brands to drive local, in-store sales. National brands use our MaxPoint Intelligence Platform to predict the most likely local buyers of a specific product at a particular retail location and then execute cross-channel digital marketing campaigns to reach these buyers. Business intelligence is at the core of our solution, which leverages high-velocity data processing and proprietary statistical models to continuously analyze more than 10 billion daily data attributes to delineate consumers' real-time purchase intent. By identifying and reaching only the most likely local buyers with digital customized product offers for local stores, national brands can more efficiently and effectively run local marketing campaigns, thereby increasing in-store sales and reducing wasted marketing spend associated with traditional approaches. We provide a technology-driven alternative to traditional local marketing methods for national brands across a number of industries where transactions take place predominantly offline, such as consumer products, retail, automotive, healthcare, telecommunications and entertainment.
We operate in one segment and generate revenue by delivering local, targeted digital marketing campaigns for customers through various channels, including display, mobile, social and video. We define "local," in terms of both retail locations and buyers or consumers, as the close proximity of a targeted consumer to a targeted retail location, typically within a specific Digital Zip. Historically, our revenue has predominantly come from display advertising because it was the first to be made available for programmatic purchasing through real-time bidding, or RTB, exchanges. The digital advertising industry is rapidly adopting programmatic purchasing for display, mobile, social and video advertising and accelerating the amount and variety of digital media inventory available through RTB exchanges. As we continue to expand in the mobile, social and video channels, we must continue to utilize our platform to effectively provide targeted campaigns in an efficient manner through a combination of pricing with our customers and by managing the costs associated with RTB exchanges. Any significant shift in the mix of channels used to provide our marketing automation software solution to our customers could have a favorable or unfavorable impact on our revenues, Revenue ex-TAC and gross profit.
Through marketing automation and direct integrations with RTB exchanges, our platform delivers customized digital advertisements containing product and store specific promotions to local consumers across display, mobile, social and video channels. National brands can then measure the offline sales impact of those digital marketing campaigns to optimize future campaigns and budgets and manage in-store supply levels. Our customers typically pay us on a cost per thousand impressions, or CPM, model based on the number of impressions we deliver through our platform for each marketing campaign.
Our diverse customer base consists primarily of enterprises with national brands in the consumer products, retail, automotive, healthcare, telecommunications and entertainment industries. We sell our solution either directly to our customers or through advertising agencies that act on
51
behalf of our customers. We have worked with each of the top 20 leading national advertisers and each of the top 10 advertising agencies in the United States as ranked in 2014 by Advertising Age. As of September 30, 2014, we had 431 enterprise customers as described in "—Key Financial and Operating Performance Metrics." Our customer agreements typically have terms of less than three months and are cancellable at any time, and we recognize revenue as we deliver advertising impressions, subject to satisfying all other revenue recognition criteria. Our revenue recognition policies are discussed in more detail under "—Critical Accounting Policies and Significant Judgments and Estimates."
Since our inception in 2006, we have focused on developing our solutions to address the challenges that national brands experience with local marketing. During our early years, we focused largely on product development, which resulted in the introduction of our MaxPoint Intelligence Platform in 2011 as a service primarily run by us on behalf of our customers. Since 2013, our customers have also had the ability to directly interface with the MaxPoint Intelligence Platform software service. We have grown our revenue from $14.7 million for the year ended December 31, 2011 to $66.1 million for the year ended December 31, 2013, representing a compounded annual growth rate, or CAGR, of 112%. Our revenue increased from $41.8 million for the nine months ended September 30, 2013 to $67.9 million for the nine months ended September 30, 2014, representing an increase of 62%. To date, substantially all of our revenue has come from sales in the United States.
Our goal is to be the leading strategic partner assisting national brands in driving local, in-store sales. The core elements of our growth strategy include increasing our share of existing customer spend, acquiring new customers, further penetrating new industries, continuing to innovate and invest in our technology, and expanding internationally. To accomplish our goal, we plan to invest for long-term growth. We anticipate that our operating expenses will increase in the foreseeable future as we execute the core elements of our growth strategy. While these investments will likely reduce our profitability in the near term, we believe they will contribute to our long-term growth.
We face a variety of challenges and risks, which we will need to address and manage as we pursue our growth strategy. In particular, if we are to remain competitive, we will need to continue to innovate in the face of a rapidly changing advertising landscape and need to effectively manage our growth. Our senior management continuously focuses on these and other challenges, and we believe that our culture of innovation and our history of expansive growth will contribute to the success of our business. We cannot, however, assure you that we will be successful in addressing and managing the many challenges and risks that we face.
Key Financial and Operating Performance Metrics
We regularly monitor a number of financial and operating metrics in order to measure our performance and project our future performance. The following metrics aid us in developing and refining our growth strategies and making strategic decisions:
| |
Year Ended December 31, | Nine Months Ended September 30, |
||||||||||||||
|---|---|---|---|---|---|---|---|---|---|---|---|---|---|---|---|---|
| |
2011 | 2012 | 2013 | 2013 | 2014 | |||||||||||
| |
(in thousands, except number of enterprise customers) |
|||||||||||||||
Revenue |
$ | 14,679 | $ | 35,072 | $ | 66,068 | $ | 41,817 | $ | 67,864 | ||||||
Revenue ex-TAC |
$ | 6,917 | $ | 18,587 | $ | 38,356 | $ | 24,657 | $ | 40,312 | ||||||
Adjusted EBITDA |
$ | (4,648 | ) | $ | (5,116 | ) | $ | 2,631 | $ | 621 | $ | (6,859 | ) | |||
Number of enterprise customers |
106 | 225 | 304 | 292 | 431 | |||||||||||
52
Revenue ex-TAC
Revenue ex-TAC is a non-GAAP financial measure defined by us as revenue less traffic acquisition costs. Traffic acquisition costs consist of purchases of advertising impressions from RTB exchanges on a CPM basis. We believe that revenue ex-TAC is a meaningful measure of operating performance because it is frequently used for internal management purposes, indicates the effectiveness of delivering results to advertisers and facilitates a more complete period-to-period understanding of factors and trends affecting our underlying revenue performance. The metric combines the important factors of our ability to sustain pricing with our customers, purchase inventory at reasonable and expected prices, and to scale our business. Please see "Selected Consolidated Financial Data—Non-GAAP Financial Measures" for more information as to the limitations of using non-GAAP financial measures and for a reconciliation of Revenue ex-TAC to revenue, the most directly comparable financial measure calculated in accordance with GAAP.
Adjusted EBITDA
Adjusted EBITDA represents our net loss before income taxes, interest expense and depreciation and amortization, adjusted to eliminate stock-based compensation expense and change in fair value of convertible preferred stock warrant liability. We have presented Adjusted EBITDA in this prospectus because it is a key measure used by our management and board of directors to understand and evaluate our core operating performance and trends, to prepare and approve our annual budget and to develop short- and long-term operating plans. In particular, we believe that the exclusion of certain items in calculating Adjusted EBITDA can provide a useful measure for period-to-period comparisons of our core business. Accordingly, we believe that Adjusted EBITDA provides useful information in understanding and evaluating our operating results. Please see "Selected Consolidated Financial Data—Non-GAAP Financial Measures" for information regarding the limitations of using Adjusted EBITDA as a financial measure and for a reconciliation of Adjusted EBITDA to net loss, the most directly comparable financial measure calculated in accordance with GAAP.
Number of Enterprise Customers
We believe our ability to increase the revenue we generate from existing customers and attract new customers is an important component of our growth strategy. We also believe that those customers from which we have generated more than $10,000 of revenue during any trailing twelve-month period best identifies customers that are actively using our solution and contribute more meaningfully to revenue. We refer to these customers as our enterprise customers. Our ability to generate additional revenue from our enterprise customers is an important indicator of our ability to grow revenue over time. As of December 31, 2011, 2012 and 2013 and September 30, 2014, customers from which we have generated less than $10,000 of revenue during the previous trailing twelve-month period have accounted for less than 2% of our revenue.
In those cases where we work with multiple brands or divisions within the same company or where the company runs marketing campaigns in multiple geographies, even though multiple insertion orders may be involved, we count that company as a single customer. When the insertion order is with an advertising agency, we consider the company on behalf of which the marketing campaign is conducted as our enterprise customer. If a company has its marketing spend with us managed by multiple advertising agencies, that company is counted as a single enterprise customer.
While the number of our enterprise customers has increased over time, this number can also fluctuate from quarter to quarter due to the seasonal trends in the advertising spend of our enterprise and other customers, which can impact the timing and amount of revenue we generate from them. Therefore, there is not necessarily a direct correlation between a change in the number
53
of enterprise customers for a particular period and an increase or decrease in our revenue during that period.
Key Factors Affecting Our Performance
Increasing Share of Spend from Existing Customers
While we have a significant customer base, we believe our ability to retain and capture an increasing share of our existing customers' marketing budgets is a key indicator of our market penetration, growth and future revenue. We intend to expand our footprint with our existing advertiser customers by working with a larger number of their national brands and by growing the number of geographies, regions and individual stores for which they use our software solution. We also plan to invest in our sales organization to deepen and strengthen our relationship with existing customers. Enterprise customers who began working with us in 2011 spent 48% more with us in 2012 and an additional 68% in 2013, and enterprise customers who began working with us in 2012 spent an additional 32% with us in 2013. As an additional example of the growth of acceptance of our product, the performance of our top 25 customers for each of 2011, 2012 and 2013 is as follows:
| |
2011 | 2012 | 2013 | |||||||
|---|---|---|---|---|---|---|---|---|---|---|
Revenue from top 25 customers (in millions) |
$ | 11.0 | $ | 18.3 | $ | 36.4 | ||||
Percent of total revenue from top 25 customers |
75% | 52% | 55% | |||||||
Revenue per top 25 customer (in thousands) |
$ | 439 | $ | 734 | $ | 1,457 | ||||
Total campaigns for top 25 customers |
415 | 928 | 2,104 | |||||||
Campaigns per top 25 customer |
17 | 37 | 84 | |||||||
Acquiring New Customers
Our growth in our customer base is also an important element of our growth strategy. Our goal is to attract new customers by growing market awareness of our solution. We believe that we are well positioned for future growth and that we have an opportunity to continue expanding our customer base in the coming years, and we plan to invest in growing our sales organization and marketing efforts in order to reach these potential customers.
Further Penetrating New Industries
Historically, we have focused primarily on serving national brands in three industries: consumer products, retail and automotive. We have recently expanded into three new industries: healthcare, telecommunications and entertainment. Our plan is to continue to penetrate these new industries and pursue opportunities in additional industries.
Continuing to Innovate and Invest in our Technology
Our technology is a key factor affecting our performance. We plan to continue to make substantial investments in our technology and research and development to enhance the effectiveness of our solution in an effort to deliver increasing value to our customers. In addition to improving our data processing, business intelligence and marketing execution technologies, we intend to enhance ways that our customers can access and utilize our solution and extract greater intelligence from the data we aggregate and generate. One recent innovation has been our ability to purchase non-display advertisements through our platform on behalf of our customers, which was introduced in the fourth quarter of 2012. Revenue from non-display advertisements has grown rapidly from 8% of revenue, or approximately $0.9 million, in the first quarter of 2013, to 20% of revenue, or approximately $5.5 million, in the third quarter of 2014.
54
Expanding Internationally
To date, we have focused our efforts on developing our solution for the U.S. market. We believe that our technology and solution can be adapted to other countries where national brands face similar challenges with local marketing. We recently established a presence in the United Kingdom and will continue to explore additional international expansion opportunities.
Seasonality
In the advertising industry, companies commonly experience seasonal fluctuations in revenue. For example, many advertisers allocate the largest portion of their budgets to the fourth quarter of the calendar year to coincide with increased holiday purchasing. Historically, the fourth quarter of the year reflects our highest level of advertising activity, and the first quarter reflects the lowest level of such activity. We expect our revenue to continue to fluctuate based on seasonal factors that affect the advertising industry as a whole.
Components of Our Results of Operations
Revenue
We generate revenue by delivering targeted digital marketing campaigns for customers through various channels, including display, mobile, social and video. Our revenue arrangements are evidenced by a fully executed insertion order, or IO. Our IOs typically have a term of less than three months and are cancellable at any time. We recognize revenue as we deliver advertising impressions, subject to satisfying all other revenue recognition criteria. We generally price our marketing campaigns on a CPM model based on the number of impressions delivered for each marketing campaign. We typically do not receive upfront payments from our customers and therefore, record an insignificant amount of deferred revenue. We contract with customers either directly or through advertising agencies that act on behalf of our customers. When we contract with an advertising agency, it acts as an agent for a disclosed principal, which is our customer. Our agreements also provide that if the customer fails to pay the advertising agency, the advertising agency is not liable to us and we must seek payment solely from the customer. Our revenue recognition policies are discussed in more detail under "Critical Accounting Policies and Significant Judgments and Estimates."
Traffic Acquisition Costs
Traffic acquisition costs consists of media costs for advertising impressions we purchase from RTB exchanges, which are expensed as incurred. We purchase impressions, generally on a CPM basis, directly from these exchanges and typically pay them monthly for actual advertising impressions acquired. Historically, we have not committed to purchasing a defined volume of impressions from any of these exchanges. We anticipate our traffic acquisition costs will increase in absolute dollars as our revenue increases. However, our traffic acquisition costs will fluctuate on a quarterly basis due to the seasonality of our business, our experimentation with and refinement of our real-time bidding platform, competition for impressions on RTB exchanges, the type of media inventory we are purchasing and the types of campaigns we are implementing for our customers.
Other Cost of Revenue
Other cost of revenue primarily consists of third-party data centers and advertisement-serving costs, depreciation of data center equipment, amortization of capitalized internal-use software cost for revenue-producing technologies, purchases of third-party data for specific marketing campaigns and salaries and personnel-related costs of our employees dedicated to executing our marketing campaigns. The number of employees dedicated to executing our marketing campaigns grew from two at December 31, 2011 to 16 at September 30, 2014, and we expect to continue to hire new
55
employees in order to support our anticipated revenue growth. We anticipate our other cost of revenue will increase in absolute dollars as our revenue increases.
Operating Expenses
Operating expenses consist of sales and marketing, research and development and general and administrative expenses. Salaries and personnel-related costs are the most significant component of each of these expense categories. The number of employees related to these expense categories grew from 59 at December 31, 2011 to 275 at September 30, 2014, and we expect to continue to hire new employees in order to support our anticipated revenue growth.
Sales and marketing expense. Sales and marketing expense consists primarily of salaries and personnel-related costs for our sales and marketing and customer support employees, including benefits, bonuses, stock-based compensation expense and commissions. We record expense for commissions ratably over the term of the associated marketing campaign. Additional expenses include marketing, advertising and promotional event programs, corporate communications, travel, and allocated overhead costs. The number of employees in our sales and marketing functions grew from 27 at December 31, 2011 to 148 at September 30, 2014, and we expect our sales and marketing expense to increase in absolute dollars in the foreseeable future as we further increase the number of our sales and marketing professionals and expand our marketing activities in order to continue to grow our business.
Research and development expense. Research and development expense consists primarily of salaries and personnel-related costs for our engineering and research and development employees, including benefits, bonuses and stock-based compensation expense. Additional expenses include costs related to the development, quality assurance and testing of new technology and enhancement of our existing platform technology, third-party data costs purchased for the development and enhancement of our technology platform, consulting, and allocated overhead costs. The number of employees in research and development functions increased from 22 at December 31, 2011 to 95 at September 30, 2014. We believe continuing to invest in research and development efforts is essential to maintaining our competitive position.
General and administrative expense. General and administrative expense consists primarily of salaries and personnel-related costs for administrative, finance and accounting, information systems, legal and human resource employees, including benefits, bonuses and stock-based compensation expense. Additional expenses include consulting and professional fees, insurance, legal, other corporate expenses and travel. The number of employees in general and administrative functions grew from 10 at December 31, 2011 to 32 at September 30, 2014, and we expect our general and administrative expenses to increase in absolute dollars as a result of our preparation to become and operate as a public company. After the completion of this offering, these expenses will also include costs associated with compliance with the Sarbanes-Oxley Act and other regulations governing public companies, directors' and officers' liability insurance, increased professional services, and an enhanced investor relations function.
Other Expense (Income)
Other expense (income) consists primarily of interest expense, interest income and rental income from subleasing a portion of our office space. Interest expense consists of interest incurred on outstanding borrowings under our credit facilities, amortization of the debt discount related to common stock warrants granted to a lender and any adjustment of the warrants' related fair value at the end of each reporting period.
56
Provision for Income Taxes
Provision for income taxes consists of U.S. federal, state and foreign income taxes. We incurred minimal income tax expense for the years ended December 31, 2011, 2012 and 2013.
Results of Operations
The following table sets forth selected consolidated statements of operations data for each of the periods indicated.
| |
Year Ended December 31, | Nine Months Ended September 30, |
||||||||||||||
|---|---|---|---|---|---|---|---|---|---|---|---|---|---|---|---|---|
| |
2011 | 2012 | 2013 | 2013 | 2014 | |||||||||||
| |
(in thousands) |
|||||||||||||||
Revenue |
$ | 14,679 | $ | 35,072 | $ | 66,068 | $ | 41,817 | $ | 67,864 | ||||||
Traffic acquisition costs |
7,762 | 16,485 | 27,712 | 17,160 | 27,552 | |||||||||||
Other cost of revenue |
1,295 | 2,982 | 3,904 | 2,721 | 5,360 | |||||||||||
| | | | | | | | | | | | | | | | | |
Gross profit |
5,622 | 15,605 | 34,452 | 21,936 | 34,952 | |||||||||||
Operating expenses: |
||||||||||||||||
Sales and marketing |
6,325 | 12,938 | 20,475 | 13,771 | 26,905 | |||||||||||
Research and development |
2,555 | 5,376 | 8,666 | 6,014 | 10,102 | |||||||||||
General and administrative |
2,117 | 4,043 | 5,217 | 3,342 | 8,440 | |||||||||||
| | | | | | | | | | | | | | | | | |
Total operating expenses |
10,997 | 22,357 | 34,358 | 23,127 | 45,447 | |||||||||||
(Loss) income from operations |
(5,375 | ) | (6,752 | ) | 94 | (1,191 | ) | (10,495 | ) | |||||||
Other expense (income): |
||||||||||||||||
Interest expense |
88 | 27 | 283 | 187 | 1,005 | |||||||||||
Other expense (income) |
31 | (19 | ) | (2 | ) | (2 | ) | (2 | ) | |||||||
| | | | | | | | | | | | | | | | | |
Total other expense (income) |
119 | 8 | 281 | 185 | 1,003 | |||||||||||
Loss before income taxes |
(5,494 | ) | (6,760 | ) | (187 | ) | (1,376 | ) | (11,498 | ) | ||||||
Provision for income taxes |
— | — | — | — | — | |||||||||||
| | | | | | | | | | | | | | | | | |
Net loss |
$ | (5,494 | ) | $ | (6,760 | ) | $ | (187 | ) | $ | (1,376 | ) | $ | (11,498 | ) | |
| | | | | | | | | | | | | | | | | |
| | | | | | | | | | | | | | | | | |
The following table sets forth our consolidated statements of operations data as a percentage of revenue for each of the periods indicated.
| |
Year Ended December 31, | Nine Months Ended September 30, |
||||||||||||||
|---|---|---|---|---|---|---|---|---|---|---|---|---|---|---|---|---|
| |
2011 | 2012 | 2013 | 2013 | 2014 | |||||||||||
| |
(as a percentage of revenue) |
|||||||||||||||
Revenue |
100.0 | % | 100.0 | % | 100.0 | % | 100.0 | % | 100.0 | % | ||||||
Traffic acquisition costs |
52.9 | % | 47.0 | % | 41.9 | % | 41.0 | % | 40.6 | % | ||||||
Other cost of revenue |
8.8 | % | 8.5 | % | 5.9 | % | 6.5 | % | 7.9 | % | ||||||
| | | | | | | | | | | | | | | | | |
Gross profit |
38.3 | % | 44.5 | % | 52.2 | % | 52.5 | % | 51.5 | % | ||||||
Operating expenses: |
||||||||||||||||
Sales and marketing |
43.1 | % | 36.9 | % | 31.0 | % | 32.9 | % | 39.6 | % | ||||||
Research and development |
17.4 | % | 15.3 | % | 13.1 | % | 14.4 | % | 14.9 | % | ||||||
General and administrative |
14.4 | % | 11.5 | % | 7.9 | % | 8.0 | % | 12.4 | % | ||||||
| | | | | | | | | | | | | | | | | |
Total operating expenses |
74.9 | % | 63.7 | % | 52.0 | % | 55.3 | % | 66.9 | % | ||||||
(Loss) income from operations |
(36.6 | )% | (19.2 | )% | 0.2 | % | (2.8 | )% | (15.4 | )% | ||||||
Other expense (income): |
||||||||||||||||
Interest expense |
0.6 | % | 0.1 | % | 0.4 | % | 0.4 | % | 1.5 | % | ||||||
Other income |
0.2 | % | (0.1 | )% | 0.0 | % | 0.0 | % | 0.0 | % | ||||||
| | | | | | | | | | | | | | | | | |
Total other expense (income) |
0.8 | % | — | % | 0.4 | % | 0.4 | % | 1.5 | % | ||||||
Loss before income taxes |
(37.4 | )% | (19.2 | )% | (0.2 | )% | (3.2 | )% | (16.9 | )% | ||||||
Provision for income taxes |
— | % | — | % | — | % | — | % | — | % | ||||||
| | | | | | | | | | | | | | | | | |
Net loss |
(37.4 | )% | (19.2 | )% | (0.2 | )% | (3.2 | )% | (16.9 | )% | ||||||
| | | | | | | | | | | | | | | | | |
| | | | | | | | | | | | | | | | | |
57
Comparison of Nine Months Ended September 30, 2013 and 2014
| |
Nine Months Ended September 30, | |
|
||||||||||||||||
|---|---|---|---|---|---|---|---|---|---|---|---|---|---|---|---|---|---|---|---|
| |
2013 | 2014 | |
|
|||||||||||||||
| |
Period-to-Period Change | ||||||||||||||||||
| |
|
Percentage of Revenue |
|
Percentage of Revenue |
|||||||||||||||
| |
Amount | Amount | Amount | Percentage | |||||||||||||||
| |
(in thousands, except percentages) |
||||||||||||||||||
Revenue |
$ | 41,817 | 100.0 | % | $ | 67,864 | 100.0 | % | $ | 26,047 | 62.3 | % | |||||||
Traffic acquisition costs |
17,160 | 41.0 | % | 27,552 | 40.6 | % | 10,392 | 60.6 | % | ||||||||||
Other cost of revenue |
2,721 | 6.5 | % | 5,360 | 7.9 | % | 2,639 | 97.0 | % | ||||||||||
| | | | | | | | | | | | | | | | | | | | |
Gross profit |
21,936 | 52.5 | % | 34,952 | 51.5 | % | 13,016 | 59.3 | % | ||||||||||
Operating expenses: |
|||||||||||||||||||
Sales and marketing |
13,771 | 32.9 | % | 26,905 | 39.6 | % | 13,134 | 95.4 | % | ||||||||||
Research and development |
6,014 | 14.4 | % | 10,102 | 14.9 | % | 4,088 | 68.0 | % | ||||||||||
General and administrative |
3,342 | 8.0 | % | 8,440 | 12.4 | % | 5,098 | 152.5 | % | ||||||||||
| | | | | | | | | | | | | | | | | | | | |
Total operating expenses |
23,127 | 55.3 | % | 45,447 | 66.9 | % | 22,320 | 96.5 | % | ||||||||||
Loss from operations |
(1,191 | ) | (2.8 | )% | (10,495 | ) | (15.4 | )% | (9,304 | ) | 781.2 | % | |||||||
Other expense (income): |
|||||||||||||||||||
Interest expense |
187 | 0.4 | % | 1,005 | 1.5 | % | 818 | 437.4 | % | ||||||||||
Other income |
(2 | ) | 0.0 | % | (2 | ) | 0.0 | % | — | 0.0 | % | ||||||||
| | | | | | | | | | | | | | | | | | | | |
Total other expense (income) |
185 | 0.4 | % | 1,003 | 1.5 | % | 818 | 442.2 | % | ||||||||||
Loss before income taxes |
(1,376 | ) | (3.2 | )% | (11,498 | ) | (16.9 | )% | (10,122 | ) | 735.6 | % | |||||||
Provision for income taxes |
— | — | % | — | — | % | — | — | % | ||||||||||
| | | | | | | | | | | | | | | | | | | | |
Net loss |
$ | (1,376 | ) | (3.2 | )% | $ | (11,498 | ) | (16.9 | )% | $ | (10,122 | ) | 735.6 | % | ||||
| | | | | | | | | | | | | | | | | | | | |
| | | | | | | | | | | | | | | | | | | | |
Revenue. Revenue increased by $26.0 million, or 62.3%, from $41.8 million for the nine months ended September 30, 2013 to $67.9 million for the nine months ended September 30, 2014. This growth was primarily attributable to the combined effect of an increase in the number of enterprise customers and in revenue per enterprise customer during the nine months ended September 30, 2014 compared to the nine months ended September 30, 2013. The number of enterprise customers increased 47.6% from 292 as of September 30, 2013 to 431 as of September 30, 2014. In addition, our revenue per enterprise customer increased 9.6% during the nine months ended September 30, 2014 as compared to the nine months ended September 30, 2013.
Traffic acquisition costs. Traffic acquisition costs increased by $10.4 million, or 60.6%, from $17.2 million for the nine months ended September 30, 2013 to $27.6 million for the nine months ended September 30, 2014. The increase in traffic acquisition costs was primarily attributable to the increased volume of impressions purchased on RTB exchanges. As a percentage of revenue, traffic acquisition costs decreased from 41.0% for the nine months ended September 30, 2013 to 40.6% for the nine months ended September 30, 2014. The decrease in traffic acquisition costs as a percentage of revenue was primarily due to improvements in our real-time bidding platform, which allowed us to more efficiently purchase advertising impressions.
Other cost of revenue. Other cost of revenue increased by $2.6 million, or 97.0%, from $2.7 million for the nine months ended September 30, 2013 to $5.4 million for the nine months
58
ended September 30, 2014. The increase in other cost of revenue was primarily attributable to an increase in infrastructure costs required to support our technology platform. This included a $0.5 million increase in amortization of internal-use software and depreciation expense, $0.5 million increase in purchases of third-party data and a $0.4 million increase in third-party data center costs. In addition, we experienced a $0.9 million increase in third-party advertisement-serving costs due to the increased volume of impressions delivered. We also experienced a $0.3 million increase in salaries and personnel-related costs. The number of full-time employees dedicated to executing our marketing campaigns increased from 7 at September 30, 2013 to 16 at September 30, 2014. As a percentage of revenue, other cost of revenue increased from 6.5% for the nine months ended September 30, 2013 to 7.9% for the nine months ended September 30, 2014.
Sales and marketing. Sales and marketing expense increased by $13.1 million, or 95.4%, from $13.8 million, or 32.9% of revenue, for the nine months ended September 30, 2013, to $26.9 million, or 39.6% of revenue, for the nine months ended September 30, 2014. The increase in sales and marketing expense was primarily attributable to a $10.5 million increase in salaries and personnel-related costs, as we increased the number of sales and marketing and customer support personnel to continue driving revenue growth. The number of full-time sales and marketing employees increased from 73 at September 30, 2013 to 148 at September 30, 2014. In addition, we experienced an increase in marketing, advertising and promotional events, and travel costs of $1.9 million as we focused on marketing our software solution to generate awareness, expanding our footprint with existing advertiser customers, and increasing the adoption of our software solution by new customers. We also experienced a $0.7 million increase in allocated overhead costs.
Research and development. Research and development expense increased by $4.1 million, or 68.0%, from $6.0 million, or 14.4% of revenue, for the nine months ended September 30, 2013, to $10.1 million, or 14.9% of revenue, for the nine months ended September 30, 2014. The increase in research and development expense was primarily attributable to a $4.1 million increase in salaries and personnel-related costs associated with an increase in research and development personnel. The number of full-time research and development employees increased from 59 at September 30, 2013 to 95 at September 30, 2014. In addition, we experienced increases in costs related to improving our existing technology platform of $0.2 million and third-party data costs of $0.4 million. These increases were partially offset by a decline in allocated overhead and consulting costs of $0.6 million.
General and administrative. General and administrative expense increased by $5.1 million, or 152.5%, from $3.3 million, or 8.0% of revenue, for the nine months ended September 30, 2013, to $8.4 million, or 12.4% of revenue, for the nine months ended September 30, 2014. The increase in general and administrative expense was primarily attributable to a $2.0 million increase in salaries and personnel-related costs associated with an increase in general and administrative personnel to support our growing business. The number of full-time general and administrative employees increased from 16 at September 30, 2013 to 32 at September 30, 2014. In addition, we experienced a $3.1 million increase in consulting, professional fees and other corporate administration and travel costs as we prepared for our initial public offering.
Interest expense. Interest expense increased by $0.8 million, or 437.4%, for the nine months ended September 30, 2014 compared to the nine months ended September 30, 2013. The increase in interest expense was primarily due to additional borrowings under our previous revolving line of credit and equipment line of credit, our new loan agreements entered into in June 2014 and the fair value adjustment related to warrants issued in connection with one such loan agreement.
59
Comparison of Years Ended December 31, 2012 and 2013
| |
Year Ended December 31, | |
|
||||||||||||||||
|---|---|---|---|---|---|---|---|---|---|---|---|---|---|---|---|---|---|---|---|
| |
2012 | 2013 | |
|
|||||||||||||||
| |
Period-to-Period Change | ||||||||||||||||||
| |
|
Percentage of Revenue |
|
Percentage of Revenue |
|||||||||||||||
| |
Amount | Amount | Amount | Percentage | |||||||||||||||
| |
(in thousands, except percentages) |
||||||||||||||||||
Revenue |
$ | 35,072 | 100.0 | % | $ | 66,068 | 100.0 | % | $ | 30,996 | 88.4 | % | |||||||
Traffic acquisition costs |
16,485 | 47.0 | % | 27,712 | 41.9 | % | 11,227 | 68.1 | % | ||||||||||
Other cost of revenue |
2,982 | 8.5 | % | 3,904 | 5.9 | % | 922 | 30.9 | % | ||||||||||
| | | | | | | | | | | | | | | | | | | | |
Gross profit |
15,605 | 44.5 | % | 34,452 | 52.2 | % | 18,847 | 120.8 | % | ||||||||||
Operating expenses: |
|||||||||||||||||||
Sales and marketing |
12,938 | 36.9 | % | 20,475 | 31.0 | % | 7,537 | 58.3 | % | ||||||||||
Research and development |
5,376 | 15.3 | % | 8,666 | 13.1 | % | 3,290 | 61.2 | % | ||||||||||
General and administrative |
4,043 | 11.5 | % | 5,217 | 7.9 | % | 1,174 | 29.0 | % | ||||||||||
| | | | | | | | | | | | | | | | | | | | |
Total operating expenses |
22,357 | 63.7 | % | 34,358 | 52.0 | % | 12,001 | 53.7 | % | ||||||||||
(Loss) income from operations |
(6,752 | ) | (19.2 | )% | 94 | 0.2 | % | 6,846 | (101.4 | )% | |||||||||
Other expense (income): |
|||||||||||||||||||
Interest expense |
27 | 0.1 | % | 283 | 0.4 | % | 256 | 948.1 | % | ||||||||||
Other income |
(19 | ) | (0.1 | )% | (2 | ) | 0.0 | % | 17 | (89.5 | )% | ||||||||
| | | | | | | | | | | | | | | | | | | | |
Total other expense (income) |
8 | — | % | 281 | 0.4 | % | 273 | 3,412.5 | % | ||||||||||
Loss before income taxes |
(6,760 | ) | (19.2 | )% | (187 | ) | (0.2 | )% | 6,573 | (97.2 | )% | ||||||||
Provision for income taxes |
— | — | % | — | — | % | — | — | % | ||||||||||
| | | | | | | | | | | | | | | | | | | | |
Net loss |
$ | (6,760 | ) | (19.2 | )% | $ | (187 | ) | (0.2 | )% | $ | 6,573 | (97.2 | )% | |||||
| | | | | | | | | | | | | | | | | | | | |
| | | | | | | | | | | | | | | | | | | | |
Revenue. Revenue increased by $31.0 million, or 88.4%, from $35.1 million for the year ended December 31, 2012 to $66.1 million for the year ended December 31, 2013. This growth was primarily attributable to the combined effect of an increase in the number of enterprise customers and in revenue per enterprise customer during the year ended December 31, 2013 compared to the year ended December 31, 2012. The number of enterprise customers increased 35.1% from 225 as of December 31, 2012 to 304 as of December 31, 2013. In addition, our revenue per enterprise customer increased 39.7% during the year ended December 31, 2013 as compared to the year ended December 31, 2012.
Traffic acquisition costs. Traffic acquisition costs increased by $11.2 million, or 68.1%, from $16.5 million for the year ended December 31, 2012 to $27.7 million for the year ended December 31, 2013. The increase in traffic acquisition costs was primarily attributable to an increased number of impressions purchased on RTB exchanges. As a percentage of revenue, traffic acquisition costs declined from 47.0% for the year ended December 31, 2012 to 41.9% for the year ended December 31, 2013. The decrease in traffic acquisition costs as a percentage of revenue was primarily due to improvements in our real-time bidding platform, which allowed us to more efficiently purchase advertising impressions for our customers' marketing campaigns.
Other cost of revenue. Other cost of revenue increased by $0.9 million, or 30.9%, from $3.0 million for the year ended December 31, 2012 to $3.9 million for the year ended December 31, 2013. This increase was primarily attributable to an increase in infrastructure costs required to support our technology platform. This included a $0.4 million increase in amortization of internal-use software and depreciation expense and a $0.2 million increase in third-party data center costs. In addition, we experienced a $0.3 million increase in third-party advertisement-serving costs and a $0.3 million increase in salaries and personnel-related costs due to the increased volume of impressions delivered and marketing campaigns executed. These increases were partially offset by a $0.2 million decline in third-party data purchases during the year ended December 31, 2013. As a
60
percentage of revenue, other cost of revenue declined from 8.5% for the year ended December 31, 2012 to 5.9% for the year ended December 31, 2013.
Sales and marketing. Sales and marketing expense increased by $7.5 million, or 58.3%, from $12.9 million, or 36.9% of revenue, for the year ended December 31, 2012, to $20.5 million, or 31.0% of revenue, for the year ended December 31, 2013. The increase in sales and marketing expense was primarily attributable to a $6.3 million increase in salaries and personnel-related costs, as we increased the number of sales and marketing and customer support personnel to continue driving revenue growth. The number of full-time sales and marketing employees increased from 54 as of December 31, 2012 to 84 as of December 31, 2013. In addition, we experienced an increase in our marketing, advertising and promotional events of $1.0 million, as we focused on marketing our software solution to generate awareness, expanding our footprint with existing advertiser customers and increasing the adoption of our software solution by new advertiser customers. We also experienced an increase in allocated overhead costs of $0.3 million.
Research and development. Research and development expense increased by $3.3 million, or 61.2%, from $5.4 million, or 15.3% of revenue, for the year ended December 31, 2012, to $8.7 million, or 13.1% of revenue, for the year ended December 31, 2013. The increase in research and development expense was primarily attributable to a $3.1 million increase in salaries and personnel-related costs associated with an increase in research and development personnel. The number of full-time research and development employees increased from 40 as of December 31, 2012 to 60 as of December 31, 2013. In addition, we experienced a $0.6 million increase in third-party data costs and a $0.5 million increase in allocated overhead costs. These increases were partially offset by a $0.7 million reduction in quality assurance and testing of new technology costs and a $0.2 million decrease in consulting costs during the year ended December 31, 2013.
General and administrative. General and administrative expense increased by $1.2 million, or 29.0%, from $4.0 million, or 11.5% of revenue, for the year ended December 31, 2012, to $5.2 million, or 7.9% of revenue, for the year ended December 31, 2013. The increase in general and administrative expense was primarily attributable to a $1.1 million increase in other corporate expenses as we continued to invest in our corporate infrastructure to support our growth. In addition, we experienced an increase of $0.1 million in consulting, professional and legal fees during the year ended December 31, 2013.
Interest Expense. Interest expense increased by $0.3 million, or 948.1%, for the year ended December 31, 2013 compared to the year ended December 31, 2012. The increase in interest expense was primarily due to additional borrowings under our revolving line of credit and equipment line of credit.
61
Comparison of Years Ended December 31, 2011 and 2012
| |
Year Ended December 31, | |
|
||||||||||||||||
|---|---|---|---|---|---|---|---|---|---|---|---|---|---|---|---|---|---|---|---|
| |
2011 | 2012 | |
|
|||||||||||||||
| |
Period-to-Period Change | ||||||||||||||||||
| |
|
Percentage of Revenue |
|
Percentage of Revenue |
|||||||||||||||
| |
Amount | Amount | Amount | Percentage | |||||||||||||||
| |
(in thousands, except percentages) |
||||||||||||||||||
Revenue |
$ | 14,679 | 100.0 | % | $ | 35,072 | 100.0 | % | $ | 20,393 | 138.9 | % | |||||||
Traffic acquisition costs |
7,762 | 52.9 | % | 16,485 | 47.0 | % | 8,723 | 112.4 | % | ||||||||||
Other cost of revenue |
1,295 | 8.8 | % | 2,982 | 8.5 | % | 1,687 | 130.3 | % | ||||||||||
| | | | | | | | | | | | | | | | | | | | |
Gross profit |
5,622 | 38.3 | % | 15,605 | 44.5 | % | 9,983 | 177.6 | % | ||||||||||
Operating expenses: |
|||||||||||||||||||
Sales and marketing |
6,325 | 43.1 | % | 12,938 | 36.9 | % | 6,613 | 104.6 | % | ||||||||||
Research and development |
2,555 | 17.4 | % | 5,376 | 15.3 | % | 2,821 | 110.4 | % | ||||||||||
General and administrative |
2,117 | 14.4 | % | 4,043 | 11.5 | % | 1,926 | 91.0 | % | ||||||||||
| | | | | | | | | | | | | | | | | | | | |
Total operating expenses |
10,997 | 74.9 | % | 22,357 | 63.7 | % | 11,360 | 103.3 | % | ||||||||||
Loss from operations |
(5,375 | ) | (36.6 | )% | (6,752 | ) | (19.2 | )% | (1,377 | ) | 25.6 | % | |||||||
Other expense (income): |
|||||||||||||||||||
Interest expense |
88 | 0.6 | % | 27 | 0.1 | % | (61 | ) | (69.3 | )% | |||||||||
Other income |
31 | 0.2 | % | (19 | ) | (0.1 | )% | (50 | ) | (161.3 | )% | ||||||||
| | | | | | | | | | | | | | | | | | | | |
Total other expense (income) |
119 | 0.8 | % | 8 | — | % | (111 | ) | (93.3 | )% | |||||||||
Loss before income taxes |
(5,494 | ) | (37.4 | )% | (6,760 | ) | (19.2 | )% | (1,266 | ) | 23.0 | % | |||||||
Provision for income taxes |
— | — | % | — | — | % | — | — | % | ||||||||||
| | | | | | | | | | | | | | | | | | | | |
Net loss |
$ | (5,494 | ) | (37.4 | )% | $ | (6,760 | ) | (19.2 | )% | $ | (1,266 | ) | 23.0 | % | ||||
| | | | | | | | | | | | | | | | | | | | |
| | | | | | | | | | | | | | | | | | | | |
Revenue. Revenue increased by $20.4 million, or 138.9%, from $14.7 million for the year ended December 31, 2011 to $35.1 million for year ended December 31, 2012. This growth was primarily attributable to the combined effect of a significant increase in the number of enterprise customers and an increase in revenue per enterprise customer during the year ended December 31, 2012 compared to the year ended December 31, 2011. The number of enterprise customers increased 112.3% from 106 as of December 31, 2011 to 225 as of December 31, 2012. Our revenue per enterprise customer increased 10.5% during the year ended December 31, 2012 as compared to the year ended December 31, 2011.
Traffic acquisition costs. Traffic acquisition costs increased by $8.7 million, or 112.4%, from $7.8 million for the year ended December 31, 2011 to $16.5 million for the year ended December 31, 2012. The increase in traffic acquisition costs was primarily attributable to an increased number of impressions purchased on RTB exchanges. As a percentage of revenue, traffic acquisition costs declined from 52.9% for the year ended December 31, 2011 to 47.0% for the year ended December 31, 2012. This was primarily due to improvements in our real-time bidding platform, which allowed us to more efficiently purchase advertising impressions for our customers' marketing campaigns.
Other cost of revenue. Other cost of revenue increased by $1.7 million, or 130.3%, from $1.3 million for the year ended December 31, 2011 to $3.0 million for the year ended December 31, 2012. This increase was primarily attributable to the increased volume of impressions delivered and marketing campaigns executed. This included a $0.6 million increase in advertisement-serving costs, a $0.4 million increase in third-party data purchased and a $0.1 million increase in salaries and personnel related costs. In addition, we experienced an increase in infrastructure costs required to support our real-time bidding platform. This included a $0.4 million increase in costs related to third-party data centers, and a $0.2 million increase in amortization of internal-use software and depreciation expense. As a percentage of revenue, other cost of revenue declined slightly from 8.8% for the year ended December 31, 2011 to 8.5% for the year ended December 31, 2012.
62
Sales and marketing. Sales and marketing expense increased by $6.6 million, or 104.6%, from $6.3 million, or 43.1% of revenue, for the year ended December 31, 2011, to $12.9 million, or 36.9% of revenue, for the year ended December 31, 2012. This increase was primarily attributable to a $5.7 million increase in salaries and personnel-related costs, as we increased the number of sales and marketing and customer support personnel to continue driving revenue growth. The number of full-time sales and marketing employees increased from 27 at December 31, 2011 to 54 at December 31, 2012. In addition, we experienced increases to our marketing, advertising and promotional events, and travel costs of $0.7 million as we focused on marketing our software solution to generate awareness, expanding our footprint with existing advertiser customers and increasing the adoption of our software solution by new advertiser customers. We also reported an increase in allocated overhead costs of $0.2 million.
Research and development. Research and development expense increased by $2.8 million, or 110.4%, from $2.6 million, or 17.4% of revenue, for the year ended December 31, 2011, to $5.4 million, or 15.3% of revenue, for the year ended December 31, 2012. The increase in research and development expense was primarily attributable to a $2.4 million increase in salaries and personnel-related costs associated with an increase in research and development personnel. The number of full-time research and development employees increased from 22 at December 31, 2011 to 40 at December 31, 2012. In addition, we experienced a $0.3 million increase in consulting costs, a $0.2 million increase in third-party data costs, and a $0.3 million increase in allocated overhead costs. These increases were partially offset by a $0.3 million decline in quality assurance and testing of new technology costs during the year ended December 31, 2012.
General and administrative. General and administrative expense increased by $1.9 million, or 91.0%, from $2.1 million, or 14.4% of revenue, for the year ended December 31, 2011, to $4.0 million, or 11.5% of revenue, for the year ended December 31, 2012. The increase in general and administrative expense was primarily attributable to a $1.2 million increase in salaries and personnel-related costs associated with an increase in general and administrative personnel to support our growing business. The number of full-time general and administrative employees increased from 10 at December 31, 2011 to 14 at December 31, 2012. In addition, we experienced a $0.7 million increase in other corporate expenses, legal fees, insurance costs and travel costs during the year ended December 31, 2012, as we continued to invest in our corporate infrastructure to support our growth.
Quarterly Results of Operations
The following tables show our unaudited consolidated quarterly statements of operations data for the eleven quarters in the period ended September 30, 2014, as well as the percentage of revenue for each line item shown. This information has been derived from our unaudited financial statements, which, in the opinion of management, have been prepared on the same basis as our audited financial statements and include all adjustments, consisting of normal recurring adjustments and accruals, necessary for the fair presentation of the financial information for the quarters presented. Historical results are not necessarily indicative of the results to be expected in future periods, and operating results for a quarterly period are not necessarily indicative of the operating
63
results for a full year. This information should be read in conjunction with the consolidated financial statements and related notes included elsewhere in this prospectus.
| |
Three Months Ended | |||||||||||||||||||||||||||||||||
|---|---|---|---|---|---|---|---|---|---|---|---|---|---|---|---|---|---|---|---|---|---|---|---|---|---|---|---|---|---|---|---|---|---|---|
| |
March 31, 2012 |
June 30, 2012 |
September 30, 2012 |
December 31, 2012 |
March 31, 2013 |
June 30, 2013 |
September 30, 2013 |
December 31, 2013 |
March 31, 2014 |
June 30, 2014 |
September 30, 2014 |
|||||||||||||||||||||||
| |
(in thousands) |
|||||||||||||||||||||||||||||||||
Revenue |
$ | 4,739 | $ | 6,759 | $ | 9,544 | $ | 14,030 | $ | 11,024 | $ | 15,391 | $ | 15,402 | $ | 24,251 | $ | 15,353 | $ | 25,371 | $ | 27,140 | ||||||||||||
Traffic acquisition costs |
2,487 | 3,073 | 4,339 | 6,586 | 4,472 | 6,526 | 6,162 | 10,552 | 6,532 | 10,139 | 10,881 | |||||||||||||||||||||||
Other cost of revenue |
545 | 646 | 812 | 979 | 796 | 967 | 958 | 1,183 | 1,259 | 1,807 | 2,294 | |||||||||||||||||||||||
| | | | | | | | | | | | | | | | | | | | | | | | | | | | | | | | | | | |
Gross profit |
1,707 | 3,040 | 4,393 | 6,465 | 5,756 | 7,898 | 8,282 | 12,516 | 7,562 | 13,425 | 13,965 | |||||||||||||||||||||||
Operating expenses: |
||||||||||||||||||||||||||||||||||
Sales and marketing |
2,479 | 3,104 | 3,303 | 4,052 | 4,629 | 4,616 | 4,526 | 6,704 | 6,947 | 9,324 | 10,634 | |||||||||||||||||||||||
Research and development |
1,101 | 1,185 | 1,440 | 1,650 | 1,763 | 1,940 | 2,311 | 2,652 | 3,002 | 3,371 | 3,729 | |||||||||||||||||||||||
General and administrative |
825 | 814 | 1,332 | 1,072 | 1,064 | 1,188 | 1,090 | 1,875 | 1,677 | 3,643 | 3,120 | |||||||||||||||||||||||
| | | | | | | | | | | | | | | | | | | | | | | | | | | | | | | | | | | |
Total operating expenses |
4,405 | 5,103 | 6,075 | 6,774 | 7,456 | 7,744 | 7,927 | 11,231 | 11,626 | 16,338 | 17,483 | |||||||||||||||||||||||
(Loss) income from operations |
(2,698 | ) | (2,063 | ) | (1,682 | ) | (309 | ) | (1,700 | ) | 154 | 355 | 1,285 | (4,064 | ) | (2,913 | ) | (3,518 | ) | |||||||||||||||
Other expense (income): |
||||||||||||||||||||||||||||||||||
Interest expense |
9 | (5 | ) | 6 | 17 | 49 | 58 | 80 | 96 | 145 | 311 | 549 | ||||||||||||||||||||||
Other income |
1 | — | (9 | ) | (11 | ) | (6 | ) | 4 | — | — | — | (2 | ) | — | |||||||||||||||||||
| | | | | | | | | | | | | | | | | | | | | | | | | | | | | | | | | | | |
Total other expense (income) |
10 | (5 | ) | (3 | ) | 6 | 43 | 62 | 80 | 96 | 145 | 309 | 549 | |||||||||||||||||||||
(Loss) income before income taxes |
(2,708 | ) | (2,058 | ) | (1,679 | ) | (315 | ) | (1,743 | ) | 92 | 275 | 1,189 | (4,209 | ) | (3,222 | ) | (4,067 | ) | |||||||||||||||
Provision for income taxes |
— | — | — | — | — | — | — | — | — | — | — | |||||||||||||||||||||||
| | | | | | | | | | | | | | | | | | | | | | | | | | | | | | | | | | | |
Net (loss) income |
$ | (2,708 | ) | $ | (2,058 | ) | $ | (1,679 | ) | $ | (315 | ) | $ | (1,743 | ) | $ | 92 | $ | 275 | $ | 1,189 | $ | (4,209 | ) | $ | (3,222 | ) | $ | (4,067 | ) | ||||
| | | | | | | | | | | | | | | | | | | | | | | | | | | | | | | | | | | |
| | | | | | | | | | | | | | | | | | | | | | | | | | | | | | | | | | | |
| |
Three Months Ended | |||||||||||||||||||||||||||||||||
|---|---|---|---|---|---|---|---|---|---|---|---|---|---|---|---|---|---|---|---|---|---|---|---|---|---|---|---|---|---|---|---|---|---|---|
| |
March 31, 2012 |
June 30, 2012 |
September 30, 2012 |
December 31, 2012 |
March 31, 2013 |
June 30, 2013 |
September 30, 2013 |
December 31, 2013 |
March 31, 2014 |
June 30, 2014 |
September 30, 2014 |
|||||||||||||||||||||||
| |
(as a percentage of revenue) |
|||||||||||||||||||||||||||||||||
Revenue |
100.0 | % | 100.0 | % | 100.0 | % | 100.0 | % | 100.0 | % | 100.0 | % | 100.0 | % | 100.0 | % | 100.0 | % | 100.0 | % | 100.0 | % | ||||||||||||
Traffic acquisition costs |
52.5 | % | 45.5 | % | 45.5 | % | 46.9 | % | 40.6 | % | 42.4 | % | 40.0 | % | 43.5 | % | 42.5 | % | 40.0 | % | 40.1 | % | ||||||||||||
Other cost of revenue |
11.5 | % | 9.5 | % | 8.5 | % | 7.0 | % | 7.2 | % | 6.3 | % | 6.2 | % | 4.9 | % | 8.2 | % | 7.1 | % | 8.5 | % | ||||||||||||
| | | | | | | | | | | | | | | | | | | | | | | | | | | | | | | | | | | |
Gross profit |
36.0 | % | 45.0 | % | 46.0 | % | 46.1 | % | 52.2 | % | 51.3 | % | 53.8 | % | 51.6 | % | 49.3 | % | 52.9 | % | 51.4 | % | ||||||||||||
Operating expenses: |
||||||||||||||||||||||||||||||||||
Sales and marketing |
52.3 | % | 45.9 | % | 34.6 | % | 28.9 | % | 42.0 | % | 30.0 | % | 29.4 | % | 27.6 | % | 45.2 | % | 36.8 | % | 39.2 | % | ||||||||||||
Research and development |
23.2 | % | 17.5 | % | 15.1 | % | 11.8 | % | 16.0 | % | 12.6 | % | 15.0 | % | 10.9 | % | 19.6 | % | 13.3 | % | 13.7 | % | ||||||||||||
General and administrative |
17.4 | % | 12.1 | % | 14.0 | % | 7.6 | % | 9.7 | % | 7.7 | % | 7.1 | % | 7.7 | % | 10.9 | % | 14.4 | % | 11.5 | % | ||||||||||||
| | | | | | | | | | | | | | | | | | | | | | | | | | | | | | | | | | | |
Total operating expenses |
92.9 | % | 75.5 | % | 63.7 | % | 48.3 | % | 67.7 | % | 50.3 | % | 51.5 | % | 46.2 | % | 75.7 | % | 64.5 | % | 64.4 | % | ||||||||||||
(Loss) income from operations |
(56.9 | )% | (30.5 | )% | (17.7 | )% | (2.2 | )% | (15.5 | )% | 1.0 | % | 2.3 | % | 5.4 | % | (26.4 | )% | (11.6 | )% | (13.0 | )% | ||||||||||||
Other expense (income): |
||||||||||||||||||||||||||||||||||
Interest expense |
0.2 | % | (0.0 | )% | 0.1 | % | 0.1 | % | 0.4 | % | 0.4 | % | 0.5 | % | 0.4 | % | 0.9 | % | 1.2 | % | 2.0 | % | ||||||||||||
Other income |
0.0 | % | — | % | (0.1 | )% | (0.1 | )% | (0.1 | )% | 0.0 | % | — | % | — | % | — | % | — | % | — | % | ||||||||||||
| | | | | | | | | | | | | | | | | | | | | | | | | | | | | | | | | | | |
Total other expense (income) |
0.2 | % | (0.0 | )% | (0.0 | )% | 0.0 | % | 0.3 | % | 0.4 | % | 0.5 | % | 0.4 | % | 0.9 | % | 1.2 | % | 2.0 | % | ||||||||||||
(Loss) income before income taxes |
(57.1 | )% | (30.5 | )% | (17.7 | )% | (2.2 | )% | (15.8 | )% | 0.6 | % | 1.8 | % | 5.0 | % | (27.3 | )% | (12.8 | )% | (15.0 | )% | ||||||||||||
Provision for income taxes |
— | % | — | % | — | % | — | % | — | % | — | % | — | % | — | % | — | % | — | % | — | % | ||||||||||||
| | | | | | | | | | | | | | | | | | | | | | | | | | | | | | | | | | | |
Net (loss) income |
(57.1 | )% | (30.5 | )% | (17.7 | )% | (2.2 | )% | (15.8 | )% | 0.6 | % | 1.8 | % | 5.0 | % | (27.3 | )% | (12.8 | )% | (15.0 | )% | ||||||||||||
| | | | | | | | | | | | | | | | | | | | | | | | | | | | | | | | | | | |
| | | | | | | | | | | | | | | | | | | | | | | | | | | | | | | | | | | |
Our overall operating results fluctuate from quarter to quarter as a result of a variety of factors, some of which are outside our control. In general, our revenue has increased as a result of an increase in the number of enterprise customers and average revenue per enterprise customer. In most of the quarters presented, we added sales and marketing personnel to focus on adding new customers and increasing spend with existing customers and added technical support, services, research and development and administrative personnel to support our growth. Our historical results should not be considered a reliable indicator of our future results of operations.
Our revenue fluctuates on a quarterly basis as a result of seasonal variations in our business, with the fourth quarter of each calendar year historically representing the largest percentage of our revenue for the year, and the first quarter representing the smallest percentage of our revenue for the year. Many of our customers allocate the largest portion of their annual advertising budgets to the fourth quarter of the calendar year to coincide with increased holiday purchasing. As such, we expect our revenue to continue to fluctuate based on seasonal factors that affect the advertising industry as a whole.
64
Additionally, as our solution is designed to drive in-store sales, we have experienced quarterly fluctuations in revenue growth due to macroeconomic and other factors impacting consumer purchasing. For example, our revenue growth for the three months ended September 30, 2013 and March 31, 2014, respectively, was impacted by a downturn in consumer spending, which affected our customers in the consumer products and retail industries, resulting in a delay in the timing of delivering marketing campaigns.
Our traffic acquisition costs as a percentage of revenue have improved on an annual basis during the last three years as a result of improvements in our real-time bidding platform which enables us to more efficiently purchase advertising opportunities. However, our traffic acquisition costs as a percentage of revenue has fluctuated on a quarterly basis due to the seasonality of our business, our experimentation with and refinement of our real-time bidding platform, competition for impressions on RTB exchanges, the type of media inventory we are purchasing and the types of campaigns we are implementing for our customers.
Liquidity and Capital Resources
Sources of Liquidity
To date, we have funded our operations primarily through private placements of convertible preferred stock, bank borrowings and cash from operating activities. We have raised $25.5 million from the sale of convertible preferred stock to third parties. In line with industry practice, we receive payments from our agency customers once payment is collected from the parties they represent. We are often required to pay for advertising space prior to the receipt of payment from our agency customers. We draw upon the line of credit described below to manage our cash flows during this time lag.
In September 2011, we entered into a loan and security agreement with another lender, which was most recently amended in February 2014. The agreement, as amended, included a revolving line of credit of up to $21.0 million and an equipment line of credit of up to $2.0 million.
On June 12, 2014, we (i) repaid amounts outstanding under and terminated our prior loan and security agreement and (ii) entered into a new loan and security agreement and a mezzanine loan and security agreement with a lender. The loan and security agreement includes a revolving line of credit of up to $30.0 million. The mezzanine loan and security agreement includes a term loan of $15.0 million composed of two separate draws. The draw of the first tranche of $10.0 million occurred at closing and the draw of the second tranche of $5.0 million occurred on December 16, 2014.
Our revolving line of credit has a maturity date of June 12, 2016. The interest rate on outstanding amounts under the revolving line of credit is a floating rate per annum equal to the prime rate plus an applicable margin of 1.00%. Interest is payable monthly. The loan is secured by substantially all of our assets. Borrowing availability under our revolving line of credit is measured by reference to a formula based on the amount of certain eligible accounts receivable (but not exceeding the aggregate principal amount of commitments under our revolving line of credit) (such calculated amount being referred to as the "Availability Amount"). Under the terms of the agreement governing our revolving credit facility, we are required to satisfy a minimum liquidity condition of $5.0 million, consisting of the sum of: (i) cash held at our lender (determined in accordance with the loan and security agreement); plus (ii) the unused Availability Amount; plus (iii) the undrawn portion of the term loan under our mezzanine loan and security agreement.
The interest rate on borrowings under the mezzanine loan and security agreement is fixed at 11.50%. Interest is payable monthly and the cumulative principal is due at maturity. Pursuant to the mezzanine loan and security agreement, we issued warrants to our lender to purchase 200,000 shares of our common stock in connection with the draw of the first tranche. In December 2014, we drew down the second tranche under the mezzanine loan and security agreement and issued
65
additional warrants to our lender to purchase 100,000 shares of our common stock. Borrowings under the mezzanine loan and security agreement are secured by substantially all of our assets.
As of September 30, 2014, we were in compliance with the covenants contained in each of the loan and security agreement and the mezzanine loan and security agreement.
The following table summarizes the outstanding balances related to the mezzanine loan and security agreement and the loan and security agreement as of September 30, 2014 (in thousands):
Mezzanine loan and security agreement principal balance |
$ | 10,000 | ||
Debt discount related to the mezzanine loan and security agreement |
(851 | ) | ||
Loan and security agreement principal balance |
21,713 | |||
| | | | | |
Total |
$ | 30,862 | ||
| | | | | |
| | | | | |
Working Capital
The following table summarizes our cash and cash equivalents, accounts receivable, working capital and cash flows for the periods indicated (in thousands):
| |
As of and for the Year Ended December 31, |
As of and for the Nine Months Ended September 30, |
||||||||||||||
|---|---|---|---|---|---|---|---|---|---|---|---|---|---|---|---|---|
| |
2011 | 2012 | 2013 | 2013 | 2014 | |||||||||||
Cash and cash equivalents |
$ | 17,105 | $ | 9,831 | $ | 8,805 | $ | 5,902 | $ | 12,480 | ||||||
Accounts receivable, net |
$ | 4,603 | $ | 15,028 | $ | 24,233 | $ | 17,439 | $ | 29,443 | ||||||
Working capital |
$ | 18,001 | $ | 16,431 | $ | 20,611 | $ | 16,373 | $ | 22,586 | ||||||
Cash (used in) provided by: |
||||||||||||||||
Operating activities |
$ | (4,689 | ) | $ | (10,902 | ) | $ | (2,668 | ) | $ | (3,322 | ) | $ | (8,181 | ) | |
Investing activities |
$ | (2,914 | ) | $ | (3,406 | ) | $ | (5,470 | ) | $ | (4,210 | ) | $ | (1,568 | ) | |
Financing activities |
$ | 15,645 | $ | 7,034 | $ | 7,112 | $ | 3,603 | $ | 13,440 | ||||||
Our cash and cash equivalents at September 30, 2014 was held for working capital purposes. We do not enter into investments for trading or speculative purposes. Our policy is to invest any cash in excess of our immediate requirements in investments designed to preserve the principal balance and provide liquidity. Accordingly, our cash is invested primarily in demand deposit accounts that are currently providing only a minimal return.
Cash Flows
Operating Activities
Cash used in operating activities is primarily influenced by the amount of cash we invest in personnel and corporate infrastructure to support the increase in revenue and anticipated growth of our business. Cash used in operating activities has typically been generated from net losses and further increased by changes in our working capital, particularly in the areas of accounts receivable, accounts payable and accrued liabilities, adjusted for non-cash items such as depreciation and amortization expense and stock compensation expense.
Our accounts receivable collection cycles can vary from period to period based on common payment practices employed by advertising agencies. However, our agreements with RTB exchanges typically are based on standard payment terms. As a result, the timing of cash receipts and vendor payments can significantly impact our cash used in operations for any period presented. During the fourth quarter, our working capital needs may increase due to the seasonality of our business. This increase is driven by the fact that we have to make timely payments to RTB exchanges and other vendors, but customer payments may be delayed beyond the contractual terms of the customers' invoices.
66
For the nine months ended September 30, 2014, our net cash used to fund operating activities of $8.2 million consisted of a net loss of $11.5 million, $3.8 million in adjustments for non-cash items offset by $0.7 million of cash used by changes in working capital. Adjustments for non-cash items primarily consisted of depreciation and amortization expense of $2.2 million and non-cash stock compensation expense of $1.5 million. For the nine months ended September 30, 2014, changes in working capital primarily consisted of an increase in accounts payable and accrued expenses and other current liabilities of $2.8 million and $2.1 million, respectively, primarily driven by additional legal, audit, consulting and other operating costs during the period to support our growth. This increase was partially offset by decreases in operating cash flow due to a $5.2 million increase in accounts receivable as a result of increased revenue during the period presented.
For the nine months ended September 30, 2013, our net cash used to fund operating activities of $3.3 million consisted of a net loss of $1.4 million in addition to $4.0 million of cash used in working capital offset by $2.0 million in adjustments for non-cash items. Adjustments for non-cash items primarily consisted of depreciation and amortization expense of $1.4 million and non-cash stock compensation expense of $0.4 million. The decrease in cash resulting from changes in working capital primarily consisted of an increase in accounts receivable of $2.6 million driven by increased revenue during the period and a decrease in accounts payable and accrued expenses and other current liabilities of $1.0 million and $0.3 million, respectively.
For the year ended December 31, 2013, our net cash used in operating activities of $2.7 million consisted of a net loss of $0.2 million and $5.7 million of cash used to fund changes in working capital, offset by $3.2 million in adjustments for non-cash items. Adjustments for non-cash items primarily consisted of depreciation and amortization expense of $2.0 million, bad debt expense of $0.7 million and non-cash stock compensation expense of $0.6 million. The decrease in cash resulting from changes in working capital primarily consisted of an increase in accounts receivable of $9.9 million, primarily driven by increased revenue during the period as we continued to expand our operations. This decrease was partially offset by increases in operating cash flow due to a $2.9 million increase in accounts payable and a $1.3 million increase in accrued expenses, primarily driven by increased operating costs during the period to support our growth.
For the year ended December 31, 2012, our net cash used in operating activities of $10.9 million consisted of a net loss of $6.8 million and $5.9 million of cash used to fund changes in working capital, offset by $1.8 million in adjustments for non-cash items. Adjustments for non-cash items primarily consisted of depreciation and amortization expense of $1.1 million, non-cash stock compensation expense of $0.6 million and bad debt expense of $0.1 million. The decrease in cash resulting from changes in working capital primarily consisted of an increase in accounts receivable of $10.6 million, primarily driven by increased revenue during the period as we continued to expand our operations and an increase in prepaid expenses and other current assets of $0.2 million. These decreases were partially offset by increases in operating cash flow due to a $3.6 million increase in accounts payable and a $1.4 million increase in accrued expenses and other current liabilities, primarily driven by increased operating costs during the period to support our growth.
For the year ended December 31, 2011, our net cash used in operating activities of $4.7 million consisted of a net loss of $5.5 million, offset by $0.8 million in adjustments for non-cash items and $0.1 million of cash used to fund changes in working capital. Adjustments for non-cash items primarily consisted of depreciation and amortization expense of $0.4 million and non-cash stock compensation expense of $0.3 million. The increase in cash resulting from changes in working capital primarily consisted of an increase in operating cash flow due to a $1.8 million increase in accounts payable and a $1.3 million increase in accrued expenses and other current liabilities, primarily driven by increased operating costs during the period to support our growth. These increases were partially offset by a decrease in operating cash flow due to a $3.1 million increase in accounts receivable, primarily driven by increased revenue during the period as we continued to
67
expand our operations and an increase in prepaid expenses and other current assets of $0.1 million.
Investing Activities
During the nine months ended September 30, 2013 and 2014 and the years ended December 31, 2011, 2012 and 2013, investing activities consisted of purchases of property and equipment to support our growth as well as capitalized internal-use software development costs and changes to restricted cash. Purchases of property and equipment may vary from period-to-period due to the timing of the expansion of our operations, the addition of headcount and the development cycles of our internal-use software platform. We expect to continue to invest in property and equipment and in the further development and enhancement of our software platform for the foreseeable future.
Financing Activities
Our financing activities have consisted primarily of net proceeds from the issuance of convertible preferred stock, net borrowings under our credit facilities and the proceeds from the exercise of stock options and convertible preferred stock warrants.
For the nine months ended September 30, 2013 and 2014, net cash provided by financing activities was $3.6 million and $13.4 million, respectively, consisting primarily of net borrowings under our credit facilities.
For the year ended December 31, 2013, net cash provided by financing activities was $7.1 million, consisting of $7.0 million in net borrowings under our revolving line of credit and $0.1 million in cash received upon the exercise of stock options.
For the year ended December 31, 2012, net cash provided by financing activities was $7.0 million, consisting of the net borrowings under our revolving line of credit.
For the year ended December 31, 2011, net cash provided by financing activities was $15.6 million, primarily consisting of $12.9 million of net proceeds from the issuance of convertible preferred stock and $2.7 million in net borrowings under our revolving line of credit.
Operating and Capital Expenditure Requirements
We believe that our existing cash balances, together with the available borrowing capacity under our revolving line of credit, will be sufficient to meet our anticipated cash requirements through at least the next 12 months. If our available cash balances and net proceeds from this offering are insufficient to satisfy our liquidity requirements, we may seek additional equity or debt financing. The sale of equity may result in dilution to our stockholders and those securities may have rights senior to those of our common shares. If we raise additional funds through the issuance of additional debt, the agreements governing such debt could contain covenants that would restrict our operations and such debt would rank senior to shares of our common stock. We may require additional capital beyond our currently anticipated amounts. Additional capital may not be available on reasonable terms, or at all.
Contractual Obligations
Our principal commitments consist of obligations under our outstanding debt facilities, non-cancelable leases for our office space and computer equipment and purchase commitments for our co-location and other support services. The following table summarizes these contractual
68
obligations at September 30, 2014. Future events could cause actual payments to differ from these estimates.
| |
Payment Due by Period | |||||||||||||||
|---|---|---|---|---|---|---|---|---|---|---|---|---|---|---|---|---|
Contractual Obligations(1)
|
Total | Less than 1 Year |
1 - 3 Years | 3 - 5 Years | More than 5 Years |
|||||||||||
| |
(in thousands) |
|||||||||||||||
Long-term debt: |
||||||||||||||||
Mezzanine loan and security agreement |
$ | 10,000 | $ | — | $ | 10,000 | $ | — | $ | — | ||||||
Loan and security agreement |
21,713 | — | 21,713 | — | — | |||||||||||
Interest payments |
4,336 | 1,856 | 2,480 | — | — | |||||||||||
Operating lease obligations |
5,511 | 1,441 | 2,391 | 1,679 | — | |||||||||||
Purchase commitments |
3,108 | 2,193 | 915 | — | — | |||||||||||
| | | | | | | | | | | | | | | | | |
Total contractual obligations |
$ | 44,668 | $ | 5,490 | $ | 37,499 | $ | 1,679 | $ | — | ||||||
| | | | | | | | | | | | | | | | | |
| | | | | | | | | | | | | | | | | |
- (1)
- Interest payment projections on our loan and security agreement assume that we will not incur a material change in our outstanding borrowing and a maturity date of June 12, 2016.
Subsequent to September 30, 2014, we entered into vendor agreements with minimum purchase commitments of $0.7 million. In addition, we entered into an amended office lease for our Austin, Texas location which extended the expiration date through mid-2020 at an annualized cost of approximately $0.3 million and amended our Morrisville, North Carolina office lease for additional space with an incremental annualized cost of approximately $0.1 million through mid-2019.
Off-Balance Sheet Arrangements
As of September 30, 2014, we did not have any off-balance sheet arrangements, as defined in Item 303(a)(4)(ii) of Regulation S-K, such as the use of unconsolidated subsidiaries, structured finance, special purpose entities or variable interest entities.
Critical Accounting Policies and Significant Judgments and Estimates
Our management's discussion and analysis of our financial condition and results of operations is based on our consolidated financial statements, which have been prepared in accordance with GAAP. The preparation of these consolidated financial statements requires us to make estimates and assumptions that affect the reported amounts of assets and liabilities, disclosure of contingent assets and liabilities at the date of the consolidated financial statements and the reported amounts of revenue and expenses during the reported period. In accordance with GAAP, we base our estimates on historical experience and on various other assumptions that we believe are reasonable under the circumstances. Actual results may differ from these estimates under different assumptions or conditions.
While our significant accounting policies are more fully described in Note 2 to our consolidated financial statements appearing elsewhere in this prospectus, we believe the following accounting policies are critical to the process of making significant judgments and estimates in the preparation of our consolidated financial statements.
Revenue Recognition
We generate revenue by delivering targeted digital marketing campaigns for customers through various channels, including display, mobile, social and video. We recognize revenue when there is persuasive evidence of an arrangement, delivery has occurred or services have been provided, fees are fixed or determinable and collection of fees is reasonably assured. Revenue arrangements are evidenced by a fully executed IO. The IOs specify the delivery terms including the advertising format, the contracted number of advertising impressions to be delivered, the agreed upon rate for each delivered impression, generally on a CPM basis and the fixed period of time for delivery. Our
69
IOs typically have a term of less than three months and are cancellable at any time. We recognize revenue in the period in which the impressions are delivered, limited to the contracted number of impressions as specified in the IO. We determine collectability by performing a credit evaluation for new customers and by monitoring existing customers' accounts receivable balances. We only recognize revenue when collection is reasonably assured. We typically do not receive upfront payments from our customers, and, therefore, record an insignificant amount of deferred revenue.
In the normal course of business, we contract either directly with our customers or through advertising agencies that act on behalf of our customers. The determination of whether revenue should be reported on a gross or net basis is based on an assessment of whether we act as the principal or an agent in the transaction. We assess the gross and net indicators referenced in Accounting Standards Codification 605-45-45 Principal Agent Considerations. While no one factor is determined to be individually conclusive, indicators that an entity is acting as a principal include if it (i) is the primary obligor in the arrangement; (ii) has certain inventory risk; (iii) has latitude in establishing pricing; (iv) adds meaningful value to the service; (v) has discretion in supplier selection; (vi) is involved in the determination of the service specifications; or (vii) has credit risk. We recognize revenue on a gross basis primarily based on our determination that we are subject to the risk of fluctuating costs from our media vendors, have latitude in establishing prices with our customers, have discretion in selecting media vendors when fulfilling a customer's advertising campaign, and have credit risks.
We may enter into multiple element arrangements for the delivery of more than one advertising placement to be delivered at the same time, or within close proximity of one another. When entering into an arrangement that includes multiple elements, we determine whether the arrangement should be divided into separate units of accounting and how the arrangement consideration should be measured and allocated among the separate units of accounting. An element qualifies as a separate unit of accounting when the delivered element has standalone value to the customer. We sell advertising placements on a standalone basis and thus have determined that each advertising placement in multiple element arrangements represents a single unit of accounting.
We allocate arrangement consideration in multiple element arrangements at the inception of an arrangement to all deliverables based on the relative selling price method in accordance with the selling price hierarchy, which includes: (1) vendor-specific objective evidence, or VSOE, if available; (2) third-party evidence, or TPE, if VSOE is not available; and (3) best estimate of selling price, or BESP, if neither VSOE nor TPE is available. We have been unable to establish VSOE or TPE, and, therefore, use BESP in the allocation of arrangement consideration. We determine BESP, for our deliverables by considering a number of factors including, but not limited to the price lists used by our sales team in pricing negotiations, historical average and median pricing achieved in prior contractual customer arrangements and input from our sales operation department regarding what it believes the deliverables could be sold for on a stand-alone basis. As such, we allocate the arrangement consideration based on the relative fair value of the placements and recognize revenue as each advertising impression is delivered, assuming all other revenue recognition criteria have been met.
During the years ended December 31, 2011 and 2012, we maintained commission-based arrangements with channel partners that helped market our technology solution. We paid the channel partner a commission, or fee, in exchange for providing us with new business. We recorded reductions to revenue for fees paid to our channel partners.
Accounts Receivable and Allowances for Doubtful Accounts
Accounts receivable are stated at realizable value, net of an allowance for doubtful accounts that we maintain for estimated losses expected to result from the inability of some customers to make payments as they become due. Our estimated allowance is based on our analysis of past due amounts and ongoing credit evaluations. Historically, our actual collection experience has not
70
varied significantly from our estimates, due primarily to our credit and collection policies and the financial strength of our customers.
Internal-Use Software Development Costs
We capitalize certain costs related to software developed for internal-use, primarily associated with the ongoing development and enhancement of our platform. In accordance with authoritative guidance, we begin to capitalize our costs to develop software when preliminary development efforts are successfully completed, management has authorized and committed project funding and it is probable that the project will be completed and the software will be used as intended. These costs are amortized on a straight-line basis over the estimated useful life of the related asset, estimated to be three years. Costs incurred prior to meeting these criteria together with costs incurred for training and maintenance are expensed as incurred and recorded in research and development expense on our consolidated statements of operations. Costs incurred for enhancements that are expected to result in additional features or functionality are capitalized and expensed over the estimated useful life of the enhancements, generally three years.
Stock-Based Compensation
Stock options awarded to employees, directors and non-employee third parties are measured at fair value at each grant date. We consider what we believe to be comparable publicly traded companies, discounted free cash flows and an analysis of our enterprise value in estimating the fair value of our common stock. We recognize compensation expense ratably over the requisite service period of the option award. Options generally vest quarterly over a four-year period.
Stock-based compensation cost is measured on the grant date, based on the estimated fair value of the award using a Black-Scholes pricing model and recognized as an expense over the employee's requisite service period on a straight-line basis. We recorded stock-based compensation expense of $0.3 million, $0.6 million and $0.6 million for years ended December 31, 2011, 2012 and 2013 and $0.4 million and $1.5 million for the nine months ended September 30, 2013 and 2014, respectively. At September 30, 2014, we had $9.9 million of total unrecognized stock-based compensation expense, net of estimated forfeitures, related to stock option grants that will be recognized over a weighted-average period of 2.45 years. We expect to continue to grant stock options in the future, and, to the extent that we do, our stock-based compensation expense recognized in future periods will likely increase.
We account for stock-based compensation arrangements with non-employees using a fair value approach. The fair value of these options is measured using the Black-Scholes option pricing model reflecting the same assumptions as applied to employee options in each of the reported periods, other than the expected life, which is assumed to be the contractual life of the option. The compensation costs of these arrangements are subject to remeasurement over the vesting terms as earned.
Key Assumptions
Our Black-Scholes option-pricing model requires the input of highly subjective assumptions, including the fair value of the underlying common stock, the expected volatility of the price of our common stock, the expected term of the option, risk-free interest rates and the expected dividend yield of our common stock. These estimates involve inherent uncertainties and the application of management's judgment. If factors change and different assumptions are used, our stock-based compensation expense could be materially different in the future.
71
In determining the fair value of stock options granted, the following weighted-average assumptions were used in the Black-Scholes option pricing model for awards granted in the periods indicated:
| |
Year Ended December 31, | Nine Months Ended September 30, | ||||||||
|---|---|---|---|---|---|---|---|---|---|---|
| |
2011 | 2012 | 2013 | 2013 | 2014 | |||||
Assumptions: |
||||||||||
Risk-free interest rate |
1.2% – 2.5% | 0.7% – 1.1% | 0.9% – 2.1% | 0.94% – 2.05% | 1.32% – 2.04% | |||||
Expected life |
6.08 | 5.64 – 6.08 | 5.64 – 6.08 | 6.08 | 4.00 – 6.08 | |||||
Expected volatility |
63% – 65% | 62% – 65% | 59% – 62% | 59% – 60% | 50% – 60% | |||||
Dividend yield |
—% | —% | —% | —% | —% | |||||
Common Stock Valuations
The fair value of our common stock underlying stock options has historically been determined by our board of directors, with assistance from management, based upon information available at the time of grant. Given the absence of a public trading market for our common stock, and in accordance with the American Institute of Certified Public Accountants Practice Aid, Valuation of Privately-Held-Company Equity Securities Issued as Compensation, or the Practice Aid, our board of directors has exercised reasonable judgment and considered numerous objective and subjective factors to determine the best estimate of the fair value of our common stock at each grant date. These factors included:
- •
- contemporaneous third-party valuations of our common stock performed as of December 31, 2012, July 31, 2013,
November 30, 2013, January 31, 2014, April 30, 2014, June 30, 2014; September 30, 2014; and December 31, 2014.
- •
- the prices, rights, preferences and privileges of our convertible preferred stock relative to the common stock;
- •
- our operating and financial performance;
- •
- current business conditions and projections;
- •
- the likelihood of achieving a liquidity event for the shares of common stock underlying these stock options, such as an
initial public offering or sale of our company, given prevailing market conditions;
- •
- any adjustment necessary to recognize a lack of marketability for our common stock;
- •
- the market performance of comparable publicly-traded advertising and technology companies;
and
- •
- the U.S. and global capital market conditions.
The per share estimated fair value of our common stock in the table below represents the determination by our board of directors of the fair value of our common stock as of the date of grant, taking into consideration the various objective and subjective factors described above, including the conclusions, if applicable, of valuations of our common stock. There is inherent uncertainty in these estimates and if we had made different assumptions than those described below, the fair value of the underlying common stock and amount of our stock-based compensation expense, net loss and net loss per share amounts would have differed. Following the closing of this initial public offering the fair value per share of our common stock for purposes of determining stock-based compensation will be the closing price of our common stock as reported on the applicable grant date.
The following table summarizes by grant date the number of shares of common stock subject to stock options granted from January 1, 2013 through the date of this prospectus, as well as the
72
associated per share exercise price and the estimated fair value per share of our common stock on the grant date:
Grant Date
|
Number of Shares Underlying Options Granted |
Exercise Price per Share |
Estimated Fair Value per Share |
|||||||
|---|---|---|---|---|---|---|---|---|---|---|
April 12, 2013 |
193,000 | $ | 1.74 | $ | 1.74 | |||||
July 7, 2013 |
251,500 | $ | 1.74 | $ | 1.74 | |||||
September 11, 2013 |
369,612 | $ | 2.45 | $ | 2.45 | |||||
December 13, 2013 |
242,697 | $ | 4.63 | $ | 4.63 | |||||
February 27, 2014 |
160,250 | $ | 5.68 | $ | 5.68 | |||||
March 21, 2014 |
499,000 | $ | 5.68 | $ | 5.68 | |||||
June 10, 2014 |
451,250 | $ | 6.63 | $ | 6.63 | |||||
June 11, 2014 |
1,535,000 | $ | 6.63 | $ | 6.63 | |||||
August 1, 2014 |
72,000 | $ | 6.88 | $ | 6.88 | |||||
November 4, 2014 |
664,350 | $ | 7.12 | $ | 7.12 | |||||
January 21, 2015 |
326,500 | $ | 7.59 | $ | 7.59 | |||||
Based on an assumed initial public offering price of $ per share, the midpoint of the price range set forth on the cover page of this prospectus, the intrinsic value of stock options outstanding at September 30, 2014 was $ million, of which $ million and $ million related to stock options that were vested and unvested, respectively, at that date.
In valuing our common stock, the board of directors determined the equity value of our business using the income approach. The income approach estimates the fair value of a company based on the present value of a company's future estimated cash flows and the residual value of the company beyond the forecast period. These future values are discounted to their present values to reflect the risks inherent in the company achieving these estimated cash flows. Significant inputs of the income approach (in addition to our estimated future cash flows themselves) include the long-term growth rate assumed in the residual value, discount rate and normalized long-term operating margin. The terminal value was calculated to estimate our value beyond the forecast period by applying valuation metrics to the final year of our forecasted revenue and discounting that value to the present value using the same weighted-average cost of capital, or WACC, applied to the forecasted periods.
For the December 31, 2012 and July 31, 2013 valuations, the equity value determined was then allocated to the common stock using the Option Pricing Method, or OPM. The OPM treats common stock and convertible preferred stock as call options on an equity value, with exercise prices based on the liquidation preference of the convertible preferred stock. Therefore, the common stock has value only if the funds available for distribution to the stockholders exceed the value of the liquidation preference at the time of a liquidity event such as a merger, sale or initial public offering, assuming the enterprise has funds available to make a liquidation preference meaningful and collectible by the stockholders. The common stock is modeled to be a call option with a claim on the enterprise at an exercise price equal to the remaining value immediately after the convertible preferred stock is liquidated. The OPM uses the Black-Scholes option pricing model to price the call options. The OPM is appropriate to use when the range of possible future outcomes is so difficult to predict that forecasts would be highly speculative.
Beginning with the November 30, 2013 valuation, we changed the methodology for allocating our enterprise value to our common stock to be a probability weighted expected return method, or PWERM. We made this change as greater certainty developed regarding a possible liquidity event. The PWERM methodology relies on a forward-looking analysis to predict the possible future value of the company. Under this method, discrete future outcomes, including initial public offering, or IPO, non-IPO scenarios and a strategic merger or sale are weighted based on our estimate of the probability of each scenario. We applied a hybrid method of the PWERM where the non-IPO scenario is modeled using an OPM, to reflect the full distribution of possible non-IPO outcomes.
73
The hybrid method is useful when certain discrete future outcomes can be predicted, but also accounts for uncertainty regarding the timing or likelihood of specific alternative exit events.
Income Taxes
We account for income taxes under the asset and liability method. We recognize deferred tax assets and liabilities for the future tax consequences attributable to differences between the financial statement carrying amounts of existing assets and liabilities and their respective tax bases, as well as for operating loss and tax credit carryforwards. We measure deferred tax assets and liabilities using enacted tax rates expected to apply to taxable income in the years in which we expect to recover or settle those temporary differences. We recognize the effect of a change in tax rates on deferred tax assets and liabilities in the results of operations in the period that includes the enactment date. We reduce the measurement of a deferred tax asset, if necessary, by a valuation allowance if it is more likely than not that we will not realize some or all of the deferred tax asset.
We account for uncertain tax positions by recognizing the financial statement effects of a tax position only when, based upon technical merits, it is more likely than not that the position will be sustained upon examination. We recognize potential accrued interest and penalties associated with unrecognized tax positions within our global operations in income tax expense.
Inflation
We do not believe that inflation has had a material effect on our business, financial condition or results of operations. We continue to monitor the impact of inflation in order to minimize its effects through pricing strategies, productivity improvements and cost reductions. If our costs were to become subject to significant inflationary pressures, we may not be able to fully offset such higher costs through price increases. Our inability or failure to do so could harm our business, financial condition and results of operations.
Recent Accounting Pronouncements
In May 2011, the Financial Accounting Standards Board, or FASB, issued Accounting Standards Update, or ASU, 2011-04, Fair Value Measurement (Topic 820): Amendments to Achieve Common Fair Value Measurement and Disclosure Requirements in U.S. GAAP and IFRS. ASU 2011-04 represents the converged guidance of the FASB and the International Accounting Standards Board, or IASB, on fair value measurement and has resulted in common requirements for measuring fair value and for disclosing information about fair value measurements, including a consistent meaning of the term "fair value." We adopted ASU 2011-04 effective January 1, 2012 and have retrospectively applied the provisions of ASU 2011-04 for all periods presented.
In July 2013, the FASB issued ASU No. 2013-11, Presentation of an Unrecognized Tax Benefit When a Net Operating Loss Carryforward, a Similar Tax Loss, or a Tax Credit Carryforward Exists. This guidance provides financial statement presentation guidance on whether an unrecognized tax benefit must be presented as either a reduction to a deferred tax asset or separately as a liability. ASU No. 2013-11 is effective for interim or annual periods beginning after December 15, 2013. We adopted ASU 2013-11 effective January 1, 2014 and have applied the provisions of ASU 2013-11 for all the applicable periods presented.
Quantitative and Qualitative Disclosures about Market Risk
Market risk is the risk of loss to future earnings, values or future cash flows that may result from changes in the price of a financial instrument. The value of a financial instrument may change as a result of changes in interest rates, exchange rates, commodity prices, equity prices and other market changes. We are exposed to market risk related to changes in foreign currency exchange rates. We do not use derivative financial instruments for speculative, hedging or trading purposes,
74
although in the future we may enter into exchange rate hedging arrangements to manage the risks described below.
Interest Rate Sensitivity
Our cash and cash equivalents as of September 30, 2014 consisted of cash maintained in several FDIC insured operating accounts. Our primary exposure to market risk for our cash and cash equivalents is interest income sensitivity, which is affected by changes in the general level of U.S. interest rates. However, we do not believe a sudden change in the interest rates would have a material impact on our financial condition or results of operations.
We are subject to interest rate risk in connection with our $21.7 million outstanding under the loan and security agreement as of September 30, 2014. Borrowings under this agreement are subject to interest, charged at the prime rate plus a maximum margin of 1.00%. Assuming our outstanding debt remains consistent with the outstanding balance reported as of September 30, 2014 a 100-basis point change to the interest rates would result in an approximate $0.2 million change in our annual interest expense on our outstanding borrowings. The interest rate on the outstanding borrowings under the mezzanine loan and security agreement as of September 30, 2014 is fixed at 11.50%.
Foreign Currency Exchange Risk
Substantially all of our revenue and operating expenses are denominated in U.S. dollars. Therefore, we do not believe that our exposure to foreign currency exchange risk is material to our business, financial condition or results of operations. If a significant portion of our revenue and operating expenses were to become denominated in currencies other than U.S. dollars, we may not be able to effectively manage this risk, and our business, financial condition and results of operations could be adversely affected by translation and by transactional foreign currency conversions.
75
Overview
MaxPoint provides a leading business intelligence and marketing automation software service, which we refer to as our solution, that enables national brands to drive local, in-store sales. National brands use our MaxPoint Intelligence Platform to predict the most likely local buyers of a specific product at a particular retail location and then execute cross-channel digital marketing campaigns to reach these buyers. Business intelligence is at the core of our solution, which leverages high-velocity data processing and proprietary statistical models to continuously analyze more than 10 billion daily data attributes to delineate consumers' real-time purchase intent. By identifying and reaching only the most likely local buyers with digital customized product offers for local stores, national brands can more efficiently and effectively run local marketing campaigns, thereby increasing in-store sales and reducing wasted marketing spend associated with traditional approaches. We provide a technology-driven alternative to traditional local marketing methods for national brands across a number of industries where transactions take place predominantly offline, such as consumer products, retail, automotive, healthcare, telecommunications and entertainment.
The primary marketing methods traditionally utilized to engage local consumers are print media, direct mail and radio. We believe these methods have become outdated as media consumption moves online and national brands increasingly seek digital solutions to make effective local marketing decisions to drive in-store sales. Approximately 88% of total U.S. retail purchases in 2014 occurred at physical locations, according to Euromonitor. The challenges associated with the promotion of local, in-store purchasing include predicting a consumer's purchase intent and matching that consumer with the appropriate local store that currently has the desired product in stock. We believe these challenges are more pronounced for national brands because they generally operate on a centralized or regional basis, which limits their visibility into the purchase intent of local consumers.
The MaxPoint Intelligence Platform is a software service that enables national brands to predict local demand based on consumers' purchase power and intent and manage customized digital advertisements containing in-store offers and promotions to reach consumers at a local level across display, mobile, social and video channels. The MaxPoint Intelligence Platform matches the most likely communities of local buyers with a specific product at a particular retail location within a given timeframe. Through marketing automation and direct integration with real-time bidding, or RTB, exchanges, our platform delivers customized digital advertisements containing product and store-specific promotions to local consumers. National brands can then measure the offline sales impact of those digital marketing campaigns to optimize future campaigns and budgets and manage in-store supply levels. We introduced the MaxPoint Intelligence Platform in 2011 as a service run primarily by us on behalf of our customers. Since 2013, our customers have also had the ability to directly interface with the MaxPoint Intelligence Platform software service.
The foundation for our local targeting is our proprietary Digital Zip architecture, a digital grid of households organized into over 44,000 specific neighborhoods, or Digital Zips, which can be as small as a couple of city blocks. Through a combination of our proprietary and third-party data, we create a profile for each Digital Zip based on shared demographic and financial traits, such as family size, income level, education, age and historical purchasing behavior.
We use our consumer purchase intent model to determine which products consumers in a particular Digital Zip are most likely to purchase. Our consumer purchase intent model uses proprietary algorithms that take into account demographic and financial characteristics of potential consumers, historical purchase patterns of potential consumers and recent consumption of online media content by consumers, each aggregated at the Digital Zip level, which relate to targeted product characteristics or brand attributes. We analyze the aggregated consumption of online media content in each Digital Zip through the use of our proprietary search-based technology. This
76
technology crawls, indexes and analyzes webpages around-the clock to interpret the meaning of text on webpages and catalogue each webpage by key topics. We then match the Digital Zips with the highest number of views of webpages that pertain to a key topic associated with a targeted product or product category. Based on these results, we can then match a targeted product offer to specific Digital Zips that exhibit an online behavior that correlates most strongly with the likely purchase of such products at the local level. We define "local," in terms of both retail locations and buyers or consumers, as the close proximity of a targeted consumer to a targeted retail location, typically within a specific Digital Zip.
Our diverse customer base consists primarily of enterprises with national brands in the consumer products, retail, automotive, healthcare, telecommunications and entertainment industries. We sell our solution either directly to our customers or through advertising agencies that act on behalf of our customers. We have worked with each of the top 20 leading national advertisers and each of the top 10 advertising agencies in the United States as ranked in 2014 by Advertising Age. As of September 30, 2014, we had 431 enterprise customers as described in "—Our Customers." Our customers pay typically us on a cost per thousand impression, or CPM, model based on the number of impressions we deliver through our platform for each marketing campaign.
We generated revenue of $14.7 million, $35.1 million and $66.1 million for the years ended December 31, 2011, 2012 and 2013, respectively, representing year-over-year increases of 139% and 88%, respectively. We generated revenue of $41.8 million and $67.9 million for the nine months ended September 30, 2013 and 2014, respectively, representing a period-over-period increase of 62%. Revenue less traffic acquisition costs, which we refer to as Revenue ex-TAC, was $6.9 million, $18.6 million and $38.4 million for the years ended December 31, 2011, 2012 and 2013, respectively, representing year-over-year increases of 169% and 106%, respectively. Our Revenue ex-TAC was $24.7 million and $40.3 million for the nine months ended September 30, 2013 and 2014, respectively, representing a period-over-period increase of 63%. We recorded a net loss of $5.5 million, $6.8 million and $0.2 million for the years ended December 31, 2011, 2012 and 2013, respectively. We recorded a net loss of $1.4 million and $11.5 million for the nine months ended September 30, 2013 and 2014, respectively. Our Adjusted EBITDA was $(4.6) million, $(5.1) million and $2.6 million for the years ended December 31, 2011, 2012 and 2013, respectively. Our Adjusted EBITDA was $0.6 million and $(6.9) million for the nine months ended September 30, 2013 and 2014, respectively. Revenue ex-TAC and Adjusted EBITDA are financial measures not calculated in accordance with U.S. generally accepted accounting principles, or GAAP. Please refer to "Selected Consolidated Financial Data—Non-GAAP Financial Measures" for information on Revenue ex-TAC and Adjusted EBITDA and for a reconciliation of Revenue ex-TAC to revenue and Adjusted EBITDA to net income (loss), respectively, the most directly comparable GAAP financial measures.
Industry Background
Despite the growth of e-commerce over the past decade, the vast majority of consumer purchases currently is and, in the foreseeable future, is expected to be, made locally in physical retail stores. Approximately 88% of total U.S. retail purchases in 2014 occurred at physical store locations, representing over $2 trillion of spending, and approximately 12% of total U.S. retail purchases occurred at non-physical store locations (including e-commerce), representing over $300 billion of spending, according to Euromonitor. We believe the vast majority of these retail purchases at physical retail stores are made in close proximity to the consumer's home. By 2019, retail purchases at physical retail locations will continue to represent approximately 85%, or nearly $3 trillion, and retail purchases at non-physical store locations (including e-commerce) will represent approximately 15%, or approximately $500 billion, of total U.S. retail spending according to Euromonitor. Moreover, Planet Retail expects the number of retail locations of the global leading retailers to grow from over 275,000 in 2013 to over 290,000 in 2019 in the United States.
77
Although the vast majority of retail purchases continues to occur in physical retail locations, media consumption is shifting dramatically from offline to online media. Adults spend more time online and on mobile devices than any other form of media, including television. According to eMarketer, time spent with digital media as a percentage of time spent across digital, television, radio and print media is projected to grow from 30% in 2010 to 46% in 2014, which is more than any other form of media, including television. In particular, time spent with mobile media is projected to represent approximately 49% of total time spent with digital media in 2014.
National brands employ a variety of offline and online local marketing channels in an effort to target and reach consumers to promote sales of their products at physical retail locations. According to BIA/Kelsey, the U.S. marketing industry spent approximately $137 billion in 2014 and is projected to spend approximately $159 billion in 2019 on local media marketing, which includes both traditional and digital forms of marketing.
- •
- Traditional Local Marketing. Local
marketing is still predominantly conducted through traditional marketing channels, which include television, newspaper, magazine and radio advertising, as well as mailers, free-standing inserts and
coupons. According to BIA/Kelsey, spending for traditional local marketing was approximately $106 billion in 2014 and is projected to be approximately $104 billion in 2019, which would
represent a decline from approximately 77% to approximately 65% of total local marketing spend during that period.
- •
- Online/Digital Local Marketing. National brands continue to increase their digital marketing as increasing numbers of consumers shift their media consumption from offline to online. According to BIA/Kelsey, digital local marketing spend was approximately $31 billion in 2014 and is projected to be approximately $55 billion in 2019, which would represent an increase from approximately 23% to approximately 35% of total local marketing spend during that period. Based on the data reported by BIA/Kelsey and excluding local and mobile search, email and SMS-based local marketing, spending on digital marketing was approximately $20 billion in 2014 and is projected to be approximately $36 billion in 2019, which would represent an increase from approximately 14% to approximately 23% of total local advertising spend.
National brands seeking to drive in-store sales face the following challenges with current local marketing channels:
- •
- Limited ability to predict and target the most likely
buyers. Traditional marketing methods typically lack the sophisticated technology and data necessary for targeting consumers and instead
broadly target large metropolitan areas rather than the specific neighborhoods surrounding a physical retail location. Online methods benefit from better technology and data for targeting, but
generally rely on cookies—the predominant digital advertising identifier—which are not optimized for targeting consumers at the local, offline level, and are frequently
deleted. Consumers that search for products online often intend to purchase those products online; therefore, cookies do not effectively capture consumer purchase intent for many, if not most,
products purchased offline in stores, and marketing channels based on cookies can lead to wasted marketing dollars.
- •
- Limited ability to efficiently reach the most likely buyers at scale and at the right time. Many traditional methods for local marketing, such as newspapers, direct mail and radio, have shrinking audiences and lack the scale to connect specific consumers interested in purchasing a product to that particular product. The proliferation of digital content and devices has created significant audience fragmentation, which creates challenges for reaching buyers at scale through online channels. Also, as lead times of up to eight weeks are generally required to plan and execute marketing campaigns for certain products, national brands often miss opportunities to reach consumers at the point in time when they desire to purchase a product.
78
- •
- Inability to capture and analyze massive amounts of unstructured and disparate data in real
time. Most local marketing methods are unable to programmatically capture, process and analyze massive amounts of disparate data in real
time, which reflect the current purchase intent of consumers and store-level supply of products. It is difficult for advertisers to connect online and offline data, particularly at the speeds required
to capture specific demand for specific products. Also, most marketing methods do not allow national brands to integrate consumer data regarding purchase intent with their enterprise data, such as
point-of-sale and supply chain information, to improve marketing performance.
- •
- Inability to measure and optimize local marketing based on in-store
sales. Both offline and online media typically lack measurement and attribution tools that, at the individual store level, demonstrate
return on investment for national brands and help them determine where to allocate marketing budgets. In addition, traditional local marketing measurement requires long cycle times, which limits the
ability to provide real-time insights on campaign efficacy and consumer behavior.
- •
- Inability to automate offline methods of marketing. Traditional marketing methods rely heavily on human involvement, hindering the automation of targeted marketing campaigns. Moreover, traditional local marketing campaigns typically have long lead times, require a significant amount of effort to manage across multiple markets and involve numerous small media purchases across multiple channels and geographies. Reliance on individuals rather than algorithms to implement and manage a marketing campaign slows down the process for placing advertisements and leaves room for error in interpreting the results of campaigns.
The Benefits of Our Solution
We believe our solution transforms the way in which national brands use digital marketing to drive local sales at physical retail locations. Our solution enables national brands to:
- •
- Predict and target the most likely local buyers for specific
products. Our solution predicts, in real time, what products local consumers intend to purchase. Our solution, which does not rely on
cookies, enables national brands to programmatically target those specific consumers in real time and in specific locations near the retail store in which the national brand wishes to drive sales.
This enables national brands to digitally market products to consumers that have demonstrated intent to purchase such products on a granular store-by-store, product-by-product basis.
- •
- Reach the most likely consumers efficiently at scale and at the right
time. Our solution enables national brands to programmatically deliver targeted and timely advertisements to the most likely local
consumers of specific products at a particular retail location to drive in-store sales. By helping national brands reach the right consumers at scale, we help them reduce wasted marketing dollars and
maximize the impact of digital marketing campaigns on in-store sales. For example, with our solution, national brands can advertise for specific products available at a specific location at a specific
time, based on current inventory data.
- •
- Capture and analyze massive amounts of unstructured and disparate data in real time. Our solution is purpose-built to use integrated proprietary software and customized hardware to programmatically process billions of unstructured data points and make over 450,000 decisions per second. We are able to process and analyze vast amounts of data on a daily basis and run more than a thousand simultaneous campaigns. As a result, we can deliver our solution to national brands in a manner that allows them to execute local marketing campaigns on a cost-effective basis. In addition, our customers can connect their enterprise data, such as point-of sale and supply chain information, with our solution to improve the effectiveness of their marketing campaigns.
79
- •
- Measure and optimize the impact of local, online marketing campaigns on in-store
sales. Our solution enables national brands to track the impact of digital marketing campaigns and to understand quantitatively their
return on marketing investment. National brands are able to realize a return on their digital marketing investment because we can track and measure the direct impact of any particular campaign on
in-store sales. Our technology utilizes data from retailers' point-of-sale systems and runs analyses in real time so that national brands do not have to wait until the end of a marketing campaign to
see the impact on in-store sales. As a result, they are able to adjust their marketing strategy more quickly, for example, by changing the advertisements they are using across channels in real time.
Our solution also enables national brands to apply insights from past campaigns to make future marketing investment decisions at a specific store level.
- •
- Automate and streamline the execution of local marketing. Our solution enables national brands to programmatically execute digital marketing campaigns with minimal lead time and human intervention. We connect to RTB exchanges, such as Google's DoubleClick Ad Exchange, Rubicon Project, PubMatic and AppNexus, to serve advertisements across display, mobile, social and video channels. Our highly-scalable solution automates the entire marketing campaign process, from the identification of target audiences to full programmatic execution. National brands can immediately respond to small pockets of consumer demand almost as soon as they are identified because our solution offers significantly shorter lead times and real-time insights relative to other local marketing media.
Our Competitive Strengths
We believe that the following competitive strengths will enable us to continue to deliver to national brands a compelling value proposition that differentiates us from competing solutions:
- •
- Pioneering solution with compelling value
proposition. Since our inception in 2006, we have focused on developing solutions to address the challenges that national brands experience
with local marketing. Our proprietary, predictive business intelligence engine identifies, in real time, consumers likely to be receptive to our customers' advertisements, thereby focusing marketing
spend on the most efficient and effective channel. We are able to produce a customized solution and actionable insights for each of our customers in real time because our technology operates at
significant scale and our algorithms analyze billions of advertising impressions and millions of new offline transaction data. We believe that our customized software and hardware stack and years of
algorithmic learning are difficult for others to replicate.
- •
- Virtuous cycle of data
aggregation. Our solution provides increasing value to our customers as our data assets grow over time. As our business intelligence engine
analyzes and makes millions of predictions about consumer purchase intent, it learns from each action, enabling us to programmatically improve our algorithms and the results we deliver to our
customers. For example, our business intelligence platform enables customers to learn valuable, quantitative insights about their marketing campaigns, including what worked, what did not work and why,
which allows them to make real-time adjustments. As we drive more in-store sales for our customers, we believe more national brands and retailers will work with us and share data from their
point-of-sale, CRM and supply chain management systems. This will enable us to enhance the business intelligence of our solution and improve our ability to measure the impact of marketing campaigns on
in-store sales.
- •
- Proprietary, data-driven understanding of consumer intent and behavior. We have developed a proprietary business intelligence engine that predicts consumer purchase intent for products generally purchased offline, including a broad range of products consumers purchase frequently without conducting any online research that would leave a digital trail.
80
- •
- Deep relationships with national brands across key industries. Leading national brands trust us to help them automate and execute local marketing campaigns. Our customers include national brands in a number of industries, such as consumer products, retail, automotive, healthcare, telecommunications and entertainment. We interact with our customers either directly or through advertising agencies acting on their behalf. We have worked with each of the top 20 leading national advertisers and each of the top 10 advertising agencies in the United States as ranked in 2014 by Advertising Age.
Our consumer purchase intent model analyzes individual web pages to determine which products consumers will most likely purchase based on the media content they consume. Our solution automatically constructs a closed loop measurement test environment for every marketing campaign initiated through our platform. The results of every marketing campaign are continuously fed back into our solution to improve the accuracy of its predictions and recommendations.
MaxPoint Intelligence Platform
Our MaxPoint Intelligence Platform is a software service, which we refer to as our solution, that combines our proprietary Digital Zip architecture, business intelligence analytics and marketing automation to enable national brands in real time to:
- •
- predict consumer purchase intent;
- •
- deliver geo-targeted digital marketing programmatically to communities of consumers that have demonstrated purchase intent
and are most likely to shop at a targeted local retail location; and
- •
- measure the effectiveness of digital marketing campaigns.
How it works
When a customer initiates a marketing campaign with us, they begin the process by specifying several variables. These variables commonly include the product (SKU, family or category), consumer characteristics, physical retail locations, timing of the placement of the marketing campaign and desired outcome. These outcomes can include incremental sales, customer online engagement actions and brand awareness.
Based on these variables, the MaxPoint Intelligence Platform creates a plan and then executes on that plan in an automated manner. Our solution determines the Digital Zips that are in the trade area of each store or location and then applies algorithms to identify which Digital Zips are most likely to contain the highest concentration of potential consumers of the given product in the time period specified. The MaxPoint Intelligence Platform then purchases impressions on one of several RTB exchanges that meet the criteria established above through our proprietary real-time bidding platform. The MaxPoint Intelligence Platform can be presented with more than 13 billion opportunities or impressions daily to deliver a digital advertisement to users. As each impression becomes available to us, our proprietary bidding engine, enabled by our Digital Zip architecture, programmatically determines the optimal price for each impression and places a bid based on our proprietary data and analytics. Given the unique attributes we apply to our bidding process, it was necessary for us to develop a purpose-built, proprietary bidding engine that programmatically assesses these attributes against each available impression. If we are able to acquire the impression for less than or equal to the optimal price, we programmatically display the appropriate digital advertisement on behalf of our customer. Our customized hardware and software stack executes this entire bidding process in under 12 milliseconds.
The results of marketing campaigns, such as in-store sales lift, coupon downloads, website engagement activities and brand awareness metrics, can be continuously fed back into the MaxPoint Intelligence Platform to improve the accuracy of its predictions and recommendations.
81
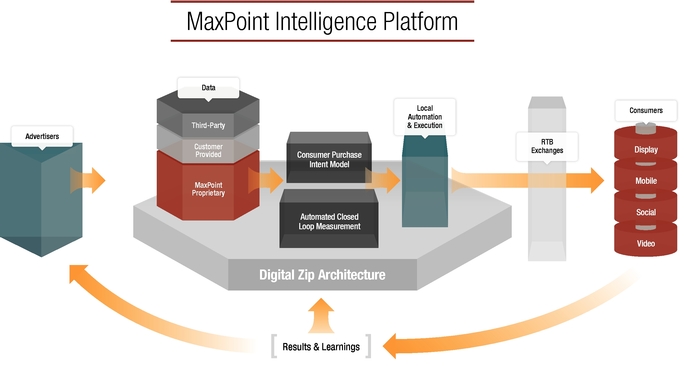
Elements of the MaxPoint Intelligence Platform
The MaxPoint Intelligence Platform consists of four key elements:
- •
- Digital Zip architecture;
- •
- consumer purchase intent model;
- •
- local automation and execution; and
- •
- automated closed loop measurement.
Digital Zip architecture
Our proprietary Digital Zip architecture creates the foundation for our local targeting. Digital Zips are proprietary geographic profiles of specific neighborhoods or areas that contain certain traits, such as family size, income level, education, age and purchasing behavior, which represent a statistically significant group for the purpose of determining consumer purchase intent. We developed our Digital Zips based on our accumulation and analysis of geolocation data and third party data over more than six years. There are over 44,000 Digital Zips in the United States. Our Digital Zip architecture is critical to our ability to market to target consumers and to link the physical offline world with the digital online world.
82
An example of our Digital Zip architecture as applied to the Chicago area is illustrated in the following diagram. There are more than 600 discrete Digital Zips of various sizes and shapes in the Chicago area shown in the diagram. In contrast, a more traditional designated market area, or DMA, that can be used by advertisers to target local consumers consists of the larger, single geographic area contained within the circle in the diagram.
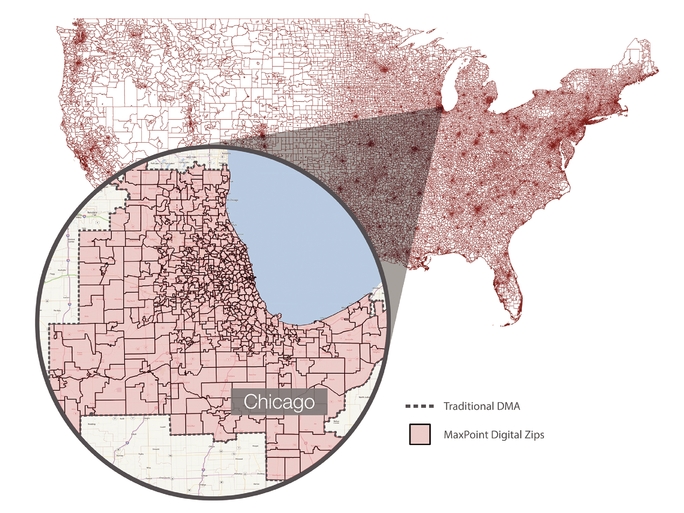
Consumer purchase intent model
Our consumer purchase intent model uses multiple algorithms to predict the intensity of consumer purchase interest in a particular product for a given location, typically a local store, over a specific time period. The model enables the MaxPoint Intelligence Platform to determine the Digital Zips in which to focus marketing efforts for a particular campaign to achieve the customer's objectives, such as to yield a higher lift in the sales of a given product in a given physical retail location. The model also determines the optimal media mix—such as display, mobile, social or video—and the exact digital media properties that best match the specific product involved in the campaign.
Consumer purchase intent information is not readily available to advertisers at a general level, much less at the neighborhood level. To predict explicit consumer purchase intent at the local or neighborhood level, the MaxPoint Intelligence Platform analyzes vast amounts and types of data from three different sources, all of which is presented at the local, Digital Zip level:
- •
- MaxPoint proprietary consumer intent and interest data. We derive over 90% of the data we use from our proprietary search-based technology, which determines the link between
83
- •
- Customer-provided data. Our customers
often share with us their enterprise data, such as point-of-sale and supply chain data, which allows our consumer purchase intent model to analyze such individual customer's enterprise information
together with our proprietary data and third-party data. When a customer connects its enterprise data into the MaxPoint Intelligence Platform, it obtains more customized, precise, granular, timely and
statistically valuable consumer intent models. We do not provide direct access to data provided to us by a customer to any other customer.
- •
- Third-party data. We supplement our proprietary data by purchasing third-party data, such as demographic, financial, point-of-sale and inventory data across a multitude of industry segments and products, from commercial sources.
consumer interests, as indicated by web page viewing, to demand for particular products. We use our consumer purchase intent model to analyze around-the-clock the individual web pages browsed by consumers in each Digital Zip to determine which products those consumers will most likely purchase based on the media content they are consuming. For instance, if consumers in a particular Digital Zip are viewing web pages about healthy living, then our solution may deduce strong interest for organic or gluten-free products.
The algorithms for our consumer purchase intent model enable the MaxPoint Intelligence Platform to programmatically analyze, consider and weigh data from each of these three data sources to generate a real-time prediction on the intensity of consumer demand for a particular product in each Digital Zip, including for a broad range of products consumers purchase frequently without conducting any online research that would leave a digital trail. Our solution also has the capability to perform cookie-based marketing at the local in-store level.
Local marketing automation and execution
National brands that implement marketing campaigns must frequently focus on multiple products, multiple cities, numerous distinct retail locations, different retail partners and various time windows for execution. It has traditionally been highly complicated to design and execute marketing campaigns that address all of these factors, requiring interaction with numerous vendors and media sources and coordinating with hundreds of store locations across numerous local markets.
The MaxPoint Intelligence Platform automates marketing campaign design and execution, dramatically simplifying local marketing campaigns. With our solution, the customer provides the basic inputs associated with a marketing campaign, such as product, consumer characteristics, physical retail locations, timing of the placement of the marketing campaign and desired outcome. By matching these inputs with our consumer purchase intent model at the Digital Zip level, the MaxPoint Intelligence Platform automatically designs and executes a marketing campaign for the national brand, and purchases the digital marketing media it determines will best obtain the national brand's desired results. Because the MaxPoint Intelligence Platform is automated, it simplifies marketing campaigns by reducing both the time and effort required to execute them. The MaxPoint Intelligence Platform also programmatically provides recommendations for additional marketing campaigns based on insights discovered in the execution of the first campaign through our platform. These recommendations are presented to the customer fully designed and ready to execute with a single click.
Automated closed loop measurement and optimization
A key aspect of the MaxPoint Intelligence Platform is its ability to automatically construct a closed loop measurement test environment for every marketing campaign initiated through our platform. By evaluating the success of a marketing campaign, our solution is capable of showing customers the impact of the campaign on sales down to an individual physical retail location. Through the MaxPoint Intelligence Platform, national brands can access business intelligence from
84
a marketing campaign on product sales in specific physical retail locations following the campaign. Our solution also enables customers to optimize active marketing campaigns based on both online metrics and offline metrics, such as sales increases at the physical retail location. The MaxPoint Intelligence Platform is also able to automate the measurement and optimization process. When a customer establishes a series of measurement feedback rules in our solution, our solution will automatically adjust and optimize the campaign in accordance with the feedback it receives.
Customized infrastructure
The MaxPoint Intelligence Platform runs on our proprietary software and custom hardware that utilizes over 12,000 hyper-threaded CPU cores with a storage capacity exceeding 3.1 petabytes. The Platform utilizes a distributed architecture housed in six third-party data centers located in California, New Jersey, North Carolina, Texas and the Netherlands. In addition to providing redundancy, this distributed approach enables bidding operations to be positioned closer to the time critical RTB exchanges to reduce network latency. Our platform's modular design allows it to scale as needed to support growth.
Our Growth Strategies
Our goal is to be the leading strategic partner assisting national brands in driving local, in-store sales. The core elements of our growth strategy include:
- •
- Increase share of spend from existing customers. Our goal is to capture an increasing share of our existing customers' marketing budgets by working with more of their national brands, growing the number of physical store locations of retailers through which they sell their products, and broadening the number of regions and geographies covered by our solution. We plan to invest in our sales organization to deepen and strengthen our relationship with existing customers. We believe that our enterprise customers recognize the value of our services. For example, enterprise customers who began working with us in 2011 spent 48% more with us in 2012 and an additional 68% in 2013, and enterprise customers who began working with us in 2012 spent an additional 32% with us in 2013. As an additional example of the growth of acceptance of our product, the performance of our top 25 customers for each of 2011, 2012 and 2013 is as follows:
| |
2011 | 2012 | 2013 | |||||||
|---|---|---|---|---|---|---|---|---|---|---|
Revenue from top 25 customers (in millions) |
$ | 11.0 | $ | 18.3 | $ | 36.4 | ||||
Percent of total revenue from top 25 customers |
75 | % | 52 | % | 55 | % | ||||
Revenue per top 25 customer (in thousands) |
$ | 439 | $ | 734 | $ | 1,457 | ||||
Total campaigns for top 25 customers |
415 | 928 | 2,104 | |||||||
Campaigns per top 25 customer |
17 | 37 | 84 | |||||||
- •
- Acquire new customers. Our goal is to
attract new customers by growing market awareness of our solution. Many national brands continue to utilize less effective, inefficient marketing solutions and methods that have limited or
unquantifiable impact on in-store sales. We believe that national brands can benefit from our proprietary, technology-driven local marketing solution, and we plan to invest in growing our sales
organization and marketing efforts in order to reach these potential customers.
- •
- Further penetrate new industries. Historically, we have focused primarily on serving national brands in three industries—consumer products, retail and automotive—and have recently expanded into three new industries—healthcare, telecommunications and entertainment. Our plan is to continue to penetrate these new industries and pursue opportunities in additional industries.
85
- •
- Continue to innovate and invest in our
technology. We plan to continue to make substantial investments in our technology and product development to enhance the effectiveness of
our solution in an effort to deliver increasing value to our customers. In addition to improving our data processing, business intelligence and marketing execution technologies, we intend to enhance
the ways that our customers can access and utilize our solution and extract greater intelligence from the data we generate and aggregate. One recent innovation has been our ability to deliver
non-display advertisements, which was introduced in the fourth quarter of 2012. Revenue from non-display advertisements has grown rapidly from 8% of revenue, or approximately $0.9 million in
the first quarter of 2013, to 20% of revenue, or approximately $5.5 million, in the third quarter of 2014.
- •
- Expand internationally. To date, we have focused our efforts on developing our solution for the U.S. market. We believe that our technology and solution can be adapted to other countries where national brands face similar local marketing challenges. We recently established a presence in the United Kingdom and expect to explore additional international expansion opportunities.
Our Customers
Our customer base consists primarily of companies with national brands in the consumer products, retail, automotive, healthcare, telecommunications and entertainment industries. We sell our solution either directly to our customers or through advertising agencies that act on behalf of our customers. As of September 30, 2014, we had 431 enterprise customers. We have worked with each of the top 20 leading national advertisers and each of the top 10 advertising agencies in the United States as ranked in 2014 by Advertising Age. We benefit from a diverse advertiser base across many industries, such as consumer products, retail, automotive, healthcare, telecommunications and entertainment. For the year ended December 31, 2011, one customer, General Mills, Inc., accounted for approximately 28% of our revenue, and for the years ended December 31, 2012 and 2013, no single customer represented more than 10% of our revenue.
We define an enterprise customer to be any customer from which we have generated more than $10,000 of revenue during any trailing twelve-month period. In those cases where we work with multiple brands or divisions within the same company or where the company runs marketing campaigns in multiple geographies, even though multiple IOs may be involved, we count that company as a single customer. When the IO is with an advertising agency, we consider the company on behalf of which the marketing campaign is conducted as our enterprise customer. If a company has its marketing spend with us managed by multiple advertising agencies, that company is still counted as a single enterprise customer.
While the number of our enterprise customers has increased over time, this number can also fluctuate from quarter to quarter due to the seasonal trends in the advertising spend of our enterprise and other customers, which can impact the timing and amount of revenue we generate from them. For information regarding the seasonality of our business, see "—Seasonality" and "—Quarterly Trends and Seasonality" in "Management's Discussion and Analysis of Financial Condition and Results of Operations."
Customer Case Studies
Although each marketing campaign that we conduct for our customers is unique, we believe that the following customer case studies provide a representative sample of how different types of customers can use, customize and benefit from our solution across different industries, retail locations, product types, marketing goals and sales strategies. The following customer case studies relate to marketing campaigns that occurred during the fourth quarter of 2013 and the first half of 2014.
86
For purposes of the following customer case studies, we measured the increase in sales lift that results from the use of our solution by comparing product sales in test stores that participated in the marketing campaign against sales of the same product in control stores that did not participate. We selected, matched and normalized the test and control stores—based on, among other things, overall store sales volume, brand and category sales, product distribution and geography—to achieve statistical equivalency and establish a baseline for test store performance.
Barilla Gluten Free Pasta New Product Launch: Accelerate New Product Sales by Matching Advertising to Distribution
Goal. Generate immediate demand for Barilla's new line of gluten free pasta products in over 600 select stores of a large grocery retailer as soon as the product first became available or was sold in those stores.
Strategy. Utilize "first scan" data from each select store's inventory or point of sale system to initiate a digital marketing campaign immediately following the initial availability or sale of the new line of products on a store-by-store basis, targeting consumers within Digital Zips near the select stores based on pre-determined demographics and lifestyles.
Results. During the six-week marketing campaign, average per store sales of the new line of gluten free pasta products at the select stores were 20.2% greater than for the approximately 100 stores of the large grocery retailer that served as a control group and did not participate in the marketing campaign, or 10.1% after adjustments taking into account differences between the select and control stores. Sales of three other existing Barilla pasta products in the select stores were also greater during the marketing campaign as compared to sales in the control stores. Based on the greater sales of its new line of gluten free products and three other existing pasta products in the stores that participated in our marketing campaign as compared to sales in the control stores during our marketing campaign, Barilla achieved a four times return on its investment in the campaign.
Starbucks Via Latte New Product Launch: Accelerate Sales by Optimizing Advertising Delivery Based on Real-Time Store Level Sales
Goal. Generate immediate demand for two of Starbuck's new Via Latte products and drive trial sales over a six-week period in over 1,500 select stores of a large national retailer as soon as the product first became available or was first sold in those stores.
Strategy. Utilize "first scan" data from each select store's inventory or point of sale system to initiate a digital marketing campaign immediately following the initial availability or sale of the new Via Latte products and optimize the allocation of advertising impressions on an ongoing basis based on real-time store-by-store sales performance over the course of the six-week marketing campaign.
Results. During the six week marketing campaign, average sales of the new Starbucks Via Latte products in the select stores were 7.7% greater than for the approximately 200 stores of the large national retailer that served as a control group and did not participate in the marketing campaign, after adjustments taking into account differences between the select and control stores. Sales of all other Starbucks Via products in the select stores were also greater during the marketing campaign as compared to sales in the control stores.
Electrolux Household Appliance Manufacturer: Drive Sales of Frigidaire Cooking Appliances at Select Home Depot Stores
Goal. Drive sales of Frigidaire cooking appliances in over 130 select Home Depot stores.
87
Strategy. Utilize weekly store level sales data and our Digital Zip architecture to serve advertising impressions only to households likely to have an interest in home improvement and purchases in the home improvement store category within a specific geographic radius of the select Home Depot stores.
Results. During the seven-week marketing campaign, average per store sales of the four advertised Frigidaire cooking appliances in the select stores were 23.2% greater than for the approximately 40 Home Depot stores that served as a control group and did not participate in the marketing campaign, after adjustments taking into account differences between the select and control stores. Sales of all other Frigidaire cooking appliances in the select stores were also greater during the marketing campaign as compared to sales in the control stores. Based on the greater sales of the four advertised Frigidaire cooking appliances and the other Frigidaire cooking appliances in the stores that participated in our marketing campaign as compared to sales in the control stores during our marketing campaign, Frigidaire achieved a three times return on its investment in the campaign.
Research and Development
Our research and development expenses were $2.6 million, $5.4 million and $8.7 million for the years ended December 31, 2011, 2012 and 2013, respectively, and $6.0 million and $10.1 million for the nine months ended September 30, 2013 and 2014, respectively. We believe that continued investment in our platform, including its technologies and functionalities, is critical to our success and long-term growth. We therefore expect technology and development expense to increase as we continue to invest in technology infrastructure to support increased volume of marketing spend on our platform and international expansion, as well as to expand our engineering and technology teams to maintain and support our technology and development efforts. We also intend to invest in new and enhanced technologies and functionalities to enhance our platform and further automate our business processes with the goal of enhancing our future profitability.
Sales and Marketing
We sell our solution to customers, and advertising agencies acting on their behalf, through our direct sales team. Our direct sale team leverages its market knowledge and expertise to demonstrate the benefits of our solution to both advertisers and advertising agencies acting on their behalf.
We are focused on managing our brand, increasing market awareness and generating new marketing campaigns. We often present at industry conferences, create custom events and invest in public relations. In addition, our marketing team advertises online, in print and in other forms of media, creates case studies, sponsors research, authors whitepapers, publishes marketing collateral, generates blog posts and undertakes customer research studies.
Our Employees
As of September 30, 2014, we had 291 employees, 286 of whom were based in the United States.
Our Competition
We compete for the local marketing spend of national brands. Our industry is highly competitive and fragmented. Our principal competition includes traditional advertising and direct marketing companies, such as Gannett Company, Inc., The McClatchey Company, News America
88
Marketing, Valassis Communications, Inc. and Valpak Direct Marketing Systems, Inc. In addition, we compete or may compete with:
- •
- companies that offer demand-side platforms that allow customers to purchase inventory directly from RTB exchanges or other
third parties;
- •
- advertising networks and advertising agencies;
- •
- traditional advertising channels, such as television, radio and print;
- •
- services offered through large online portals, such as Yahoo! Inc. and Google Inc.;
- •
- companies providing online search advertising, for which we do not offer a solution; and
- •
- technology companies providing online marketing platforms focused on local businesses.
In addition, the advertising agencies that act on behalf of our customers are creating their own competitive solutions, referred to as agency trading desks, which they operate through holding companies. If the agency trading desks are successful in leveraging agency relationships with our customers, we may be unable to compete successfully even if our solution is more effective. To continue to compete effectively, our solution must remain competitive in terms of ease of use, scalability, speed, performance, brand safety, customer service and other technological features that assist national brands in increasing the return on their marketing investment. Although our industry is evolving rapidly and becoming increasingly competitive, we believe that our solution enables us to compete favorably on these factors.
Intellectual Property
The protection of our technology and intellectual property is an important component of our success. We rely on intellectual property laws, including trade secret, copyright, trademark and patent laws in the United States and abroad, and use confidentiality procedures, non-disclosure agreements, confidentiality and invention assignment agreements and other contractual rights to protect our intellectual property.
As of December 31, 2014, we had three active U.S. patents and 18 pending non-provisional applications in the United States and five pending non-U.S. applications. We register certain domain names, trademarks and service marks in the United States and in certain locations outside the United States. We also rely upon common law protection for certain trademarks. In addition, in the ordinary course of business, we license third-party software, enter into third-party relationships and utilize "open source" software to create and distribute our solution.
Circumstances outside of our control could pose a threat to our intellectual property rights. Effective intellectual property protection may not be available in the United States or other countries in which we provide our solution. In addition, the efforts we have taken to protect our intellectual property rights may not be sufficient or effective. Any impairment of our intellectual property rights could harm our business, our ability to compete and harm our operating results.
Privacy and Interest-Based Advertising
The use of interest-based digital advertising has come under increasing scrutiny by user advocacy organizations and regulatory agencies in the United States and abroad that focus on digital privacy. More specifically, these groups have voiced concerns about the use of cookies and other digital applications to record an Internet user's browsing history, and the use of that information to deliver digital advertisements based on inferred interests of such Internet user. We rely upon access to large volumes of user data, including web browsing history, and it is essential that we monitor developments in this area domestically and globally and engage in responsible privacy practices.
89
We recognize that privacy is important to users and advertisers, and we strictly enforce our privacy and data protection policies. Our privacy policy, which can be found on our website at http://maxpoint.com/us/privacy-policy, explains our privacy practices, as well as the type of data we collect and how we use it to provide our services. The information contained on, or that can be accessed through, our website is not a part of this prospectus.
We rely on anonymous data about Internet users, including geolocation information derived from users' IP addresses. We do not attempt to associate this anonymous data with data that can be used to identify real people, and we take steps not to collect and store personally identifiable information from any source. The definition of personally identifiable information, or personal data, however, varies by country and continues to evolve. Some jurisdictions, for example, may consider IP addresses to be personal data subject to the same data protection requirements as information understood in the United States to be personal data, such as name, phone number and postal or email addresses. As a result, our technology platform and business practices must be assessed and managed regularly in each jurisdiction in which we do business to avoid violating laws or regulations related to the collection, storage and use of personally identifiable information.
We are members of, or participants in, industry self-regulatory organizations, including the Network Advertising Initiative. Under the requirements of these self-regulatory organizations, in addition to other compliance obligations, we provide consumers with notice about our use of cookies and other tracking mechanisms and our collection and use of data in connection with the delivery of targeted advertising, and we also allow consumers to opt out from receiving targeted advertising that is based on the data we collect about them. These practices are described in our privacy policy. Additionally, MaxPoint is certified under the U.S.-E.U. Safe Harbor Framework and U.S.-Swiss Safe Harbor Framework as set forth by the U.S. Department of Commerce regarding the collection, use and retention of personal information from European Union member countries.
In addition to industry self-regulation, compliance with our privacy policy is also subject to regulation by both federal and state governments, and the governments of every other jurisdiction in which we conduct business.
Legal Proceedings
From time to time, we are involved in legal proceedings and subject to claims incident to the ordinary course of business. Although the results of legal proceedings and claims cannot be predicted with certainty, we believe we are not currently party to any legal proceedings the outcome of which, if determined adversely to us, would individually or taken together have a material adverse effect on our business, operating results, cash flows or financial condition. Regardless of the outcome, such proceedings can have an adverse impact on us because of defense and settlement costs, diversion of resources and other factors, and there can be no assurances that favorable outcomes will be obtained.
Facilities
Our corporate headquarters are located in Morrisville, North Carolina, where we occupy facilities totaling approximately 48,648 square feet under a lease which expires in June 2019. We use these facilities for our principal administration, sales and marketing, technology and development and engineering activities. We also maintain additional offices in Austin, Texas, which we use primarily for software development, and Atlanta, Georgia; Boston, Massachusetts; Chicago, Illinois; Cincinnati, Ohio; London, United Kingdom; Los Angeles, California; Minneapolis, Minnesota, New York, New York, Rogers, Arkansas and San Francisco, California, which we use primarily for sales and marketing. We believe that our current facilities are adequate to meet our ongoing needs, and that, if we require additional space, we will be able to obtain additional facilities on commercially reasonable terms.
90
Executive Officers and Directors
Our executive officers and directors, and their ages and positions as of December 31, 2014, are set forth below:
Name
|
Age | Position(s)
|
|||
|---|---|---|---|---|---|
| Joseph Epperson | 44 | President, Chief Executive Officer and Chairman | |||
Gretchen Joyce |
50 |
Chief Operating Officer |
|||
Kurt Carlson |
44 |
Chief Technology Officer |
|||
Brad Schomber |
41 |
Chief Financial Officer |
|||
Kevin Dulsky |
48 |
Director |
|||
Lynnette Frank |
46 |
Director |
|||
Len Jordan |
48 |
Director |
|||
Augustus Tai |
49 |
Director |
|||
- (1)
- Member of audit committee.
- (2)
- Member of compensation committee.
- (3)
- Member of nominating and corporate governance committee.
Executive Officers
Joseph Epperson has served as our chief executive officer and as a member of our board of directors since September 2006 and has served as our chairman and president since December 2011. Mr. Epperson served as our chief financial officer from September 2006 to February 2009. Prior to co-founding MaxPoint, Mr. Epperson was a finance director at eBay Inc., a global technology company, from May 2001 to December 2006. Prior to eBay, Mr. Epperson was with 3Com Corporation, a digital electronics manufacturer, and, prior to that, a business analyst with Ford Motor Company, a multi-national automaker. Mr. Epperson received a B.S.B.A. in finance and accounting from The Ohio State University and an M.B.A. from Michigan State University. Our board of directors believes that Mr. Epperson's comprehensive knowledge of our business due to his position as our chief executive officer, his extensive experience in general management and business strategy and his experience in the software industry qualify him to serve on our board of directors.
Gretchen Joyce has served as our chief operating officer since February 2009. Ms. Joyce served as our president from February 2009 to December 2011 and as a member of our board of directors from September 2006 to January 2010. Prior to joining MaxPoint, Ms. Joyce was a vice president of sales and distribution at Tesla Motors, Inc., an electric vehicle manufacturer, from May 2006 to August 2007. From March 2004 to April 2006, Ms. Joyce was a director of international motors at eBay and, from April 2001 to March 2004, director of passenger vehicles at eBay. Prior to eBay, Ms. Joyce was director of business development at E-Loan, Inc., a financial services company, and manager, retail strategies at Saturn Corporation, an automobile manufacturer. Ms. Joyce received a B.A. in economics and management from Albion College.
Kurt Carlson has served as our chief technology officer since September 2006. Prior to co-founding MaxPoint, Mr. Carlson was a senior software engineer at NetQoS Inc., a provider of network management software and services, from May 2006 to July 2007. From March 2001 to April 2006, Mr. Carlson held a variety of positions, including director, software development, at Luminex
91
Corporation, a biotechnology company. Prior to Luminex, Mr. Carlson held multiple software engineering positions at Wavefly Corporation, a developer of technology platforms enabling users to access digital media, and National Instruments Corporation, a producer of automated test equipment and virtual instrumentation software. Mr. Carlson received a B.S. in computer and information science from The Ohio State University.
Brad Schomber has served as our chief financial officer since March 2014. Prior to joining MaxPoint, Mr. Schomber was chief accounting officer at ChannelAdvisor Corporation, a provider of software-as-a-service solutions for e-commerce optimization, from August 2013 to March 2014. Previously at ChannelAdvisor, Mr. Schomber was vice president of finance from July 2010 to July 2013, director of finance from July 2009 to July 2010 and controller from July 2006 to July 2009. From July 2002 to July 2006, Mr. Schomber served in various roles, including as senior audit manager, at Grant Thornton LLP, an accounting firm. From September 1995 to July 2002, Mr. Schomber was an audit manager at Arthur Andersen LLP, an accounting firm. Mr. Schomber is currently on the board of directors of the RTP CFO Forum, an organization that supports chief financial officers in the Research Triangle Park area. Mr. Schomber received a B.S. in accounting from Wake Forest University.
Non-Employee Directors
Kevin Dulsky has served as our corporate secretary and as a member of our board of directors since September 2006. Mr. Dulsky has been self-employed since October 2014. From December 2013 to October 2014, Mr. Dulsky was a vice president at Dot & Bo Inc., a furniture e-commerce company. From May 2013 to November 2013, Mr. Dulsky was president at Rakiteer, Inc., provider of an e-commerce mobile application. From January 2013 to May 2013, Mr. Dulsky was chief executive officer of WellPower, a mobile application offered by WellPoint, Inc., a mobile wellness company. From January 2011 to November 2012, Mr. Dulsky held a variety of executive positions at Nokia Oyj, a manufacturer of mobile devices and networks. Prior to Nokia, Mr. Dulsky was president at ID8 Advisory Services Corporation, an advisory company to mobile and Internet companies, from January 2008 to December 2010. Previously Mr. Dulsky was a senior director and general manager of PayPal Mobile with PayPal, Inc., an electronic payments company, and a director at eBay. Mr. Dulsky currently serves as an advisor to a number of privately held companies. Mr. Dulsky received a B.A. in social psychology from Harvard University and an M.B.A. from Harvard Business School. Our board of directors believes that Mr. Dulsky's extensive experience in general management and his deep experience in the technology industry qualify him to serve as a member of our board of directors.
Lynnette Frank has served as a member of our board of directors since August 2014. Prior to being appointed to our board of directors, Ms. Frank was a partner at Deloitte & Touche LLP, a professional services firm that provides audit, tax, consulting, enterprise risk and financial advisory services, where she served as an audit professional from September 1990 through May 2014, including as an audit partner from August 2003 to May 2014. Ms. Frank received a B.A. in business administration with an accounting concentration from the University of Washington and is a certified public accountant in the State of Washington. Our board of directors believes that Ms. Frank's deep experience with accounting, auditing and financial reporting qualifies her to serve on our board of directors.
Len Jordan has served as a member of our board of directors since December 2010. Mr. Jordan is a managing director at Madrona Venture Group, a venture capital firm that invests in digital media and advertising, mobile, networking, commercial software and consumer internet companies, where he has served since January 2010. Prior to joining Madrona, Mr. Jordan worked full-time for Frazier Technology Ventures, a venture capital firm, from February 2003 to December 2010. He remains a general partner of Frazier Technology Ventures and, on its behalf, serves on the board of Control4 Corporation, a publicly traded corporation that provides automation and control
92
solutions for the connected home. Prior to Frazier Technology Ventures, Mr. Jordan was senior vice president of media systems and consumer appliances at RealNetworks, Inc., a provider of Internet streaming media delivery software and services, and, prior to that, president at Creative Multimedia, Inc., a developer and publisher of CD-ROM and Internet products. Mr. Jordan began his career as a product manager at Central Point Software, Inc., a software utilities company. In addition to Control4, Mr. Jordan currently serves on the board of directors of a number of privately held technology companies. Mr. Jordan received a B.S. in economics from the David Eccles School of Business at the University of Utah. Our board of directors believes that Mr. Jordan's deep experience with the venture capital industry and his business experience building software and digital media companies qualify him to serve on our board of directors.
Augustus Tai has served as a member of our board of directors since January 2010. Mr. Tai is a general partner at Trinity Ventures, a venture capital firm that invests in software, consumer enabling technologies and consumer services, where he has served since May 1996. Prior to joining Trinity, Mr. Tai was a management consultant at Bain & Company, a manager at Digital Equipment Corporation, a vendor of computer systems, and an analyst at The Goldman Sachs Group, Inc., a global investment banking, securities and investment management firm. Mr. Tai currently serves on the board of directors of a number of privately held technology companies. Mr. Tai received a B.A. in applied mathematics from Harvard University and a M.S. and M.B.A. from the Massachusetts Institute of Technology's Department of Materials Science and Engineering and Sloan School of Management, respectively. Our board of directors believes that Mr. Tai's deep experience with the venture capital industry and his extensive experience providing guidance and counsel to consumer-related technology companies qualify him to serve on our board of directors.
Director Independence
We are applying to have our common stock listed on the New York Stock Exchange. The listing rules of this stock exchange generally require that a majority of the members of a listed company's board of directors be independent within 12 months following the closing of an initial public offering. Our board of directors has determined that none of our non-employee directors has a relationship that would interfere with the exercise of independent judgment in carrying out the responsibilities of a director and that each of these directors is "independent" as that term is defined under the rules of the New York Stock Exchange. The independent members of our board of directors will hold separate regularly scheduled executive session meetings at which only independent directors are present.
Audit committee members must also satisfy the independence rules in Securities and Exchange Commission, or SEC, Rule 10A-3 adopted under the Exchange Act. In order to be considered independent for purposes of Rule 10A-3, a member of an audit committee of a public company may not, other than in his or her capacity as a member of the audit committee, the board of directors, or any other board committee: accept, directly or indirectly, any consulting, advisory or other compensatory fee from the listed company or any of its subsidiaries; or be an affiliated person of the listed company or any of its subsidiaries. Each of Mr. Jordan and Ms. Frank qualify as an independent director pursuant to Rule 10A-3. Our board of directors determined that Mr. Tai does not satisfy the independence criteria set forth in Rule 10A-3. Accordingly, we are relying on the exemption from the independence requirements of Rule 10A-3 that provides that a minority of the members of our audit committee may be exempt from the independence requirements for one year from the date of effectiveness of this registration statement. We also intend to satisfy the audit committee independence requirement of the New York Stock Exchange.
Board Composition
Our board of directors currently consists of five members, who were elected pursuant to the amended and restated voting agreement that we entered into with certain holders of our common
93
stock and certain holders of our convertible preferred stock and the related provisions of our amended and restated certificate of incorporation.
The provisions of this voting agreement will terminate upon the completion of this offering, after which there will be no further contractual obligations regarding the election of our directors. Our directors hold office until their successors have been elected and qualified or appointed, or the earlier of their death, resignation or removal.
Immediately after this offering, our board of directors will be divided into three classes with staggered three-year terms. At each annual meeting of stockholders, the successors to directors whose terms then expire will be elected to serve from the time of election and qualification until the third annual meeting following election. Our directors will be divided among the three classes as follows:
- •
- the Class I director will be Mr. Dulsky, and his term will expire at the annual meeting of stockholders to
be held in 2016;
- •
- the Class II directors will be Ms. Frank and Mr. Tai, and their terms will expire at the annual
meeting of stockholders to be held in 2017; and
- •
- the Class III directors will be Messrs. Epperson and Jordan, and their terms will expire at the annual meeting of stockholders to be held in 2018.
Directors in a particular class will be elected for three-year terms at the annual meeting of stockholders in the year in which their terms expire. As a result, only one class of directors will be elected at each annual meeting of our stockholders, with the other classes continuing for the remainder of their respective three-year terms. Each director's term continues until the election and qualification of his or her successor, or the earlier of his or her death, resignation or removal.
Our amended and restated certificate of incorporation and amended and restated bylaws that will be in effect upon the completion of this offering provide that only our board of directors can fill vacant directorships, including newly-created seats. Any additional directorships resulting from an increase in the authorized number of directors would be distributed among the three classes so that, as nearly as possible, each class would consist of one-third of the authorized number of directors.
The classification of our board of directors may have the effect of delaying or preventing changes in our control or management. See "Description of Capital Stock—Anti-Takeover Provisions—Certificate of Incorporation and Bylaws Provisions."
Board Leadership Structure
Currently, our chairman is Mr. Epperson, who also serves as our chief executive officer. The board of directors believes that it is in the best interest of the company and its stockholders for Mr. Epperson to serve in both roles given his knowledge of our company and industry. We believe that this structure provides appropriate leadership and oversight of the company and facilitates effective functioning of both management and the board of directors. Pursuant to our Corporate Governance Principles, our board of directors may separate or combine the roles of the chairman of the board of directors and chief executive officer when and if it deems it advisable and in our best interests and in the best interests of our stockholders to do so.
Board Oversight of Risk
One of the key functions of our board of directors is informed oversight of our risk management process. In particular, our board of directors is responsible for monitoring and assessing strategic risk exposure. Our executive officers are responsible for the day-to-day management of the material risks we face. Our board of directors administers its oversight function
94
directly as a whole, as well as through various standing committees of our board of directors that address risks inherent in their respective areas of oversight. For example, our audit committee is responsible for overseeing the management of risks associated with our financial reporting, accounting and auditing matters; our compensation committee oversees the management of risks associated with our compensation policies and programs; and our nominating and corporate governance committee oversees the management of risks associated with director independence, conflicts of interest, composition and organization of our board of directors and director succession planning.
Board Committees
Effective as of the completion of this offering, our board of directors has established an audit committee, a compensation committee and a nominating and corporate governance committee. Our board of directors may establish other committees to facilitate the management of our business. Our board of directors and its committees set schedules for meeting throughout the year and can also hold special meetings and act by written consent from time to time, as appropriate. Our board of directors has delegated various responsibilities and authority to its committees as generally described below. The committees will regularly report on their activities and actions to the full board of directors. Each member of each committee of our board of directors qualifies as an independent director in accordance with the listing standards of the New York Stock Exchange. Each committee of our board of directors has a written charter approved by our board of directors. Upon the completion of this offering, copies of each charter will be posted on our website at www.maxpoint.com under the Investor Relations section. The inclusion of our website address in this prospectus does not include or incorporate by reference the information on our website into this prospectus. Members serve on these committees until their resignation or until otherwise determined by our board of directors.
Audit Committee
Effective as of the completion of this offering, the members of our audit committee will be Messrs. Jordan and Tai and Ms. Frank, each of whom can read and understand fundamental financial statements. Each of Mr. Jordan and Ms. Frank is independent under the rules and regulations of the SEC and the listing standards of the New York Stock Exchange applicable to audit committee members. Ms. Frank will chair the audit committee. Our board of directors has determined that Ms. Frank qualifies as an audit committee financial expert within the meaning of SEC regulations and meets the financial sophistication requirements of the New York Stock Exchange.
Our audit committee assists our board of directors' oversight of the integrity of our financial statements, our compliance with legal and regulatory requirements, the qualifications, independence and performance of the independent registered public accounting firm, the design and implementation of our internal audit function and risk assessment and risk management. Among other things, our audit committee is responsible for reviewing and discussing with our management the adequacy and effectiveness of our disclosure controls and procedures. The audit committee also discusses with our management and independent registered public accounting firm the annual audit plan and scope of audit activities, scope and timing of the annual audit of our financial statements, and the results of the audit, quarterly reviews of our financial statements and, as appropriate, initiates inquiries into aspects of our financial affairs. Our audit committee is responsible for establishing and overseeing procedures for the receipt, retention and treatment of any complaints reporting accounting, internal accounting controls or auditing matters, as well as for the confidential and anonymous submissions by our employees of concerning questionable accounting or auditing matters. In addition, our audit committee has direct responsibility for the appointment, compensation, retention and oversight of the work of our independent registered
95
public accounting firm. Our audit committee has sole authority to approve the hiring and discharging of our independent registered public accounting firm, all audit engagement fees and terms and all permissible non-audit engagements with the independent auditor. Our audit committee will review and oversee all related person transactions in accordance with our policies and procedures.
Compensation Committee
Effective as of the completion of this offering, the members of our compensation committee will be Messrs. Jordan and Tai. Mr. Jordan will chair the compensation committee. Each member of our compensation committee is independent under the rules and regulations of the SEC and the listing standards of the New York Stock Exchange applicable to compensation committee members. Our compensation committee assists our board of directors with its oversight of the forms and amount of compensation for our executive officers, and the administration of our incentive plans for employees and other service providers, including our equity incentive plans, and certain other matters related to our compensation programs.
Nominating and Corporate Governance Committee
Effective as of the completion of this offering, the members of our nominating and corporate governance committee will be Messrs. Jordan and Tai. Mr. Tai will chair the nominating and corporate governance committee. Our nominating and corporate governance committee assists our board of directors with its oversight of and identification of individuals qualified to become members of our board of directors, consistent with criteria approved by our board of directors, and selects, or recommends that our board of directors selects, director nominees; develops and recommends to our board of directors a set of corporate governance guidelines; and oversees the evaluation of our board of directors.
Code of Conduct
Effective as of the completion of this offering, our board of directors has adopted a code of conduct. The code of conduct will apply to all of our employees, officers and directors. We also expect our contractors, consultants, suppliers and agents to follow our code of conduct in connection with their work for us. Upon the completion of this offering, the full text of our code of conduct will be posted on our website at www.maxpoint.com under the Investor Relations section. We intend to disclose future amendments to, or waivers of, our code of conduct, as and to the extent required by SEC regulations, at the same location on our website identified above and in public filings. Information contained on our website is not incorporated by reference into this prospectus, and you should not consider information contained on our website to be part of this prospectus or in deciding whether to purchase shares of our common stock.
Compensation Committee Interlocks and Insider Participation
As noted above, the compensation committee of our board of directors will consist of Messrs. Jordan and Tai. During the year ended December 31, 2014, our compensation committee consisted of Messrs. Jordan and Tai. None of our executive officers serves, or served during the year ended December 31, 2014, as a member of the board of directors or compensation committee of any other entity that has or has had one or more executive officers serving as a member of our board of directors or our compensation committee. Messrs. Jordan and Tai may be deemed to have an interest in certain transactions requiring disclosure under Item 404 of Regulation S-K under the Securities Act of 1933, as amended, or Securities Act, that are discussed in the section entitles "Certain Relationships and Related Party Transactions," which disclosure is hereby incorporated by reference in this section.
96
Director Compensation
Prior to August 2014, we did not pay any fees, make any equity or non-equity awards, or pay any other compensation, to the non-employee directors who served on our board of directors. A non-employee director is a director who is not employed by us and who does not receive compensation from us or have a business relationship with us that would require disclosure under certain SEC rules. Mr. Epperson, our chief executive officer, does not receive any compensation for his service as a director.
In August 2014, Ms. Frank was appointed as a member of our board of directors. Ms. Frank will receive an annual retainer of $30,000 for service as an independent director and an annual retainer of $20,000 for service on our audit committee, in each case payable in cash quarterly in arrears. In addition, in August 2014, we agreed to pay Mr. Dulsky an annual retainer of $30,000 for service on our board of directors, payable in cash quarterly in arrears.
Further, in August 2014, we granted each of Ms. Frank and Mr. Dulsky an option to purchase 36,000 shares of our common stock at an exercise price of $6.88 per share. Ms. Frank's option vests over 36 months of continuous service provided by her following August 1, 2014, and Mr. Dulsky's option vests over 12 months of continuous service provided by him following August 1, 2014. In each case, the options will vest in full if we are subject to a change in control before the service of the optionee terminates.
We have a policy of reimbursing our directors for their reasonable out-of-pocket expenses incurred in attending board of directors and committee meetings.
The following table provides information concerning the compensation paid to each of our non-employee directors for the year ended December 31, 2014. Mr. Epperson, who was our employee during 2014, did not receive additional compensation for his service as a director.
Name
|
Fees Earned or Paid in Cash ($) |
Option Awards ($)(1)(2) |
Total ($) | |||||||
|---|---|---|---|---|---|---|---|---|---|---|
Kevin Dulsky |
$ | 12,500 | $ | 129,787 | $ | 142,287 | ||||
Lynnette Frank |
$ | 20,833 | $ | 114,644 | $ | 135,477 | ||||
Len Jordan |
— | — | — | |||||||
Augustus Tai |
— | — | — | |||||||
- (1)
- The amounts in this column represent the aggregate grant date fair value of option awards granted to the non-employee director in the applicable fiscal year computed in accordance with Financial Accounting Standards Board, or FASB, Accounting Standards Codification, or ASC, Topic 718. The assumptions used in calculating the grant date fair value of the stock options reported in this column are set forth in the notes to our audited consolidated financial statements included elsewhere in this prospectus.
- (2)
- As of December 31, 2014, each of Ms. Frank and Mr. Dulsky held an outstanding option to purchase 36,000 shares of our common stock. Neither Mr. Jordan nor Mr. Tai has been granted any options to purchase shares of our common stock, and none of our directors has been granted any stock awards.
97
Summary Compensation Table
The following table provides information concerning the compensation paid to each of our named executive officers for the years ended December 31, 2013, and December 31, 2014.
Name and Principal Position
|
Year | Salary ($) |
Bonus ($) |
Non-Equity Incentive Plan Compensation ($) |
Option Awards ($)(1) |
All Other Compensation ($) |
Total ($) |
|||||||||||||||
|---|---|---|---|---|---|---|---|---|---|---|---|---|---|---|---|---|---|---|---|---|---|---|
Joseph Epperson |
2014 | $ | 237,500 | $ | 1,000 | (2) | $ | 121,230 | (3) | $ | 1,470,820 | $ | 196 | $ | 1,830,746 | |||||||
President, Chief Executive Officer and Chairman |
2013 | $ | 213,333 | $ | 1,000 | $ | 100,125 | $ | — | $ | 451 | $ | 314,909 | |||||||||
Gretchen Joyce |
2014 | $ | 227,000 | $ | 1,000 | (2) | $ | 101,958 | (3) | $ | 845,721 | $ | 196 | $ | 1,175,875 | |||||||
Chief Operating Officer |
2013 | $ | 213,333 | $ | 1,000 | $ | 88,345 | $ | — | $ | 3,039 | $ | 305,717 | |||||||||
Brad Schomber(4) |
2014 | $ | 177,539 | $ | 750 | (2) | $ | 44,302 | (3) | $ | 1,066,577 | $ | 196 | $ | 1,289,364 | |||||||
- (1)
- Amounts represent the aggregate grant date fair value of stock options as computed in accordance with FASB ASC Topic 718. The assumptions used in calculating the grant date fair value of the stock options reported in this column are set forth in the notes to our audited consolidated financial statements included elsewhere in this prospectus. As required by rules of the SEC, the amounts shown exclude the impact of estimated forfeitures related to service-based vesting conditions.
- (2)
- Reflects a cash bonus paid to each of our employees in December 2014.
- (3)
- Reflects awards earned under our 2014 cash incentive bonus program, to be paid in 2015.
- (4)
- Mr. Schomber's employment with us commenced in March 2014.
Narrative Explanation of Compensation Arrangements with Our Named Executive Officers
The base salaries of all of our executive officers are reviewed annually and adjusted when our board or its compensation committee determines an adjustment is appropriate. In June 2014, our board of directors approved an increase in the base salary for each of Mr. Epperson and Ms. Joyce. Effective July 1, 2014, Mr. Epperson's base salary increased to $255,000 and Ms. Joyce's base salary increased to $234,000.
During the year ended December 31, 2014, our named executive officers were eligible to earn cash incentive bonuses based on achievement of revenue targets for the year ended December 31, 2014. We require that participants continue to be employed through the payment date to receive a bonus. In June 2014, our board of directors approved target bonus amounts for the year ending December 31, 2014 of $195,000 for Mr. Epperson and $164,000 for Ms. Joyce.
Further, in June 2014, each of Mr. Epperson and Ms. Joyce were granted a stock option to purchase 400,000 and 230,000 shares, respectively, of our common stock, at an exercise price equal to $6.63 per share. Such options will vest over four years of service following the grant date, with 25% vesting following the completion of 12 months of service and the remainder vesting ratably in 36 monthly installments thereafter.
Offer Letter with Chief Financial Officer
In February 2014, we entered into an offer letter with Brad Schomber, our chief financial officer. Pursuant to such letter, Mr. Schomber will be paid a base salary of $225,000 and is eligible to earn an annual bonus at a target amount of $90,000.
In addition, Mr. Schomber was granted an option to purchase 430,000 shares of our common stock at an exercise price of $5.68 per share, vesting over four years of service. If we are acquired
98
following the completion of this offering but within 24 months of the date on which his employment with us began, he will become vested in a total of 215,000 of such option shares.
Mr. Schomber is eligible to receive a cash bonus equal to $400,000 if we are acquired prior to the completion of this offering but within 12 months of the date on which his employment with us began.
If Mr. Schomber is terminated for reasons other than financial fraud, then he will be eligible to receive six months of his base salary and, if such termination occurs less than 12 months after his start date, a number of option shares will vest equal to the number of months of service he has completed with us divided by 48.
Employee Benefits and Perquisites
Our named executive officers are eligible to participate in our health and welfare plans to the same extent as are all full-time employees generally. We generally do not provide our named executive officers with perquisites or other personal benefits. However, in December 2014, we gave each of our employees, including our named executive officers, a GoPro camera and, additionally, a $1,000 cash bonus.
None of our other named executive officers have entered into employment agreements with us, and none of our named executive officers are eligible for any severance or change in control benefits, except as described above in "—Offer Letter with Chief Financial Officer" and below in "—Equity Compensation."
Retirement Benefits
We have established a 401(k) tax-deferred savings plan, which permits participants, including our named executive officers, to make contributions by salary deduction pursuant to Section 401(k) of the Internal Revenue Code of 1986, as amended. We are responsible for administrative costs of the 401(k) plan. We may, in our discretion, make matching contributions to the 401(k) plan. No employer contributions have been made to date.
Equity Compensation
We typically grant equity awards to new hires upon their commencing employment with us. Stock options allow employees to purchase shares of our common stock at a price per share equal to the fair market value of our common stock on the date of grant and may or may not be intended to qualify as "incentive stock options" for U.S. federal income tax purposes. In the past, our board of directors has determined the fair market value of our common stock based upon inputs including valuation reports prepared by third-party valuation firms. Generally, our equity awards vest over four years, with 25% of such award vesting after the completion of 12 months of service, and the remainder vesting in equal monthly installments over an additional 36 months of service.
Pursuant to our change in control equity acceleration policy, which will apply effective upon the effective date of this offering, if any of our employees, including our named executive officers, are subject to a termination without cause or resign for certain good reasons during the period beginning 45 days prior to, and ending on the first anniversary of, a change in control of us, 50% (or 25% for employees who have completed less than one year of continuous employment with us prior to such change in control) of such employee's then-otherwise unvested equity or equity-based awards will vest and/or become exercisable as of the employment termination date. Such benefits are contingent on the employee's execution of a general release of claims against us and agreeing to adhere to any noncompetition, nonsolicitation or nondisparagement policy then in effect.
99
Outstanding Equity Awards at 2014 Fiscal Year-End
The following table provides information regarding each unexercised option and all unvested stock held by each of our named executive officers as of December 31, 2014. The vesting schedule applicable to each outstanding award is described in the footnotes to the table below.
Where indicated, options granted to our named executive officers are immediately exercisable with respect to all of the option shares, subject to our repurchase right in the event that the executive's service terminates before vesting in such shares.
| |
Option Awards | Stock Awards | ||||||||||||||||||||
|---|---|---|---|---|---|---|---|---|---|---|---|---|---|---|---|---|---|---|---|---|---|---|
Name
|
Vesting Commencement Date |
Number of Securities Underlying Unexercised Options (#) Vested |
Number of Securities Underlying Unexercised Options (#) Unvested |
Option Exercise Price ($) |
Option Expiration Date |
Number of Shares of Stock That Have Not Vested (#) |
Market Value of Shares of Stock That Have Not Vested ($) |
|||||||||||||||
Joseph Epperson |
6/11/2014 | — | 400,000 | (1) | $ | 6.63 | 6/11/2024 | — | — | |||||||||||||
Gretchen Joyce |
6/11/2014 | — | 230,000 | (1) | $ | 6.63 | 6/11/2024 | — | — | |||||||||||||
Brad Schomber |
3/17/2014 | — | 420,000(2 | )(3) | $ | 5.68 | 3/21/2024 | 10,000 | (4) | $ | (5 | ) | ||||||||||
- (1)
- Options vest over four years of service following the vesting commencement date set forth above, with 25% vesting upon completion of one year of service and in 36 monthly installments thereafter.
- (2)
- Reflects the unexercised portion of an option to purchase 430,000 shares granted to Mr. Schomber. As granted, the option will become vested with respect to 107,500 shares when Mr. Schomber completes one year of service following the vesting commencement date, and with respect to the remaining option shares in 36 monthly installments thereafter provided service continues. In addition the option will become vested with respect to a total of 215,000 shares if we are acquired less than or equal to 24 months following March 17, 2014.
- (3)
- Option is immediately exercisable, subject to our repurchase right that lapses in accordance with the vesting schedule applicable to the option.
- (4)
- Represents shares subject to our repurchase right acquired upon partial exercise of the option to purchase 430,000 shares granted to Mr. Schomber on March 21, 2014, described in footnotes 2 and 3.
- (5)
- Market value is based on the fair market value of our common stock on December 31, 2014. As there was no public market for our common stock on December 31, 2014, we have assumed that the fair market value on such date was which represents the midpoint of the range set forth on the cover page of this prospectus.
Equity Plans
2015 Equity Incentive Plan
General. Our board of directors adopted our 2015 Equity Incentive Plan, or 2015 Plan, in January 2015, and we expect our stockholders to approve the 2015 Plan prior to the completion of this offering. The 2015 Plan became effective immediately on adoption although no awards will be made under it until the effective date of the registration statement of which this prospectus is a part. Our 2015 Plan will replace our 2010 Equity Incentive Plan, or 2010 Plan. However, awards outstanding under the 2010 Plan will continue to be governed by their existing terms.
Share Reserve. The number of shares of our common stock available for issuance under our 2015 Plan will equal the sum of 5,000,000 shares plus up to 9,075,736 shares remaining available for issuance under, or issued pursuant to or subject to awards granted under, our 2010 Plan. The number of shares reserved for issuance under the 2015 Plan will be increased automatically on the first business day of each of our fiscal years, commencing in 2016, by a number equal to the smallest of:
- •
- 3,500,000 shares;
- •
- 5% of the shares of common stock outstanding on the last business day of the prior fiscal year; or
100
- •
- the number of shares determined by our board of directors.
In general, to the extent that any awards under the 2015 Plan are forfeited, terminate, expire or lapse without the issuance of shares, or if we repurchase the shares subject to awards granted under the 2015 Plan, those shares will again become available for issuance under the 2015 Plan, as will shares applied to pay the exercise or purchase price of an award or to satisfy tax withholding obligations related to any award.
Administration. The compensation committee of our board of directors administers the 2015 Plan. The compensation committee has complete discretion to make all decisions relating to the 2015 Plan and outstanding awards, including repricing outstanding options and modifying outstanding awards in other ways.
Eligibility. Employees, non-employee directors, consultants and advisors are eligible to participate in our 2015 Plan.
Types of Awards. Our 2015 Plan provides for the following types of awards:
- •
- incentive and nonstatutory stock options;
- •
- stock appreciation rights;
- •
- restricted shares;
- •
- stock units; and
- •
- performance cash awards.
Options and Stock Appreciation Rights. The exercise price for options granted under the 2015 Plan may not be less than 100% of the fair market value of our common stock on the grant date. Optionees may pay the exercise price in cash or, with the consent of the compensation committee:
- •
- with shares of common stock that the optionee already owns;
- •
- by an immediate sale of shares through a broker approved by us;
- •
- by instructing us to withhold a number of shares having an aggregate fair market value that does not exceed the exercise
price; or
- •
- by other methods permitted by applicable law.
An optionee who exercises a stock appreciation right receives the increase in value of our common stock over the base price. The base price for stock appreciation rights may not be less than 100% of the fair market value of our common stock on the grant date. The settlement value of a stock appreciation right may be paid in cash, shares of our common stock or a combination.
Options and stock appreciation rights vest as determined by the compensation committee. In general, they will vest over a four-year period following the date of grant. Options and stock appreciation rights expire at the time determined by the compensation committee but in no event more than ten years after they are granted. These awards generally expire earlier if the participant's service terminates earlier. No participant may be granted stock options or stock appreciation rights under our 2015 Plan covering more than 3,000,000 shares in any fiscal year, except that a new employee may receive stock options or stock appreciation rights covering up to 2,000,000 additional shares in the fiscal year in which employment commences.
Restricted Shares and Stock Units. Restricted shares and stock units may be awarded under the 2015 Plan in return for any lawful consideration, and participants who receive restricted shares or stock units generally are not required to pay cash for their awards. In general, these awards will be subject to vesting. Vesting may be based on length of service, the attainment of performance-based milestones or a combination of both, as determined by the compensation committee. No
101
participant may be granted restricted share awards or stock units with performance-based vesting covering more than 2,000,000 shares during any fiscal year, except that a new employee may receive restricted shares or stock units covering up to 1,000,000 additional shares in the fiscal year in which employment commences. Settlement of vested stock units may be made in the form of cash, shares of common stock or a combination.
Performance Cash Awards. Performance cash awards granted under the 2015 Plan may qualify as performance-based compensation that is not subject to the income tax deductibility limitations imposed by Section 162(m) of the Internal Revenue Code, if the award is approved by our compensation committee and the grant or vesting of the award is tied solely to the attainment of performance goals during a designated performance period. No participant may be paid more than $5,000,000 in cash in any calendar year pursuant to a performance cash award granted under the 2015 Plan.
Performance goals for the grant or vesting of performance awards under the 2015 Plan may be based on any one, or combination, of the following:
Earnings (before or after taxes) |
Sales or revenue | |
Earnings per share |
Revenue excluding total advertising cost Expense or cost reduction | |
Earnings before interest, taxes and depreciation |
Working capital | |
Earnings before interest, taxes, depreciation and amortization |
Economic value added (or an equivalent metric) |
|
Total stockholder return |
Market share | |
Return on equity or average stockholders' equity |
Cash flow or cash balance | |
Return on assets, investment or capital employed |
Operating cash flow | |
Operating income |
Cash flow per share | |
Gross margin |
Share price | |
Operating margin |
Debt reduction | |
Net operating income |
Customer satisfaction | |
Net operating income after tax |
Stockholders' equity | |
Return on operating revenue |
Contract awards or backlog |
To the extent a performance award is not intended to comply with Section 162(m) of the Internal Revenue Code, the compensation committee may select other measures of performance.
Corporate Transactions. In the event we are a party to a merger, consolidation or certain change in control transactions, outstanding awards granted under the 2015 Plan, and all shares acquired under the 2015 Plan, will be subject to the terms of the definitive transaction agreement (or, if there is no such agreement, as determined by our compensation committee). Such treatment may include (without limitation) any of the following with respect to each outstanding award:
- •
- the continuation, assumption or substitution of an award by a surviving entity or its parent;
- •
- the cancellation of an award without payment of any consideration;
- •
- the cancellation of the vested portion of an award (and any portion that becomes vested as of the effective time of the
transaction) in exchange for a payment equal to the excess, if any, of the value that the holder of each share of our common stock receives in the transaction over (if applicable) the exercise price
otherwise payable in connection with the stock award; or
- •
- the assignment of any reacquisition or repurchase rights held by us in respect of an award of restricted shares to the surviving entity or its parent (with proportionate adjustments made to the price per share to be paid upon exercise of such rights).
102
The compensation committee is not required to treat all awards, or portions thereof, in the same manner.
The vesting of an outstanding award may be accelerated upon the occurrence of a change in control, whether or not the award is to be assumed or replaced in the transaction, or in connection with a termination of service following a change in control transaction.
A change in control includes:
- •
- any person acquiring beneficial ownership of more than 50% of our total voting power;
- •
- the sale or other disposition of all or substantially all of our assets; or
- •
- our merger or consolidation after which our voting securities represent 50% or less of the total voting power of the surviving or acquiring entity.
Changes in Capitalization. In the event of certain changes in our capital structure without our receipt of consideration, such as a stock split, reverse stock split or dividend paid in common stock, proportionate adjustments will automatically be made to:
- •
- the maximum number and kind of shares available for issuance under the 2015 Plan, including the maximum number and kind of
shares that may be issued upon the exercise of incentive stock options;
- •
- the maximum number and kind of shares covered by, and exercise price, base price or purchase price, if any, applicable to
each outstanding stock award;
- •
- the maximum number and kind of shares by which the share reserve may increase automatically each year; and
- •
- the maximum number and kind of shares subject to stock awards that may be granted to a participant in a fiscal year (as established under the 2015 Plan pursuant to Section 162(m) of the Internal Revenue Code).
In the event that there is a declaration of an extraordinary dividend payable in a form other than our common stock in an amount that has a material effect on the price of our common stock, a recapitalization, a spin-off or a similar occurrence, the compensation committee may make such adjustments to any of the foregoing as it deems appropriate, in its sole discretion.
Amendments or Termination. Our board of directors may amend or terminate the 2015 Plan at any time. If our board of directors amends the 2015 Plan, it does not need stockholder approval of the amendment unless required by applicable law, regulation or rules. The 2015 Plan will terminate automatically 10 years after the later of the date when our board of directors adopted the 2015 Plan or approved the latest share increase that was also approved by our stockholders.
2010 Equity Incentive Plan
General. Our board of directors adopted our 2010 Plan in January 2010, and it has been approved by our stockholders. The most recent amendment of our 2010 Plan was adopted by our board of directors in July 2013 and was subsequently approved by our stockholders. No further awards will be made under our 2010 Plan after this offering; however, awards outstanding under our 2010 Plan will continue to be governed by their existing terms.
Share Reserve. We have reserved 9,075,736 shares of our common stock for issuance under the 2010 Plan, all of which may be issued as incentive stock options. As of September 30, 2014, options to purchase 6,695,951 shares of common stock, at exercise prices ranging from $0.17 to $6.88 per share, or a weighted average exercise price of $3.23 per share, were outstanding under the 2010 Plan, and 974,894 shares of common stock remained available for future issuance under the 2010 Plan. Unissued
103
shares subject to awards that expire or are cancelled and shares withheld in payment of the purchase price or exercise price of an award or in satisfaction of withholding taxes again become available for issuance under the 2010 Plan.
Administration. Our board of directors administered the 2010 Plan before this offering, and the compensation committee of our board of directors will administer the 2010 Plan after this offering. The administrator has complete discretion to make all decisions relating to the 2010 Plan and outstanding awards.
Eligibility. Employees, non-employee members of our board of directors, consultants, advisors and other independent service providers are eligible to participate in our 2010 Plan.
Types of Awards. Our 2010 Plan provides for the following types of awards:
- •
- incentive and nonstatutory stock options; and
- •
- restricted shares.
Options. The exercise price for options granted under our 2010 Plan may not be less than 100% of the fair market value of our common stock on the grant date. Optionees may pay the exercise price in cash or cash equivalents, with shares of common stock that the optionee already owns, or by any other means permitted by applicable law.
Options vest as determined by the administrator. In general, we have granted options that vest over a four-year period following the date of grant, with 25% vesting after the completion of 12 months of service and the remainder vesting in 36 equal monthly installments thereafter. Options expire at the time determined by the administrator, but in no event more than ten years after they are granted, and generally expire earlier if the optionee's service terminates earlier.
Restricted Shares. Restricted shares may be awarded or sold under the 2010 Plan in return for cash or cash equivalents or, as permitted by the administrator in its sole discretion, in exchange for services rendered to us or through other means permitted by applicable law. Restricted shares vest as determined by the administrator.
Corporate Transactions. In the event that we are subject to a change in control, the administrator has the discretion to provide for shares one or more of the following with respect to outstanding options:
- •
- the assumption or substitution of the option by the surviving entity or its parent;
- •
- cancellation of the option in exchange for a payment equal to the excess, if any, of the value that the holder of each
share of our common stock receives in the transaction over the exercise price per share of the option; or
- •
- termination of the option without the payment of any consideration, following written notice to the optionee and an opportunity to exercise the then-unvested portion of such option.
A change in control includes:
- •
- our acquisition in which all or substantially all of our outstanding shares of stock are exchanged for securities or other
consideration issued by the acquiring entity or its parent;
- •
- any person acquiring beneficial ownership of 50% or more of our total voting power; or
- •
- the sale, transfer or other disposition of all or substantially all of our assets.
The administrator may require participants to waive any dissenters', appraisal or similar rights in connection with a change in control, and participants may be required to sell all shares acquired under
104
the 2010 Plan and any vested options on terms and conditions approved by us and comparable to the terms applicable to our other stockholders.
The administrator is not obligated to treat all awards in the same manner. The administrator has the discretion, at any time, to provide that an award granted under the 2010 Plan will vest on an accelerated basis if we are subject to a change of control or if the participant is subject to an involuntary termination.
Changes in Capitalization. In the event of certain specified changes in the capital structure of our common stock, such as a merger, consolidation, stock split, reverse stock split, recapitalization or reclassification, adjustments will automatically be made in the number of shares available for future grants under the 2010 Plan and the number of shares covered by each outstanding option. In the event of other changes in our capitalization, including unusual or nonrecurring events, the administrator at its sole discretion may make appropriate adjustments to awards outstanding under our 2010 Plan.
Amendments or Termination. The administrator may at any time amend, alter, modify or terminate the 2010 Plan, subject to stockholder approval if required under applicable law. The 2010 Plan will terminate automatically 10 years after the earlier of the date when our board of directors adopted the 2010 Plan or the date when our stockholders approved the 2010 Plan.
2015 Employee Stock Purchase Plan
General. Our 2015 Employee Stock Purchase Plan, or 2015 ESPP, was adopted by our board of directors in January 2015 and we expect our stockholders to approve it prior to completion of this offering. The 2015 ESPP will become effective as of the effective date of the registration statement of which this prospectus is a part. Our 2015 ESPP is intended to qualify under Section 423 of the Internal Revenue Code.
Share Reserve. We have reserved 750,000 shares of our common stock for issuance under the 2015 ESPP. The number of shares reserved for issuance under the 2015 ESPP will automatically be increased on the first business day of each of our fiscal years, commencing in 2016, by a number equal to the least of:
- •
- 500,000 shares;
- •
- 1% of the shares of common stock outstanding on the last business day of the prior fiscal year; or
- •
- the number of shares determined by our board of directors.
The number of shares reserved under the 2015 ESPP will automatically be adjusted in the event of a stock split, stock dividend or a reverse stock split (including an adjustment to the per-purchase period share limit).
Administration. The compensation committee of our board of directors will administer the 2015 ESPP.
Eligibility. All of our employees are eligible to participate if we employ them for more than 20 hours per week and for more than five months per year. Eligible employees may begin participating in the 2015 ESPP at the start of any offering period.
Offering Periods. Each offering period will last a number of months determined by the compensation committee, not to exceed 27 months. A new offering period will begin periodically, as determined by the compensation committee. Offering periods may overlap or may be consecutive. Unless otherwise determined by the compensation committee, two offering periods of six months' duration will begin in each year on May 1 and November 1. However, the first offering period may start
105
on the effective date of the registration statement related to this offering and will end on October 31, 2015, with the first purchase date occurring on or about October 31, 2015.
Amount of Contributions. Our 2015 ESPP permits each eligible employee to purchase common stock through payroll deductions. Each employee's payroll deductions may not exceed 15% of the employee's cash compensation. Each participant may purchase up to the number of shares determined by our board of directors on any purchase date, not to exceed 3,000 shares. The value of the shares purchased in any calendar year may not exceed $25,000. Participants may withdraw their contributions at any time before stock is purchased.
Purchase Price. The price of each share of common stock purchased under our 2015 ESPP will not be less than 85% of the lower of the fair market value per share of common stock on the first day of the applicable offering period (or, in the case of the first offering period, the price at which one share of common stock is offered to the public in this offering) or the fair market value per share of common stock on the purchase date.
Other Provisions. Employees may end their participation in the 2015 ESPP at any time. Participation ends automatically upon termination of employment with us. If we experience a change in control, our 2015 ESPP will end and shares will be purchased with the payroll deductions accumulated to date by participating employees. Our board of directors or our compensation committee may amend or terminate the 2015 ESPP at any time.
106
CERTAIN RELATIONSHIPS AND RELATED PARTY TRANSACTIONS
In addition to the compensation arrangements with directors and executive officers and the registration rights described elsewhere in this prospectus, there has not been a transaction or series of related transactions to which we have been a party to since January 1, 2012 or any currently proposed transaction in which:
- •
- we have been or are to be a participant;
- •
- the amount involved exceeds or will exceed $120,000; and
- •
- any of our directors, executive officers or holders of more than 5% of our capital stock, or any immediate family member of or person sharing the household with any of these individuals (other than tenants or employees), had or will have a direct or indirect material interest.
Amended and Restated Investors' Rights Agreement
We have entered into an investors' rights agreement, or IRA, with certain holders of our convertible preferred stock, including entities with which certain of our directors are affiliated. These stockholders are entitled to rights with respect to the registration of their shares following this offering under the Securities Act. For a description of these registration rights, see "Description of Capital Stock—Registration Rights."
Indemnification Agreements
Our amended and restated certificate of incorporation, which will be effective upon the completion of this offering, will contain provisions limiting the liability of directors, and our amended and restated bylaws, which will be effective upon the completion of this offering, will provide that we will indemnify each of our directors to the fullest extent permitted under Delaware law. Our certificate of incorporation and bylaws will also provide our board of directors with discretion to indemnify our officers and employees when determined appropriate by our board of directors.
We intend to enter into indemnification agreements with each of our directors and executive officers and certain other key employees. The indemnification agreements will provide that we will indemnify each of our directors, executive officers and such other key employees against any and all expenses incurred by that director, executive officer, or other key employee because of his or her status as one of our directors, executive officers, or other key employees, to the fullest extent permitted by Delaware law, our amended and restated certificate of incorporation and our amended and restated bylaws. In addition, the indemnification agreements will provide that, to the fullest extent permitted by Delaware law, we will advance all expenses incurred by our directors, executive officers and other key employees in connection with a legal proceeding involving his or her status as a director, executive officer or employee.
Policies and Procedures for Related Party Transactions
Our audit committee has the primary responsibility for the review, approval and oversight of any "related party transaction," which is any transaction, arrangement, or relationship (or series of similar transactions, arrangements, or relationships) in which we are, were, or will be a participant and the amount involved exceeds $120,000, and in which the related person has, had, or will have a direct or indirect material interest. We intend to adopt a written related party transaction policy to be effective upon the completion of this offering. Under our related party transaction policy, our management will be required to submit any related person transaction not previously approved or ratified by our audit committee to our audit committee. In approving or rejecting the proposed transactions, our audit committee will take into account all of the relevant facts and circumstances available. Our audit committee will approve only those transactions that, as determined by our audit
107
committee, are in, or are not inconsistent with, our best interests and the best interests of our stockholders.
Although we have not had a written policy prior to this offering for the review and approval of transactions with related persons, our board of directors has historically reviewed and approved any transaction where a director or officer had a financial interest, including the transactions described above. Prior to approving such a transaction, the material facts as to a director's or officer's relationship or interest as to the agreement or transaction were disclosed to our board of directors. Our board of directors would take this information into account when evaluating the transaction and in determining whether such transaction was fair to us and in the best interest of all of our stockholders.
108
The following table sets forth certain information with respect to the beneficial ownership of our common stock as of December 31, 2014, and as adjusted to reflect the sale of common stock offered by us in this offering, for:
- •
- each of our named executive officers;
- •
- each of our directors;
- •
- all of our executive officers and directors as a group; and
- •
- each stockholder known by us to be the beneficial owner of more than 5% of our outstanding shares of common stock.
We have determined beneficial ownership in accordance with the rules of the Securities and Exchange Commission. Except as indicated in the footnotes below, we believe, based on the information furnished to us, that the persons and entities named in the table below have sole voting and investment power with respect to all shares of common stock that they beneficially own, subject to applicable community property laws.
Applicable percentage ownership is based on 38,132,499 shares of common stock outstanding at December 31, 2014, after giving effect to the conversion of all outstanding shares of convertible preferred stock as of that date into an aggregate of 29,697,650 shares of our common stock, which will occur immediately prior to the closing of this offering. For purposes of computing percentage ownership after this offering, we have assumed that shares of common stock will be issued by us in this offering and that the underwriters will not exercise their right to purchase additional shares to cover over-allotments. In computing the number of shares of common stock beneficially owned by a person and the percentage ownership of that person, we deemed to be outstanding all shares of common stock subject to options held by that person or entity that are currently exercisable or that will become exercisable within 60 days of December 31, 2014. We did not deem these shares outstanding, however, for the purpose of computing the percentage ownership of any other person. Unless otherwise indicated, the address of each beneficial owner listed in the table below is c/o MaxPoint Interactive, Inc., 3020 Carrington Mill Blvd., Suite 300, Morrisville, North Carolina 27560.
| |
|
Percent of Shares Beneficially Owned |
||||||||
|---|---|---|---|---|---|---|---|---|---|---|
| |
Number of Shares Beneficially Owned |
|||||||||
Name of Beneficial Owner
|
Before the Offering |
After the Offering |
||||||||
Named Executive Officers and Directors: |
||||||||||
Kevin Dulsky(1) |
1,075,638 | 2.8 | ||||||||
Joseph Epperson |
4,164,066 | 10.9 | ||||||||
Lynnette Frank(2) |
* | * | ||||||||
Len Jordan(3) |
9,010,652 | 23.6 | ||||||||
Gretchen Joyce(4) |
968,728 | 2.5 | ||||||||
Brad Schomber(5) |
430,000 | 1.1 | ||||||||
Augustus Tai(6) |
12,299,150 | 32.3 | ||||||||
All Executive Officers and Directors as a Group (8 persons)(7) |
28,855,234 | 74.8 | ||||||||
5% Stockholders: |
||||||||||
Trinity Ventures(8) |
12,299,150 | 32.3 | ||||||||
Madrona Venture Funds(9) |
9,010,652 | 23.6 | ||||||||
Entities affiliated with Performance Equity Management(10) |
6,200,492 | 16.3 | ||||||||
- *
- Less
than 1 percent.
- (1)
- Consists of (i) 900,000 shares of common stock held by Mr. Dulsky, (ii) 21,000 shares of common stock issuable to Mr. Dulsky pursuant to an option exercisable within 60 days of December 31, 2014, of which all of the shares were vested as of such date and (iii) 154,638 shares of common stock held by Kevin Dulsky and Melissa Daniels.
109
- (2)
- Consists of 7,000 shares of common stock issuable to Ms. Frank pursuant to an option exercisable within 60 days of December 31, 2014, of which all of the shares were vested as of such date.
- (3)
- Consists of 9,010,652 shares of common stock held by the Madrona Venture Funds, as reflected in footnote 9 below. Mr. Jordan, a member of our board of directors, is a managing director of Madrona IV General Partner, LLC, the general partner of Madrona Investment Partners IV, L.P., itself the general partner of Madrona Venture Fund IV, L.P. (Madrona Fund IV) and Madrona Venture Fund IV-A, L.P. (Madrona Fund IV-A, and together with Madrona Fund IV, the Madrona Venture Funds), and has shared voting and dispositive power with regard to the shares directly held by the Madrona Venture Funds. Mr. Jordan disclaims beneficial ownership of the securities except to the extent of his pecuniary interest therein.
- (4)
- Consists of (i) 934,364 shares of common stock held by Ms. Joyce and (ii) 34,364 shares of common stock held by Gretchen Joyce and Brien Joyce.
- (5)
- Consists of (i) 10,000 shares of common stock held by Mr. Schomber and (ii) 420,000 shares of common stock issuable to Mr. Schomber pursuant to an option exercisable within 60 days of December 31, 2014, of which none of the shares was vested as of such date.
- (6)
- Consists of 12,299,150 shares of common stock held by the Trinity Entities, as reflected in footnote 8 below. Mr. Tai, a member of our board of directors, is a management member of Trinity TVL X, LLC, the general partner of each of the Trinity Entities, and has shared voting and dispositive power with regard to the shares directly held by the Trinity Entities.
- (7)
- Includes (i) 27,955,234 shares of common stock beneficially owned by the directors and named executive officers and (ii) 900,000 shares of common stock held by an executive officer who is not a named executive officer.
- (8)
- Consists of (i) 12,111,702 shares of common stock held by Trinity Ventures X, L.P., (Trinity Ventures), (ii) 118,012 shares of common stock held by Trinity X Entrepreneurs' Fund, L.P. (Trinity Entrepreneurs) and (iii) 69,436 shares of common stock held by Trinity X Side-By-Side Fund, L.P. (Trinity Side, and together with Trinity Ventures and Trinity Entrepreneurs, the Trinity Entities). The address for Trinity Ventures is 2480 Sand Hill Road, Suite 200, Menlo Park, California 94025.
- (9)
- Consists of (i) 8,786,712 shares of common stock held by Madrona Fund IV and (ii) 223,940 shares of common stock held by Madrona Fund IV-A. The address for the Madrona Venture Funds is 999 Third Avenue, 34th Floor, Seattle, Washington 98104.
- (10)
- Consists of (i) 3,222,395 shares of common stock held by Performance Direct Investments II, L.P. (PDI), (ii) 2,404,991 shares of common stock held by Southlake & Co., as nominee for State Street Bank and Trust Company, as trustee for First Plaza Group Trust for the sole benefit of Pool PMI-127 (beneficially owned by General Motors Hourly-Rate Employees Pension Plan) and (iii) 573,106 shares of common stock held by Southlake & Co., as nominee for State Street Bank and Trust Company, as trustee for First Plaza Group Trust for the sole benefit of Pool PMI-129 (beneficially owned by General Motors Retirement Program for Salaried Employees). First Plaza Group Trust (First Plaza) and PDI may be deemed affiliates of Performance Equity Associates (PEA). PDI is managed by Performance Direct Investors II GP, LLC, which is managed by Performance Equity Management LLC (PEM), a non-member manager. PEA is the majority owner of PEM. First Plaza is a New York trust containing assets of certain employee benefit plans of General Motors Company (GM), its subsidiaries and unrelated employers. General Motors Investment Management Corporation (GMIMCo), an indirect wholly-owned subsidiary of GM and minority owner of PEM, in its capacity as named fiduciary for investment purposes for the foregoing defined benefit plans (and their successors) that invest through First Plaza, considers the approval of certain private equity investments and their disposition by means of the Private Equity Investment Approval Committee of GMIMCo. Pursuant to a Subadvisory Agreement, GMIMCo has delegated non-discretionary management of certain assets of First Plaza to PEM, including the assets of First Plaza invested in MaxPoint Interactive, Inc. The address for Performance Equity Management is 2 Pickwick Plaza, Suite 310, Greenwich, Connecticut 06830.
110
A description of our capital stock and the material terms and provisions of our amended and restated certificate of incorporation and amended and restated bylaws that will be in effect upon the completion of this offering and affecting the rights of holders of our capital stock is set forth below. The forms of our amended and restated certificate of incorporation and our amended and restated bylaws to be adopted in connection with this offering will be filed as exhibits to the registration statement relating to this prospectus.
Upon the completion of this offering, our amended and restated certificate of incorporation will authorize shares of undesignated preferred stock, the rights, preferences and privileges of which may be designated from time to time by our board of directors.
Upon the completion of this offering, our authorized capital stock will consist of shares, all with a par value of $0.00005 per share, of which:
- •
- shares are designated common stock; and
- •
- shares are designated preferred stock.
As of September 30, 2014, and after giving effect to the automatic conversion of all of our outstanding convertible preferred stock into common stock in connection with this offering, there were outstanding:
- •
- 37,689,073 shares of our common stock held of record by 74 stockholders;
- •
- 6,695,951 shares of our common stock issuable upon exercise of outstanding stock options; and
- •
- 200,000 shares of our common stock issuable upon exercise of the outstanding warrants held by the lender in connection with our credit facilities.
Common Stock
Dividend Rights
Subject to preferences that may apply to shares of preferred stock outstanding at the time, the holders of outstanding shares of our common stock are entitled to receive dividends out of funds legally available if our board of directors, in its discretion, determines to issue dividends and only then at the times and in the amounts that our board of directors may determine. See "Dividend Policy" for more information.
Voting Rights
The holders of our common stock are entitled to one vote per share. Stockholders do not have the ability to cumulate votes for the election of directors. Our amended and restated certificate of incorporation and amended and restated bylaws that will be in effect upon the completion of this offering will provide for a classified board of directors consisting of three classes of approximately equal size, each serving staggered three-year terms. Only one class of directors will be elected at each annual meeting of our stockholders, with the other classes continuing for the remainder of their respective three-year terms.
No Preemptive or Similar Rights
Our common stock is not entitled to preemptive rights and is not subject to conversion, redemption or sinking fund provisions.
111
Right to Receive Liquidation Distributions
Upon our dissolution, liquidation or winding-up, the assets legally available for distribution to our stockholders are distributable ratably among the holders of our common stock, subject to prior satisfaction of all outstanding debt and liabilities and the preferential rights and payment of liquidation preferences, if any, on any outstanding shares of preferred stock.
Preferred Stock
Upon the completion of this offering, no shares of preferred stock will be outstanding, but we will be authorized, subject to limitations prescribed by Delaware law, to issue preferred stock in one or more series, to establish from time to time the number of shares to be included in each series and to fix the designation, powers, preferences and rights of the shares of each series and any of its qualifications, limitations or restrictions. Our board of directors also can increase or decrease the number of shares of any series, but not below the number of shares of that series then outstanding, without any further vote or action by our stockholders. Our board of directors may authorize the issuance of preferred stock with voting or conversion rights that could adversely affect the voting power or other rights of the holders of the common stock. The issuance of preferred stock, while providing flexibility in connection with possible acquisitions and other corporate purposes, could, among other things, have the effect of delaying, deferring or preventing a change in control of our company and may adversely affect the market price of our common stock and the voting and other rights of the holders of common stock. We have no current plan to issue any shares of preferred stock.
Options
As of September 30, 2014, we had options to purchase 6,695,951 shares of our common stock outstanding under our 2010 Equity Incentive Plan.
Subsequent to September 30, 2014, we granted options to purchase 990,850 shares of our common stock under our 2010 Equity Incentive Plan.
Warrants
As of September 30, 2014, we had outstanding immediately exercisable warrants to purchase an aggregate of 200,000 shares of our common stock at an exercise price of $5.68 per share. Subsequent to September 30, 2014, we issued warrants to purchase an aggregate of 100,000 shares of our common stock at an exercise price of $5.68 per share. The warrants expire in June 2024. Each of our outstanding warrants has a net exercise provision under which the holder may, in lieu of payment of the exercise price in cash, surrender the warrant and receive a net amount of shares based on the fair market value of our stock at the time of exercise of the warrant after deduction of the aggregate exercise price. The warrants also contain provisions for the adjustment of the exercise price and the number of shares issuable upon the exercise of the warrant in the event of certain stock dividends, stock splits, reorganizations, reclassifications and consolidations, as well as for an increase in the number of shares issuable upon the exercise of the warrants in connection with certain triggering events.
Registration Rights
Following this offering, holders of an aggregate of shares of our common stock will be entitled to certain rights with respect to registration of such shares under the Securities Act. These shares are referred to as registrable securities. The holders of these registrable securities possess registration rights pursuant to the terms of our IRA, which terms are described in additional detail below. We originally entered into the IRA in connection with our Series B financing in January 2012
112
and amended it in connection with our convertible Series C preferred stock and convertible Series D preferred stock financings.
Demand Registration Rights
Under our IRA, upon the written request of the holders of at least 20% of the registrable securities then outstanding that we file a registration statement under the Securities Act with an anticipated aggregate price to the public of at least $10 million, we will be obligated to use our best efforts to register the sale of all registrable securities as soon as practicable after our receipt of such request. The number of registrable securities that we will be obligated to register may be limited, however, by a good faith determination of the representatives of the underwriters that market factors require a limitation of the number of shares to be underwritten. These demand registration rights will become exercisable six months after the effective date of this offering. We are required to effect no more than two registration statements which are declared or ordered effective, subject to certain exceptions. We may postpone the filing of a registration statement for up to 90 days once in a 12-month period if in the good faith judgment of our board of directors such registration would be materially detrimental to us and our stockholders, and we are not required to effect the filing of a registration statement during the period beginning 90 days prior to our good faith estimate of the date of the filing of a separate registration statement initiated by us.
Piggyback Registration Rights
If we register any of our securities for public sale, we will have to use all commercially reasonable efforts to register all registrable securities that the holders of such securities request in writing be registered within 30 days of receipt of notice by us of the proposed registration. However, this right does not apply to a registration relating to any of our stock plans, or a corporate reorganization or other transaction under Rule 145 of the Securities Act. The representatives of the underwriters of any underwritten offering will have the right to limit the number of shares registered by these holders to no less than 30% of the total shares covered by the registration statement, except for in this offering, based on a good faith determination of such representatives that market factors require such limitation.
Form S-3 Registration Rights
The holders of the registrable securities can request that we register all or a portion of their shares on Form S-3 if we are eligible to file a registration statement on Form S-3, which offering is estimated to result in gross proceeds of at least $1.0 million. We are required to file no more than two registration statements on Form S-3 upon exercise of these rights per 12-month period, subject to certain exceptions. We may postpone the filing of a registration statement for up to 90 days once in a 12-month period if in the good faith judgment of our board of directors such registration would be materially detrimental to us.
Registration Expenses
We will pay all expenses up to $25,000 incurred in connection with each of the registrations described above, except for the underwriting discount and commissions. However, we will not pay for any expenses of any demand or Form S-3 registration if the request is subsequently withdrawn at the request of a majority of the holders of the registrable securities to be registered, subject to limited exceptions.
Termination of Registration Rights
The registration rights described above will survive this offering and will terminate as to any stockholder at such time as all of such stockholder's securities could be sold within a given three-
113
month period solely in reliance upon the registration requirements of the Securities Act pursuant to Rule 144, but in any event no later than the five-year anniversary of this offering.
Anti-Takeover Provisions
Delaware Law
Upon the completion of this offering, we will be governed by the provisions of Section 203 of the Delaware General Corporation Law regulating corporate takeovers. This section prevents some Delaware corporations from engaging, under some circumstances, in a business combination, which includes a merger or sale of at least 10% of the corporation's assets with any interested stockholder, meaning a stockholder who, together with affiliates and associates, owns or, within three years prior to the determination of interested stockholder status, did own 15% or more of the corporation's outstanding voting stock, unless:
- •
- the transaction is approved by the board of directors prior to the time that the interested stockholder became an
interested stockholder; or
- •
- subsequent to such time that the stockholder became an interested stockholder the business combination is approved by the board of directors and authorized at an annual or special meeting of stockholders by at least two-thirds of the outstanding voting stock which is not owned by the interested stockholder.
A Delaware corporation may "opt out" of these provisions with an express provision in its original certificate of incorporation or an express provision in its certificate of incorporation or amended and restated bylaws resulting from a stockholders' amendment approved by at least a majority of the outstanding voting shares. We have not opted out of these provisions. As a result, mergers or other takeover or change in control attempts of us may be discouraged or prevented.
Certificate of Incorporation and Bylaws Provisions
Upon the completion of this offering, our amended and restated certificate of incorporation and our amended and restated bylaws will include a number of provisions that may have the effect of deterring hostile takeovers or delaying or preventing changes in control of our management team, including the following:
- •
- Board of Directors Vacancies. Our
amended and restated certificate of incorporation and amended and restated bylaws will authorize our board of directors to fill vacant directorships, including newly-created seats. In addition, the
number of directors constituting our board of directors will be set only by resolution adopted by a majority vote of our entire board of directors. These provisions will prevent a stockholder from
increasing the size of our board of directors and gaining control of our board of directors by filling the resulting vacancies with its own nominees.
- •
- Classified Board. Our amended and
restated certificate of incorporation and amended and restated bylaws will provide that our board of directors will be classified into three classes of directors, each of whom will hold office for a
three-year term. In addition, directors may only be removed from the board of directors for cause and only by the approval of of our
then-outstanding shares of our common stock. The
existence of a classified board could delay a successful tender offeror from obtaining majority control of our board of directors, and the prospect of that delay might deter a potential offeror.
- •
- Stockholder Action; Special Meeting of Stockholders. Our amended and restated certificate of incorporation will provide that stockholders will not be able to take action by written consent, and will only be able to take action at annual or special meetings of our stockholders. Stockholders will not be permitted to cumulate their votes for the election of
114
- •
- Advance Notice Requirements for Stockholder Proposals and Director
Nominations. Our amended and restated bylaws will provide advance notice procedures for stockholders seeking to bring business before our
annual meeting of stockholders, or to nominate candidates for election as directors at any meeting of stockholders. Our amended and restated bylaws will also specify certain requirements regarding the
form and content of a stockholder's notice. These provisions may preclude our stockholders from bringing matters before our annual meeting of stockholders or from making nominations for directors at
our meetings of stockholders.
- •
- Issuance of Undesignated Preferred Stock. Our board of directors will have the authority, without further action by the holders of common stock, to issue up to shares of undesignated preferred stock with rights and preferences, including voting rights, designated from time to time by the board of directors. The existence of authorized but unissued shares of preferred stock will enable our board of directors to render more difficult or to discourage an attempt to obtain control of us by means of a merger, tender offer, proxy contest or otherwise.
directors. Our amended and restated bylaws will further provide that special meetings of our stockholders may be called only by a majority vote of our entire board of directors, the chairman of our board of directors or our chief executive officer.
Choice of Forum
Upon the completion of this offering, our amended and restated certificate of incorporation will provide that the Court of Chancery of the State of Delaware will be the exclusive forum for any derivative action or proceeding brought on our behalf; any action asserting a breach of fiduciary duty; any action asserting a claim against us arising pursuant to the Delaware General Corporation Law, our amended and restated certificate of incorporation or our amended and restated bylaws or any action asserting a claim against us that is governed by the internal affairs doctrine. The enforceability of similar choice of forum provisions in other companies' certificates of incorporation has been challenged in legal proceedings, and it is possible that a court could find these types of provisions to be inapplicable or unenforceable.
Transfer Agent and Registrar
Upon the completion of this offering, the transfer agent and registrar for our common stock will be Computershare Trust Company, N.A. The transfer agent's address is 250 Royall Street, Canton, Massachusetts, 02021, and the telephone number is (800) 662-7232.
Listing
We are applying to list our common stock on the New York Stock Exchange under the symbol "MXPT."
115
SHARES ELIGIBLE FOR FUTURE SALE
Before this offering, there has not been a public market for shares of our common stock. Future sales of substantial amounts of shares of our common stock, including shares issued upon the exercise of outstanding options, in the public market following this offering or the possibility of these sales occurring, could cause the prevailing market price for our common stock to fall or impair our ability to raise equity capital in the future.
Following this offering, we will have outstanding shares of our common stock, based on the number of shares outstanding as of September 30, 2014. This includes shares of common stock that we are selling in this offering, which shares may be resold in the public market immediately, and assumes no additional exercise of outstanding options other than as described elsewhere in this prospectus.
The remaining shares of common stock that are not sold in this offering will be "restricted securities," as that term is defined in Rule 144 under the Securities Act. These restricted securities are eligible for public sale only if they are registered under the Securities Act or if they qualify for an exemption from registration under Rule 144 or Rule 701 under the Securities Act, which are summarized below.
In addition, substantially all of our security holders have entered into market standoff agreements with us or lock-up agreements with the underwriters under which they have agreed, subject to specific exceptions, not to sell any of our capital stock until at least 181 days after the date of this prospectus, as described below. As a result of these agreements and the provisions of our investors' rights agreement described above under "Description of Capital Stock—Registration Rights," subject to the provisions of Rule 144 or Rule 701, based on an assumed offering date of , 2014, shares will be available for sale in the public market as follows:
- •
- beginning on the date of this prospectus, the shares sold in this offering will be immediately available
for sale in the public market;
- •
- beginning 181 days after the date of this prospectus, additional shares will become eligible for
sale in the public market, of which shares will be held by affiliates and subject to the volume and other restrictions of Rule 144, as described below; and
- •
- the remainder of the shares will be eligible for sale in the public market from time to time thereafter, subject in some cases to the volume and other restrictions of Rule 144, as described below.
Lock-Up Agreements
We and our executive officers, directors and stockholders holding substantially all of our outstanding capital stock have agreed with the underwriters, subject to certain exceptions, not to offer, sell, contract to sell, pledge, grant any option to purchase, transfer, make any short sale or otherwise dispose of or hedge any of our common stock or securities convertible into or exchangeable for shares of our common stock during the 180-day period following the date of this prospectus, except with the prior written consent of Goldman, Sachs & Co. In addition, substantially all other holders of our common stock and options have previously entered into market stand-off agreements with us not to sell or otherwise transfer any of their common stock or securities convertible into or exchangeable for shares of common stock for a period that extends until 181 days after the date of this prospectus.
Rule 144
In general, under Rule 144 as currently in effect, a person who has beneficially owned shares of our restricted common stock for at least six months would be entitled to sell their securities
116
provided that such person is not deemed to have been one of our affiliates at the time of, or at any time during the 90 days preceding, a sale, and we are subject to the periodic reporting requirements of the Exchange Act, for at least 90 days before the sale. In addition, under Rule 144, any person who is not an affiliate of ours and has held their shares for at least one year, including the holding period of any prior owner other than one of our affiliates, would be entitled to sell an unlimited number of shares immediately upon the completion of this offering without regard to whether current public information about us is available. Persons who have beneficially owned shares of our restricted common stock for at least six months but who are our affiliates at the time of, or any time during the 90 days preceding, a sale, would be subject to additional restrictions, by which such person would be entitled to sell within any three-month period only a number of securities that does not exceed the greater of either of the following:
- •
- 1% of the number of common shares then outstanding, which will equal approximately shares immediately
after this offering assuming no exercise of the underwriters' option to purchase additional shares, based on the number of common shares outstanding as of September 30, 2014; or
- •
- the average weekly trading volume of our common shares during the four calendar weeks preceding the filing of a notice on Form 144 with respect to the sale;
provided, in each case, that we have been subject to the Exchange Act periodic reporting requirements for at least 90 days before the sale. Such sales both by affiliates and by non-affiliates must also comply with the manner of sale, current public information and notice provisions of Rule 144.
Rule 701
Any of our service providers who purchased shares under a written compensatory plan or contract prior to this offering may be entitled to rely on the resale provisions of Rule 701. Rule 701, as currently in effect, permits resales of shares, including by affiliates, in reliance upon Rule 144 but without compliance with certain restrictions, including the holding period requirement, of Rule 144. Rule 701 further provides that non-affiliates may sell such shares in reliance on Rule 144 without having to comply with the public information, volume limitation or notice provisions of Rule 144. All holders of Rule 701 shares are required to wait until 90 days after the date of this prospectus before selling such shares if such resale is pursuant to Rule 701. All Rule 701 shares are, however, subject to lock-up agreements and will only become eligible for sale upon the expiration of these lock-up agreements.
Registration Rights
Upon completion of this offering, the holders of shares of our common stock will be entitled to rights with respect to the registration of the sale of such shares of common stock under the Securities Act. See "Description of Capital Stock—Registration Rights." All such shares are covered by lock-up agreements. Following the expiration of the lock-up period, registration of these shares under the Securities Act would result in the shares becoming freely tradable without restriction under the Securities Act immediately upon the effectiveness of the registration.
Form S-8 Registration Statements
We intend to file a registration statement on Form S-8 under the Securities Act covering all of the shares of common stock subject to options outstanding, as well as reserved for future issuance, under our stock plans. We expect to file this registration statement as soon as practicable after this offering. However, none of the shares registered on Form S-8 will be eligible for resale until the expiration of the lock-up agreements to which they are subject.
117
MATERIAL U.S. FEDERAL INCOME TAX CONSIDERATIONS
FOR NON-U.S. HOLDERS OF COMMON STOCK
The following is a discussion of the material U.S. federal income tax considerations with respect to the ownership and disposition of shares of common stock applicable to non-U.S. holders who acquire such shares in this offering and hold such shares as a capital asset within the meaning of Section 1221 of the Internal Revenue Code of 1986, as amended (the "Code") (generally, property held for investment). For purposes of this discussion, a "non-U.S. holder" means a beneficial owner of our common stock (other than an entity or arrangement that is treated as a partnership for U.S. federal income tax purposes) that is not, for U.S. federal income tax purposes, any of the following:
- •
- a citizen or resident of the United States;
- •
- a corporation (or other entity treated as a corporation for U.S. federal income tax purposes) created or organized in the
United States or under the laws of the United States, any state thereof or the District of Columbia, or any other corporation treated as such;
- •
- an estate, the income of which is includable in gross income for U.S. federal income tax purposes regardless of its
source; or
- •
- a trust if (i) a court within the United States is able to exercise primary supervision over the administration of the trust and one or more "U.S. persons," as defined under the Code, have the authority to control all substantial decisions of the trust or (ii) such trust has made a valid election to be treated as a U.S. person for U.S. federal income tax purposes.
This discussion is based on current provisions of the Code, Treasury regulations promulgated thereunder, judicial opinions, published positions of the Internal Revenue Service and other applicable authorities, all of which are subject to change (possibly with retroactive effect). This discussion does not address all aspects of U.S. federal income taxation that may be important to a particular non-U.S. holder in light of that non-U.S. holder's individual circumstances, nor does it address any aspects of the unearned income Medicare contribution tax pursuant to the Health Care and Education Reconciliation Act of 2010, any U.S. federal estate and gift taxes, any U.S. alternative minimum taxes or any state, local or non-U.S. taxes. This discussion may not apply, in whole or in part, to particular non-U.S. holders in light of their individual circumstances or to holders subject to special treatment under the U.S. federal income tax laws (such as insurance companies, tax-exempt organizations, financial institutions, brokers or dealers in securities, "controlled foreign corporations," "passive foreign investment companies," non-U.S. holders that hold our common stock as part of a straddle, hedge, conversion transaction or other integrated investment and certain U.S. expatriates).
If a partnership (or other entity or arrangement treated as a partnership for U.S. federal income tax purposes) holds our common stock, the tax treatment of a partner therein will generally depend on the status of the partner and the activities of the partnership. Partners of a partnership holding our common stock should consult their tax advisor as to the particular U.S. federal income tax consequences applicable to them.
THIS SUMMARY IS FOR GENERAL INFORMATION ONLY AND IS NOT INTENDED TO CONSTITUTE A COMPLETE DESCRIPTION OF ALL TAX CONSEQUENCES FOR NON-U.S. HOLDERS RELATING TO THE OWNERSHIP AND DISPOSITION OF OUR COMMON STOCK. PROSPECTIVE HOLDERS OF OUR COMMON STOCK SHOULD CONSULT WITH THEIR TAX ADVISORS REGARDING THE TAX CONSEQUENCES TO THEM (INCLUDING THE APPLICATION AND EFFECT OF ANY STATE, LOCAL, FOREIGN INCOME AND OTHER TAX LAWS) OF THE OWNERSHIP AND DISPOSITION OF OUR COMMON STOCK.
118
Dividends
In general, the gross amount of any distribution we make to a non-U.S. holder with respect to its shares of common stock will be subject to U.S. withholding tax at a rate of 30% to the extent the distribution constitutes a dividend for U.S. federal income tax purposes, unless the non-U.S. holder is eligible for a reduced rate of withholding tax under an applicable tax treaty and the non-U.S. holder provides proper certification of its eligibility for such reduced rate. A distribution will constitute a dividend for U.S. federal income tax purposes to the extent of our current or accumulated earnings and profits as determined for U.S. federal income tax purposes. To the extent any distribution does not constitute a dividend, it will be treated first as reducing the adjusted basis in the non-U.S. holder's shares of common stock and then, to the extent it exceeds the adjusted basis in the non-U.S. holder's shares of common stock, as gain from the sale or exchange of such stock. Any such gain will be subject to the treatment described below under "—Gain on Sale or Other Disposition of Common Stock."
Dividends we pay to a non-U.S. holder that are effectively connected with its conduct of a trade or business within the United States (and, if required by an applicable tax treaty, are attributable to a U.S. permanent establishment of such non-U.S. holder) will not be subject to U.S. withholding tax, as described above, if the non-U.S. holder complies with applicable certification and disclosure requirements. Instead, such dividends generally will be subject to U.S. federal income tax on a net income basis, at regular U.S. federal income tax rates. Dividends received by a foreign corporation that are effectively connected with its conduct of trade or business within the United States may be subject to an additional branch profits tax at a rate of 30% (or such lower rate as may be specified by an applicable tax treaty).
Gain on Sale or Other Disposition of Common Stock
In general, a non-U.S. holder will not be subject to U.S. federal income tax on any gain realized upon the sale or other disposition of the non-U.S. holder's shares of common stock unless:
- •
- the gain is effectively connected with a trade or business carried on by the non-U.S. holder within the United States
(and, if required by an applicable tax treaty, is attributable to a U.S. permanent establishment of such non-U.S. holder);
- •
- the non-U.S. holder is an individual and is present in the United States for 183 days or more in the taxable year
of disposition and certain other conditions are met; or
- •
- we are or have been a U.S. real property holding corporation for U.S. federal income tax purposes at any time within the shorter of the five-year period preceding such disposition or such non-U.S. holder's holding period of our common stock, and the non-U.S. holder has held, at any time during said period, more than 5% of the class of our stock being sold.
Gain that is effectively connected with the conduct of a trade or business in the United States (or so treated) generally will be subject to U.S. federal income tax on a net income tax basis, at regular U.S. federal income tax rates. If the non-U.S. holder is a foreign corporation, the branch profits tax described above also may apply to such effectively connected gain. An individual non-U.S. holder who is subject to U.S. federal income tax because the non-U.S. holder was present in the United States for 183 days or more during the year of sale or other disposition of our common stock will be subject to a flat 30% tax on the gain derived from such sale or other disposition, which may be offset by U.S. source capital losses. We believe that we are not and we do not anticipate becoming a U.S. real property holding corporation for U.S. federal income tax purposes.
119
Withholdable Payments to Foreign Financial Entities and Other Foreign Entities
The Foreign Account Tax Compliance Act, or FATCA, will impose a U.S. federal withholding tax of 30% on certain payments to foreign financial institutions, investment funds and certain other non-U.S. persons that fail to comply with certain information reporting and certification requirements pertaining to their direct and indirect U.S. securityholders and/or U.S. accountholders. Such payments would include our dividends and the gross proceeds from the sale or other disposition of our common stock. Under applicable Treasury Regulations, this withholding will apply to payments of dividends on our common stock and to payments of gross proceeds from a sale or other disposition of our common stock made on or after January 1, 2017. Prospective investors are encouraged to consult with their own tax advisors regarding the possible implications of this legislation on their investment in our common stock.
Backup Withholding, Information Reporting and Other Reporting Requirements
We must report annually to the Internal Revenue Service and to each non-U.S. holder the amount of dividends paid to, and the tax withheld with respect to, each non-U.S. holder. These reporting requirements apply regardless of whether withholding was reduced or eliminated by an applicable tax treaty. Copies of this information reporting may also be made available under the provisions of a specific tax treaty or agreement with the tax authorities in the country in which the non-U.S. holder resides or is established.
A non-U.S. holder will generally be subject to backup withholding for dividends on our common stock paid to such holder unless such holder certifies under penalties of perjury that, among other things, it is a non-U.S. holder (and the payor does not have actual knowledge or reason to know that such holder is a U.S. person) or otherwise establishes an exemption.
Information reporting and backup withholding generally are not required with respect to the amount of any proceeds from the sale or other disposition of our common stock by a non-U.S. holder outside the United States through a foreign office of a foreign broker that does not have certain specified connections to the United States. However, if a non-U.S. holder sells or otherwise disposes of its shares of common stock through a U.S. broker or the U.S. offices of a foreign broker, the broker will generally be required to report the amount of proceeds paid to the non-U.S. holder to the Internal Revenue Service and also backup withhold on that amount unless such non-U.S. holder provides appropriate certification to the broker of its status as a non-U.S. person (and the payor does not have actual knowledge or reason to know that such holder is a U.S. person) or otherwise establishes an exemption. Information reporting will also apply if a non-U.S. holder sells its shares of common stock through a foreign broker deriving more than a specified percentage of its income from U.S. sources or having certain other connections to the United States, unless such broker has documentary evidence in its records that such non-U.S. holder is a non-U.S. person (and the payor does not have actual knowledge or reason to know that such holder is a U.S. person) and certain other conditions are met, or such non-U.S. holder otherwise establishes an exemption.
Backup withholding is not an additional income tax. Any amounts withheld under the backup withholding rules from a payment to a non-U.S. holder generally can be credited against the non-U.S. holder's U.S. federal income tax liability, if any, or refunded, provided that the required information is furnished to the Internal Revenue Service in a timely manner. Non-U.S. holders should consult their tax advisors regarding the application of the information reporting and backup withholding rules to them.
120
The company and the underwriters named below have entered into an underwriting agreement with respect to the shares being offered. Subject to certain conditions, each underwriter has severally agreed to purchase the number of shares indicated in the following table. Goldman, Sachs & Co. and Deutsche Bank Securities Inc. are the representatives of the underwriters.
Underwriters
|
Number of Shares | |||
|---|---|---|---|---|
Goldman, Sachs & Co. |
||||
Deutsche Bank Securities Inc. |
||||
Pacific Crest Securities LLC |
||||
Needham & Company, LLC |
||||
William Blair & Company, L.L.C. |
||||
| | | | | |
Total |
||||
| | | | | |
| | | | | |
The underwriters are committed to take and pay for all of the shares being offered, if any are taken, other than the shares covered by the option described below unless and until this option is exercised.
The underwriters have an option to buy up to an additional shares from the company to cover sales by the underwriters of a greater number of shares than the total number set forth in the table above. They may exercise that option for 30 days. If any shares are purchased pursuant to this option, the underwriters will severally purchase shares in approximately the same proportion as set forth in the table above.
The following table shows the per share and total underwriting discount and commissions to be paid to the underwriters by the company. Such amounts are shown assuming both no exercise and full exercise of the underwriters' option to purchase additional shares.
Paid by the Company
|
No Exercise | Full Exercise | |||||
|---|---|---|---|---|---|---|---|
Per Share |
$ | $ | |||||
Total |
$ | $ | |||||
Shares sold by the underwriters to the public will initially be offered at the initial public offering price set forth on the cover of this prospectus. Any shares sold by the underwriters to securities dealers may be sold at a discount of up to $ per share from the initial public offering price. After the initial offering of the shares, the representatives may change the offering price and the other selling terms. The offering of the shares by the underwriters is subject to receipt and acceptance and subject to the underwriters' right to reject any order in whole or in part.
The company and its officers, directors and holders of substantially all of the company's common stock have agreed with the underwriters, subject to certain exceptions, not to dispose of or hedge any of their common stock or securities convertible into or exchangeable for shares of common stock during the period from the date of this prospectus continuing through the date 180 days after the date of this prospectus, except with the prior written consent of Goldman, Sachs & Co. This agreement does not apply to any existing employee benefit plans. See "Shares Eligible for Future Sale" for a discussion of certain transfer restrictions.
Prior to the offering, there has been no public market for the shares. The initial public offering price will be negotiated among the company and the representatives. Among the factors to be considered in determining the initial public offering price of the shares, in addition to prevailing market conditions, will be the company's historical performance, estimates of the business potential and earnings prospects of the company, an assessment of the company's management and the
121
consideration of the above factors in relation to market valuation of companies in related businesses.
We are applying to list our common stock on the New York Stock Exchange under the symbol "MXPT."
In connection with the offering, the underwriters may purchase and sell shares of common stock in the open market. These transactions may include short sales, stabilizing transactions and purchases to cover positions created by short sales. Short sales involve the sale by the underwriters of a greater number of shares than they are required to purchase in the offering, and a short position represents the amount of such sales that have not been covered by subsequent purchases. A "covered short position" is a short position that is not greater than the amount of additional shares for which the underwriters' option described above may be exercised. The underwriters may cover any covered short position by either exercising their option to purchase additional shares or purchasing shares in the open market. In determining the source of shares to cover the covered short position, the underwriters will consider, among other things, the price of shares available for purchase in the open market as compared to the price at which they may purchase additional shares pursuant to the option described above. "Naked" short sales are any short sales that create a short position greater than the amount of additional shares for which the option described above may be exercised. The underwriters must cover any such naked short position by purchasing shares in the open market. A naked short position is more likely to be created if the underwriters are concerned that there may be downward pressure on the price of the common stock in the open market after pricing that could adversely affect investors who purchase in the offering. Stabilizing transactions consist of various bids for or purchases of common stock made by the underwriters in the open market prior to the completion of the offering.
The underwriters may also impose a penalty bid. This occurs when a particular underwriter repays to the underwriters a portion of the underwriting discount received by it because the representatives have repurchased shares sold by or for the account of such underwriter in stabilizing or short covering transactions.
Purchases to cover a short position and stabilizing transactions, as well as other purchases by the underwriters for their own accounts, may have the effect of preventing or retarding a decline in the market price of the company's stock, and together with the imposition of the penalty bid, may stabilize, maintain or otherwise affect the market price of the common stock. As a result, the price of the common stock may be higher than the price that otherwise might exist in the open market. The underwriters are not required to engage in these activities and may end any of these activities at any time. These transactions may be effected on , in the over-the-counter market or otherwise.
The underwriters do not expect sales to discretionary accounts to exceed five percent of the total number of shares offered.
The company estimates that its share of the total expenses of the offering, excluding underwriting discount and commissions, will be approximately $ , all of which will be paid by the company.
The company has agreed to indemnify the several underwriters against certain liabilities, including liabilities under the Securities Act of 1933.
The underwriters and their respective affiliates are full service financial institutions engaged in various activities, which may include sales and trading, commercial and investment banking, advisory, investment management, investment research, principal investment, hedging, market making, brokerage and other financial and non-financial activities and services. Certain of the underwriters and their respective affiliates have provided, and may in the future provide, a variety of
122
these services to the issuer and to persons and entities with relationships with the issuer, for which they received or will receive customary fees and expenses.
In the ordinary course of their various business activities, the underwriters and their respective affiliates, officers, directors and employees may purchase, sell or hold a broad array of investments and actively trade securities, derivatives, loans, commodities, currencies, credit default swaps and other financial instruments for their own account and for the accounts of their customers, and such investment and trading activities may involve or relate to assets, securities and/or instruments of the issuer (directly, as collateral securing other obligations or otherwise) and/or persons and entities with relationships with the issuer. The underwriters and their respective affiliates may also communicate independent investment recommendations, market color or trading ideas and/or publish or express independent research views in respect of such assets, securities or instruments and may at any time hold, or recommend to clients that they should acquire, long and/or short positions in such assets, securities and instruments.
Notice to Non-U.S. Investors
In relation to each Member State of the European Economic Area which has implemented the Prospectus Directive (each, a Relevant Member State), each underwriter has represented and agreed that with effect from and including the date on which the Prospectus Directive is implemented in that Relevant Member State (the Relevant Implementation Date) it has not made and will not make an offer of shares to the public in that Relevant Member State prior to the publication of a prospectus in relation to the shares which has been approved by the competent authority in that Relevant Member State or, where appropriate, approved in another Relevant Member State and notified to the competent authority in that Relevant Member State, all in accordance with the Prospectus Directive, except that it may, with effect from and including the Relevant Implementation Date, make an offer of shares to the public in that Relevant Member State at any time:
- (a)
- to
legal entities which are authorized or regulated to operate in the financial markets or, if not so authorized or regulated, the corporate purpose of
which is solely to invest in securities;
- (b)
- to
any legal entity which has two or more of (1) an average of at least 250 employees during the last financial year; (2) a total balance
sheet of more than €43,000,000 and (3) an annual net turnover of more than €50,000,000, as shown in its last annual or consolidated accounts;
- (c)
- to
fewer than 100 natural or legal persons (other than qualified investors as defined in the Prospectus Directive) subject to obtaining the prior consent of
the representatives for any such offer; or
- (d)
- in any other circumstances which do not require the publication by the Issuer of a prospectus pursuant to Article 3 of the Prospectus Directive.
For the purposes of this provision, the expression an "offer of shares to the public" in relation to any shares in any Relevant Member State means the communication in any form and by any means of sufficient information on the terms of the offer and the shares to be offered so as to enable an investor to decide to purchase or subscribe the shares, as the same may be varied in that Relevant Member State by any measure implementing the Prospectus Directive in that Relevant Member State and the expression Prospectus Directive means Directive 2003/71/EC and includes any relevant implementing measure in each Relevant Member State.
123
Each underwriter has represented and agreed that:
- (a)
- it
has only communicated or caused to be communicated and will only communicate or cause to be communicated an invitation or inducement to engage in
investment activity (within the meaning of Section 21 of the FSMA) received by it in connection with the issue or sale of the shares in circumstances in which Section 21(1) of the FSMA
does not apply to the Issuer; and
- (b)
- it has complied and will comply with all applicable provisions of the FSMA with respect to anything done by it in relation to the shares in, from or otherwise involving the United Kingdom.
The shares may not be offered or sold by means of any document other than (i) in circumstances which do not constitute an offer to the public within the meaning of the Companies Ordinance (Cap.32, Laws of Hong Kong), or (ii) to "professional investors" within the meaning of the Securities and Futures Ordinance (Cap.571, Laws of Hong Kong) and any rules made thereunder, or (iii) in other circumstances which do not result in the document being a "prospectus" within the meaning of the Companies Ordinance (Cap.32, Laws of Hong Kong), and no advertisement, invitation or document relating to the shares may be issued or may be in the possession of any person for the purpose of issue (in each case whether in Hong Kong or elsewhere), which is directed at, or the contents of which are likely to be accessed or read by, the public in Hong Kong (except if permitted to do so under the laws of Hong Kong) other than with respect to shares which are or are intended to be disposed of only to persons outside Hong Kong or only to "professional investors" within the meaning of the Securities and Futures Ordinance (Cap. 571, Laws of Hong Kong) and any rules made thereunder.
This prospectus has not been registered as a prospectus with the Monetary Authority of Singapore. Accordingly, this prospectus and any other document or material in connection with the offer or sale, or invitation for subscription or purchase, of the shares may not be circulated or distributed, nor may the shares be offered or sold, or be made the subject of an invitation for subscription or purchase, whether directly or indirectly, to persons in Singapore other than (i) to an institutional investor under Section 274 of the Securities and Futures Act, Chapter 289 of Singapore, or the SFA, (ii) to a relevant person, or any person pursuant to Section 275(1A), and in accordance with the conditions, specified in Section 275 of the SFA or (iii) otherwise pursuant to, and in accordance with the conditions of, any other applicable provision of the SFA.
Where the shares are subscribed or purchased under Section 275 by a relevant person which is: (a) a corporation (which is not an accredited investor) the sole business of which is to hold investments and the entire share capital of which is owned by one or more individuals, each of whom is an accredited investor; or (b) a trust (where the trustee is not an accredited investor) whose sole purpose is to hold investments and each beneficiary is an accredited investor, shares, debentures and units of shares and debentures of that corporation or the beneficiaries' rights and interest in that trust shall not be transferable for 6 months after that corporation or that trust has acquired the shares under Section 275 except: (1) to an institutional investor under Section 274 of the SFA or to a relevant person, or any person pursuant to Section 275(1A), and in accordance with the conditions, specified in Section 275 of the SFA; (2) where no consideration is given for the transfer; or (3) by operation of law.
The securities have not been and will not be registered under the Financial Instruments and Exchange Law of Japan (the Financial Instruments and Exchange Law) and each underwriter has agreed that it will not offer or sell any securities, directly or indirectly, in Japan or to, or for the benefit of, any resident of Japan (which term as used herein means any person resident in Japan, including any corporation or other entity organized under the laws of Japan), or to others for re-offering or resale, directly or indirectly, in Japan or to a resident of Japan, except pursuant to an exemption from the registration requirements of, and otherwise in compliance with, the Financial Instruments and Exchange Law and any other applicable laws, regulations and ministerial guidelines of Japan.
124
The validity of the shares of common stock being offered will be passed upon for us by Gunderson Dettmer Stough Villeneuve Franklin & Hachigian, LLP, Redwood City, California. Certain legal matters in connection with this offering will be passed upon for the underwriters by Wilmer Cutler Pickering Hale and Dorr LLP.
The financial statements as of December 31, 2012 and 2013, and for each of the three years in the period ended December 31, 2013, included in this prospectus have been audited by Deloitte & Touche LLP, an independent registered public accounting firm, as stated in their report appearing herein. Such financial statements have been so included in reliance upon the report of such firm given upon their authority as experts in accounting and auditing.
WHERE YOU CAN FIND MORE INFORMATION
We have filed with the Securities and Exchange Commission, or SEC, a registration statement on Form S-1 under the Securities Act with respect to the shares of common stock offered hereby. This prospectus contains all information about us and our common stock that may be material to an investor in this offering. The registration statement includes exhibits to which you should refer for additional information about us.
You may inspect a copy of the registration statement and the exhibits and schedules to the registration statement without charge at the offices of the SEC at 100 F Street, N.E., Washington, D.C. 20549. You may obtain copies of all or any part of the registration statement from the public reference section of the SEC, 100 F Street, N.E., Washington, D.C. 20549 upon the payment of the prescribed fees. You may obtain information on the operation of the public reference room by calling the SEC at 1-800-SEC-0330. The SEC maintains a website at www.sec.gov that contains reports, proxy and information statements and other information regarding registrants like us that file electronically with the SEC. You can also inspect our registration statement on this website.
Upon the completion of this offering, we will be subject to the information reporting requirements of the Exchange Act and we will file reports, proxy statements and other information with the SEC. These reports, proxy statements and other information will be available for inspection and copying at the public reference room and website of the SEC referred to above. We also maintain a website at www.maxpoint.com, at which you may access these materials free of charge as soon as reasonably practicable after they are electronically filed with, or furnished to, the SEC. Information contained on our website is not incorporated by reference into this prospectus, and you should not consider information contained on our website to be part of this prospectus or in deciding whether to purchase shares of our common stock.
125
INDEX TO CONSOLIDATED FINANCIAL STATEMENTS
F-1
Report of Independent Registered Public Accounting Firm
To
the Board of Directors and Stockholders of
MaxPoint Interactive, Inc.
Morrisville, North Carolina
We have audited the accompanying consolidated balance sheets of MaxPoint Interactive, Inc. and its subsidiary (the "Company") as of December 31, 2012 and 2013, and the related consolidated statements of operations, changes in stockholders' deficit, and cash flows for each of the three years in the period ended December 31, 2013. These financial statements are the responsibility of the Company's management. Our responsibility is to express an opinion on these financial statements based on our audits.
We conducted our audits in accordance with the standards of the Public Company Accounting Oversight Board (United States). Those standards require that we plan and perform the audit to obtain reasonable assurance about whether the financial statements are free of material misstatement. The Company is not required to have, nor were we engaged to perform, an audit of its internal control over financial reporting. Our audits included consideration of internal control over financial reporting as a basis for designing audit procedures that are appropriate in the circumstances, but not for the purpose of expressing an opinion on the effectiveness of the Company's internal control over financial reporting. Accordingly, we express no such opinion. An audit also includes examining, on a test basis, evidence supporting the amounts and disclosures in the financial statements, assessing the accounting principles used and significant estimates made by management, as well as evaluating the overall financial statement presentation. We believe that our audits provide a reasonable basis for our opinion.
In our opinion, such consolidated financial statements present fairly, in all material respects, the financial position of MaxPoint Interactive, Inc. and its subsidiary as of December 31, 2012 and 2013, and the results of their operations and their cash flows for each of the three years in the period ended December 31, 2013, in conformity with accounting principles generally accepted in the United States of America.
/s/ Deloitte & Touche LLP
Raleigh,
North Carolina
July 2, 2014
F-2
MaxPoint Interactive, Inc. and Subsidiary
Consolidated Balance Sheets
As of December 31, 2012 and 2013
(in thousands, except share data)
| |
As of December 31, | ||||||
|---|---|---|---|---|---|---|---|
| |
2012 | 2013 | |||||
Assets |
|||||||
Current assets: |
|||||||
Cash and cash equivalents |
$ | 9,831 | $ | 8,805 | |||
Accounts receivable, net |
15,028 | 24,233 | |||||
Prepaid expenses and other current assets |
535 | 694 | |||||
| | | | | | | | |
Total current assets |
25,394 | 33,732 | |||||
| | | | | | | | |
Property, equipment and software, net |
3,588 | 5,418 | |||||
Restricted cash |
2,000 | 3,500 | |||||
Other long-term assets |
100 | 100 | |||||
| | | | | | | | |
Total assets |
$ | 31,082 | $ | 42,750 | |||
| | | | | | | | |
| | | | | | | | |
Liabilities, Convertible preferred stock and Stockholders' deficit |
|||||||
Current liabilities: |
|||||||
Accounts payable |
$ | 6,343 | $ | 9,292 | |||
Accrued expenses and other current liabilities |
2,620 | 3,829 | |||||
| | | | | | | | |
Total current liabilities |
8,963 | 13,121 | |||||
| | | | | | | | |
Long-term debt |
10,718 | 17,761 | |||||
Other long-term liabilities |
8 | 4 | |||||
| | | | | | | | |
Total liabilities |
19,689 | 30,886 | |||||
| | | | | | | | |
Commitments and contingencies (See Note 11) |
|||||||
Convertible preferred stock: |
|||||||
Convertible Series A preferred stock $0.00005 par value, 4,973,014 shares authorized, 4,767,492 issued and outstanding as of December 31, 2012 and December 31, 2013; liquidation preference of $1,387 as of December 31, 2013 |
1,387 | 1,387 | |||||
Convertible Series B preferred stock $0.00005 par value, 7,298,736 shares authorized, 7,298,736 issued and outstanding as of December 31, 2012 and December 31, 2013; liquidation preference of $3,089 as of December 31, 2013 |
3,089 | 3,089 | |||||
Convertible Series C preferred stock $0.00005 par value, 10,813,002 shares authorized, 10,813,002 issued and outstanding as of December 31, 2012 and December 31, 2013; liquidation preference of $8,000 as of December 31, 2013 |
8,000 | 8,000 | |||||
Convertible Series D preferred stock $0.00005 par value, 6,818,500 shares authorized, 6,818,420 issued and outstanding as of December 31, 2012 and December 31, 2013; liquidation preference of $13,000 as of December 31, 2013 |
13,000 | 13,000 | |||||
| | | | | | | | |
Total convertible preferred stock |
25,476 | 25,476 | |||||
| | | | | | | | |
Stockholders' deficit: |
|||||||
Common stock $0.00005 par value, 44,000,000 shares authorized, 7,326,810 and 7,521,310 issued and outstanding as of December 31, 2012 and December 31, 2013 |
— | — | |||||
Additional paid-in capital |
1,588 | 2,246 | |||||
Accumulated deficit |
(15,671 | ) | (15,858 | ) | |||
| | | | | | | | |
Total stockholders' deficit |
(14,083 | ) | (13,612 | ) | |||
| | | | | | | | |
Total liabilities, convertible preferred stock and stockholders' deficit |
$ | 31,082 | $ | 42,750 | |||
| | | | | | | | |
| | | | | | | | |
The accompanying notes are an integral part of these financial statements.
F-3
MaxPoint Interactive, Inc. and Subsidiary
Consolidated Statements of Operations
Years ended December 31, 2011, 2012 and 2013
(in thousands, except share and
per share data)
| |
Year Ended December 31, | |||||||||
|---|---|---|---|---|---|---|---|---|---|---|
| |
2011 | 2012 | 2013 | |||||||
Revenue, net (See Note 14) |
$ | 14,679 | $ | 35,072 | $ | 66,068 | ||||
Traffic acquisition costs |
7,762 | 16,485 | 27,712 | |||||||
Other cost of revenue |
1,295 | 2,982 | 3,904 | |||||||
| | | | | | | | | | | |
Gross profit |
5,622 | 15,605 | 34,452 | |||||||
Operating expenses: |
||||||||||
Sales and marketing |
6,325 | 12,938 | 20,475 | |||||||
Research and development |
2,555 | 5,376 | 8,666 | |||||||
General and administrative |
2,117 | 4,043 | 5,217 | |||||||
| | | | | | | | | | | |
Total operating expenses |
10,997 | 22,357 | 34,358 | |||||||
| | | | | | | | | | | |
(Loss) income from operations |
(5,375 | ) | (6,752 | ) | 94 | |||||
Other expense (income): |
||||||||||
Interest expense |
88 | 27 | 283 | |||||||
Other expense (income) |
31 | (19 | ) | (2 | ) | |||||
| | | | | | | | | | | |
Total other expense (income) |
119 | 8 | 281 | |||||||
Loss before income taxes |
(5,494 | ) | (6,760 | ) | (187 | ) | ||||
| | | | | | | | | | | |
Provision for income taxes |
— | — | — | |||||||
| | | | | | | | | | | |
Net loss |
$ | (5,494 | ) | $ | (6,760 | ) | $ | (187 | ) | |
| | | | | | | | | | | |
| | | | | | | | | | | |
Net loss per share of common stock: |
||||||||||
Basic and diluted |
$ | (1.11 | ) | $ | (1.07 | ) | $ | (0.03 | ) | |
| | | | | | | | | | | |
| | | | | | | | | | | |
Pro forma (unaudited): |
||||||||||
Basic and diluted |
$ | (0.01 | ) | |||||||
| | | | | | | | | | | |
| | | | | | | | | | | |
Weighted-average shares of common stock outstanding: |
||||||||||
Basic and diluted |
4,965,155 | 6,340,942 | 7,417,068 | |||||||
| | | | | | | | | | | |
| | | | | | | | | | | |
Pro forma (unaudited): |
||||||||||
Basic and diluted |
37,114,718 | |||||||||
| | | | | | | | | | | |
| | | | | | | | | | | |
The accompanying notes are an integral part of these financial statements.
F-4
MaxPoint Interactive, Inc. and Subsidiary
Consolidated Statements of Changes in Stockholders' Deficit
Years ended December 31, 2011, 2012 and 2013
(in
thousands, except share data)
| |
Common Stock | |
|
|
||||||||||||
|---|---|---|---|---|---|---|---|---|---|---|---|---|---|---|---|---|
| |
Additional Paid-In Capital |
Accumulated Deficit |
Total Stockholders' Deficit |
|||||||||||||
| |
Shares | Amount | ||||||||||||||
Balance—January 1, 2011 |
7,287,872 | $ | — | $ | 384 | $ | (3,417 | ) | $ | (3,033 | ) | |||||
Exercise of stock options |
15,366 | — | 3 | — | 3 | |||||||||||
Stock-based compensation expense |
— | — | 284 | — | 284 | |||||||||||
Vesting of restricted stock subject to repurchase |
— | — | 55 | — | 55 | |||||||||||
Repurchase of unvested common stock |
(88,340 | ) | — | — | — | — | ||||||||||
Adjustment of convertible preferred stock to liquidation value |
— | — | 287 | — | 287 | |||||||||||
Accretion of issuance costs on convertible preferred stock |
— | — | (72 | ) | — | (72 | ) | |||||||||
Net loss |
— | — | — | (5,494 | ) | (5,494 | ) | |||||||||
| | | | | | | | | | | | | | | | | |
Balance—December 31, 2011 |
7,214,898 | — | 941 | (8,911 | ) | (7,970 | ) | |||||||||
Exercise of stock options |
111,912 | — | 31 | — | 31 | |||||||||||
Stock-based compensation expense |
— | — | 553 | — | 553 | |||||||||||
Vesting of restricted stock subject to repurchase |
— | — | 57 | — | 57 | |||||||||||
Adjustment of convertible preferred stock to liquidation value |
— | — | 6 | — | 6 | |||||||||||
Net loss |
— | — | — | (6,760 | ) | (6,760 | ) | |||||||||
| | | | | | | | | | | | | | | | | |
Balance—December 31, 2012 |
7,326,810 | — | 1,588 | (15,671 | ) | (14,083 | ) | |||||||||
Exercise of stock options |
194,500 | — | 69 | — | 69 | |||||||||||
Stock-based compensation expense |
— | — | 579 | — | 579 | |||||||||||
Vesting of restricted stock subject to repurchase |
— | — | 10 | — | 10 | |||||||||||
Net loss |
— | — | — | (187 | ) | (187 | ) | |||||||||
| | | | | | | | | | | | | | | | | |
Balance—December 31, 2013 |
7,521,310 | $ | — | $ | 2,246 | $ | (15,858 | ) | $ | (13,612 | ) | |||||
| | | | | | | | | | | | | | | | | |
| | | | | | | | | | | | | | | | | |
The accompanying notes are an integral part of these financial statements.
F-5
MaxPoint Interactive, Inc. and Subsidiary
Consolidated Statements of Cash Flows
Years ended December 31, 2011, 2012 and 2013
(in thousands)
| |
Year Ended December 31, | |||||||||
|---|---|---|---|---|---|---|---|---|---|---|
| |
2011 | 2012 | 2013 | |||||||
Cash flows from operating activities: |
||||||||||
Net loss |
$ | (5,494 | ) | $ | (6,760 | ) | $ | (187 | ) | |
Adjustments to reconcile net loss to net cash used in operating activities: |
||||||||||
Depreciation and amortization |
443 | 1,063 | 1,956 | |||||||
Stock-based compensation |
284 | 553 | 579 | |||||||
Change in fair value of warrant |
31 | 1 | — | |||||||
Bad debt expense |
33 | 131 | 659 | |||||||
Amortization of deferred financing costs |
8 | 6 | 15 | |||||||
Changes in operating assets and liabilities: |
||||||||||
Accounts receivable |
(3,063 | ) | (10,556 | ) | (9,864 | ) | ||||
Prepaid expenses and other current assets |
(60 | ) | (242 | ) | (59 | ) | ||||
Security deposits |
(27 | ) | (47 | ) | (15 | ) | ||||
Accounts payable |
1,762 | 3,605 | 2,949 | |||||||
Accrued expenses and other current liabilities |
1,325 | 1,353 | 1,303 | |||||||
Other long-term liabilities |
69 | (9 | ) | (4 | ) | |||||
| | | | | | | | | | | |
Net cash used in operating activities |
(4,689 | ) | (10,902 | ) | (2,668 | ) | ||||
| | | | | | | | | | | |
Cash flows from investing activities: |
||||||||||
Purchases of property, equipment and software |
(1,148 | ) | (1,262 | ) | (1,858 | ) | ||||
Capitalized internal-use software costs |
(666 | ) | (1,144 | ) | (2,012 | ) | ||||
Changes to restricted cash |
(1,100 | ) | (1,000 | ) | (1,600 | ) | ||||
| | | | | | | | | | | |
Net cash used in investing activities |
(2,914 | ) | (3,406 | ) | (5,470 | ) | ||||
| | | | | | | | | | | |
Cash flows from financing activities: |
||||||||||
Proceeds from debt |
10,103 | 28,848 | 52,793 | |||||||
Repayment of debt |
(7,403 | ) | (21,830 | ) | (45,750 | ) | ||||
Proceeds from stock option exercises |
3 | 31 | 69 | |||||||
Proceeds from issuance of convertible preferred stock |
13,000 | — | — | |||||||
Issuance costs related to convertible preferred stock |
(72 | ) | — | — | ||||||
Proceeds from exercises of convertible preferred stock warrants |
24 | — | — | |||||||
Issuance costs related to debt |
(10 | ) | (15 | ) | — | |||||
| | | | | | | | | | | |
Net cash provided by financing activities |
15,645 | 7,034 | 7,112 | |||||||
| | | | | | | | | | | |
Net increase (decrease) in cash and cash equivalents |
8,042 | (7,274 | ) | (1,026 | ) | |||||
Cash and cash equivalents at beginning of year |
9,063 | 17,105 | 9,831 | |||||||
| | | | | | | | | | | |
Cash and cash equivalents at end of year |
$ | 17,105 | $ | 9,831 | $ | 8,805 | ||||
| | | | | | | | | | | |
| | | | | | | | | | | |
Supplemental disclosures of other cash flow information: |
||||||||||
Cash paid for interest |
$ | 71 | $ | 47 | $ | 286 | ||||
| | | | | | | | | | | |
| | | | | | | | | | | |
Supplemental disclosures of non-cash investing and financing activities: |
||||||||||
Purchases of property, equipment and software included in accounts payable and accruals |
$ | 49 | $ | 116 | $ | 32 | ||||
| | | | | | | | | | | |
| | | | | | | | | | | |
Vesting of restricted stock subject to repurchase |
$ | 55 | $ | 57 | $ | 10 | ||||
| | | | | | | | | | | |
| | | | | | | | | | | |
Forgiveness of accounts payable through exercise of convertible preferred stock warrant |
$ | 169 | $ | 5 | $ | — | ||||
| | | | | | | | | | | |
| | | | | | | | | | | |
Accretion of issuance costs of convertible preferred stock |
$ | 72 | $ | — | $ | — | ||||
| | | | | | | | | | | |
| | | | | | | | | | | |
The accompanying notes are an integral part of these financial statements.
F-6
MaxPoint Interactive, Inc. and Subsidiary
Notes to Consolidated Financial Statements
For the years ended December 31, 2011, 2012 and 2013
1. Description of Business
MaxPoint Interactive, Inc. (the "Company") was incorporated in September 2006 under the state laws of Delaware. The Company is a provider of a business intelligence and marketing automation solution. The Company's customers are located in the United States and consist primarily of enterprises with national brands in the consumer products, retail, automotive, healthcare, telecommunications and entertainment industries. The Company's MaxPoint Intelligence Platform predicts the most likely local buyers of a specific product at a particular retail location and then executes cross-channel digital marketing campaigns to reach these buyers on behalf of the Company's customers. The Company is headquartered in Morrisville, North Carolina and has offices across the United States.
2. Summary of Significant Accounting Policies
Principles of Consolidation
The consolidated financial statements include the accounts of the Company and its wholly-owned subsidiary and have been prepared in accordance with accounting principles generally accepted in the United States of America ("GAAP"). All intercompany accounts and transactions have been eliminated in consolidation.
Unaudited Pro Forma Presentation
Upon the consummation of a proposed Initial Public Offering ("IPO") of the Company's shares of common stock, subject to certain requirements described in Note 8, all of the outstanding shares of convertible preferred stock will automatically convert into shares of common stock. The unaudited pro forma net loss per share for the year ended December 31, 2013 assumes the conversion of all outstanding shares of convertible preferred stock into an aggregate of 29,697,650 shares of common stock upon the completion of the IPO as of January 1, 2013.
The Company believes that the unaudited pro forma net loss per share provides material information to investors because the conversion of the convertible preferred stock into common stock is expected to occur upon the closing of the IPO and, therefore, the disclosure of pro forma net loss per share provides a measure of loss per share that is comparable to what will be reported as a public company.
Use of Estimates
The preparation of financial statements in conformity with GAAP requires management to make estimates and assumptions that affect the reported amounts in the consolidated financial statements and accompanying notes. On an ongoing basis, the Company evaluates its estimates, including those related to its allowance for doubtful accounts, the fair value of the Company's common stock and assumptions used for purposes of determining stock-based compensation, income taxes and related valuation allowances and the fair value of the Series A convertible preferred stock warrant. The Company bases its estimates on its historical experience and on various other assumptions that it believes to be reasonable, the results of which form the basis for making judgments about the carrying value of assets and liabilities. Actual results could differ from those estimates.
F-7
MaxPoint Interactive, Inc. and Subsidiary
Notes to Consolidated Financial Statements (continued)
For the years ended December 31, 2011, 2012 and 2013
Cash and Cash Equivalents
The Company considers all highly liquid investments with a maturity of three months or less when purchased to be cash equivalents. Cash and cash equivalents consist of cash maintained in operating accounts.
Restricted Cash
Restricted cash represents cash that is subject to contractual withdrawal restrictions and penalties. Restricted cash is classified within the consolidated balance sheets based on the timing of when the restrictions are expected to lapse.
In accordance with a loan and security agreement (the "Loan and Security Agreement") entered into in September 2011 described in Note 5, the Company is required to keep a minimum cash balance in a cash account held with the same lender. As of December 31, 2012 and 2013, the Company is required by its Loan and Security Agreement to keep a minimum cash balance of $2.0 million and $3.5 million, respectively. The Company records the minimum cash balances in restricted cash on the consolidated balance sheets within long-term assets based on the timing of the maturity of the underlying Loan and Security Agreement.
In addition, the Company is required to maintain a cash balance equal to the overall credit limit of a corporate credit card account. This cash balance serves as collateral and is required to be placed in an account held with the creditor. As of December 31, 2012 and 2013, the Company was required to keep minimum cash balances of $0.2 million and $0.3 million, respectively. The Company presents this restricted cash in prepaid and other current assets on the consolidated balance sheets.
Comprehensive Loss
There are no items of comprehensive loss other than net loss for any periods presented.
Revenue Recognition
The Company generates revenue by delivering targeted advertising campaigns for customers through various channels, including display, mobile and video. The Company recognizes revenue when there is persuasive evidence of an arrangement, delivery has occurred or services have been provided, fees are fixed or determinable, and collection of fees is reasonably assured. Revenue arrangements are evidenced by a fully executed insertion order ("IO"). The IOs specify the delivery terms including the advertising format, the contracted number of advertising impressions to be delivered, the agreed upon rate for each delivered impression, generally on a cost-per-thousand basis, and the fixed period of time for delivery. The IOs typically have a term of less than three months and are cancellable at any time. The Company recognizes revenue in the period in which the impressions are served, limited to the contracted number of impressions as specified in the IO. The Company determines collectability by performing a credit evaluation for new customers and by monitoring its existing customers' accounts receivable balances. The Company does not typically receive upfront payments from its customers, and therefore, has an insignificant amount of deferred revenue.
In the normal course of business, the Company contracts either directly with advertisers or advertising agencies on behalf of their advertiser clients. The determination of whether revenue should be reported on a gross or net basis is based on an assessment of whether the Company is
F-8
MaxPoint Interactive, Inc. and Subsidiary
Notes to Consolidated Financial Statements (continued)
For the years ended December 31, 2011, 2012 and 2013
acting as the principal or an agent in the transaction. In determining whether the Company acts as the principal or an agent, the Company follows the accounting guidance for principal-agent considerations. While no one factor is determined to be individually conclusive, indicators that an entity is acting as a principal include if the Company (i) is the primary obligor in the arrangement; (ii) has certain inventory risk; (iii) has latitude in establishing pricing; (iv) adds meaningful value to the service; (v) has discretion in supplier selection; (vi) is involved in the determination of the service specifications; or (vii) has credit risk. The Company recognizes revenue on a gross basis primarily based on the Company's determination that it is subject to the risk of fluctuating costs from its media vendors, has latitude in establishing prices with its customers, has discretion in selecting media vendors when fulfilling a customer's advertising campaign, and has credit risks.
The Company may enter into multiple element arrangements for the delivery of more than one advertising placement to be delivered at the same time, or within close proximity of one another. When entering into an arrangement that includes multiple elements, the Company determines whether the arrangement should be divided into separate units of accounting and how the arrangement consideration should be measured and allocated among the separate units of accounting. An element qualifies as a separate unit of accounting when the delivered element has standalone value to the customer. The Company sells advertising placements on a standalone basis and thus has determined that each advertising placement in multiple element arrangements represents a separate unit of accounting.
The Company allocates arrangement consideration in multiple element arrangements at the inception of an arrangement to all deliverables based on the relative selling price method in accordance with the selling price hierarchy, which includes: (1) vendor-specific objective evidence ("VSOE"), if available; (2) third-party evidence ("TPE"), if VSOE is not available; and (3) best estimate of selling price ("BESP"), if neither VSOE nor TPE is available. The Company has been unable to establish VSOE or TPE, and therefore, uses BESP in its allocation of arrangement consideration. The Company determines BESP for its deliverables by considering a number of factors including, but not limited to, the price lists used by the Company's sales team in pricing negotiations, historical average and median pricing achieved in prior contractual customer arrangements and input from the Company's sales operation department regarding what it believes the deliverables could be sold for on a stand-alone basis. The Company allocates consideration based on the relative fair value of the advertising impressions and recognizes revenue as impressions are delivered, assuming all other revenue recognition criteria have been met.
During the years ended December 31, 2011, 2012 and 2013, the Company maintained commission-based arrangements with channel partners who helped market its advertising placement services. The Company paid the channel partners a commission, or fee, in exchange for providing the Company with new business. The Company recorded reductions to revenue for consideration paid to its channel partners in the amounts of $1.2 million, $0.3 million, and approximately $43,000 for the years ended December 31, 2011, 2012 and 2013, respectively.
Cost of Revenue
Traffic Acquisition Costs
Traffic acquisition costs consist of media costs for advertising impressions purchased from real-time bidding exchanges, which are expensed as incurred. The Company is billed by the advertising exchanges on a monthly basis for actual advertising impressions acquired.
F-9
MaxPoint Interactive, Inc. and Subsidiary
Notes to Consolidated Financial Statements (continued)
For the years ended December 31, 2011, 2012 and 2013
Other Cost of Revenue
Other cost of revenue includes third-party data center and other advertisement-serving costs, depreciation of data center equipment, amortization of capitalized internal-use software cost for revenue-producing technologies, purchases of third-party data for specific marketing campaigns and salaries and related costs for the Company's personnel dedicated to executing the Company's advertising campaigns.
Research and Development
Research and development expenses include costs associated with the maintenance and ongoing development of the Company's technology, including compensation and employee benefits and allocated costs associated with the Company's engineering and research and development departments, as well as costs for contracted services and supplies. The Company reviews costs incurred in the application development stage and assesses such costs for capitalization.
Concentration of Credit Risk
Financial instruments that potentially subject the Company to concentrations of credit risk consist principally of cash and accounts receivable. All of the Company's cash is held at financial institutions that management believes to be of high credit quality. The Company's cash accounts exceed federally insured limits. The Company has not experienced any losses on cash to date. To manage accounts receivable risk, the Company evaluates and monitors the creditworthiness of its customers.
As of December 31, 2012 and December 31, 2013, the Company did not have any customers or advertising agencies that individually comprised a significant concentration of its accounts receivable.
Revenue from one customer represented $4.0 million, or 28%, of total revenue for the year ended December 31, 2011. For the years ended December 31, 2012 and 2013, the Company did not have any customers that individually comprised a significant concentration of its revenue.
Allowance for Doubtful Accounts
The Company extends credit to its customers without requiring collateral. Accounts receivable are stated at realizable value, net of an allowance for doubtful accounts. The Company utilizes the allowance method to provide for doubtful accounts based on management's evaluation of the collectability of amounts due. The Company's estimate is based on historical collection experience and the current status of accounts receivable. Historically, actual write-offs for uncollectible accounts have not significantly differed from the Company's estimates. At December 31, 2012 and 2013, the Company had reserved for $0.1 million and $0.7 million, respectively, of its accounts receivable balance.
F-10
MaxPoint Interactive, Inc. and Subsidiary
Notes to Consolidated Financial Statements (continued)
For the years ended December 31, 2011, 2012 and 2013
The following table presents the changes in the allowance for doubtful accounts for the years ended December 31 (in thousands):
| |
2011 | 2012 | 2013 | |||||||
|---|---|---|---|---|---|---|---|---|---|---|
Allowance for doubtful accounts: |
||||||||||
Balance, beginning of period |
$ | 57 | $ | 90 | $ | 119 | ||||
Add: bad debt expense |
33 | 131 | 659 | |||||||
Less: write-offs, net of recoveries |
— | (102 | ) | (62 | ) | |||||
| | | | | | | | | | | |
Balance, end of period |
$ | 90 | $ | 119 | $ | 716 | ||||
| | | | | | | | | | | |
| | | | | | | | | | | |
Warrant
In 2009, as amended in 2011, the Company issued a performance-based warrant to purchase shares of Series A convertible preferred stock to a related party customer with a performance period extending to December 31, 2011. Under the agreement, the warrant holder earned the right to purchase 240,018 shares of Series A convertible preferred stock during the year ended December 31, 2011. The fair value of the warrant on the date of grant totaled approximately $130,000 for the year ended December 31, 2011, and was recorded as a reduction of revenue in the consolidated statements of operations and an increase in other liabilities in the consolidated balance sheets on the date of issuance. The warrant liability was remeasured to its fair value at the end of each reporting period until it was exercised or expired, and the related change in fair value was recorded as an increase in other expense and other liabilities. The Company recorded approximately $31,000 and $1,000 as other expense in 2011 and 2012, respectively. The warrant holder exercised and received 311,750 and 2,694 shares of Series A convertible preferred stock in 2011 and 2012, respectively. The warrant agreement expired on March 31, 2012.
Fair Value of Financial Instruments
The carrying amounts of certain of the Company's financial instruments, including cash and cash equivalents, accounts receivable, accounts payable and accrued expenses and other current liabilities, approximate their respective fair values due to their short term nature. As the Company's debt contains variable interest rates, carrying value approximates fair value. The fair value of debt falls within Level 3 of the fair value hierarchy as it is significantly driven by the creditworthiness of the Company, which is an unobservable input.
The Company uses a three-tier fair value hierarchy to classify and disclose all assets and liabilities measured at fair value on a recurring basis, as well as assets and liabilities measured at fair value on a non-recurring basis, in periods subsequent to their initial measurement. The hierarchy requires the Company to use observable inputs when available, and to minimize the use of unobservable inputs used to determine its fair value on a nonrecurring basis. The three tiers are defined as follows:
- •
- Level 1. Observable inputs based on unadjusted quoted prices in active markets
for identical assets or liabilities;
- •
- Level 2. Inputs, other than quoted prices in active markets, that are
observable either directly or indirectly; and
- •
- Level 3. Unobservable inputs for which there is little or no market data, which require the Company to develop its own assumptions.
F-11
MaxPoint Interactive, Inc. and Subsidiary
Notes to Consolidated Financial Statements (continued)
For the years ended December 31, 2011, 2012 and 2013
The Company did not have any financial instruments that were measured at fair value on a recurring basis as of December 31, 2012 and 2013.
The following table presents the changes in the Company's Level 3 instruments measured at fair value on a recurring basis during the years ended December 31 (in thousands):
| |
Series A Warrant | |||||||||
|---|---|---|---|---|---|---|---|---|---|---|
| |
2011 | 2012 | 2013 | |||||||
Balance as of January 1 |
$ | 23 | $ | 1 | $ | — | ||||
Issuance of warrant |
130 | — | — | |||||||
Exercise of warrant |
(183 | ) | (2 | ) | — | |||||
Change in fair value of warrant liability |
31 | 1 | — | |||||||
| | | | | | | | | | | |
Balance as of December 31 |
$ | 1 | $ | — | $ | — | ||||
| | | | | | | | | | | |
| | | | | | | | | | | |
In order to determine the fair value of the Series A convertible preferred stock warrant, the Company used an option pricing model. The valuation requires the input of subjective assumptions, including the estimated enterprise fair value, risk-free interest rate and the expected stock price volatility. The risk-free interest rate assumption is based upon observed interest rates for constant maturity U.S. Treasury securities consistent with the term of the warrant. The expected stock price volatility assumption is based on historical volatilities for publicly traded stock of comparable companies over the term of the warrant.
The following table summarizes the assumptions used for estimating the fair value of the Series A convertible preferred stock warrant for the years ended December 31:
| |
2011 | 2012 | |||||
|---|---|---|---|---|---|---|---|
Risk-free interest rate |
0.39 | % | 0.42 | % | |||
Expected term (years) |
2.50 | 2.25 | |||||
Expected volatility |
60 | % | 59 | % | |||
Dividend yield |
— | % | — | % | |||
Internal-Use Software Development Costs
The Company capitalizes certain costs associated with software developed for internal use, primarily consisting of direct labor costs associated with creating the software. Software development projects generally include three stages: the preliminary project stage (all costs are expensed as incurred); the application development stage (certain costs are capitalized and certain costs are expensed as incurred); and the post-implementation/operation stage (all costs are expensed as incurred). Costs capitalized in the application development stage primarily include costs of designing, coding, and testing the software. Capitalization of costs requires judgment in determining when a project has reached the application development stage and the period over which the Company expects to benefit from the use of that software. Once the software is placed in service, these capitalized costs are amortized using the straight-line method over the estimated useful life of the software.
Internal-use software development costs of $0.7 million, $1.1 million, and $2.0 million were capitalized during the years ended December 31, 2011, 2012 and 2013, respectively, and are included in property, equipment and software in the accompanying consolidated balance sheets. Amortization expense related to the capitalized internal-use software was $0.1 million, $0.4 million,
F-12
MaxPoint Interactive, Inc. and Subsidiary
Notes to Consolidated Financial Statements (continued)
For the years ended December 31, 2011, 2012 and 2013
and $0.8 million for the years ended December 31, 2011, 2012 and 2013, respectively, and is primarily included in other cost of revenue and research and development expense in the accompanying consolidated statements of operations. The net book value of capitalized internal-use software was $1.7 million and $3.0 million at December 31, 2012 and 2013, respectively.
Property, Equipment and Software
Property, equipment and software is recorded at cost, net of depreciation. Expenditures for major additions and improvements are capitalized. Depreciation and amortization are recognized over the estimated useful life of the related assets using the straight-line method.
The depreciation and amortization periods for the Company's significant property, equipment and software categories are as follows:
| Capitalized internal-use software costs | 3 years | |
| Computer hardware and software | 3 years | |
| Furniture and office equipment | 3 years | |
| Leasehold improvements | Lesser of remaining lease term or useful life |
Repairs and maintenance costs are expensed as incurred.
Impairment of Long-lived Assets
The Company reviews long-lived assets for impairment whenever events or changes in circumstances indicate the carrying amount of an asset may not be recoverable. Recoverability of a long-lived asset is measured by a comparison of the carrying amount of the asset or asset group to future undiscounted net cash flows expected to be generated by the asset or asset group. If such assets are not recoverable, the impairment to be recognized, if any, is measured by the amount by which the carrying amount of the assets exceeds the estimated fair value of the assets or asset group. No impairment charges were necessary for any period presented.
Income Taxes
Income taxes are accounted for under the asset and liability method of accounting. Deferred tax assets and liabilities are recognized for the future tax consequences attributable to differences between the financial statement carrying amounts of existing assets and liabilities and their respective tax bases, as well as for operating loss and tax credit carryforwards. Deferred tax assets and liabilities are measured using enacted tax rates expected to apply to taxable income in the years in which those temporary differences are expected to be recovered or settled. The effect on deferred tax assets and liabilities of a change in tax rates is recognized in the results of operations in the period when enacted. The measurement of a deferred tax asset is reduced, if necessary, by a valuation allowance if it is more likely than not that some portion or all of the deferred tax asset will not be realized. The assessment of whether or not a valuation allowance is required often requires significant judgment, including the long-range forecast of future taxable income and the evaluation of tax planning initiatives. Adjustments to the deferred tax valuation allowances are made to earnings in the period when such assessments are made. Due to the historical losses from the Company's operations, a full valuation allowance on deferred tax assets has been recorded.
F-13
MaxPoint Interactive, Inc. and Subsidiary
Notes to Consolidated Financial Statements (continued)
For the years ended December 31, 2011, 2012 and 2013
Advertising and Marketing
Advertising and marketing costs are expensed as incurred and totaled $1.1 million, $1.4 million and $2.2 million for the years ended December 31, 2011, 2012 and 2013, respectively.
Stock-Based Compensation
The Company accounts for stock options granted to employees based on their estimated fair values on the date of grant. The fair value of each stock option granted is estimated using the Black-Scholes option pricing model. The stock-based compensation expense is recognized on a straight-line basis over the requisite service period, net of estimated forfeitures.
The Company accounts for stock options issued to non-employees based on the fair value of the awards determined using the Black-Scholes option pricing model. The measurement of stock-based compensation is subject to periodic adjustment as the underlying equity instruments vest. The stock-based compensation expense is recognized on a straight-line basis over the vesting schedule.
Basic and Diluted Loss per Common Share
The Company uses the two-class method to compute net loss per common share because the Company has issued securities, other than common stock, that contractually entitle the holders to participate in dividends and earnings of the Company. The two-class method requires earnings for the period to be allocated between common stock and participating securities based upon their respective rights to receive distributed and undistributed earnings. Each series of the Company's convertible preferred stock is entitled to participate in distributions, when and if declared by the board of directors, that are made to common stockholders, and as a result all are considered participating securities.
Under the two-class method, for periods with net income, basic net income per common share is computed by dividing the net income attributable to common stockholders by the weighted average number of shares of common stock outstanding during the period. Net income attributable to common stockholders is computed by subtracting from net income the portion of current year earnings that the participating securities would have been entitled to receive pursuant to their dividend rights had all of the year's earnings been distributed. No such adjustment to earnings is made during periods with a net loss, as the holders of the participating securities have no obligation to fund losses. Diluted net loss per common share is computed under the two-class method by using the weighted average number of shares of common stock outstanding, plus, for periods with net income attributable to common stockholders, the potential effect of dilutive securities. In addition, the Company analyzes the potential dilutive effect of the outstanding participating securities under the if-converted method when calculating diluted earnings per share in which it is assumed that the outstanding participating securities convert into common stock at the beginning of the period. The Company reports the more dilutive of the approaches (two-class or if-converted) as its diluted net income per share during each reporting period. Due to net losses for the years ended December 31, 2011, 2012 and 2013, basic and diluted loss per share were the same, as the effect of potentially dilutive securities would have been anti-dilutive.
F-14
MaxPoint Interactive, Inc. and Subsidiary
Notes to Consolidated Financial Statements (continued)
For the years ended December 31, 2011, 2012 and 2013
Stock Split
On October 3, 2012, the Company's board of directors declared a two-for-one stock split on the shares of the Company's common and convertible preferred stock. Each stockholder of record on October 3, 2012 received an additional share of common or convertible preferred stock for each share of common or convertible preferred stock. The Company also adjusted the par value to $0.00005 per share for all shares of common and convertible preferred stock. All share and per share amounts related to the convertible preferred stock and common stock, including amounts under the Company's equity incentive plan, were adjusted to reflect the effect of the stock split. The accompanying consolidated financial statements and notes to the consolidated financial statements give effect to the stock split for all periods presented.
Recently Adopted Accounting Pronouncements
In May 2011, the Financial Accounting Standards Board ("FASB") issued Accounting Standards Update ("ASU") 2011-04, Fair Value Measurement (Topic 820): Amendments to Achieve Common Fair Value Measurement and Disclosure Requirements in U.S. GAAP and IFRS. ASU 2011-04 represents the converged guidance of the FASB and the International Accounting Standards Board ("IASB") on fair value measurements and has resulted in common requirements for measuring fair value and for disclosing information about fair value measurements, including a consistent meaning of the term "fair value." The Company adopted ASU 2011-04 effective January 1, 2012 and has applied the provisions of ASU 2011-04 for all periods presented. This new guidance only impacts how the Company reports on fair value measurements, and had no effect on the Company's consolidated results of operations, financial position or liquidity.
Recent Accounting Pronouncements Not Yet Adopted
In July 2013, the FASB issued ASU 2013-11, Presentation of an Unrecognized Tax Benefit When a Net Operating Loss Carryforward, a Similar Tax Loss, or a Tax Credit Carryforward Exists. This guidance provides financial statement presentation guidance on whether an unrecognized tax benefit must be presented as either a reduction to a deferred tax asset or separately as a liability. ASU 2013-11 is effective for interim or annual periods beginning after December 15, 2013. The Company plans to adopt ASU 2013-11 as of January 1, 2014, and the adoption of this guidance is not expected to have a material impact on the Company's consolidated results of operations, financial position or liquidity.
In May 2014, the FASB issued ASU 2014-09, Revenue from Contracts with Customers. This guidance states that an entity should recognize revenue to depict the transfer of promised goods or services to customers in an amount that reflects the consideration to which the entity expects to be entitled in exchange for those goods or services. ASU 2014-09 is effective for interim or annual periods beginning after December 15, 2016. The Company plans to adopt ASU 2014-09 as of January 1, 2017. Early adoption is not permitted. The Company is currently evaluating the impact of the adoption of this guidance on its consolidated results of operations, financial position and liquidity.
F-15
MaxPoint Interactive, Inc. and Subsidiary
Notes to Consolidated Financial Statements (continued)
For the years ended December 31, 2011, 2012 and 2013
3. Property, Equipment and Software, net
Property, equipment and software consisted of the following as of December 31 (in thousands):
| |
2012 | 2013 | |||||
|---|---|---|---|---|---|---|---|
Capitalized internal-use software costs |
$ | 2,267 | $ | 4,279 | |||
Computer hardware and software |
2,821 | 4,482 | |||||
Furniture and office equipment |
95 | 139 | |||||
Leasehold improvements |
31 | 100 | |||||
| | | | | | | | |
Total |
5,214 | 9,000 | |||||
Less: accumulated depreciation |
(1,626 | ) | (3,582 | ) | |||
| | | | | | | | |
Property, equipment and software, net |
$ | 3,588 | $ | 5,418 | |||
| | | | | | | | |
| | | | | | | | |
Depreciation and amortization expense for the years ended December 31, 2011, 2012 and 2013 was $0.4 million, $1.1 million and $2.0 million, respectively.
4. Accrued Expenses and Other Current Liabilities
Accrued expenses consisted of the following as of December 31 (in thousands):
| |
2012 | 2013 | |||||
|---|---|---|---|---|---|---|---|
Accrued commissions |
$ | 1,093 | $ | 1,751 | |||
Accrued bonuses |
939 | 1,112 | |||||
Accrued salaries, wages, benefits and related costs |
328 | 376 | |||||
Other accrued expenses and current liabilities |
260 | 590 | |||||
| | | | | | | | |
Accrued expenses and other current liabilities |
$ | 2,620 | $ | 3,829 | |||
| | | | | | | | |
| | | | | | | | |
5. Debt
As described in Note 15, the Company entered into two new debt arrangements which resulted in the Company subsequently repaying all of its debt outstanding as of December 31, 2013. As of December 31, 2013, the Company has excluded the required payments due within the next twelve months under the debt agreement from current liabilities because the Company refinanced the obligations on a long-term basis.
Debt consisted of the following as of December 31 (in thousands):
| |
2012 | 2013 | |||||
|---|---|---|---|---|---|---|---|
Revolving line of credit |
$ | 10,718 | $ | 16,529 | |||
Equipment line of credit |
— | 1,232 | |||||
| | | | | | | | |
Long-term debt |
$ | 10,718 | $ | 17,761 | |||
| | | | | | | | |
| | | | | | | | |
In June 2010, the Company entered into a loan and security agreement with a lender, which was amended in November 2010. The loan and security agreement included a revolving line of aggregate advances totaling $1.0 million. The loan was secured by substantially all of the Company's assets, excluding intellectual property. Borrowings under the revolving line of credit were limited to 80% of eligible accounts receivable. The revolving line of credit had a maturity date of November 29, 2011. Interest-only payments were made monthly on any outstanding advances during the term at an interest rate determined by the Company's quick ratio, defined as the ratio of
F-16
MaxPoint Interactive, Inc. and Subsidiary
Notes to Consolidated Financial Statements (continued)
For the years ended December 31, 2011, 2012 and 2013
current assets to current liabilities. In March 2011, the Company amended the loan and security agreement to (i) increase the borrowing capacity to $3.0 million; and (ii) modify the quick ratio covenant to include a reduced interest rate of the greater of the lender's prime rate plus 0.5%, or 4.50% if the quick ratio was equal to or greater than 2.5:1. In September 2011, the Company repaid all amounts borrowed under the loan and security agreement and terminated the agreement.
In September 2011, the Company entered into the Loan and Security Agreement with another lender. The Loan and Security Agreement includes a revolving line of aggregate advances (the "Revolving Line of Credit") totaling $7.5 million. The loan is secured by substantially all of the Company's assets, excluding intellectual property. Borrowings under the Revolving Line of Credit are limited to 85% of eligible accounts receivable. The Revolving Line of Credit had an initial maturity date of March 14, 2013. The interest rate on outstanding amounts under the Revolving Line of Credit is a floating rate per annum equal to the prime referenced rate plus the applicable margin (as defined in the Loan and Security Agreement as 0.75% - 1.50%). Interest is payable monthly, in arrears. In December 2012, the Company amended the Loan and Security Agreement to increase the borrowing capacity under the Revolving Line of Credit to $14.0 million and to extend the maturity date of the Revolving Line of Credit to June 11, 2014. The effective interest rate of the Revolving Line of Credit was 4.0% as of December 31, 2011 and 2012.
In September 2013, the Company amended the Loan and Security Agreement to (i) increase the borrowing capacity of the Revolving Line of Credit to $21.0 million; (ii) extend the maturity date of the Revolving Line of Credit to March 23, 2015; and (iii) add an equipment line of credit (the "Equipment Line of Credit"). The Equipment Line of Credit provides for the purchase of up to $2.0 million of fixed assets. Interest is payable monthly, in arrears. Principal is payable monthly over 30 months beginning in October 2014. The Company made borrowings under the Equipment Line of Credit of $1.2 million. Interest is charged at the prime referenced rate plus the applicable margin (as defined in the amended Loan and Security Agreement as 1.5% for the Equipment Line of Credit and 0.5% for the Revolving Line of Credit). The effective interest rate for the Equipment Line of Credit and the Revolving Line of Credit was 4.75% and 3.75%, respectively, as December 31, 2013. As of December 31, 2013 the Company had a maximum of $5.2 million of unused borrowing capacity under the Loan and Security Agreement, subject to limitations related to the Company's eligible receivable balance, described above.
Under the terms of the Loan and Security Agreement, the Company is required to meet and maintain certain customary financial and nonfinancial covenants, one of which restricts the Company's ability to pay dividends or make any distribution or payment to redeem, retire or purchase any capital stock, subject to certain specified exceptions. As of December 31, 2013, the Company was in compliance with all such covenants.
Based on the Company's borrowings under the Loan and Security Agreement as of December 31, 2013, the future principal payments are as follows (in thousands):
Year Ending December 31, |
||||
2014 |
$ | 123 | ||
2015 |
17,022 | |||
2016 |
493 | |||
2017 |
123 | |||
| | | | | |
Long-term debt |
$ | 17,761 | ||
| | | | | |
| | | | | |
F-17
MaxPoint Interactive, Inc. and Subsidiary
Notes to Consolidated Financial Statements (continued)
For the years ended December 31, 2011, 2012 and 2013
6. Employee Retirement Savings Plan
Effective July 1, 2011, the Company established the MaxPoint Interactive, Inc. 401(k) Profit Sharing Plan (the "Retirement Plan") covering all permanent full-time employees who are at least 21 years of age. Retirement Plan participants may make a combination of pre-tax and after-tax elective contributions, up to the maximum percentage of compensation and dollar amount limits under the Internal Revenue Code. Retirement Plan participants are immediately 100% vested in their elective contributions. Company contributions to the Retirement Plan are discretionary. There were no Company contributions to the Retirement Plan for the years ended December 31, 2011, 2012 and 2013.
7. Common Stock
The Company is authorized to issue two classes of stock, common stock and convertible preferred stock. The Company is authorized to issue 73,903,252 total shares, consisting of 44,000,000 shares of common stock and 29,903,252 shares of convertible preferred stock. Both the common stock and convertible preferred stock have a par value of $0.00005 per share.
Liquidation Rights
In the event of any liquidation or dissolution of the Company, the holders of common stock are entitled to the remaining assets of the Company legally available for distribution after the payment of the full liquidation preference for all series of outstanding convertible preferred stock.
Dividend and Voting Rights
The holders of common stock are entitled to receive dividends if and when declared by the Company, but not until all dividends on convertible preferred stock have been either (i) paid or (ii) declared and the Company has set aside funds to pay those dividends declared. Holders of common stock have the right to one vote per share.
Common Stock Reserved for Issuance
The Company's shares of common stock reserved for issuance as of December 31, 2013 were as follows:
| |
2013 | |||
|---|---|---|---|---|
Series A convertible preferred stock |
4,767,492 | |||
Series B convertible preferred stock |
7,298,736 | |||
Series C convertible preferred stock |
10,813,002 | |||
Series D convertible preferred stock |
6,818,420 | |||
Stock options outstanding |
4,748,490 | |||
Stock options available for grant |
992,468 | |||
| | | | | |
Total shares reserved |
35,438,608 | |||
| | | | | |
| | | | | |
F-18
MaxPoint Interactive, Inc. and Subsidiary
Notes to Consolidated Financial Statements (continued)
For the years ended December 31, 2011, 2012 and 2013
8. Convertible Preferred Stock
The following table summarizes the issuances of convertible preferred stock:
Name
|
Original Issue Price Per Share |
Number of Shares |
Conversion Price per Share |
|||||||
|---|---|---|---|---|---|---|---|---|---|---|
Series A |
$ | 0.291 | 4,767,492 | $ | 0.291 | |||||
Series B |
$ | 0.42328 | 7,298,736 | $ | 0.42328 | |||||
Series C |
$ | 0.7399 | 10,813,002 | $ | 0.7399 | |||||
Series D |
$ | 1.9066 | 6,818,420 | $ | 1.9066 | |||||
The Series A, Series B, Series C and Series D convertible preferred stock are collectively referred to as the "Preferred Stock," and individually as the "Series A," "Series B," "Series C," and "Series D." The "Original Issue Price" per share excludes the cost of issuance.
The Company has determined that its convertible preferred stock is contingently redeemable due to the existence of deemed liquidation provisions contained in its certificate of incorporation, and therefore classifies its convertible preferred stock outside of permanent equity.
Summary of Activity
The following table presents a summary of activity for the Preferred Stock issued and outstanding for the years ended December 31, 2011, 2012 and 2013 (in thousands):
| |
Convertible Preferred Stock | |||||||||||||||
|---|---|---|---|---|---|---|---|---|---|---|---|---|---|---|---|---|
| |
Series A | Series B | Series C | Series D | Total Amount |
|||||||||||
Balance, January 1, 2011 |
$ | 1,295 | $ | 3,089 | $ | 8,000 | $ | — | $ | 12,384 | ||||||
Issuance of Series D, less offering costs of $72 |
— | — | — | 12,928 | 12,928 | |||||||||||
Exercise of Series A warrant |
91 | — | — | — | 91 | |||||||||||
Accretion of issuance costs on convertible Preferred Stock |
— | — | — | 72 | 72 | |||||||||||
| | | | | | | | | | | | | | | | | |
Balance, December 31, 2011 |
1,386 | 3,089 | 8,000 | 13,000 | 25,475 | |||||||||||
| | | | | | | | | | | | | | | | | |
| | | | | | | | | | | | | | | | | |
Exercise of Series A warrant |
1 | — | — | — | 1 | |||||||||||
| | | | | | | | | | | | | | | | | |
| | | | | | | | | | | | | | | | | |
Balance, December 31, 2012 |
1,387 | 3,089 | 8,000 | 13,000 | 25,476 | |||||||||||
| | | | | | | | | | | | | | | | | |
| | | | | | | | | | | | | | | | | |
Balance, December 31, 2013 |
$ | 1,387 | $ | 3,089 | $ | 8,000 | $ | 13,000 | $ | 25,476 | ||||||
| | | | | | | | | | | | | | | | | |
| | | | | | | | | | | | | | | | | |
Conversion Rights
The holders of the Company's Preferred Stock are entitled to convert their shares into common stock at any time. The number of shares of common stock issued upon conversion is determined based on the number of converted Preferred Stock shares and the conversion price. The conversion price varies based upon the occurrence of certain events, such as stock splits, business combinations, issuances of common stock dividends and distributions, recapitalizations, mergers, consolidations and sales of common stock below the Preferred Stock conversion price. As of December 31, 2012 and 2013, the conversion price of each series of Preferred Stock was equal to the Original Issue Price of such series.
F-19
MaxPoint Interactive, Inc. and Subsidiary
Notes to Consolidated Financial Statements (continued)
For the years ended December 31, 2011, 2012 and 2013
Each share of the Preferred Stock will automatically and immediately be converted into Common Stock at the then applicable conversion rate in the event of either (i) immediately prior to the closing of a firm commitment initial public offering underwritten by an investment banking firm of national standing with aggregate gross offering proceeds to the Company (determined after deduction of underwriting discounts and expenses of the offering) of at least $30.0 million, at a public offering price of at least $2.21955 per share as adjusted from time to time to reflect stock splits, consolidations, stock dividends, combinations, recapitalizations, and the like, after which the Common Stock is listed on the New York Stock Exchange or the NASDAQ Global Market or (ii) the election of the holders of (a) with respect to the conversion of the Series A and Series B only, a majority of the outstanding shares of the Series B, (b) with respect to the conversion of the Series C only, a majority of the outstanding shares of Series C and (c) with respect to the conversion of the Series D only, sixty-seven percent of the outstanding shares of Series D; provided, however, if such conversion is in connection with an initial public offering of the Company's Common Stock, the conversion of the Series B, Series C and Series D shall be at the election of the holders of sixty-seven percent of the outstanding shares of the Series B, Series C and Series D, voting together as a single class on an as-converted basis.
Voting Rights
The holders of the Preferred Stock are entitled to vote, together with the holders of common stock, on all matters submitted to stockholders for a vote. Each share of Preferred Stock entitles its holder to the number of votes equal to the number of shares of common stock into which such preferred share is convertible at the time of such vote.
Dividend Rights
Holders of the Series D, in preference to holders of the Series A, Series B and Series C (the "Junior Preferred") and common stock, are entitled to receive dividends at a rate of 8% of the Series D Original Issue Price per annum on each outstanding share of Series D. Such dividends are payable only when, as and if declared by the board of directors and are non-cumulative. Payment of any dividends to the holders of the Series D shall be on a pro rata basis.
After all dividends in the full preferential amount specified above for the Series D have been paid or declared and set apart in any fiscal year, holders of the Junior Preferred, in preference to the holders of common stock, are entitled to receive dividends at a rate of 8% of the applicable Original Issue Price per annum on each outstanding share of Junior Preferred. Such dividends are payable only when, as and if declared by the board of directors and are non-cumulative. Payment of any dividends to the holders of the Junior Preferred shall be on a pro rata basis.
In addition to the 8% dividend, holders of the Preferred Stock are entitled to receive, on an as-converted basis, when and as declared by the Company's board of directors, any dividends on the Company's common stock. No dividends have been declared by the board of directors as of December 31, 2013.
Liquidation Rights
In the event of any liquidation, dissolution, winding up of the Company, whether voluntary or involuntary, or change of control, before any distribution or payment is made to the holders of common stock, the holders of Preferred Stock are entitled to receive, on a pari passu basis, an amount per share equal to the applicable Original Issue Price, as adjusted for stock splits,
F-20
MaxPoint Interactive, Inc. and Subsidiary
Notes to Consolidated Financial Statements (continued)
For the years ended December 31, 2011, 2012 and 2013
consolidations, stock dividends, combinations, consolidations, recapitalizations and the like (the "Liquidation Preference"), plus all declared but unpaid dividends on such shares. If the assets of the Company legally available for distribution to the holders of Preferred Stock are insufficient to make payment in full of the applicable Liquidation Preference, then the entire amount of the assets of the Company legally available for distribution shall be distributed among the holders of Preferred Stock ratably in proportion to the full preferential amounts to which they would have otherwise been entitled, plus all declared and unpaid dividends.
9. Stock-Based Compensation
During 2010, the Company adopted the 2010 Equity Incentive Plan (the "Plan"), pursuant to which the Company has reserved 6,175,736 shares for issuance to employees, directors and consultants. Of this amount, 992,468 shares are available for future stock option grants as of December 31, 2013.
The terms of the stock options, including the exercise price per share and vesting provisions, are determined by the board of directors. Stock options are granted at exercise prices not less than the estimated fair market value of the Company's common stock at the date of grant based upon numerous objective and subjective factors including: third-party valuations, preferred stock transactions with third-parties, current operating and financial performance, management estimates and future expectations. Stock option grants typically vest upon the expiration of an initial one year cliff and vest monthly thereafter over the remaining thirty-six months assuming continuing service, and expire ten years from the grant date.
The Plan allows for the granting of stock options that may be exercised before the options have vested at the discretion and determination of the board of directors. Restricted shares issued as a result of the early exercise of stock options are subject to repurchase by the Company upon termination of service. As of December 31, 2012 and 2013, there were an insignificant amount of shares of common stock subject to the Company's right of repurchase. Payments received from early exercises are recorded in accrued expenses and other current liabilities on the consolidated balance sheets and reclassified to stockholders' deficit as the options vest.
Stock-based compensation expense is included in the following line items in the accompanying consolidated statements of operations for the years ended December 31 (in thousands):
| |
2011 | 2012 | 2013 | |||||||
|---|---|---|---|---|---|---|---|---|---|---|
Other cost of revenue |
$ | 1 | $ | 2 | $ | 6 | ||||
Sales and marketing |
32 | 137 | 212 | |||||||
Research and development |
21 | 155 | 276 | |||||||
General and administrative |
230 | 259 | 85 | |||||||
| | | | | | | | | | | |
|
$ | 284 | $ | 553 | $ | 579 | ||||
| | | | | | | | | | | |
| | | | | | | | | | | |
The Company values stock options using the Black-Scholes option-pricing model, which requires the input of subjective assumptions, including the risk-free interest rate, expected life, expected stock price volatility and dividend yield. The risk-free interest rate assumption is based upon observed interest rates for constant maturity U.S. Treasury securities consistent with the expected term of the Company's employee stock options. The expected life represents the period of time the stock options are expected to be outstanding and is based on the simplified method. The Company uses the simplified method due to the lack of sufficient historical exercise data to
F-21
MaxPoint Interactive, Inc. and Subsidiary
Notes to Consolidated Financial Statements (continued)
For the years ended December 31, 2011, 2012 and 2013
provide a reasonable basis upon which to otherwise estimate the expected life of the stock options. Expected volatility is based on historical volatilities for publicly traded stock of comparable companies over the estimated expected life of the stock options. The Company assumes no dividend yield because dividends are not expected to be paid in the near future, which is consistent with the Company's history of not paying dividends.
The following table summarizes the assumptions used for estimating the fair value of stock options granted to employees for the years ended December 31:
| |
2011 | 2012 | 2013 | |||
|---|---|---|---|---|---|---|
Risk-free interest rate |
1.24% - 2.49% | 0.74% - 1.10% | 0.94% - 2.05% | |||
Expected term (years) |
6.08 | 5.64 - 6.08 | 5.64 - 6.08 | |||
Expected volatility |
63% - 65% | 62% - 65% | 59% - 62% | |||
Dividend yield |
— % | — % | — % |
The following table summarizes the assumptions used for estimating the fair value of stock options granted to non-employees for the years ended December 31:
| |
2013 | |
|---|---|---|
Risk-free interest rate |
2.70% | |
Expected term (years) |
10.00 | |
Expected volatility |
60% | |
Dividend yield |
— % |
The following table summarizes the stock option activity for the years ended December 31, 2011, 2012 and 2013:
| |
Number of Options |
Weighted Average Exercise Price |
Weighted Average Remaining Contractual Term |
Aggregate Intrinsic Value |
|||||||||
|---|---|---|---|---|---|---|---|---|---|---|---|---|---|
| |
|
|
(in years) |
(in thousands) |
|||||||||
Outstanding balance at January 1, 2011 |
519,516 | $ | 0.17 | 9.58 | $ | 223 | |||||||
Granted |
2,367,000 | 0.30 | |||||||||||
Exercised |
(15,366 | ) | 0.17 | ||||||||||
Cancelled |
(329,514 | ) | 0.29 | ||||||||||
| | | | | | | | | | | | | | |
Outstanding balance at December 31, 2011 |
2,541,636 | $ | 0.28 | 9.32 | $ | 701 | |||||||
Granted |
2,207,000 | 0.93 | |||||||||||
Exercised |
(111,912 | ) | 0.29 | ||||||||||
Cancelled |
(430,753 | ) | 0.30 | ||||||||||
| | | | | | | | | | | | | | |
Outstanding balance at December 31, 2012 |
4,205,971 | $ | 0.61 | 8.89 | $ | 4,771 | |||||||
Granted |
1,056,809 | 2.65 | |||||||||||
Exercised |
(194,500 | ) | 0.37 | ||||||||||
Cancelled |
(319,790 | ) | 0.97 | ||||||||||
| | | | | | | | | | | | | | |
Outstanding balance at December 31, 2013 |
4,748,490 | $ | 1.05 | 8.26 | $ | 17,016 | |||||||
| | | | | | | | | | | | | | |
| | | | | | | | | | | | | | |
Exercisable at December 31, 2013 |
2,231,630 | $ | 0.53 | 7.68 | $ | 9,154 | |||||||
| | | | | | | | | | | | | | |
| | | | | | | | | | | | | | |
Vested and expected to vest at December 31, 2013 |
3,457,286 | $ | 0.95 | 8.14 | $ | 12,731 | |||||||
| | | | | | | | | | | | | | |
| | | | | | | | | | | | | | |
F-22
MaxPoint Interactive, Inc. and Subsidiary
Notes to Consolidated Financial Statements (continued)
For the years ended December 31, 2011, 2012 and 2013
The following table provides a summary of options outstanding and vested as of December 31, 2013:
Exercise Prices
|
Number Outstanding |
Weighted- Average Life (in Years) |
Number Exercisable |
Weighted- Average Life (in Years) |
|||||||||
|---|---|---|---|---|---|---|---|---|---|---|---|---|---|
$0.17 |
461,637 | 6.58 | 431,637 | 6.58 | |||||||||
$0.30 |
1,413,418 | 7.44 | 864,735 | 7.42 | |||||||||
$0.76 |
900,584 | 8.21 | 576,768 | 8.17 | |||||||||
$1.10 |
940,542 | 8.82 | 343,837 | 8.80 | |||||||||
$1.74 |
430,000 | 9.42 | 7,000 | 9.28 | |||||||||
$2.45 |
359,612 | 9.70 | 7,653 | 9.70 | |||||||||
$4.63 |
242,697 | 9.98 | — | — | |||||||||
| | | | | | | | | | | | | | |
|
4,748,490 | 8.26 | 2,231,630 | 7.68 | |||||||||
| | | | | | | | | | | | | | |
| | | | | | | | | | | | | | |
The weighted average grant date fair value for the Company's stock options granted during the years ended December 31, 2011, 2012 and 2013 was $0.18, $0.53 and $1.52 per share, respectively. The total compensation cost related to nonvested stock options not yet recognized as of December 31, 2013 was $2.2 million and will be recognized over a weighted average period of approximately 2.71 years. The aggregate intrinsic value of stock options exercised during the years ended December 31, 2011, 2012 and 2013 was approximately $21,000, $0.2 million and $0.8 million, respectively.
The Company did not grant any stock options to non-employees for the years ended December 31, 2011 and 2012. During the year ended December 31, 2013, the Company granted options to purchase a total of 30,612 shares of common stock to non-employees under the Plan.
The Company recorded stock-based compensation expense for options issued to non-employees of approximately $0.1 million, $0.1 million and approximately $42,000 for the years ended December 31, 2011, 2012 and 2013, respectively. As of December 31, 2012 and 2013, 231,248 and 30,612 non-employee options were outstanding, respectively.
During 2010, the Company restricted 5,850,880 shares of then outstanding common stock held by employees and consultants of the Company as a condition of the investors in the Company's Series B convertible preferred stock issuance. In accordance with the terms of the restricted stock agreements, shares were held in escrow and released incrementally when vested through January 31, 2013. These restricted shares are considered issued and outstanding based on the fact they are participating securities and their respective rights to receive distributed earnings, subject to their contractual vesting provisions. The restricted shares held in escrow are subject to repurchase by the Company upon termination of employment. The Company had 113,251 restricted shares held in escrow as of December 31, 2012. The original purchase price related to these shares is recorded in accrued expenses and other current liabilities and other long-term liabilities on the balance sheets and reclassified to stockholders' deficit as the restricted shares vest. The Company recorded stock-based compensation expense of approximately $0.2 million, $0.2 million and approximately $14,000 for the years ended December 31, 2011, 2012 and 2013, respectively.
F-23
MaxPoint Interactive, Inc. and Subsidiary
Notes to Consolidated Financial Statements (continued)
For the years ended December 31, 2011, 2012 and 2013
The following table summarizes the restricted share activity for the years ended December 31, 2011, 2012 and 2013:
| |
Restricted Shares |
|||
|---|---|---|---|---|
Nonvested at January 1, 2011 |
2,831,269 | |||
Vested |
(1,359,009 | ) | ||
| | | | | |
Nonvested at December 31, 2011 |
1,472,260 | |||
Vested |
(1,359,009 | ) | ||
| | | | | |
Nonvested at December 31, 2012 |
113,251 | |||
Vested |
(113,251 | ) | ||
| | | | | |
Nonvested at December 31, 2013 |
— | |||
| | | | | |
| | | | | |
10. Income Taxes
Taxes computed at the statutory U.S. federal income tax rate of 34% are reconciled to the provision for income taxes as follows (in thousands of dollars):
| |
Year Ended December 31, | |||||||||
|---|---|---|---|---|---|---|---|---|---|---|
| |
2011 | 2012 | 2013 | |||||||
Effective tax rate |
0 | % | 0 | % | 0 | % | ||||
| | | | | | | | | | | |
| | | | | | | | | | | |
Statutory rate of 34% |
$ | (1,868 | ) | $ | (2,298 | ) | $ | (64 | ) | |
State taxes, net of federal benefit |
(147 | ) | (181 | ) | (4 | ) | ||||
Stock-based compensation permanent differences |
24 | 102 | 182 | |||||||
Miscellaneous permanent differences |
43 | 63 | 39 | |||||||
Change in valuation allowance and other adjustments |
1,948 | 2,314 | (153 | ) | ||||||
| | | | | | | | | | | |
Provision for income taxes |
$ | — | $ | — | $ | — | ||||
| | | | | | | | | | | |
| | | | | | | | | | | |
Components of the current and long-term deferred tax assets were as follows (in thousands of dollars):
| |
December 31, | ||||||
|---|---|---|---|---|---|---|---|
| |
2012 | 2013 | |||||
Current: |
|||||||
Accrued expenses |
$ | 453 | $ | 769 | |||
Valuation allowance |
(453 | ) | (769 | ) | |||
| | | | | | | | |
Total current deferred tax asset |
$ | — | $ | — | |||
| | | | | | | | |
Long-term: |
|||||||
Stock-based compensation |
$ | 333 | $ | 363 | |||
Future benefit of carry forward losses |
5,789 | 5,612 | |||||
Valuation allowance |
(4,997 | ) | (4,527 | ) | |||
| | | | | | | | |
Total long-term deferred tax asset |
$ | 1,125 | $ | 1,448 | |||
| | | | | | | | |
F-24
MaxPoint Interactive, Inc. and Subsidiary
Notes to Consolidated Financial Statements (continued)
For the years ended December 31, 2011, 2012 and 2013
Components of long-term deferred tax liabilities were as follows (in thousands of dollars):
| |
December 31, | ||||||
|---|---|---|---|---|---|---|---|
| |
2012 | 2013 | |||||
Long-term: |
|||||||
Amortization |
$ | (634 | ) | $ | (1,084 | ) | |
Depreciation |
(491 | ) | (364 | ) | |||
| | | | | | | | |
Total long-term deferred tax liability |
$ | (1,125 | ) | $ | (1,448 | ) | |
| | | | | | | | |
Net deferred tax assets (liabilities) |
$ |
— |
$ |
— |
|||
| | | | | | | | |
| | | | | | | | |
The Company has federal operating loss carry forwards at December 31, 2013 of approximately $15.4 million that will begin to expire in 2026. The Company also has state operating loss carry forwards of approximately $8.3 million that will begin to expire in 2021.
The Company applies the accounting guidance for uncertainties in income taxes, which prescribes a recognition threshold and measurement process for recording uncertain tax positions taken, or expected to be taken, in a tax return in the financial statements. Additionally, the guidance also prescribes the treatment for the derecognition, classification, accounting in interim periods and disclosure requirements for uncertain tax positions. The Company accrues for the estimated amount of taxes for uncertain tax positions if it is more likely than not that the Company would be required to pay such additional taxes. An uncertain tax position will be recognized if it is more likely than not to be sustained. The Company has determined that any uncertain tax positions for the tax years open for examination would have no material impact on the consolidated financial statements.
In accordance with Section 382 of the Internal Revenue Code of 1986, as amended, a change in equity ownership of greater than 50% within a three-year period results in an annual limitation on the Company's ability to utilize its NOL carryforwards created during the tax periods prior to the change in ownership. The Company has determined that ownership changes have occurred and as a result, a portion of the Company's NOL carryforwards might be limited.
11. Commitments and Contingencies
Leases
The Company leases office facilities under operating leases. Future minimum lease payments under non-cancellable operating leases as of December 31, 2013 are as follows (in thousands):
Year Ending December 31, |
||||
2014 |
$ | 1,044 | ||
2015 |
1,217 | |||
2016 |
1,169 | |||
2017 |
1,131 | |||
2018 |
980 | |||
Thereafter |
413 | |||
| | | | | |
Total minimum lease payments |
$ | 5,954 | ||
| | | | | |
| | | | | |
F-25
MaxPoint Interactive, Inc. and Subsidiary
Notes to Consolidated Financial Statements (continued)
For the years ended December 31, 2011, 2012 and 2013
Future minimum lease payments due under certain operating lease arrangements contain fixed rent increases and rent abatements over the term of the lease. Rent expense on these operating leases is recognized over the term of the lease on a straight-line basis. The excess of rent expense over future minimum lease payments due has been reported in other long-term liabilities in the accompanying consolidated balance sheets. As of December 31, 2012 and 2013, deferred rent related to these leases totaled $0.1 million.
Total rent expense for the years ended December 31, 2011, 2012 and 2013 was $0.2 million, $0.4 million and $0.8 million, respectively.
Purchase Commitments
The Company has $2.3 million of non-cancelable contractual commitments as of December 31, 2013, primarily related to third-party data centers and other support services. Of these commitments, $1.7 million, $0.5 million and $0.1 million are due within the next year, within one to three years and within three to five years, respectively.
Litigation
The Company is subject to various legal matters in the ordinary course of business. In the opinion of management, there are currently no such known matters that will have a material effect on the financial condition, results of operations or cash flows of the Company.
Indemnification Agreements
In the ordinary course of business, the Company may provide indemnifications of varying scope and terms to customers, vendors, lessors, business partners and other parties with respect to certain matters, including, but not limited to, losses arising out of breach of such agreements, services to be provided by the Company or from intellectual property infringement claims made by third parties. In addition, the Company has entered into indemnification agreements with directors and certain officers and employees that will require the Company, among other things, to indemnify them against certain liabilities that may arise by reason of their status or service as directors, officers or employees. No demands have been made upon the Company to provide indemnification under such agreements, and thus there are no claims that the Company is aware of that could have a material effect on the Company's financial position, results of operations or cash flows.
F-26
MaxPoint Interactive, Inc. and Subsidiary
Notes to Consolidated Financial Statements (continued)
For the years ended December 31, 2011, 2012 and 2013
12. Net Loss Per Share
Diluted net loss per share is the same as basic net loss per share for the years ended December 31, 2011, 2012 and 2013 because the effects of potentially dilutive items were anti-dilutive, given the Company's net losses in those years. The following securities have been excluded from the calculation of diluted weighted average common shares outstanding because the effect is anti-dilutive for the years ended December 31:
| |
2011 | 2012 | 2013 | |||||||
|---|---|---|---|---|---|---|---|---|---|---|
Convertible preferred stock: |
||||||||||
Series A |
4,764,798 | 4,767,492 | 4,767,492 | |||||||
Series B |
7,298,736 | 7,298,736 | 7,298,736 | |||||||
Series C |
10,813,002 | 10,813,002 | 10,813,002 | |||||||
Series D |
6,818,420 | 6,818,420 | 6,818,420 | |||||||
Warrant to purchase Series A convertible preferred stock |
2,694 | — | — | |||||||
Common stock subject to repurchase |
1,538,176 | 152,667 | 12,916 | |||||||
Stock options |
2,541,636 | 4,205,971 | 4,748,490 | |||||||
Pro Forma Net Loss Per Share (unaudited)
The denominator used in computing pro forma net loss per share for the year ended December 31, 2013 has been adjusted to assume the conversion of all outstanding shares of convertible Preferred Stock into common stock as of the beginning of the year or at the time of issuance, if later.
The following table presents the calculation of pro forma basic and diluted net loss per share (in thousands, except share and per share data) for the year ended December 31, 2013:
Numerator: |
||||
Net loss |
$ | (187 | ) | |
| | | | | |
Pro forma numerator for basic and diluted net loss per share |
$ | (187 | ) | |
| | | | | |
| | | | | |
Denominator: |
||||
Denominator for basic net loss per share—weighted average shares |
7,417,068 | |||
Plus: conversion of convertible preferred stock to common stock |
29,697,650 | |||
| | | | | |
Pro forma denominator for basic and diluted net loss per share |
37,114,718 | |||
| | | | | |
| | | | | |
Pro forma basic and diluted net loss per share |
$ | (0.01 | ) | |
| | | | | |
| | | | | |
13. Segment and Geographic Information
Operating segments are defined as components of an enterprise for which discrete financial information is available that is evaluated regularly by the chief operating decision maker ("CODM") for purposes of allocating resources and evaluating financial performance. The Company's CODM, the Chief Executive Officer, reviews financial information presented on a consolidated basis for purposes of allocating resources and evaluating financial performance. The Company has one business activity, and there are no segment managers who are held accountable for operations, operating results or plans for levels or components below the consolidated unit level. Accordingly, the Company has determined that it has a single operating and reportable segment.
F-27
MaxPoint Interactive, Inc. and Subsidiary
Notes to Consolidated Financial Statements (continued)
For the years ended December 31, 2011, 2012 and 2013
All assets were held, and substantially all revenue was generated, in the United States during the years ended December 31, 2011, 2012 and 2013.
14. Related Parties
One of the Company's channel partners was an investor during the years ended December 31, 2011, 2012 and 2013. During the year ended December 31, 2013 the related party disposed of its investment in the Company. Revenue generated from this channel partner arrangement totaled $0.9 million, $1.5 million and $0.3 million, for the years ended December 31, 2011, 2012 and 2013, respectively. As of December 31, 2012, total receivables due from this related party were $0.2 million and are included in accounts receivable in the accompanying consolidated balance sheets.
15. Subsequent Events
The Company has evaluated subsequent events that occurred after December 31, 2013 through July 2, 2014, the date on which the financial statements for the year ended December 31, 2013 were issued. There are no significant events that require disclosure in these financial statements, except as follows:
Stock Options
In February and March 2014, the compensation committee of the board of directors approved stock options under the Plan to purchase an aggregate of 659,250 shares of common stock at an exercise price of $5.68.
In June 2014, the compensation committee of the board of directors approved stock options under the Plan to purchase an aggregate of 1,986,250 shares of common stock at an exercise price of $6.63. The board also approved an increase to the option Plan for shares reserved for issuance to employees, directors and consultants by 2,400,000 shares.
New Debt Agreements
On February 28, 2014, the Company entered into an amendment to modify its Loan and Security Agreement. The amendment allowed the Company to invest up to $0.4 million per month, not to exceed $4.2 million a year, in its United Kingdom subsidiary. There was no modification to the maturity date, the borrowing capacity, or any other significant terms of the debt arrangement.
On June 12, 2014, the Company terminated the Loan and Security Agreement and entered into two debt arrangements with a new lender.
The first debt arrangement was a new loan and security agreement (the "New Loan and Security Agreement"). The New Loan and Security Agreement includes a revolving line of credit of potential maximum aggregate advances (the "New Revolving Line of Credit") totaling $30.0 million. The amount available is (a) the lesser of (i) the New Revolving Line of Credit or (ii) the amount available under the borrowing base (defined as eighty-five percent of eligible accounts receivable), minus (b) the outstanding principal balance of any advances. The New Revolving Line of Credit is secured by substantially all of the Company's assets. The New Revolving Line of Credit has a maturity date of June 12, 2016. The interest rate on outstanding amounts under the New Revolving Line of Credit is a floating rate per annum equal to the prime referenced rate plus an applicable margin of 1.00%. Interest is payable monthly. In addition, the Company is required to maintain at all
F-28
MaxPoint Interactive, Inc. and Subsidiary
Notes to Consolidated Financial Statements (continued)
For the years ended December 31, 2011, 2012 and 2013
times, $5.0 million, consisting of the sum of: (i) cash held at the lender (determined in accordance with the New Loan and Security Agreement); plus (ii) the unused availability amount; plus (iii) the undrawn portion of the term loan advance related to the Mezzanine Loan and Security Agreement, described below.
The second debt arrangement is a term loan and security agreement (the "Mezzanine Loan and Security Agreement"). This Mezzanine Loan and Security Agreement includes a term loan with a total commitment of $15.0 million comprised of two separate tranches. The first tranche of $10.0 million occurred at closing and the second tranche of $5.0 million is available at the Company's discretion through December 31, 2014. The loan is secured by substantially all of the Company's assets. The Mezzanine Loan and Security Agreement has a maturity date of June 12, 2017. The interest rate on outstanding amounts under the Mezzanine Loan and Security Agreement is fixed at 11.50%. Interest is payable monthly and the cumulative principal is due at maturity. Per the Mezzanine Loan and Security Agreement, the Company has issued warrants to the Lender to purchase 200,000 shares of common stock at a price of $5.68 per share. The Company is also required to issue additional warrants to purchase 100,000 shares of common stock at $5.68 per share, if the second tranche is utilized.
The proceeds from these new debt arrangements were used to pay off the existing debt under the original Loan and Security Agreement, in addition to providing additional working capital for general corporate purposes.
F-29
MaxPoint Interactive, Inc. and Subsidiary
Condensed Consolidated Balance Sheets
As of December 31, 2013 and September 30, 2014
(Unaudited)
(in
thousands, except share data)
| |
|
As of September 30, | ||||||||
|---|---|---|---|---|---|---|---|---|---|---|
| |
As of December 31, 2013 |
2014 | 2014 Pro forma | |||||||
Assets |
||||||||||
Current assets: |
||||||||||
Cash and cash equivalents |
$ | 8,805 | $ | 12,480 | $ | 12,480 | ||||
Accounts receivable, net |
24,233 | 29,443 | 29,443 | |||||||
Prepaid expenses and other current assets |
694 | 1,183 | 1,183 | |||||||
| | | | | | | | | | | |
Total current assets |
33,732 | 43,106 | 43,106 | |||||||
| | | | | | | | | | | |
Property, equipment and software, net |
5,418 | 8,773 | 8,773 | |||||||
Deferred offering costs |
— | 2,663 | 2,663 | |||||||
Restricted cash |
3,500 | — | — | |||||||
Other long-term assets |
100 | 160 | 160 | |||||||
| | | | | | | | | | | |
Total assets |
$ | 42,750 | $ | 54,702 | $ | 54,702 | ||||
| | | | | | | | | | | |
| | | | | | | | | | | |
Liabilities, Convertible preferred stock and Stockholders' (deficit) equity |
||||||||||
Current liabilities: |
||||||||||
Accounts payable |
$ | 9,292 | $ | 13,290 | $ | 13,290 | ||||
Accrued expenses and other current liabilities |
3,829 | 7,230 | 7,230 | |||||||
| | | | | | | | | | | |
Total current liabilities |
13,121 | 20,520 | 20,520 | |||||||
| | | | | | | | | | | |
Long-term debt, net |
17,761 | 30,862 | 30,862 | |||||||
Other long-term liabilities |
4 | 1,263 | 1,263 | |||||||
| | | | | | | | | | | |
Total liabilities |
30,886 | 52,645 | 52,645 | |||||||
| | | | | | | | | | | |
Commitments and contingencies (See Note 5) |
||||||||||
Convertible preferred stock: |
||||||||||
Convertible Series A preferred stock $0.00005 par value, 4,973,014 shares authorized, 4,767,492 issued and outstanding as of December 31, 2013 and September 30, 2014, no shares issued and outstanding pro forma; liquidation preference of $1,387 as of September 30, 2014 |
1,387 | 1,387 | — | |||||||
Convertible Series B preferred stock $0.00005 par value, 7,298,736 shares authorized, 7,298,736 issued and outstanding as of December 31, 2013 and September 30, 2014, no shares issued and outstanding pro forma; liquidation preference of $3,089 as of September 30, 2014 |
3,089 | 3,089 | — | |||||||
Convertible Series C preferred stock $0.00005 par value, 10,813,002 shares authorized, 10,813,002 issued and outstanding as of December 31, 2013 and September 30, 2014, no shares issued and outstanding pro forma; liquidation preference of $8,000 as of September 30, 2014 |
8,000 | 8,000 | — | |||||||
Convertible Series D preferred stock $0.00005 par value, 6,818,500 shares authorized, 6,818,420 issued and outstanding as of December 31, 2013 and September 30, 2014, no shares issued and outstanding pro forma; liquidation preference of $13,000 as of September 30, 2014 |
13,000 | 13,000 | — | |||||||
| | | | | | | | | | | |
Total convertible preferred stock |
25,476 | 25,476 | — | |||||||
| | | | | | | | | | | |
Stockholders' (deficit) equity: |
||||||||||
Common stock |
||||||||||
$0.00005 par value, 44,000,000 shares authorized, 7,521,310, 7,991,423 and 37,689,073 issued and outstanding as of December 31, 2013, September 30, 2014 and September 30, 2014 pro forma, respectively |
— | — | 2 | |||||||
Additional paid-in capital |
2,246 | 3,962 | 29,436 | |||||||
Accumulated other comprehensive loss |
— | (25 | ) | (25 | ) | |||||
Accumulated deficit |
(15,858 | ) | (27,356 | ) | (27,356 | ) | ||||
| | | | | | | | | | | |
Total stockholders' (deficit) equity |
(13,612 | ) | (23,419 | ) | 2,057 | |||||
| | | | | | | | | | | |
Total liabilities, convertible preferred stock and stockholders' (deficit) equity |
$ | 42,750 | $ | 54,702 | $ | 54,702 | ||||
| | | | | | | | | | | |
| | | | | | | | | | | |
The accompanying notes are an integral part of these financial statements.
F-30
MaxPoint Interactive, Inc. and Subsidiary
Condensed Consolidated Statements of Operations
Nine months ended September 30, 2013 and 2014
(Unaudited)
(in thousands, except share and per share data)
| |
Nine Months Ended September 30, |
||||||
|---|---|---|---|---|---|---|---|
| |
2013 | 2014 | |||||
Revenue, net (See Note 7) |
$ | 41,817 | $ | 67,864 | |||
Traffic acquisition costs |
17,160 | 27,552 | |||||
Other cost of revenue |
2,721 | 5,360 | |||||
| | | | | | | | |
Gross profit |
21,936 | 34,952 | |||||
Operating expenses: |
|||||||
Sales and marketing |
13,771 | 26,905 | |||||
Research and development |
6,014 | 10,102 | |||||
General and administrative |
3,342 | 8,440 | |||||
| | | | | | | | |
Total operating expenses |
23,127 | 45,447 | |||||
| | | | | | | | |
Loss from operations |
(1,191 | ) | (10,495 | ) | |||
Other expense (income): |
|||||||
Interest expense |
187 | 1,005 | |||||
Other expense (income) |
(2 | ) | (2 | ) | |||
| | | | | | | | |
Total other expense (income) |
185 | 1,003 | |||||
Loss before income taxes |
(1,376 | ) | (11,498 | ) | |||
| | | | | | | | |
Provision for income taxes |
— | — | |||||
| | | | | | | | |
Net loss |
$ | (1,376 | ) | $ | (11,498 | ) | |
| | | | | | | | |
| | | | | | | | |
Net loss per share of common stock: |
|||||||
Basic and diluted |
$ | (0.19 | ) | $ | (1.49 | ) | |
| | | | | | | | |
| | | | | | | | |
Pro forma: |
|||||||
Basic and diluted |
$ | (0.31 | ) | ||||
| | | | | | | | |
| | | | | | | | |
Weighted-average shares of common stock outstanding: |
|||||||
Basic and diluted |
7,398,718 | 7,737,968 | |||||
| | | | | | | | |
| | | | | | | | |
Pro forma: |
|||||||
Basic and diluted |
37,435,618 | ||||||
| | | | | | | | |
| | | | | | | | |
The accompanying notes are an integral part of these financial statements.
F-31
MaxPoint Interactive, Inc. and Subsidiary
Condensed Consolidated Statements of Comprehensive Loss
Nine months ended September 30, 2013 and 2014
(Unaudited)
(in thousands)
| |
Nine Months Ended September 30, |
||||||
|---|---|---|---|---|---|---|---|
| |
2013 | 2014 | |||||
Net loss |
$ | (1,376 | ) | $ | (11,498 | ) | |
Other comprehensive loss: |
|||||||
Foreign currency translation adjustments |
— | (25 | ) | ||||
| | | | | | | | |
Comprehensive loss |
$ | (1,376 | ) | $ | (11,523 | ) | |
| | | | | | | | |
| | | | | | | | |
The accompanying notes are an integral part of these financial statements.
F-32
MaxPoint Interactive, Inc. and Subsidiary
Condensed Consolidated Statement of Changes in Stockholders' Deficit
Nine months ended September 30, 2014
(Unaudited)
(in thousands, except share data)
| |
Common Stock | |
Accumulated Other Comprehensive Loss |
|
|
||||||||||||||
|---|---|---|---|---|---|---|---|---|---|---|---|---|---|---|---|---|---|---|---|
| |
Additional Paid-in Capital |
Accumulated Deficit |
Total Stockholders' Deficit |
||||||||||||||||
| |
Shares | Amount | |||||||||||||||||
Balance—January 1, 2014 |
7,521,310 | $ | — | $ | 2,246 | $ | — | $ | (15,858 | ) | $ | (13,612 | ) | ||||||
Exercise of stock options |
470,113 | — | 260 | — | — | 260 | |||||||||||||
Stock-based compensation expense |
— | — | 1,454 | — | — | 1,454 | |||||||||||||
Vesting of restricted stock subject to repurchase |
— | — | 2 | — | — | 2 | |||||||||||||
Foreign currency translation adjustments |
— | — | — | (25 | ) | — | (25 | ) | |||||||||||
Net loss |
— | — | — | — | (11,498 | ) | (11,498 | ) | |||||||||||
| | | | | | | | | | | | | | | | | | | | |
Balance—September 30, 2014 |
7,991,423 | $ | — | $ | 3,962 | $ | (25 | ) | $ | (27,356 | ) | $ | (23,419 | ) | |||||
| | | | | | | | | | | | | | | | | | | | |
| | | | | | | | | | | | | | | | | | | | |
The accompanying notes are an integral part of these financial statements.
F-33
MaxPoint Interactive, Inc. and Subsidiary
Condensed Consolidated Statements of Cash Flows
Nine months ended September 30, 2013 and 2014
(Unaudited)
(in
thousands)
| |
Nine Months Ended September 30, |
||||||
|---|---|---|---|---|---|---|---|
| |
2013 | 2014 | |||||
Cash flows from operating activities: |
|||||||
Net loss |
$ | (1,376 | ) | $ | (11,498 | ) | |
Adjustments to reconcile net loss to net cash used in operating activities: |
|||||||
Depreciation and amortization |
1,402 | 2,180 | |||||
Stock-based compensation |
408 | 1,454 | |||||
Change in fair value of warrants |
— | 71 | |||||
Bad debt expense |
200 | — | |||||
Amortization of deferred financing costs |
10 | 17 | |||||
Amortization of debt discount |
— | 92 | |||||
Changes in operating assets and liabilities: |
|||||||
Accounts receivable |
(2,611 | ) | (5,214 | ) | |||
Prepaid expenses and other current assets |
(14 | ) | (418 | ) | |||
Security deposits |
(16 | ) | (7 | ) | |||
Accounts payable |
(1,036 | ) | 2,775 | ||||
Accrued expenses and other current liabilities |
(286 | ) | 2,120 | ||||
Other long-term liabilities |
(3 | ) | 247 | ||||
| | | | | | | | |
Net cash used in operating activities |
(3,322 | ) | (8,181 | ) | |||
| | | | | | | | |
Cash flows from investing activities: |
|||||||
Purchases of property, equipment and software |
(1,264 | ) | (2,211 | ) | |||
Capitalized internal-use software costs |
(1,446 | ) | (2,857 | ) | |||
Changes to restricted cash |
(1,500 | ) | 3,500 | ||||
| | | | | | | | |
Net cash used in investing activities |
(4,210 | ) | (1,568 | ) | |||
| | | | | | | | |
Cash flows from financing activities: |
|||||||
Proceeds from debt |
35,302 | 45,129 | |||||
Repayment of debt |
(31,750 | ) | (31,177 | ) | |||
Proceeds from stock option exercises |
51 | 260 | |||||
Proceeds from unvested stock option exercises |
— | 57 | |||||
Issuance costs related to debt |
— | (146 | ) | ||||
Payments for deferred offering costs |
— | (683 | ) | ||||
| | | | | | | | |
Net cash provided by financing activities |
3,603 | 13,440 | |||||
| | | | | | | | |
Effect of exchange rate changes on cash and cash equivalents |
— | (16 | ) | ||||
Net (decrease) increase in cash and cash equivalents |
(3,929 | ) | 3,675 | ||||
Cash and cash equivalents at beginning of period |
9,831 | 8,805 | |||||
| | | | | | | | |
Cash and cash equivalents at end of period |
$ | 5,902 | $ | 12,480 | |||
| | | | | | | | |
| | | | | | | | |
Supplemental disclosures of other cash flow information: |
|||||||
Cash paid for interest |
$ | 185 | $ | 756 | |||
| | | | | | | | |
| | | | | | | | |
Supplemental disclosures of non-cash investing and financing activities: |
|||||||
Purchases of property, equipment and software included in accounts payable and accruals |
$ | 2 | $ | 506 | |||
| | | | | | | | |
| | | | | | | | |
Vesting of restricted stock subject to repurchase |
$ | 8 | $ | 2 | |||
| | | | | | | | |
| | | | | | | | |
Issuance of lender warrants allocated to debt discount |
$ | — | $ | 943 | |||
| | | | | | | | |
| | | | | | | | |
Deferred offering costs recorded in accounts payable and accrued expenses |
$ | — | $ | 1,980 | |||
| | | | | | | | |
| | | | | | | | |
The accompanying notes are an integral part of these financial statements.
F-34
MaxPoint Interactive, Inc. and Subsidiary
Notes to Condensed Consolidated Financial Statements
(Unaudited)
1. Description of Business
MaxPoint Interactive, Inc. (the "Company") was incorporated in September 2006 under the state laws of Delaware. The Company is a provider of a business intelligence and marketing automation solution. The Company's customers are located in the United States and consist primarily of enterprises with national brands in the consumer products, retail, automotive, healthcare, telecommunications and entertainment industries. The Company's MaxPoint Intelligence Platform predicts the most likely local buyers of a specific product at a particular retail location and then executes cross-channel digital marketing campaigns to reach these buyers on behalf of the Company's customers. The Company is headquartered in Morrisville, North Carolina and has offices across the United States and one in the United Kingdom.
2. Summary of Significant Accounting Policies
Principles of Consolidation
The condensed consolidated financial statements include the accounts of the Company and its wholly-owned subsidiary and have been prepared in accordance with accounting principles generally accepted in the United States of America ("GAAP"). All intercompany accounts and transactions have been eliminated in consolidation.
Interim Condensed Consolidated Financial Information
The accompanying condensed consolidated financial statements and footnotes have been prepared in accordance with GAAP as contained in the Financial Accounting Standards Board ("FASB") Accounting Standards Codification ("ASC") for interim financial information. In the opinion of management, the interim financial information includes all adjustments of a normal recurring nature necessary for a fair presentation of financial position, the results of operations, comprehensive loss, changes in stockholders' deficit and cash flows. The results of operations for the nine months ended September 30, 2014 are not necessarily indicative of the results for the full year or the results for any future periods. These condensed consolidated financial statements should be read in conjunction with the audited consolidated financial statements and related footnotes for the year ended December 31, 2013 appearing elsewhere in this prospectus.
Unaudited Pro Forma Presentation
Upon the consummation of a proposed Initial Public Offering ("IPO") of the Company's shares of common stock, subject to certain requirements, all of the outstanding shares of convertible preferred stock will automatically convert into shares of common stock. The pro forma condensed consolidated balance sheet data as of September 30, 2014 has been prepared assuming the conversion of the convertible preferred stock outstanding into 29,697,650 shares of common stock. The pro forma net loss per share for the nine months ended September 30, 2014 assumes the conversion of all outstanding shares of convertible preferred stock into an aggregate of 29,697,650 shares of common stock upon the completion of the IPO as of January 1, 2014.
The Company believes that the pro forma net loss per share disclosure provides material information to investors because the conversion of the convertible preferred stock into common stock is expected to occur upon the closing of the IPO and, therefore, the disclosure of pro forma net loss per share provides a measure of loss per share that is comparable to what will be reported as a public company.
F-35
MaxPoint Interactive, Inc. and Subsidiary
Notes to Condensed Consolidated Financial Statements (continued)
(Unaudited)
Deferred Offering Costs
Deferred offering costs consist of incremental costs directly attributable to the Company's proposed initial public offering of its common stock. Approximately $2.7 million of deferred offering costs are included on the Company's consolidated balance sheets as of September 30, 2014. There were no deferred offering costs included on the Company's consolidated balance sheets as of December 31, 2013. Upon completion of the initial public offering contemplated herein, these amounts will be offset against the proceeds of the offering. If the offering is terminated, the deferred offering costs will be expensed.
Use of Estimates
The preparation of financial statements in conformity with GAAP requires management to make estimates and assumptions that affect the reported amounts in the condensed consolidated financial statements and accompanying notes. On an ongoing basis, the Company evaluates its estimates, including those related to its allowance for doubtful accounts, the fair value of the Company's common stock and assumptions used for purposes of determining stock-based compensation, income taxes and related valuation allowances and the fair value of common stock warrants. The Company bases its estimates on its historical experience and on various other assumptions that it believes to be reasonable, the results of which form the basis for making judgments about the carrying value of assets and liabilities. Actual results could differ from those estimates.
Revenue Recognition
The Company generates revenue by delivering targeted advertising campaigns for customers through various channels, including display, mobile and video. The Company recognizes revenue when there is persuasive evidence of an arrangement, delivery has occurred or services have been provided, fees are fixed or determinable, and collection of fees is reasonably assured. Revenue arrangements are evidenced by a fully executed insertion order ("IO"). The IOs specify the delivery terms including the advertising format, the contracted number of advertising impressions to be delivered, the agreed upon rate for each delivered impression, generally on a cost-per-thousand basis, and the fixed period of time for delivery. The IOs typically have a term of less than three months and are cancellable at any time. The Company recognizes revenue in the period in which the impressions are served, limited to the contracted number of impressions as specified in the IO. The Company determines collectability by performing a credit evaluation for new customers and by monitoring its existing customers' accounts receivable balances. The Company does not typically receive upfront payments from its customers, and therefore, has an insignificant amount of deferred revenue.
In the normal course of business, the Company contracts either directly with advertisers or advertising agencies on behalf of their advertiser clients. The determination of whether revenue should be reported on a gross or net basis is based on an assessment of whether the Company is acting as the principal or an agent in the transaction. In determining whether the Company acts as the principal or an agent, the Company follows the accounting guidance for principal-agent considerations. While no one factor is determined to be individually conclusive, indicators that an entity is acting as a principal include if the Company (i) is the primary obligor in the arrangement; (ii) has certain inventory risk; (iii) has latitude in establishing pricing; (iv) adds meaningful value to the service; (v) has discretion in supplier selection; (vi) is involved in the determination of the service specifications; or (vii) has credit risk. The Company recognizes revenue on a gross basis
F-36
MaxPoint Interactive, Inc. and Subsidiary
Notes to Condensed Consolidated Financial Statements (continued)
(Unaudited)
primarily based on the Company's determination that it is subject to the risk of fluctuating costs from its media vendors, has latitude in establishing prices with its customers, has discretion in selecting media vendors when fulfilling a customer's advertising campaign, and has credit risks.
The Company may enter into multiple element arrangements for the delivery of more than one advertising placement to be delivered at the same time, or within close proximity of one another. When entering into an arrangement that includes multiple elements, the Company determines whether the arrangement should be divided into separate units of accounting and how the arrangement consideration should be measured and allocated among the separate units of accounting. An element qualifies as a separate unit of accounting when the delivered element has standalone value to the customer. The Company sells advertising placements on a standalone basis and thus has determined that each advertising placement in multiple element arrangements represents a separate unit of accounting.
The Company allocates arrangement consideration in multiple element arrangements at the inception of an arrangement to all deliverables based on the relative selling price method in accordance with the selling price hierarchy, which includes: (1) vendor-specific objective evidence ("VSOE"), if available; (2) third-party evidence ("TPE"), if VSOE is not available; and (3) best estimate of selling price ("BESP"), if neither VSOE nor TPE is available. The Company has been unable to establish VSOE or TPE, and therefore, uses BESP in its allocation of arrangement consideration. The Company determines BESP for its deliverables by considering a number of factors including, but not limited to, the price lists used by the Company's sales team in pricing negotiations, historical average and median pricing achieved in prior contractual customer arrangements and input from the Company's sales operation department regarding what it believes the deliverables could be sold for on a stand-alone basis. The Company allocates consideration based on the relative fair value of the advertising impressions and recognizes revenue as impressions are delivered, assuming all other revenue recognition criteria have been met.
Cost of Revenue
Traffic Acquisition Costs
Traffic acquisition costs consist of media costs for advertising impressions purchased from real-time bidding exchanges, which are expensed as incurred. The Company is billed by the advertising exchanges on a monthly basis for actual advertising impressions acquired.
Other Cost of Revenue
Other cost of revenue includes third-party data center and other advertisement-serving costs, depreciation of data center equipment, amortization of capitalized internal-use software cost for revenue-producing technologies, purchases of third-party data for specific marketing campaigns and salaries and related costs for the Company's personnel dedicated to executing the Company's advertising campaigns.
Research and Development
Research and development expenses include costs associated with the maintenance and ongoing development of the Company's technology, including compensation and employee benefits and allocated costs associated with the Company's engineering and research and development departments, as well as costs for contracted services and supplies.
F-37
MaxPoint Interactive, Inc. and Subsidiary
Notes to Condensed Consolidated Financial Statements (continued)
(Unaudited)
Concentration of Credit Risk
Financial instruments that potentially subject the Company to concentrations of credit risk consist principally of cash and accounts receivable. All of the Company's cash is held at financial institutions that management believes to be of high credit quality. The Company's cash accounts exceed federally insured limits. The Company has not experienced any losses on cash to date. To manage accounts receivable risk, the Company evaluates and monitors the creditworthiness of its customers.
As of December 31, 2013 and September 30, 2014, the Company did not have any customers or advertising agencies that individually comprised a significant concentration of its accounts receivable. For the nine months ended September 30, 2013 and 2014, the Company did not have any customers that individually comprised a significant concentration of its revenue.
Allowance for Doubtful Accounts
The Company extends credit to its customers without requiring collateral. Accounts receivable are stated at realizable value, net of an allowance for doubtful accounts. The Company utilizes the allowance method to provide for doubtful accounts based on management's evaluation of the collectability of amounts due. The Company's estimate is based on historical collection experience and the current status of accounts receivable. Historically, actual write-offs for uncollectible accounts have not significantly differed from the Company's estimates. At December 31, 2013 and September 30, 2014, the Company had reserved for $0.7 million and $0.4 million of its accounts receivable balance, respectively.
The following table presents the changes in the allowance for doubtful accounts for the nine months ended September 30 (in thousands):
| |
2013 | 2014 | |||||
|---|---|---|---|---|---|---|---|
Allowance for doubtful accounts: |
|||||||
Balance, beginning of period |
$ | 119 | $ | 716 | |||
Add: bad debt expense |
200 | — | |||||
Less: write-offs, net of recoveries |
(63 | ) | (300 | ) | |||
| | | | | | | | |
Balance, end of period |
$ | 256 | $ | 416 | |||
| | | | | | | | |
| | | | | | | | |
Warrants
In accordance with a term loan and security agreement (the "Mezzanine Loan and Security Agreement") entered into on June 12, 2014 and described in Note 3, the Company issued warrants to the lender to purchase 200,000 shares of common stock (the "Lender Warrants") at a price of $5.68 per share. The fair value of the warrants on the date of grant totaled approximately $0.9 million. This warrant liability was recorded as a reduction of long-term debt and an increase in other long-term liabilities in the consolidated balance sheets on the date of issuance. This debt discount will be amortized ratably to interest expense over the term of the Mezzanine Loan and Security Agreement. In addition, the warrant liability is remeasured to its fair value at the end of each reporting period until it is exercised or expires, and the related change in fair value is recorded in interest expense and other long-term liabilities. The Company recorded approximately $71,000 in interest expense for the nine months ended September 30, 2014 related to the fair value adjustment.
F-38
MaxPoint Interactive, Inc. and Subsidiary
Notes to Condensed Consolidated Financial Statements (continued)
(Unaudited)
Fair Value of Financial Instruments
The carrying amounts of certain of the Company's financial instruments, including cash and cash equivalents, accounts receivable, accounts payable and accrued expenses and other current liabilities, approximate their respective fair values due to their short term nature. The Company's debt contains either variable interest rates or fixed interest rates. The carrying value of the variable rate debt approximates fair value. The carrying value of fixed rate debt at September 30, 2014, as discounted with the Lender Warrants, approximates its fair value as there have been no significant changes in interest rates or the creditworthiness of the Company since the debt was incurred in June 2014. The fair value of debt falls within Level 3 of the fair value hierarchy as it is significantly driven by the creditworthiness of the Company, which is an unobservable input.
The Company uses a three-tier fair value hierarchy to classify and disclose all assets and liabilities measured at fair value on a recurring basis, as well as assets and liabilities measured at fair value on a non-recurring basis, in periods subsequent to their initial measurement. The hierarchy requires the Company to use observable inputs when available, and to minimize the use of unobservable inputs used to determine its fair value on a nonrecurring basis. The three tiers are defined as follows:
- •
- Level 1. Observable inputs
based on unadjusted quoted prices in active markets for identical assets or liabilities;
- •
- Level 2. Inputs, other than
quoted prices in active markets, that are observable either directly or indirectly; and
- •
- Level 3. Unobservable inputs for which there is little or no market data, which require the Company to develop its own assumptions.
The Company did not have any financial instruments that were measured at fair value on a recurring basis for the year ended December 31, 2013 or for the nine-month period ended September 30, 2013.
The following table set forth the Company's financial instruments that were measured at fair value on a recurring basis as of September 30, 2014, by level within the fair value hierarchy (in thousands):
| |
Fair Value | Level 1 | Level 2 | Level 3 | |||||||||
|---|---|---|---|---|---|---|---|---|---|---|---|---|---|
Liabilities: |
|||||||||||||
Lender Warrants |
$ | 1,014 | $ | — | $ | — | $ | 1,014 | |||||
The following table presents the changes in the Company's Level 3 instruments measured at fair value on a recurring basis during the nine months ended September 30 (in thousands):
| |
2014 | |||
|---|---|---|---|---|
Balance as of January 1 |
$ | — | ||
Issuance of Lender Warrants |
943 | |||
Change in fair value of Lender Warrant liability |
71 | |||
| | | | | |
Balance as of September 30 |
$ | 1,014 | ||
| | | | | |
| | | | | |
In order to determine the fair value of the Lender Warrants the Company used an option pricing model. The valuation requires the input of subjective assumptions, including the estimated
F-39
MaxPoint Interactive, Inc. and Subsidiary
Notes to Condensed Consolidated Financial Statements (continued)
(Unaudited)
enterprise fair value, risk-free interest rate and the expected stock price volatility. The risk-free interest rate assumption is based upon observed interest rates for constant maturity U.S. Treasury securities consistent with the term of the warrants. The expected stock price volatility assumption is based on historical volatilities for publicly traded stock of comparable companies over the term of the warrants.
The following table summarizes the assumptions used for estimating the fair value of the Lender Warrants as of September 30:
| |
2014 | |||
|---|---|---|---|---|
Risk-free interest rate |
2.49 | % | ||
Expected term (years) |
9.70 | |||
Expected volatility |
57 | % | ||
Dividend yield |
— | % | ||
Internal-Use Software Development Costs
The Company capitalizes certain costs associated with software developed for internal use, primarily consisting of direct labor costs associated with creating the software. Software development projects generally include three stages: the preliminary project stage (all costs are expensed as incurred); the application development stage (certain costs are capitalized and certain costs are expensed as incurred); and the post-implementation/operation stage (all costs are expensed as incurred). Costs capitalized in the application development stage primarily include costs of designing, coding, and testing the software. Capitalization of costs requires judgment in determining when a project has reached the application development stage and the period over which the Company expects to benefit from the use of that software. Once the software is placed in service, these capitalized costs are amortized using the straight-line method over the estimated useful life of the software.
Internal-use software development costs of $1.4 million and $2.9 million were capitalized during the nine months ended September 30, 2013 and 2014, respectively, and are included in property, equipment and software in the accompanying condensed consolidated balance sheets. Amortization expense related to the capitalized internal-use software was $0.6 million and $1.0 million for the nine months ended September 30, 2013 and 2014, respectively, and is primarily included in other cost of revenue and research and development expense in the accompanying condensed consolidated statements of operations. The net book value of capitalized internal-use software was $3.0 million and $4.9 million at December 31, 2013 and September 30, 2014, respectively.
Income Taxes
Income taxes are accounted for under the asset and liability method of accounting. Deferred tax assets and liabilities are recognized for the future tax consequences attributable to differences between the financial statement carrying amounts of existing assets and liabilities and their respective tax bases, as well as for operating loss and tax credit carryforwards. Deferred tax assets and liabilities are measured using enacted tax rates expected to apply to taxable income in the years in which those temporary differences are expected to be recovered or settled. The effect on deferred tax assets and liabilities of a change in tax rates is recognized in the results of operations in the period when enacted. The measurement of a deferred tax asset is reduced, if necessary, by a
F-40
MaxPoint Interactive, Inc. and Subsidiary
Notes to Condensed Consolidated Financial Statements (continued)
(Unaudited)
valuation allowance if it is more likely than not that some portion or all of the deferred tax asset will not be realized. The assessment of whether or not a valuation allowance is required often requires significant judgment, including the long-range forecast of future taxable income and the evaluation of tax planning initiatives. Adjustments to the deferred tax valuation allowances are made to earnings in the period when such assessments are made. Due to the historical losses from the Company's operations, a full valuation allowance on deferred tax assets has been recorded.
Stock-Based Compensation
The Company accounts for stock options granted to employees based on their estimated fair values on the date of grant. The fair value of each stock option granted is estimated using the Black-Scholes option pricing model. The stock-based compensation expense is recognized on a straight-line basis over the requisite service period, net of estimated forfeitures.
The Company accounts for stock options issued to non-employees based on the fair value of the awards determined using the Black-Scholes option pricing model. The measurement of stock-based compensation is subject to periodic adjustment as the underlying equity instruments vest. The stock-based compensation expense is recognized on a straight-line basis over the vesting schedule.
Basic and Diluted Loss per Common Share
The Company uses the two-class method to compute net loss per common share because the Company has issued securities, other than common stock, that contractually entitle the holders to participate in dividends and earnings of the Company. The two-class method requires earnings for the period to be allocated between common stock and participating securities based upon their respective rights to receive distributed and undistributed earnings. Each series of the Company's convertible preferred stock is entitled to participate in distributions, when and if declared by the board of directors, that are made to common stockholders, and as a result all are considered participating securities.
Under the two-class method, for periods with net income, basic net income per common share is computed by dividing the net income attributable to common stockholders by the weighted average number of shares of common stock outstanding during the period. Net income attributable to common stockholders is computed by subtracting from net income the portion of current period's earnings that the participating securities would have been entitled to receive pursuant to their dividend rights had all of the period's earnings been distributed. No such adjustment to earnings is made during periods with a net loss, as the holders of the participating securities have no obligation to fund losses. Diluted net loss per common share is computed under the two-class method by using the weighted average number of shares of common stock outstanding, plus, for periods with net income attributable to common stockholders, the potential effect of dilutive securities. In addition, the Company analyzes the potential dilutive effect of the outstanding participating securities under the if-converted method when calculating diluted earnings per share in which it is assumed that the outstanding participating securities convert into common stock at the beginning of the period. The Company reports the more dilutive of the approaches (two-class or if-converted) as its diluted net income per share during each reporting period. Due to net losses for the nine months ended September 30, 2013 and 2014, basic and diluted loss per share were the same, as the effect of potentially dilutive securities would have been anti-dilutive.
F-41
MaxPoint Interactive, Inc. and Subsidiary
Notes to Condensed Consolidated Financial Statements (continued)
(Unaudited)
Recently Adopted Accounting Pronouncements
In July 2013, the FASB issued ASU 2013-11, Presentation of an Unrecognized Tax Benefit When a Net Operating Loss Carryforward, a Similar Tax Loss, or a Tax Credit Carryforward Exists. This guidance provides financial statement presentation guidance on whether an unrecognized tax benefit must be presented as either a reduction to a deferred tax asset or separately as a liability. The Company adopted ASU 2013-11 effective January 1, 2014. The adoption of this pronouncement did not have a material impact on the Company's consolidated results of operations, financial position or liquidity.
Recent Accounting Pronouncements Not Yet Adopted
In May 2014, the FASB issued ASU 2014-09, Revenue from Contracts with Customers. This guidance states that an entity should recognize revenue to depict the transfer of promised goods or services to customers in an amount that reflects the consideration to which the entity expects to be entitled in exchange for those goods or services. ASU 2014-09 is effective for interim or annual periods beginning after December 15, 2016. The Company plans to adopt ASU 2014-09 as of January 1, 2017. Early adoption is not permitted. The Company is currently evaluating the impact of the adoption of this guidance on its consolidated results of operations, financial position and liquidity.
In August 2014, the FASB issued ASU 2014-15, Presentation of Financial Statements—Going Concern. This guidance addresses management's responsibility to evaluate whether there is substantial doubt about an entity's ability to continue as a going concern and to provide related footnote disclosures. Management's evaluation should be based on relevant conditions and events that are known and reasonably knowable at the date that the financial statements are issued. ASU 2014-15 is effective for interim or annual periods beginning after December 15, 2016. Early adoption is permitted. The Company does not expect to early adopt this guidance and is currently evaluating the impact of the adoption of this guidance on its consolidated results of operations, financial position and liquidity.
3. Debt
On February 28, 2014, the Company entered into a debt amendment with its lender to modify the terms of the debt arrangement. The modification allows the Company to invest up to $0.4 million per month, not to exceed $4.2 million a year, in its United Kingdom subsidiary. There was no modification to the maturity date, the borrowing capacity, or any other significant terms of the debt arrangement.
On June 12, 2014, the Company terminated the debt arrangement and entered into two debt arrangements with a new lender.
The first debt arrangement is a new loan and security agreement (the "Loan and Security Agreement"). The Loan and Security Agreement includes a revolving line of credit of potential maximum aggregate advances (the "Revolving Line of Credit") totaling $30.0 million. The amount available is (a) the lesser of (i) the Revolving Line of Credit or (ii) the amount available under the borrowing base (defined as eighty-five percent of eligible accounts receivable), minus (b) the outstanding principal balance of any advances. The amount available as of September 30, 2014 was $0.1 million. The Revolving Line of Credit is secured by substantially all of the Company's assets. The Revolving Line of Credit has a maturity date of June 12, 2016. The interest rate on outstanding amounts under the Revolving Line of Credit is a floating rate per annum equal to the
F-42
MaxPoint Interactive, Inc. and Subsidiary
Notes to Condensed Consolidated Financial Statements (continued)
(Unaudited)
prime referenced rate plus a potential maximum margin of 1.00%. Interest is payable monthly. In addition, the Company is required to maintain at all times, $5.0 million, consisting of the sum of: (i) cash held at the lender (determined in accordance with the Loan and Security Agreement); plus (ii) the unused availability amount; plus (iii) the undrawn portion of the term loan advance related to the Mezzanine Loan and Security Agreement, described below. As of September 30, 2014, the Company was in compliance with this requirement.
The second debt arrangement is a term loan and security agreement (the "Mezzanine Loan and Security Agreement"). This Mezzanine Loan and Security Agreement includes a term loan with a total commitment of $15.0 million comprised of two separate tranches. The first tranche of $10.0 million occurred at closing and the second tranche of $5.0 million is available at the Company's discretion through December 31, 2014. The loan is secured by substantially all of the Company's assets. The Mezzanine Loan and Security Agreement has a maturity date of June 12, 2017. The interest rate on outstanding amounts under the Mezzanine Loan and Security Agreement is fixed at 11.50%. Interest is payable monthly and the cumulative principal is due at maturity. As described in Note 2, under the Mezzanine Loan and Security Agreement, the Company has issued Lender Warrants to purchase 200,000 shares of common stock at a price of $5.68 per share. The Company is also required to issue additional warrants to purchase 100,000 shares of common stock at $5.68 per share, if the second tranche of $5.0 million is utilized.
The proceeds from these new debt arrangements were used to pay off the existing debt, in addition to providing additional working capital for general corporate purposes.
Under the terms of the Loan and Security Agreement, the Company is required to meet and maintain certain customary financial and nonfinancial covenants, one of which restricts the Company's ability to pay dividends or make any distribution or payment to redeem, retire or purchase any capital stock, subject to certain specified exceptions. In addition, the Company must maintain with the lender all of its primary domestic operating and other deposit and investment accounts consisting of at least ninety-five percent of the Company's total cash and cash equivalents balance. As of September 30, 2014, the Company was in compliance with all such covenants.
As of December 31, 2013, the Company has excluded the required payments due within the next twelve months under the debt agreement from current liabilities because the Company refinanced the obligations on a long-term basis.
Debt consisted of the following as of December 31, 2013 and September 30, 2014 (in thousands):
| |
2013 | 2014 | |||||
|---|---|---|---|---|---|---|---|
Mezzanine loan and security agreement |
$ | — | $ | 10,000 | |||
Discount on mezzanine loan and security agreement |
— | (851 | ) | ||||
Loan and security agreement |
— | 21,713 | |||||
Revolving line of credit |
16,529 | — | |||||
Equipment line of credit |
1,232 | — | |||||
| | | | | | | | |
Long-term debt, net |
$ | 17,761 | $ | 30,862 | |||
| | | | | | | | |
| | | | | | | | |
4. Stock-Based Compensation
During 2010, the Company adopted the 2010 Equity Incentive Plan (the "Plan"), pursuant to which the Company has reserved 8,575,736 shares for issuance to employees, directors and
F-43
MaxPoint Interactive, Inc. and Subsidiary
Notes to Condensed Consolidated Financial Statements (continued)
(Unaudited)
consultants. Of this amount, 974,894 shares are available for future stock option grants as of September 30, 2014.
The terms of the stock options, including the exercise price per share and vesting provisions, are determined by the board of directors. Stock options are granted at exercise prices not less than the estimated fair market value of the Company's common stock at the date of grant based upon numerous objective and subjective factors including: third-party valuations, preferred stock transactions with third-parties, current operating and financial performance, management estimates and future expectations. Stock option grants typically vest upon the expiration of an initial one year cliff and vest monthly thereafter over the remaining thirty-six months assuming continuing service, and expire ten years from the grant date.
The Plan allows for the granting of stock options that may be exercised before the options have vested at the discretion and determination of the board of directors. Restricted shares issued as a result of the early exercise of stock options are subject to repurchase by the Company upon termination of service. As of December 31, 2013 and September 30, 2014, there were 12,916 and 10,583, respectively, of shares subject to the Company's right of repurchase. Payments received from early exercises are recorded in accrued expenses and other current liabilities on the condensed consolidated balance sheets and reclassified to stockholders' deficit as the options vest.
Stock-based compensation expense is included in the following line items in the accompanying condensed consolidated statements of operations for the nine months ended September 30 (in thousands):
| |
2013 | 2014 | |||||
|---|---|---|---|---|---|---|---|
Other cost of revenue |
$ | 4 | $ | 11 | |||
Sales and marketing |
152 | 331 | |||||
Research and development |
188 | 461 | |||||
General and administrative |
64 | 651 | |||||
| | | | | | | | |
|
$ | 408 | $ | 1,454 | |||
| | | | | | | | |
| | | | | | | | |
The Company values stock options using the Black-Scholes option-pricing model, which requires the input of subjective assumptions, including the risk-free interest rate, expected life, expected stock price volatility and dividend yield. The risk-free interest rate assumption is based upon observed interest rates for constant maturity U.S. Treasury securities consistent with the expected term of the Company's employee stock options. The expected life represents the period of time the stock options are expected to be outstanding and is based on the simplified method. The Company uses the simplified method due to the lack of sufficient historical exercise data to provide a reasonable basis upon which to otherwise estimate the expected life of the stock options. Expected volatility is based on historical volatilities for publicly traded stock of comparable companies over the estimated expected life of the stock options. The Company assumes no dividend yield because dividends are not expected to be paid in the near future, which is consistent with the Company's history of not paying dividends.
F-44
MaxPoint Interactive, Inc. and Subsidiary
Notes to Condensed Consolidated Financial Statements (continued)
(Unaudited)
The following table summarizes the assumptions used for estimating the fair value of stock options granted to employees for the nine months ended September 30:
| |
2013 | 2014 | ||
|---|---|---|---|---|
Risk-free interest rate |
0.94% - 2.05% | 1.32% - 2.04% | ||
Expected term (years) |
6.08 | 4.00 - 6.08 | ||
Expected volatility |
59% - 60% | 50% - 60% | ||
Dividend yield |
—% | — % |
The following summarizes the stock option activity for the nine months ended September 30, 2014:
| |
Number of Options |
Weighted Average Exercise Price |
Weighted Average Remaining Contractual Term |
Aggregate Intrinsic Value |
|||||||||
|---|---|---|---|---|---|---|---|---|---|---|---|---|---|
| |
|
|
(in years) |
(in thousands) |
|||||||||
Outstanding balance at January 1, 2014 |
4,748,490 | $ | 1.05 | 8.26 | $ | 17,016 | |||||||
Granted |
2,717,500 | 6.41 | |||||||||||
Exercised |
(470,113 | ) | 0.65 | ||||||||||
Cancelled |
(299,926 | ) | 1.51 | ||||||||||
| | | | | | | | | | | | | | |
Outstanding balance at September 30, 2014 |
6,695,951 | $ | 3.23 | 8.39 | $ | 26,056 | |||||||
| | | | | | | | | | | | | | |
| | | | | | | | | | | | | | |
Exercisable at September 30, 2014 |
2,968,650 | $ | 1.40 | 7.47 | $ | 16,977 | |||||||
| | | | | | | | | | | | | | |
| | | | | | | | | | | | | | |
Vested and expected to vest at September 30, 2014 |
5,675,420 | $ | 3.15 | 8.31 | $ | 22,529 | |||||||
| | | | | | | | | | | | | | |
| | | | | | | | | | | | | | |
The weighted average grant date fair value for the Company's stock options granted during the nine months ended September 30, 2013 and 2014 was $1.17 and $3.44 per share, respectively. The total compensation cost related to nonvested stock options not yet recognized as of September 30, 2014 was $9.9 million and will be recognized over a weighted average period of approximately 2.45 years. The aggregate intrinsic value of stock options exercised during the nine months ended September 30, 2013 and 2014 was $0.2 million and $2.7 million, respectively.
5. Commitments and Contingencies
Purchase Commitments
The Company has $3.1 million of non-cancelable contractual commitments as of September 30, 2014, primarily related to third-party data centers and other support services. Of these commitments, $2.2 million and $0.9 million are due within the next year and within one to three years, respectively.
Litigation
The Company is subject to various legal matters in the ordinary course of business. In the opinion of management, there are currently no such known matters that will have a material effect on the financial condition, results of operations or cash flows of the Company.
F-45
MaxPoint Interactive, Inc. and Subsidiary
Notes to Condensed Consolidated Financial Statements (continued)
(Unaudited)
Indemnification Agreements
In the ordinary course of business, the Company may provide indemnifications of varying scope and terms to customers, vendors, lessors, business partners and other parties with respect to certain matters, including, but not limited to, losses arising out of breach of such agreements, services to be provided by the Company or from intellectual property infringement claims made by third parties. In addition, the Company has entered into indemnification agreements with directors and certain officers and employees that will require the Company, among other things, to indemnify them against certain liabilities that may arise by reason of their status or service as directors, officers or employees. No demands have been made upon the Company to provide indemnification under such agreements, and thus there are no claims that the Company is aware of that could have a material effect on the Company's financial position, results of operations or cash flows.
6. Net Loss Per Share
Diluted net loss per share is the same as basic net loss per share for the nine months ended September 30, 2013 and 2014 because the effects of potentially dilutive items were anti-dilutive, given the Company's net losses during these periods. The following securities have been excluded from the calculation of diluted weighted average common shares outstanding because the effect is anti-dilutive for the nine months ended September 30:
| |
2013 | 2014 | |||||
|---|---|---|---|---|---|---|---|
Convertible preferred stock: |
|||||||
Series A |
4,767,492 | 4,767,492 | |||||
Series B |
7,298,736 | 7,298,736 | |||||
Series C |
10,813,002 | 10,813,002 | |||||
Series D |
6,818,420 | 6,818,420 | |||||
Common stock subject to repurchase |
19,541 | 10,583 | |||||
Lender Warrants to purchase common stock |
— | 200,000 | |||||
Stock options |
4,645,753 | 6,695,951 | |||||
Pro Forma Net Loss Per Share
The denominator used in computing pro forma net loss per share for the nine months ended September 30, 2014 has been adjusted to assume the conversion of all outstanding shares of convertible Preferred Stock into common stock as of the beginning of the period or at the time of issuance, if later.
F-46
MaxPoint Interactive, Inc. and Subsidiary
Notes to Condensed Consolidated Financial Statements (continued)
(Unaudited)
The following table presents the calculation of pro forma basic and diluted net loss per share (in thousands, except share and per share data) for the nine months ended September 30, 2014:
Numerator: |
||||
Net loss |
$ | (11,498 | ) | |
Pro forma numerator for basic and diluted net loss per share |
$ | (11,498 | ) | |
| | | | | |
| | | | | |
Denominator: |
||||
Denominator for basic net loss per share—weighted average shares |
7,737,968 | |||
Plus: conversion of convertible preferred stock to common stock |
29,697,650 | |||
| | | | | |
Pro forma denominator for basic and diluted net loss per share |
37,435,618 | |||
| | | | | |
| | | | | |
Pro forma basic and diluted net loss per share |
$ | (0.31 | ) | |
| | | | | |
| | | | | |
7. Related Parties
One of the Company's channel partners was an investor during the nine months ended September 30, 2013. Revenue generated from this channel partner arrangement totaled $0.3 million for the nine months ended September 30, 2013. This channel partner was no longer a related party as of September 30, 2013.
8. Subsequent Events
Subsequent events have been evaluated for recognition purposes through December 10, 2014, the date the condensed consolidated financial statements were originally available to be issued, and further updated for disclosure purposes through the reissuance date of February 3, 2015. There are no significant events that require disclosure in these financial statements, except as follows:
Subsequent to September 30, 2014, the Company has granted a total of 990,850 shares of common stock issuable upon the exercise of options under our 2010 Equity Incentive Plan, with a weighted average exercise price of $7.27 per share. In addition, the Company reserved an additional 500,000 shares of common stock for issuance to employees, directors and consultants pursuant to the 2010 Equity Incentive Plan.
On December 16, 2014 the Company drew down the second tranche of the Mezzanine Loan and Security Agreement, as described in Note 3, in the amount of $5.0 million. The Company issued additional Lender Warrants to purchase 100,000 shares of common stock at $5.68 per share as part of this funding. Subsequent to the utilization of the second tranche, the Company had no additional availability per the terms of the Mezzanine Loan and Security Agreement. In addition, the Company is required to maintain at all times, $5.0 million, consisting of the sum of: (i) cash held at the lender (determined in accordance with the Loan and Security Agreement); plus (ii) the unused availability amount; plus (iii) the undrawn portion of the term loan advance related to the Mezzanine Loan and Security Agreement.
F-47
Shares
Common Stock
| Goldman, Sachs & Co. | Deutsche Bank Securities | Pacific Crest Securities | ||
Needham & Company |
William Blair |
PART II
INFORMATION NOT REQUIRED IN PROSPECTUS
Item 13. Other Expenses of Issuance and Distribution
The following table presents the costs and expenses, other than underwriting discount and commissions, payable in connection with this offering. All amounts are estimates except the SEC registration fee, the FINRA filing fee and the New York Stock Exchange listing fee. Except as otherwise noted, all the expenses below will be paid by us.
SEC registration fee |
* | |||
FINRA filing fee |
* | |||
NYSE listing fee |
* | |||
Printing and engraving expenses |
* | |||
Legal fees and expenses |
* | |||
Accounting fees and expenses |
* | |||
Blue sky fees and expenses |
* | |||
Transfer agent and registrar fees |
* | |||
Miscellaneous fees and expenses |
* | |||
| | | | | |
Total |
* | |||
| | | | | |
| | | | | |
- *
- To be completed by amendment.
Item 14. Indemnification of Directors and Officers
Section 145 of the Delaware General Corporation Law authorizes a court to award, or a corporation's board of directors to grant, indemnity to directors and officers under certain circumstances and subject to certain limitations. The terms of Section 145 of the Delaware General Corporation Law are sufficiently broad to permit indemnification under certain circumstances for liabilities, including reimbursement of expenses incurred, arising under the Securities Act of 1933, as amended (Securities Act).
As permitted by the Delaware General Corporation Law, our amended and restated certificate of incorporation and amended and restated bylaws contain provisions relating to the limitation of liability and indemnification of directors and officers. The amended and restated certificate of incorporation provides that our directors will not be personally liable to us or our stockholders for monetary damages for any breach of fiduciary duty as a director, except for liability:
- •
- for any breach of the director's duty of loyalty to us or our stockholders;
- •
- for acts or omissions not in good faith or that involve intentional misconduct or a knowing violation of law;
- •
- in respect of unlawful payments of dividends or unlawful stock repurchases or redemptions as provided in
Section 174 of the Delaware General Corporation Law; or
- •
- for any transaction from which the director derives any improper personal benefit.
Our amended and restated certificate of incorporation also provides that if Delaware law is amended after the approval by our stockholders of the certificate of incorporation to authorize corporate action further eliminating or limiting the personal liability of directors, then the liability of our directors will be eliminated or limited to the fullest extent permitted by Delaware law.
Our amended and restated bylaws provide that we will indemnify our directors and officers to the fullest extent permitted by Delaware law, as it now exists or may in the future be amended, against all expenses and liabilities reasonably incurred in connection with their service for or on our
II-1
behalf. Our amended and restated bylaws provide that we shall advance the expenses incurred by a director or officer in advance of the final disposition of an action or proceeding, and permit us to secure insurance on behalf of any director, officer, employee, or other enterprise agent for any liability arising out of his or her action in that capacity, whether or not Delaware law would otherwise permit indemnification.
We intend to enter, into indemnification agreements with each of our directors and executive officers and certain other key employees, a form of which is attached as Exhibit 10.1. The form of agreement provides that we will indemnify each of our directors, executive officers and such other key employees against any and all expenses incurred by that director, executive officer, or other key employee because of his or her status as one of our directors, executive officers, or other key employees, to the fullest extent permitted by Delaware law, our amended and restated certificate of incorporation and our amended and restated bylaws. In addition, the form agreement provides that, to the fullest extent permitted by Delaware law, we will advance all expenses incurred by our directors, executive officers and other key employees in connection with a legal proceeding.
Reference is made to the underwriting agreement contained in Exhibit 1.1 to this registration statement, indemnifying our directors and officers against limited liabilities. In addition, Section 2.9 of our amended and restated investors' rights agreement (IRA) contained in Exhibit 4.2 to this registration statement provides for indemnification of certain of our stockholders against liabilities described in our IRA.
We currently carry and intend to continue to carry liability insurance for our directors and officers.
Item 15. Recent Sales of Unregistered Securities
The following sets forth information regarding all unregistered securities sold from January 1, 2012 to December 31, 2014 giving effect to a 2-for-1 forward stock split, which occurred on October 3, 2012:
From January 2012 to March 2012, we issued 2,694 shares of our convertible Series A preferred stock, in exchange for the cancellation of warrants for an equivalent number of shares of convertible Series A preferred stock.
We have issued warrants to purchase 300,000 shares of our common stock at a per share price of $5.68 to the lender in connection with our credit facilities.
We have granted options to purchase 6,645,659 shares of our common stock to service providers under the 2010 Equity Incentive Plan, with per share exercise prices ranging from $0.76 to $7.12.
We have issued 1,219,951 shares of our common stock upon the exercise of options issued under the 2010 Equity Incentive Plan for an aggregate consideration of $765,734.17, at exercise prices ranging from $0.17 to $5.68.
None of the foregoing transactions involved any underwriters, underwriting discount or commissions, or any public offering. The Registrant believes that each transaction was exempt from the registration requirements of the Securities Act in reliance upon either Section 4(a)(2) of the Securities Act or Regulation D promulgated thereunder as transactions by an issuer not involving any public offering or Rule 701 promulgated under Section 3(b) of the Securities Act pursuant to benefit plans and contracts relating to compensation as provided under Rule 701. The recipients of the securities in each of these transactions represented their intentions to acquire the securities for investment only and not with a view to or for sale in connection with any distribution thereof, and appropriate legends were placed upon the stock certificates issued in these transactions. All
II-2
recipients had adequate information about us or had adequate access, through their relationships with us, to information about us.
Item 16. Exhibits and Financial Statement Schedules
(a) Exhibits. We have filed the exhibits listed on the accompanying Index to Exhibits, which is incorporated herein by reference.
(b) Financial Statement Schedules. All schedules have been omitted because the information required to be presented in them is not applicable or is shown in the financial statements or related notes, which is incorporated herein by reference.
The undersigned registrant hereby undertakes to provide to the underwriter at the closing specified in the underwriting agreements certificates in such denominations and registered in such names as required by the underwriter to permit prompt delivery to each purchaser.
Insofar as indemnification for liabilities arising under the Securities Act of 1933 may be permitted to directors, officers and controlling persons of the registrant pursuant to the foregoing provisions, or otherwise, the registrant has been advised that in the opinion of the Securities and Exchange Commission such indemnification is against public policy as expressed in the Act and is, therefore, unenforceable. In the event that a claim for indemnification against such liabilities (other than the payment by the registrant of expenses incurred or paid by a director, officer or controlling person of the registrant in the successful defense of any action, suit or proceeding) is asserted by such director, officer or controlling person in connection with the securities being registered, the registrant will, unless in the opinion of its counsel the matter has been settled by controlling precedent, submit to a court of appropriate jurisdiction the question whether such indemnification by it is against public policy as expressed in the Act and will be governed by the final adjudication of such issue.
The undersigned registrant hereby undertakes that:
(1) For purposes of determining any liability under the Securities Act of 1933, the information omitted from the form of prospectus filed as part of this registration statement in reliance upon Rule 430A and contained in a form of prospectus filed by the registrant pursuant to Rule 424(b)(1) or (4) or 497(h) under the Securities Act shall be deemed to be part of this registration statement as of the time it was declared effective.
(2) For the purpose of determining any liability under the Securities Act of 1933, each post-effective amendment that contains a form of prospectus shall be deemed to be a new registration statement relating to the securities offered therein, and the offering of such securities at that time shall be deemed to be the initial bona fide offering thereof.
II-3
Pursuant to the requirements of the Securities Act of 1933, the registrant has duly caused this Registration Statement to be signed on its behalf by the undersigned, thereunto duly authorized, in the City of Morrisville, State of North Carolina, on this 3rd day of February, 2015.
| MAXPOINT INTERACTIVE, INC. | ||||||
By: |
/s/ JOSEPH EPPERSON |
|||||
| Name: | Joseph Epperson | |||||
| Title: | President and Chief Executive Officer | |||||
KNOW ALL PERSONS BY THESE PRESENTS, that each person whose signature appears below hereby constitutes and appoints Joseph Epperson and Brad Schomber, and each of them, as his or her true and lawful attorney-in-fact and agent with full power of substitution, for him or her in any and all capacities, to sign any and all amendments to this registration statement (including post-effective amendments) and any registration statement related thereto filed pursuant to Rule 462(b) increasing the number of securities for which registration is sought, and to file the same, with all exhibits thereto and other documents in connection therewith, with the SEC, granting unto said attorney-in-fact and agent full power and authority to do and perform each and every act and thing requisite and necessary to be done in connection therewith, as fully for all intents and purposes as he or she might or could do in person, hereby ratifying and confirming all that said attorney-in-fact and agent, or his or her substitute, may lawfully do or cause to be done by virtue hereof.
Pursuant to the requirements of the Securities Act of 1933, as amended, this Registration Statement has been signed by the following persons in the capacities and on the dates indicated.
Signature
|
Title
|
Date
|
|||
|---|---|---|---|---|---|
| /s/ JOSEPH EPPERSON Joseph Epperson |
President, Chief Executive Officer and Chairman (Principal Executive Officer) |
February 3, 2015 | |||
/s/ BRAD SCHOMBER Brad Schomber |
Chief Financial Officer (Principal Financial and Accounting Officer) |
February 3, 2015 |
|||
/s/ KEVIN DULSKY Kevin Dulsky |
Director |
February 3, 2015 |
|||
/s/ LYNNETTE FRANK Lynnette Frank |
Director |
February 3, 2015 |
|||
/s/ LEN JORDAN Len Jordan |
Director |
February 3, 2015 |
|||
/s/ AUGUSTUS TAI Augustus Tai |
Director |
February 3, 2015 |
II-4
| Exhibit No. | Description | ||
|---|---|---|---|
| 1.1 | * | Form of Underwriting Agreement. | |
3.1 |
Seventh Amended and Restated Certificate of Incorporation of Registrant. |
||
3.2 |
* |
Form of Amended and Restated Certificate of Incorporation of Registrant, to be effective upon completion of this offering. |
|
3.3 |
Second Amended and Restated Bylaws of Registrant, as amended. |
||
3.4 |
* |
Form of Amended and Restated Bylaws of Registrant, to be effective upon completion of this offering. |
|
4.1 |
* |
Form of Registrant's common stock certificate. |
|
4.2 |
Amended and Restated Investors' Rights Agreement, dated December 12, 2011, by and among the Registrant and the parties thereto. |
||
4.3 |
Form of Warrant to Purchase Common Stock |
||
5.1 |
* |
Opinion of Gunderson Dettmer Stough Villeneuve Franklin & Hachigian, LLP. |
|
10.1 |
* |
Form of Indemnification Agreement between the Registrant and each of its directors and executive officers. |
|
10.2 |
2010 Equity Incentive Plan and forms of agreements thereunder. |
||
10.3 |
* |
2015 Equity Incentive Plan and forms of agreements thereunder. |
|
10.4 |
* |
2015 Employee Stock Purchase Plan and forms of agreements thereunder. |
|
10.5 |
Office Lease, dated May 6, 2013, by and among the Registrant and the party thereto, as amended on January 7, 2014 and January 23, 2015. |
||
10.6 |
Loan and Security Agreement, dated June 12, 2014, between the Registrant and Silicon Valley Bank. |
||
10.7 |
Mezzanine Loan and Security Agreement, dated June 12, 2014, between the Registrant and Silicon Valley Bank. |
||
10.9 |
* |
Management Cash Incentive Bonus Plan. |
|
10.10 |
* |
Change in Control Equity Acceleration Policy. |
|
21.1 |
List of Subsidiaries of Registrant. |
||
23.1 |
Consent of Deloitte & Touche LLP, Independent Registered Public Accounting Firm. |
||
23.2 |
* |
Consent of Gunderson Dettmer Stough Villeneuve Franklin & Hachigian, LLP (contained in Exhibit 5.1). |
|
24.1 |
Power of Attorney (contained in the signature page to this registration statement). |
||
- *
- To be filed by amendment.
II-5