Attached files
| file | filename |
|---|---|
| 8-K - SOUTHWEST IOWA RENEWABLE ENERGY, LLC 8-K 1-30-2015 - SOUTHWEST IOWA RENEWABLE ENERGY, LLC | form8k.htm |
Exhibit 99.1

2015 Annual MeetingFiscal year 2014 in review
This presentation contains certain forward-looking statements within the meaning of the Private Securities Litigation Reform Act of 1995. Such statements are made in good faith by Southwest Iowa Renewable Energy, LLC (“SIRE,” “us” or “we”) and are identified by including terms such as “may,” “will,” “should,” “expects,” “anticipates,” “estimates,” “plans,” or similar language. In connection with these safe-harbor provisions, SIRE has identified in its registration statement on Form 10-K, and in its other filings with the SEC, important factors that could cause actual results to differ materially from those contained in any forward-looking statement made by or on behalf of SIRE, including, without limitation, the risk and nature of our business and the effects of general economic conditions on us. We may experience significant fluctuations in future operating results due to a number of economic conditions, including, but not limited to, competition in the ethanol industry, commodity market risks, financial market risks, counter-party risks, and risks associated with changes to federal policy or regulation. The cautionary statements in this presentation expressly qualify all of SIRE’s forward-looking statements. The forward-looking statements contained in this presentation are included in the safe harbor protection provided by Section 27A of the Securities Act of 1933. SIRE further cautions that such factors are not exhaustive or exclusive. SIRE does not undertake to update any forward-looking statement which may be made from time to time by or on behalf of SIRE unless an update is required by applicable securities laws. Forward-Looking Statements and Disclaimer

Hubert houser lifetime champion of renewable fuelsaward

Sire leadership team

Focus for 2014 Debt Refinance Operate SafelyOperate ProfitablyManage RiskOperate Plant at High Volume When Margins Allow Continue Retiring Debt QuicklyPlan for 2015 thru 2020
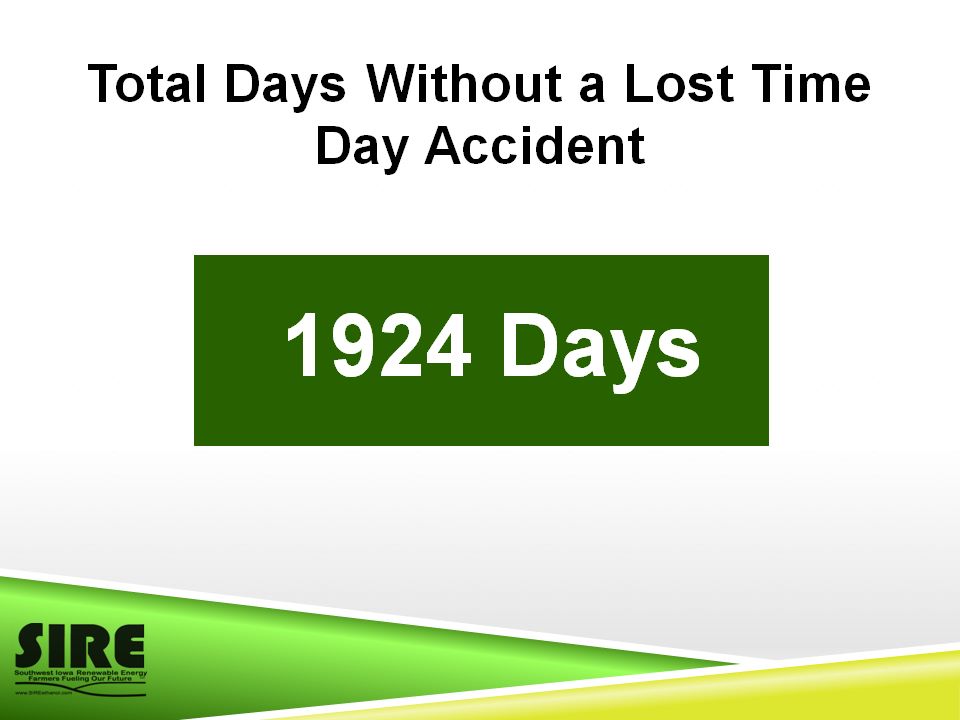
Total Days Without a Lost Time Day Accident


Annual Net Income (Loss)In Millions $ 9/30/2011 9/30/2012 9/30/2013 9/30/2014
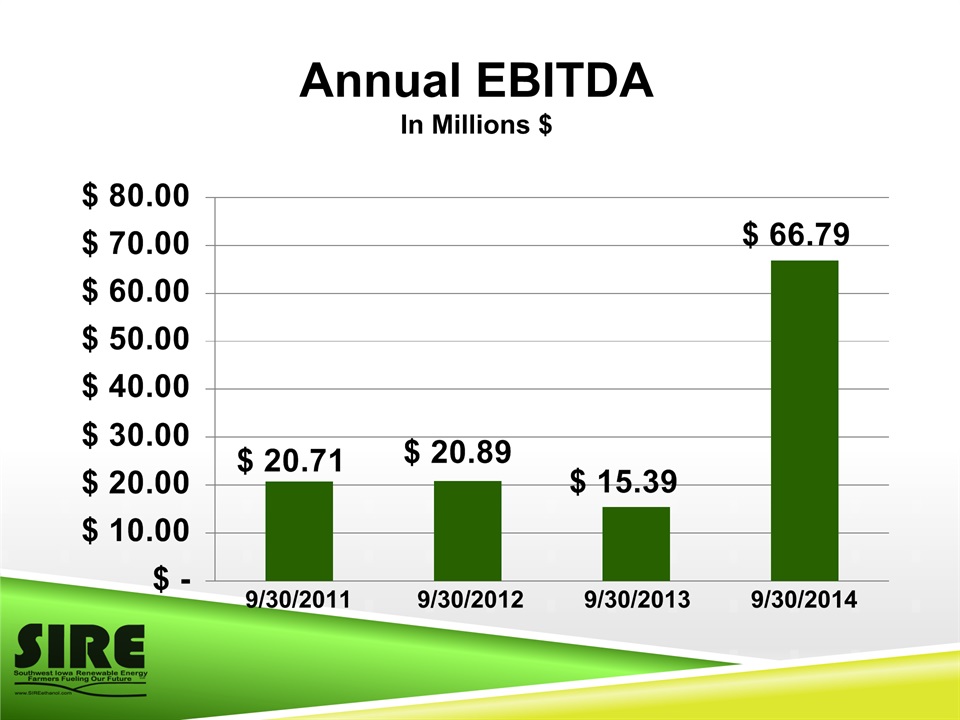
Annual EBITDA In Millions $ 9/30/2011 9/30/2012 9/30/2013 9/30/2014

Annual Ethanol ProductionIn Millions of Gallons 9/30/11 9/30/12 9/30/13 9/30/14

Bank and Sub Debt year ending 9/30In Millions $ 2009 2010 2011 2012 2013 2014*Subdebt Paid in Full – 12/22/2014

Book Value per Shareyear ending 9/30Per Unit 2009 2010 2011 2012 2013 2014

CO2 plant

GRAIN BIN CONSTRUCTION
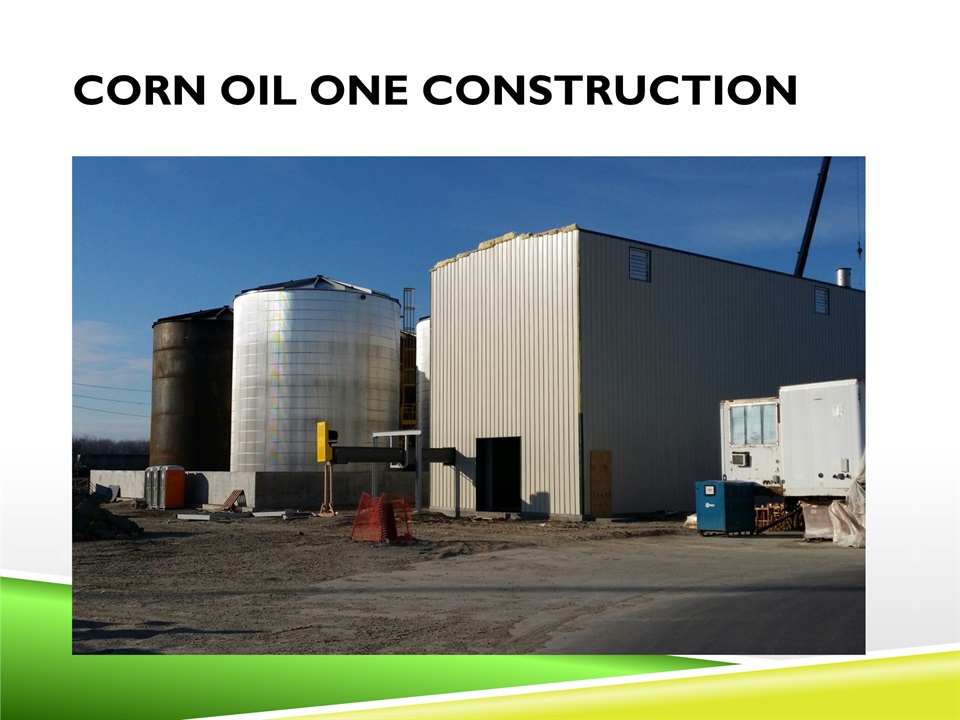
CORN OIL ONE CONSTRUCTION

STEAM LINE REPAIR


SIRE bought 43.2MM bushels cornTotal - $186.4MM ($4.32 / bu)SIRE sold 118.2MM gallons ethanolSIRE sold 273,178 tons of DG Fiscal Year 2014

Focus for 2015 Return to ShareholdersOperate SafelyOperate ProfitablyManage RiskLow Cost Ethanol ProducerEnergyYieldEnogenContinue to Reduce DebtPlan for 2015 thru 2020Diversification

Financial Summary January 2015

Operational Information YE 9/30/11 YE 9/30/12 YE 9/30/13 YE 9/30/14 Gallons Sold (millions) 114.5 122.6 111.8 118.2 Avg Price/Gallon $2.36 $2.26 $2.35 $2.07 Bushels Ground (millions) 40.8 43.6 39.3 43.0 Total Cost of Corn $264.7 $291.2 $279.7 $186.4 Yield (Ethanol/Bushel) 2.84 2.79 2.83 2.78

Financial Highlights(millions , except per gallon) YE 9/30/11 YE 9/30/12 YE 9/30/13 YE 9/30/14 Revenue $333.1 $362.9 $350.2 $319.4 Cost of Corn $264.7 $291.2 $279.7 $186.4 Crush Margin / Gallon $0.65 $0.47 $0.63 $1.13 EBITDA $20.7 $20.9 $15.3 $66.8 Net Income (Loss) $(2.7) $(0.7) $(5.5) $48.6

Financial Highlights(millions)) YE 9/30/11 YE 9/30/12 YE 9/30/13 YE 9/30/14 Bank Debt $93.4 $79.0 $68.8 $30.0 Bank Debt/Gallon $0.75 $0.63 $0.55 $0.24 Bank Debt - Repayment $12.0 $14.4 $12.6 $38.8 Total debt paid in last 15 months - $92.7 million!!

Quarterly Crush MarginIn Millions $ 9/30/13 12/31/13 3/31/14 6/30/14 9/30/14 12/31/14

LiquidityIn Millions $ 9/30/2011 9/30/2012 9/30/2013 9/30/2014

Annual Ethanol Yield (gallons/bushel) 9/30/11 9/30/12 9/30/13 9/30/14

Annual DDG Equivalent ProductionIn Tons (000’s) 9/30/11 9/30/12 9/30/13 9/30/14
Annual Corn Oil ProductionIn millions of pounds 9/30/11 9/30/12 9/30/13 9/30/14


Sire’s merchandising team

CHINA’S BACK IN THE GAME Like it or not China is a game changer. When they are in the market Values climb to well over 100% VTCHowever when they are out of the market we have seen DDG hold it’s value to around 80 to 85% VTC(much better than historical performance)


Co-Products We make approximately 1,000 tons per day of distiller co-products.35% to 40% of the production is wet feed, we continue to increase our customer base due to it’s consistency, digestibility and value as a feed source. Wet sales remain consistent with or without China in the market.