Attached files
| file | filename |
|---|---|
| 8-K - FORM 8-K - Regency Energy Partners LP | d861928d8k.htm |
| Exhibit 99.1
|
ENERGY TRANSFER PARTNERS, L.P.
REGENCY ENERGY PARTNERS LP
ETP’s Merger with Regency
January 30, 2015
|
|
LEGAL DISCLAIMER
Additional Information and Where to Find It
SECURITY HOLDERS ARE URGED TO READ THE PROXY STATEMENT/PROSPECTUS AND THE REGISTRATION STATEMENT REGARDING THE
TRANSACTION (THE “TRANSACTION”) INVOLVING THE MERGER OF ENERGY TRANSFER PARTNERS, L.P. (“ETP”) AND REGENCY ENERGY PARTNERS LP (“RGP” AND/OR “REGENCY”) CAREFULLY WHEN IT BECOMES AVAILABLE. These documents (when they become available), and any other doc uments filed by ETP or Regency with the U.S. Securities and Exchange Commission (“SEC”), may be obtained free of charge at the SEC’s website, at www.sec.gov. In addition, investors and security holders will be able to obtain free copies of the registration statement and the proxy statement/prosp ectus by phone, e-mail or written request by contacting the investor relations department of ETP or Regency at the following:
Energy Transfer Partners, L.P. Regency Energy Partners LP
3738 Oak Lawn Ave. 2001 Bryan Street, Suite 3700
Dallas, TX 75219 Dallas, TX 75201
Attention: Investor Relations Attention: Investor Relations
Phone: 214-981-0700 Phone: 214-840-5477
Participants in the Solicitation
ETP, Regency and their respective directors and executive officers may be deemed to be participants in the solicitation of pr oxies in connection with the proposed merger. Information regarding the directors and executive officers of ETP is contained in ETP’s Form 10 -K for the year ended December 31, 2013, which was filed with the SEC on February 27, 2014. Information regarding the directors and executive officers of Regency is contained in Regency’s Form 10-K for the year ended
December 31, 2013, which was filed with the SEC on February 27, 2014. Additional information regarding the interests of parti cipants in the solicitation of proxies in connection with the proposed merger will be included in the proxy statement/prospectus.
Cautionary Statement Regarding Forward-Looking Statements
This presentation includes “forward-looking” statements. Forward-looking statements are identified as any statement that does not relate strictly to historical or current facts. Statements using words such as “anticipate,” “believe,” “intend,” “project,” “plan,” “expect,” “continue,” “estimate,” “goal,” “forecast,” “may” or similar expressions help identify forward-looking statements. ETP and Regency cannot give any assurance that expectations and projections about futu re events will prove to be correct. Forward-looking statements are subject to a variety of risks, uncertainties and assumptions. These risks and uncertainties inclu de the risks that the proposed transaction may not be consummated or the benefits contemplated therefrom may not be realized. Additional risks include: the ability to obtain requisite regulatory and unitholder approval and the satisfaction of the other conditions to the consummation of the proposed transaction, the ability of ETP to successfully integrate Regency’s operations and employees and realize anticipated synergies and cost savings, the potential impact of the announcement or cons ummation of the proposed transaction on relationships, including with employees, suppliers, customers, competitors and credit rating agencies, the ability to achi eve revenue, DCF and EBITDA growth, and volatility in the price of oil, natural gas, and natural gas liquids. Actual results and outcomes may differ materially from those expressed in such forward-looking statements. These and other risks and uncertainties are discussed in more detail in filings made by ETP and Regency with the Securities and Exchange Commission
(the “SEC”), which are available to the public. ETP and Regency undertake no obligation to update publicly or to revise any f orward-looking statements, whether as a result of new information, future events or otherwise.
| 2 |
|
|
|
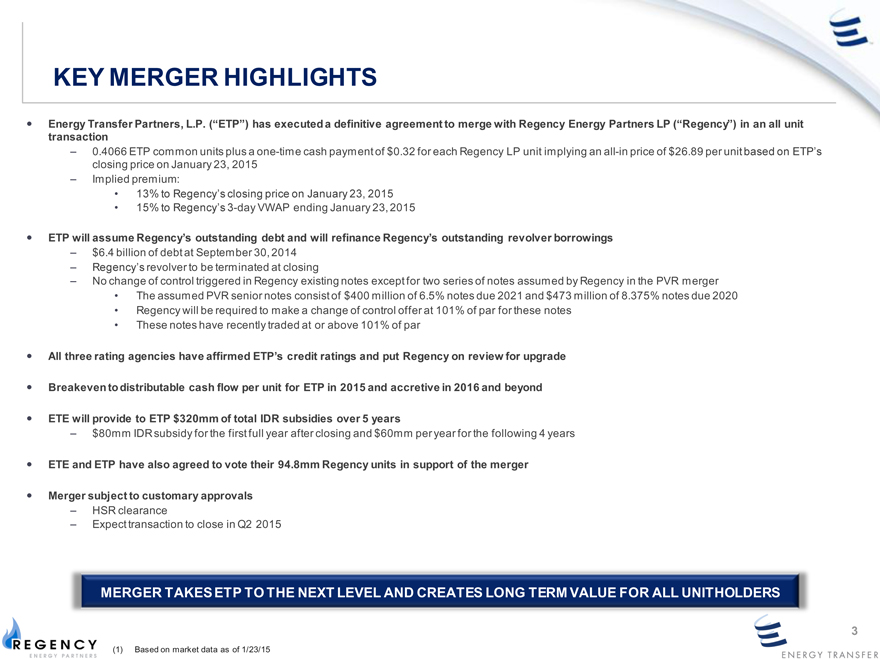
KEY MERGER HIGHLIGHTS
Energy Transfer Partners, L.P. (“ETP”) has executed a definitive agreement to merge with Regency Energy Partners LP (“Regency”) in an all unit transaction
– 0.4066 ETP common units plus a one-time cash payment of $0.32 for each Regency LP unit implying an all-in price of $26.89 per unit based on ETP’s closing price on January 23, 2015
– Implied premium:
13% to Regency’s closing price on January 23, 2015
15% to Regency’s 3-day VWAP ending January 23, 2015
ETP will assume Regency’s outstanding debt and will refinance Regency’s outstanding revolver borrowings
– $6.4 billion of debt at September 30, 2014
– Regency’s revolver to be terminated at closing
– No change of control triggered in Regency existing notes except for two series of notes assumed by Regency in the PVR merger
The assumed PVR senior notes consist of $400 million of 6.5% notes due 2021 and $473 million of 8.375% notes due 2020
Regency will be required to make a change of control offer at 101% of par for these notes
These notes have recently traded at or above 101% of par
All three rating agencies have affirmed ETP’s credit ratings and put Regency on review for upgrade
Breakeven to distributable cash flow per unit for ETP in 2015 and accretive in 2016 and beyond
ETE will provide to ETP $320mm of total IDR subsidies over 5 years
– $80mm IDR subsidy for the first full year after closing and $60mm per year for the following 4 years
ETE and ETP have also agreed to vote their 94.8mm Regency units in support of the merger
Merger subject to customary approvals
– HSR clearance
– Expect transaction to close in Q2 2015
MERGER TAKES ETP TO THE NEXT LEVEL AND CREATES LONG TERM VALUE FOR ALL UNITHOLDERS
| 3 |
|
| (1) |
|
Based on market data as of 1/23/15 |
|
|
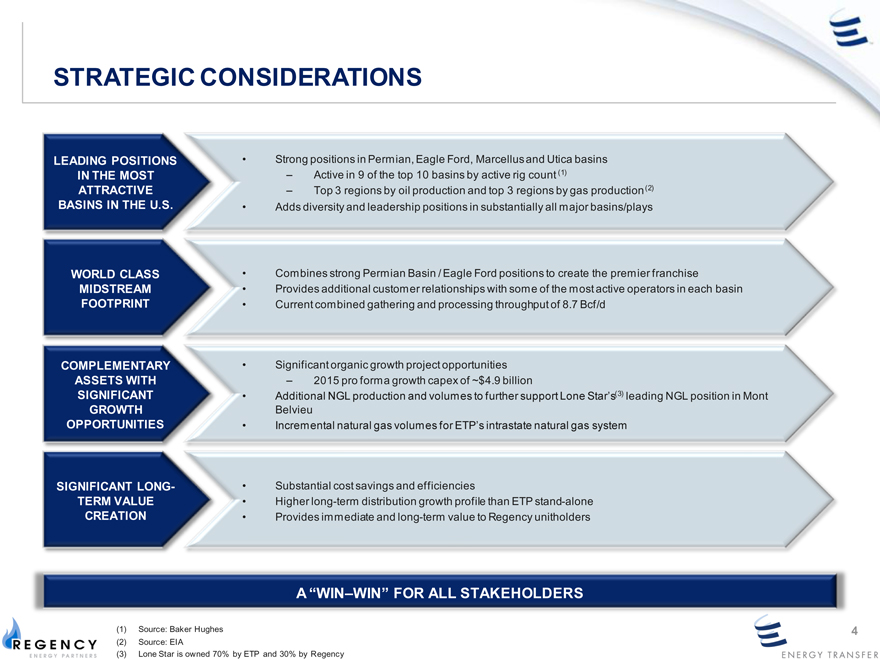
STRATEGIC CONSIDERATIONS
LEADING POSITIONS Strong positions in Permian, Eagle Ford, Marcellus and Utica basins
IN THE MOST – Active in 9 of the top 10 basins by active rig count (1)
ATTRACTIVE – Top 3 regions by oil production and top 3 regions by gas production (2)
BASINS IN THE U.S. Adds diversity and leadership positions in substantially all major basins/plays
WORLD CLASS Combines strong Permian Basin / Eagle Ford positions to create the premier franchise
MIDSTREAM Provides additional customer relationships with some of the most active operators in each basin
FOOTPRINT Current combined gathering and processing throughput of 8.7 Bcf/d
COMPLEMENTARY Significant organic growth project opportunities
ASSETS WITH – 2015 pro forma growth capex of ~$4.9 billion
SIGNIFICANT Additional NGL production and volumes to further support Lone Star’s(3) leading NGL position in Mont
GROWTH Belvieu
OPPORTUNITIES Incremental natural gas volumes for ETP’s intrastate natural gas system
SIGNIFICANT LONG- Substantial cost savings and efficiencies
TERM VALUE Higher long-term distribution growth profile than ETP stand-alone
CREATION Provides immediate and long-term value to Regency unitholders
| 4 |
|
|
|
A “WIN–WIN” FOR ALL STAKEHOLDERS
| (1) |
|
Source: Baker Hughes 4 (2) Source: EIA |
| (3) |
|
Lone Star is owned 70% by ETP and 30% by Regency |
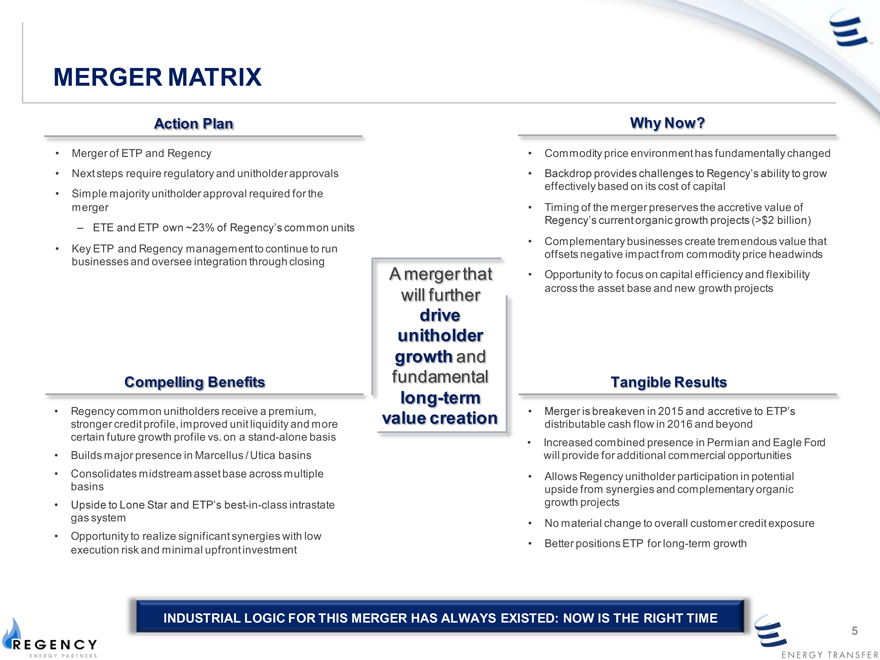
MERGER MATRIX
Action Plan Why Now?
Merger of ETP and Regency Commodity price environment has fundamentally changed
Next steps require regulatory and unitholder approvals Backdrop provides challenges to Regency’s ability to grow
effectively based on its cost of capital
Simple majority unitholder approval required for the
merger Timing of the merger preserves the accretive value of
Regency’s current organic growth projects (>$2 billion)
– ETE and ETP own ~23% of Regency’s common units
Complementary businesses create tremendous value that
Key ETP and Regency management to continue to run offsets negative impact from commodity price headwinds
businesses and oversee integration through closing
A merger that Opportunity to focus on capital efficiency and flexibility
will further across the asset base and new growth projects
drive
unitholder
growth and
Compelling Benefits fundamental Tangible Results
long-term
Regency common unitholders receive a premium, value creation Merger is breakeven in 2015 and accretive to ETP’s
stronger credit profile, improved unit liquidity and more distributable cash flow in 2016 and beyond
certain future growth profile vs. on a stand-alone basis Increased combined presence in Permian and Eagle Ford
Builds major presence in Marcellus / Utica basins will provide for additional commercial opportunities
Consolidates midstream asset base across multiple Allows Regency unitholder participation in potential
basins upside from synergies and complementary organic
Upside to Lone Star and ETP’s best-in-class intrastate growth projects
gas system No material change to overall customer credit exposure
Opportunity to realize significant synergies with low
execution risk and minimal upfront investment Better positions ETP for long-term growth
INDUSTRIAL LOGIC FOR THIS MERGER HAS ALWAYS EXISTED: NOW IS THE RIGHT TIME
| 5 |
|
|
|
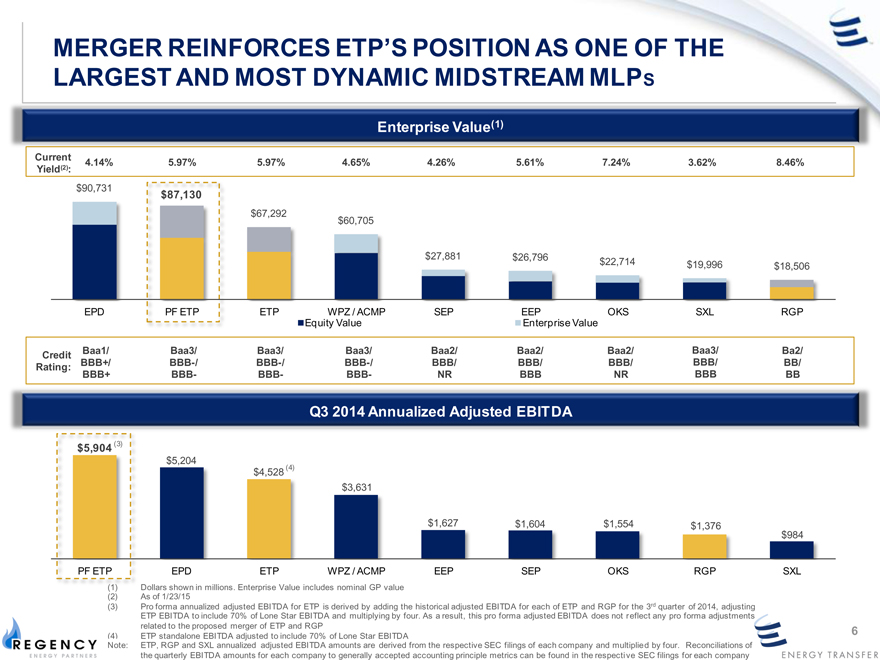
MERGER REINFORCES ETP’S POSITION AS ONE OF THE
LARGEST AND MOST DYNAMIC MIDSTREAM MLPS
Enterprise Value(1)
Current 4.14% 5.97% 5.97% 4.65% 4.26% 5.61% 7.24% 3.62% 8.46%
Yield(2):
$90,731 $87,130
$67,292
$60,705
$27,881 $26,796 $22,714 $19,996 $18,506
EPD PF ETP ETP WPZ / ACMP SEP EEP OKS SXL RGP
Equity Value Enterprise Value
Credit Baa1/ Baa3/ Baa3/ Baa3/ Baa2/ Baa2/ Baa2/ Baa3/ Ba2/
Rating: BBB+/ BBB-/ BBB-/ BBB-/ BBB/ BBB/ BBB/ BBB/ BB/
BBB+ BBB- BBB- BBB- NR BBB NR BBB BB
Q3 2014 Annualized Adjusted EBITDA
| (3) |
|
$5,204
$4,528 (4)
$3,631
$1,627 $1,604 $1,554 $1,376
$984
EPD ETP WPZ / ACMP EEP SEP OKS RGP SXL
| (1) |
|
Dollars shown in millions. Enterprise Value includes nominal GP value |
| (2) |
|
As of 1/23/15 |
(3) Pro forma annualized adjusted EBITDA for ETP is derived by adding the historical adjusted EBITDA for each of ETP and RGP for the 3rd quarter of 2014, adjusting
ETP EBITDA to include 70% of Lone Star EBITDA and multiplying by four. As a result, this pro forma adjusted EBITDA does not reflect any pro forma adjustments
related to the proposed merger of ETP and RGP (4) ETP standalone EBITDA adjusted to include 70% of Lone Star EBITDA
Note:(5) ETP, RGP and SXL annualized adjusted EBITDA amounts are derived from the respective SEC filings of each company and multiplied by four. Reconciliations of
the quarterly EBITDA amounts for each company to generally accepted accounting principle metrics can be found in the respective SEC filings for each company
| 6 |
|
|
|
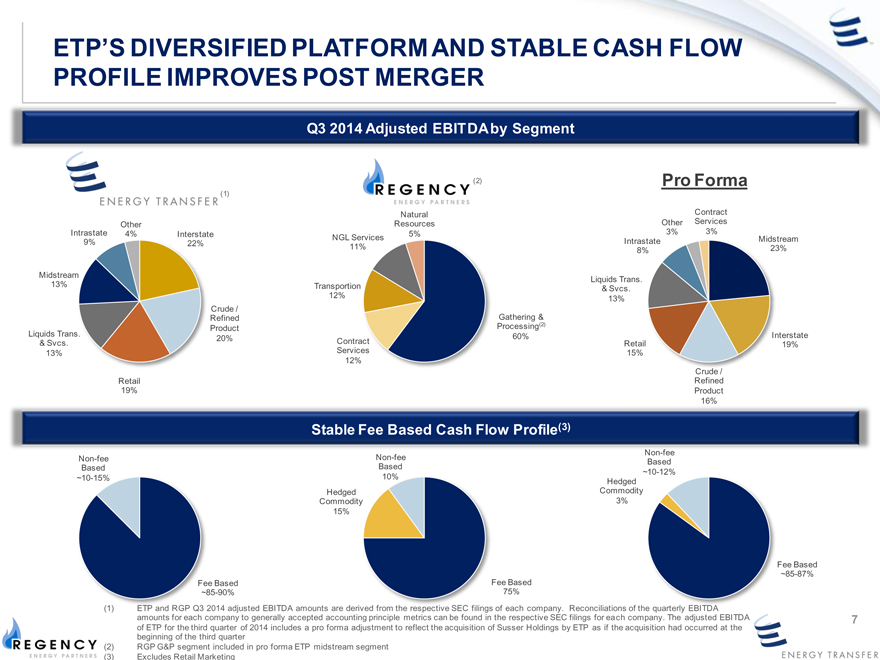
ETP’S DIVERSIFIED PLATFORM AND STABLE CASH FLOW
PROFILE IMPROVES POST MERGER
Q3 2014 Adjusted EBITDA by Segment
| (2) |
|
Pro Forma |
| (1) |
|
Natural Contract
Other Resources Other Services
Intrastate 4% Interstate 5% 3% 3%
9% 22% NGL Services Intrastate Midstream
11% 8% 23%
Midstream Liquids Trans.
13% Transportion & Svcs.
12% 13%
Crude /
Refined Gathering &
Product Processing(2)
Liquids Trans. 20% 60% Interstate
& Svcs. Contract Retail 19%
13% Services 15%
12%
Crude /
Retail Refined
19% Product
16%
Stable Fee Based Cash Flow Profile(3)
Non-fee Non-fee Based
Based Based ~10-12%
~10-15% 10% Hedged
Hedged Commodity
Commodity 3%
15%
Fee Based
~85-87%
Fee Based Fee Based
~85-90% 75%
(1) ETP and RGP Q3 2014 adjusted EBITDA amounts are derived from the respective SEC filings of each company. Reconciliations of the quarterly EBITDA
amounts for each company to generally accepted accounting principle metrics can be found in the respective SEC filings for each company. The adjusted EBITDA
of ETP for the third quarter of 2014 includes a pro forma adjustment to reflect the acquisition of Susser Holdings by ETP as if the acquisition had occurred at the
beginning of the third quarter
| (2) |
|
RGP G&P segment included in pro forma ETP midstream segment |
| (3) |
|
Excludes Retail Marketing |
| 7 |
|
|
|
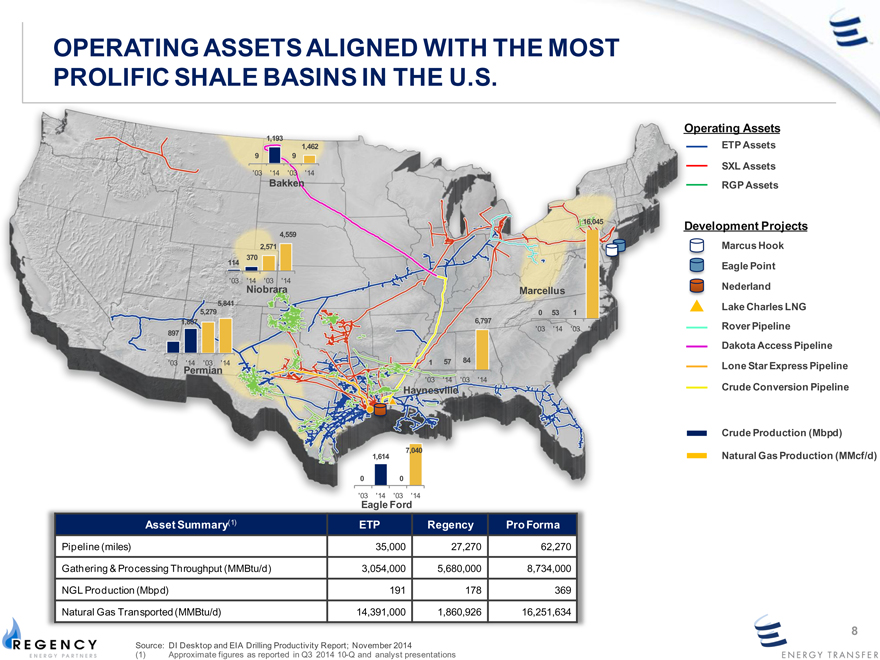
OPERATING ASSETS ALIGNED WITH THE MOST PROLIFIC SHALE BASINS , IN THE U.S.
,
,
, Operating Assets
1,193 , ETP Assets
1,462
9 9 ,
, SXL Assets
‘03 ‘14 ‘03 ‘14
Bakken , RGP Assets
,
, ,
,
,
, 16,045 Development Projects
,
4,559,
,
2,571 , Marcus Hook
, 370 ,
114 Eagle Point
, ,
‘03 ‘14 ‘03 ‘14
Niobrara Marcellus Nederland
5,841 Lake Charles LNG
5,279 0 53 1 1,807 6,797
Rover Pipeline
‘03 ‘14 ‘03 ‘14
897
Dakota Access Pipeline
‘03 ‘14 ‘03 ‘14 1 57 84
Lone Star Express Pipeline Permian
‘03 ‘14 ‘03 ‘14
Haynesville Crude Conversion Pipeline
Crude Production (Mbpd)
1,614 7,040
Natural Gas Production (MMcf/d)
0 0
‘03 ‘14 ‘03 ‘14
Eagle Ford
Asset Summary(1) ETP Regency Pro Forma
Pipeline (miles) 35,000 27,270 62,270
Gathering & Processing Throughput (MMBtu/d) 3,054,000 5,680,000 8,734,000
NGL Production (Mbpd) 191 178 369
Natural Gas Transported (MMBtu/d) 14,391,000 1,860,926 16,251,634
Source: DI Desktop and EIA Drilling Productivity Report; November 2014
| (1) |
|
Approximate figures as reported in Q3 2014 10-Q and analyst presentations |
| 8 |
|
|
|
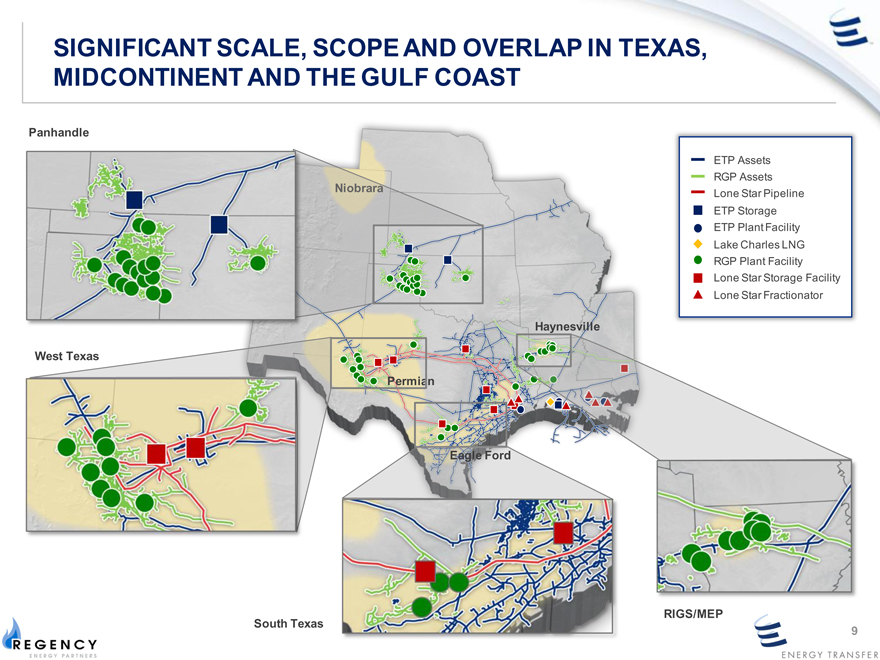
SIGNIFICANT SCALE, SCOPE AND OVERLAP IN TEXAS, MIDCONTINENT AND THE GULF COAST
Panhandle
ETP Assets RGP Assets
Niobrara
Lone Star Pipeline ETP Storage ETP Plant Facility Lake Charles LNG RGP Plant Facility
Lone Star Storage Facility Lone Star Fractionator
Haynesville West Texas Permian
Eagle Ford
RIGS/MEP South Texas
9
|
|
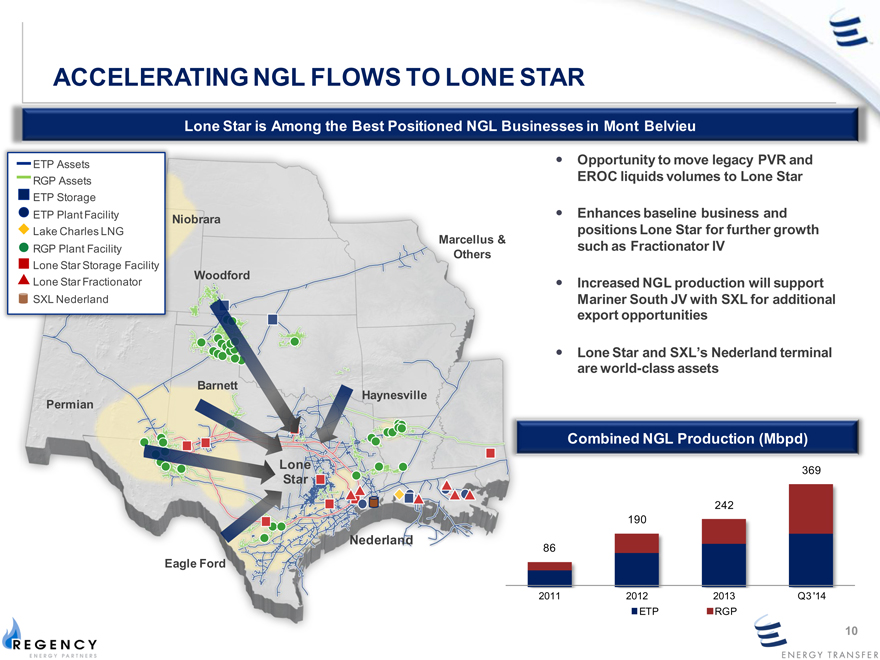
ACCELERATING NGL FLOWS TO LONE STAR
Lone Star is Among the Best Positioned NGL Businesses in Mont Belvieu
ETP Assets Opportunity to move legacy PVR and RGP Assets EROC liquids volumes to Lone Star
ETP Storage
ETP Plant Facility Enhances baseline business and
Niobrara
Lake Charles LNG positions Lone Star for further growth
Marcellus &
RGP Plant Facility such as Fractionator IV
Others
Lone Star Storage Facility Woodford
Lone Star Fractionator Increased NGL production will support SXL Nederland Mariner South JV with SXL for additional export opportunities
Lone Star and SXL’s Nederland terminal are world-class assets
Barnett
Haynesville Permian
Combined NGL Production (Mbpd)
Lone
369
Star
242 190
Nederland
86
Eagle Ford
2011 2012 2013 Q3 ‘14
ETP RGP
10
|
|
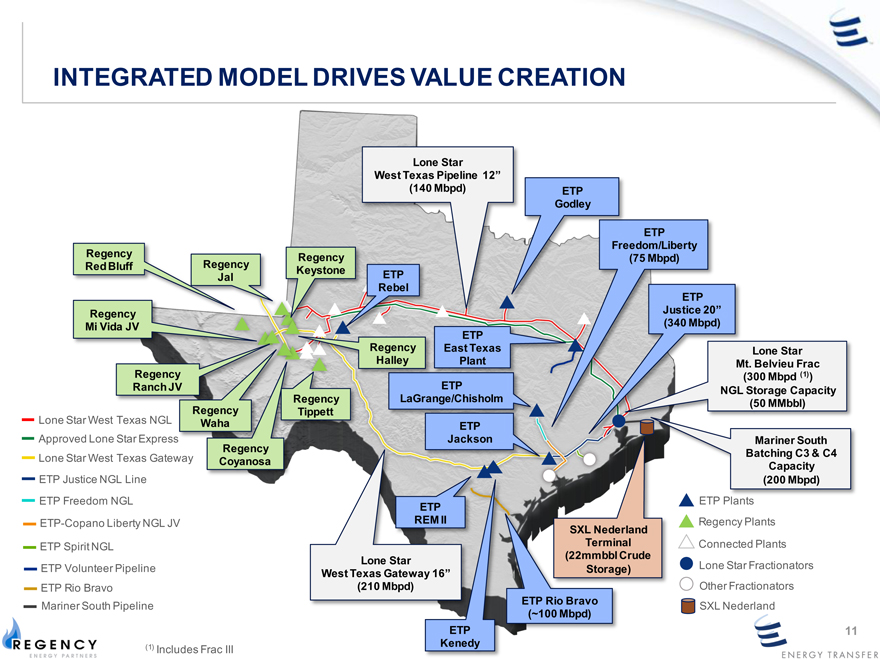
INTEGRATED MODEL DRIVES VALUE CREATION
Lone Star
West Texas Pipeline 12”
(140 Mbpd) ETP Godley
ETP edom/Liberty Regency Regency (75 Mbpd) Red Bluff y Keyston ETP
Rebel ETP
Justice 20”
Mi Vida JV (340 Mbpd) ETP
Regency East Texas Lone Star Halley Plant Mt. Belvieu Frac Regency (300 Mbpd (1)) Ranch JV ETP NGL Storage Capacity Regency LaGrange/Chisholm (50 MMbbl)
Lone Star West Texas NGL Regency Tippett
Waha ETP
Approved Lone Star Express Regency Jackson Mariner South
Batching C3 & C4
Lone Star West Texas Gateway Coyanosa
Capacity
ETP Justice NGL Line (200 Mbpd) ETP Freedom NGL ETP Plants ETP-Copano Liberty NGL JV R rland Regency Plants ETP Spirit NGL al Connected Plants
Crude
Lone Star Lone Star Fractionators ETP Volunteer Pipeline e)
West Texas Gatewa
ETP Rio Bravo (210 Mbpd) Other Fractionators
ETP Rio Bravo
Mariner South Pipeline SXL Nederland
(~100 Mbpd)
ETP 11 (1) Kenedy
Includes Frac III
11
|
|
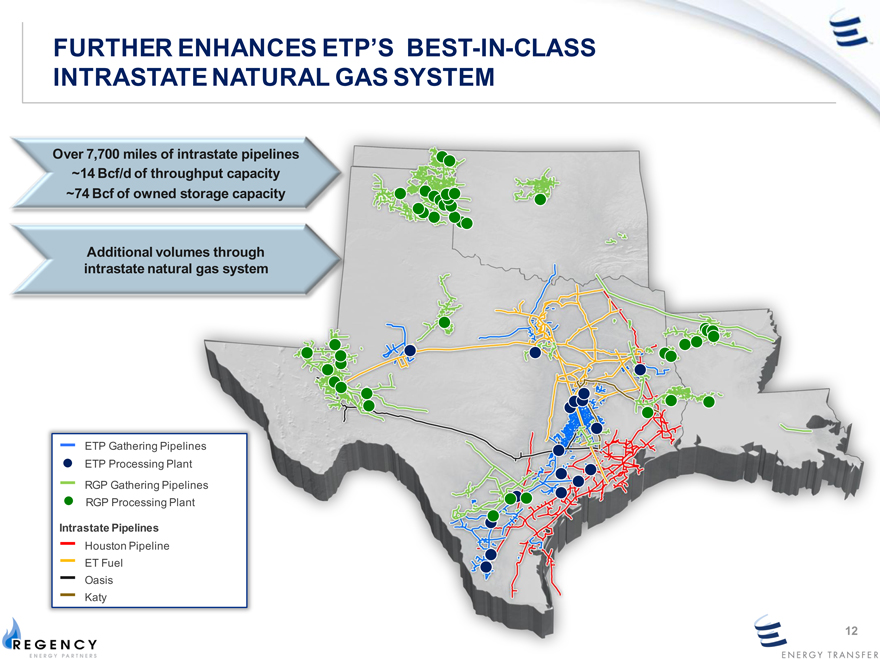
FURTHER ENHANCES ETP’S BEST-IN-CLASS INTRASTATE Interstate Pipeline NATURAL Assets GAS SYSTEM
Over 7,700 miles of intrastate pipelines ~14 Bcf/d of throughput capacity ~74 Bcf of owned storage capacity
Additional volumes through intrastate natural gas system
ETP Gathering Pipelines ETP Processing Plant RGP Gathering Pipelines RGP Processing Plant
Intrastate Pipelines
Houston Pipeline ET Fuel Oasis Katy
12
|
|
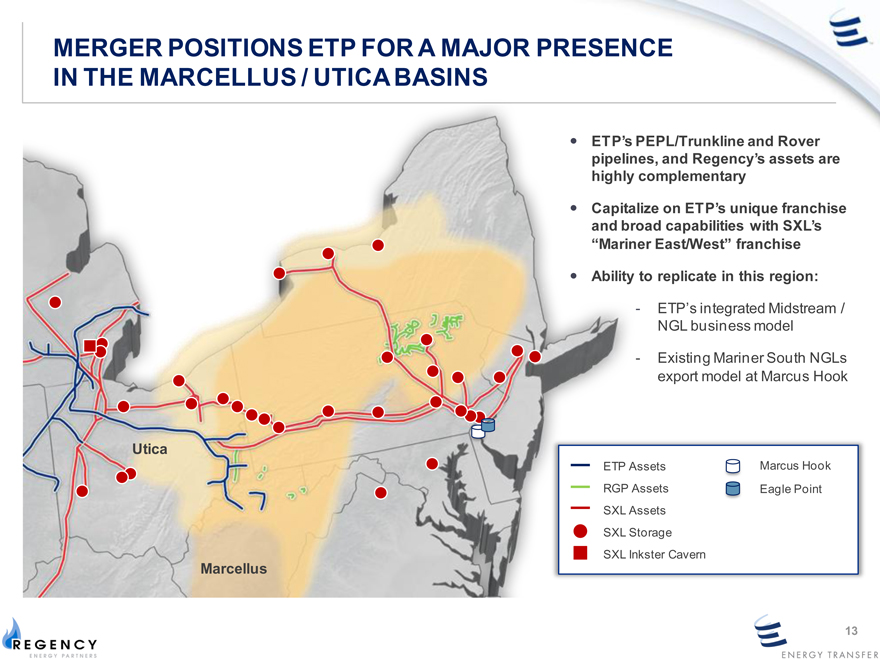
MERGER POSITIONS ETP FOR A MAJOR PRESENCE IN THE MARCELLUS / UTICA BASINS
ETP’s PEPL/Trunkline and Rover pipelines, and Regency’s assets are highly complementary
Capitalize on ETP’s unique franchise and broad capabilities with SXL’s “Mariner East/West” franchise
Ability to replicate in this region:
- ETP’s integrated Midstream /
NGL business model
- Existing Mariner South NGLs export model at Marcus Hook
Utica
ETP Assets Marcus Hook RGP Assets Eagle Point SXL Assets SXL Storage SXL Inkster Cavern
Marcellus
13
|
|
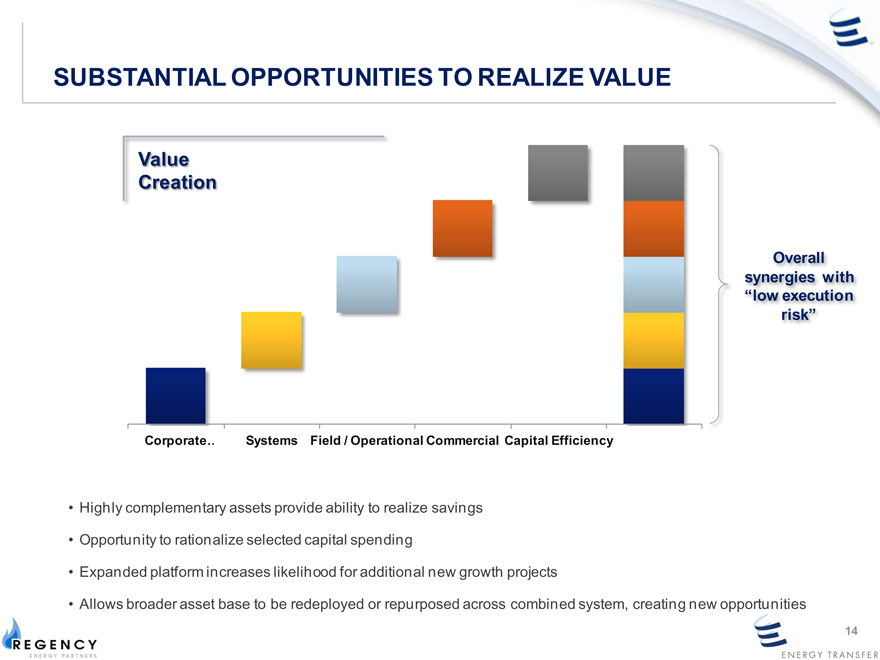
SUBSTANTIAL OPPORTUNITIES TO REALIZE VALUE
Value
Creation
Overall
synergies with
“low execution
risk”
Corporate… Systems Field / Operational Commercial Capital Efficiency
Highly complementary assets provide ability to realize savings
Opportunity to rationalize selected capital spending
Expanded platform increases likelihood for additional new growth projects
Allows broader asset base to be redeployed or repurposed across combined system, creating new opportunities
14
|
|
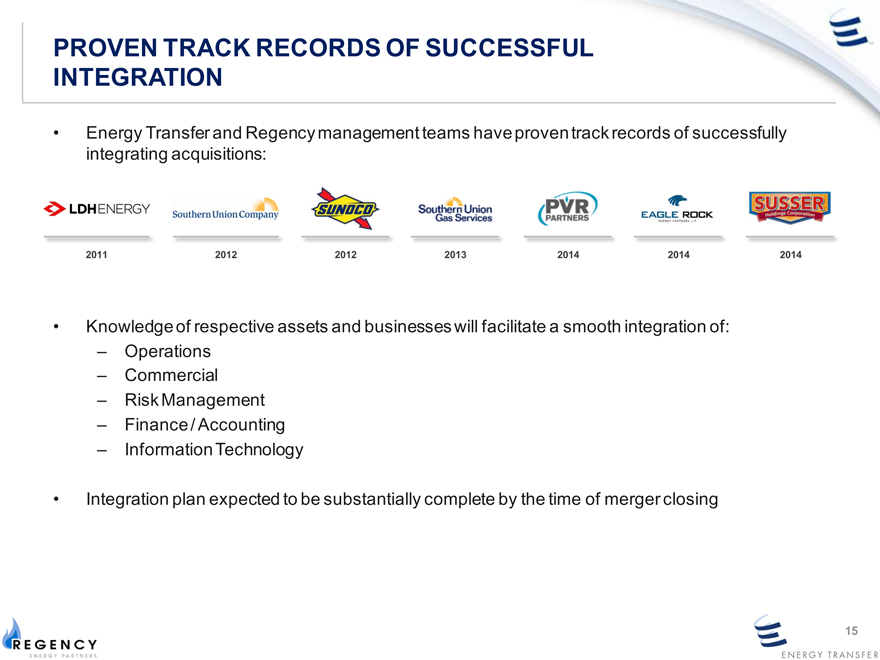
PROVEN TRACK RECORDS OF SUCCESSFUL INTEGRATION
Energy Transfer and Regency management teams have proven track records of successfully integrating acquisitions:
2011 2012 2012 2013 2014 2014 2014
Knowledge of respective assets and businesses will facilitate a smooth integration of:
– Operations
– Commercial
– Risk Management
– Finance / Accounting
– Information Technology
Integration plan expected to be substantially complete by the time of merger closing 15
15
|
|
KEY TAKEAWAYS
ETP becomes the second largest MLP
– Combined footprint with over 62,270 miles of pipelines and over 60 plants with 8.7 Bcf/d of gathering and processing throughput
– Operations in major high-growth oil and gas shales and basins, including Eagle Ford, Permian, Panhandle and Marcellus / Utica
ETP benefits from further diversified basin exposure, major presence in Marcellus / Utica basins, increased NGL volumes to Lone Star and greater gas volumes in its intrastate system
The merger of ETP and Regency creates benefits for ETE
– Immediate increase in overall cash flow and long-term cash flow growth
– Improved pro forma credit profile
ETE will be stronger and better positioned for future strategic opportunities
Regency benefits from size and strength of ETP’s diversified platform
– Improved access to capital and lower cost of capital
– Better potential for growth in a lower commodity price environment
Regency steps into an investment grade balance sheet and an attractive cost of capital
16
|
|
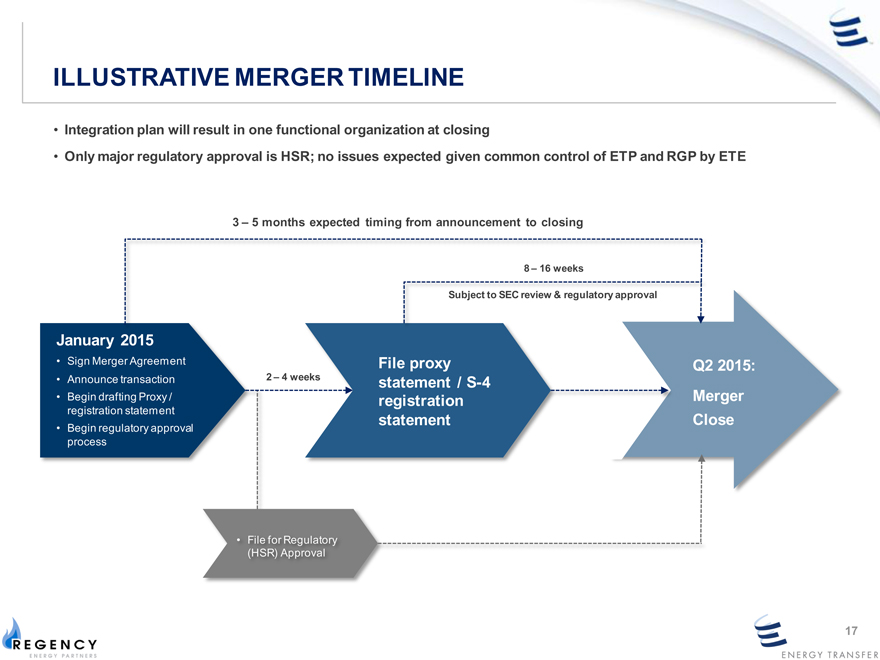
ILLUSTRATIVE MERGER TIMELINE
Integration plan will result in one functional organization at closing
Only major regulatory approval is HSR; no issues expected given common control of ETP and RGP by ETE
| 3 |
|
– 5 months expected timing from announcement to closing |
| 8 |
|
– 16 weeks |
Subject to SEC review & regulatory approval
January 2015
Sign Merger Agreement File proxy Q2 2015:
Announce transaction 2 – 4 weeks statement / S-4
Begin drafting Proxy / registration Merger
registration statement
Begin regulatory approval statement Close
process
File for Regulatory
(HSR) Approval
| 17 |
|
|
|
APPENDIX
|
|
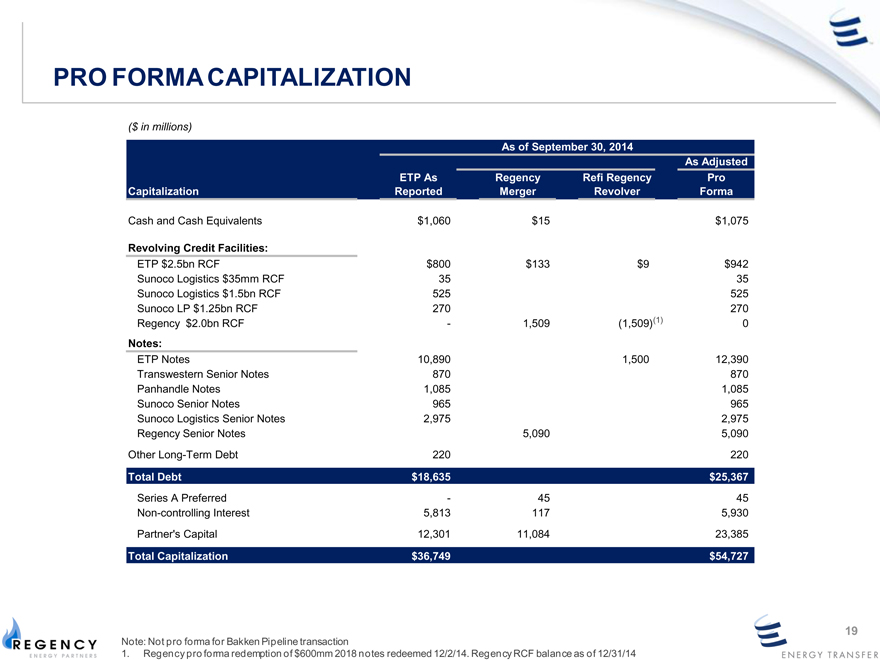
PRO FORMA CAPITALIZATION
($ in millions)
As of September 30, 2014
As Adjusted
ETP As Regency Refi Regency Pro
Capitalization Reported Merger Revolver Forma
Cash and Cash Equivalents $1,060 $15 $1,075
Revolving Credit Facilities:
ETP $2.5bn RCF $800 $133 $9 $942
Sunoco Logistics $35mm RCF 35 35
Sunoco Logistics $1.5bn RCF 525 525
Sunoco LP $1.25bn RCF 270 270
Regency $2.0bn RCF—1,509(1,509)(1) 0
Notes:
ETP Notes 10,890 1,500 12,390
Transwestern Senior Notes 870 870
Panhandle Notes 1,085 1,085
Sunoco Senior Notes 965 965
Sunoco Logistics Senior Notes 2,975 2,975
Regency Senior Notes 5,090 5,090
Other Long-Term Debt 220 220
Total Debt $18,635 $25,367
Series A Preferred—45 45
Non-controlling Interest 5,813 117 5,930
Partner’s Capital 12,301 11,084 23,385
Total Capitalization $36,749 $54,727
| 19 |
|
Note: Not pro forma for Bakken Pipeline transaction
| 1. |
|
Regency pro forma redemption of $600mm 2018 notes redeemed 12/2/14. Regency RCF balance as of 12/31/14 |