UNITED STATES
SECURITIES AND EXCHANGE COMMISSION
Washington D.C. 20549
FORM 8-K
CURRENT REPORT
Pursuant to Section 13 or 15(d) of The Securities Exchange Act of 1934
Date of Report (Date of earliest event reported): January 29, 2015
Oro East Mining, Inc.
(Exact name of registrant as specified in its charter)
Delaware
(State or other jurisdiction of incorporation)
000-53136
(Commission File Number)
26-2012582
(IRS Employer Identification No.)
7817 Oakport Street, Suite 205
Oakland, California 94621
(Address of principal executive offices)(Zip Code)
(510) 638-5000
Registrant’s telephone number, including area code
Check the appropriate box below if the Form 8-K filing is intended to simultaneously satisfy the filing obligation of the registrant under any of the following provisions (see General Instruction A.2. below):
o Written communications pursuant to Rule 425 under the Securities Act (17 CFR 230.425)
o Soliciting material pursuant to Rule 14a-12 under the Exchange Act (17 CFR 240.14a-12)
o Pre-commencement communications pursuant to Rule 14d-2(b) under the Exchange Act (17 CFR 240.14d-2(b))
o Pre-commencement communications pursuant to Rule 13e-4(c) under the Exchange Act (17 CFR 240.13e-4(c))
Item 8.01 Other Events.
On December 16, 2014, Oro East Mining, Inc. (the “Company”) filed a Current Report on Form 8-K reporting, among other things, that the Company had entered into a binding letter of intent (“LOI”), dated December 12, 2014, with Red Bank Trust for the purchase of certain lode and placer mining claims and all mineral rights thereto, in Mariposa County, California, known as the Red Bank Mine (the “Red Bank Mine property”), including an easement, right of entry, and other rights and interests as set forth in the LOI. Under the LOI, the Company must pay for the purchase of the Red Bank Mine Property with (i) 20,000,000 shares of common stock of the Company, to be registered under a Registration Statement on Form S-1, which the parties value at $1,000,000, and (ii) delivery of a convertible promissory note to Yan Ming Wu, the named beneficiary of the Redbank Trust, in the sum of $1,000,000.
This Current Report on Form 8-K discloses certain information regarding the Mining Claims and Mineral Rights.
We are an exploration stage company engaged in the acquisition and exploration of mineral properties. We have a right to purchase the mining rights to the Red Bank Mine property under the terms of the LOI. The Red Bank Mine property is located approximately 17 miles north of the town of Mariposa, California. We are currently conducting mineral exploration activities on the Red Bank Mine property in order to assess whether it contains any commercially exploitable mineral reserves. Currently there are no known mineral reserves on the Red Bank Mine property.
Since our inception, we have not earned any revenues to date and our net losses are $1,260,102 at September 30, 2014. Our independent auditor has issued an audit opinion which includes a statement expressing substantial doubt as to our ability to continue as a going concern. The source of information contained in this discussion is our geology report dated December 29, 2014, and prepared by Robert Campbell, M.S., California Professional Geologist, California Certified Engineering Geologist and Principal Engineering Geologist of GeoSolve, Inc.
While we intend to test for commercially viable reserves of precious metals and rare earth element (REE) production and for propose additional drilling locations to isolate gold- and REE-bearing zones at the site, there is the likelihood of our mineral claim containing little or no economic mineralization or reserves of gold, REEs, or other minerals. We are presently in the exploration stage of our business and we can provide no assurance that any commercially viable mineral deposits exist on our mineral claims, that we will discover commercially exploitable levels of mineral resources on our property, or, if such deposits are discovered, that we will enter into further substantial exploration programs. Further exploration is required before a final determination can be made as to whether our mineral claims possess commercially exploitable mineral deposits. If our claim does not contain any reserves all funds that we spend on exploration will be lost.
We engaged Mr. Campbell to prepare a geological evaluation report on the Red Bank Mine property. Mr. Campbell is the professional geologist who authored the report. Mr. Campbell graduated from the University of California at Davis with a Bachelor’s of Science (B.S.) in geology in 1989 and a graduate of California State University East Bay with a Master’s of Science (M.S.) in geology in 2006. He is a member of the California Board of Professional Engineers, Land Surveyors and Geologists with a Professional Geologist (P.G.) license number 6454 and Certified Engineering Geologist (C.E.G.) license number 2089, and a member of the American Institute of Professional Geologists (A.I.P.G.) member number 1564.
We received the geological evaluation report on the Red Bank Mine property, entitled “National Instrument 43-101 Technical Report on Red Bank Mine – 81 Acres, Apns 003-350-0050; 003-340-0070; And 003-330-0060, Mariposa County, California, for Oro East Mining, Inc.” (the “Report”) prepared by Mr. Campbell on December 29, 2014. The Report summarizes the results of the history of the exploration of the mineral claims, the regional and local geology of the mineral claims and the mineralization and the geological formations identified as a result of the prior exploration. The Report also gives conclusions regarding potential mineralization of the mineral claims and recommends a further geological exploration program on the mineral claims. The Report does not make any recommendation regarding any work program or the anticipated costs of any exploration activities.
The description of the Red Bank Mine property provided below is based on the Report.
2
Summary
The purpose of the Report was to evaluate the Red Bank Mine for precious metals and rare earth element (REE) production and for propose additional drilling locations to isolate gold- and REE-bearing zones at the site. The Red Bank Mine property consists of patented claims comprised of the Stevenson, Jubilee and Daisy Quartz mines, which comprises approximately 81 acres. The property is situated approximately 17 miles north of the town of Mariposa, California and is bounded by Lake McClure and Highway 49 on a steep dipping slope from below Highway 49 to the shores of Lake McClure.
Based on the laboratory analytical results obtained from the 14 mineral samples collected at the Red Bank mine property, which were analyzed by ALS Minerals, mineable ore was determined to be present along the strike of two quartz veins and the talc-carbonate schist matrix bounded by the quartz veins. Up to 0.056 ounce of gold per troy ton of ore and 0.059 ounce of silver per troy ton of ore were determined to be present at the Red Bank mine property. Additionally, moderate to high concentrations of REEs were detected within the mineral samples collected from the talc-carbonate schist matrix within the lower tunnel mine adit.
Introduction
The Red Bank Mine property consists of patented claims comprised of the Stevenson, Jubilee and Daisy Quartz mines, which comprises approximately 81 acres. The property is situated approximately 17 miles north of the town of Mariposa, California and is bounded by Lake McClure and Highway 49 on a steep dipping slope from below Highway 49 to the shores of Lake McClure.
GeoSolve, Inc. relied on information provided by the Company. The Report is based on the following sources of information: 1) discussions with Oro East Mariposa, LLC; 2) visual inspection of the Red Bank mine project area; 3) information obtained from public domain resources; and 4) regional geology published by the United States Geological Survey (USGS) and Jason Jordon, a geologist.
Mr. Campbell visited the Red Bank mine property on October 15, 2014. During the site visit, the Stevenson Crosscut (lower tunnel mine adit), quartz vein open-pit mine and serpentinized ultra-mafic knob areas were observed and mineral samples were collected from all three areas for assaying and laboratory analyses to evaluate the areas for future mining reserves. A review of previous work was summarized within the Red Bank mine area and areas for future exploration were proposed.
Reliance on Other Experts
The information, opinions, and conclusions contained in the Report are based on the following:
|
·
|
Information available to GeoSolve, Inc. at the time of the Report preparation;
|
|
·
|
Assumptions, conditions, and qualifications established in the Report;
|
|
·
|
Laboratory analytical data from ALS Minerals and UC Davis; and
|
|
·
|
Geologic data, published reports, and other information supplied by Oro East Mariposa, LLC and third party sources.
|
Mr. Robert D. Campbell, M.S., P.G., C.E.G., Principal Engineering Geologist of GeoSolve, Inc. did, however, rely on a former NI 43-101 Technical Report prepared by Mr. Bartlett J. Hanford, licensed mining engineer, for portions of this report, especially the historical aspects of Red Bank mine. All other information was obtained by Mr. Robert D. Campbell.
Property Description and Location
The Red Bank Mine property consists of patented claims comprised of the Stevenson, Jubilee and Daisy Quartz mines, which comprises approximately 81 acres. The property is situated approximately 17 miles north of the town of Mariposa, California and is bounded by Lake McClure and Highway 49 on a steep dipping slope from below Highway 49 to the shores of Lake McClure. The Red Bank mine lies in the northern part of Mariposa County in the area between Coulterville District to the north and Bagby District to the south. The Coulterville District is in the southwestern Tuolumne County and northwestern Mariposa County.
3
Geosolve, Inc. reviewed and relied on the ownership information provided by Oro East Mariposa, LLC, which to GeoSolve, Inc.’s knowledge is correct. GeoSolve, Inc. obtained a copy of the quick claim deed transfers, where the subject property was transferred to Oro East Mariposa, LLC from Mr. Timothy Chen. GeoSolve, Inc. has relied on Mr. Timothy Chen’s documents to establish mineral title of the subject property. Oro East Mariposa, LLC is unaware of any environmental liabilities associated with the subject property. During the site visit conducted on October 15, 2014, GeoSolve, Inc. did not notice any existing obvious environmental liabilities associated with the Red Bank mine property. However, limiting drainage from existing the mine adits and open pit areas during investigation and future ore production activities would significantly reduce any future environmental acid-mine drainage, if any, originating from the Red Bank mine property to Lake McClure.
Mining and Reclamation plans were submitted to the Mariposa Planning Department for review, which will also include the United States Bureau of Land Management for California (http://www.blm.gov/ca/st/en/prog/minerals.html). A California Regional Water Quality Control Board (RWQCB) storm water pollution prevention permit will be required for industrial activities prior to commencement of mining at the Red Bank mine to insure sedimentation is not being eroded into Lake McClure. California Occupational Safety and Health Administration (Cal OSHA) is the agency responsible for tunnel and mine safety, as well as testing for mine atmosphere. A blasting permit (Federal Explosive Permit) can be obtained through the Federal Department of Alcohol Tobacco and Firearms (ATF). Access to the Red Bank mine property is from Highway 49, approximately 17 miles north of the town of Mariposa on the left side of the road (west side) via a minor and un-improved dirt road. Four-wheel drive vehicles are strongly recommended while entering the Red Bank Mine property. Due to the steep slopes and steep inclinations encountered on the dirt access road from Highway 49 to the Red Bank mine, slow speed is also strongly recommended due to safety concerns. Improving the access road conditions would greatly increase production and safety at the Red Bank mine property.
Accessibility, Climate, Local Resources, Infrastructure and Physiography
As discussed in Section 4.0, access to the Red Bank mine property is attainable via Highway 49 approximately 17 miles north of the town of Mariposa, California and/or 10 miles south of Coulterville, California, and is entered from a dirt and un-improved road on the western side of Highway 49, which significantly decreases by approximately 350 feet in elevation. The entrance is on a slight blind-curve on Highway 49 and care should be taken while entering the Red Bank mine property. Access to the Red Bank mine property is highly not recommended during and immediately after a significant precipitation event due to the clayey nature and un-safe driving conditions at the Red Bank mine property.
Mariposa, California climate is mild during summer when temperatures tend to be in the 60's and very cold during winter when temperatures tend to be in the 30's. The warmest month of the year is July with an average maximum temperature of 77.60 degrees Fahrenheit (F), which can reach over 110 degrees F. The coldest month of the year is December with an average minimum temperature of 25.30 degrees Fahrenheit.
Temperature variations between night and day tend to be moderate during summer with a difference that can reach 29 degrees Fahrenheit, and moderate during winter with an average difference of 20 degrees Fahrenheit.
The annual average precipitation at Mariposa is 30.18 inches. Winter months tend to be wetter than summer months. The wettest month of the year is January with an average rainfall of 6.20 inches (http://www.idcide.com/weather/ca/mariposa.htm).
Ideal mining operating seasons would be from late spring (May) to late fall (October), when rainfall is least.
Due to the limited horizontal (flat) topography at the Red Bank mine property, ore is recommended to be consolidated and removed to another area for processing. This will also reduce potential environmental liabilities associated with leaks and spills associated with producing mineral concentrates on the property.
Regional Mining History
Gold quartz veins in the Motherlode have a long history in California. The Mother Lode Belt (MLB) produced an excess of 40 million oz. of gold through 1964 and recent mining activities in the 1990s and 2000s has produced an estimated 10 to 20 million additional oz. of gold. The Red Bank mine property is situated on the southern end of the MLB.
4
The history in the Coulterville District initiated with the surface portions of the veins and in the streams as placer mining. Coulterville was named for George Coulter, who opened a store at this location in 1849. Quartz mining initiated in approximately 1852 with the discovery of the McAlpine and Mary Harrison veins. Considerable ore mining was conducted from the 1860s until the 1890s, when many of the claims were owned by the Cook estate. Minor mining activity continued from the early 1900s until 1942. In recent years, minor mining was performed on the Virginia, McAlpine and Red Bank mine (Chen, personal communication).
In the Bagby District, streams were placer mined in the beginning of the gold rush and the Pine Tree and Josephine veins were discovered in 1849, which a portion of the claims were on the Las Mariposa Spanish Land grant of General John C. Fremont. Bagby was originally known as Benton Mills, named by Fremont for Senator Thomas Hart Benton, his father-in-law. Benton Mills was re-named in the 1890s for A. Bagby, a hotel owner along the stop to Yosemite Valley Railroad, which traversed up the Merced River canyon to Yosemite National Park.
Gold mining activity continued until 1875 and again in the early 1900s in the Bagby District. The Pine Tree-Josephine mine operated on a significant scale from 1933 to 1944 and, as stated above, the Red Bank mine was active in recent years. A portion of the mining district, including the town of Bagby, was inundated by Lake McClure in 1967 (Hanford, 2014).
Notable mine production records in the Coulterville District prior to 1964 indicated values from $100,000 on the Louisa claim to $1.5 million on the Mary Harrison claim based on $35 per oz. value. Notable mine production records in the Bagby District prior to 1964 indicated values from $50,000 on the Mexican and Oso claims up to $4 million on the Pine Tree-Josephine claims. A $100,000 specimen was obtained from the Red Bank mine.
Geologically, the gold deposit characteristics observed in the Pine Tree-Josephine mines are very similar to the Red Bank mine deposits (Hanford, 2014). Approximately 118,000 oz. of gold were recovered from the Pine Tree-Josephine mine. The gold-producing mineralized zone is comprised of gray to black schist cross-just and juxtaposed by a stockwork of quartz veins and a zone of carbonate-mariposite-talc-pyrite alteration, which defines the pre-historic New Melones Fault shears.
Red Bank Mine History
The Red Bank mine was originally owned by Mr. Percy D Pettigrew of Palo Alto, California and Horace Meyer of Cathey, California, which were comprised of the Daisy, Jubilee and Syndicate Lode placer Claims totaling approximately 165 acres. The Red Bank mine was most likely discovered in the 1860s and consisted mostly of placer mining (Hanford, 2014).
Initial hard-rock mining was undertaken from 1894 to 1897 by the Red Bank Mining Company, under Mr. Isaac Solinger and two tunnel adits to approximately 400 horizontal feet were constructed; however, the Mother lode vein was never encountered. In 1897, the mine owners were listed as Mr. Heney Bratnoble and Mr. A. Wartenweiler attempted to sell the Red Bank mine to Hamilton Smith and Associates for $100,000; however, the deal was not brokered and the property was sold to London Exploration Company. The Daisy Tunnel was extended by the London Exploration Company to approximately 500 feet, which stuck the Mother Lode vein approximately 1,000 feet below the outcrop. The producing vein was determined to be approximately 30 feet in width with ore assaying at approximately $16.00 per ton at a historical $16.00 per oz. gold value (Hanford, 2014). The Red Bank mine closed down in 1898 with little production realized. Minor mining was performed from 1910 to 1918 and approximately ten tons of ore were milled, producing 28 oz. of gold and 40 oz. of silver (Hanford, 2014). Historically, a 5-ton stamp mill and later a 125 ton stamp mill were previously on the property and operated from 1918 through 1935. During 1939 and 1940, a total of 12,786 tons of ore was milled, which yielded approximately 1,551 oz. of gold and 6,896 oz. of silver. The total production of the mine was in excess of $100,000 and contained an abnormally high concentration of silver for a Motherlode mine (Hanford, 2014).
In 1954, Mr. Jack Wildt continued mining on the eastern portion of the Red Bank mine by constructing a shaft to approximately 60 feet below ground surface (bgs). Mr. Wildt produced enough gold and silver to sustain a living for over 41 years from the Red Bank mine Wildt shaft. Drifts were installed to the north and south of the shaft at 40 feet and 60 feet bgs. Milling was relegated to talc-schist material rather than the quartz rich-gold ore due to lack of larger milling equipment, and amalgamation using mercury. As the price of gold dropped to $370 per oz. in 1995, mining activities at Red Bank mine ceased (Hanford, 2014).
Approximately 5,000 oz. of gold were recovered from the Red Bank mine by 1964 (Discovery Consultants, 1987).
5
Regional Geology
The Mother Lode region of California is a complex geological system of quartz veins and mineralized rock approximately 195 km long and approximately 1.5 km in width, with localized along east dipping ancient fault traces with geologic offsets of over 10 km. The quartz ore deposits are not continuous, but discontinuous lenticular masses up to 20 m in thickness. Ore bodies appear to be associated with the thickest portions of the quartz veins and are localized where veins intersect or branch outward. Ore zones typically have short strike lengths, but can be continuous in the down dip-direction for thousands of m, which dip easterly along the ancient transform fault shear zones.
Typically, zones of mineralization are porphyritic and consist of massive white quartz, opaque with coarse crystalline structure, and often contains inclusions of host country rock. Alteration is common and pervasive with ankerite dominating (Bohlke, 1989). Most gold lies within the contact between the quartz veins and footwall metamorphics, often finely disseminated in rocks around the quartz veins within the southern portion of the MLB (Bohlke, 1989).
The Sierra Nevada Mountains are the backbone of California’s topography and extend from the Cascade province to the north, the Transverse Range province to the south, the Basin and Range and Mojave provinces to the east and southeast and Great Valley to the west. The Garlock Fault is the Southern Boundary between the Mojave and Transverse Ranges provinces. The Sierra Nevada Mountains are 400 miles long and 40 to 100 miles wide and the western edge of the Sierra Nevada batholith along the ancient plate-boundary transform fault created the MLB.
The subjacent rocks are mainly igneous and metamorphic units (meta-sedimentary and meta-igneous) of diverse composition and age. Approximately 60% of the rocks are siliceous granites. The Sierra Nevada Batholith is a composite of over 100 distinct plutons from the Nevadan Orogeny (Late Jurassic to Late Cretaceous – 160 million years ago [ma] to 66 ma). The Nevadan Orogeny produced the Nevada Mountains, site of the present Sierra Nevada Mountains. The modern Sierra Nevada represents the highly eroded Nevada Mountains, which were significantly uplifted by faulting.
Ordovician meta-sediments (500 ma to 439 ma) were thought to be the oldest rocks in the Sierra (near Lake Crowley) found in the Mount Morrison roof pendant. However, the oldest rocks are Lower Cambrian archaeocyathids (540 ma) in the Big Pine pendant, about 60 km south of Crowley Lake. These roof pendants are found in the eastern Inyo-White Mountains. The Shoo Fly complex (Silurian – 439 ma – 409 ma) is overlain by Paleozoic island arc sequences) in the northern Sierra is truncated by late Devonian volcanic rocks of the Sierra Buttes Formation (409 ma to 354 ma). More volcanic rocks in the northern Sierra than in the central or eastern Sierra.
6
Two main orogenic events caused unconformities within the rock units, the Antler Orogeny (Devonian) and the Sonoma Orogeny (Permian). The early Jurassic sediments were the youngest rocks involved with the Nevada Orogeny. Pre-Cenozoic sedimentation on the site of today’s Sierra formerly was attributed to the presence of a Cordilleran geosyncline during much of the Paleozoic and most of the Mesozoic. The shallow trough was presumed to have extended from the Gulf of Mexico to the Arctic. The continental margin of North America in the Sierra-Klamath area is thought to have grown ocean ward by the tectonic accretion during the Phanerozoic (540 ma to 354 ma). A graphic showing the formation of Sierra Nevada Mountains is presented below.

The earliest plutons within the Sierra were small, mafic and often coarse-textured hornblende phenocrysts in a plagioclase matrix – dioritic to gabbroic. Remnants of these intrusives became inclusions in later granitic rocks. The batholith is composed of granitic rocks ranging from granite, quartz-monzonite, granodiorite and quartz diorite. These rocks were intruded into pre-Jurassic roof rocks as a series of over-lapping plutons from 88 ma to 206 ma. The Nevada Orogeny took place between 150 million years in bursts of plutonic activity with intervening periods of quiescence.
Studies in the northern Sierra reinforce the position that granitic magmas were crustally derived, while the older gabbroic and dioritic plutons were probably mantle sources. Faults controlled the placement of the different mountain building event.
The New Melones fault is an east-dipping thrust fault along which older rocks thrust westward over the Calaveras Complex. The New Melones fault is traced from the northernmost Sierra southward to the Merced River near Mariposa and bisects the subject Red Bank mine property.
Overlying the Sierran basement are late Mesozoic and Cenozoic sediments and volcanics deposited after the long erosional interval that followed the Nevadan Orogeny. Although the region generally had low relief during this period, local relief may have reached up to 3,300 feet. The Cenozoic volcanic flows and vocaniclastics were deposited discontinuously. Non marine basins received continental, lacustrine and fluvial deposits and marine sediments overlapped the western margin of the former Nevadan Mountain. These rocks comprise the superjacent series (Unruh, 1991).
7
The Nevadan Orogeny may have been caused by the arrival of a complex island arc at the New Melones thrust boundary. The Shoo Fly Complex contains old ocean crust and some geologists are convinced that the Shoo Fly complex is a pre-Devonian subduction complex, which incorporated large amounts of sediment from land-derived deep sea fans as well as portions from the continental slope and rise rocks. These rocks were stacked upon one another during subduction and are now overlain by the Late Devonian Grizzly Formation. The Grizzly Formation is the base of a series of Paleozoic island arc deposits that accumulated during the late Devonian to early Mississippian Antler Orogeny. The late Paleozoic Calaveras Complex appears to have jointed the continent during the early Triassic Sonoma Orogeny when it was thrust beneath the Shoo Fly, which indicates a dominantly depositional environment for much of the central and southern Sierra throughout the Paleozoic. This combination of continental shelf accumulation and terrain accretion was profoundly altered, folded, faulted by the Nevadan Orogeny in the early Jurassic. Based on the accumulation of sediments within the Sacramento Valley (25,000 feet or 5.75 miles), paleo-pollen grain studies showed aridity east of the mountains (much like today), which indicates very high mountains up to 10,000 feet and more geographically extensive than the Sierra’s.
The New Melones fault is a zone of en-echelon dip-slip faults, which have off-set up to 5,000 feet in the northern Sierra and up to 11,000 feet in the southern Sierra. Movement began in the middle Miocene and accelerated in the Pleistocene, as evidenced by the glacial till, volcanic and fault scarp deposits/surfaces.
Approximately 107 million oz. (6.6 million pounds or 3,300 tons) of gold have been extracted from the Mother Lode, primarily before 1900. The gold is found mainly in the Jurassic Mariposa slate of the Foothill Metamorphic belt.
The gold found in the Mother Lode rocks was mobilized by connate water released during metamorphism of the original marine sedimentary rocks and circulating in deep hydrothermal systems. The emplacement of plutons provided heat to drive the hot water systems. The water dissolved gold and sulfides and acquired carbon dioxide from the cooling granite magmas. The pregnant solution precipitated gold and quartz in veins and altered other rocks to form the low-grade disseminated gold deposits (Unruh, 1991) and (Wernicke, 1996).
The Red Bank mine deposits are porphyritic in nature and are large geochemical anomalies of iron and sulfur with economically important enrichments of copper and gold. Porphyry deposits consist of veins and disseminations with variable proportions of chalcopyrite, bornite, molybdentie, pyrite, and magnetite, and are formed from magmatic-hydrothermal fluids exsolved from relatively oxidized, sulfur rich, calc-alkaline to mildly alkaline arc-related magmas (Richards, 2013). Deposition of gold, silver and other metals in a porphyry environment are shown below from Richards (2013); however, the volcanic pipe is preplaced by the New Melones Fault zone.
8
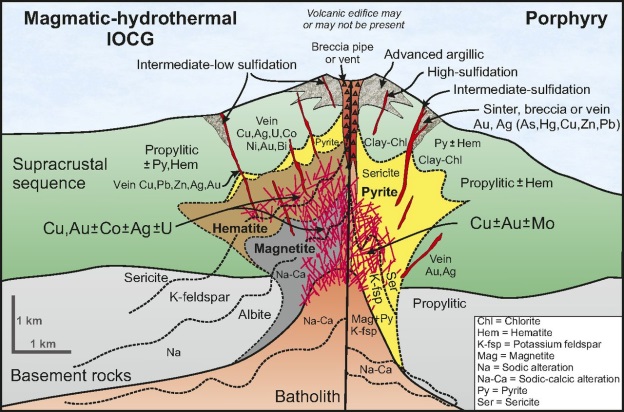
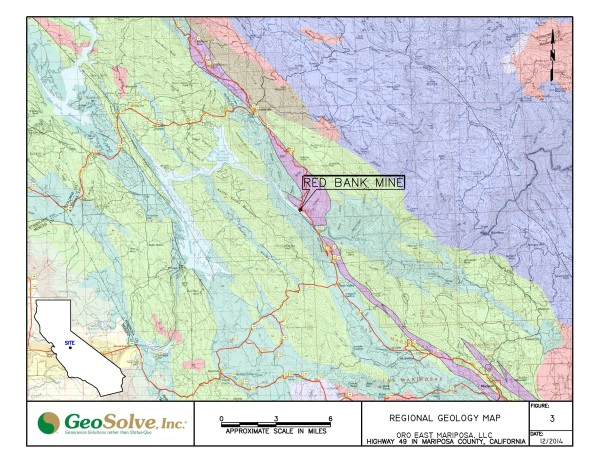
Porphyry deposits occur most commonly in Cenozoic and Mesozoic rocks, are less abundant in the Paleozoic, and are very rare in the Precambrian. One explanation for this temporal distribution is that arc-related porphyry deposits form in environments of active uplift and erosion, commonly followed by collision, and as such they are highly susceptible to loss through erosion (Richards, 2013). In addition, most porphyry deposits are formed at shallow levels (~1–5 km depth) above deeper batholiths (~5–10 km), and thus in cooler country rocks. High ambient temperatures in the host rocks would facilitate the formation of extensive zones of high-temperature alteration, from which a significant flux of crustally-derived lithophile elements such as iron, potassium, calcium, uranium, and rare earth elements (REEs). A regional geologic map of the Red Bank mine property and surrounding region is shown on Figure 3, Regional Geologic Map.
Red Bank Mine Geology and Mineralization
The local geology at the Red Bank mine property is consistent with metamorphism and metasomatism associated with porphyry induced epithermal deposition in the Miocene along the New Melones fault zone. The epithermal depositions were derived from the mobilization, alteration, and emplacement of silica-rich Cretaceous marine sediment rocks from plutonic derived heated fluids generated at depth into carbonate-rich rocks and the silica-mobilized fluid was deposited along with gold and silver within the quartz and ankerite (mariposite) veins, which trended along strike of the New Melones fault shear zones. Due to the emplacement of the Sierra Nevada plutons and the New Melones transform fault metamorphosed the bedrock at Red Bank Mine and along strike of the New Melones Fault zone. These metamorphic rocks include phyllite, slate, and meta-volcanic rocks. A belt of serpentine extends along strike of the New Melones Fault zone, especially along the northern portion of the Red Bank Mine property. Hydrated talc and highly serpentinitized zones are also juxtaposed within the fault zone, and exhibit relatively low gold and silver concentrations.
9
Two main quartz-mariposite veins traverse the Red Bank mine property with strikes ranging from N10W to N40W and dipping northeast up to 60 degrees from horizontal. Mariposite and ankerite deposits (silica-carbonate rocks) are the main vein rock types. Ore minerals are pryrite, argentiferous galena and native gold with minor accessories of tetrahedrite, chalcopyrite and sphalerite. The quartz veins are approximately 30 feet in width with an unknown depth, which truncate on the northern portion of the property into a knob of highly ultra-mafic serpentinite. Gold occurs in several northwest trending quartz veins and stringers with brecciated slate, schist and associated bodies of pyrite, ankerite, and arsenopyrite (Discovery Consultants, 1987).
Sample Collection and Analyses
The main mineral deposits investigated at the Red Bank mine property included quartz veins, quartz-mariposite veins, ankerite-mariposite deposits and serpentinite knob deposits. Although GeoSolve, Inc. assumed the highest gold concentrations should be within the quartz veins, mineral samples were collected from the ankerite-mariposite and serpentinte deposits for mining production evaluation purposes. Due to poor air quality, no samples were collected from the Wildt shaft. Mr. Campbell was able to enter the mine shaft until poor air quality at one of the horizontal mine adits prevented further exploration. Mineral samples were collected from the initial 45 feet into the lower tunnel adit due to the instability within the mine tunnel. Although a few rotted wood timbers were observed along the mine adit floor, no wood supports or framing was observed within the lower tunnel mine adit. Furthermore, the mine adit was partially collapsed at approximately 50 feet into the tunnel due to groundwater saturation of the mine footwall and hanging walls.
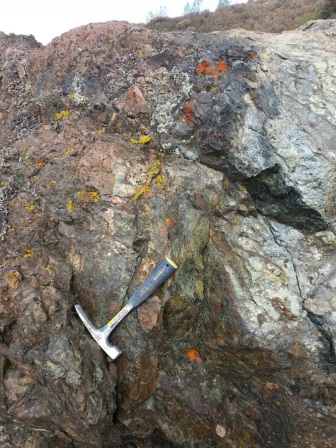
The quartz veins were extremely hard and not easily broken with hammers or using mechanical drilling methods. Similarly, the ankerite and mariposite exposed within the lower tunnel adit are very hard, but easily loosed due to extensive cleavage along strike of the New Melones Fault shear zone. No free gold was observed within hand samples collected for analyses; however, extensive mineralization was observed within the ankerite and mariposite samples. Gold ore material was also observed within the quartz vein samples. The following photograph depicts the open pit quartz vein.

Area of Sample OP-3 from quartz vein.
10
The following are pictures of collecting OP-2 and LT-3 below.

Collecting Sample OP-2 from quartz vein.

Collecting Sample LT-3 within lower tunnel mine.
11
Fourteen mineral samples were collected from the Red Bank mine property, four samples were collected from the open pit mine area (OP-1 through OP-4) within the quartz veins, seven samples from the lower tunnel adit (LT-1 through LT-6 and LT-6D), and three samples from the ultra-mafic serpentinite knob (S-1 through S-3), as shown below.
Collecting Sample S-3 within the serpentinite knob.
All mineral samples were collected using rock hammers and powered drills, which were placed into clean zip-lock bags, labeled, and placed within a sample box for temporary storage. Smaller portions of each mineral sample were also collected, placed in separate clean zip-lock bags, and labeled for potential electron microprobe analyses at the University of California at Davis.
12
Table 1
Mineral Sample Locations
Red Bank Mine Property
Mariposa, California
October 15, 2014
|
Sample ID
|
Mineral Type
|
|
OP-1
|
Quartz Porphyry
|
|
OP-2
|
Quartz Porphyry
|
|
OP-3
|
Quartz Porphyry-Mariposite
|
|
OP-4
|
Quartz Porphyry
|
|
LT-1
|
Ankerite-Mariposite-Talc
|
|
LT-2
|
Ankerite-Mariposite-Talc
|
|
LT-3
|
Ankerite-Mariposite-Talc
|
|
LT-4
|
Ankerite-Mariposite-Talc
|
|
LT-5
|
Quartz-Ankerite
|
|
LT-6
|
Quartz-Ankerite
|
|
TL-6D
|
Quartz-Ankerite
|
|
S-1
|
Serpentinite
|
|
S-2
|
Serpentinite
|
|
S-3
|
Serpentinite
|
All fourteen mineral samples were submitted to ALS Minerals in Reno, Nevada under a chain-of-custody form for fine rock crushing and pulverizing to 85% less than 75 microns. The crushed and pulverized mineral samples were then analyzed for 34 elements using ICP-MS, base metals, gold (au), platinum (pt) and palladium (pd) by ICP-AES, total carbon and total sulfur by LECO and lithium borate fusion by ICP-MS. The ALS Minerals laboratory analytical report is attached to Appendix A, ALS Minerals Laboratory Report and the precious metals and REEs concentrations are shown on Table 2, Laboratory Analytical Results of Mineral Samples – Precious Metals, Table 3, Laboratory Analytical Results of Mineral Samples – Rare Earth Elements, and Table 4, Analytical Results of Averaged Concentrations for Mineral Oxides and Non-Metal Elements in Mineral Samples.
Four split mineral samples, OP-2, OP-4, LT-4 and LT-6 were submitted for electron microprobe analyses under chain-of-custody documentation to University of California at Davis department of Earth and Planetary Sciences (UC Davis). The purpose of the electron microprobe analyses was to evaluate the geochemistry of gold and silver mineralization on the ore body at the Red Bank mine property.
13
Table 2
Laboratory Analytical Results of Mineral Samples – Precious Metals
Red Bank Mine
Mariposa County, California
October 15, 2014
|
Sample ID
|
Au
(ppm)
|
Au
(oz/tt)
|
Ag
(ppm)
|
Ag
(oz/tt)
|
Pt
(ppm)
|
Pd
(ppm)
|
Cu
(ppm)
|
|
OP-1
|
0.389
|
0.0125
|
1.7
|
0.0546
|
0.0000
|
0.0030
|
19.0
|
|
OP-2
|
3.16
|
0.1016
|
1.7
|
0.0546
|
0.0050
|
0.0090
|
16.0
|
|
OP-3
|
0.09
|
0.0029
|
0
|
0.0000
|
0.0000
|
0.0030
|
41.0
|
|
OP-4
|
1.61
|
0.0517
|
0
|
0.0000
|
0.0000
|
0.0030
|
11.0
|
|
LT-1
|
0.026
|
0.0008
|
0.7
|
0.0225
|
0.0000
|
0.0030
|
62.0
|
|
LT-2
|
0.028
|
0.0009
|
3.0
|
0.0964
|
0.0000
|
0.0040
|
63.0
|
|
LT-3
|
0.58
|
0.0186
|
0
|
0.0000
|
0.0000
|
0.0020
|
31.0
|
|
LT-4
|
1.005
|
0.0323
|
0.6
|
0.0193
|
0.0000
|
0.0020
|
25.0
|
|
LT-5
|
0.308
|
0.0099
|
0.5
|
0.0161
|
0.0000
|
0.0080
|
105
|
|
LT-6
|
0.511
|
0.0164
|
1.5
|
0.0482
|
0.0000
|
0.0080
|
71.0
|
|
LT-6D
|
0.424
|
0.0136
|
1.1
|
0.0353
|
0.0000
|
0.0100
|
105
|
|
S-1
|
0.003
|
0.0001
|
0
|
0.0000
|
0.0050
|
0.0040
|
7.0
|
|
S-2
|
0.002
|
0.0001
|
0
|
0.0000
|
0.0000
|
0.0020
|
7.0
|
|
S-3
|
0.001
|
0.000
|
0
|
0.0000
|
0.0050
|
0.0030
|
7.0
|
|
Average
|
0.739
|
0.0237
|
0.771
|
0.0315
|
0.0017
|
0.0050
|
49.909
|
Au = Gold
Ag = Silver
Cu = Copper
Pt = Platinum
Pd = Palladium
14
Table 3
Laboratory Analytical Results of Mineral Samples – Rare Earth Elements
Red Bank Mine
Mariposa County, California
October 15, 2014
|
Sample ID
|
Dy
(ppm)
|
Er
(ppm)
|
Ho
(ppm)
|
Lu
(ppm)
|
Tb
(ppm)
|
Tm
(ppm)
|
Y
(ppm)
|
Yb
(ppm)
|
|
OP-1
|
0.27
|
0.16
|
0.05
|
0.03
|
0.04
|
0.03
|
1.8
|
0.16
|
|
OP-2
|
0.76
|
0.45
|
0.15
|
0.08
|
0.14
|
0.07
|
5.5
|
0.46
|
|
OP-3
|
0.14
|
0.05
|
0.02
|
0.01
|
0.02
|
0.02
|
0.70
|
0.06
|
|
OP-4
|
0.42
|
0.20
|
0.10
|
0.03
|
0.06
|
0.03
|
2.1
|
0.18
|
|
LT-1
|
2.76
|
1.75
|
0.58
|
0.30
|
0.47
|
0.27
|
17.3
|
1.77
|
|
LT-2
|
2.38
|
1.50
|
0.51
|
0.23
|
0.42
|
0.26
|
14.7
|
1.57
|
|
LT-3
|
2.18
|
1.39
|
0.45
|
0.18
|
0.34
|
0.22
|
14.3
|
1.37
|
|
LT-4
|
1.89
|
1.11
|
0.37
|
0.20
|
0.29
|
0.17
|
9.7
|
1.11
|
|
LT-5
|
4.0
|
2.43
|
0.87
|
0.36
|
0.70
|
0.37
|
24.5
|
2.46
|
|
LT-6
|
2.31
|
1.46
|
0.5
|
0.25
|
0.40
|
0.23
|
14.0
|
1.43
|
|
LT-6D
|
3.84
|
2.37
|
0.82
|
0.37
|
0.61
|
0.35
|
23.4
|
2.21
|
|
S-1
|
0.32
|
0.23
|
0.06
|
0.03
|
0.04
|
0.04
|
1.9
|
0.19
|
|
S-2
|
0.17
|
0.13
|
0.04
|
0.03
|
0.02
|
0.02
|
1.0
|
0.17
|
|
S-3
|
0.50
|
0.32
|
0.10
|
0.05
|
0.06
|
0.06
|
2.8
|
0.34
|
|
Average
|
1.56
|
0.97
|
0.33
|
0.15
|
0.25
|
0.15
|
9.55
|
0.96
|
Dy = Dysprosium
Er = Erbium
Ho = Holmium
Lu = Lutetium
Tb = Terbium
Tm = Thulium
Y = Yttrium
Yb = Ytterbium
15
Table 4
Analytical Results of Averaged Concentrations for
Mineral Oxides and Non-Metal Elements in Mineral Samples
Red Bank Mine
Mariposa County, California
October 15, 2014
|
Mineral Oxide &
Non-Metal Elements
|
Average
(ppm)
|
|
C
|
1.47
|
|
S
|
0.09
|
|
BaO
|
0.05
|
|
SiO2
|
64.63
|
|
TiO2
|
0.23
|
|
Al2O3
|
5.82
|
|
Cr2O3
|
0.11
|
|
Fe2O3
|
4.98
|
|
MnO
|
0.08
|
|
MgO
|
12.24
|
|
CaO
|
1.67
|
|
Na2O
|
0.11
|
|
K2O
|
1.22
|
|
P2O5
|
0.01
|
|
LOI (%)
|
9.88
|
Mineral Oxides
SiO2 = quartz
TiO2 = titanium oxide
Al2O3 = aluminum oxide
Cr2O3 = chromium oxide
16
MnO = manganese oxide
CaO = calcium oxide
Na2O = sodium oxide
K2O = potassium oxide
P2O5 = phosphorus oxide
MgO = magnesium oxide
Physical Testing & Non-Metal Elements
C = Carbon
S = Sulfur
LOI = loss of ignition measured in percent (%)
Summary of Laboratory Analytical Results
The laboratory analytical results of the mineral samples OP-1 through OP-4, LT-1 through LT-6 and LT-6D and S-1 through S-3 indicated moderate to high gold and silver concentrations within mineral samples collected from the open mine pit within the quartz vein (OP-1 through OP-4). Low to moderate gold concentrations were detected in samples collected from the lower tunnel mine adit (LT-1 through LT-6 and LT-6D; however, moderate to very high concentrations of REEs were detected in mineral samples from the lower tunnel mine adit, which was within the ankerite-mariposite mineralization zone. No significant gold, silver or REE’s were detected in samples S-1 through S-3 collected from the ultra-mafic serpentinite knob outcrop. Moderate to high copper concentrations were detected in mineral samples OP-1 through OP-4 and LT-1 through LT-6 and LT-6D. Platinum concentrations were very low in all mineral samples analyzed. Low concentrations of palladium were also detected in all mineral samples analyzed. These results are summarized on Tables 2 and 3.
Moderate to high averaged silica concentrations were detected in all mineral samples analyzed. Low to moderate averaged aluminum oxides, iron oxides and magnesium oxides were detected in all mineral samples analyzed and very low averaged concentrations of carbon and sulfur were detected in mineral samples analyzed. Low averaged concentrations of calcium oxides, potassium oxides, and phosphorus oxides were also detected in all mineral samples analyzed. These results are summarized on Table 4.
UC Davis Microprobe Analyses
Four samples from Red Bank Mine were examined in an electron microprobe, which allows scanning of a planar surface for particular elements and visually image how elements exist in the mineralization phase. This qualitative view of the elements’ abundances and distribution is combined with our knowledge of mineralogy to make a determination of what mineral phases are present. The samples analyzed were OP-2, OP-4, LT-4 and LT-6. Gold was detected in samples LT-6 and OP-2. The other two samples did not have detectable gold at the surface of the cut.
17
The surfaces were selected by targeting the contact region between quartz and carbonate veins and adjacent sulfides or clays. After primary cuts were made the cut surfaces were epoxied to a glass slide and the adjacent material was trimmed with a rock saw down to approximately 100 microns (µm) thick, then polished with fine diamond or aluminum-oxide grit. The polished surface was coated with approximately 200 angstroms of vaporized carbon to make the surface conductive. Back-scattered electron (BSE) imaging is the primary tool to identify gold (Au) and other elements of interest. The brightness in an image is due to increased amounts of back-scattered electrons, which is directly related to the total mass of the material. Thus Au and other precious elements, which are very dense relative to the surrounding silicates and carbonates, will be very bright in BSE images. Once Au or other phases of interest are identified by BSE, one can determine what elements are present by using EDS (energy dispersive spectrometry) and WDS (wave-length dispersive spectrometry). The EDS scans show the elements present in a volume approximately 1 µm-wide by approximately 6 to 10 µm deep in volume of the total grain. This method may pick up elements from surrounding minerals when the gold is very fine (less than 5 µm), which is the case in these samples. Thus some of the EDS plots have elements which are not likely to be part of the Au-bearing compound but are from the surrounding matrix mineral(s). A copy of the UC Davis Report of Gold Occurrence Identified by Imaging and Qualitative Chemical Analysis is attached to Appendix A.
Discussion of Mineral Resource Estimates
The yellow high-lighted areas in Tables 2 and 3 indicate sample locations and mineral concentrations recommended for additional mineral exploration for gold, silver, and REEs.
The gold concentration average for samples OP-1 through OP-4 and LT-1 through LT-6 and LT-6D was calculated at 0.739 ppm and the 95% upper confidence level (UCL) using the EPA computer program ProUCL version 4.02 was calculated at 1.617 ppm. UCL is a statistical method of numerically evaluating and comparing sets of numbers, such as chemical concentrations to a mathematical mean and 95% confidence level of statistical accuracy. The average ounce (oz) per troy ton (tt) of gold within mineral samples OP-1 through OP-4 and LT-1 through LT-6 and LT-6D was calculated at 0.0237 oz/tt and the 95% UCL using the EPA computer program ProUCL version 4.02 was calculated at 0.052 oz/tt.
The silver concentration average for samples OP-1 through OP-4 and LT-1 through LT-6 and LT-6D was calculated at 0.925 ppm and the 95% UCL using the EPA computer program ProUCL version 4.02 was calculated at 1.56 ppm. The average troy ounce per ton of silver within mineral samples OP-1 through OP-4 and LT-1 through LT-6 and LT-6D was calculated at 0.031 oz/tt and the 95% UCL using the EPA computer program ProUCL version 4.02 was calculated at 0.059 oz/tt. Table 5 summarizes the mineral resource estimate for the entire mine area. The mineral resource estimates are shown on Tables 5 and 6, which are attached to this report.
The Pine Tree-Josephine mine immediately south of the Red Bank mine property, indicated gold was deposited within two quartz veins bounding a pyritic grey talc carbonate schist between the quartz veins (Discovery Consultants, 1987). An average gold concentration of 0.058 oz/tt was reported within this deposit, which is very similar in geology to the deposited mapped in the lower tunnel mine adit on the Red Bank mine property.
Based on the UC Davis microprobe analyses, Au occurs in different mineral associations in the two samples. Sample LT-6 has 0.5 to 5 µm gold occurring as almost pure Au with minor Ag. Au also occurs both as a phase within quartz (Figure 2) and in a chlorite-smectite clay layer within the quartz vein material (Figure 1). The Au in sample OP-2 is always associated with Fe-rich material that appears to be a mixture of goethite (FeO(OH)), actinolite or tremolite, and Fe-oxide (Figure 4). These minerals are replacing some coarser phase, which may have been pyrite (minor primary pyrite found in one grain). The Au in OP-2 contains Ag in varying abundance, from very minor to significant. Platinum and palladium were actively searched for but no evidence for either was found. Sample OP-2 does contain a few crystals of a Ni-As-Sb-S phase. The latter could be a solid-solution between Gersdorfitte (NiAsS) and Ullmannite (NiSbS). Arsenopyrite was also identified. These Ni- and As-bearing sulfides are associated with moderate-temperature hydrothermal veins. A copy of the UC Davis Report of Gold Occurrence Identified by Imaging and Qualitative Chemical Analysis is attached to Appendix A.
18

Figure 1 - LT-6 sample. Back-scattered electron image showing association of Au with
Chlorite-smectite vein material within quartz vein. Scale bar on Figure 2.
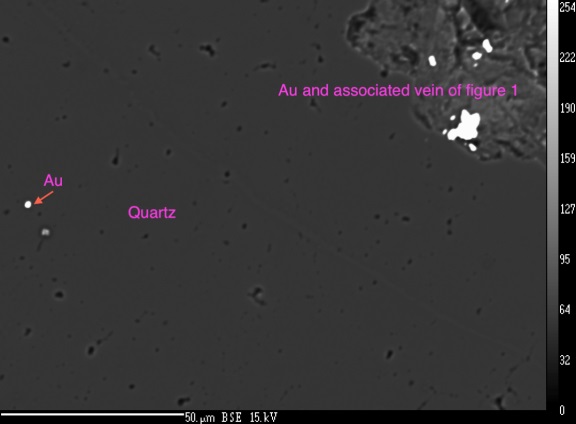
Figure 2 - LT-6 sample. Back-scattered electron image showing very fine Au in quartz vein.
Other occurrences in this sample show similar fine Au aligned within quartz.
19
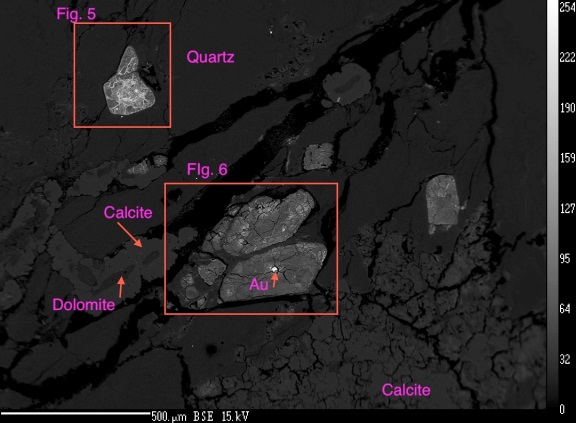
Figure 4 - OP-2 dominantly quartz and carbonate veins. The carbonates include low-Mg calcite and
dolomite. Gold is only found within grains of dominantly goethite, which may have been
replacing pyrite (based on morphology and minor pyrite found in one grain (Fig. 5).
The Report does not make any recommendation regarding any work program or the anticipated costs of any exploration activities.
20
SIGNATURES
Pursuant to the requirements of the Securities Exchange Act of 1934, the registrant has duly caused this report to be signed on its behalf by the undersigned hereunto duly authorized.
|
Oro East Mining, Inc.
|
|||
| (Registrant) | |||
|
Date: January 30, 2015
|
By:
|
/s/ Tian Qing Chen | |
| Name: Tian Qing Chen | |||
| Title: Chief Executive Officer | |||
21