Attached files
| file | filename |
|---|---|
| 8-K - 8-K - Mastercard Inc | ma01302015-8xk.htm |
| EX-99.1 - EX-99.1 - Mastercard Inc | ma12312014ex991earnings.htm |

©2015 MasterCard. Proprietary MasterCard Incorporated Fourth-Quarter and Full-Year 2014 Financial Results Conference Call January 30, 2015

©2015 MasterCard. Proprietary Business Update Financial & Operational Overview Economic Update Business Highlights Page 2

©2015 MasterCard. Proprietary 4th Quarter Selected Financial Performance ($ in millions, except per share data) 4Q 14 4Q 13 Non-GAAP excl. special item* Net revenue 2,416$ 2,126$ 14% 17% Total operating expenses 1,398 1,111 26% 29% Operating income 1,018 1,015 0% 3% Operating margin 42.1% 47.7% (5.6) ppts (5.4) ppts Net income 801$ 684$ 17% 21% Diluted EPS 0.69$ 0.57$ 21% 25% Effective tax rate 20.3% 32.0% FX Adjusted YOY Growth As Reported excl. special item* Note: Figures may not sum due to rounding. *See Appendix of this presentation and our earnings release for GAAP reconciliations of the special item. Page 3

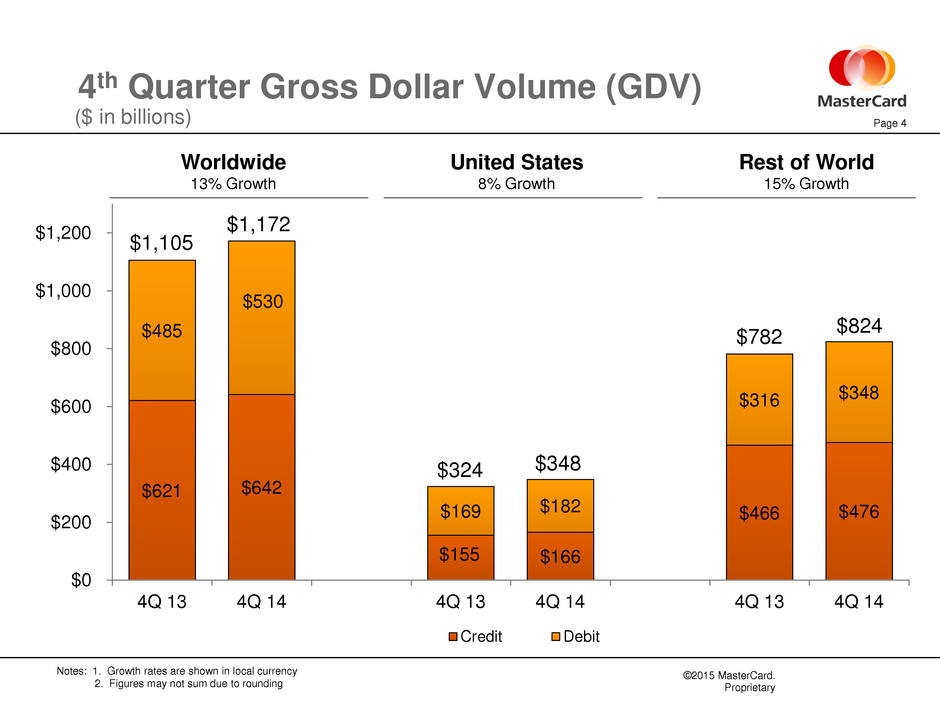
©2015 MasterCard. Proprietary 4th Quarter Gross Dollar Volume (GDV) ($ in billions) Notes: 1. Growth rates are shown in local currency 2. Figures may not sum due to rounding $621 $642 $155 $166 $466 $476 $485 $530 $169 $182 $316 $348 $0 $200 $400 $600 $800 $1,000 $1,200 4Q 13 4Q 14 4Q 13 4Q 14 4Q 13 4Q 14 Credit Debit $1,105 $1,172 $324 $348 $782 $824 4 Worldwide 13% Growth United States 8% Growth Rest of World 15% Growth Page

©2015 MasterCard. Proprietary 4th Quarter Processed Transactions and Cards Cards 9% Growth Note: Figures may not sum due to rounding 1,265 1,437 705 703 0 500 1,000 1,500 2,000 4Q 13 4Q 14 C ar ds (i n m ill io ns ) MasterCard Cards Maestro Cards 1,970 10,372 11,562 0 2,000 4,000 6,000 8,000 10,000 12,000 14,000 4Q 13 4Q 14 Tr an sa ct io ns (i n m ill io ns ) Processed Transactions 11% Growth 5 2,140 Page

©2015 MasterCard. Proprietary $972 $730 $949 $400 ($925) $2,126 $1,018 $774 $1,063 $495 ($934) $2,416 -$1,500 -$1,000 -$500 $0 $500 $1,000 $1,500 $2,000 $2,500 $3,000 Domestic Assessments Cross-Border Volume Fees Transaction Processing Fees Other Revenues Rebates and Incentives Total Net Revenue 4Q 13 4Q 14 Note: Figures may not sum due to rounding 4th Quarter Revenue ($ in millions) 5% 6% 12% 24% 1% 14% As-reported 17% 3% 28% 15% 8% FX-adjusted 7% Page 6

©2015 MasterCard. Proprietary $719 $321 $71 $1,111 $977 $337 $84 $1,398 $0 $400 $800 $1,200 $1,600 General & Administrative Advertising & Marketing Depreciation & Amortization Total Operating Expenses* 4Q 13 4Q 14 4th Quarter Operating Expenses ($ in millions) 36% 5% 19% 26%* As-reported 29%* FX-adjusted 38% 9% 19% Note: Figures may not sum due to rounding *See Appendix of this presentation and our earnings release for GAAP reconciliations of the special item. Page 7

©2015 MasterCard. Proprietary Looking Ahead Business update through January 21 Thoughts for 2015 Long-Term Performance Objectives • Discussion on FX • Revenue • Expenses • Tax Rate Page 8

©2015 MasterCard. Proprietary

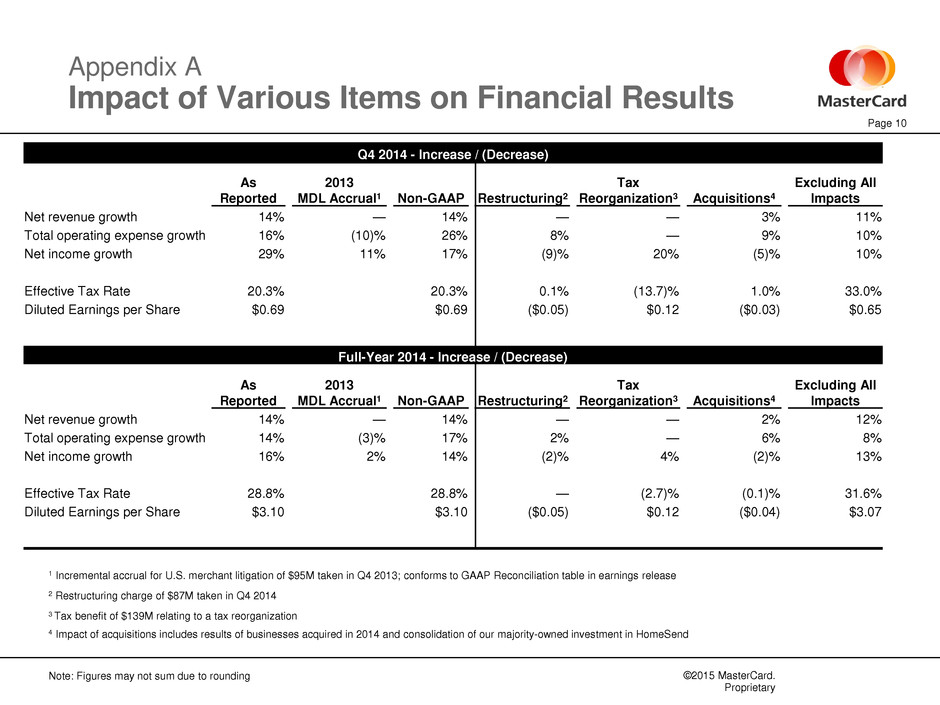
©2015 MasterCard. Proprietary Appendix A Impact of Various Items on Financial Results Page 10 Note: Figures may not sum due to rounding 1 Incremental accrual for U.S. merchant litigation of $95M taken in Q4 2013; conforms to GAAP Reconciliation table in earnings release 2 Restructuring charge of $87M taken in Q4 2014 3 Tax benefit of $139M relating to a tax reorganization 4 Impact of acquisitions includes results of businesses acquired in 2014 and consolidation of our majority-owned investment in HomeSend Q4 2014 - Increase / (Decrease) As Reported 2013 MDL Accrual1 Non-GAAP Restructuring2 Tax Reorganization3 Acquisitions4 Excluding All Impacts Net revenue growth 14% — 14% — — 3% 11% Total operating expense growth 16% (10)% 26% 8% — 9% 10% Net income growth 29% 11% 17% (9)% 20% (5)% 10% Effective Tax Rate 20.3% 20.3% 0.1% (13.7)% 1.0% 33.0% Diluted Earnings per Share $0.69 $0.69 ($0.05) $0.12 ($0.03) $0.65 Full-Year 2014 - Increase / (Decrease) As Reported 2013 MDL Accrual1 Non-GAAP Restructuring2 Tax Reorganization3 Acquisitions4 Excluding All Impacts Net revenue growth 14% — 14% — — 2% 12% Total operating expense growth 14% (3)% 17% 2% — 6% 8% Net income growth 16% 2% 14% (2)% 4% (2)% 13% Effective Tax Rate 28.8% 28.8% — (2.7)% (0.1)% 31.6% Diluted Earnings per Share $3.10 $3.10 ($0.05) $0.12 ($0.04) $3.07
