Attached files
| file | filename |
|---|---|
| 8-K - 8-K - Virtu KCG Holdings LLC | d862691d8k.htm |
| EX-99.1 - EX-99.1 - Virtu KCG Holdings LLC | d862691dex991.htm |
 KCG Holdings, Inc. (NYSE: KCG)
4
Quarter
2014
Earnings
Presentation
January 30, 2015
th
Exhibit 99.2 |
 Safe Harbor
Certain statements contained herein may constitute "forward-looking
statements" within the meaning of the safe harbor provisions of the U.S. Private
Securities Litigation Reform Act of 1995. Forward-looking statements are
typically identified by words such as "believe," "expect," "anticipate," "intend,"
"target," "estimate," "continue," "positions,"
"prospects" or "potential," by future conditional verbs such as "will," "would," "should," "could" or "may," or
by variations of such words or by similar expressions. These
"forward-looking statements" are not historical facts and are based on current
expectations, estimates and projections about KCG's industry, management's
beliefs and certain assumptions made by management, many of which, by
their nature, are inherently uncertain and beyond our control. Any
forward-looking statement contained herein speaks only as of the date on which it is
made. Accordingly, readers are cautioned that any such forward-looking
statements are not guarantees of future performance and are subject to certain
risks, uncertainties and assumptions that are difficult to predict including,
without limitation, risks associated with: (i) the strategic business
combination (the "Mergers") of Knight Capital Group, Inc.
("Knight") and GETCO Holding Company, LLC ("GETCO"), including, among other things, (a)
difficulties and delays in integrating the Knight and GETCO businesses or fully
realizing cost savings and other benefits, (b) the inability to sustain
revenue and earnings growth, and (c) customer and client reactions to the
Mergers; (ii) the August 1, 2012 technology issue that resulted in Knight's
broker-dealer subsidiary sending numerous erroneous orders in NYSE-listed
and NYSE Arca securities into the market and the impact to Knight's
business as well as actions taken in response thereto and consequences thereof;
(iii) the sale of KCG's reverse mortgage origination and securitization
business, sale of KCG's futures commission merchant and the agreement to sell KCG
Hotspot; (iv) changes in market structure, legislative, regulatory or
financial reporting rules, including the increased focus by regulators, the New
York Attorney General, Congress and the media on market structure issues,
and in particular, the scrutiny of high frequency trading, alternative trading systems, market fragmentation, colocation, access to market data
feeds, and remuneration arrangements such as payment for order flow and exchange
fee structures; (v) past or future changes to organizational structure and
management; (vi) KCG's ability to develop competitive new products and services in a timely manner and the acceptance of such products
and services by KCG's customers and potential customers; (vii) KCG's ability to
keep up with technological changes; (viii) KCG's ability to effectively
identify and manage market risk, operational and technology risk, legal risk,
liquidity risk, reputational risk, counterparty and credit risk, international
risk, regulatory risk, and compliance risk; (ix) the cost and other effects of
material contingencies, including litigation contingencies, and any adverse
judicial, administrative or arbitral rulings or proceedings; and (x) the effects
of increased competition and KCG's ability to maintain and expand market
share. The list above is not exhaustive. Readers should carefully review the
risks and uncertainties disclosed in KCG's reports with the SEC, including,
without limitation, those detailed under "Risk Factors" in KCG's Annual
Report on Form 10-K for the year-ended December 31, 2013, under "Certain
Factors Affecting Results of Operations" in KCG's Quarterly Report on Form
10-Q for the period ended September 30, 2014, and other reports or
documents KCG files with, or furnishes to, the SEC from time to time.
For additional disclosures, please see https://www.kcg.com/legal/global-disclosures. |
 4th Quarter 2014 Summary
Solid financial results amid improved market conditions in U.S. equities and
certain segments of global equities, fixed income, currencies and
commodities U.S.
equity
market
making
grew
market
share
of
“retail”
SEC
Rule
605
U.S.
equity
share
volume as the quarter progressed
Algorithmic trading and order routing established a new quarterly record for
average daily U.S. equity share volume
Released
$45
million
in
excess
capital
from
the
consolidation
of
U.K.
broker
dealers
Completed the sale of KCG’s futures commission merchant (FCM)
Subsequent
to
the
4th
quarter,
announced
the
sale
of
KCG
Hotspot
to
BATS
1 |
 KCG Financial Results
Pre-Tax Earnings (Loss) from Continuing Operations By Business Segment
(in thousands)
(unaudited)
For the three months ended
December 31, 2013
September 30, 2014
December 31, 2014
Market Making
Revenues
$ 232,519
$ 166,620
$ 238,740
Expenses
184,569
174,653
196,030
Pre-tax earnings (loss)
47,951
(8,033)
42,710
Global Execution Services
Revenues
84,065
79,218
93,369
Expenses
88,557
80,882
83,401
Pre-tax earnings (loss)
(4,491)
(1,664)
9,968
Corporate and Other
Revenues
6,790
26,464
14,030
Expenses
66,949
32,002
40,177
Pre-tax earnings (loss)
(60,159)
(5,538)
(26,147)
Consolidated
Revenues
323,374
272,302
346,139
Expenses
340,073
287,537
319,608
Pre-tax earnings (loss)
$ (16,699)
$ (15,235)
$ 26,531
Notes:
4th quarter 2014 results include a $2.1 million gain from the sale of the FCM as
well as expenses of $6.1 million related to less loss accruals 3rd quarter
2014 results include a $15.1 million net gain related to the Company’s strategic investment in tradeMONSTER, which combined with
OptionsHouse, as well as expenses of $10.8 million related to a reduction in
workforce and other separations as well as a lease loss accrual 4th
quarter 2013 results include expenses of $36.5 million related to a writeoff of capitalized debt costs, a reduction in workforce and additional
merger-related expenses and writedowns
2 |
 Market Conditions
Sources:
BATS
Global
Markets,
VistaOne
Solutions,
Thomson
Reuters,
OCC,
CSI,
Bloomberg,
Reuters,
EBS,
SIFMA,
TRACE,
MSRB;
*
4Q14
SEC
Rule
605
U.S.
equity
share
volume
includes
an
estimate of December 2014 total based on public and proprietary data
3
Avg. daily volume in select securities markets
4Q13
3Q14
4Q14
Consolidated U.S. equity share volume
6.1 bn
5.7 bn
7.1 bn
“Retail”
SEC
Rule
605
U.S.
equity
share
volume*
783.0 mn
672.5 mn
783.3 mn
ETF share volume
633.2 mn
666.6 mn
1,024.7 mn
Consolidated U.S. equity dollar volume
$229.8 bn
$236.1 bn
$291.3 bn
U.S. equity futures contracts
2.8 mn
3.4 mn
3.9 mn
U.S. options contracts
16.2 mn
16.3 mn
17.9 mn
European equity notional value traded (USD)
$943.9 bn
$1,019.8 bn
$1,176.4 bn
Asian equity share volume
7.2 bn
6.2 bn
6.1 bn
U.S. Treasury notional volume
$297.1 bn
$489.6 bn
$506.6 bn
U.S. corporate bond notional volume
$17.1 bn
$18.7 bn
$19.7 bn
Transactions under 250 bonds
13,011
11,024
11,747
FX notional value traded (USD) among reporting venues
$213.3 bn
$237.9 bn
$271.5 bn
A marked upturn in global equities ex-Asia
Generally improved market conditions in global fixed
income, currencies and commodities
Average daily consolidated U.S. equity share volume
Average daily consolidated U.S. equity dollar volume
Average realized volatility for the S&P 500
Market conditions in U.S. equities
18.6
4.1
15.7
8,000
$400,000
6,000
$300,000
4,000
$200,000
2,000
$100,000
October
November
December
4Q14
-
Consolidated U.S. equity share volume rose 24.3% while
dollar volume increased 23.4% quarter over quarter
-
European equity notional value traded rose 15.4%
-
Asian equity share volume declined 1.6%
-
In fixed income, U.S. Treasury notional volume rose 3.5%
quarter over quarter while U.S. corporate bond notional
volume increased 5.3%
-
In foreign exchange, notional value traded among reporting
venues rose 14.1% QoQ
-
An increase in volatility among certain commodities
|
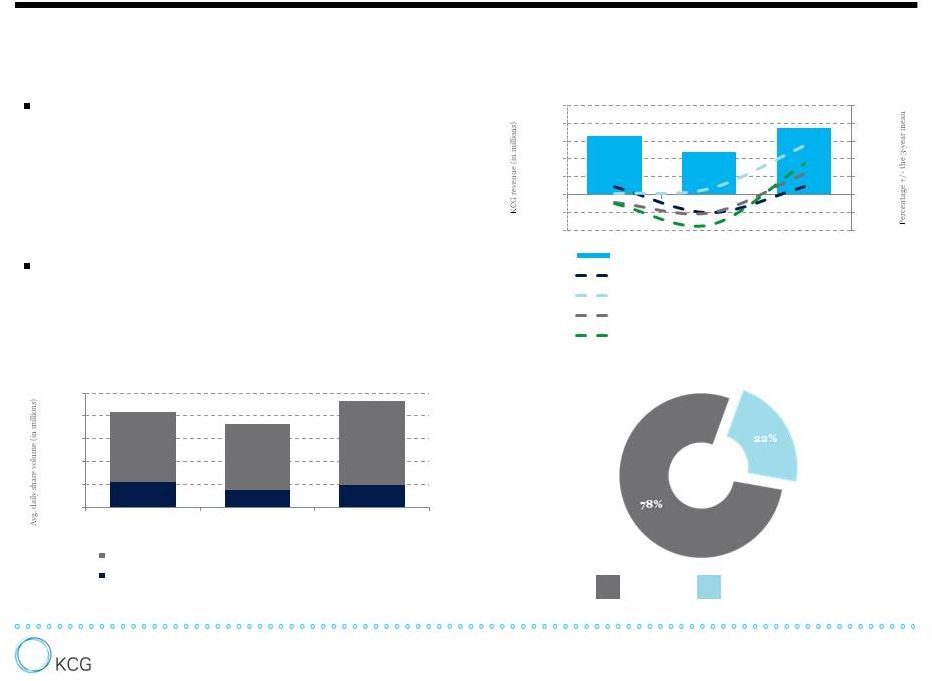 The Market Making Segment
Strong results driven by a rebound in retail trading
activity and an active U.S. equity market
-
KCG’s avg. daily SEC Rule 605 U.S. equity volume rose
27.3% quarter over quarter amid higher market-wide retail
trading activity and KCG market share gains
-
KCG’s avg. daily NYSE-
and NASDAQ-listed share volume
rose 28.3% QoQ while dollar volume including OTCs
increased 27.9%
Improved results from non-U.S. equities
-
A better operating environment QoQ for European equities
and certain classes of FICC
4Q14
Market
Making
revenue
distribution
†
4
U.S. equities
Non-U.S. equities
-20%
-10%
0%
10%
20%
30%
40%
50%
-$100
-$50
$0
$50
$100
$150
$200
$250
4Q13
3Q14
4Q14
Primary drivers of revenues from U.S. equities*
KCG revenue from U.S. equity market making
Avg. daily SEC Rule 605 U.S equity share volume
Avg. daily consolidated U.S equity dollar volume
Avg. daily consolidated U.S equity share volume
Avg. realized volatility for the S&P 500
832.8
727.3
933.4
217.3
152.1
193.6
0
200
400
600
800
1,000
4Q13
3Q14
4Q14
KCG retail and total exchange-listed volume
KCG avg. daily exchange-listed share volume
KCG avg. daily SEC Rule 605 U.S equity share volume
Sources: KCG, SEC, VistaOne Solutions; * 4Q14 SEC Rule 605 share volume
includes an estimate of December 2014 total based on public and proprietary data.
†
Revenue from market making in U.S. equities of $185.6 million in the fourth
quarter of 2014 is a factor, along with total dollar volume during the quarter of $1.99 trillion that
results in average revenue capture of 0.93 basis points. Market making in
non-U.S. equities includes European and Asian equities, fixed income, currencies and commodities.
|
 Renewed Strength in Retail Trading Activity
5
Sources: KCG, SEC, VistaOne Solutions. Estimated marketwide gross and net retail
flows are a function of the gross and net dollar value of all SEC Rule 605-eligible buys and sells executed by KCG
during a given month scaled up based on market share among the core set of
wholesalers. Estimate of December 2014 SEC Rule 605 volume based on public and proprietary data.
KCG’s Individual Investor Gauge represents estimated market-wide
gross and net retail investor flows based on public and proprietary data
derived from monthly SEC Rule 605-eligible volume. Estimated
market-wide gross retail flows CAGR of 33% from 1Q13 to 4Q14
Estimated
market-wide
net
retail
inflows
of
$143
billion
from
2012
through
2014
following
outflows
of $83 billion from 2009 through 2011
Gross CAGR of 33%
Net outflows of $83 billion
Net inflows of $143 billion
$0
$50
$100
$150
$200
$250
$300
$350
$400
$450
$500
$550
$600
$650
$700
$750
-$25
-$20
-$15
-$10
-$5
$0
$5
$10
$15
$20
$25
Market-
wide net (est.)
Market-
wide gross (est.) |
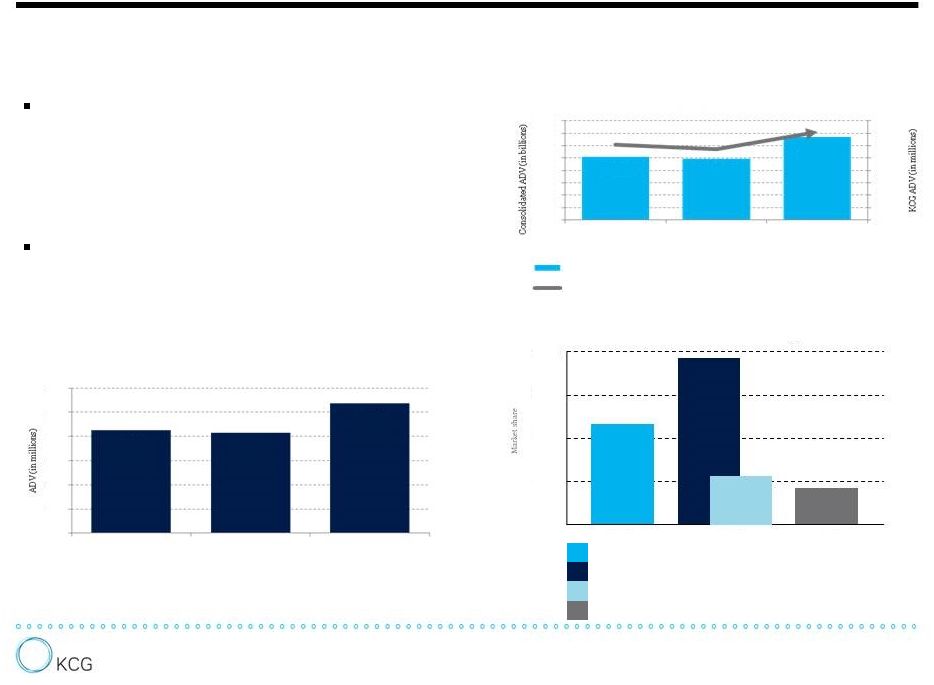 The Global Execution Services Segment
6
Sources: KCG, BATS Global Markets, Reuters, EBS, TRACE, MSRB
KCG Hotspot % of institutional spot FX notional dollar volume among reporting
venues KCG BondPoint % of interdealer corporate bond transactions
under 250 bonds
KCG BondPoint % of interdealer muni bond transactions under 250 bonds
Knight Match ATS % of dark U.S. equity liquidity
Market share of KCG trading venues
11.6%
19.2%
5.7%
4.1%
42.5
41.4
53.8
0
10
20
30
40
50
60
4Q13
3Q14
4Q14
KCG algorithmic trading and order routing
U.S. equity share volume from U.S. institutions
0
100
200
300
400
0.0
1.0
2.0
3.0
4.0
5.0
6.0
7.0
8.0
4Q13
3Q14
4Q14
KCG algorithmic trading and order routing
U.S. equity share volume
Avg. daily algorithmic trading and order routing U.S equity share volume
Avg. daily consolidated U.S. equity share volume
50
150
250
350
256.1
248.2
334.3
In agency execution, solid results driven by market
conditions and client growth
Among trading venues, sustained good performance
-
Algorithmic trading and order routing set a new quarterly
record for avg. daily share volume; ADV from algorithmic
trading by U.S. institutional clients rose 30% QoQ
-
Increased contributions QoQ from institutional equity
sales trading and ETF trading
-
KCG Hotspot increased avg. daily notional FX dollar volume
4.4% QoQ
-
KCG BondPoint grew avg. daily par value traded 3.9% QoQ
20%
15%
10%
5%
4Q14
4Q14
4Q14 |
 Consolidated Expenses
Compensation and Benefits rose $15 million
quarter over quarter due to higher net
revenues and increased bonus accruals
Communications and Data Processing
declined $1.6 million QoQ as a result of
reductions in connectivity and market data
costs
Professional Fees decreased $1.5 million QoQ,
attributable to lower consulting and legal fees
Depreciation and Amortization increased
$900,000 QoQ as a result of asset purchases
and deployments
Among transaction-based expenses, the
$700,000 decline in Payments for Order Flow
QoQ –
amid a rise in retail trading activity –
is due to a further shift to execution quality
and price improvement
7
†
See addendum for a reconciliation of GAAP to non-GAAP financial
results. Compensation and benefits
Communications and data processing
Depreciation and amortization
Debt interest expense
Professional fees
Occupancy and equipment rentals
Business development
Other |
 Additional Financials
Consolidated Statements of Financial Condition
(in millions)
(unaudited)
December 31, 2013
September 30, 2014
December 31, 2014
Cash and cash equivalents
$ 674.3
$ 540.5
$ 578.8
Debt
657.3
422.3
422.3
Stockholders’
equity
1,509.5
1,485.8
1,522.6
Debt-to-tangible equity ratio
0.51
0.33
0.31
Tangible book value per share
$10.64
$11.05
$11.72
Book value per share
$12.34
$12.68
$13.03
Shares outstanding including restricted
stock units (in thousands)
122,239
117,167
116,860
Tangible book value is calculated by subtracting goodwill and intangible assets
from equity. 8 |
 Announced Sale of KCG Hotspot
Subsequent to the fourth quarter of 2014, KCG announced a definitive agreement to
sell spot fixed income ECN KCG Hotspot to BATS Global Markets
Upon the close, the transaction is expected to increase KCG’s tangible book
value by approximately $2.00 per share
9
Under the terms of the agreement:
Assets and liabilities held for sale on the balance sheet dated December 31, 2014
are related to Hotspot
The transaction is expected to close in the second quarter of 2015
-
KCG will receive $365 million in cash upon the close of the transaction
-
KCG
and
BATS
will
share
certain
tax
benefits,
which
could
result
in
further
payments
to
KCG
of
up
to approximately $70 million in the three-year period following the
close |
 |
 Regulation G Reconciliation of Non-GAAP
Financial Measures (Continuing Operations)
3 months ended December 31, 2014
Market Making
Global Execution
Services
Corporate and Other
Consolidated
Reconciliation of GAAP pre-tax to non-GAAP pre-tax:
GAAP income (loss) from continuing operations before income taxes
$ 42,710
$ 9,968
$ (26,147)
$ 26,531
Gain on sale of FCM
-
(2,116)
-
(2,116)
Writedown of assets and lease loss accrual, net
-
-
6,117
6,117
Non-GAAP income (loss) from continuing operations before income taxes
$ 42,710
$ 7,852
$ (20,030)
$ 30,532
10 |
 3
months ended September 30, 2014 Market Making
Global Execution
Services
Corporate and
Other
Consolidated
Reconciliation of GAAP pre-tax to non-GAAP pre-tax:
GAAP loss from continuing operations before income taxes
$ (8,033)
$ (1,664)
$ (5,538)
$ (15,235)
Net gain related to tradeMONSTER combination with OptionsHouse
-
-
(15,105)
(15,105)
Compensation related to reduction in workforce and other employee
separations 2,786
3,577
4,158
10,521
Writedown of assets and lease loss accrual, net
-
-
301
301
Non-GAAP (loss) income from continuing operations before income taxes
$ (5,247)
$ 1,913
$ (16,184)
$ (19,518)
Regulation G Reconciliation of Non-GAAP
Financial Measures (Continuing Operations)
11 |
 Regulation G Reconciliation of Non-GAAP
Financial Measures (Continuing Operations)
3 months ended December 31, 2013
Market Making
Global Execution
Services
Corporate and
Other
Consolidated
Reconciliation of GAAP pre-tax to non-GAAP pre-tax:
GAAP income (loss) from continuing operations before income taxes
$ 47,951
$ (4,491)
$ (60,159)
$ (16,699)
Compensation and other expenses related to a reduction in workforce
5,254
5,447
708
11,409
Professional and other fees related to Mergers and August 1st technology
issue -
-
2,785
2,785
Writedown of capitalized debt costs
-
-
13,209
13,209
Gain on strategic asset
-
-
(1,359)
(1,359)
Writedown of assets and lease loss accrual
-
1,681
8,819
10,500
Non-GAAP income (loss) from continuing operations before income taxes
$ 53,205
$ 2,637
$ (35,997)
$ 19,845
12 |
 3
months ended December 31, 2014 GAAP
Adjustments for
non-GAAP presentation
KCG adjusted, normalized
expenses
Reconciliation of GAAP expenses to normalized non-GAAP expenses:
Employee compensation and benefits
116,214
0
116,214
Communications and data processing
36,945
0
36,945
Depreciation and amortization
21,224
0
21,224
Debt interest expense
7,721
0
7,721
Professional fees
5,695
0
5,695
Occupancy and equipment rentals
8,514
0
8,514
Business development
2,308
0
2,308
Writedown of assets and lease loss accrual, net
6,117
6,117
0
Other
9,822
0
9,822
Total expenses
$ 214,561
$ 6,117
$ 208,444
Regulation G Reconciliation of Non-GAAP
Financial Measures (Continuing Operations)
13 |
 Regulation G Reconciliation of Non-GAAP
Financial Measures (Continuing Operations)
3 months ended September 30, 2014
GAAP
Adjustments for
non-GAAP presentation
KCG adjusted, normalized
expenses
Reconciliation of GAAP expenses to normalized non-GAAP expenses:
Employee compensation and benefits
95,307
10,521
84,786
Communications and data processing
38,576
-
38,576
Depreciation and amortization
20,298
-
20,298
Debt interest expense
7,714
-
7,714
Professional fees
7,161
-
7,161
Occupancy and equipment rentals
7,672
-
7,672
Business development
3,163
-
3,163
Writedown of assets and lease loss accrual, net
301
301
-
Other
10,580
-
10,580
Total expenses
$ 190,772
$ 10,822
$ 179,950
14 |
 3
months ended December 31, 2013 GAAP
Adjustments for
non-GAAP presentation
KCG adjusted, normalized
expenses
Reconciliation of GAAP expenses to normalized non-GAAP expenses:
Employee compensation and benefits
112,209
11,409
100,800
Communications and data processing
37,512
-
37,512
Depreciation and amortization
19,566
-
19,566
Debt interest expense
12,943
-
12,943
Professional fees
7,734
2,491
5,243
Occupancy and equipment rentals
9,358
-
9,358
Business development
1,923
-
1,923
Writedown of capitalized debt costs
13,209
13,209
-
Writedown of assets and lease loss accrual
10,500
10,500
-
Other
13,066
294
12,772
Total expenses
$ 238,020
$ 37,903
$ 200,117
Regulation G Reconciliation of Non-GAAP
Financial Measures (Continuing Operations)
15 |
 |