Attached files
| file | filename |
|---|---|
| EX-99.1 - EX-99.1 - SunCoke Energy, Inc. | d863511dex991.htm |
| EX-99.3 - EX-99.3 - SunCoke Energy, Inc. | d863511dex993.htm |
| 8-K - 8-K - SunCoke Energy, Inc. | d863511d8k.htm |
 SunCoke Energy,
Inc. Q4 2014 Earnings
& 2015 Guidance
Conference Call
January 29, 2015
Exhibit 99.2 |
 Forward-Looking Statements
1
SXC Q4/ FY 2014 Earnings & 2015 Guidance Call
This slide presentation should be reviewed in conjunction with the Fourth Quarter 2014
earnings and 2015 guidance release of SunCoke Energy, Inc. (SXC) and the conference
call held on January 29, 2015 at 11:30 a.m. ET. Some of the information included in
this presentation constitutes “forward-looking statements” as defined in Section 27A of the Securities Act of
1933, as amended and Section 21E of the Securities Exchange Act of 1934, as amended. All
statements in this presentation that express opinions, expectations, beliefs, plans,
objectives, assumptions or projections with respect to anticipated future performance of SXC or SunCoke
Energy Partners, L.P. (SXCP), in contrast with statements of historical facts, are
forward-looking statements. Such forward-looking statements are based on
management’s beliefs and assumptions and on information currently available. Forward-looking statements include information
concerning possible or assumed future results of operations, business strategies, financing
plans, competitive position, potential growth opportunities, potential operating
performance improvements, the effects of competition and the effects of future legislation or regulations.
Forward-looking statements include all statements that are not historical facts and may be
identified by the use of forward-looking terminology such as the words
“believe,” “expect,” “plan,” “intend,” “anticipate,” “estimate,” “predict,” “potential,” “continue,” “may,” “will,” “should” or
the negative of these terms or similar expressions.
Although management believes that its plans, intentions and expectations reflected in or
suggested by the forward-looking statements made in this presentation are
reasonable, no assurance can be given that these plans, intentions or expectations will be achieved when anticipated or at
all. Moreover, such statements are subject to a number of assumptions, risks and
uncertainties. Many of these risks are beyond the control of SXC and SXCP, and
may cause actual results to differ materially from those implied or expressed by the forward-looking statements. Each of SXC
and SXCP has included in its filings with the Securities and Exchange Commission cautionary
language identifying important factors (but not necessarily all the important factors)
that could cause actual results to differ materially from those expressed in any forward-looking statement.
For more information concerning these factors, see the Securities and Exchange Commission
filings of SXC and SXCP. All forward-looking statements included in this
presentation are expressly qualified in their entirety by such cautionary statements. Although forward-looking
statements are based on current beliefs and expectations, caution should be taken not to place
undue reliance on any such forward-looking statements because such statements speak
only as of the date hereof. SXC and SXCP do not have any intention or obligation to update publicly
any forward-looking statement (or its associated cautionary language) whether as a result
of new information or future events or after the date of this presentation, except as
required by applicable law. This presentation includes certain non-GAAP financial
measures intended to supplement, not substitute for, comparable GAAP measures.
Reconciliations of non-GAAP financial measures to GAAP financial measures are provided in
the Appendix at the end of the presentation. Investors are urged to consider carefully
the comparable GAAP measures and the reconciliations to those measures provided in the Appendix. |
 2014
Overview Accomplishments & Challenges
Operating Performance
•
Sustained solid full year operating, safety and environmental performance in
coke, logistics and coal despite weather-challenged Q1
•
Completed Indiana Harbor refurbishment, but facility turnaround still in
progress; delivered FY ‘14 Adj. EBITDA of $16.4M but fell short of guidance
•
Completed construction of Haverhill 2 gas sharing project ahead of schedule
Business Restructuring
•
Executed two dropdown transactions, most recently 75% of Granite City
•
Unable
to
sell
coal
mining
business
as
planned;
initiated
rationalization
plan
to
scale back operations; recorded ~$150M non-cash impairments
•
Continuing
significant
M&A
efforts
despite
inability
to
consummate
transaction
•
Given depressed Indian coke pricing, recorded ~$30M non-cash impairment
Capital Allocation
•
Declared first quarterly cash dividend
•
Completed $75M ASR; additional $75M authorized for repurchase
•
2014 GP/IDR cash flows of $2.1M
•
Delevered
SXC
balance
sheet;
solid
cash
position
and
significant
revolver
capacity provide strong foundation for growth
2
SXC Q4/ FY 2014 Earnings & 2015 Guidance Call |
 Value of
GP/IDR Cash
Flows
Value of
SXCP LP Units
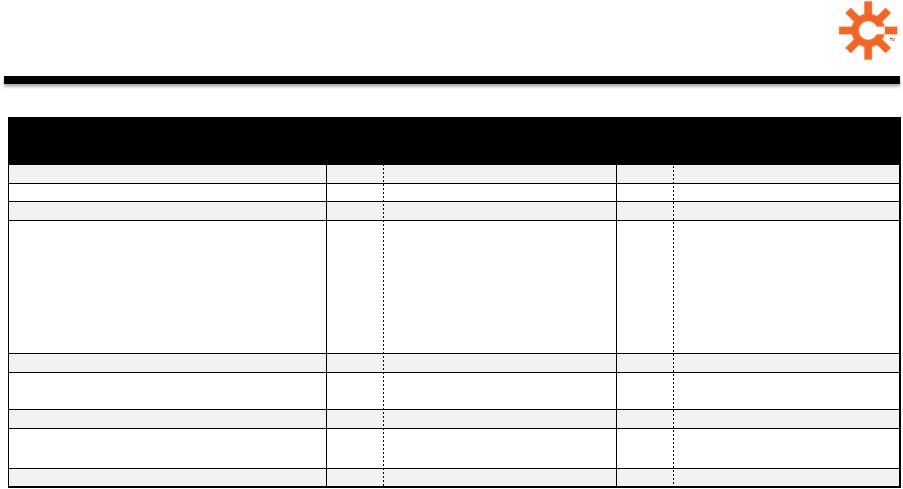
Granite City Dropdown Transaction
Expected Impact from Dropdown
Potential Impact to
SXC Equity Value
3
•
DCF per LP unit accretion of ~5%,
or $0.10 -
$0.11
2
•
~$52M additional LP/GP units
•
$135M debt pay down
•
$45M pre-fund environmental
obligation
•
At 25% IDR splits today
As 56% LP owner, SXC
is major beneficiary to
unit price and cash
distribution upside
Transaction structured
to delever and ensure
tax efficiency
Estimated
EBITDA Multiple
~8.0x
(1)
~0.9x
(2)
~1.0x
(3)
~9.9x
3
SXC Q4/ FY 2014 Earnings & 2015 Guidance Call
(1)
Based on $245M transaction value over ~$30M EBITDA run-rate for 75% interest in Granite
City. (2)
Unit price change of 5%, assuming constant yield and constant cash distribution coverage ratio
on ~5% accretion. (3)
Assumes 20x value for GP/IDR cash flow.
75% dropdown of Granite City executed at ~9.9x total EBITDA multiple
At target coverage,
2015 GP/IDR cash
flow expected to
be >$5.0M
Direct
Transaction
Value
1 |
 Q4 & FY 2014
Earnings Overview 4
SXC Q4/ FY 2014 Earnings & 2015 Guidance Call
Adj. EBITDA from Cont. Ops. up $7.2M in Q4
and $16.0M in FY
•
Improvement at Indiana Harbor, Jewell Coke
and Brazil plus lower Corporate costs
•
FY benefited from Coal Logistics acquisitions
•
At low end of $235M -
$255M guidance
(2)
FY Consolidated Adj. EBITDA
(3)
of $210.7M
•
Impacted by year-end Black Lung valuation
charge of $12.3M
•
As previously disclosed, Black Lung charges
drove results below $220M -
$240M
guidance
(4)
Q4 and FY EPS from Cont. Ops. loss reflects
•
$30.5M India joint venture impairment and
Legacy Black Lung impacts in Q4 and FY
•
Coal prep. plant impairment and accelerated
depreciation at Indiana Harbor impacted FY
($ in millions)
Q4 ‘14
$70.0
Q4 ‘13
$62.8
FY ‘13
$237.8
FY ‘14
$221.8
$0.22
Q4 ‘13
Q4 ‘14
($0.38)
FY ‘13
$0.58
($0.29)
FY ‘14
($/share)
(1)
For a definition and reconciliation of Adjusted EBITDA from Continuing
Operations and Adjusted EBITDA (Consolidated), please see
appendix. (2)
Guidance range provided in July 2014 earnings presentation.
(3)
Excludes impairment charges and estimated costs incurred to exit Coal business.
(4)
Revised guidance range provided in April 2014 earnings presentation.
|
 Q4 & FY 2014
Financial Results (1)
Coke Adjusted EBITDA includes Domestic Coke, Brazil Coke and India Coke segments.
(2)
For a definition and reconciliation of Adjusted EBITDA from Continuing Operations,
please see appendix.
5
SXC Q4/ FY 2014 Earnings & 2015 Guidance Call
Continuing Ops. Adj. EBITDA
up 11.5% in Q4 and 7.2% in FY
•
Q4 Domestic Coke benefited
from
–
Indiana Harbor up $7.3M
–
Jewell up on favorable
comparison due to prior year
quality issues
–
Offset by Granite City, down on
higher outage costs
•
Q4 Coal logistics impacted by
higher O&M expenses
•
Q4 Corporate costs down $2.6M
due to lower employee costs
Q4 and FY Discontinued Ops.
loss (net of tax benefits) of
$40.1M and $106.0M
($ in millions, except volumes and
per share)
Q4 '14
Q4 '13
Q4 '14 vs.
Q4 '13
FY '14
FY '13
FY '14 vs.
FY '13
Domestic Coke Sales
Volumes
1,103
1,047
56
4,184
4,263
(79)
Coal Transloading Volumes
4,301
3,649
652
19,037
3,785
15,252
Coke Adj. EBITDA
(1)
$75.2
$70.0
$5.2
$263.7
$260.2
$3.5
Coal Logistics Adj. EBITDA
$3.4
$4.0
($0.6)
$14.3
$4.7
$9.6
Corporate and Other
($8.6)
($11.2)
$2.6
($40.2)
($43.1)
$2.9
Adj. EBITDA from
Continuing Ops.
(2)
$70.0
$62.8
$7.2
$237.8
$221.8
$16.0
Revenue
$388.1
$388.0
$0.1
$1,472.7
$1,585.5
($112.8)
Operating Income
$30.8
$41.5
($10.7)
$109.8
$136.5
($26.7)
Net Income from Continuing
Ops. attributable to SXC
($25.3)
$15.4
($40.7)
($20.1)
$40.5
($60.6)
Earnings Per Share from
Continuing Ops.
($0.38)
$0.22
($0.60)
($0.29)
$0.58
($0.87)
Net Loss from
Discontinued Ops.
($40.1)
($4.4)
($35.7)
($106.0)
($15.5)
($90.5)
Loss Per Share from
Discontinued Ops.
($0.60)
($0.06)
($0.54)
($1.54)
($0.22)
($1.32) |
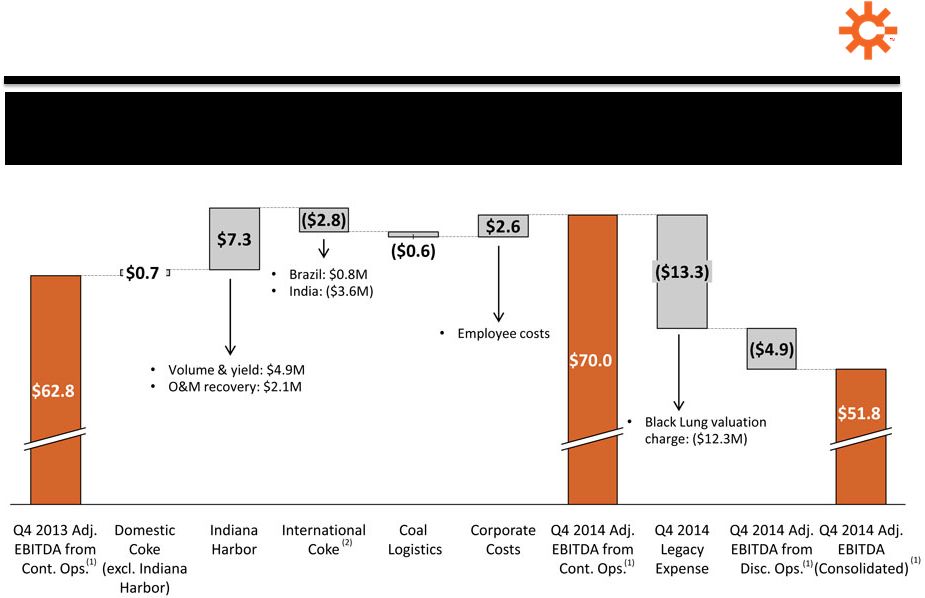 Adjusted
EBITDA (1)
–
Q4 ‘14 vs. Q4 ‘13
($ in millions)
Improved Indiana Harbor results & lower Corporate costs benefited Q4
6
SXC Q4/ FY 2014 Earnings & 2015 Guidance Call
(1)
Q4 2013 Adj. EBITDA (Consolidated) totaled $59.7 million. For a definition and reconciliation of Adjusted EBITDA from Continuing Operations, Adjusted EBITDA
from Discontinued Operations and Adjusted EBITDA (Consolidated), please see appendix.
(2)
Includes Brazil Coke and India Coke
|
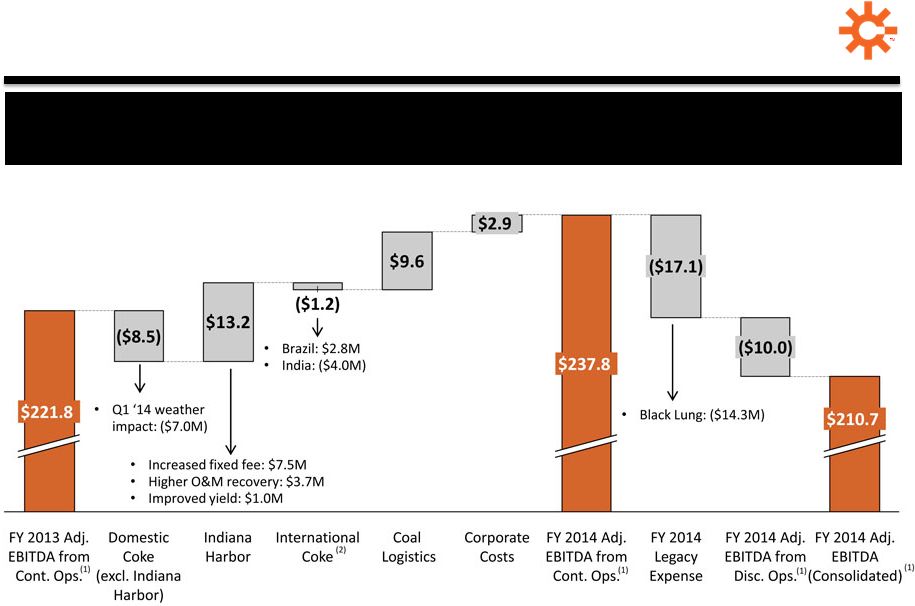 Adjusted
EBITDA (1)
–
FY ‘14 vs. FY ‘13
($ in millions)
Indiana Harbor and Coal Logistics benefited FY results
7
SXC Q4/ FY 2014 Earnings & 2015 Guidance Call
(1)
FY 2013 Adj. EBITDA (Consolidated) totaled $215.1 million. For a definition and reconciliation
of Adjusted EBITDA from Continuing Operations, Adjusted EBITDA from Discontinued
Operations and Adjusted EBITDA (Consolidated), please see appendix.
(2)
Includes Brazil Coke and India Coke |
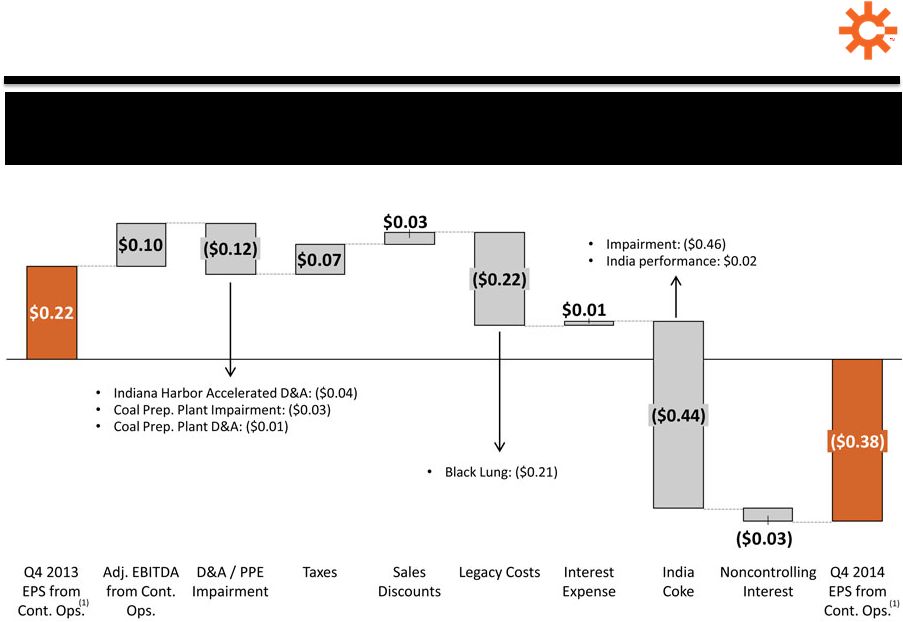 Diluted
EPS (1)
–
Q4 ‘14 vs. Q4 ‘13
India impairment and Legacy costs drove Q4 ‘14 EPS loss
($ per share)
(1)
Represents EPS from Continuing Operations attributable to SXC.
8
SXC Q4/ FY 2014 Earnings & 2015 Guidance Call |
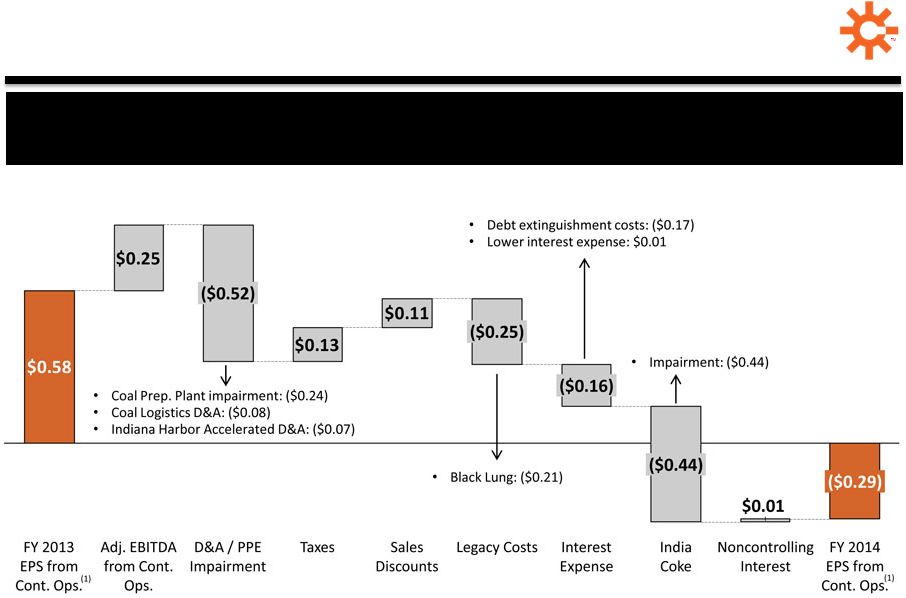 Diluted
EPS (1)
–
FY ‘14 vs. FY ‘13
India and Prep. Plant impairment, depreciation
and Legacy costs drove FY ‘14 EPS loss
($ per share)
9
SXC Q4/ FY 2014 Earnings & 2015 Guidance Call
(1)
Represents EPS from Continuing Operations attributable to SXC. |
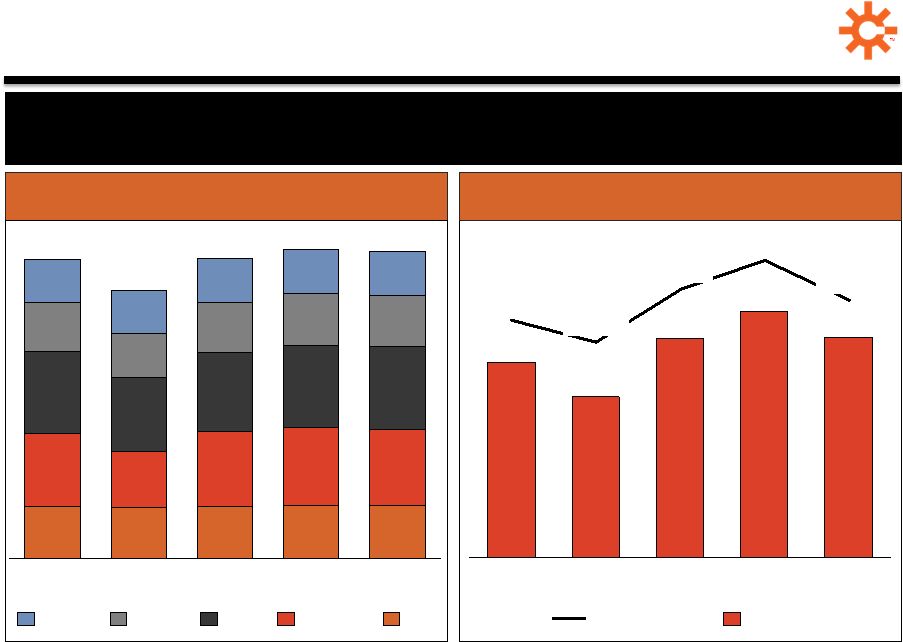 Domestic Coke
Business Summary Q4 ‘14 Adjusted EBITDA per ton of $58
FY ‘14 Adj. EBITDA per ton of $59 impacted by Q1 weather
Domestic Coke Production
(thousands of tons)
(1)
For a definition of Adjusted EBITDA and Adjusted EBITDA/Ton and reconciliations,
see appendix.
184
178
184
185
185
255
199
264
275
270
291
264
279
292
296
172
153
177
182
177
154
150
155
155
156
Q4 ‘14
1,083
Q3 ‘14
1,090
Q2 ‘14
1,059
Q1 ‘14
944
Q4 ‘13
1,056
Jewell
Indiana Harbor
Haverhill
Granite City
Middletown
$64
$72
$64
$47
$57
Q2 ‘14
$61/ton
Q1 ‘14
$49/ton
Q4 ‘13
$54/ton
Q4 ‘14
$58/ton
Q3 ‘14
$67/ton
Adjusted EBITDA
Adjusted EBITDA/ton
Domestic Coke Adjusted EBITDA
(1)
Per Ton
($ in millions, except per ton amounts)
10
SXC Q4/ FY 2014 Earnings & 2015 Guidance Call |
 Indiana Harbor
Performance 2014 Coke Production
(thousands of tons)
Q4 ‘14 production below guidance
•
Exited year with solid yields
•
Ovens pushed per day challenged
–
Experienced two major equipment failures
–
Oven-push cycle and scheduling below target
•
New PCM commissioning slower than
expected
Achieving 1,220K ton nameplate
capacity attainable, but timing delayed
•
Expect Q1 ‘15 to be 30K-
40K tons below
run rate on weak January start
•
Prioritizing completion of floor and sole
flue replacements
•
2015E total capex ~$15M vs. $39M in 2014
270
275
264
199
Q3 ‘14
Q4 ‘14
Q2 ‘14
Q1 ‘14
Q4 ‘14 Guidance
285K –
295K tons
11
SXC Q4/ FY 2014 Earnings & 2015 Guidance Call |
 Discontinued
Operations Q4 ‘14 Adj. EBITDA from Disc.
Ops. loss of $4.9M vs. $4.6M in
Q4 ‘13
•
Average coal sales price down
$17 per ton, largely offset by
lower cash costs and volumes
FY ‘14 Adj. EBITDA from Disc.
Ops. loss of $10.0M reflects
similar coal price and production
cost dynamics
•
At tight end of guidance range
(2)
Q4 ‘14 rationalization plan
impacts
•
Further asset impairment of $29.1M
•
Contract termination expense of
$6.0M (vs. ~$10M estimate)
•
Employee severance costs of
$11.6M (vs. $10M -
$15M estimate)
Loss on Disc. Ops., net of tax
Income tax benefit
($106.0M)
$18.5M
($66.2M)
Depreciation and depletion
$10.2M
Adj. EBITDA from Disc. Operations
(1)
($10.0M)
Adj. EBITDA from Disc. Ops.
12
SXC Q4/ FY 2014 Earnings & 2015 Guidance Call
Exit Costs (contract term. & severance)
$133.5M
Asset impairment
Q4 ‘14
FY ‘14
($40.1M)
$17.6M
($12.3M)
$0.8M
($4.9M)
$29.1M
(1) For a definition and reconciliation of Adjusted EBITDA from
Discontinued Operations, please
see appendix.
(2) Revised guidance range of ($10M) –
($13M) provided in October 2014 earnings presentation. |
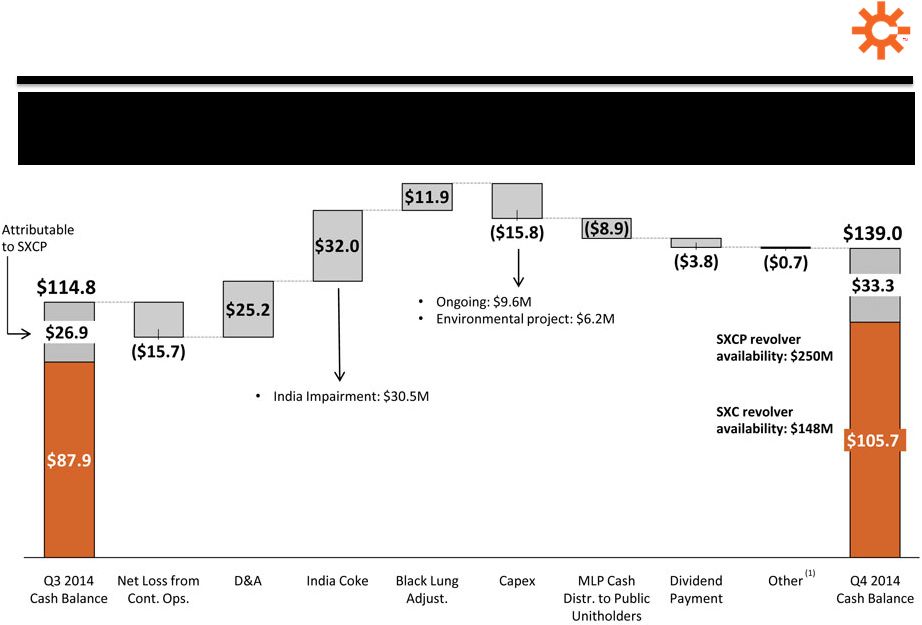 Liquidity
Position Ended quarter with solid cash position and significant revolver capacity
13
SXC Q4/ FY 2014 Earnings & 2015 Guidance Call
(1)
Includes ($0.1) million in working capital, $1.0 million in other financing activities and
($1.6) million of cash used in Discontinued Operations. |
 GUIDANCE
14
SXC Q4/ FY 2014 Earnings & 2015 Guidance Call
**********
**********
**********
**********
********** |
 15
Operations
Excellence
Growth Strategy
Capital and
Structure
Optimization
2015 priorities include sustained focus on operations excellence,
growth initiatives and capital optimization to enhance valuation
2015 Priorities
SXC Q4/ FY 2014 Earnings & 2015 Guidance Call
•
Sustain high-level operating, safety & environmental performance
•
Improve Indiana Harbor performance; return to name plate run-rate
•
Execute coal rationalization plan & optimize standalone Jewell Coke
•
Complete construction of gas sharing project at Haverhill 1
•
Pursue MLP-qualifying, industrial-facing processing and handling M&A
opportunities
•
Continue development of greenfield opportunities, including potential
construction of new coke plant and/or DRI facility
•
Intend to execute at least one additional dropdown in 2015
•
Build upon capital allocation strategy initiated in 2014 |
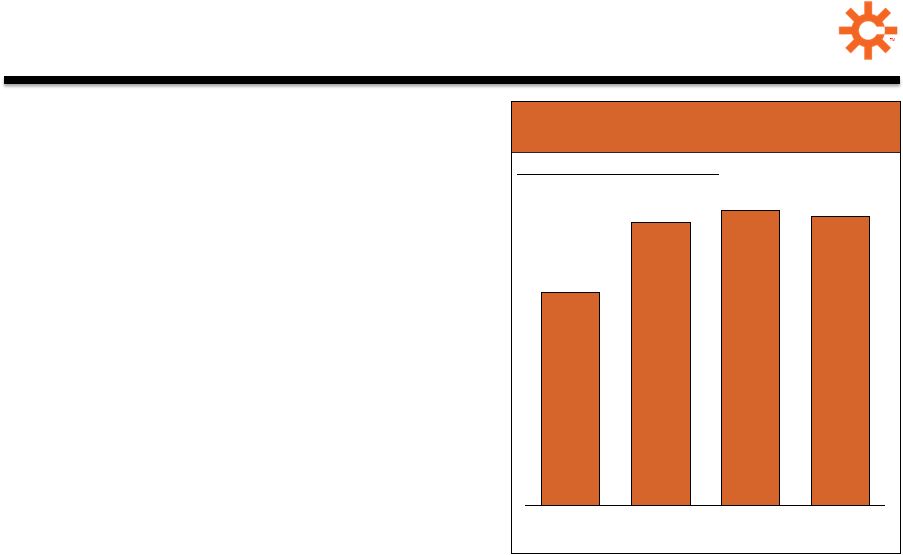
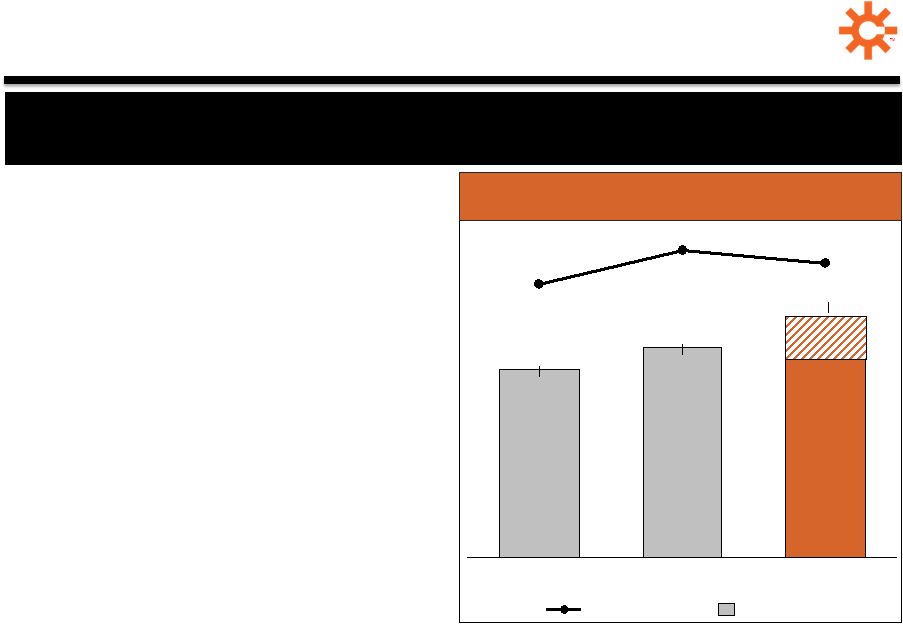 2015 Domestic
Coke Business Outlook 2015E Adj. EBITDA per ton of $55 –
$60 reflects Jewell Coke
standalone impacts and outlook for Indiana Harbor
16
FY 2015E
$55 -
$60/ton
FY 2014
$248M
$59/ton
FY 2013
$243M
$57/ton
Adjusted EBITDA
Adjusted EBITDA/ton
Domestic Coke Adjusted EBITDA
(1)
Per Ton
($ in millions, except per ton amounts)
2015 Domestic Coke Adj. EBITDA
outlook of $240M -
$255M
reflects:
•
Solid operating performance with
production of ~4.3M tons
•
Expected ongoing impacts of Jewell
Coke
standalone costs of ~$7.5M
–
Primarily for blending/handling
costs and coal moisture
•
Improvement at Indiana Harbor,
but below $40M targeted run-rate
SXC Q4/ FY 2014 Earnings & 2015 Guidance Call
$240M -
$255M
(1)
For a definition and reconciliation of Adjusted EBITDA and Adjusted EBITDA/Ton ,
see appendix. |
 2015 Indiana
Harbor Outlook Operating environment remains challenged
•
Steep learning curve on post-refurbishment oven performance and new
equipment
•
Existing equipment reliability and oven-push cycles impacting scheduling and
productivity
•
2015 focus on establishing firm oven-push cycles, mastering new PCMs,
improving equipment maintenance practices and completing floor and sole
flue replacements
2015
Adjusted EBITDA outlook of $25M –
$35M
•
Expect Q1 to be 30K-
40K tons below run rate on weak January start
•
Maintain flexibility across fleet to cover shortfalls if needed
•
Lower overall total operating and maintenance expenses but reduced cost
recovery
SXC Q4/ FY 2014 Earnings & 2015 Guidance Call
Indiana Harbor expected 2015 Adj. EBITDA of $25M –
$35M reflects
Q1 production outlook and contract cost recovery economics
17 |
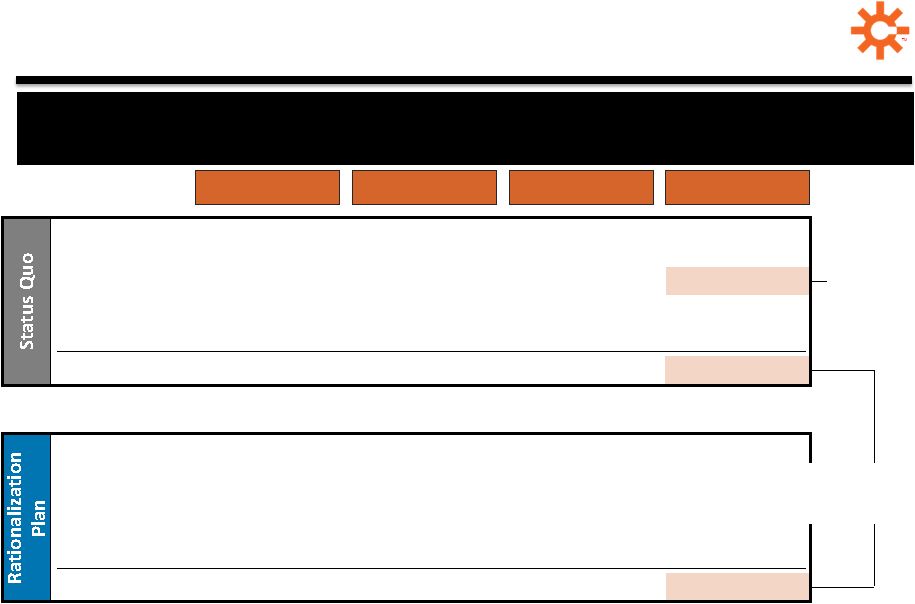
 2015 Coal
Rationalization Plan Plan preserves optionality to sell while balancing impact to Jewell
Coke 18
SXC Q4/ FY 2014 Earnings & 2015 Guidance Call
Dec. 2014
Announcement
•
Reduced coal production by
>50%, idling mines,
eliminating positions and
reducing prep. plant
operations
•
Substantially decreased
Coal Mining cash loss
outlook
•
Contract termination: $10M
($6M FY ‘14 actual)
•
Employee severance and other
one-time costs: $10M -
$15M
(~$12.5M FY ‘14 actual)
2015 Coal
Rationalization Plan
•
Implement contract mining model
for ~0.6M tons of coal
•
Purchase ~0.5M tons of coal from
3
rd
parties
•
Transition to 3
rd
party coal
washing (Q1/Q2);
decommission
existing prep. plant (Q2/Q3)
•
Install coal handling/blending
capabilities (Q1/Q2)
•
2015E Adj. EBITDA from Disc.
Ops. expected loss of ~$20M
•
Estimate
$5M
-
$10M
of
capex
for handling/storage
infrastructure at Jewell Coke
Long-term
Coal Supply
•
Maintain optionality for
securing least-cost Jewell Coke
coal supply
•
Preserves flexibility to shift
between contract mining &
purchased coal
•
Reduces impact to Jewell Coke
coal blend & operations
•
Expect run-rate Adj. EBITDA
from Disc. Ops. loss of
~$12.5M at current prices
•
Potential upside should
market prices recover
Guidance:
Guidance:
Guidance: |
 Benefits of
Coal Rationalization Plan SXC Q4/ FY 2014 Earnings & 2015 Guidance Call
19
Expect rationalization plan to generate $20M run-rate difference vs.
operating status quo
FY 2013
FY 2014
FY 2015E
(1)
FY 2016E
(1)
Adjusted EBITDA
from Disc. Ops.
Jewell Coke
Standalone Costs
Cash Loss
(4)
($6.3M)
-
($26.4M)
($10.0M)
-
($17.1M)
($31.5M)
-
($40.5M)
($31.5M)
-
($40.5M)
Capital
Expenditures
(2)
($20.1M)
($7.1M)
($9.0M)
Adjusted EBITDA
from Disc. Ops.
Jewell Coke
Standalone Costs
Cash Loss
(4)
-
-
-
-
-
-
($20.0M)
($7.5M)
($12.5M)
($7.5M)
($20.0M)
Capital
Expenditures
(3)
-
-
($5.0M) –
($10.0M)
-
($32.5M) –
($37.5M)
Announced $20M
run-rate difference
Excludes
$50M –
$70M for
new prep. plant
($9.0M)
(1)
2015 and 2016 status quo estimates assume $90/ton coal price and targeted $120 cash cost per
ton on ~1.1M tons. (2)
Represents Coal Mining business capex only.
(3)
Represents capex to install coal handling and storage infrastructure to enable third-party
coal purchases for our Jewell Coke facility. (4)
Equals Adjusted EBITDA from Disc. Ops. less capex less Jewell Coke standalone costs.
Excludes financial impact of Legacy Costs. |
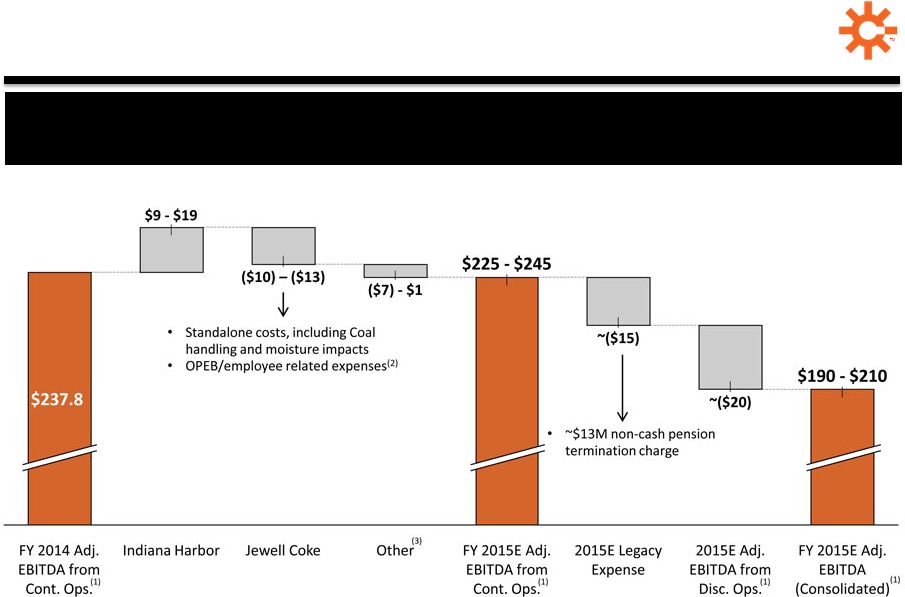 Expected 2015
Adjusted EBITDA (1)
($ in millions)
2015 Adj. EBITDA
(1)
outlook is flat, with Jewell Coke standalone cost
impacts offset by Indiana Harbor improvement
20
SXC Q4/ FY 2014 Earnings & 2015 Guidance Call
(1)
For a definition and reconciliation of Adjusted EBITDA from Continuing Operations, Adjusted
EBITDA from Discontinued Operations and Adjusted EBITDA (Consolidated), please see
appendix. (2)
Expiration of OPEB credits recognized in prior years.
(3)
Includes incremental Corporate costs for growth initiatives and India JV losses, partially offset by increases in Brazil and Coal Logistics volumes. |
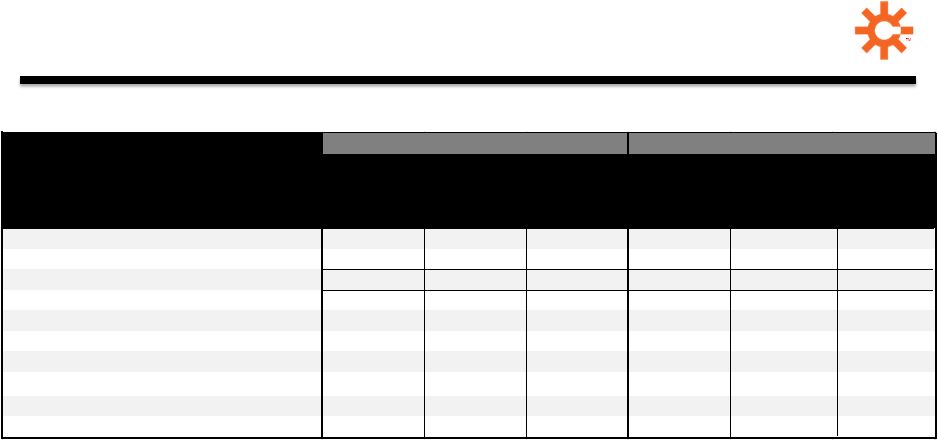
 Consolidated
Guidance Summary 21
Metric
2014 Actual
2015 Guidance
Adjusted EBITDA
(1)
Continuing Operations
Consolidated
Attributable to SXC
$237.8 million
$210.7 million
$150.0 million
$225 –
$245 million
$190 –
$210 million
$115 –
$130 million
Capital Expenditures
~$125 million
~$90 million
Domestic Coke Production
~4.2 million tons
~4.3 million tons
Dom. Coke Adj. EBITDA / ton
$59 / ton
$55 -
$60 / ton
Operating Cash Flow
$112.3 million
$125 -
$145 million
Cash Taxes
(2)
$7.0 million
$10 -
$15 million
SXC Q4/ FY 2014 Earnings & 2015 Guidance Call
(1)
Please see appendix for a definition and reconciliation of 2014 and 2015E Adjusted
EBITDA. (2)
Included in Operating Cash Flow. |
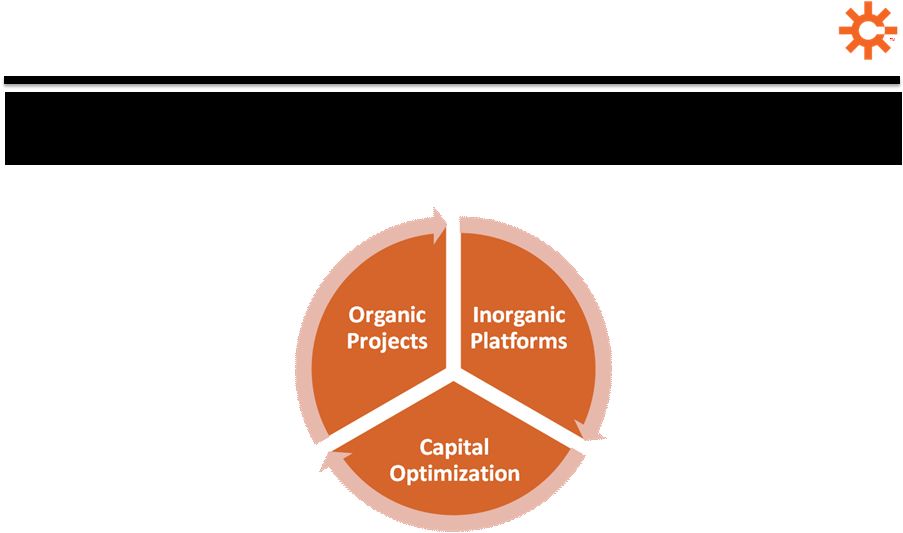 Shareholder
Value Creation 22
SXC Q4/ FY 2014 Earnings & 2015 Guidance Call
Shareholder value creation via organic and inorganic growth projects,
backed by disciplined capital management
Pursue organic growth projects that
leverage our operational strengths and
greenfield development capabilities
Acquire industrial-facing processing
and handling assets to drive further
SXCP distribution growth
•
Acquire raw material processing and
handling assets which would be a
natural fit for SXCP (e.g., manageable
commodity exposure)
•
Our core manufacturing and logistics
competencies provide solid basis for
acquisitions across a number of
verticals
•
Expands qualifying income for SXCP,
grows GP cash flows and adds new
platforms for growth
•
Continue pursuit of Kentucky coke
plant development as our macro
coke market thesis plays out
•
Actively pursuing select DRI
projects to leverage our greenfield
experience and access to
advantaged capital via SXCP
Maximize return on capital
for shareholders via the
appropriate financial levers
•
Evaluate dividend increases as GP/LP cash flows grow
•
Maintain $75M authorization for opportunistic share repurchases
•
Expect 8% -
10% cash distribution CAGR at SXCP through 2016 from
domestic coke dropdowns alone
•
Plan to increase SXCP cash distributions by 2% per quarter in 2015
|
 Steel
Industry 23
SXC Q4/ FY 2014 Earnings & 2015 Guidance Call
Recent capital markets sentiment & industry environment
has shifted negatively for steelmakers
US primary demand outlook reasonable
•
Resilient automotive demand
•
Continued non-residential construction recovery
•
Expect challenges within tubular/oil & gas segment
Steel pricing under pressure
•
Constructive industry consolidation in 2014 (e.g., TK, Severstal, Gallatin)
•
Elevated level of imports
•
Strong US dollar challenging domestic producers
On the other hand, commodity prices provide continued
tailwinds on carbon, scrap and, to an extent, iron ore
•
Energy inputs also favorable
Customers continue to rationalize aged cokemaking capacity |
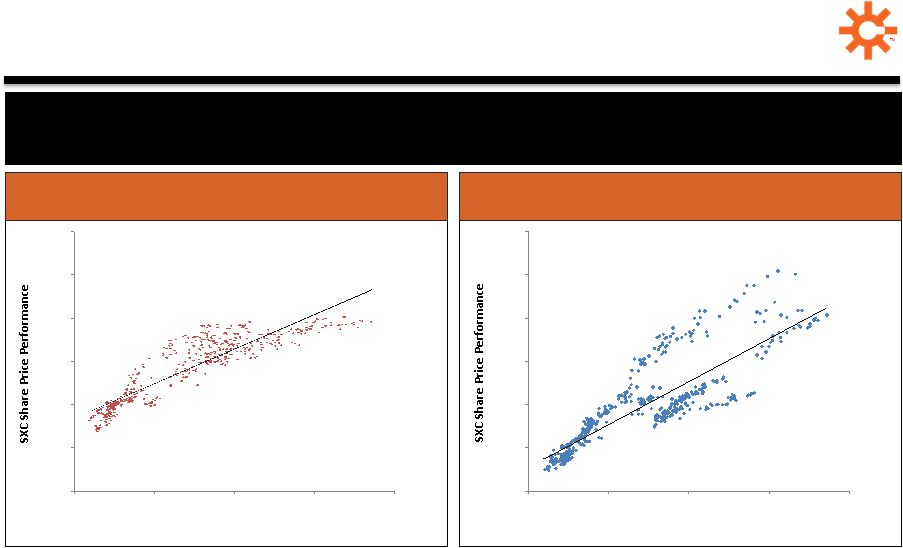 SXC Share Price
Correlation 24
SXC Q4/ FY 2014 Earnings & 2015 Guidance Call
50%
75%
100%
125%
150%
175%
200%
50%
100%
150%
200%
250%
50%
75%
100%
125%
150%
175%
200%
50%
100%
150%
200%
250%
Historical Share Price Correlation to AK Steel
(1,2)
Correlation Coefficient = 0.90
Historical Share Price Correlation to US Steel
(1,2)
Correlation Coefficient = 0.82
AKS Share Price Performance
X Share Price Performance
SunCoke Energy historical share price performance
highly correlated to AK Steel and US Steel
(1)
Two-year Share Price Correlation calculated from January 2, 2013 through January 16,
2015. (2)
Correlation graphs plot share price performance as a percentage of January 2, 2013 price
(i.e., >100% represents closing price above January 2, 2013 share price,
while <100% represents closing price below January 2, 2013 share price)
|
 Key Investment
Considerations 25
Strong investment thesis remains intact
Stable, Long-Term
Cash Flows
Strong Balance Sheet
Potential Growth
Opportunities
Visible Dropdown
Structure
Effective Capital
Allocation
•
Long-term, take-or-pay contracts at strategic customer assets
•
Profit and return on capital generated via fixed-fee structure
•
Pass-through of coal and operating costs in addition to taxes,
transportation and future environmental costs
•
Essentially no net debt at parent; Net Debt/EBITDA at SXCP ~3x
•
~$400M revolver capacity at SXC and SXCP combined
•
Ability to leverage both balance sheets provides M&A financing flexibility
•
Limited legacy obligations
•
Exploring industrial-facing processing & handling M&A which generates
qualifying income and fits SXC business model & core competencies
•
Continue development of greenfield opportunities, including potential
construction of new coke plant and/or DRI facility
•
Declining ongoing and environmental capex
•
Completed $75M ASR; additional $75M authorized for repurchase
•
Initiated
dividend
during
October
which
was
linked
to
GP/LP
cash
flows
•
Executing
upon
strategy
to
transition
toward
“pure-play”
GP
•
Intend
to
execute
at
least
one
additional
dropdown
in
2015,
with
remaining
asset dropdowns to be executed through 2016
SXC Q4/ FY 2014 Earnings & 2015 Guidance Call |
 QUESTIONS
26
SXC Q4/ FY 2014 Earnings & 2015 Guidance Call
*****
*****
*****
*****
*****
***** |
 Investor
Relations 630-824-1907
www.suncoke.com |
 APPENDIX
28
SXC Q4/ FY 2014 Earnings & 2015 Guidance Call
*******
*******
*******
*******
*******
******* |
 Definitions
Adjusted EBITDA
represents earnings before interest, taxes, depreciation, depletion and amortization
(“EBITDA”) adjusted for impairments, costs related to exiting our Coal
business, sales discounts and the interest, taxes, depreciation, depletion and amortization attributable to our equity
method investment. Prior to the expiration of our nonconventional fuel tax credits in
2013, EBITDA reflects sales discounts included as a reduction in sales and other
operating revenue. The sales discounts represent the sharing with customers of a portion of nonconventional fuel tax credits,
which reduce our income tax expense. However, we believe our Adjusted EBITDA would be
inappropriately penalized if these discounts were treated
as
a
reduction
of
EBITDA
since
they
represent
sharing
of
a
tax
benefit
that
is
not
included
in
EBITDA.
Accordingly,
in
computing
Adjusted
EBITDA, we have added back these sales discounts. Our Adjusted EBITDA also includes EBITDA
attributable to our equity method investment. EBITDA and Adjusted EBITDA do not
represent and should not be considered alternatives to net income or operating income under GAAP and may
not be comparable to other similarly titled measures in other businesses. Management
believes Adjusted EBITDA is an important measure of the operating performance of the
SXC's net assets and provides useful information to investors because it highlights trends in our business that may
not otherwise be apparent when relying solely on GAAP measures and because it eliminates items
that have less bearing on our operating performance. Adjusted EBITDA is a measure
of operating performance that is not defined by GAAP, does not represent and should not be
considered a substitute for net income as determined in accordance with GAAP.
Calculations of Adjusted EBITDA may not be comparable to those reported by other
companies. EBITDA
represents earnings before interest, taxes, depreciation, depletion and amortization.
Adjusted
EBITDA
attributable
to
SXC/SXCP
equals
consolidated
Adjusted
EBITDA
less
Adjusted
EBITDA
attributable
to
noncontrolling
interests.
Adjusted EBITDA/Ton
represents Adjusted EBITDA divided by tons sold.
Adjusted EBITDA from Continuing Operations
equals consolidated Adjusted EBITDA less Adjusted EBITDA from Discontinued Operations less
Legacy Costs.
Adjusted
EBITDA
from
Discontinued
Operations
equals
Coal
business
Adjusted
EBITDA
excluding
Corporate
cost
allocation
attributable
to
Coal,
costs related to exiting our Coal business and certain retained Coal-related costs
reclassified as Legacy Costs. Legacy
Costs
equals
royalty
revenues,
Coal
pension/OPEB,
Coal
workers’
compensation,
black
lung,
prep.
plant
and
certain
other
Coal-related
costs
that we expect to retain after sale of the Coal business.
29
SXC Q4/ FY 2014 Earnings & 2015 Guidance Call |
 Reconciliation
of Net Income to Adjusted EBITDA 30
SXC Q4/ FY 2014 Earnings & 2015 Guidance Call
($ in millions)
FY 2014
Q4 2014
Q3 2014
Q2 2014
Q1 2014
FY 2013
Q4 2013
Q3 2013
Q2 2013
Q1 2013
Net Income/(Loss)
($101.8)
($55.8)
$6.4
($48.6)
($3.8)
$50.1
$18.7
$12.3
$12.7
$6.4
Subtract: Net Loss from Discontinued Operations
(106.0)
(40.1)
(18.5)
(41.2)
(6.2)
(15.5)
(4.4)
(3.6)
(2.8)
(4.7)
Net Income/(Loss) from Continuing Operations
$4.2
($15.7)
$24.9
($7.4)
$2.4
$65.6
$23.1
$15.9
$15.5
$11.1
Depreciation, depletion and amortization
96.1
25.1
22.5
24.0
24.5
77.1
19.5
18.8
19.0
19.8
Interest expense, net
63.2
12.1
11.9
27.1
12.1
52.3
12.3
12.1
12.1
15.8
Income tax expense/(benefit)
7.4
2.4
7.5
(1.3)
(1.2)
16.4
6.4
1.5
2.7
5.8
Legacy expense/(income)
17.1
13.3
0.9
1.4
1.5
0.4
(1.5)
0.3
0.7
0.9
Asset impairment
(1)
16.8
1.7
-
15.1
-
-
-
-
-
-
Sales discounts
(0.5)
-
-
-
(0.5)
6.8
1.1
2.2
2.1
1.4
Adjustment to unconsolidated affiliate earnings
(2)
33.5
31.1
0.3
1.1
1.0
3.2
1.9
0.3
1.0
-
Adjusted EBITDA from Continuing Operations
$237.8
$70.0
$68.0
$60.0
$39.8
$221.8
$62.8
$51.1
$53.1
$54.8
Legacy (expense)/income
(17.1)
(13.3)
(0.9)
(1.4)
(1.5)
(0.4)
1.5
(0.3)
(0.7)
(0.9)
Adjusted EBITDA from Discontinued Operations
(10.0)
(4.9)
(2.8)
2.2
(4.5)
(6.3)
(4.6)
(0.1)
-
(1.6)
Adjusted EBITDA (consolidated)
$210.7
$51.8
$64.3
$60.8
$33.8
$215.1
$59.7
$50.7
$52.4
$52.3
Adjusted EBITDA attributable to noncontrolling
interests
(3)
(60.7)
(18.7)
(18.2)
(14.5)
(9.3)
(41.2)
(12.2)
(9.9)
(10.7)
(8.4)
Adjusted EBITDA attributable to SXC
$150.0
$33.1
$46.1
$46.3
$24.5
$173.9
$47.5
$40.8
$41.7
$43.9
(1)
Includes portion of coal impairment attributable to Continuing Operations.
(2)
Represents SunCoke’s share of India JV interest, taxes and depreciation expense.
Includes $30.5M impairment of our equity method investment in India in Q4 and FY 2014.
(3)
Represents Adjusted EBITDA attributable to SXCP public unitholders and DTE Energy’s
interest in Indiana Harbor. |
 ($ in
millions) FY 2014
Q4 2014
Q3 2014
Q2 2014
Q1 2014
FY 2013
Q4 2013
Q3 2013
Q2 2013
Q1 2013
Net Loss from Discontinued Operations
($106.0)
($40.1)
($18.5)
($41.2)
($6.2)
($15.5)
($4.4)
($3.6)
($2.8)
($4.7)
Depreciation, depletion and amortization
10.2
0.8
0.3
4.6
4.5
18.9
6.0
4.4
4.4
4.1
Interest expense, net
-
-
-
-
-
-
-
-
-
-
Income tax benefit
(66.2)
(12.3)
(1.4)
(49.5)
(3.0)
(9.7)
(6.2)
(0.9)
(1.6)
(1.0)
Asset impairment
133.5
29.1
16.4
88.0
-
-
-
-
-
-
Exit Costs
18.5
17.6
0.4
0.3
0.2
-
-
-
-
-
Adjusted EBITDA from Discontinued Operations
($10.0)
($4.9)
($2.8)
$2.2
($4.5)
($6.3)
($4.6)
($0.1)
$0.0
($1.6)
Reconciliation of Net Income to Adjusted EBITDA
from Discontinued Operations
31
SXC Q4/ FY 2014 Earnings & 2015 Guidance Call |
 Reconciliation
of Segment Adjusted EBITDA and Adjusted EBITDA per ton
(1)
Represents SunCoke’s share of India JV interest, taxes and depreciation expense.
32
SXC Q4/ FY 2014 Earnings & 2015 Guidance Call
Reconciliation of Segment Adjusted EBITDA and Adjusted EBITDA per Ton
($ in millions, except per ton data)
Domestic
Coke
Brazil Coke
India
Coke
(1)
Coal Logistics
Corporate /
Other
Continuing
Operations
Discontinued
Operations
Legacy Costs
Combined
FY 2014
Adjusted EBITDA
$247.9
$18.9
($3.1)
$14.3
($40.2)
$237.8
($10.0)
($17.1)
$210.7
Sales Volume (thousands of tons)
4,184
1,516
177
19,037
Adjusted EBITDA per Ton
$59.25
$12.47
($17.51)
$0.75
Q4 2014
Adjusted EBITDA
$64.4
$12.2
($1.4)
$3.4
($8.6)
$70.0
($4.9)
($13.3)
$51.8
Sales Volume (thousands of tons)
1,103
419
38
4,301
Adjusted EBITDA per Ton
$58.39
$29.12
($36.84)
$0.79
Q3 2014
Adjusted EBITDA
$72.3
$2.5
($1.3)
$3.8
($9.3)
$68.0
($2.8)
($0.9)
$64.3
Sales Volume (thousands of tons)
1,074
431
38
4,772
Adjusted EBITDA per Ton
$67.32
$5.80
($34.21)
$0.80
Q2 2014
Adjusted EBITDA
$64.4
$2.5
($0.5)
$5.0
($11.4)
$60.0
$2.2
($1.4)
$60.8
Sales Volume (thousands of tons)
1,059
413
42
5,605
Adjusted EBITDA per Ton
$60.81
$6.05
($11.90)
$0.89
Q1 2014
Adjusted EBITDA
$46.8
$1.7
$0.1
$2.1
($10.9)
$39.8
($4.5)
($1.5)
$33.8
Sales Volume (thousands of tons)
948
252
60
4,359
Adjusted EBITDA per Ton
$49.37
$6.75
$1.67
$0.48
FY 2013
Adjusted EBITDA
$243.2
$16.1
$0.9
$4.7
($43.1)
$221.8
($6.3)
($0.4)
$215.1
Sales Volume (thousands of tons)
4,263
876
126
3,785
Adjusted EBITDA per Ton
$57.05
$18.38
$7.14
$1.24
Q4 2013
Adjusted EBITDA
$56.4
$11.4
$2.2
$4.0
($11.2)
$62.8
($4.6)
$1.5
$59.7
Sales Volume (thousands of tons)
1,047
222
53
3,649
Adjusted EBITDA per Ton
$53.87
$51.35
$41.51
$1.10 |
 2015E Guidance
Reconciliation (1)
Represents SunCoke’s share of India JV interest, taxes and depreciation expense.
(2)
Represents Adjusted EBITDA attributable to SXCP public unitholders and DTE Energy’s
interest in Indiana Harbor. 33
SXC Q4/ FY 2014 Earnings & 2015 Guidance Call
($ in millions)
2015E
Low
2015E
High
Net Income
$21
$38
Subtract: Net Loss from Discontinued Operations
(16)
(13)
Net Income from Continuing Operations
$37
$51
Depreciation, depletion and amortization
89
89
Interest expense, net
68
66
Income tax expense
12
20
Legacy expense
15
15
Adjustment to unconsolidated affiliate earnings
(1)
4
4
Adjusted EBITDA from Continuing Operations
$225
$245
Legacy expense
(15)
(15)
Adjusted EBITDA from Discontinued Operations
(20)
(20)
Adjusted EBITDA
$190
$210
Adjusted EBITDA attributable to noncontrolling interests
(2)
(75)
(80)
Adjusted EBITDA attributable to SXC
$115
$130 |
 Balance Sheet
& Debt Metrics 34
SXC Q4/ FY 2014 Earnings & 2015 Guidance Call
(1)
Assumes full effect of Granite City dropdown, inclusive of SXC bond repayment following
completion of call period. Incremental cash to SXCP includes $45M retained to
pre-fund environmental liabilities.
(2)
Represents FY 2014 Adjusted EBITDA from Continuing Operations for the period ended 12/31/2014
and mid-point of FY 2015 Adjusted EBITDA from Continuing Operations guidance for
proforma presentation. SXC
Consolidated
Attributable
to SXCP
Balance
Attributable
to SXC
SXC
Consolidated
Attributable
to SXCP
Balance
Attributable
to SXC
Cash
$139
$33
$106
$188
$82
$106
Revolver Capacity
398
250
148
398
250
148
Total Liquidity
$537
$283
$254
$586
$332
$254
Total Debt (Long and Short-term)
$652
$412
$240
$721
$616
$105
Net Debt (Total Debt less Cash)
513
378
134
533
533
(1)
Full Year Adj. EBITDA from Cont. Ops.
(2)
$238
$151
$150
$235
$174
$123
Total Debt/2014 Adj. EBITDA from Cont. Ops.
2.7x
2.7x
1.6x
3.1x
3.5x
0.9x
Net Debt/2014 Adj. EBITDA from Cont. Ops.
2.2x
2.5x
0.9x
2.3x
3.1x
0.0x
As of 12/31/2014
Proforma
(1)
Post-Granite City Transaction
($ in millions) |
  Capital
Expenditures 35
SXC Q4/ FY 2014 Earnings & 2015 Guidance Call
2015 Expected Capex
($ in millions)
SXC
SXCP
(1)
Consolidated
Ongoing
(4)
$28
$17
$45
Expansion
10
6
16
Environmental Project
0
29
29
Total CapEx from Continued Operations
$38
$52
$90
2014 Capex
($ in millions)
SXC
SXCP
(1)
Consolidated
Ongoing
(2)
$27
$17
$44
Expansion
4
0
4
Environmental Project
1
45
46
Indiana Harbor Refurbishment
24
0
24
Total CapEx from Continued Operations
$56
$62
$118
Ongoing: Discontinued Operations
(3)
7
0
7
Total CapEx (Consolidated)
$63
$62
$125
(1)
Represents SXCP capex on 100% basis. Includes Granite City in 2015.
(2)
Includes $3M ongoing Coal Logistics, $1M ongoing Prep. Plant and $40M in ongoing Coke CapEx,
including $13M related to Indiana Harbor oven floor and sole flue replacement work.
(3)
Includes ongoing CapEx related to Coal business excluding $1M related to Prep. Plant.
(4)
Consolidated includes approximately $42M in ongoing Coke Capex and $3M ongoing Coal
Logistics. |
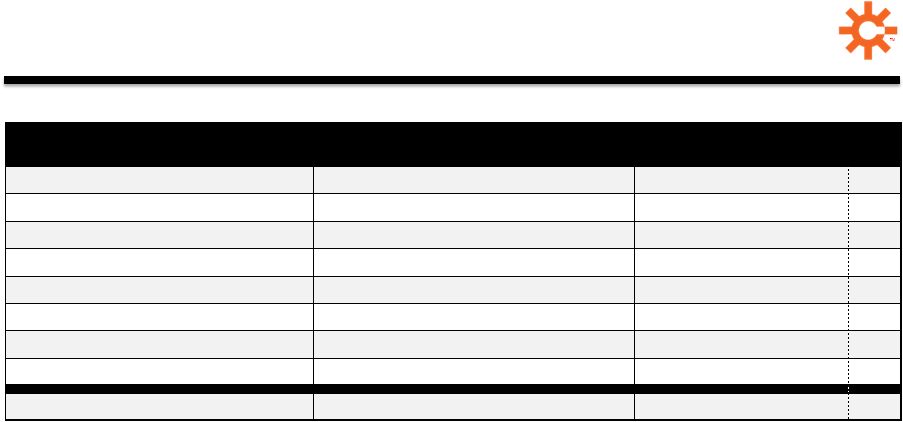 ($ in
millions) Segment
Financial Classification
Q1 '14
Q2 '14
Q3 '14
Q4 '14
FY '14
Asset Impairment - Disc. Ops.
Disc. Ops
Net Income from Disc. Ops.
-
$88.0
$16.4
$29.1
$133.5
Asset Impairment - Cont. Ops.
Cont. Ops.
Net Income from Cont. Ops.
-
15.1
-
1.7
16.8
Coal Exit Costs - Severance
Disc. Ops.
Net Income from Disc. Ops.
0.2
0.3
0.4
11.6
12.5
Coal Exit Costs - Contract Terminations
Disc. Ops.
Net Income from Disc. Ops.
-
-
-
6.0
6.0
Black Lung Valuation Charge
Legacy Costs
Adj. EBITDA (Consolidated)
-
-
-
12.3
12.3
OPEB Curtailment
(1)
Legacy Costs
Adj. EBITDA (Consolidated)
-
-
-
(2.5)
(2.5)
Asset Retirement Obligation (ARO) Valuation Charge
(1)
Legacy Costs
Adj. EBITDA (Consolidated)
-
-
-
1.9
1.9
Workers' Compensation
(1)
Legacy Costs
Adj. EBITDA (Consolidated)
-
-
-
0.6
0.6
India Impairment
Cont. Ops.
Net Income from Cont. Ops.
-
-
-
30.5
30.5
Q4 and FY 2014 Charges
36
SXC Q4/ FY 2014 Earnings & 2015 Guidance Call
(1)
Incremental charges incurred upon execution of Coal contingency plan.
|