Attached files
| file | filename |
|---|---|
| 8-K/A - 8-K/A - SLM Corp | d859545d8ka.htm |
| Exhibit 99.1
|
SALLIE MAE
Investor Presentation
FIRST QUARTER 2015
|
|
Cautionary Note Regarding Forward-Looking Statements
The following information is current as of January 22, 2015 (unless otherwise noted) and should be read in connection with SLM Corporation’s press release announcing its financial results for the quarter and year ended December 31, 2014, and the audited carve out financial statements filed on Form 8-K on May 6, 2014, and subsequent reports filed with the Securities and Exchange Commission (the “SEC”). Definitions for capitalized terms in this presentation not defined herein can be found in the 2013 Form 10-K (filed with the SEC on February 19, 2014).
This Presentation contains forward-looking statements and information based on management’s current expectations as of the date of this presentation. Statements that are not historical facts, including statements about the Company’s beliefs or expectations and statements that assume or are dependent upon future events, are forward-looking statements. Forward-looking statements are subject to risks, uncertainties, assumptions and other factors that may cause actual results to be materially different from those reflected in such forward-looking statements. These factors include, among others, the risks and uncertainties set forth in Item 1A “Risk Factors” and elsewhere in the Company’s Annual Report on Form 10-K for the year ended Dec. 31, 2013 (filed with the SEC on Feb. 19, 2014), the Company’s Quarterly Report on Form 10-Q for the quarter ended June 30, 2014, and the Company’s Quarterly Report on Form 10-Q for the quarter ended Sept. 30, 2014; increases in financing costs; limits on liquidity; increases in costs associated with compliance with laws and regulations; changes in accounting standards and the impact of related changes in significant accounting estimates; any adverse outcomes in any significant litigation to which the Company is a party; credit risk associated with the Company’s exposure to third parties, including counterparties to the Company’s derivative transactions; and changes in the terms of student loans and the educational credit marketplace (including changes resulting from new laws and the implementation of existing laws). The Company could also be affected by, among other things: changes in its funding costs and availability; failures of its operating systems or infrastructure, including those of third-party vendors; failure to implement the recently executed separation of the Company into two separate publicly traded companies, including failure to transition its origination and servicing operations as planned, increased costs in connection with being a stand-alone company, and failure to achieve the expected benefits of the separation; damage to its reputation; changes in the demand for educational financing or in financing preferences of lenders, educational institutions, studentsand their families; changes in law and regulations with respect to thestudent lending business and financial institutions generally; changes in banking rules and regulations, including increased capital requirements; increased competition from banks and other consumer lenders; the creditworthiness of its customers; changes in the general interest rate environment, including the rate relationships among relevant money-market instruments and those of its earning assets vs. its funding arrangements; and changes in general economic conditions. The preparation of the Company’s consolidated financial statements also requires management to make certain estimates and assumptions including estimates and assumptions about future events. These estimates or assumptions may prove to be incorrect. All forward-looking statements contained in this release are qualified by these cautionary statements and are made only as of the date of this release. The Company does not undertake any obligation to update or revise these forward-looking statements to conform the statement to actual results or changes in its expectations.
In connection with the spin-off of Navient Corporation, the Company conformed its policy with that of Sallie Mae Bank to charge off loans after 120 days of delinquency. The Company also changed its loss confirmation period from two years to one year to reflect both the shorter charge-off policy and its related servicing practices. Prior to the spin-off, Sallie Mae Bank sold all loans past 90 days delinquent to an affiliate of what is now Navient Corporation. Post-spin-off, sales of delinquent loans to Navient Corporation have been significantly curtailed. Consequently, many of the pre-spin-off, historical credit indicators and period over-period trends are not comparable and may not be indicative of future performance.
The Company reports financial results on a GAAP basis and also provides certain core earnings performance measures. The difference between the Company’s “Core Earnings” and GAAP results for the periods presented were the unrealized, mark-to-market gains/losses on derivative contracts. These are recognized in GAAP but not in “Core Earnings” results. The Company provides “Core Earnings” measures because this is what management uses when making management decisions regarding the Company’s performance and the allocation of corporate resources. The Company’s “Core Earnings” are not defined terms within GAAP and may not be comparable to similarly titled measures reported by other companies.
For additional information, see “Key Financial Measures-Core Earnings” in the Company’s Form 10-Q for the quarter ended September 30, 2014 for a further discussion, and the Company’s press release announcing its financial results for the quarter and year ended December 31, 2014 for a complete reconciliation between GAAP net income and core earnings.
2
|
|
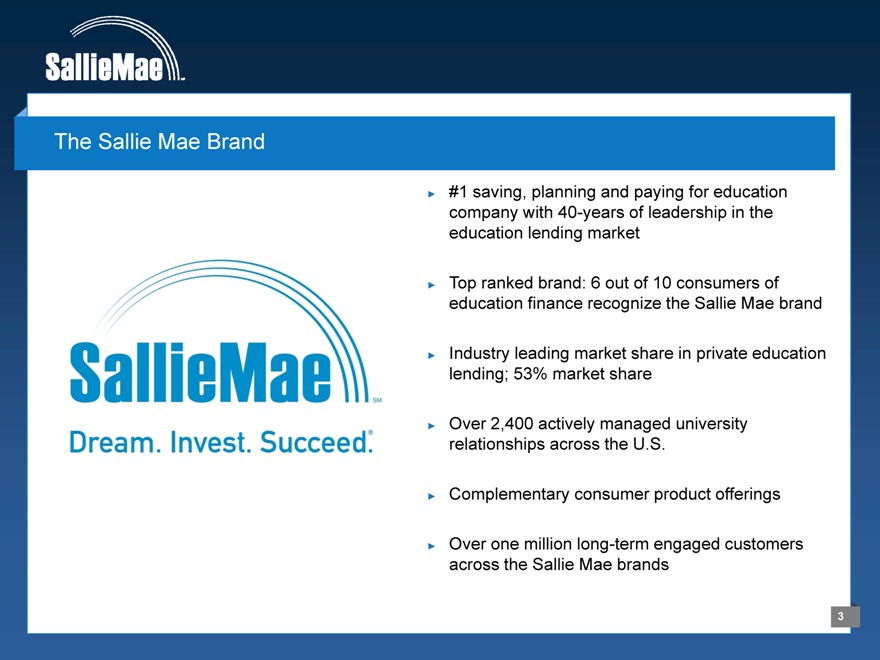
The Sallie Mae Brand
#1 saving, planning and paying for education company with 40-years of leadership in the education lending market
Top ranked brand: 6 out of 10 consumers of education finance recognize the Sallie Mae brand
Industry leading market share in private education lending; 53% market share
Over 2,400 actively managed university relationships across the U.S.
Complementary consumer product offerings
Over one million long-term engaged customers across the Sallie Mae brands
3
|
|
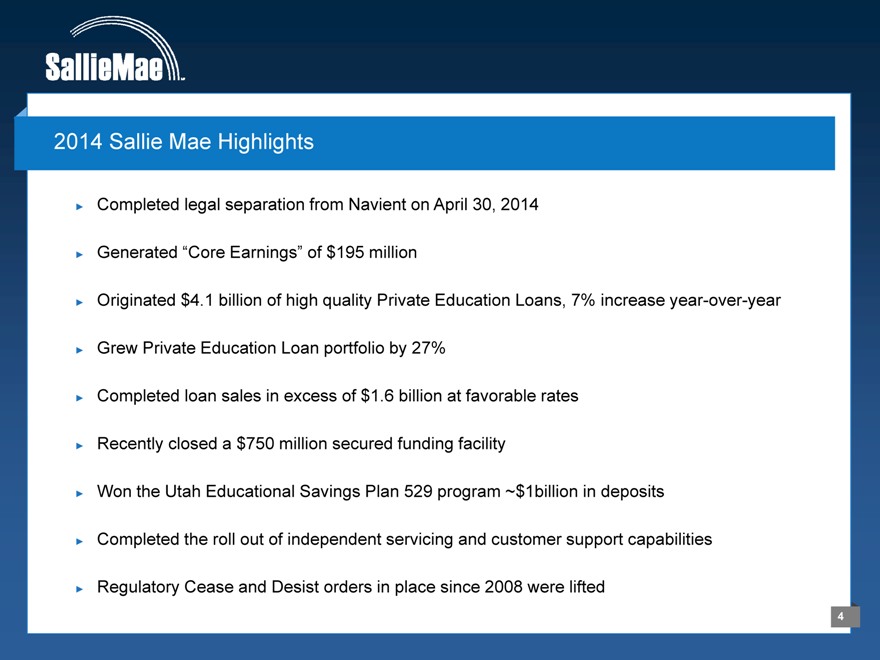
2014 Sallie Mae Highlights
Completed legal separation from Navient on April 30, 2014
Generated “Core Earnings” of $195 million
Originated $4.1 billion of high quality Private Education Loans, 7% increase year-over-year
Grew Private Education Loan portfolio by 27%
Completed loan sales in excess of $1.6 billion at favorable rates
Recently closed a $750 million secured funding facility
Won the Utah Educational Savings Plan 529 program ~$1billion in deposits
Completed the roll out of independent servicing and customer support capabilities
Regulatory Cease and Desist orders in place since 2008 were lifted
4
|
|
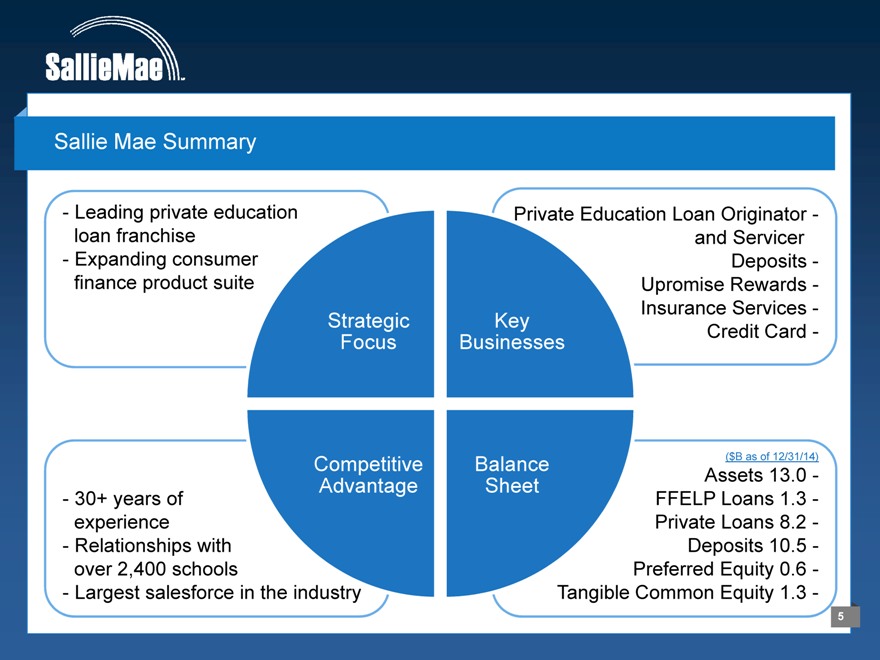
Sallie Mae Summary
Leading private education loan franchise Expanding consumer finance product suite
Private Education Loan Originator -
and Servicer
Deposits -
Upromise Rewards -
Insurance Services -
Strategic Key Credit Card -
Focus Businesses
Competitive
- 30+ years of Advantage
experience
- Relationships with
over 2,400 schools
- Largest salesforce in the industry
Balance ($B as of 12/31/14)
Sheet Assets 13.0 -
FFELP Loans 1.3 -
Private Loans 8.2 -
Deposits 10.5 -
Preferred Equity 0.6 -
Tangible Common Equity 1.3 -
5
|
|
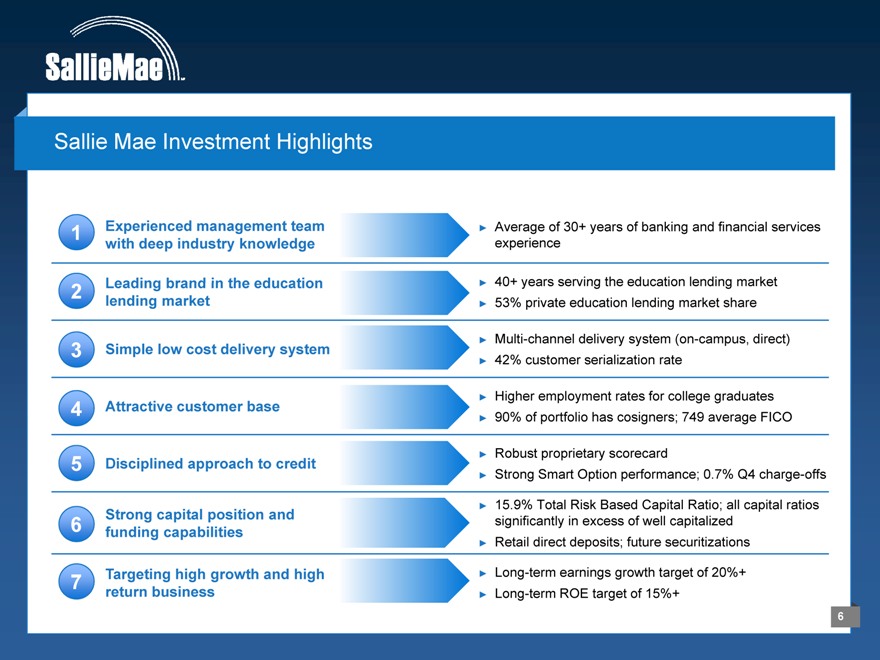
Sallie Mae Investment Highlights
1 Experienced management team with deep industry knowledge
2 Leading brand in the education lending market
3 Simple low cost delivery system
4 Attractive customer base Disciplined approach to credit
Strong capital position and 6 funding capabilities
7 Targeting high growth and high return business
Average of 30+ years of banking and financial services experience
40+ years serving the education lending market 53% private education lending market share
Multi-channel delivery system (on-campus, direct) 42% customer serialization rate
Higher employment rates for college graduates 90% of portfolio has cosigners; 749 average FICO
Robust proprietary scorecard
Strong Smart Option performance; 0.7% Q4 charge-offs
15.9% Total Risk Based Capital Ratio; all capital ratios significantly in excess of well capitalized Retail direct deposits; future securitizations
Long-term earnings growth target of 20%+ Long-term ROE target of 15%+
6
|
|
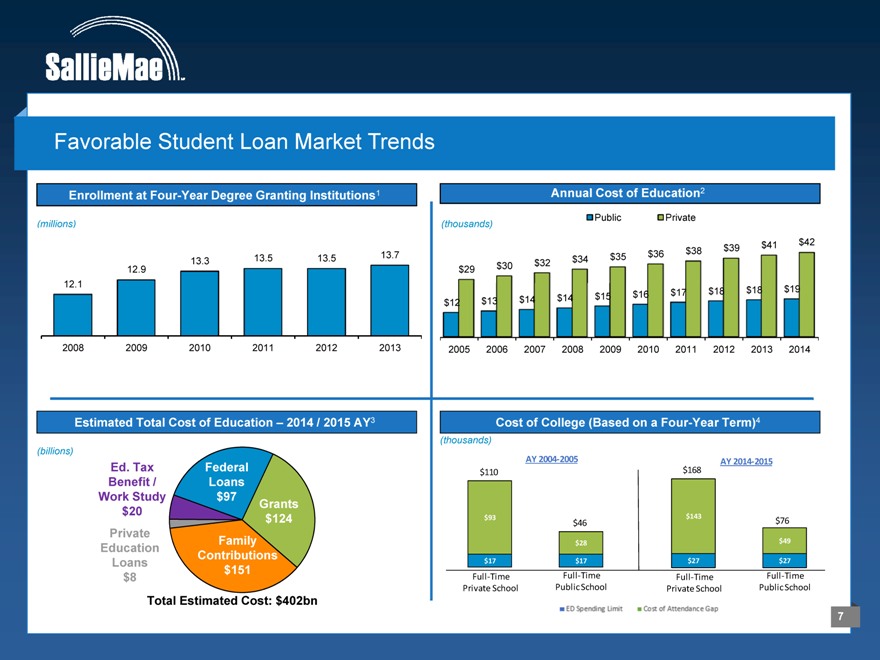
Favorable Student Loan Market Trends
Enrollment at Four-Year Degree Granting Institutions1 Annual Cost of Education2
Public Private
(millions) (thousands)
$41 $42
$38 $39
13.5 13.5 13.7 $35 $36
13.3 $32 $34
12.9 $29 $30
12.1
$17 $18 $18 $19
$14 $15 $16
$12 $13 $14
2008 2009 2010 2011 2012 2013 2005 2006 2007 2008 2009 2010 2011 2012 2013 2014
Estimated Total Cost of Education – 2014 / 2015 AY3 Cost of College (Based on a Four-Year Term)4
(thousands)
(billions) AY 2004?2005
Ed. Tax Federal AY 2014?2015
$110 $168
Benefit / Loans Work Study $97
Grants $20
$124 $93 $143
$46 $76
Private $49 Family $28 Education Contributions
Loans $151 $17 $17 $27 $27
$8 Full?Time Full?Time Full?Time Full?Time Private School Public School Private School Public School
Total Estimated Cost: $402bn
7
|
|
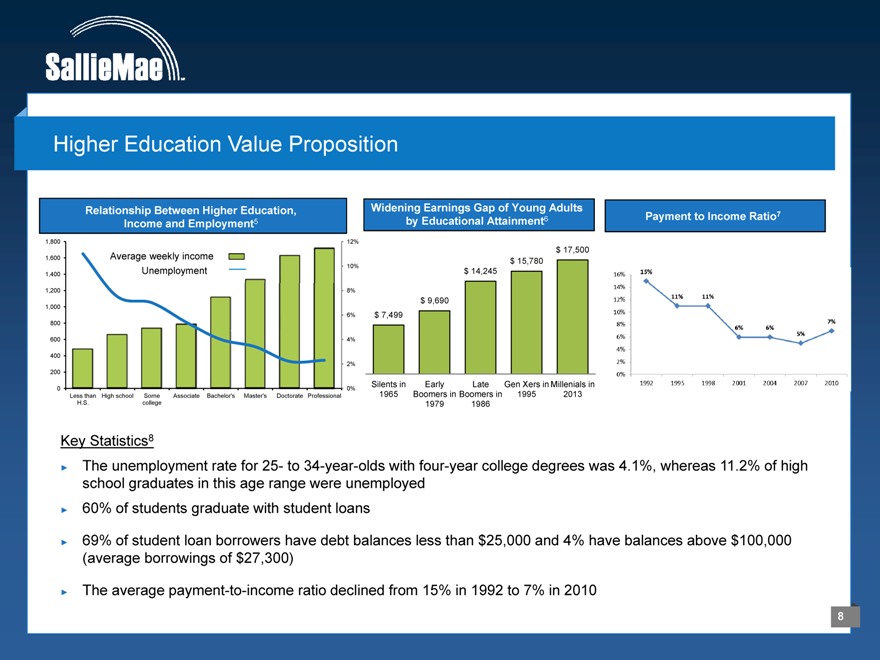
Higher Education Value Proposition
Relationship Between Higher Education, Income and Employment5
1,800 12%
1,600 Average weekly income
Unemployment 10%
1,400
1,200 8%
1,000
6% 800
600 4%
400
2% 200
0 0% Less than High school Some Associate Bachelor’s Master’s Doctorate Professional H.S. college
Widening Earnings Gap of Young Adults by Educational Attainment6
$ 17,500 $ 15,780 $ 14,245
$ 9,690 $ 7,499
Silents in Early Late Gen Xers in Millenials in 1965 Boomers in Boomers in 1995 2013 1979 1986
Payment to Income Ratio7
Key Statistics8
The unemployment rate for 25- to 34-year-olds with four-year college degrees was 4.1%, whereas 11.2% of high school graduates in this age range were unemployed
60% of students graduate with student loans
69% of student loan borrowers have debt balances less than $25,000 and 4% have balances above $100,000 (average borrowings of $27,300)
The average payment-to-income ratio declined from 15% in 1992 to 7% in 2010
8
|
|
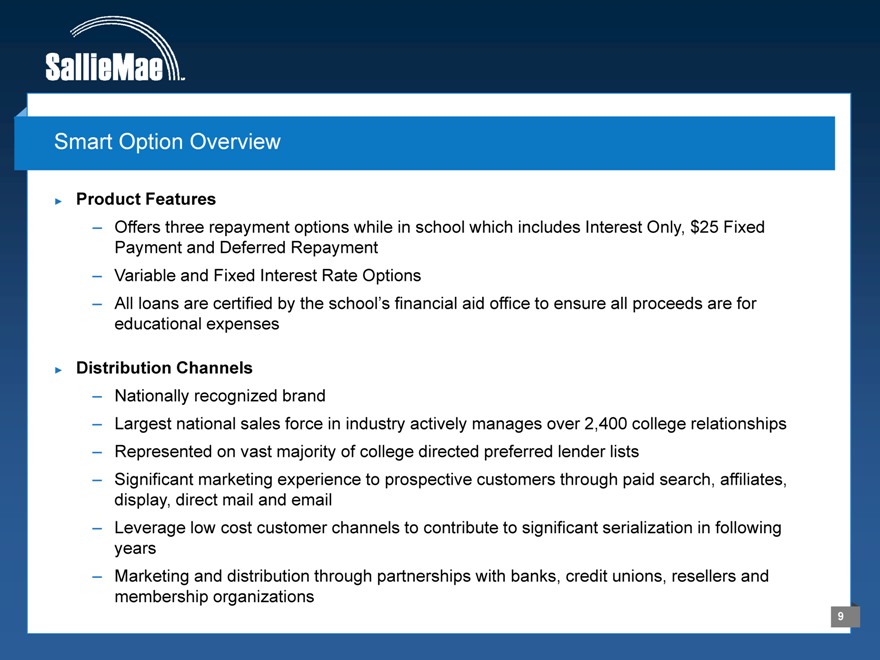
Smart Option Overview
Product Features
– Offers three repayment options while in school which includes Interest Only, $25 Fixed Payment and Deferred Repayment
– Variable and Fixed Interest Rate Options
– All loans are certified by the school’s financial aid office to ensure all proceeds are for educational expenses
Distribution Channels
– Nationally recognized brand
– Largest national sales force in industry actively manages over 2,400 college relationships
– Represented on vast majority of college directed preferred lender lists
– Significant marketing experience to prospective customers through paid search, affiliates, display, direct mail and email
– Leverage low cost customer channels to contribute to significant serialization in following years
– Marketing and distribution through partnerships with banks, credit unions, resellers and membership organizations
9
|
|
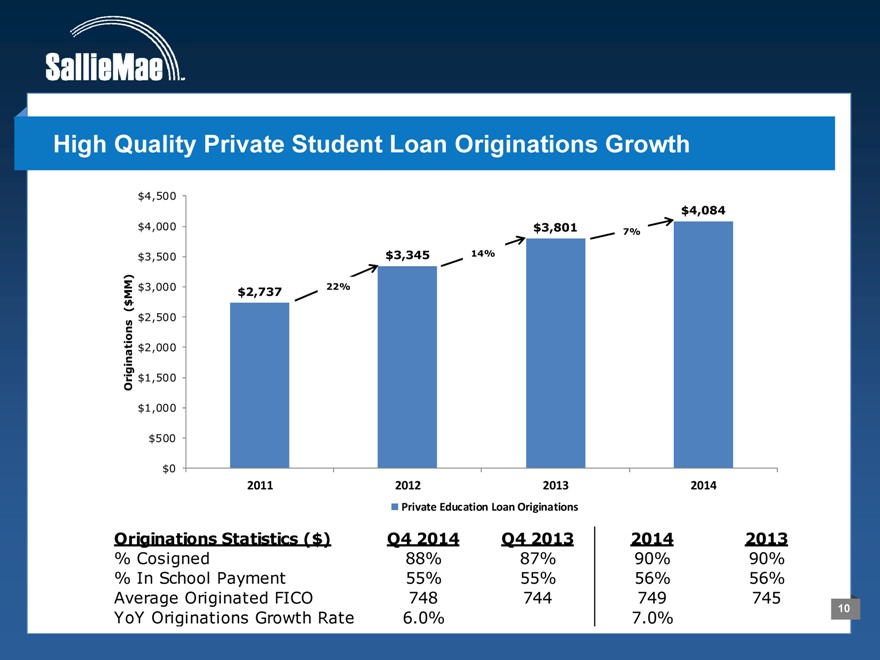
High Quality Private Student Loan Originations Growth
$4,500 $4,084 $4,000 $3,801
7%
$3,500 $3,345 14%
)
MM $3,000 $2,737 22%
( $ $2,500 iginations $2,000
$1,500
Or $1,000
$500
$0
2011 2012 2013 2014
Private Education Loan Originations
Originations Statistics ($) Q4 2014 Q4 2013 2014 2013
% Cosigned 88% 87% 90% 90%
% In School Payment 55% 55% 56% 56%
Average Originated FICO 748 744 749 745
YoY Originations Growth Rate 6.0% 7.0%
10
|
|
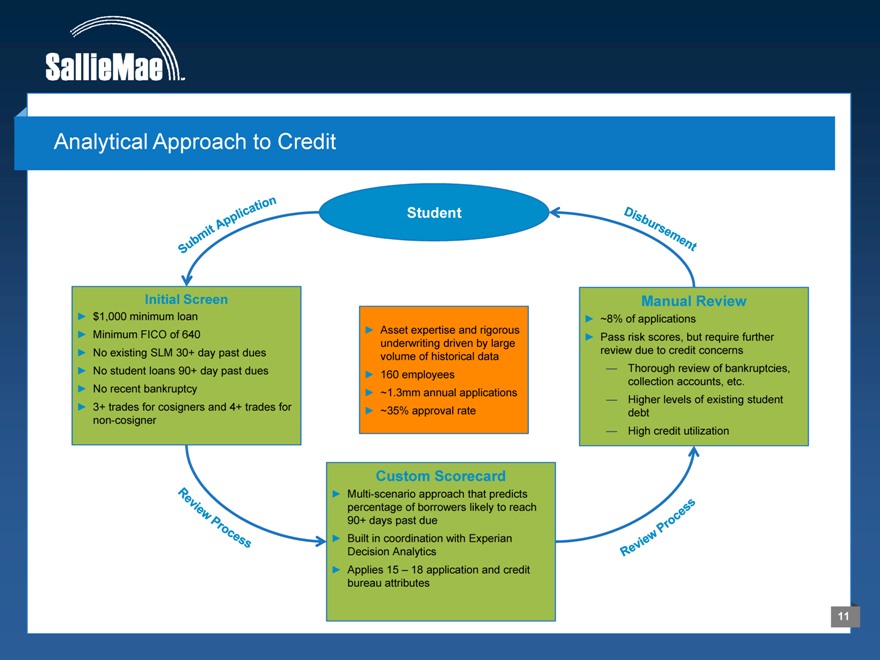
Analytical Approach to Credit
Student
Initial Screen
$1,000 minimum loan Minimum FICO of 640
No existing SLM 30+ day past dues No student loans 90+ day past dues No recent bankruptcy 3+ trades for cosigners and 4+ trades for non-cosigner
Asset expertise and rigorous underwriting driven by large volume of historical data 160 employees ~1.3mm annual applications ~35% approval rate
Manual Review
~8% of applications
Pass risk scores, but require further review due to credit concerns
— Thorough review of bankruptcies, collection accounts, etc.
— Higher levels of existing student debt
— High credit utilization
Custom Scorecard
Multi-scenario approach that predicts percentage of borrowers likely to reach 90+ days past due Built in coordination with Experian Decision Analytics Applies 15 – 18 application and credit bureau attributes
11
|
|
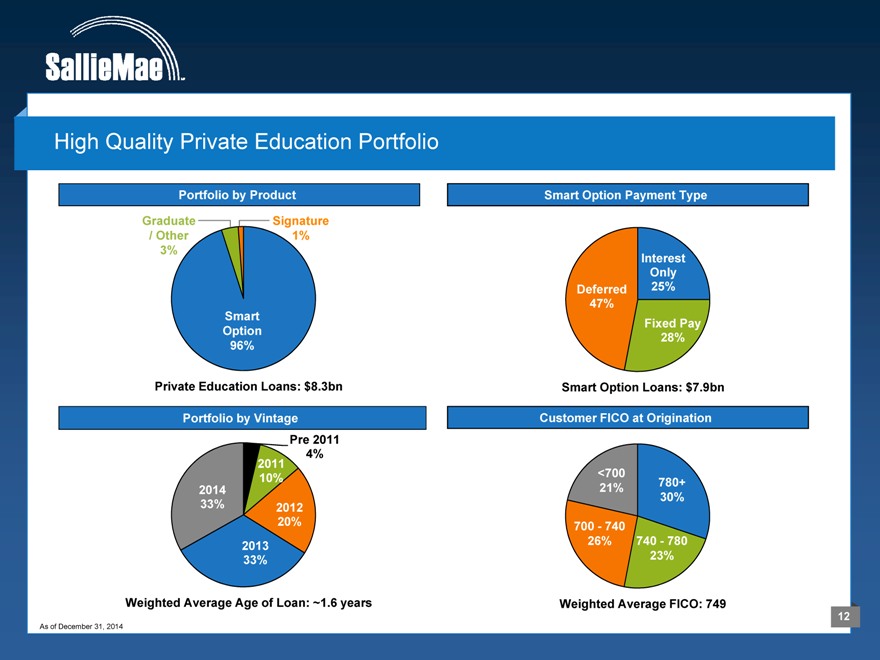
High Quality Private Education Portfolio
Portfolio by Product Smart Option Payment Type
Graduate Signature / Other 1% 3%
Interest Only Deferred 25% 47% Smart Fixed Pay Option 28% 96%
Private Education Loans: $8.3bn Smart Option Loans: $7.9bn
Portfolio by Vintage Customer FICO at Origination Pre 2011 4%
<700
21% 780+ 2014
2011 10%
2012 20%
30% 33% Y 700—740 2013 26% 740—780 33% 23%
Weighted Average Age of Loan: ~1.6 years Weighted Average FICO: 749
As of December 31, 2014
12
|
|
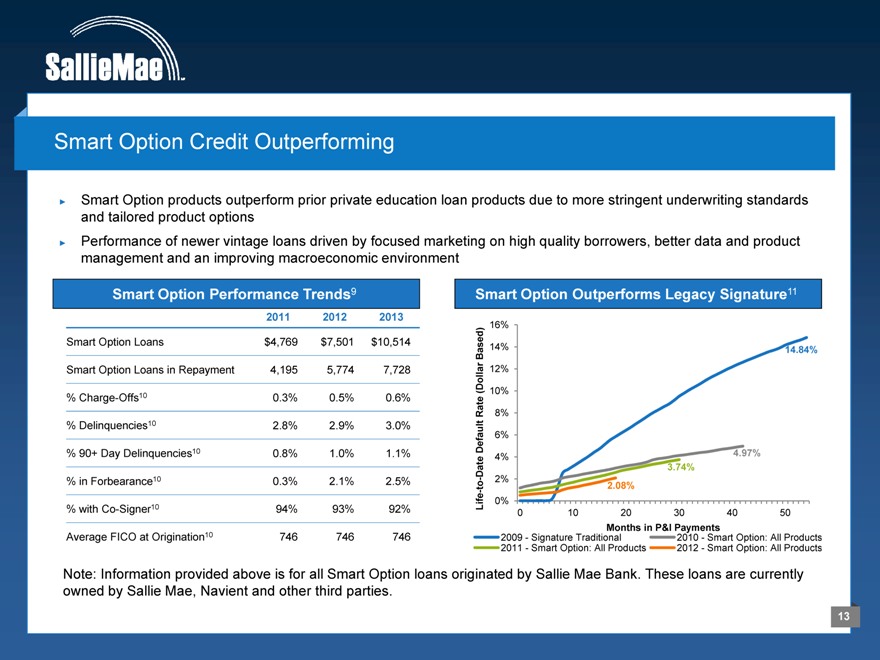
Smart Option Credit Outperforming
Smart Option products outperform prior private education loan products due to more stringent underwriting standards and tailored product options Performance of newer vintage loans driven by focused marketing on high quality borrowers, better data and product management and an improving macroeconomic environment
Smart Option Performance Trends9
2011 2012 2013
Smart Option Loans $4,769 $7,501 $10,514
Smart Option Loans in Repayment 4,195 5,774 7,728
% Charge-Offs10 0.3% 0.5% 0.6%
% Delinquencies10 2.8% 2.9% 3.0%
% 90+ Day Delinquencies10 0.8% 1.0% 1.1% % in Forbearance10 0.3% 2.1% 2.5% % with Co-Signer10 94% 93% 92% Average FICO at Origination10 746 746 746
Smart Option Outperforms Legacy Signature11
16%
Based) 14% 14.84% llar 12% (Do 10% Rate 8% Default 6%
4% 4.97% ate 3.74%
-D 2% to 2.08% -Life 0%
0 1020 3040 50
Months in P&I Payments
2009—Signature Traditional 2010—Smart Option: All Products 2011—Smart Option: All Products 2012—Smart Option: All Products
Note: Information provided above is for all Smart Option loans originated by Sallie Mae Bank. These loans are currently owned by Sallie Mae, Navient and other third parties.
13
|
|
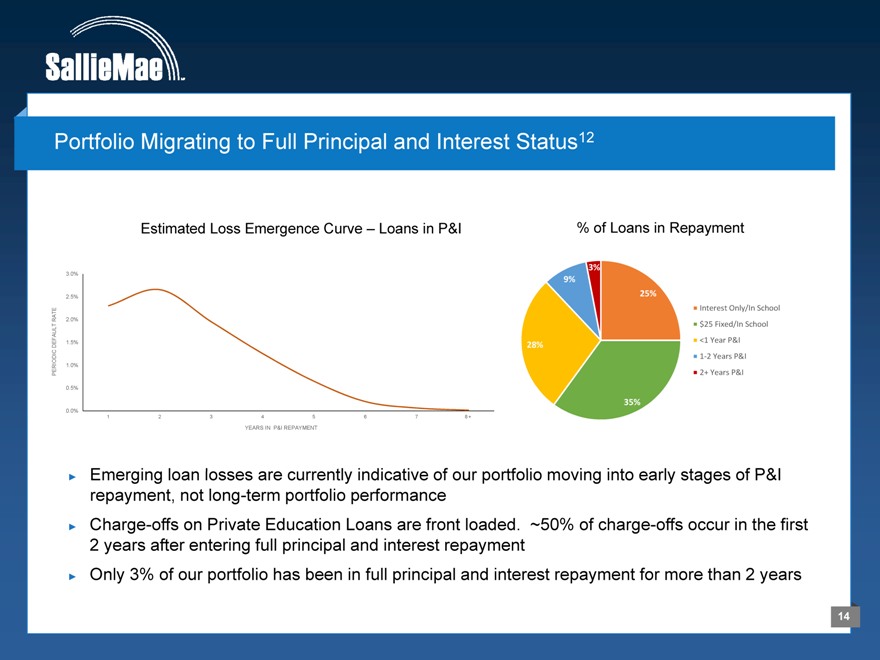
Portfolio Migrating to Full Principal and Interest Status12
Estimated Loss Emergence Curve – Loans in P&I % of Loans in Repayment
3.0% 3%
9%
2.5% 25%
Interest Only/In School
RATE 2.0%
$25 Fixed/In School
1.5% <1 Year P&I
DEFAULT 28%
1 2 Years P&I
1.0%
PERIODIC 2+ Years P&I
0.5%
35%
0.0%
1234 567 8 +
YEARS IN P&I REPAYMENT
Emerging loan losses are currently indicative of our portfolio moving into early stages of P&I repayment, not long-term portfolio performance Charge-offs on Private Education Loans are front loaded. ~50% of charge-offs occur in the first 2 years after entering full principal and interest repayment Only 3% of our portfolio has been in full principal and interest repayment for more than 2 years
14
|
|
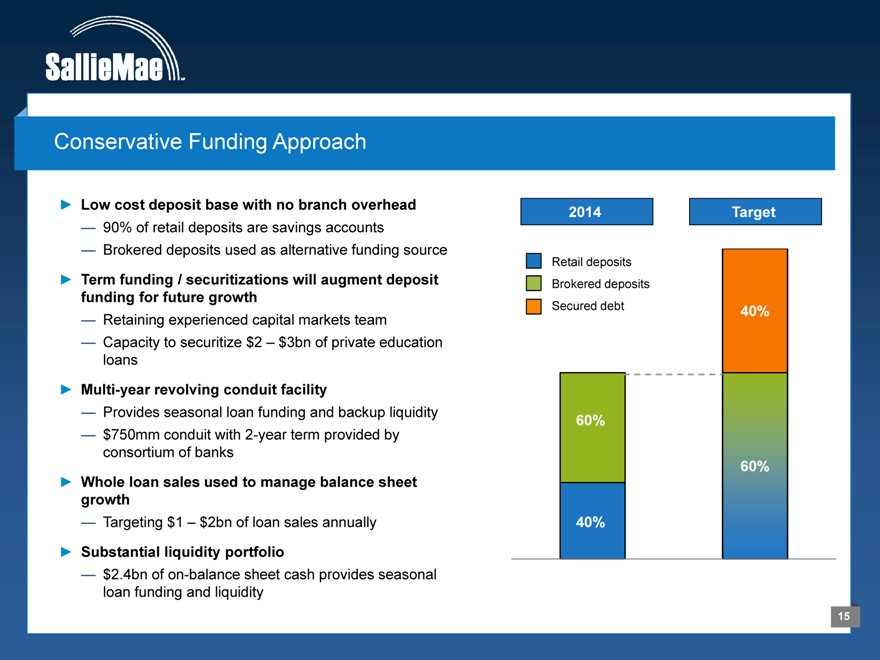
Conservative Funding Approach
Low cost deposit base with no branch overhead
— 90% of retail deposits are savings accounts
— Brokered deposits used as alternative funding source
Term funding / securitizations will augment deposit funding for future growth
— Retaining experienced capital markets team
— Capacity to securitize $2 – $3bn of private education loans
Multi-year revolving conduit facility
— Provides seasonal loan funding and backup liquidity
— $750mm conduit with 2-year term provided by consortium of banks
Whole loan sales used to manage balance sheet growth
— Targeting $1 – $2bn of loan sales annually
Substantial liquidity portfolio
— $2.4bn of on-balance sheet cash provides seasonal loan funding and liquidity
2014 Target
Retail deposits Brokered deposits
Secured debt 40%
60%
60%
40%
15
|
|
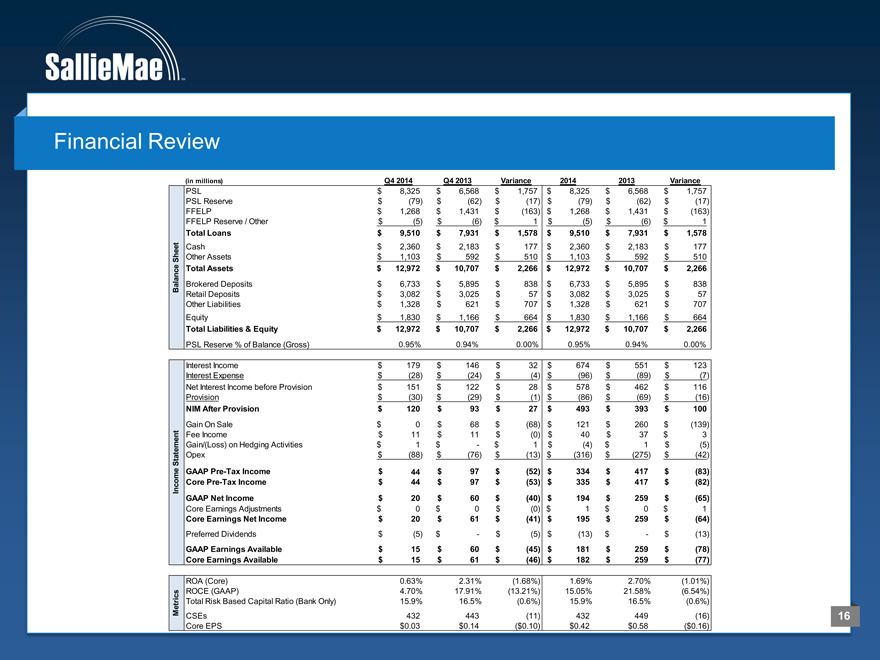
Financial Review
(in millions) Q4 2014 Q4 2013 Variance 2014 2013 Variance
PSL $ 8,325 $ 6,568 $ 1,757 $ 8,325 $ 6,568 $ 1,757
PSL Reserve $ (79) $ (62) $ (17) $ (79) $ (62) $ (17)
FFELP $ 1,268 $ 1,431 $ (163) $ 1,268 $ 1,431 $ (163)
FFELP Reserve / Other $ (5) $ (6) $ 1 $ (5) $ (6) $ 1
Total Loans $ 9,510 $ 7,931 $ 1,578 $ 9,510 $ 7,931 $ 1,578
Cash $ 2,360 $ 2,183 $ 177 $ 2,360 $ 2,183 $ 177
Sheet Other Assets $ 1,103 $ 592 $ 510 $ 1,103 $ 592 $ 510
lance Total Assets $ 12,972 $ 10,707 $ 2,266 $ 12,972 $ 10,707 $ 2,266
Brokered Deposits $ 6,733 $ 5,895 $ 838 $ 6,733 $ 5,895 $ 838
Ba Retail Deposits $ 3,082 $ 3,025 $ 57 $ 3,082 $ 3,025 $ 57
Other Liabilities $ 1,328 $ 621 $ 707 $ 1,328 $ 621 $ 707
Equity $ 1,830 $ 1,166 $ 664 $ 1,830 $ 1,166 $ 664
Total Liabilities & Equity $ 12,972 $ 10,707 $ 2,266 $ 12,972 $ 10,707 $ 2,266
PSL Reserve % of Balance (Gross) 0.95% 0.94% 0.00% 0.95% 0.94% 0.00%
Interest Income $ 179 $ 146 $ 32 $ 674 $ 551 $ 123
Interest Expense $ (28) $ (24) $ (4) $ (96) $ (89) $ (7)
Net Interest Income before Provision $ 151 $ 122 $ 28 $ 578 $ 462 $ 116
Provision $ (30) $ (29) $ (1) $ (86) $ (69) $ (16)
NIM After Provision $ 120 $ 93 $ 27 $ 493 $ 393 $ 100
Gain On Sale $ 0 $ 68 $ (68) $ 121 $ 260 $ (139)
Fee Income $ 11 $ 11 $ (0) $ 40 $ 37 $ 3
Gain/(Loss) on Hedging Activities $ 1 $ — $ 1 $ (4) $ 1 $ (5)
Statement Opex $ (88) $ (76) $ (13) $ (316) $ (275) $ (42)
e GAAP Pre-Tax Income $ 45 $ 97 $ (52) $ 334 $ 417 $ (83)
Incom Core Pre-Tax Income $ 44 $ 97 $ (53) $ 335 $ 417 $ (82)
GAAP Net Income $ 20 $ 60 $ (40) $ 194 $ 259 $ (65)
Core Earnings Adjustments $ 0 $ 0 $ (0) $ 1 $ 0 $ 1
Core Earnings Net Income $ 20 $ 61 $ (41) $ 195 $ 259 $ (64)
Preferred Dividends $ (5) $ — $ (5) $ (13) $ — $ (13)
GAAP Earnings Available $ 15 $ 60 $ (45) $ 181 $ 259 $ (78)
Core Earnings Available $ 15 $ 61 $ (46) $ 182 $ 259 $ (77)
ROA (Core) 0.63% 2.31% (1.68%) 1.69% 2.70% (1.01%)
ROCE (GAAP) 4.70% 17.91% (13.21%) 15.05% 21.58% (6.54%)
Metrics Total Risk Based Capital Ratio (Bank Only) 15.9% 16.5% (0.6%) 15.9% 16.5% (0.6%)
CSEs 432 443 (11) 432 449 (16)
Core EPS $0.03 $0.14 ($0.10) $0.42 $0.58 ($0.16)
16
|
|
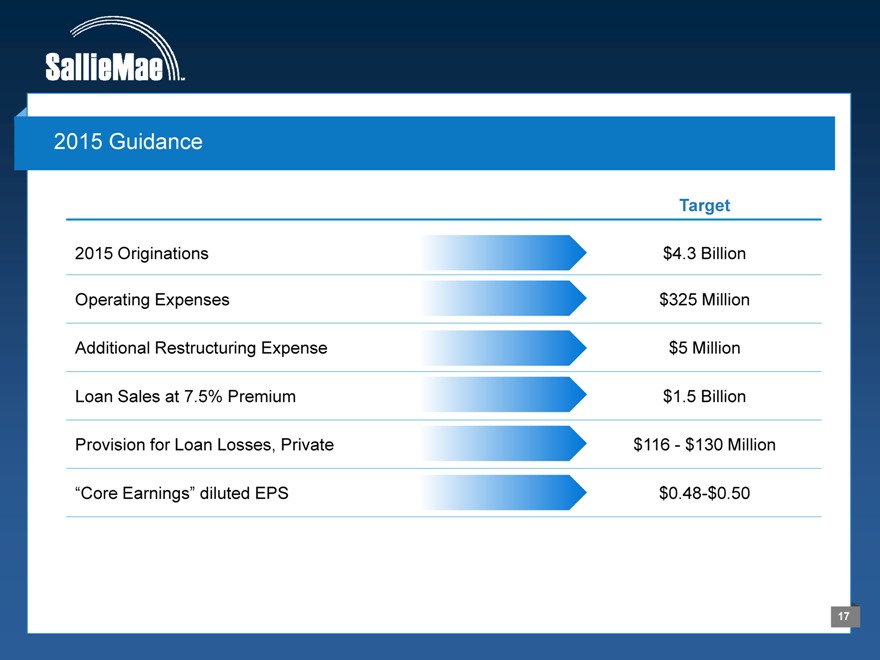
2015 Guidance
2015 Originations
Operating Expenses
Additional Restructuring Expense Loan Sales at 7.5% Premium Provision for Loan Losses, Private “Core Earnings” diluted EPS
Target
$4.3 Billion
$325 Million
$5 Million $1.5 Billion $116—$130 Million $0.48-$0.50
17
|
|
Sallie Mae Bank
Market share leader in private student loan industry
High quality assets and conservatively funded balance sheet Predictable balance sheet growth for the next several years Strong capital position and funding capabilities
A financial services company with high growth trajectory and excellent return on equity
18
|
|
APPENDIX
19
|
|
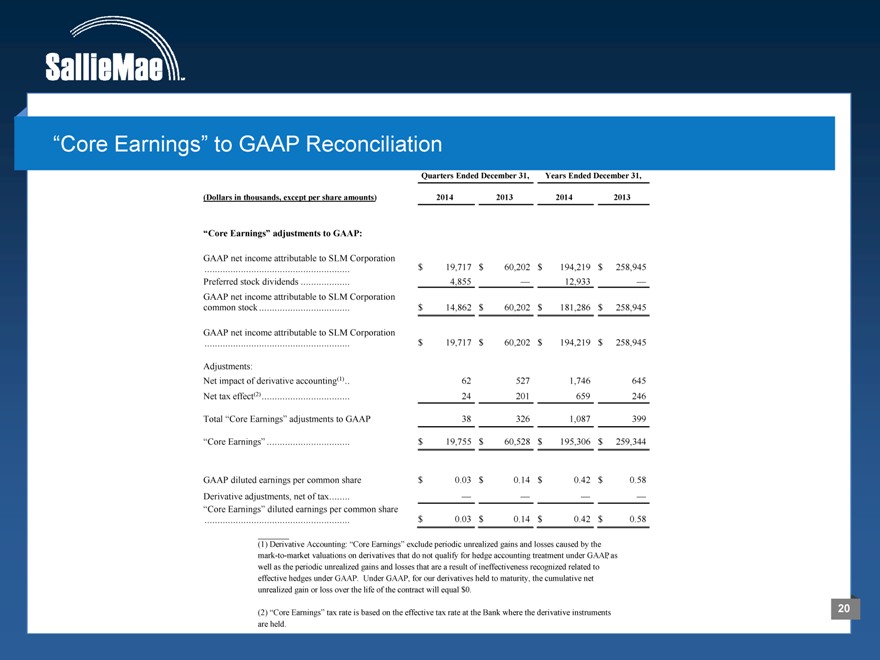
“Core Earnings” to GAAP Reconciliation
Quarters Ended December 31, Years Ended December 31,
(Dollars in thousands, except per share amounts) 2014 2013 2014 2013
“Core Earnings” adjustments to GAAP:
GAAP net income attributable to SLM Corporation
$ 19,717 $ 60,202 $ 194,219 $ 258,945
Preferred stock dividends 4,855 — 12,933 —
GAAP net income attributable to SLM Corporation
common stock $ 14,862 $ 60,202 $ 181,286 $ 258,945
GAAP net income attributable to SLM Corporation
$ 19,717 $ 60,202 $ 194,219 $ 258,945
Adjustments:
Net impact of derivative accounting(1) 62 527 1,746 645
Net tax effect(2) 24 201 659 246
Total “Core Earnings” adjustments to GAAP 38 326 1,087 399
“Core Earnings” $ 19,755 $ 60,528 $ 195,306 $ 259,344
GAAP diluted earnings per common share $ 0.03 $ 0.14 $ 0.42 $ 0.58
Derivative adjustments, net of tax — — — —
“Core Earnings” diluted earnings per common share
$ 0.03 $ 0.14 $ 0.42 $ 0.58
(1) Derivative Accounting: “Core Earnings” exclude periodic unrealized gains and losses caused by the mark-to-market valuations on derivatives that do not qualify for hedge accounting treatment under GAAP, as well as the periodic unrealized gains and losses that are a result of ineffectiveness recognized related to effective hedges under GAAP. Under GAAP, for our derivatives held to maturity, the cumulative net unrealized gain or loss over the life of the contract will equal $0.
(2) “Core Earnings” tax rate is based on the effective tax rate at the Bank where the derivative instruments are held.
20
|
|

Footnotes
1 Source: U.S. Department of Education, National Center for Education Statistics, Projections of Education Statistics to 2022
2 Source: Trends in College Pricing.© 2014 The College Board,. www.collegeboard.org,
Note: Academic years, average published tuition, fees, room and board charges at four-year institutions; enrollment-weighted
3 “Total post-secondary education spend” is estimated by Sallie Mae by determining the full-time equivalents for both graduates and undergraduates and multiplying by estimated total per person cost of attendance for each school type. In doing so, we utilize information from the US Department of Education, College Board, MeasureOne, National Student Clearinghouse and Company Analysis. Other sources for these data points also exist publicly and may vary from our computed estimates
4 Source: Trends in College Pricing.© 2014 The College Board,. www.collegeboard.org, U.S. Department of Education 2014
5 Source: U.S. Bureau of Labor Statistics
6 Source: PEW Research Center
7 Source: Brown Center on Education Policy at Brookings: Is a Student Loan Crisis on the Horizon
8 Source: College Board, Trends in Student Aid, 2014
9 The performance trends and defaults rates below include Sallie Mae and Navient owned Smart Option loans, and are based in part on loan data obtained from Navient pursuant to the Data Sharing Agreement between Navient and Sallie Mae. As Navient and Sallie Mae use different charge-off and delinquency policies, future performance may not be comparable.
10 Percentage of loans in repayment.
11 Signature loans represent traditional Signature loans in full P&I repayment that were originated during the 2006-2008 origination years; Smart Option loans represent Smart Option loans in full P&I repayment that were originated during the 2009-2012 origination years. Life-to-Date Default Rate comparison is based in part on loan data obtained from Navient pursuant to the Data Sharing Agreement between Navient and Sallie Mae.
12 Sallie Mae converted from a 212 day to a 120 day charge-off policy effective May 1, 2014. The loss curve shown above estimates periodic losses on our Deferred Smart Option Loan product and utilizes historical data for periods before May 1, 2014. Actual performance may vary from estimates.
21