Attached files
| file | filename |
|---|---|
| 8-K - META FINANCIAL GROUP, INC 8-K 1-29-2015 - META FINANCIAL GROUP INC | form8k.htm |
| EX-99.1 - EXHIBIT 99.1 - META FINANCIAL GROUP INC | ex99_1.htm |
Exhibit 99.2
FIRST QUARTER 2015 INVESTOR UPDATE
FORWARD LOOKING STATEMENTS Meta Financial Group, Inc.®, (“Meta Financial” or “the Company” or “us”) and its wholly-owned subsidiary, MetaBank® (the “Bank” or “MetaBank”), may from time to time make written or oral “forward-looking statements,” including statements contained in this investor update, in its filings with the Securities and Exchange Commission (“SEC”), in its reports to stockholders, and in other communications by the Company, which are made in good faith by the Company pursuant to the “safe harbor” provisions of the Private Securities Litigation Reform Act of 1995.You can identify forward-looking statements by words such as “may,” “hope,” “will,” “should,” “expect,” “plan,” “anticipate,” “intend,” “believe,” “estimate,” “predict,” “potential,” “continue,” “could,” “future” or the negative of those terms or other words of similar meaning. You should carefully read statements that contain these words because they discuss our future expectations or state other “forward-looking” information. These forward-looking statements include statements with respect to the Company’s beliefs, expectations, estimates, and intentions that are subject to significant risks and uncertainties, and are subject to change based on various factors, some of which are beyond the Company’s control. Such statements address, among others, the following subjects: future operating results; customer retention; loan and other product demand; important components of the Company’s balance sheet and income statements; growth and expansion; new products and services, such as those offered by MetaBank or Meta Payment Systems® (“MPS”), a division of the Bank; credit quality and adequacy of reserves; technology; and the Company’s employees. The following factors, among others, could cause the Company’s financial performance and results of operations to differ materially from the expectations, estimates, and intentions expressed in such forward-looking statements: the strength of the United States’ economy in general and the strength of the local economies in which the Company conducts operations; the effects of, and changes in, trade, monetary, and fiscal policies and laws, including interest rate policies of the Board of Governors of the Federal Reserve System (the “Federal Reserve”), as well as efforts of the United States Treasury in conjunction with bank regulatory agencies to stimulate the economy and protect the financial system; inflation, interest rate, market, and monetary fluctuations; the timely development of and acceptance of new products and services offered by the Company as well as risks (including reputational and litigation) attendant thereto and the perceived overall value of these products and services by users; the risks of dealing with or utilizing third parties; the ability of the Bank to successfully integrate the operations of AFS/IBEX Financial Services Inc; the scope of restrictions and compliance requirements imposed by the Consent Order entered into by the Company as administered by the Federal Reserve and any other such actions which may be initiated by our regulators; the impact of changes in financial services laws and regulations, including but not limited to our relationship with our primary regulators, the Office of the Comptroller of the Currency and the Federal Reserve; technological changes, including, but not limited to, the protection of electronic files or databases; acquisitions; litigation risk in general, including, but not limited to, those risks involving the MPS division; the growth of the Company’s business as well as expenses related thereto; continued maintenance by the Bank of its status as a well-capitalized institution; changes in consumer spending and saving habits; and the success of the Company at managing and collecting assets of borrowers in default.The foregoing list of factors is not exclusive. Additional discussions of factors affecting the Company’s business and prospects are reflected under the headings “Risk Factors” and in other sections of the Company’s Annual Report on Form 10-K for the fiscal year ended September 30, 2014, those factors addressed in the prospectus supplement and the accompanying prospectus filed in connection with the Company’s at-the-market offering and other filings made with the SEC. The Company expressly disclaims any intent or obligation to update any forward-looking statement, whether written or oral, that may be made from time to time by or on behalf of the Company or its subsidiaries. *
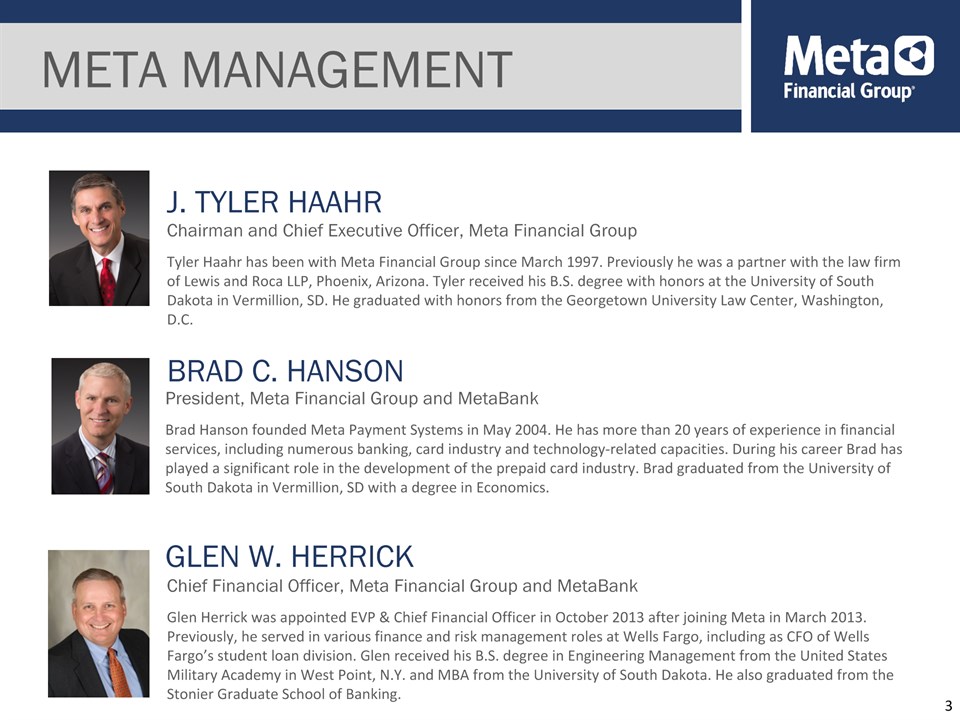
META MANAGEMENT Chairman and Chief Executive Officer, Meta Financial GroupTyler Haahr has been with Meta Financial Group since March 1997. Previously he was a partner with the law firm of Lewis and Roca LLP, Phoenix, Arizona. Tyler received his B.S. degree with honors at the University of South Dakota in Vermillion, SD. He graduated with honors from the Georgetown University Law Center, Washington, D.C. President, Meta Financial Group and MetaBankBrad Hanson founded Meta Payment Systems in May 2004. He has more than 20 years of experience in financial services, including numerous banking, card industry and technology-related capacities. During his career Brad has played a significant role in the development of the prepaid card industry. Brad graduated from the University of South Dakota in Vermillion, SD with a degree in Economics. Chief Financial Officer, Meta Financial Group and MetaBank Glen Herrick was appointed EVP & Chief Financial Officer in October 2013 after joining Meta in March 2013. Previously, he served in various finance and risk management roles at Wells Fargo, including as CFO of Wells Fargo’s student loan division. Glen received his B.S. degree in Engineering Management from the United States Military Academy in West Point, N.Y. and MBA from the University of South Dakota. He also graduated from the Stonier Graduate School of Banking. J. TYLER HAAHR BRAD C. HANSON GLEN W. HERRICK *
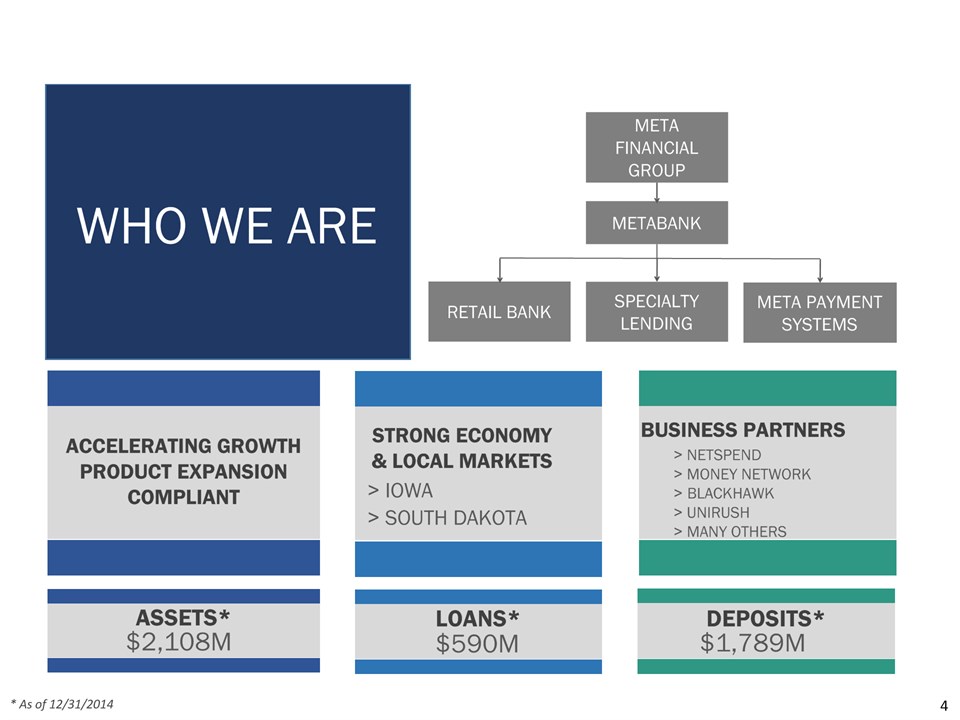
METABANK RETAIL BANK META PAYMENT SYSTEMS META FINANCIAL GROUP LOANS* $590M DEPOSITS* $1,789M STRONG ECONOMY & LOCAL MARKETS > IOWA BUSINESS PARTNERS > NETSPEND> MONEY NETWORK> BLACKHAWK> UNIRUSH> MANY OTHERS > SOUTH DAKOTA * As of 12/31/2014 WHO WE ARE * SPECIALTY LENDING ACCELERATING GROWTH PRODUCT EXPANSION COMPLIANT ASSETS* $2,108M
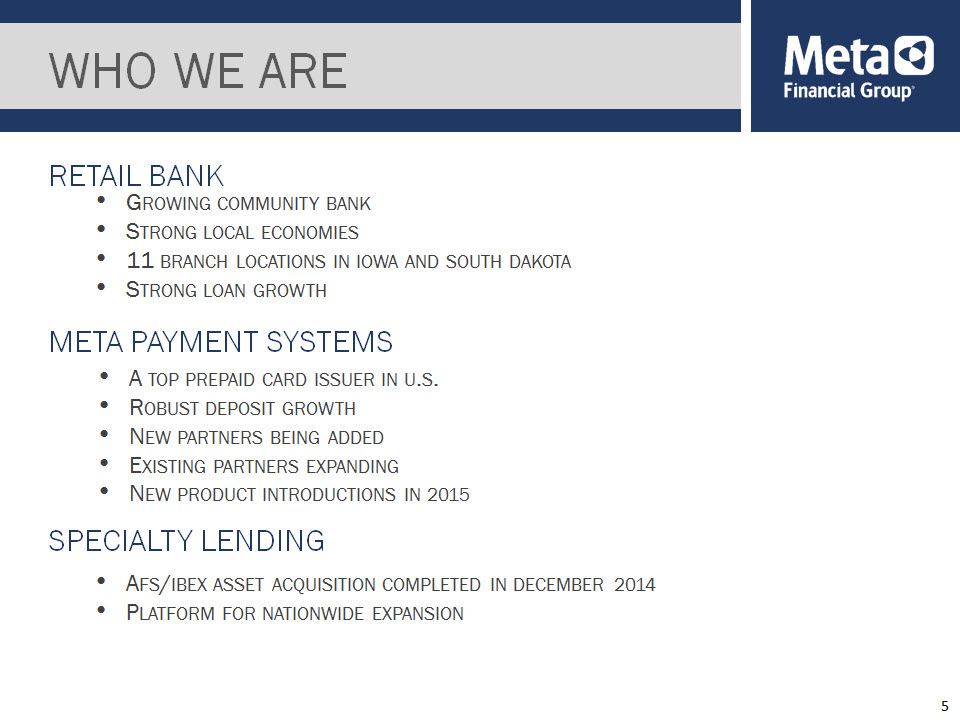
WHO WE ARE GROWING COMMUNITY BANKSTRONG LOCAL ECONOMIES11 BRANCH LOCATIONS IN IOWA AND SOUTH DAKOTASTRONG LOAN GROWTH RETAIL BANK A TOP PREPAID CARD ISSUER IN U.S.ROBUST DEPOSIT GROWTHNEW PARTNERS BEING ADDEDEXISTING PARTNERS EXPANDING NEW PRODUCT INTRODUCTIONS IN 2015 META PAYMENT SYSTEMS * SPECIALTY LENDING AFS/IBEX ASSET ACQUISITION COMPLETED IN DECEMBER 2014PLATFORM FOR NATIONWIDE EXPANSION
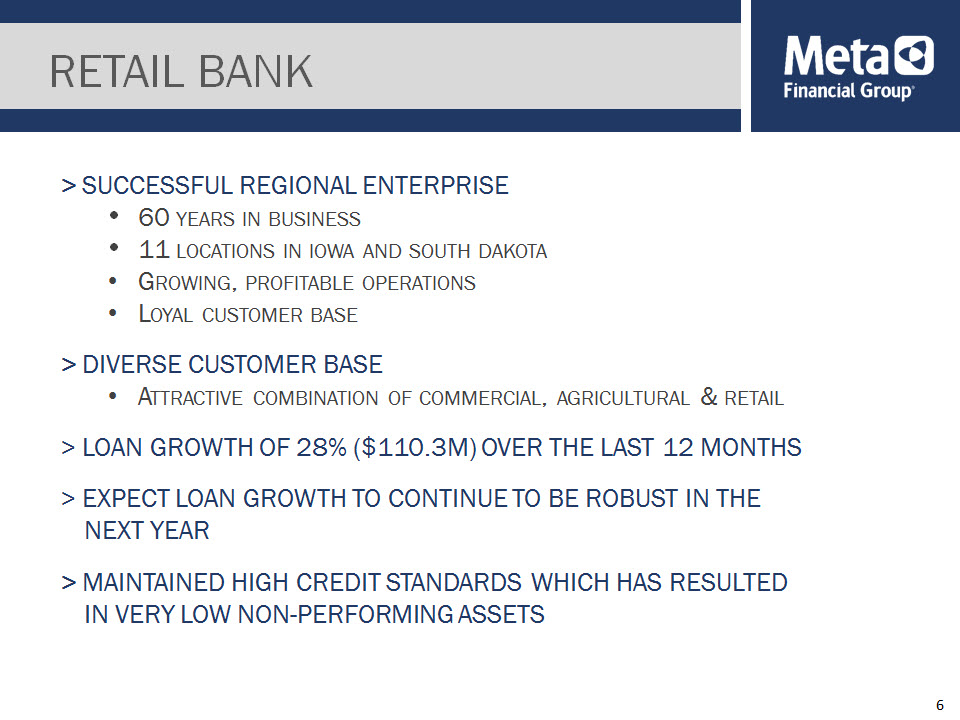
> SUCCESSFUL REGIONAL ENTERPRISE60 YEARS IN BUSINESS 11 LOCATIONS IN IOWA AND SOUTH DAKOTAGROWING, PROFITABLE OPERATIONSLOYAL CUSTOMER BASE> DIVERSE CUSTOMER BASE ATTRACTIVE COMBINATION OF COMMERCIAL, AGRICULTURAL & RETAIL> LOAN GROWTH OF 28% ($110.3M) OVER THE LAST 12 MONTHS> EXPECT LOAN GROWTH TO CONTINUE TO BE ROBUST IN THE NEXT YEAR> MAINTAINED HIGH CREDIT STANDARDS WHICH HAS RESULTED IN VERY LOW NON-PERFORMING ASSETS RETAIL BANK *
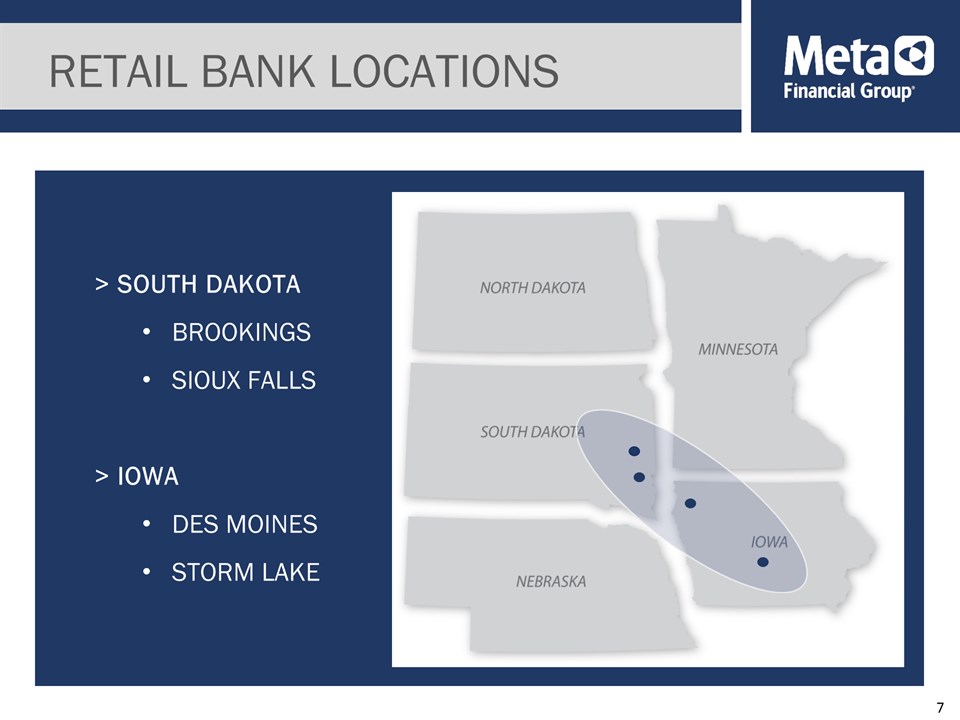
RETAIL BANK LOCATIONS > SOUTH DAKOTABROOKINGSSIOUX FALLS> IOWA DES MOINESSTORM LAKE *
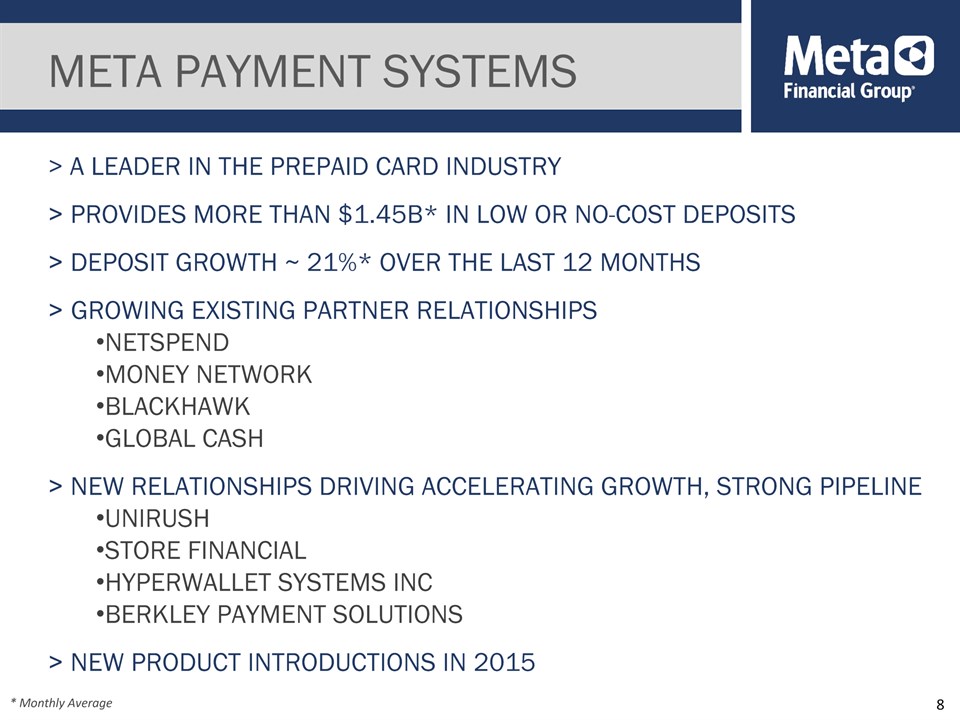
> A LEADER IN THE PREPAID CARD INDUSTRY> PROVIDES MORE THAN $1.45B* IN LOW OR NO-COST DEPOSITS> DEPOSIT GROWTH ~ 21%* OVER THE LAST 12 MONTHS> GROWING EXISTING PARTNER RELATIONSHIPSNETSPENDMONEY NETWORKBLACKHAWKGLOBAL CASH> NEW RELATIONSHIPS DRIVING ACCELERATING GROWTH, STRONG PIPELINEUNIRUSHSTORE FINANCIALHYPERWALLET SYSTEMS INCBERKLEY PAYMENT SOLUTIONS> NEW PRODUCT INTRODUCTIONS IN 2015 META PAYMENT SYSTEMS * * Monthly Average
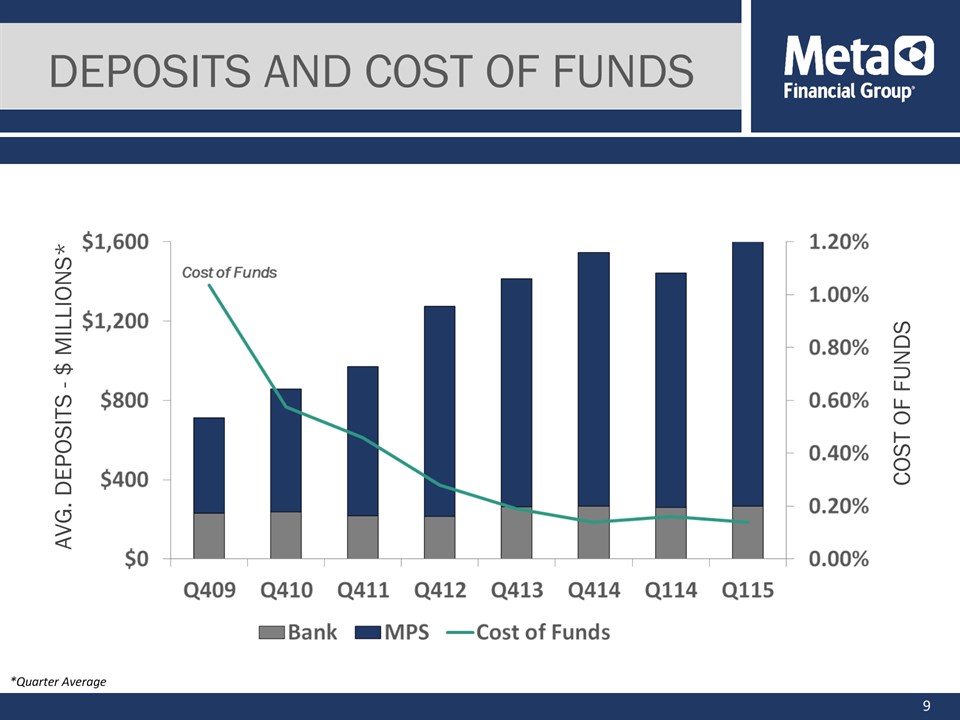
DEPOSITS AND COST OF FUNDS AVG. DEPOSITS - $ MILLIONS* COST OF FUNDS * *Quarter Average
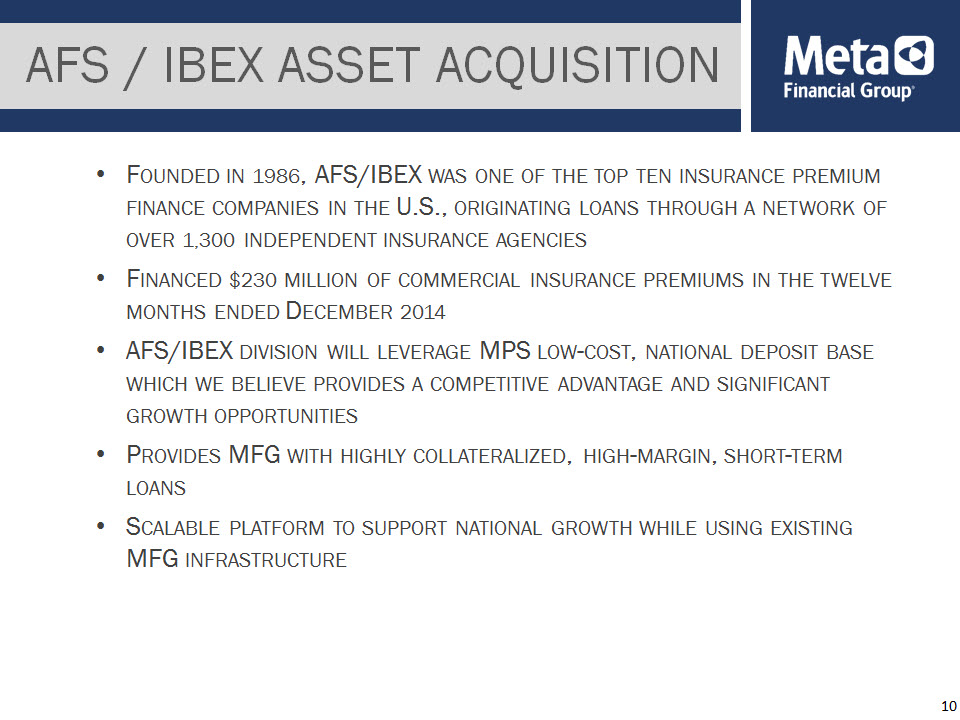
AFS / IBEX ASSET ACQUISITION * FOUNDED IN 1986, AFS/IBEX WAS ONE OF THE TOP TEN INSURANCE PREMIUM FINANCE COMPANIES IN THE U.S., ORIGINATING LOANS THROUGH A NETWORK OF OVER 1,300 INDEPENDENT INSURANCE AGENCIESFINANCED $230 MILLION OF COMMERCIAL INSURANCE PREMIUMS IN THE TWELVE MONTHS ENDED DECEMBER 2014AFS/IBEX DIVISION WILL LEVERAGE MPS LOW-COST, NATIONAL DEPOSIT BASE WHICH WE BELIEVE PROVIDES A COMPETITIVE ADVANTAGE AND SIGNIFICANT GROWTH OPPORTUNITIESPROVIDES MFG WITH HIGHLY COLLATERALIZED, HIGH-MARGIN, SHORT-TERM LOANSSCALABLE PLATFORM TO SUPPORT NATIONAL GROWTH WHILE USING EXISTING MFG INFRASTRUCTURE
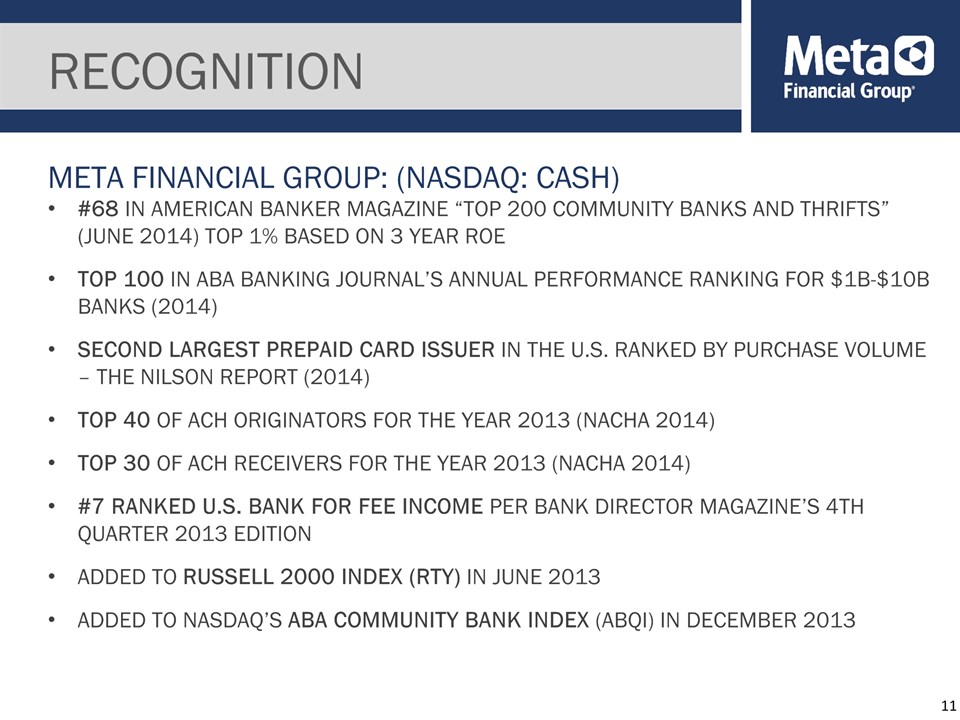
RECOGNITION #68 IN AMERICAN BANKER MAGAZINE “TOP 200 COMMUNITY BANKS AND THRIFTS” (JUNE 2014) TOP 1% BASED ON 3 YEAR ROETOP 100 IN ABA BANKING JOURNAL’S ANNUAL PERFORMANCE RANKING FOR $1B-$10B BANKS (2014)SECOND LARGEST PREPAID CARD ISSUER IN THE U.S. RANKED BY PURCHASE VOLUME – THE NILSON REPORT (2014)TOP 40 OF ACH ORIGINATORS FOR THE YEAR 2013 (NACHA 2014)TOP 30 OF ACH RECEIVERS FOR THE YEAR 2013 (NACHA 2014)#7 RANKED U.S. BANK FOR FEE INCOME PER BANK DIRECTOR MAGAZINE’S 4TH QUARTER 2013 EDITION ADDED TO RUSSELL 2000 INDEX (RTY) IN JUNE 2013ADDED TO NASDAQ’S ABA COMMUNITY BANK INDEX (ABQI) IN DECEMBER 2013 META FINANCIAL GROUP: (NASDAQ: CASH) *

STRATEGIC GOALS > GROW MPS DIVISIONSCALABLE, STATE OF THE ART OPERATING INFRASTRUCTURELEVERAGE LOW/NO COST FUNDSROBUST PRODUCT OFFERING RELOADABLE, PAYROLL, GIFT, INCENTIVE, VIRTUAL, AND TRAVELDIVERSIFYING PRODUCT SUITE IN 2015 – PAYMENTS, DEPOSITS, AND CREDITMPS “FINANCIAL INCLUSION” PROGRAMS FOR UNBANKED, UNDERBANKED> EXERCISE “EARLY ADOPTER” ADVANTAGE IN REGULATORY COMPLIANCEEFFICIENTLY ADDING NEW PARTNERSHIPS WITH INDUSTRY LEADERS> MAINTAIN STRONG CREDIT AND INVESTMENT QUALITY> EMPHASIZE ASSET DIVERSIFICATION, YIELD ENHANCEMENT, AND HIGH QUALITY LOAN GROWTH *
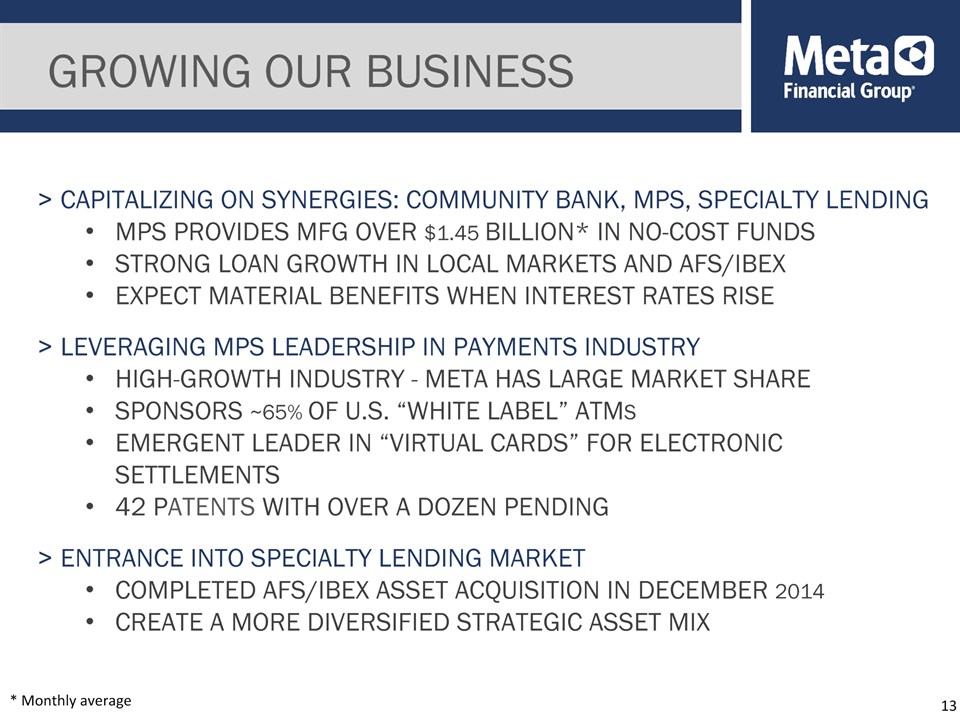
> CAPITALIZING ON SYNERGIES: COMMUNITY BANK, MPS, SPECIALTY LENDINGMPS PROVIDES MFG OVER $1.45 BILLION* IN NO-COST FUNDS STRONG LOAN GROWTH IN LOCAL MARKETS AND AFS/IBEXEXPECT MATERIAL BENEFITS WHEN INTEREST RATES RISE> LEVERAGING MPS LEADERSHIP IN PAYMENTS INDUSTRYHIGH-GROWTH INDUSTRY - META HAS LARGE MARKET SHARESPONSORS ~65% OF U.S. “WHITE LABEL” ATMSEMERGENT LEADER IN “VIRTUAL CARDS” FOR ELECTRONIC SETTLEMENTS42 PATENTS WITH OVER A DOZEN PENDING> ENTRANCE INTO SPECIALTY LENDING MARKETCOMPLETED AFS/IBEX ASSET ACQUISITION IN DECEMBER 2014CREATE A MORE DIVERSIFIED STRATEGIC ASSET MIX GROWING OUR BUSINESS * * Monthly average
> EARLY ADOPTER OF SOPHISTICATED COMPLIANCE SYSTEMS> OCC CONSENT ORDER REMOVED IN AUGUST 2014> INVESTMENTS IN MPS PROGRAM DESIGN, TRAINING AND TECHNOLOGYIMPLEMENTED ENHANCED BSA/AML TECHNOLOGYENHANCED INFRASTRUCTURE SUPPORTS GROWTH; MODERATING EXPENSES EXPECTEDSHIFTED FOCUS TO BUSINESS DEVELOPMENT OPPORTUNITIES, WHILE MAINTAINING CONTINUOUS IMPROVEMENT MINDSET ON SYSTEMS AND COMPLIANCE> HIGH COMPETITIVE BARRIERS TO ENTER PREPAID INDUSTRYEXPERTISE, CAPITAL, COMPLIANCEOPERATIONAL INFRASTRUCTUREHIGH START-UP COSTS> BROKERED DEPOSIT RECLASSIFICATIONNO IMPACT TO EARNINGS ANTICIPATED BASED ON CURRENT CONDITION COMPLIANCE AND OVERSIGHT SYSTEMS *
> POSITIVELY LEVERAGED FOR HIGHER RATE ENVIRONMENT> OCI VOLATILE RELATIVE TO PEERS GAAP DOES NOT CAPTURE BALANCE SHEET TRUE VALUEMETA MARK INCLUDES ~65% OF ASSETS (SECURITIES) VS. TYPICAL “PEER” AT 20%GAAP OCI DOES NOT RECOGNIZE VALUE OF LOW OR NO-COST DEPOSITS> EXPECTATION FOR CONTINUED, INCREASING NET INTEREST MARGIN (NIM) DESPITE CURRENT LOWER RATESACQUIRED AFS/IBEX LOANS WITH WEIGHTED AVERAGE RATE OVER 8.5% AND MATURITIES NEAR 9 MONTHS. LOAN RATES SHOULD ADJUST HIGHER IF INTEREST RATES RISE> REINVESTMENT OPPORTUNITY LEADING TO INCREASED NIM EXPANSION IN AN UP-RATE ENVIRONMENTSECURITIES CASH FLOW AND NEW MPS DEPOSITS DEPLOYED AT HIGHER RATES> DECEMBER 31, 2014 NIM UP 29 BPS OVER THE LAST 12 MONTHS DESPITE THE VOLATILE INTEREST RATE ENVIRONMENT AND CURRENT LOWER RATESIMPROVED ASSET MIX MAXIMIZING YIELDIMPROVED YIELDS ACHIEVED WITHIN THE SECURITIES PORTFOLIO INTEREST RATE RISK MANAGEMENT *
> CAPITAL ENHANCEMENTS$61.0 MILLION IN 2012-13 VIA PRIVATE PLACEMENTS AND AN ATM OFFERINGCURRENT ATM PROCEEDS SUPPORT ORGANIC GROWTH, POSSIBLE ACQUISITIONS AND UPCOMING BASEL III REQUIREMENTS> MAINTAIN STRONG CAPITAL RATIO GOALSCOMMON EQUITY TIER 1 CAPITAL AT LEAST 8%RISK-BASED OVER 15% CAPITAL MANAGEMENT *
> NET INCOME$3.6 MILLION IN FISCAL 2015 Q1ADJUSTED $4.8 MILLION, EXCLUDING ITEMS BELOW*, +19% OVER FY14 SAME QUARTER> EARNINGS PROFILEANNUALIZED ROAA OF 0.68% AND ANNUALIZED ROAE OF 8.04% ADJUSTED ANNUALIZED ROAA AND ROAE OF 10.63% AND 0.90% RESPECTIVELY, EXCLUDING ITEMS BELOW*BUSINESS DEVELOPMENT COSTS BEING INCURRED FOR FUTURE REVENUE OPPORTUNITIES> VERY STRONG ASSET QUALITYNPAS MARKEDLY LOWER THAN PEER GROUP AT 0.1% OF TOTAL ASSETS> PRUDENT CAPITAL MANAGEMENT, FLEXIBILITY TO SOURCE FUTURE NEEDS MFG FINANCIAL HIGHLIGHTS * *$(1.3)M Loss-on Sale of Securities and $(0.5)M acquisition costs less applicable taxes
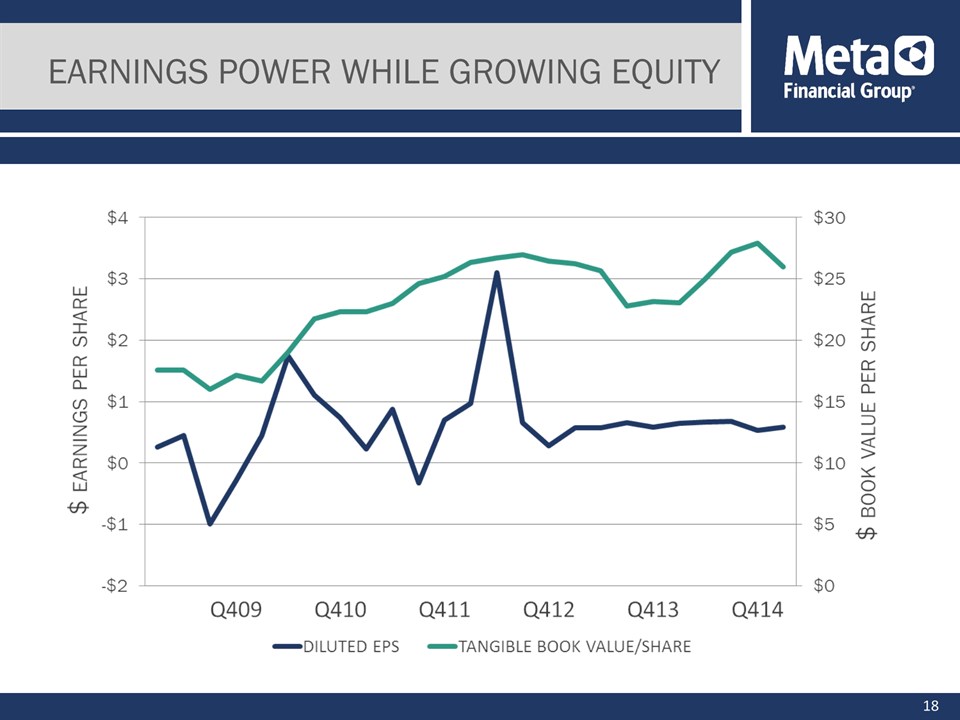
EARNINGS POWER WHILE GROWING EQUITY *
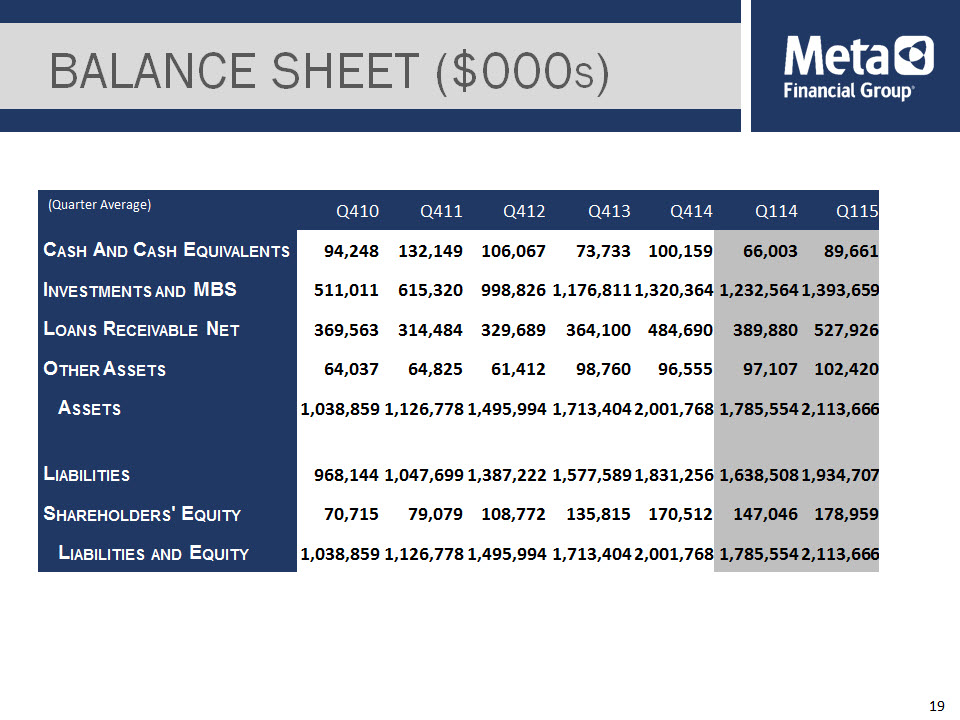
BALANCE SHEET ($000S) Q410 Q411 Q412 Q413 Q414 Q114 Q115 CASH AND CASH EQUIVALENTS 94,248 132,149 106,067 73,733 100,159 66,003 89,661 INVESTMENTS AND MBS 511,011 615,320 998,826 1,176,811 1,320,364 1,232,564 1,393,659 LOANS RECEIVABLE NET 369,563 314,484 329,689 364,100 484,690 389,880 527,926 OTHER ASSETS 64,037 64,825 61,412 98,760 96,555 97,107 102,420 ASSETS 1,038,859 1,126,778 1,495,994 1,713,404 2,001,768 1,785,554 2,113,666 LIABILITIES 968,144 1,047,699 1,387,222 1,577,589 1,831,256 1,638,508 1,934,707 SHAREHOLDERS' EQUITY 70,715 79,079 108,772 135,815 170,512 147,046 178,959 LIABILITIES AND EQUITY 1,038,859 1,126,778 1,495,994 1,713,404 2,001,768 1,785,554 2,113,666 (Quarter Average) *
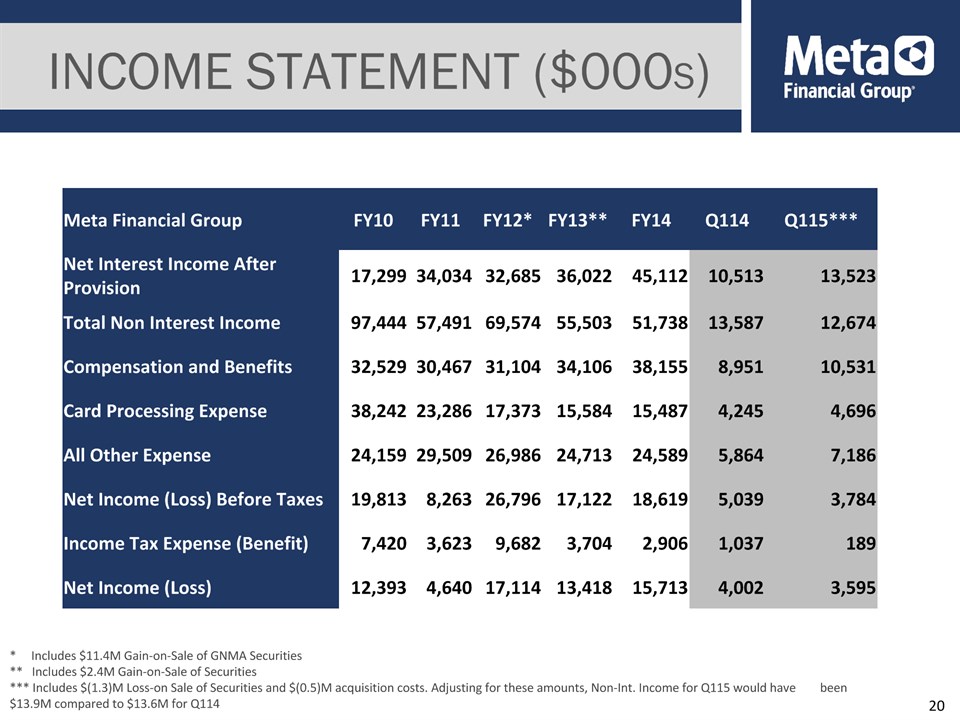
INCOME STATEMENT ($000S) * Includes $11.4M Gain-on-Sale of GNMA Securities** Includes $2.4M Gain-on-Sale of Securities*** Includes $(1.3)M Loss-on Sale of Securities and $(0.5)M acquisition costs. Adjusting for these amounts, Non-Int. Income for Q115 would have been $13.9M compared to $13.6M for Q114 Meta Financial Group FY10 FY11 FY12* FY13** FY14 Q114 Q115*** Net Interest Income After Provision 17,299 34,034 32,685 36,022 45,112 10,513 13,523 Total Non Interest Income 97,444 57,491 69,574 55,503 51,738 13,587 12,674 Compensation and Benefits 32,529 30,467 31,104 34,106 38,155 8,951 10,531 Card Processing Expense 38,242 23,286 17,373 15,584 15,487 4,245 4,696 All Other Expense 24,159 29,509 26,986 24,713 24,589 5,864 7,186 Net Income (Loss) Before Taxes 19,813 8,263 26,796 17,122 18,619 5,039 3,784 Income Tax Expense (Benefit) 7,420 3,623 9,682 3,704 2,906 1,037 189 Net Income (Loss) 12,393 4,640 17,114 13,418 15,713 4,002 3,595 *
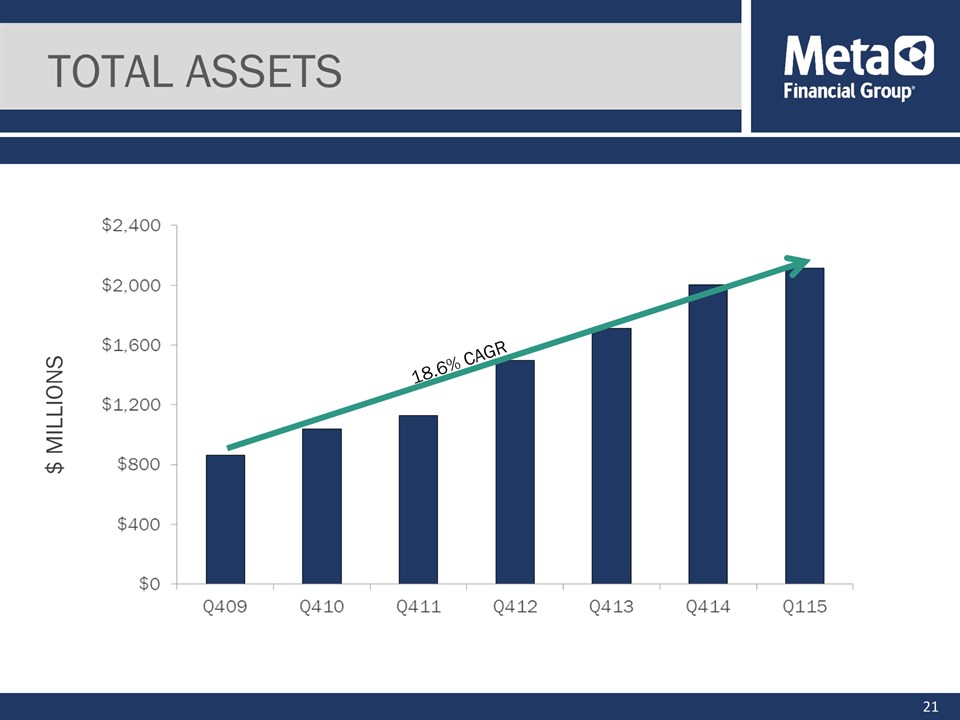
TOTAL ASSETS 18.6% CAGR $ MILLIONS *
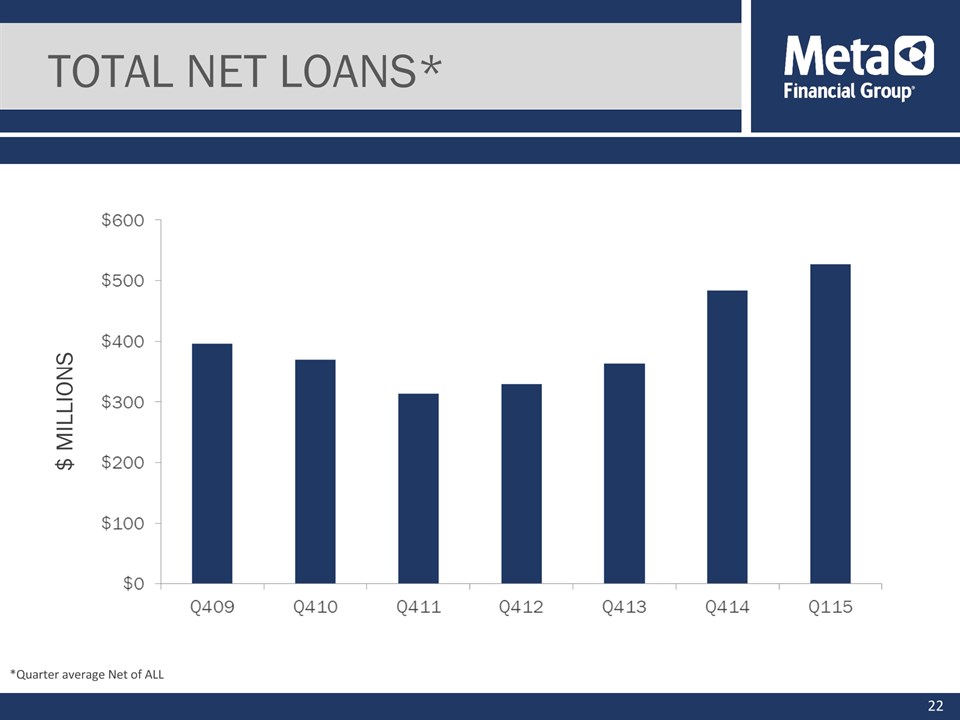
TOTAL NET LOANS* *Quarter average Net of ALL $ MILLIONS *
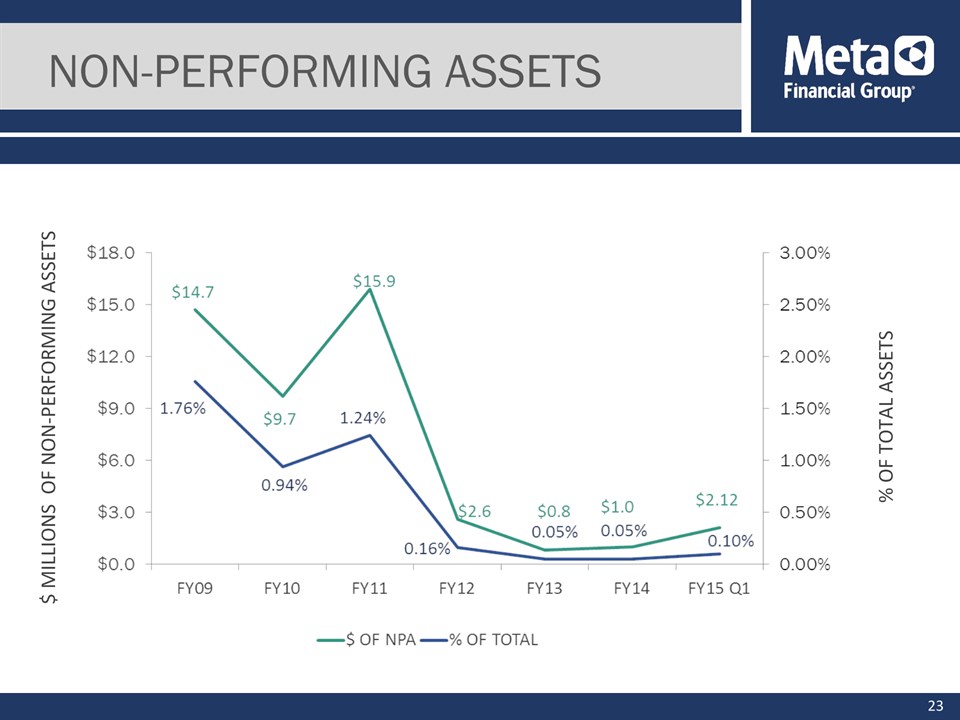
NON-PERFORMING ASSETS $ MILLIONS OF NON-PERFORMING ASSETS % OF TOTAL ASSETS *
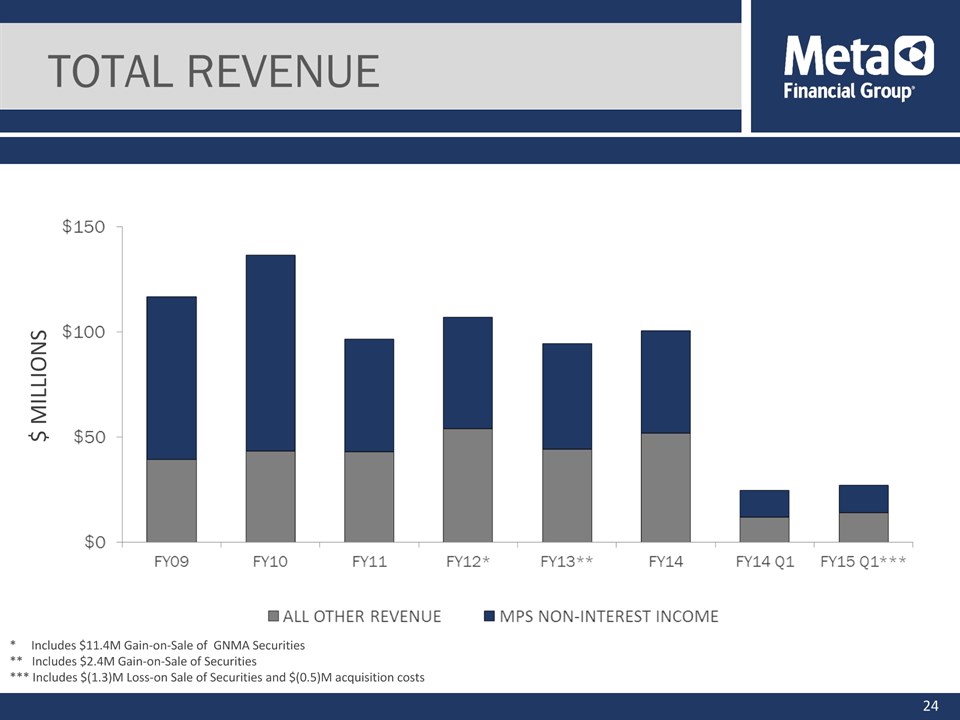
TOTAL REVENUE * Includes $11.4M Gain-on-Sale of GNMA Securities** Includes $2.4M Gain-on-Sale of Securities*** Includes $(1.3)M Loss-on Sale of Securities and $(0.5)M acquisition costs $ MILLIONS *
> A LEADING ISSUER OF PREPAID DEBIT CARDSSPRINGBOARD INTO OTHER PRODUCTS AND SERVICES> STRONG CAPITAL POSITIONEARNINGS AND ACCESS TO CAPITAL MARKETS TO FUND OUR GROWTH OBJECTIVESTIER 1 CORE CAPITAL AT DECEMBER 31, 2014 – 8.13%RISK-WEIGHTED CAPITAL AT DECEMBER 31, 2014 – 18.87% > STABLE, LOW COST FUNDING ADVANTAGE> STEADY DIVIDEND POLICY > POTENTIAL FOR UPWARD TREND IN EARNINGSHIGHER/NORMALIZED INTEREST RATES ASSET DIVERSIFICATION~85% OF DEPOSITS ARE LOW OR NO-COST AND WILL REMAIN SO IN A RISING RATE ENVIRONMENT META VALUE PROPOSITION *
NASDAQ: CASH