Attached files
| file | filename |
|---|---|
| EX-21 - EXHIBIT 21 - BROADCOM CORP | a20141231-10k_ex21.htm |
| EX-23.1 - EXHIBIT 23.1 - BROADCOM CORP | a20141231-10k_ex231.htm |
| EX-10.41 - EXHIBIT 10.41 - BROADCOM CORP | a20141231-10k_ex1041.htm |
| EX-10.48 - EXHIBIT 10.48 - BROADCOM CORP | a20141231-10k_ex1048.htm |
| EX-10.20 - EXHIBIT 10.20 - BROADCOM CORP | a20141231-10k_ex1020.htm |
| EXCEL - IDEA: XBRL DOCUMENT - BROADCOM CORP | Financial_Report.xls |
| EX-31.2 - EXHIBIT 31.2 - BROADCOM CORP | a20141231-10k_ex312.htm |
| EX-31.1 - EXHIBIT 31.1 - BROADCOM CORP | a20141231-10k_ex311.htm |
| EX-32 - EXHIBIT 32 - BROADCOM CORP | a20141231-10k_ex32.htm |
UNITED STATES SECURITIES AND EXCHANGE COMMISSION
Washington, D.C. 20549
Form 10-K
(Mark One)
x ANNUAL REPORT PURSUANT TO SECTION 13 OR 15(d) OF THE SECURITIES EXCHANGE ACT OF 1934
For the fiscal year ended December 31, 2014
or
¨ TRANSITION REPORT PURSUANT TO SECTION 13 OR 15(d) OF THE SECURITIES EXCHANGE ACT OF 1934
For the transition period from to
Commission file number: 000-23993

Broadcom Corporation
(Exact Name of Registrant as Specified in Its Charter)
California | 33-0480482 |
(State or Other Jurisdiction of Incorporation or Organization) | (I.R.S. Employer Identification No.) |
5300 California Avenue
Irvine, California 92617-3038
(Address of Principal Executive Offices) (Zip Code)
(Registrant’s telephone number, including area code): (949) 926-5000
Securities registered pursuant to Section 12(b) of the Act:
Title of Class | Name of Exchange on Which Registered |
Class A Common Stock, $0.0001 par value | The Nasdaq Stock Market LLC (Nasdaq Global Select Market) |
Securities registered pursuant to Section 12(g) of the Act: None
Indicate by check mark if the registrant is a well-known seasoned issuer, as defined in Rule 405 of the Securities Act. Yes þ No ¨
Indicate by check mark if the registrant is not required to file reports pursuant to Section 13 or Section 15(d) of the Act. Yes ¨ No þ
Indicate by check mark whether the registrant: (1) has filed all reports required to be filed by Section 13 or 15(d) of the Securities Exchange Act of 1934 during the preceding 12 months (or for such shorter period that the registrant was required to file such reports), and (2) has been subject to such filing requirements for the past 90 days. Yes þ No ¨
Indicate by check mark whether the registrant has submitted electronically and posted on its corporate Web site, if any, every Interactive Data File required to be submitted and posted pursuant to Rule 405 of Regulation S-T (§ 232.405 of this chapter) during the preceding 12 months (or for such shorter period that the registrant was required to submit and post such files). Yes þ No ¨
Indicate by check mark if disclosure of delinquent filers pursuant to Item 405 of Regulation S-K (§ 229.405 of this chapter) is not contained herein, and will not be contained, to the best of registrant’s knowledge, in definitive proxy or information statements incorporated by reference in Part III of this Form 10-K or any amendment to this Form 10-K. þ
Indicate by check mark whether the registrant is a large accelerated filer, an accelerated filer, a non-accelerated filer, or a smaller reporting company. See the definitions of “large accelerated filer,” “accelerated filer” and “smaller reporting company” in Rule 12b-2 of the Exchange Act.
(Check one): | |||
Large accelerated filer þ | Accelerated filer ¨ | Non-accelerated filer ¨ | Smaller reporting company ¨ |
(Do not check if a smaller reporting company) | |||
Indicate by check mark whether the registrant is a shell company (as defined in Exchange Act Rule 12b-2). Yes ¨ No þ
The aggregate market value of the registrant’s common stock held by non-affiliates of the registrant on June 30, 2014, was $20.00 billion (based on the closing sales price of the registrant’s common stock on the Nasdaq Global Select Market on that date). As of December 31, 2014 there were 550 million shares of Class A common stock and 49 million shares of Class B common stock outstanding.
DOCUMENTS INCORPORATED BY REFERENCE
Part III incorporates by reference certain information from the registrant’s definitive proxy statement for the 2015 Annual Meeting of Shareholders to be filed on or before April 30, 2015.
Broadcom®, the pulse logo, and BroadR-Reach® are among the trademarks of Broadcom Corporation and/or its affiliates in the United States, certain other countries and/or the EU. Any other trademarks or trade names mentioned are the property of their respective owners.
©2015 Broadcom Corporation. All rights reserved. | This Annual Report on Form 10-K is printed on recycled paper. |
BROADCOM CORPORATION
ANNUAL REPORT ON FORM 10-K
FOR THE FISCAL YEAR ENDED DECEMBER 31, 2014
TABLE OF CONTENTS
Page | |
PART I | |
PART II | |
PART III | |
PART IV | |
Cautionary Statement
All statements included or incorporated by reference in this Annual Report on Form 10-K, other than statements or characterizations of historical fact, are forward-looking statements within the meaning of the federal securities laws, including the Private Securities Litigation Reform Act of 1995. Examples of forward-looking statements include, but are not limited to, statements concerning projected total net revenue, costs and expenses and gross margin; our accounting estimates, assumptions and judgments; the demand for our products; our dependence on a few key customers and/or design wins for a substantial portion of our revenue; our commitment to research and development efforts; the characteristics of our patents; the accuracy of our estimates and forecasts; estimates related to the amount and/or timing of the expensing of unearned stock-based compensation expense and stock-based compensation as a percentage of revenue; manufacturing, assembly and test capacity; the effect that economic conditions, seasonality and volume fluctuations in the demand for our customers’ consumer-oriented products will have on our quarterly operating results; our ability to adjust operations in response to changes in demand for existing products and services or the demand for new products requested by our customers; the competitive nature of and anticipated growth in our markets; our ability to consummate acquisitions and integrate their operations successfully; our ability to migrate to smaller process geometries; our success in pending intellectual property litigation matters; our potential needs for additional capital; inventory and accounts receivable levels; our ability to permanently reinvest our foreign earnings; the effect of potential changes in U.S. or foreign tax laws and regulations or the interpretation thereof; the level of accrued rebates; and our intention to continue to pay dividends. These forward-looking statements are based on our current expectations, estimates and projections about our industry and business, management’s beliefs, and certain assumptions made by us, all of which are subject to change. Forward-looking statements can often be identified by words such as “anticipates,” “expects,” “intends,” “plans,” “predicts,” “believes,” “seeks,” “estimates,” “may,” “will,” “should,” “would,” “could,” “potential,” “continue,” “ongoing,” similar expressions, and variations or negatives of these words. These statements are not guarantees of future performance and are subject to risks, uncertainties and assumptions that are difficult to predict. Therefore, our actual results could differ materially and adversely from those expressed in any forward-looking statements as a result of various factors, some of which are listed under the section entitled “Risk Factors” in Part I, Item 1A of this Report. These forward-looking statements speak only as of the date of this Report. We undertake no obligation to revise or update publicly any forward-looking statement to reflect future events or circumstances.
PART I
Item 1. Business
Overview
Broadcom Corporation (including our subsidiaries, referred to collectively in this Annual Report as “Broadcom,” “we,” “our” and “us”) is a global leader and innovator in semiconductor solutions for wired and wireless communications. Broadcom was incorporated in California in August 1991. Our Class A common stock trades on the Nasdaq Global Select Market® under the symbol BRCM. Our principal executive offices are located at 5300 California Avenue, Irvine, California 92617-3038, and our telephone number at that location is 949.926.5000. Our Internet address is www.broadcom.com. The inclusion of our Internet address in this Report does not include or incorporate by reference into this Report any information on our website. Our annual reports on Form 10-K, quarterly reports on Form 10-Q, current reports on Form 8-K, and other U.S. Securities and Exchange Commission (SEC) filings are available free of charge through the Investor Relations section of our website as soon as reasonably practicable after such reports are electronically filed with, or furnished to, the SEC. The SEC also maintains a web site, www.sec.gov, which contains reports, proxy and information statements, and other information regarding issuers that file electronically with the SEC.
Communications technologies continue to evolve rapidly due to growth in the number of connected devices, continual increased demand for faster speeds across wired and wireless networks, the emergence of new communications standards, and the introduction of new technologies and features. Success in this field is influenced by the strength of a supplier’s intellectual property, or IP, portfolio and the ability to integrate that IP into complex, single-chip solutions. We have one of the strongest IP portfolios among global fabless semiconductor suppliers, as
1
ranked by the Institute of Electrical and Electronics Engineers (IEEE). Our strategy centers on designing highly-complex and highly-integrated semiconductor solutions that leverage our leading IP portfolio and target a broad range of wired and wireless communications markets. We provide one of the industry’s broadest portfolio of highly-integrated system-on-a-chip solutions, or SoCs, that seamlessly deliver voice, video, data and multimedia connectivity in the home, office and mobile environments. This focus on integration enables Broadcom to provide products that deliver leading performance, consume relatively low power and take up a minimal amount of space within our customers’ products. Our strong and growing IP portfolio and solid track record in designing highly-integrated SoCs enables us to quickly and efficiently respond to a rapidly evolving marketplace for communication solutions.
Reportable Segments
Our business is structured around two reportable segments: (i) Broadband and Connectivity; and (ii) Infrastructure and Networking.
Net revenue for these reportable segments is presented below. “Cellular Baseband” represents the operations of the cellular baseband business that is currently winding down. “All Other” is comprised of income from our April 2009 agreement with Qualcomm Incorporated, or the Qualcomm Agreement. See detailed discussion in the “Overview” section in Item 7. Management’s Discussion and Analysis of Financial Condition and Results of Operations.
Percentage of Net Revenue
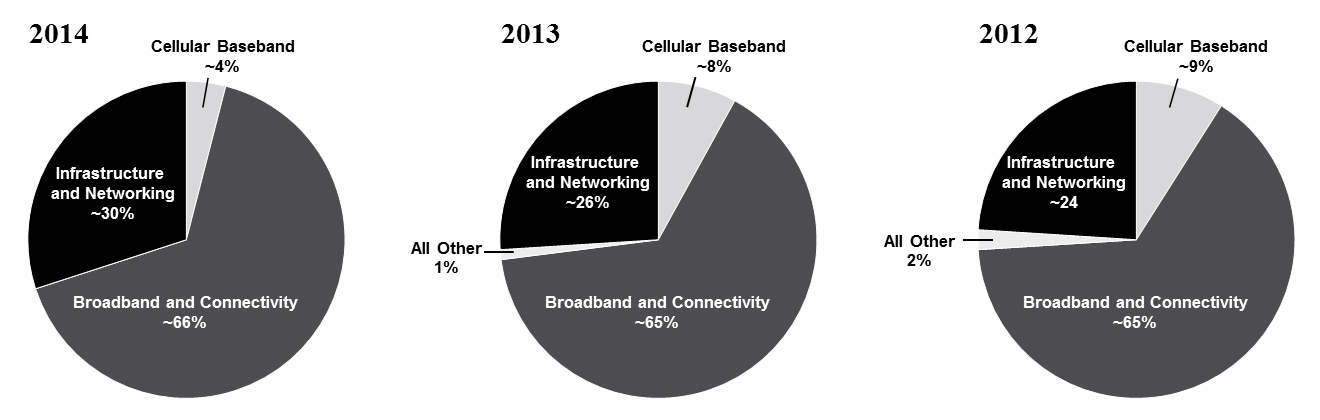
Net Revenue: $8.43 billion | Net Revenue: $8.31 billion | Net Revenue: $8.01 billion | ||
Broadband and Connectivity Reportable Segment
Our solutions in this reportable segment include: set-top box solutions, broadband modem solutions, connectivity solutions, and a range of other technologies. Customer products incorporating our solutions in this reportable segment include: set-top boxes, or STBs, central office broadband access equipment, residential gateways, stand-alone broadband access modems, and a range of consumer devices, including smartphones and tablets, wearable devices, PCs, laptops, access points, and others.
Set-Top Box Solutions
Global service providers are increasingly introducing new and enhanced technologies and services in STBs, including transcoding, digital video recording functionality, higher definition, increased networking capabilities, and more tuners to enable faster channel change and more simultaneous recordings. Service providers are also deploying High Efficiency Video Coding, or HEVC, a video compression format that is a successor to the H.264/MPEG-4 format. HEVC enables Ultra HD services by effectively doubling the capacity of existing networks to deploy new or existing content.
2
We offer complete platform solutions for cable, satellite, Internet Protocol, over-the-top and terrestrial STBs. Our families of STB solutions support the complete range of resolutions, from standard definition, to high definition, and Ultra HD. We also provide a family of related mixed-signal and digital RF tuner front-ends. Our latest generation of digital tuners leverages our Full-Band Capture (FBC) technology, which digitizes the entire downstream spectrum, replacing multiple tuners with a single FBC digital tuner. Our FBC technology is integrated into a range of gateways and STB platforms.
Broadband Modem Solutions
Global service providers continue to deploy next generation broadband access technologies across multiple standards, including DSL, cable and fiber, to provide more bandwidth and faster speeds to consumers. Over the coming years, we see global service providers moving toward DOCSIS 3.1 for cable modem technologies, G.Fast for DSL, and deploying more fiber-based solutions to increase speeds and bandwidth for customers.
We offer complete platform solutions for DSL, cable and fiber for both central office deployments and consumer premise equipment (CPE). For CPE deployments, we see continued transitions toward residential gateway solutions, which are frequently powered by Broadcom. For the central office, our solutions include cable modem termination systems for cable, optical line termination for fiber, and DSLAM’s for DSL.
Connectivity Technologies
Our connectivity solutions include integrated and discrete Wi-Fi, Bluetooth and near field communication, or NFC, solutions. Devices incorporating our wireless connectivity solutions include: smartphones; tablets; laptops, and related peripherals; wireless home routers and gateways; printers; handheld media devices; home gaming systems; smart TVs and connected STBs; as well as a range of wearable and connected devices, including watches and glasses, smoke alarms and thermostats.
Wi-Fi allows devices on a local area network to communicate wirelessly. It adds the convenience of mobility to the utility of high-speed data networks. We offer a family of high performance, low power Wi-Fi chipsets. We support a broad range of value added features on top of our WiFi solutions, including Wi-Fi Direct, WiFi Display and Miracast.
Bluetooth is a low power technology that enables direct connectivity between devices. We offer a complete family of Bluetooth silicon and software solutions that enable manufacturers to easily and cost-effectively add Bluetooth functionality to virtually any device. We continue to drive the evolution of Bluetooth with support of the Bluetooth Low Energy (BLE) standard, or Bluetooth Smart, for supporting low power applications such as health and fitness, medical devices, and wearable devices.
NFC, an ultra short-range wireless standard that enables simple pairing between devices, has been adopted for contactless payment systems and can also be implemented to facilitate simple pairing between a variety of devices, including smartphones, tablets, TVs, remote controls, wireless mice, and Bluetooth headsets. We offer a family of low-power NFC solutions for a range of consumer devices.
Other Broadband and Connectivity Technologies
Our other broadband and connectivity technologies include small cell/femtocell solutions, location (GPS) and touch controllers.
Small-cell: We offer complete 3G/4G platform solutions for femtocells and small and residential cells. We see service providers continuing to deploy small cells to add capacity and coverage to their cellular network topology. Femtocells are deployed primarily in residences to enhance cellular coverage in the home. Small cells are low-powered radio access nodes that operate in licensed and unlicensed spectrum with a range of 10 meters to 2 kilometers. Service providers are deploying small cells to enable data offload, which will enable them to more
3
efficiently utilize their limited spectrum.
Location (GPS): We also offer a family of GPS, assisted GPS (A-GPS) and GNSS semiconductor products, software and data services. Our location-based services technology delivers data to our GNSS devices, further enhancing performance and reliability. These GPS solutions are part of a broader location platform that leverages a broad range of communications technologies, including WiFi, Bluetooth, MEMS sensors and GPS, to provide more accurate location, navigation and more functionality indoors, including indoor location and navigation.
Touch controllers: We also offer touch controllers targeted to one customer, which are integrated circuits designed to process signals from touch screens on mobile devices. Our touch controllers can be found in smartphones and tablets.
Infrastructure and Networking Reportable Segment
Our solutions in this reportable segment include: Ethernet switches and PHYs, which includes switches and fabrics; copper and optical transceivers; backplane and optical front-end physical layer devices; processors (including multicore processors); and other Infrastructure and Networking technologies (including knowledge-based processors, VoIP solutions, microwave backhaul solutions and radio head digital front ends). We also offer a family of Ethernet controllers.
Customer products incorporating our solutions in this reportable segment include: service provider metro equipment; edge and core routers, wireless infrastructure and wireless access points; switches and routers; servers and workstations; network interface cards; LAN on motherboard applications; optical networks and dense wave division multiplexing applications; security appliances; storage controllers; microwave links for wireless backhaul; cellular remote radio heads; automobile Ethernet networks; point-of-sale equipment; and other embedded SoC subsystems.
Ethernet Switches and PHYs
Ethernet is a ubiquitous interconnection technology that enables high performance and cost effective networking infrastructure across the enterprise, service provider, data center and small and medium business spaces.
Ethernet Switch. We offer a broad set of Ethernet switching products that are optimized for service provider networks, data center implementations, and enterprise and small-and-medium businesses. These solutions range from low-cost five port switch chips to complete solutions enabling in excess of 400 terabits per second of switching capacity in a multi-chassis configuration. More specifically:
• | Data center - High capacity, low latency switching silicon that supports advanced protocols around virtualization and multi-pathing. Our Ethernet switching fabric technologies provide the ability to build highly scalable flat networks supporting tens of thousands of servers and supporting 100 gigabits per second (Gbps) Ethernet. |
• | Service provider - Our service provider switch portfolio enables carrier/service provider networks to support a large number of services in the wireless backhaul, access, aggregation and core of their networks. In addition, we also offer a full duplex 100 Gbps fully programmable packet processor. |
• | Enterprise and small-and-medium businesses (SMB) - For enterprise applications, we offer product families that combine multi-layer switching capabilities and wire-speed Gigabit, 10, 40 and 100 Gbps Ethernet switching performance for unified wired and wireless enterprise business networks. Our family of SMB Ethernet switch products are designed to support lower power modes and comply with industry standards around energy efficient Ethernet. |
4
Ethernet Copper Transceivers. Our high performance Ethernet transceivers are built upon a proprietary digital signal processing communication architecture optimized for high-speed network connections and support the latest standards and advanced features, such as energy efficient Ethernet, data encryption and time synchronization at one or 10 Gbps.
Automotive Ethernet. As consumer demand for in-vehicle connectivity continues to grow, automotive manufacturers are under pressure to deliver competitive, innovative features while minimizing cost. Broadcom’s BroadR-Reach® automotive solutions allow multiple in-vehicle systems (such as infotainment, on-board diagnostics and automated driver assistance) to simultaneously access information over unshielded single twisted pair cable. Our automotive Ethernet product portfolio consists of five devices (including three highly integrated switches with embedded PHYs and two stand-alone PHY solutions) that deliver high-performance bandwidth of 100Mbps and beyond while dramatically reducing connectivity costs and cabling weight, as well as increasing energy efficiency.
Backplane and Optical Front-End Physical Layer Devices. To address increasing volumes of data traffic both in data centers and service provider networks, we offer a portfolio of 10G and 40G Ethernet transceivers, 100 Gbps gear boxes, forward error correction solutions, and chips for backplanes and optical interconnect. These devices are low-power solutions for very high density 10, 40 and 100 Gbps switching and transport solutions. We also offer 2.5 Gbps and 10 Gbps SONET/SDH/OTN transceivers that enable the development of low-cost, high-density optical transport equipment, enabling telecommunications and service providers to efficiently deliver data and voice traffic over existing fiber networks.
Processors
Multicore Communication Processor. Used in building current and next-generation server, storage, data networking and wireless equipment, our multicore solutions include high performance quad-issue, quad-threaded central processing units (CPUs) that are coupled with high performance on-chip fabric and accelerators, enabling multi-chip cache coherent configurations. Broadcom’s high-speed communications processors support complex networking applications, such as deep content switching, routing and load balancing at wireline speed. In addition to our multicore processors, we provide a line of highly integrated processor and networking solutions based on ARM processors.
Ethernet Controllers
We offer Ethernet controllers for servers, workstations, and desktop and notebook computers, supporting multiple generations of Ethernet technology. We also supply ASIC controllers through a relationship with QLogic Corporation.
Other Infrastructure and Networking Technologies
Knowledge-Based Processors (KBP). Broadcom’s knowledge-based processors enable high-performance decision-making for packet processing in a variety of advanced devices in the enterprise, metro, access, edge and core networking spaces. This family features the ability to process packets at wire-speed while consuming relatively little power.
Microwave Modems and RF. Our family of microwave and millimeter modems and RF chip sets allows our customers to build high performance wireless backhaul and LAN extension products for service providers. They include features such as dual polarization for increased throughput, integrated networking functionality and full path protection.
VoIP solutions. Our family of VoIP solutions allows our customers to build VoIP-enabled telephony products primarily for the enterprise environment.
Digital Front-End Processors (DFE). We offer a family of Remote Radio Head DFE products that can be found in wireless infrastructure deployments around the globe.
5
Custom Silicon Products
We offer customers a range of custom application-specific integrated circuit, or ASIC, products that integrate customer-specific intellectual property into larger, more highly integrated solutions. This approach enables our customers to leverage their own intellectual property while still benefiting from the cost, power and performance benefits of a more integrated single-chip solution.
Reference Platforms
To assist our customers in developing products, we develop reference platforms designed around our integrated circuit products that represent prototypical system-level applications. These reference platforms generally include an extensive suite of software drivers, as well as protocol and application layer software. By providing reference platforms that may ultimately be incorporated into our customers’ end products, we believe we enable our customers to achieve easier and faster transitions from the initial prototype designs through final production releases. We believe these reference platform designs also significantly enhance customers’ confidence that our products will meet their market requirements and product introduction schedules.
Customers and Strategic Relationships
We sell our products to leading wired and wireless communications manufacturers. We have also established strategic relationships with multiservice operators that provide wired and wireless communications services to consumers and businesses. Our leading customers currently shipping wired and/or wireless communications equipment and devices incorporating our products include:
• Alcatel-Lucent | • Humax |
• Apple | • Pace |
• Arris | • Samsung |
• Cisco | • Technicolor |
• Huawei Technologies | • ZTE |
A small number of customers have historically accounted for a substantial portion of our net revenue. Contributions to our net revenue by these customers have increased in the last several years. Sales to our five largest customers represented 44.1%, 48.3% and 46.9% of our net revenue in 2014, 2013 and 2012, respectively. In 2014, 2013 and 2012 sales to Samsung represented 14.2%, 21.3%, and 17.3% of our net revenue, respectively. In 2014, 2013 and 2012 sales to Apple represented 14.0%, 13.3%, and 14.6% of our net revenue, respectively. See Note 11 of Notes to Consolidated Financial Statements, included in Part IV, Item 15 of this Report. We expect that our key customers will continue to account for a substantial portion of our net revenue in 2015 and in the foreseeable future. We typically sell products pursuant to purchase orders that customers can generally cancel, change or defer on short notice without incurring a significant penalty.
Research and Development
We have assembled a large team of experienced engineers and technologists, many of whom are leaders in their particular field or discipline. As of December 31, 2014 we had approximately 8,000 research and development employees (or approximately 75% of our total employees), including over 800 employees with Ph.D.s. These key employees are involved in advancing our core technologies, as well as product development. We believe that increased intellectual property integration and the timely introduction of new products are essential to our growth. Because SoC solutions benefit from the same underlying core technologies, we are able to address a wide range of communications markets with a relatively focused investment in research and development. Our research and development expense was $2.37 billion, $2.49 billion and $2.32 billion in 2014, 2013 and 2012, respectively. These amounts included stock-based compensation expense for employees engaged in research and development of $304 million, $363 million and $368 million in 2014, 2013 and 2012, respectively. We have design centers throughout the United States, including our principal design facilities in Irvine, California and Santa Clara County, California, as well as Asia, Europe and the Middle East.
6
Our revenue and our research and development costs as a percentage of revenue are subject to the cyclicality and seasonality of our industry. Our research and development costs on an absolute dollar basis are not, however, meaningfully affected by these patterns. We endeavor to manage our cost structure to attain long-term business objectives, rather than focusing on short-term profit targets.
Manufacturing
Wafer Fabrication
We depend on multiple foundry subcontractors located in Asia to manufacture a majority of our products. Our key silicon foundries are:
• | Taiwan Semiconductor Manufacturing Corporation, or TSMC, in Taiwan; |
• | United Microelectronics Corporation in Singapore and Taiwan; |
• | Semiconductor Manufacturing International Corporation in China; and |
• | GlobalFoundries, Inc. (formerly Chartered Semiconductor Manufacturing) in Singapore and Germany. |
By subcontracting manufacturing, we focus resources on design and test applications where we believe we have greater competitive advantages. This strategy also avoids the high capital cost of owning and operating semiconductor wafer fabrication facilities. See “Risk Factors” under Item 1A of this Report for a discussion of the risks associated with our dependence on independent foundry subcontractors.
Most of our products are manufactured using complementary metal oxide semiconductor, or CMOS, process technology. Our products are currently fabricated on a variety of processes ranging from 500 nanometers to 28 nanometers. We generally evaluate the benefits of migrating to smaller geometry process technologies based on the benefits in performance, power and/or cost. In 2014, approximately 50% of our products were manufactured in 40 nanometers and 30% in 65 nanometers. We are designing most new products in 40 nanometers and 28 nanometers, and are beginning to evaluate FinFET technologies. As we move to smaller geometries, we have become increasingly reliant on Taiwan Semiconductor Manufacturing Company (TSMC) for the manufacture of product at and below 40 nanometers. See “Risk Factors” under Item 1A of this Report for a discussion of the risks associated with transitioning to smaller geometry process technologies.
Assembly and Test
Our products are tested at either the wafer level and/or the packaged finished products level. Our product testing is conducted by independent foundries, and independent test subcontractors. The die are assembled into finished products by independent assembly and package subcontractors. A majority of our test and assembly is performed by the following independent subcontractors:
• | Advanced Semiconductor Engineering (ASE) in Singapore, China and Taiwan (test, assembly and packaging); |
• | Siliconware Precision in Taiwan (test, assembly and packaging); |
• | United Test and Assembly Center in Singapore, China and Thailand (test, assembly and packaging); |
• | Amkor in Korea, Philippines, Taiwan and China (assembly and packaging only); and |
• | STATSChipPAC in Singapore, Korea, Malaysia and China (test, assembly and packaging). |
See “Risk Factors” under Item 1A of this Report for a discussion of the risks associated with our dependence on third party assembly and test subcontractors.
7
Quality Assurance
We consider product reliability from the initial stage of the design cycle through each specific design process, from layout through testing. Our operations and quality engineering teams closely manage the interface between manufacturing and design engineering. We evaluate each assembly and foundry subcontractor. We also participate in quality and reliability monitoring by reviewing electrical and parametric data from our wafer foundry and assembly subcontractors. We closely monitor wafer foundry production to ensure consistent overall quality, reliability and yield levels. All of our principal independent foundries and package assembly facilities are currently ISO 9001 certified, a comprehensive International Standards Organization specified quality system acknowledgment. As part of our total quality program, we received ISO 9001 certification for our Singapore distribution facility.
Environmental Management
We assess the environmental impact of our products to international standards. Our manufacturing subcontractors have registered our manufacturing flow to ISO 14000, the international standard related to environmental management. Lead-free solutions in electronic components and systems are receiving increasing attention within the semiconductor industry. Our products are compliant with the Restriction of Hazardous Substances Directive, or RoHS, the European legislation that restricts the use of a number of substances, including lead, and current European REACH (Regulation, Evaluation and Authorization of Chemicals) laws.
Product Distribution
Due largely to the location of our customers and their fabrication facilities, the majority of our products are shipped outside of the United States to customers through our distribution center in Singapore and a smaller portion within the United States via an operations and distribution center in Irvine, California. Net product revenue derived from actual shipments to international destinations, primarily in Asia represented 95.7%, 96.4% and 96.4% of our net revenue in 2014, 2013 and 2012, respectively.
Sales and Marketing
Our sales and marketing strategy is to achieve design wins with industry leaders by providing quality, state-of-the-art products and superior technical support. We market and sell our products in the United States through a direct sales force, but we also use distributors and manufacturers’ representatives. The majority of our domestic sales occur through our direct sales force, which is located in offices throughout the United States. We market and sell our products internationally through regional offices in Asia and Europe, as well as through a network of independent distributors and representatives in Asia, Australia, Europe, South Africa and South America. We or our customers select these independent entities based largely on their ability to provide effective sales and technical support to our customers. All international sales to date have been in U.S. dollars. We present revenue from independent customers by geographic area in Note 11 of Notes to Consolidated Financial Statements, included in Part IV, Item 15 of this Report.
Backlog
Our sales are primarily made through standard purchase orders for delivery of products. We follow industry practice that allows customers to cancel, change or defer orders with limited advance notice prior to shipment. Given this practice, we do not believe that backlog, by itself, is a reliable indicator of future revenue levels.
Competition
The semiconductor industry in general, and wired and wireless communications markets in particular, are intensely competitive and are characterized by constant innovation, rapid change, rapid cadence through technology standards, short product life cycles and steady price erosion. We believe that the principal factors of competition for integrated circuit providers in general, or their product offerings in particular, include:
8
• product quality and reputation | • market presence |
• product capabilities | • standards compliance |
• level of integration | • system cost |
• engineering execution and scale | • breadth of intellectual property |
• reliability | • customer interface and support |
• power efficiency | • time-to-market |
• circuit board footprint | • security |
We believe that we currently compete favorably with respect to each of these factors.
We compete with a number of major domestic and international suppliers of integrated circuits and related applications, including, but not limited to the following:
Broadband and Connectivity | Infrastructure and Networking |
• Intel Corporation | • Cavium, Inc. |
• Marvell Technology Group Ltd. | • Freescale Semiconductor,Ltd. |
• Mediatek Inc. | • Intel Corporation |
• Qualcomm Incorporation | • Marvell Technology Group Ltd. |
• STMicroelectronics NV | • Mellanox |
We also compete with suppliers of system-level and motherboard-level solutions incorporating integrated circuits that are proprietary or sourced from manufacturers other than Broadcom. This competition, along with Moore’s law, has resulted and may continue to result in declining average selling prices for our products in certain markets. We also may face competition from newly established competitors, suppliers of products based on new or emerging technologies, and customers that choose to develop their own silicon solutions.
Some of our competitors operate their own fabrication facilities and have longer operating histories and presence in key markets, greater name recognition, larger customer bases and significantly greater financial, sales and marketing, manufacturing, distribution and other resources than we do. As a result, these competitors may be able to adapt more quickly to new or emerging technologies and changes in customer requirements or devote greater resources to the promotion and sale of their products. Current and potential competitors have established or may establish financial or strategic relationships among themselves or with existing or potential customers, resellers or other third parties, and may refuse to provide us with information necessary to permit the interoperability of our products with theirs. Accordingly, it is possible that new competitors or alliances among competitors could emerge and rapidly acquire significant market share. In addition, competitors may develop technologies that more effectively address our markets with products that offer enhanced features, lower power requirements or lower costs. Increased competition could result in pricing pressures, decreased gross margins and loss of market share and may materially and adversely affect our business, financial condition and results of operations. See “Risk Factors” under Item 1A of this Report for further discussion of the risks associated with competition.
Seasonality
Our revenue, at both the consolidated and reportable segment level, is subject to some seasonal variation. Our revenue tends to be weaker in the first and fourth quarters of the calendar year and stronger in the middle of the calendar year. This trend is driven by multiple factors, including manufacturers preparing for the major holiday selling seasons. Our seasonality has varied significantly over time, which ultimately limits the usefulness of this metric as a predictive indicator of our revenue trend on a quarterly basis.
Intellectual Property
Our success and future product revenue growth depend, in part, on our ability to protect our intellectual property. We rely primarily on patents, copyrights, trademarks and trade secrets, as well as nondisclosure agreements and other methods, to protect our proprietary technologies and processes. However, these may not provide
9
meaningful or adequate protection for our intellectual property.
We currently hold more than 10,350 U.S. patents (up from more than 9,000 U.S. patents from the prior year) and more than 3,550 foreign patents and have more than 6,550 additional U.S. and foreign pending patent applications. We believe that no single patent is solely responsible for protecting our products and that the duration of our patents is adequate relative to the expected lives of our products.
We generally enter into confidentiality agreements with our employees and strategic partners, and typically control access to and distribution of product documentation and other proprietary information. Despite these precautions, it is possible that competitors or other unauthorized third parties may obtain, copy, use or disclose our technologies and processes, develop similar technology independently, or design around our patents. As such, any rights granted under our patents may not provide us with meaningful protection. In addition, we may not be able to successfully enforce our patents against infringing products in every jurisdiction. See “Risk Factors” under Item 1A of this Report for further discussion of the risks associated with patents and intellectual property.
Some or all of our patents have in the past been licensed and may in the future be licensed to certain of our competitors through cross-license agreements. Moreover, because we have participated and continue to participate in developing various industry standards, we may be required to license some of our patents to others, including competitors, who develop products based on those standards.
Companies in the semiconductor industry, particularly in the wired and wireless communications markets, often aggressively protect and pursue their intellectual property rights. We are currently engaged in litigation and may need to engage in future litigation to enforce or protect our intellectual property rights or the rights of our customers, to protect our trade secrets, or to determine the validity and scope of proprietary rights of others, including our customers. Such litigation could result in substantial costs and diversion of our resources and could materially and adversely affect our business, financial condition and results of operations. For a detailed description of various outstanding intellectual property litigation matters, see Note 8 of Notes to Consolidated Financial Statements, included in Part IV, Item 15 of this Report.
Employees
As of December 31, 2014 we had approximately 10,650 employees, including 8,000 individuals engaged in research and development, 1,000 engaged in sales and marketing, 700 engaged in manufacturing operations, and 950 engaged in general and administrative activities. Although we have works council or employee representatives in certain countries, our U.S. employees are not represented by a labor union.
Additional Information
Investors and others should note that we announce material financial information using our company website (www.broadcom.com), our investor relations website (investors.broadcom.com), SEC filings, press releases, public conference calls and webcasts. Information about Broadcom and our business may also be communicated in posts on the following social media channels:
• | B-Connected Blog (blog.broadcom.com) |
• | Broadcom’s Twitter feed (www.twitter.com/Broadcom) |
• | Broadcom’s Facebook page (www.facebook.com/Broadcom) |
The information that we post on these social media channels could be deemed to be material information. As a result, we encourage investors, the media, and others interested in Broadcom to review the information that we post on these social media channels. These channels may be updated from time to time on our website. The information on or accessible through our websites and social media channels is not incorporated by reference in this Annual Report on Form 10-K.
10
Item 1A. Risk Factors
Before deciding to purchase, hold or sell our common stock, you should carefully consider the risks described below in addition to the other information contained in this Report and in our other filings with the SEC, including subsequent reports on Forms 10-Q and 8-K. The risks and uncertainties described below are not the only ones we face. Additional risks and uncertainties not presently known to us or that we currently deem immaterial may also affect our business. If any of these known or unknown risks or uncertainties actually occurs with material adverse effects on Broadcom, our business, financial condition, results of operations and/or liquidity could be seriously harmed. In that event, the market price for our Class A common stock will likely decline, and you may lose all or part of your investment.
Our quarterly operating results may fluctuate significantly.
Our quarterly net revenue and operating results have fluctuated significantly in the past and may vary from quarter to quarter. Variability in the nature of our operating results may be attributed to the factors identified throughout this “Risk Factors” section, many of which may be outside our control, including:
• | changes in economic conditions in the markets we address, including the continuing volatility in the technology sector and semiconductor industry; |
• | our dependence on a few significant customers and/or design wins for a substantial portion of our revenue; |
• | our exit or entry into various markets and our ability to align our resources to areas of strategic focus; |
• | changes in customer product needs and market acceptance of our products; |
• | seasonality in sales of consumer and enterprise products in which our products are incorporated; |
• | timing, rescheduling or cancellation of significant customer orders and our ability, as well as the ability of our customers, to manage inventory; |
• | competitive pressures and other factors such as the qualification, availability and pricing of competing products and technologies and the resulting effects on sales and pricing of our products; |
• | goodwill and other purchased intangible impairment charges; |
• | the impact of a significant natural disaster, such as an earthquake, severe weather, tsunami or other flooding, or a nuclear crisis, as well as interruptions or shortages in the supply of utilities such as water and electricity, in a key location such as our corporate headquarters or our Northern California facilities, both of which are located near major earthquake fault lines, in our Singapore distribution center or in a key location of one of our suppliers, foundries or customers; |
• | the impact of enterprise system failures or network disruptions, the lack of system redundancies, and the potential failure of our disaster recovery planning to cover various unanticipated occurrences; and |
• | the impact of tax examinations. |
We depend on a few significant customers for a substantial portion of our revenue.
We derive a substantial portion of our revenue from sales to a relatively small number of customers. Contributions to our net revenue by these customers have increased in the last several years. Sales to our five largest customers represented 44.1%, 48.3% and 46.9% of our total net revenue in 2014, 2013 and 2012, respectively. Sales to two significant customers, those representing 10% or more of total net revenue, represented 28.2%, 34.6% and 31.9% of our total net revenue in 2014, 2013 and 2012, respectively. We expect that our largest customers will continue to account for a substantial portion of our total net revenue for the foreseeable future. The loss of any significant customer could materially and adversely affect our financial condition and results of operations. Also, as our significant customers become larger relative to our business and the industry, they may be able to leverage pricing pressure through the supply chain, vertical integration or other avenues, thereby adversely affecting our gross margins.
A significant portion of our revenue in any period may also depend on a single product design win with a large customer. As a result, the loss of any such key design win or any significant delay in the ramp of volume production of the customer’s products into which our product is designed could materially and adversely affect our financial
11
condition and results of operations. We may not be able to maintain sales to certain of our key customers or continue to secure key design wins for a variety of reasons, including:
• | agreements with our customers typically do not require them to purchase a minimum quantity of our products; and |
• | our customers can stop incorporating our products into their own products with limited notice to us and suffer little or no penalty. |
Additionally, in markets where we have a strong presence, our future growth will not necessarily be dependent on or correlate to our technical or design win success, but rather, may be dependent on (and may be constrained by) the growth rate of the overall market for the end product devices.
The loss of a key customer or design win, a reduction in sales to any key customer, a significant delay or negative development in our customers’ product development plans, or our inability to attract new significant customers or secure new key design wins could seriously impact our revenue and materially and adversely affect our results of operations.
We may fail to appropriately adjust our operations in response to changes in our strategy or market demand.
We significantly modified the scope of our operations and workforce in recent years. In response to changes in industry and market conditions, we may from time to time strategically realign our resources. These circumstances could cause the need to implement restructuring actions and other cost saving measures. Our operations are characterized by a high percentage of costs that are fixed or difficult to reduce in the short term, such as research and development expenses related to our highly skilled workforce.
During other periods, our growth has placed a significant strain on our management personnel, systems and resources. To respond to such periods of increased demand, we would need to expand, train, manage and motivate our workforce, and to upgrade or enhance our existing IT systems. For example, in response to prior periods of growth we began upgrading our enterprise resource planning system and expect to continue to do so during 2015. We may not be successful in implementing new systems, which could involve business disruptions, including impeding the shipment of our products. If we are unable to effectively manage expanding operations during growth periods, we may be unable to adjust our business quickly enough to meet competitive challenges or exploit potential market opportunities.
Any of these circumstances could materially and adversely affect our current or future business.
We face intense competition.
The semiconductor industry and the wired and wireless communications markets are intensely competitive. We expect competition to continue to increase as new markets develop, as industry standards become well known and as other competitors enter our business. We also expect to encounter further consolidation in the markets in which we compete.
Some of our competitors have longer operating histories and presences in key markets, greater name recognition, larger customer bases, and significantly greater financial, research and development, sales and marketing, manufacturing, distribution, technical and other resources than we do, and in some cases operate their own fabrication facilities. These competitors may be able to adapt more quickly to new or emerging technologies and changes in customer requirements. They may also be able to devote greater resources to the promotion and sale of their products. We also face competition from newly established competitors, suppliers of products, and customers who choose to develop their own semiconductor solutions.
Existing or new competitors may develop technologies that more effectively address our markets with products that offer enhanced features and functionality, lower power requirements, lower cost or greater levels of integration. The trend of increasingly integrated SoCs and chipset solutions in particular could pose a risk to various
12
lines of our business, especially with respect to our connectivity products, as customers may opt for a solution that includes functionality that was previously sourced from us on a standalone basis.
Increased competition also has resulted in and is likely to continue to result in increased expenditures on research and development, a decline in average selling prices, reduced gross margins and loss of market share in certain markets. These factors in turn create increased pressure to consolidate. We cannot provide assurance that we will be able to continue to compete successfully against current or new competitors. If we do not compete successfully, we may lose market share in our existing markets and our revenues may fail to increase or may decline.
We manufacture and sell complex products and may be unable to successfully develop and introduce new products.
We expect that a high percentage of our future sales will come from sales of new products. We sell products in markets that are characterized by rapid technological change, evolving industry standards, frequent new product introductions and sometimes short product life cycles. The markets for some of these products are new to us and may be immature and/or unpredictable. These markets may not develop into profitable opportunities and we have in the past invested substantial resources in emerging technologies that did not achieve the market acceptance or commercial success that we had expected. As a result, it is difficult to anticipate our future revenue streams from, or the sustainability of, our new products.
Our industry is dynamic and we are required to devote significant resources to research and development to remain competitive. Such costs increase with the advancement of technologies and manufacturing in smaller geometry processes, which can adversely affect our operating margin. The development of new silicon devices is highly complex, and due to supply chain cross-dependencies and other issues, we may experience delays in completing the development, production and introduction of our new products. We may choose to discontinue one or more products or product development programs to dedicate more resources to other products. The discontinuation of an existing or planned product may adversely affect our relationship with one or more of our customers and/or cause other negative consequences.
Our ability to successfully develop and deliver new products will depend on various factors, including our ability to:
•effectively identify and capitalize upon opportunities in new markets;
•timely complete and introduce new integrated products;
•transition our semiconductor products to increasingly smaller line width geometries;
•obtain sufficient foundry capacity (including at smaller geometry processes) and packaging materials;
•license any desired third party technology or intellectual property rights; and
•qualify and obtain industry interoperability certification of our products.
If we are not able to develop and introduce new products in a cost effective and timely manner, we will be unable to attract new customers or to retain our existing customers which would materially and adversely affect our results of operations.
We have experienced hardware and software defects and bugs associated with the introduction of our highly complex products. If any of our products contain defects or bugs, or have reliability, quality, security or compatibility problems, our reputation may be damaged and customers may be reluctant to buy our products. These problems could interrupt or delay sales and shipments of our products to customers. To alleviate these problems, we may have to divert our resources from other development efforts. In addition, these problems could result in claims against us by our customers or others, including possible claims for consequential damages and/or lost profits. As we transition to manufacturing our products in smaller geometry processes, such as 28 nanometers and below, these risks are enhanced.
13
We are exposed to risks associated with our international operations.
We currently obtain substantially all of our manufacturing, assembly and testing services from suppliers located outside the United States. Products shipped to international destinations, primarily in Asia, represented 95.7%, 96.4% and 96.4% of our product revenue in 2014, 2013 and 2012, respectively. Substantially all of our products are shipped through our logistical facilities in Singapore. An increasing portion of our product sales is made through international distributors, which increases our exposure to the risks described below. In addition, we undertake various sales and marketing activities through regional offices in a number of countries. We intend to continue expanding our international business activities and to open other design and operational centers abroad.
International operations are subject to many inherent risks, including but not limited to:
• | political, social and economic instability; |
• | exposure to different business practices and legal and compliance standards; |
• | continuation of overseas conflicts and the risk of terrorist attacks and resulting heightened security; |
• | the imposition of governmental controls and restrictions and unexpected changes in regulatory requirements; |
• | nationalization of business and blocking of cash flows; |
• | logistical delays or disruptions; |
• | changes in taxation and tariffs; and |
• | difficulties in staffing and managing international operations. |
Our international operations are subject to increasingly complex foreign and U.S. laws and regulations, including but not limited to anti-corruption laws, such as the Foreign Corrupt Practices Act and the UK Bribery Act and equivalent laws in other jurisdictions, antitrust or competition laws, and data privacy laws, among others. Violations of these laws and regulations could result in fines and penalties, criminal sanctions against us, our officers, or our employees, prohibitions on the conduct of our business and on our ability to offer our products and services in one or more countries, and could also materially affect our reputation, our international expansion efforts, our ability to attract and retain employees, our business, and our operating results. Although we have implemented policies, procedures and training designed to ensure compliance with these laws and regulations, there can be no complete assurance that any individual employee, contractor, or agent will not violate our policies. Additionally, the costs of complying with these laws (including the costs of investigations, auditing and monitoring) could also adversely affect our current or future business.
Economic conditions in our primary markets, particularly in Asia, may negatively impact the demand for our products in those geographies. Also, all of our international sales to date have been denominated in U.S. dollars. Accordingly, an increase in the value of the U.S. dollar relative to foreign currencies could make our products less competitive in international markets or require us to assume the risk of denominating certain sales in foreign currencies. We anticipate that these factors will impact our business to a greater degree as we further expand our international business activities.
Our operating results may be adversely impacted by worldwide economic uncertainties and specific conditions in the markets we address.
We operate primarily in the semiconductor industry, which is cyclical and subject to rapid change and evolving industry standards. From time to time, the semiconductor industry has experienced significant downturns characterized by decreases in product demand, excess customer inventories and accelerated erosion of prices. The semiconductor industry also periodically experiences increased demand and production capacity constraints, which may affect our ability to ship products. Economic volatility can cause extreme difficulties for our customers and vendors in accurately forecasting and planning future business activities. This unpredictability could cause our customers to reduce spending on our products and services, which would delay and lengthen sales cycles. Furthermore, during challenging economic times our customers and vendors may face challenges in gaining timely access to sufficient credit, which could impact their ability to make timely payments to us. As a result, we may experience growth patterns that are different than the demand for our customers’ products, particularly during
14
periods of high volatility.
We cannot predict the timing, strength or duration of any economic slowdown or recovery or the impact of such events on our customers, our vendors or us. The combination of our lengthy sales cycle coupled with challenging macroeconomic conditions and supply chain cross-dependencies could have a compound impact on our business. The impact of market volatility is not limited to revenue but may also affect our gross margins and other financial metrics. Any downturn in the semiconductor industry may be severe and prolonged, and any failure of the industry or wired and wireless communications markets to fully recover from downturns could seriously impact our revenue and harm our business, financial condition and results of operations.
We may be unable to attract, retain or motivate key personnel.
Our future success depends on our ability to attract, retain and motivate senior management and qualified technical personnel. Competition for these employees is intense. If we are unable to attract, retain and motivate such personnel in sufficient numbers and on a timely basis, we will experience difficulty in implementing our current business and product plans. In that event, we may be unable to successfully meet competitive challenges or to exploit potential market opportunities, which could adversely affect our business and results of operations. Our recent and any future restructuring plans may adversely impact our ability to attract and retain key employees.
Our stock price is highly volatile.
The market price of our Class A common stock has fluctuated substantially in the past and is likely to continue to be highly volatile and subject to wide fluctuations. From January 1, 2012 through December 31, 2014 our Class A common stock has traded at prices as low as $23.25 and as high as $44.33 per share. Fluctuations have occurred and may continue to occur in response to various factors, many of which we cannot control.
In addition, the market prices of securities of semiconductor and other technology companies have been and remain volatile. This volatility has significantly affected the market prices of securities of many technology companies for reasons frequently unrelated to the operating performance of the specific companies. If our operating results do not meet the expectations of securities analysts or investors, who may derive their expectations by extrapolating data from recent historical operating results, our financial forecasts, or company presentations, then the market price of our Class A common stock will likely decline. Accordingly, you may not be able to resell your shares of common stock at or above the price you paid. In the past, we, and other companies that have experienced volatility in the market price of their securities, have been the subject of securities class action litigation.
Due to the nature of our compensation programs, most of our executive officers sell shares of our common stock periodically, often pursuant to trading plans established under Rule 10b5-1 of the Exchange Act. As a result, sales of shares by our executive officers may not be indicative of their respective opinions of Broadcom’s performance at the time of sale or of our potential future performance. Nonetheless, the market price of our stock may be affected by sales of shares by our executive officers.
Our business is subject to potential tax liabilities.
We are subject to income taxes in the United States and various foreign jurisdictions. The amount of income taxes we pay is subject to our interpretation and application of tax laws in jurisdictions in which we file. Changes in current or future laws or regulations, the imposition of new or changed tax laws or regulations or new related interpretations by taxing authorities in the U.S. or foreign jurisdictions, or changes in our tax planning strategies could adversely affect our results of operations and could lead to volatility with respect to tax expenses and liabilities from period to period. We are subject to examinations and tax audits. There can be no assurance that the outcomes from these audits will not have an adverse effect on our net operating loss and research and development tax credit carryforwards, our financial position, or our operating results.
15
We may be required to defend against alleged infringement of intellectual property rights of others and/or may be unable to adequately protect or enforce our own intellectual property rights.
Companies in the semiconductor industry, particularly those in the wired and wireless communications markets, aggressively protect and pursue their intellectual property rights. From time to time, we receive notices from competitors and other operating companies, as well as notices from “non-practicing entities,” or NPEs, that claim we have infringed upon, misappropriated or misused other parties’ proprietary rights. We may also be required to indemnify some customers and strategic partners under our agreements if a third party alleges or if a court finds that our products or activities have infringed upon, misappropriated or misused another party’s proprietary rights. We have received requests from certain customers and strategic partners to include increasingly broad indemnification provisions in our agreements with them. Additionally, our products may contain technology provided to us by other parties such as contractors, suppliers or customers. We may have little or no ability to determine in advance whether such technology infringes the intellectual property rights of a third party. Our contractors, suppliers and licensors may not be required to indemnify us in the event that a claim of infringement is asserted against us, or they may be required to indemnify us only up to a maximum amount, above which we would be responsible for any further costs or damages.
Furthermore, our success and future revenue growth will depend, in part, on our ability to protect our intellectual property. It is possible that competitors or other unauthorized third parties may obtain, copy, use or disclose our technologies and processes, or confidential employee, customer or supplier data. Any of our existing or future patents may be challenged, invalidated or circumvented. We engage in litigation to enforce or defend our intellectual property rights, protect our trade secrets, or determine the validity and scope of the proprietary rights of others, including our customers. We also enter into confidentiality agreements with our employees, consultants and strategic partners and control access to and distribution of our technologies, documentation and other proprietary information. Despite these efforts, internal or external parties may attempt to copy, disclose, obtain or use our products, services or technology without our authorization. If we cannot adequately protect our technology, our competitors may be able to offer products similar to ours.
Intellectual property litigation can be expensive, time consuming and distracting to management. An adverse determination in any of these types of disputes could prevent us from manufacturing or selling some of our products or could prevent us from enforcing our intellectual property rights. Settlements can involve royalty or other payments that could reduce our profit margins and adversely affect our financial results. Additionally, identifying unauthorized use of our products and technologies is difficult and time consuming. The initiation of litigation may adversely affect our relationships and agreements with certain customers that have a stake in the outcome of the litigation proceedings.
We face risks associated with our acquisition strategy.
An important element of our business strategy involves expansion through the acquisition of businesses, assets, products or technologies. The expansion of our business through acquisitions allows us to complement our existing product offerings, expand our market coverage, increase our engineering workforce and/or enhance our technological capabilities. We may not be able to identify or consummate future acquisitions or realize the desired benefit from these acquisitions.
We face a number of challenges associated with our acquisition strategy that could disrupt our ongoing business and distract our management team, including:
• | lower revenue, gross margins and operating income than originally anticipated at the time of acquisition and other financial challenges; |
• | delays in the timing and successful integration of an acquired company’s technologies and/or launch of products; |
• | the loss of key personnel; |
• | challenges in obtaining necessary transition services; and |
• | becoming subject to intellectual property or other litigation. |
16
Acquisitions can result in increased debt or contingent liabilities. While we believe we will be able to service any additional debt issued in connection with acquisitions, our ability to make principal and interest payments when due depends upon our future performance, which is subject to general economic conditions, industry cycles, and business and other factors affecting our operations, including the other risk factors described in this section, many of which are beyond our control. Acquisitions can also result in adverse tax consequences, warranty or product liability exposure related to acquired assets, additional stock-based compensation expense, write up of acquired inventory to fair value, and the recording and later amortization of amounts related to certain purchased intangible assets, all of which can adversely affect our reported results on a GAAP basis. Furthermore, we have in the past and may in the future record goodwill and other purchased intangible assets in connection with an acquisition and incur impairment charges.
We are subject to order and shipment uncertainties.
It is difficult to accurately predict demand for our semiconductor products. We typically sell products pursuant to purchase orders rather than long-term purchase commitments. Customers can generally cancel, change or defer purchase orders on short notice without incurring a significant penalty. Our ability to accurately forecast customer demand is further impaired by delays inherent in our lengthy sales cycle. We operate in a dynamic industry and use significant resources to develop new products for existing and new markets. After we have developed a product, there is no guarantee that our customers will integrate our product into their equipment or devices and, ultimately, bring those equipment and devices incorporating our product to market. In these situations, we may never produce or deliver a significant number of our products, even after incurring substantial development expenses. From the time a customer elects to integrate our solution into their product, it is typically six to 24 months before high volume production of that product commences. After volume production begins, we cannot be assured that the equipment or devices incorporating our product will gain market acceptance.
Our products are incorporated into complex devices and systems, creating supply chain cross-dependencies. Accordingly, supply chain disruptions affecting components of our customers’ devices and/or systems could negatively impact the demand for our products, even if the supply of our products is not directly affected.
Our product demand forecasts are based on multiple assumptions, each of which may introduce error into our estimates. In the event we overestimate customer demand, we may allocate resources to manufacturing products that we may not be able to sell. As a result, we could hold excess or obsolete inventory, which would reduce our profit margins and adversely affect our financial results. Conversely, if we underestimate customer demand or if insufficient manufacturing capacity is available, we could forego revenue opportunities and potentially lose market share and damage our customer relationships. Also, due to our industry’s use of “just-in-time” inventory management, any disruption in the supply chain could lead to more immediate shortages in product or component supply. Additionally, any enterprise system failures, including in connection with implementing new systems, could impact our ability to fulfill orders and interrupt other processes.
A portion of our inventory is maintained under hubbing and distribution arrangements whereby products are delivered to a customer or third party warehouse based upon the customer’s projected needs. Under these arrangements, we do not recognize product revenue until the customer reports that it has removed our product from the warehouse to incorporate into its end products. Our ability to effectively manage inventory levels may be impaired under such arrangements, which could increase expenses associated with insurance costs, excess and obsolete product inventory and negatively impact our cash flow.
We depend on third parties to fabricate, assemble and test our products.
As a fabless semiconductor company, we do not own or operate fabrication, assembly or test facilities. As a result, we face competition for manufacturing capacity in the open market. We rely on third parties to manufacture, assemble and test substantially all of our semiconductor devices. Accordingly, we cannot directly control our product delivery schedules and quality assurance. This lack of control could result in product shortages or quality assurance problems. These issues could delay shipments of our products or increase our assembly or testing costs. In
17
addition, the consolidation of foundry subcontractors, as well as the increasing capital intensity and complexity associated with fabrication in smaller process geometries has limited our diversity of suppliers and increased our risk of a “single point of failure.” Specifically, as we move to smaller geometries, we have become increasingly reliant on TSMC (Taiwan Semiconductor Manufacturing Company) for the manufacture of product at and below 40 nanometers. The lack of diversity of suppliers could also drive increased wafer prices, adversely affect our results of operations, including our gross margins.
We do not have long-term agreements with any of our direct or indirect suppliers, including our manufacturing, assembly or test subcontractors. We typically procure services from these suppliers on a per order basis. In the event our third-party foundry subcontractors experience a disruption or limitation of manufacturing, assembly or testing capacity, we may not be able to obtain alternative manufacturing, assembly and testing services in a timely manner, or at all. Furthermore, our foundries must have new manufacturing processes qualified if there is a disruption in an existing process, which could be time-consuming. We could experience significant delays in product shipments if we are required to find alternative manufacturers, assemblers or testers for our products. We are continuing to develop relationships with additional third-party subcontractors to assemble and test our products.
Because we rely on outside foundries and other third party suppliers, we face several significant risks in addition to those discussed above, including:
• | a lack of guaranteed supply of wafers and other components and potential higher wafer and component prices due to supply constraints; |
• | the limited availability of, or potential delays in obtaining access to, key process technologies; and |
• | the location of foundries and other suppliers in regions that are subject to earthquakes, tsunamis and other natural disasters. |
The manufacture of integrated circuits is a highly complex and technologically demanding process. Our foundries have from time to time experienced lower than anticipated manufacturing yields. This often occurs during the production of new products or the installation and start-up of new process technologies. In addition, we are dependent on our foundry subcontractors to successfully transition to smaller geometry processes.
Our systems are subject to security breaches and other cybersecurity incidents.
We experience cyber attacks of varying degrees on a regular basis, and as a result, unauthorized parties have obtained, and may in the future obtain, access to our computer systems and networks. Such cyber attacks could result in the misappropriation of our proprietary information and technology or interrupt our business. The reliability and security of our information technology infrastructure and software and our ability to expand and continually update technologies in response to our changing needs is critical to our business. To the extent that any disruptions or security breaches result in significant loss or damage to our data, or inappropriate disclosure of significant proprietary information, it could cause damage to our reputation and affect our relationships with our customers and ultimately harm our business.
Government regulation may adversely affect our business.
The effects of regulation on our customers or the industries in which they operate may materially and adversely impact our business. For example, regulatory policies of the Federal Communications Commission that affect the ability of cable or satellite operators or telephone companies to offer certain services to their customers could impede sales of our products in the United States. We and our customers are also subject to various import and export laws and regulations that apply to the encryption or other features contained in some of our products. If we fail to continue to comply with these regulations, we may be unable to manufacture the affected products at foreign foundries or ship these products to certain customers, or we may incur penalties or fines.
As described above under the risk factor entitled “We are exposed to risks associated with our international operations,” our business is also increasingly subject to complex foreign and U.S. laws and regulations, including but not limited to, anti-corruption laws, such as the Foreign Corrupt Practices Act and the UK Bribery Act and
18
equivalent laws in other jurisdictions, antitrust or competition laws, and data privacy laws, among others. Foreign governments may also impose tariffs, duties and other import restrictions on components that we obtain from non-domestic suppliers and may impose export restrictions on products that we sell internationally. These tariffs, duties or restrictions could materially and adversely affect our business, financial condition and results of operations.
Our product or manufacturing standards could also be impacted by new or revised environmental rules and regulations or other social initiatives. For instance, the SEC requires disclosures relating to the sourcing of certain minerals from the Democratic Republic of Congo and adjoining countries. Those rules, or similar rules that may be adopted in other jurisdictions, could adversely affect our costs, the availability of minerals used in our products and our relationships with customers and suppliers.
Our future ability to return capital to shareholders in the form of dividends or share repurchases may be impacted by the availability of U.S. cash.
Given that the majority of our cash is generated overseas, we may be limited in our ability to consistently increase or maintain the level of capital return in the form of dividends or share repurchases. In January 2010, our Board of Directors adopted a dividend policy pursuant to which Broadcom would pay quarterly dividends on our common stock. From 2011 through 2014 and again in 2015 our Board of Directors increased the quarterly dividend payment. We cannot provide assurance that we will continue to increase our dividend payment or declare dividends in any particular amounts or at all.
Our Board has also approved various share repurchase programs, including a program authorizing the repurchase of up to $1 billion in 2015.
Future dividends and the amount of share repurchases may be affected by, among other factors:
• | use of cash to consummate various transactions; |
• | our views on potential future capital requirements for investments in acquisitions and the funding of our research and development; |
• | changes in federal and state income tax laws or corporate laws; and |
• | changes to our business model. |
A reduction in our dividend payments or amount of shares repurchased could have a negative effect on our stock price.
Our articles of incorporation and bylaws contain anti-takeover provisions.
Our articles of incorporation and bylaws contain provisions that could make it more difficult for a third party to acquire a majority of our outstanding voting stock. For example, our Board of Directors may issue shares of Class B common stock in connection with certain acquisitions, which shares have superior voting rights entitling the holder to ten votes for each share held on matters that we submit to a shareholder vote (as compared to one vote per share in the case of our Class A common stock). Furthermore, our Board of Directors has the authority to fix the rights and preferences of shares of our preferred stock and to issue shares of common or preferred stock without a shareholder vote. These provisions, among others, may discourage certain types of transactions involving an actual or potential change in our control.
Our co-founders and their affiliates may strongly influence the outcome of matters that require the approval of our shareholders.
As of December 31, 2014 our co-founders, directors, executive officers and their respective affiliates beneficially owned 8.8% of our outstanding common stock and held 47.3% of the total voting power held by our shareholders. As a result, the voting power of these shareholders may strongly influence the outcome of matters that require the approval of our shareholders, including the election of our Board of Directors and certain significant corporate transactions. In particular, as of December 31, 2014 our two founders, Dr. Henry T. Nicholas III and
19
Dr. Henry Samueli, beneficially owned a total of 8.2% of our outstanding common stock and held 47.0% of the total voting power held by our shareholders. Because of their significant voting stock ownership, we may not be able to engage in certain transactions, and our shareholders may not be able to effect certain actions or transactions, without the approval of one or both of these shareholders. In addition, repurchases of shares of our Class A common stock under our share repurchase program would result in an increase in the total voting power of our co-founders, directors, executive officers and their affiliates, as well as other continuing shareholders.
Item 1B. Unresolved Staff Comments
None.
Item 2. Properties
We lease facilities in Irvine (our corporate headquarters), Sunnyvale, Santa Clara, San Jose and San Diego, California. These facilities are our principal engineering design facilities and each includes administration, sales and marketing, research and development and operations functions. We lease various additional facilities throughout the United States. Internationally, we lease a warehousing and logistics center, which also includes engineering design and administrative facilities in Singapore. In addition, we lease engineering design, sales, marketing and administrative facilities in Asia, Europe and the Middle East; and have a sales and administrative facility in Ireland.
We lease our facilities and certain engineering design tools and information systems equipment under operating lease agreements. Our leased facilities comprise an aggregate of 4.3 million square feet. Our principal facilities in Irvine comprise 0.92 million square feet and have lease terms that expire at various dates through 2018. In November 2014 we signed an agreement to purchase land for the construction of a new corporate campus in Orange County, California, totaling up to 2 million square feet to meet the requirements projected in our long-term business plan.
We believe that the facilities under lease will be adequate for at least the next 12 months. For additional information regarding our obligations under property leases, see Note 8 of Notes to Consolidated Financial Statements, included in Part IV, Item 15 of this Report.
Item 3. Legal Proceedings
The information set forth under Note 8 of Notes to Consolidated Financial Statements, included in Part IV, Item 15 of this Report, is incorporated herein by reference.
Item 4. Mine Safety Disclosures
Not applicable.
20
PART II
Item 5. Market for Registrant’s Common Equity, Related Stockholder Matters and Issuer Purchases of Equity Securities
Market Information and Holders
Our Class A common stock is traded on the Nasdaq Global Select Market under the symbol BRCM. The following table sets forth, for the periods indicated, the high and low sale prices for our Class A common stock on the Nasdaq Global Select Market:
2014 | 2013 | ||||||||||||||
High | Low | High | Low | ||||||||||||
Fourth Quarter | $ | 44.33 | $ | 34.50 | $ | 29.75 | $ | 24.60 | |||||||
Third Quarter | $ | 41.65 | $ | 36.55 | $ | 34.96 | $ | 23.25 | |||||||
Second Quarter | $ | 38.85 | $ | 28.86 | $ | 37.85 | $ | 31.25 | |||||||
First Quarter | $ | 32.31 | $ | 28.30 | $ | 35.50 | $ | 32.12 | |||||||
As of December 31, 2014 and 2013, there were 799 and 843 record holders of our Class A common stock and 120 and 128 record holders of our Class B common stock, respectively. On January 28, 2015, the last reported sale price of our Class A common stock on the Nasdaq Global Select Market was $40.975 per share.
Our Class B common stock is not publicly traded. Each share of Class B common stock is convertible at any time at the option of the holder into one share of Class A common stock and in most instances automatically converts upon sale or other transfer.
Stock Performance Graph
The following graph compares the cumulative five-year total return attained by shareholders on Broadcom Corporation’s Class A common stock relative to the cumulative total returns of the S&P 500 index, the Philadelphia Semiconductor index, and the NASDAQ Composite index. An investment of $100 (with reinvestment of all dividends) is assumed to have been made in our Class A common stock and in each index on December 31, 2009 and its relative performance is tracked through December 31, 2014. Shareholder returns over the indicated periods should not be considered indicative of future stock prices or shareholder returns.
COMPARISON OF 5 YEAR CUMULATIVE TOTAL RETURN
AMONG BROADCOM CORPORATION, THE S&P 500 INDEX,
THE NASDAQ COMPOSITE INDEX AND THE PHILADELPHIA SEMICONDUCTOR INDEX
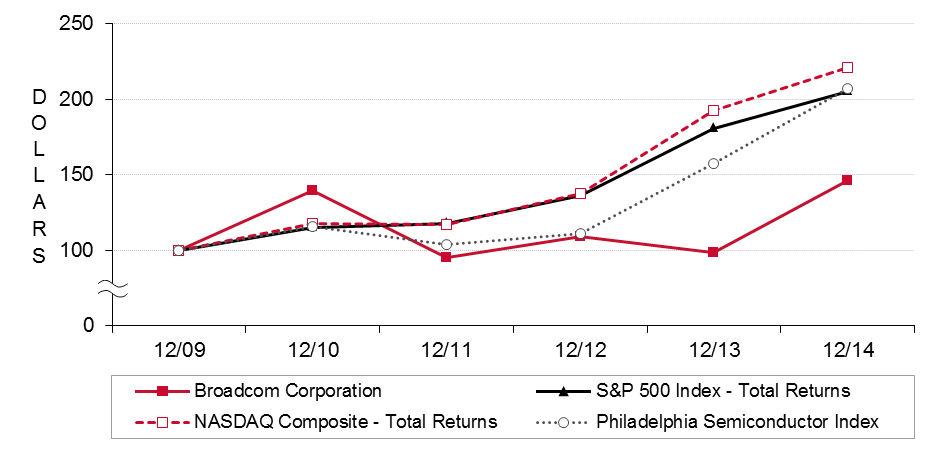
21
Dividend Policy
In January 2010 our Board of Directors adopted a dividend policy pursuant to which we intend to pay quarterly cash dividends on our common stock. Our Board of Directors declared quarterly cash dividends of $0.12, $0.11, and $0.10 per common share payable to holders of our common stock in each quarter of 2014, 2013 and 2012, respectively. In 2014, 2013 and 2012 we paid $283 million, $254 million and $224 million, respectively, in dividends to holders of our Class A and Class B common stock.
In November 2014 our Board of Directors adopted an amendment to our existing dividend policy pursuant to which we intend to increase the quarterly cash dividend by 17% to $0.14 per share for each quarter of 2015 ($0.56 per share on an annual basis). Pursuant to this plan, on January 28, 2015, we declared a quarterly cash dividend of $0.14 per share.
The cash dividend policy and the payment of future cash dividends under that policy are subject to the Board of Directors’ continuing determination that the dividend policy and the declaration of dividends thereunder are in the best interests of our shareholders and are in compliance with all laws and agreements of Broadcom applicable to the declaration and payment of cash dividends.
Recent Sales of Unregistered Securities
In 2014 we issued an aggregate of 1 million shares of Class A common stock upon conversion of a like number of shares of Class B common stock in connection with their disposition. Each share of Class B common stock is convertible at any time into one share of Class A common stock at the option of the holder. The offers and sales of those securities were effected without registration in reliance on the exemption from registration provided by Section 3(a)(9) of the Securities Act of 1933, as amended, or the Securities Act.
Issuer Purchases of Equity Securities
In February 2010 we announced that our Board of Directors had authorized an evergreen share repurchase program intended to offset dilution associated with our stock incentive plans. The maximum number of shares of our Class A common stock that may be repurchased in any one year under this program (including under an accelerated share repurchase or other arrangement) is equal to the total number of shares issued pursuant to our equity awards in the previous year and the current year. This program does not have an expiration date and may be suspended at any time at the discretion of the Board of Directors. It may also be complemented with an additional share repurchase program in the future.
The following table presents details of our various repurchases during the three months ended December 31, 2014:
Period | Total Number of Shares Purchased | Average Price per Share | Total Number of Shares Purchased as Part of Publicly Announced Plans | Approximate Dollar Value of Shares That May yet be Purchased under the Plans | ||||||||
(In millions, except per share data) | ||||||||||||
October 2014 | — | $ | — | — | ||||||||
November 2014 | 2.5 | 41.69 | 2.5 | |||||||||
December 2014 | — | — | — | |||||||||
Total | 2.5 | $ | 41.69 | 2.5 | N/A | |||||||
In November 2014 our Board of Directors authorized an additional share repurchase program for the repurchase of such number of shares incremental to the number allowed under the evergreen program that would yield a total share repurchase for 2015 of up to $1.00 billion.
Repurchases under our share repurchase programs were and are intended to be made in open market or privately negotiated transactions in compliance with Rule 10b-18 promulgated under the Exchange Act.
22
Item 6. Selected Consolidated Financial Data
The following table sets forth our selected consolidated financial data. We prepared this information using our consolidated financial statements for each of the five years ended December 31, 2014. In addition, the consolidated financial statements include the results of operations of acquisitions commencing on the respective acquisition dates.
You should read this selected consolidated financial data together with the Consolidated Financial Statements and related Notes contained in this Report and in our prior and subsequent reports filed with the SEC, as well as the section of this Report and our other reports entitled “Management’s Discussion and Analysis of Financial Condition and Results of Operations.”
Year Ended December 31, | |||||||||||||||||||
2014 (1) | 2013 (2) | 2012 (3) | 2011 (4) | 2010 (5) | |||||||||||||||
(In millions, except per share data) | |||||||||||||||||||
Consolidated Statements of Income Data | |||||||||||||||||||
Net revenue (6) | $ | 8,428 | $ | 8,305 | $ | 8,006 | $ | 7,389 | $ | 6,818 | |||||||||
Income from operations | 694 | 472 | 676 | 953 | 1,082 | ||||||||||||||
Net income | 652 | 424 | 719 | 927 | 1,082 | ||||||||||||||
Net income per share (diluted) | $ | 1.08 | $ | 0.73 | $ | 1.25 | $ | 1.65 | $ | 1.99 | |||||||||
Dividends per share | $ | 0.48 | $ | 0.44 | $ | 0.40 | $ | 0.36 | $ | 0.32 | |||||||||
Consolidated Balance Sheet Data | |||||||||||||||||||
Cash and cash equivalents and short-term and long-term marketable securities | $ | 5,989 | $ | 4,371 | $ | 3,722 | $ | 5,205 | $ | 4,058 | |||||||||
Working capital | 3,522 | 2,419 | 2,099 | 4,653 | 2,913 | ||||||||||||||
Goodwill and purchased intangible assets | 4,374 | 4,937 | 5,512 | 2,187 | 2,043 | ||||||||||||||
Total assets | 12,471 | 11,495 | 11,208 | 9,040 | 7,944 | ||||||||||||||
Total debt | 1,593 | 1,394 | 1,693 | 1,196 | 697 | ||||||||||||||
Total shareholders’ equity | 9,051 | 8,371 | 7,839 | 6,521 | 5,826 | ||||||||||||||
(1) | Includes impairment of long-lived assets of $404 million, restructuring costs of $158 million related to our exit of the cellular baseband business, other gains of $60 million and settlement costs of $16 million. |
(2) | Includes impairment of long-lived assets of $511 million, settlement gains of $69 million, restructuring costs of $29 million and a charitable contribution of $25 million. |
(3) | Includes impairment of long-lived assets of $90 million, settlement costs of $79 million, and restructuring costs of $7 million. In addition, includes the impact of the NetLogic Microsystems, Inc. acquisition in February 2012. |
(4) | Includes impairment of long-lived assets of $92 million, settlement gains of $18 million, restructuring costs of $16 million, and a charitable contribution of $25 million. |
(5) | Includes settlement costs of $53 million and impairment of long-lived assets of $19 million. |
(6) | Includes income relating to the Qualcomm Agreement, entered into with Qualcomm Corporation in April 2009, of $86 million, $186 million, $207 million and $206 million, 2013, 2012, 2011 and 2010, respectively. Income from this agreement terminated in April 2013. |
23
Item 7. Management’s Discussion and Analysis of Financial Condition and Results of Operations
You should read the following discussion and analysis in conjunction with our Consolidated Financial Statements and related Notes thereto included in Part IV, Item 15 of this Report and the “Risk Factors” included in Part I, Item 1A of this Report, as well as other cautionary statements and risks described elsewhere in this Report, before deciding to purchase, hold or sell our common stock.
Overview
Broadcom Corporation (including our subsidiaries, referred to collectively in this Report as “Broadcom,” “we,” “our” and “us”) is a global leader and innovator in semiconductor solutions for wired and wireless communications. Broadcom provides one of the industry’s broadest portfolio of highly-integrated SoCs that seamlessly deliver voice, video, data and multimedia connectivity in the home, office and mobile environments.
Our solutions are used globally by leading manufacturers and are embedded in an array of communications products. Because we leverage our technologies across different markets, certain of our integrated circuits may be incorporated into products used in multiple platforms. We utilize independent foundries and third-party subcontractors to manufacture, assemble and test all of our semiconductor products. Our business is structured around two reportable segments: (i) Broadband and Connectivity; and (ii) Infrastructure and Networking.
Operating Results for the Year Ended December 31, 2014
In 2014 our net income was $652 million, as compared to net income of $424 million in 2013. The resulting increase in profitability was primarily the result of (i) a 1.5% increase in total net revenue, (ii) a gross profit margin improvement of 60 basis points due to favorable product mix, (iii) a net reduction of $103 million in research and development; and selling, general and administrative expenses, primarily associated with the restructuring plan that we initiated in July 2014 related to the exit of the cellular baseband business, and (iv) a net decrease in charges for the impairment of long-lived assets of $107 million. This was partially offset by a net increase in restructuring costs of $129 million.
Other highlights during 2014 include the following:
• | Our cash and cash equivalents and marketable securities were $5.99 billion at December 31, 2014, compared with $4.37 billion at December 31, 2013. We generated cash flow from operations of $1.93 billion during 2014, as compared to $1.79 billion in 2013. |
• | In January 2014 our Board of Directors adopted an amendment to our existing dividend policy pursuant to which we increased our quarterly cash dividend by 9.0% to $0.12 per share ($0.48 per share on an annual basis) payable to holders of our common stock. |
• | We repurchased 14.7 million shares of our Class A common stock at a weighted average price of $35.53. |
• | In March 2014 we sold certain Ethernet controller-related assets and provided non-exclusive licenses to intellectual property, including a non-exclusive patent license, to QLogic for a total of $209 million, referred to as the QLogic Transaction. In connection with the transaction, we recorded a gain on the sale of assets of $48 million (net of a goodwill adjustment of $37 million) and deferred revenue of $120 million. |
• | In March 2014 we recorded impairment charges, primarily for completed technology, of $25 million related mainly to our acquisition of SC Square Ltd., or SC Square, and the Renesas Transaction. |
• | In June 2014 and September 2014, we recorded purchased intangible impairment charges of $35 million and $200 million, respectively, related to our acquisition of NetLogic Microsystems, Inc., or NetLogic, in 2012. |
• | As discussed below under “Exit of Cellular Baseband Business,” we recorded $152 million of restructuring costs, $144 million of non-cash charges for the impairment of certain long-lived assets, and $27 million for inventory charges in 2014. |
• | In July 2014 we issued senior unsecured notes in an aggregate principal amount of $600 million, which consist of (i) $350 million aggregate principal amount of notes that mature in August 2024 and bear |
24
interest at a fixed rate of 3.500% per annum and (ii) $250 million aggregate principal amount of notes that mature in August 2034 and bear interest at a fixed rate of 4.500% per annum.
• | In August 2014 we utilized a portion of our net proceeds from the issuance of senior unsecured notes discussed above to redeem $400 million principal aggregate amount of our 2.375% senior notes that were due November 2015. As a result of this transaction, we recorded interest expense of $11 million in the three months ended September 30, 2014, primarily due to the premium paid upon redemption of those notes. |
• | In November 2014 our Board of Directors adopted an amendment to our existing dividend policy pursuant to which we intend to increase the quarterly cash dividend by 17% to $0.14 per share for each quarter in 2015 ($0.56 per share on an annual basis). |
• | In November 2014 our Board of Directors authorized a share repurchase program for the repurchase of up to $1.0 billion. |
See Note 12 of Notes to Consolidated Financial Statements for details of our quarterly financial data.
Reportable Segments
The following table presents details of our reportable segments, and the “Cellular Baseband” and “All Other” categories:
Reportable Segments | |||||||||||||||||||||||
Broadband and Connectivity | Infrastructure and Networking | Total Reportable Segments | Cellular Baseband | All Other | Consolidated | ||||||||||||||||||
(In millions) | |||||||||||||||||||||||
Year Ended December 31, 2014 | |||||||||||||||||||||||
Net revenue | $ | 5,535 | $ | 2,525 | $ | 8,060 | $ | 368 | $ | — | $ | 8,428 | |||||||||||
Operating income (loss) | 1,086 | 685 | 1,771 | (339 | ) | (738 | ) | 694 | |||||||||||||||
Operating margin | 19.6 | % | 27.1 | % | 22.0 | % | (92.1 | )% | 8.2 | % | |||||||||||||
Year Ended December 31, 2013 | |||||||||||||||||||||||
Net revenue | $ | 5,430 | $ | 2,155 | $ | 7,585 | $ | 634 | $ | 86 | $ | 8,305 | |||||||||||
Operating income (loss) | 1,003 | 412 | 1,415 | (369 | ) | (574 | ) | 472 | |||||||||||||||
Operating margin | 18.5 | % | 19.1 | % | 18.7 | % | (58.2 | )% | 5.7 | % | |||||||||||||
Year Ended December 31, 2012 | |||||||||||||||||||||||
Net revenue | $ | 5,232 | $ | 1,911 | $ | 7,143 | $ | 677 | $ | 186 | $ | 8,006 | |||||||||||
Operating income (loss) | 990 | 189 | 1,179 | (169 | ) | (334 | ) | 676 | |||||||||||||||
Operating margin | 18.9 | % | 9.9 | % | 16.5 | % | (25.0 | )% | 8.4 | % | |||||||||||||
We have provided combined financial information for our Broadband and Connectivity; and Infrastructure and Networking reportable segments above (shown as “Total Reportable Segments”) to assist in understanding the trends of our ongoing business. The “Cellular Baseband” category shown in the table above represents the operations of the cellular baseband business that is currently winding down. In addition, as the cellular baseband business has not completely ceased operations and will continue to generate revenue, albeit declining, and expenses for the foreseeable future, it does not currently meet the requirements for “discontinued operations” under applicable accounting standards. We have included net revenue and operating loss in the above table as if our cellular baseband business did meet the requirements of a reportable segment because we believe this information is useful to readers of our financial statements. See Notes 10 and 11 of Notes to Consolidated Financial Statements for further information.
All prior-period amounts above have been adjusted retrospectively to (i) reflect our 2014 organizational and reportable segment changes, (ii) add a cellular baseband business category, and (iii) include stock-based compensation expense in our reportable segments and cellular baseband category (as certain of our financial targets for our reportable segments now include stock-based compensation).
25
Broadband and Connectivity. The increase in operating income from 2012 to 2014 resulted from increases in net revenue in set-top box and broadband modem solutions driven by operator upgrade cycles, broadband subscriber growth, market share gains and a richer mix of features in our latest generation of integrated solutions. We also saw improved gross margin driven by mix, as revenue growth within this reportable segment was disproportionately driven by our set-top box and broadband modem businesses.
Infrastructure and Networking. The increase in operating income from 2012 to 2014 was driven primarily by an increase in revenue in Ethernet Switch and PHY driven by continued evolution of service provider networks to Ethernet technology and continued deployments of large-scale data centers that require high density Ethernet Switch solutions in aggregation points throughout the network. We also saw improved gross margin due to the relative strength in sales of Ethernet Switch-related products. Operating income also benefited from reduced investment in Ethernet Controller products due to the sale of certain assets to QLogic Corporation, or QLogic.
Cellular Baseband. Due to the lengthy product development and sales cycle for LTE products, and our investment in LTE-related technologies, including the Renesas Transaction, significant research and development expense negatively impacted our operating income over the last several years. As discussed below under “Exit of Cellular Baseband Business,” we decided to wind down our cellular baseband business as the commercial and economic opportunity was not sufficient to justify the continued investment.
For additional information about our changes in reportable segments and the “All Other” category (including revenue and expense items reported under the “All Other” category), see further discussion in Note 11 of Notes to Consolidated Financial Statements as well as the “Net Revenue by Reportable Segments” discussion below.
2014 Exit of Cellular Baseband Business
On June 2, 2014, we announced that we were exploring strategic alternatives, including a potential sale and/or wind-down, for our cellular baseband business, previously included in our former Mobile and Wireless reportable segment. See Note 11 of Notes to Consolidated Financial Statements for a discussion of recent changes to our reportable segments. We reached this decision based on our conclusion that the commercial and economic opportunity in this business was not sufficiently compelling to justify the continued investment, especially when compared to other opportunities within our product portfolio. On June 26, 2014, the Audit Committee of our Board of Directors approved a global restructuring plan, or the 2014 Plan, that focuses on cost reductions and operating efficiencies and better aligns our resources to areas of strategic focus.
In July 2014 we decided to pursue a wind-down of the cellular baseband business. As of December 31, 2014, we had substantially completed a reduction to our worldwide headcount by approximately 2,300 employees and terminated various contracts. We are also in the process of closing or consolidating up to 19 locations.
We recorded $152 million in restructuring charges in 2014 primarily related to the exit of the cellular baseband business. These charges are comprised of (i) $130 million for ongoing and one-time termination benefits primarily for employees performing research and development and marketing functions in the cellular baseband business and for employees performing selling, general and administrative and other corporate functions and (ii) $22 million for certain non-cancelable contract and facility costs. We expect to record additional restructuring charges of approximately $40 million over the next 12 months for costs associated with the closure and consolidation of several facilities.
As part of these actions, we also recorded $144 million of non-cash charges for the impairment of certain long-lived assets and $27 million of inventory charges in 2014. See Note 10 of Notes to Consolidated Financial Statements for further information.
The wind-down of the cellular baseband business and associated cost saving initiatives are currently expected to result in up to approximately $650 million in reduced annualized research and development and selling, general and administrative expenses, of which up to approximately $50 million relates to estimated reductions in stock-
26
based compensation. We currently expect to organically reinvest approximately $50 million of these savings on an annualized basis into projects in our Broadband and Connectivity; and Infrastructure and Networking reportable segments. This incremental spending is currently expected to strengthen and accelerate our plans in the area of small cells, Ethernet switches and low-power connectivity.
Factors That May Impact Net Income
Our net income has been affected in the past, and may continue to be affected in the future, by various factors, including, but not limited to, the following:
• | our product mix and volume of product sales and corresponding gross margin (see further discussion below under “Factors That May Impact Net Revenue” and “Factors That May Impact Gross Margin”); |
• | levels of research and development and other operating costs (organic or acquired); |
• | stock-based compensation expense; |
• | licensing and income from intellectual property; |
• | impairment of goodwill and other long-lived assets; |
• | deferral of revenue and costs under multiple-element arrangements; |
• | amortization of purchased intangible assets; |
• | settlement costs or gains; |
• | cash-based incentive compensation expense; |
• | litigation costs and insurance recoveries; |
• | changes in tax laws, adjustments to tax reserves and the results of income tax audits; |
• | the loss of interest income resulting from lower average interest rates and investment balance reductions resulting from expenditures on repurchases of our Class A common stock, dividends and acquisitions of businesses; |
• | restructuring costs; and |
• | charitable contributions. |
Product Cycles. The cycle for test, evaluation and adoption of our products by customers can range from three to more than nine months, with an additional three to more than 12 months before a customer commences volume production of equipment or devices incorporating our products. Due to this lengthy sales cycle, we may experience significant delays from the time we incur expenses for research and development, selling, general and administrative efforts, and investments in inventory, to the time we generate corresponding revenue, if any. The rate of new orders may vary significantly from month to month and quarter to quarter. If anticipated sales or shipments in any quarter do not occur when expected, expenses and inventory levels could be disproportionately high, and our results of operations for that quarter, and potentially for future quarters, would be materially and adversely affected.
Acquisition Strategy. Historically, an element of our business strategy involves the acquisition of businesses, assets, products or technologies that allow us to reduce the time or costs required to develop new technologies and products and bring them to market, incorporate enhanced functionality into and complement our existing product offerings, augment our engineering workforce, and enhance our technological capabilities. We plan to continue to evaluate strategic opportunities concurrently with our increased capital return strategy, including acquisitions and other business combination transactions, strategic relationships and the purchase or sale of assets.
27
Critical Accounting Policies and Estimates
The preparation of financial statements in accordance with U.S. generally accepted accounting principles, or GAAP, requires us to make estimates and assumptions that affect the reported amounts of assets and liabilities at the date of the financial statements and the reported amounts of net revenue and expenses in the reporting period. We regularly evaluate our estimates and assumptions related to revenue recognition, rebates, allowances for doubtful accounts, sales returns and allowances, warranty obligations, inventory valuation, stock-based compensation expense, goodwill and purchased intangible asset recoverability, strategic investments, deferred income tax asset valuation allowances, uncertain tax positions, tax contingencies, self-insurance liabilities, restructuring costs, litigation and other loss contingencies. We base our estimates and assumptions on current facts, historical experience and various other factors that we believe to be reasonable under the circumstances, the results of which form the basis for making judgments about the carrying values of assets and liabilities and the recording of revenue, costs and expenses that are not readily apparent from other sources. The actual results experienced by us may differ materially and adversely from our estimates. To the extent there are material differences between our estimates and the actual results, our future results of operations will be affected.
We believe the following are critical accounting policies that require us to make significant estimates, assumptions or judgments:
• | Net Revenue and Related Pricing Adjustments. Establishing accruals for pricing adjustments requires the use of judgment and estimates that impact the amount and timing of revenue recognition. We record reductions of revenue for pricing adjustments, such as competitive pricing programs and rebates, in the same period that the related revenue is recorded. We accrue 100% of potential rebates at the time of sale and do not apply a breakage factor. We reverse the accrual of unclaimed rebate amounts as specific rebate programs contractually end and when we believe unclaimed rebates are no longer subject to payment and will not be paid. Thus the reversal of unclaimed rebates may have a positive impact on our net revenue and net income in subsequent periods. Additional reductions of revenue would result if actual pricing adjustments exceed our estimates. |
• | Inventory. We write down the carrying value of our inventory to net realizable value for estimated obsolescence or unmarketable inventory in an amount equal to the difference between the cost of inventory and its estimated realizable value based upon assumptions about future demand and market conditions. If our judgments about actual demand and market conditions are less favorable than those projected at the time we issue our financial statements, additional inventory write-downs could be required, which would increase our cost of revenue and reduce our gross margins. |
• | Goodwill and Purchased Intangible Assets. We evaluate goodwill by reporting unit either on an annual basis in the fourth quarter or more frequently if we believe indicators of impairment exist that would more likely than not reduce the fair value of a reporting unit below its carrying value or for other purchased intangible assets whenever events or changes in circumstances indicate that the carrying amount of the asset may not be recoverable. Significant management judgment is required in performing these tests and in the creation of the forecasts of future operating results that are used in the discounted cash flow method of valuation, including (i) estimation of future cash flows, which is dependent on internal forecasts, (ii) estimation of the long-term rate of growth for our business, (iii) estimation of the useful life over which cash flows will occur, (iv) terminal values, if applicable, and (v) the determination of our weighted average cost of capital, which helps determine the discount rate. It is possible that these forecasts may change and our performance projections included in our forecasts of future results prove to be inaccurate. If our actual results, or the forecasts and estimates used in future impairment analyses, are lower than the original estimates used to assess the recoverability of these assets, we could incur additional impairment charges. The value of our goodwill and purchased intangible assets could also be impacted by future adverse changes such as: (i) a decline in the valuation of technology company stocks, including the valuation of our common stock, (ii) a significant slowdown in the worldwide economy or the semiconductor industry, or (iii) the abandonment of any of our acquired in-process research and development, or IPR&D, projects. |
28
• | Deferred Taxes and Uncertain Tax Positions. We record a valuation allowance to reduce our deferred tax assets to the amount that we believe is more likely than not to be realized. In assessing the need for a valuation allowance, we consider all positive and negative evidence, including scheduled reversals of deferred tax liabilities, projected future taxable income, tax planning strategies, and recent financial performance. Significant judgment is required in assessing all the future tax consequences that have been recognized in our consolidated financial statements. Variations in the actual outcome of these future tax consequences could materially impact our consolidated financial statements. Forming a conclusion that a valuation allowance is not required is very difficult when there is negative evidence such as cumulative losses in recent years. In the future, if we realize a deferred tax asset that currently carries a valuation allowance, we may record a reduction of income tax expense in the period of such realization. Conversely, if we were to determine that we would not be able to realize all or a portion of our deferred tax assets in the future, we would reduce such amounts through an increase to tax expense in the period in which that determination is made. |
As a multinational corporation, we are subject to taxation in many jurisdictions, and the assessment of our income tax positions involves dealing with uncertainties in the application of complex tax laws and regulations in various taxing jurisdictions. In addition, the application of tax laws and regulations is subject to legal and factual interpretation, judgment and uncertainty. Tax laws and regulations themselves are subject to change as a result of changes in fiscal policy, changes in legislation, the evolution of regulations and court rulings. Therefore, the actual liability for U.S. or foreign taxes may be materially different from our estimates, which could result in the need to record additional tax liabilities or potentially reverse previously recorded tax liabilities.
• | Litigation and Settlement Costs. We are involved in disputes, litigation and other legal proceedings. We prosecute and defend these matters aggressively. However, there are many uncertainties associated with any litigation, and we cannot provide assurance that these actions or other third party claims against us will be resolved without costly litigation and/or substantial settlement costs. In addition, the resolution of intellectual property litigation may require us to pay damages for past alleged infringement or to obtain a license under the other party’s intellectual property rights that could require one-time license fees or running royalties, which could adversely impact gross margins in future periods, or could prevent us from manufacturing or selling some of our products or limit or restrict the type of work that employees involved in such litigation may perform for Broadcom. If any of those events were to occur, our business, financial condition and results of operations could be materially and adversely affected. |
We account for intellectual property settlement agreements as multiple element arrangements and allocate the consideration to the identifiable elements based on relative fair value. Generally the identifiable elements are (i) the licensing of intellectual property for future use and (ii) payments related to alleged prior infringement. We continually evaluate the uncertainties associated with litigation and record a liability when it is probable that a loss has been incurred and the amount is reasonably estimable. There is significant judgment required in both the probability determination and as to whether a liability can be reasonably estimated. Accordingly, the outcomes of legal proceedings and/or our ability to settle disputes on terms acceptable to us are subject to significant uncertainty. Should we choose to pay significant sums in settling a dispute or should material legal matters be resolved against us, the operating results of a particular reporting period could be materially adversely affected. Given the complexity of evaluating the probability and range of potential litigation losses and appropriately allocating the consideration in multiple element arrangements relating to settlements of intellectual property litigation, we frequently use third-party valuation and law firms to assist us in this regard.
See Note 1 of Notes to Consolidated Financial Statements for additional information regarding our critical and significant accounting policies.
29
Net Revenue
Our revenue consists principally of sales of semiconductor devices and, to a lesser extent, licensing of our intellectual property, software licenses and royalties, development, support and maintenance agreements, data services and cancellation fees. The majority of our product sales occur through the efforts of our direct sales force. The remaining balance of our product sales occurs through distributors.
The following tables present net revenue from each of our reportable segments, and the “Cellular Baseband” and “All Other” categories:
Year Ended December 31, | 2014 vs 2013 | 2013 vs 2012 | |||||||||||||||||||||||
2014 | 2013 | 2012 | $ Change | % Change | $ Change | % Change | |||||||||||||||||||
(In millions, except percentages) | |||||||||||||||||||||||||
Broadband and Connectivity | $ | 5,535 | $ | 5,430 | $ | 5,232 | $ | 105 | 1.9 | % | $ | 198 | 3.8 | % | |||||||||||
Infrastructure and Networking | 2,525 | 2,155 | 1,911 | 370 | 17.2 | 244 | 12.8 | ||||||||||||||||||
Total reportable segments | 8,060 | 7,585 | 7,143 | 475 | 6.3 | 442 | 6.2 | ||||||||||||||||||
Cellular Baseband | 368 | 634 | 677 | (266 | ) | (42.0 | ) | (43 | ) | (6.4 | ) | ||||||||||||||
All Other | — | 86 | 186 | (86 | ) | (100.0 | ) | (100 | ) | (53.8 | ) | ||||||||||||||
Total net revenue | $ | 8,428 | $ | 8,305 | $ | 8,006 | $ | 123 | 1.5 | $ | 299 | 3.7 | |||||||||||||
Year Ended December 31, | ||||||||
2014 | 2013 | 2012 | ||||||
(as a % of net revenue) | ||||||||
Broadband and Connectivity | 65.6 | % | 65.5 | % | 65.3 | % | ||
Infrastructure and Networking | 30.0 | 25.9 | 23.9 | |||||
Total reportable segments | 95.6 | 91.4 | 89.2 | |||||
Cellular Baseband | 4.4 | 7.6 | 8.5 | |||||
All Other | — | 1.0 | 2.3 | |||||
Total net revenue | 100.0 | % | 100.0 | % | 100.0 | % | ||
Broadband and Connectivity. The increase in 2014 net revenue resulted primarily from increases in sales of our set-top box (STB) solutions of $169 million and our broadband modem solutions of $148 million, offset in part by decreases in our wireless connectivity products of $181 million and other broadband and connectivity technologies of $31 million. The increase in 2013 net revenue resulted primarily from an increase in sales of both our STB solutions of $150 million and wireless connectivity products of $80 million, partially offset by a reduction in sales of our broadband modem products of $24 million and other broadband and connectivity technologies of $8 million. STB growth is generally driven by the adoption of new communication features (including HEVC, multi-stream transcoding and MoCA 2.0), market share gains, geographic expansion, particularly in developing markets, and the roll-out of more highly integrated platforms by global service providers. Growth in sales of broadband modem solutions is generally driven by subscriber growth, global deployments and upgrades of broadband infrastructure, the adoption of new features and technologies (including DOCSIS 3.0 and VDSL) and market share gains. The decline in wireless connectivity revenue is driven principally by the impact of the slowing growth rate in the smartphone market, particularly in higher-end devices, and reduced sales into low-cost smartphones. Low-cost smartphones have trended toward integrated platforms from single suppliers, which in many cases tend not to include our wireless connectivity solutions.
Infrastructure and Networking. The increase in 2014 net revenue resulted from increases in sales of our Ethernet switches and PHYs of $268 million, processors of $75 million and our Ethernet controller products of $22 million. The increase in 2013 net revenue resulted primarily from increases in sales of our Ethernet switches and PHYs of $193 million, processors of $51 million and other infrastructure and networking technologies of $29
30
million, offset in part by a decrease in sales of our controller products of $29 million. Growth in Ethernet switches and PHYs is generally driven by continued build outs of packet-based networks to support the delivery of video and mobile data over the Internet, an increase in hosted services and cloud computing, the ongoing growth in unified communications in the enterprise, and market share gains. Growth in sales of our processor solutions is driven by growth in sales of SoCs that incorporate processor and switch functionality and serve a wide range of end markets, including point-of-sale devices and enterprise and retail routers.
Cellular Baseband. The decrease in 2014 net revenue resulted primarily from our decision in July 2014 to wind down our cellular baseband business as the commercial and economic opportunity did not sufficiently justify the continued investment. Due to our announced exit of the cellular baseband business, we expected associated revenue to significantly ramp down in the near term and trend to zero over the next 12 to eighteen months.
All Other. The decrease in 2013 and 2014 resulted from the termination of the Qualcomm Agreement in April 2013. Income from the Qualcomm Agreement was derived from our April 2009 agreement with Qualcomm Incorporated, or the Qualcomm Agreement, which provided for the the licensing of our intellectual property to Qualcomm. The income from the Qualcomm Agreement terminated in April 2013, however, the term of the Qualcomm Agreement will continue until the expiration of the last to expire of the covered patents. It is unlikely that we will be able to enter into similar arrangements of this magnitude in the future. For additional information, see Note 1 of Notes to Consolidated Financial Statements.
Rebates. We recorded rebates to certain customers of $881 million, or 10.5% of net revenue, $888 million, or 10.7% of net revenue, and $727 million, or 9.1% of net revenue, in 2014, 2013 and 2012, respectively. The change in rebates as a percent of net revenue was attributable to a change in the mix of sales to customers that participate in rebate programs, primarily in the Broadband and Connectivity reportable segment. We reverse the accrual of unclaimed rebate amounts as specific rebate programs contractually end or when we believe unclaimed rebates are no longer subject to payment and will not be paid. We reversed accrued rebates of $33 million, $21 million and $18 million, in 2014, 2013 and 2012, respectively. We anticipate that accrued rebates will vary in future periods based upon the level of overall sales to customers that participate in our rebate programs.
Concentration of Net Revenue
Sales to our significant customers, including sales to their manufacturing subcontractors, as a percentage of net revenue were as follows:
Year Ended December 31, | ||||||||
2014 | 2013 | 2012 | ||||||
Samsung | 14.2 | % | 21.3 | % | 17.3 | % | ||
Apple | 14.0 | 13.3 | 14.6 | |||||
Five largest customers as a group | 44.1 | 48.3 | 46.9 | |||||
No other customer represented more than 10% of our annual net revenue in these years.
We expect that our largest customers will continue to account for a substantial portion of our total net revenue for the foreseeable future. Our largest customers and their respective contributions to our total net revenue have varied and will likely continue to vary from period to period. For additional information about geographical information of our net revenue, see further discussion in Note 11 of Notes to Consolidated Financial Statements.
From time to time, our key customers place large orders causing our quarterly net revenue to fluctuate significantly. We expect that these fluctuations will continue and that they may be exaggerated by the seasonal variations in consumer products and changes in the overall economic environment. For these and other reasons, our total net revenue and results of operations for the year ended December 31, 2014, and prior periods may not necessarily be indicative of future net revenue and results of operations.
31
Factors That May Impact Net Revenue
The demand for our products and the subsequent recognition of net revenue has been affected in the past, and may continue to be affected in the future, by various factors, including, but not limited to, the following:
• | general economic and specific conditions in the markets we address, including the continuing volatility in the technology sector and semiconductor industry, and trends in the wired and wireless communications markets in various geographic regions, including seasonality in sales of consumer products into which our products are incorporated; |
• | the timing, rescheduling or cancellation of significant customer orders and our ability, as well as the ability of our customers and distributors, to manage inventory; |
• | the timing of our distributors’ shipments to their customers or when products are taken by our customers under hubbing arrangements; |
• | our ability to specify, develop or acquire, complete, introduce, market and transition to volume production new products and technologies in a cost effective and timely manner; |
• | the rate at which our present and future customers and end-users adopt and ramp our products and technologies; |
• | the qualification, availability and pricing of competing products and technologies and the resulting effects on sales and pricing of our products; and |
• | the availability of credit and financing, which may lead certain of our customers to reduce their level of purchases or to seek credit or other accommodations from us. |
Cost of Revenue, Gross Profit and Gross Margin
Year Ended December 31, | 2014 vs 2013 | 2013 vs 2012 | |||||||||||||||||||||||
2014 | 2013 | 2012 | $ Change | % Change | $ Change | % Change | |||||||||||||||||||
(In millions, except percentages) | |||||||||||||||||||||||||
Net revenue | $ | 8,428 | $ | 8,305 | $ | 8,006 | $ | 123 | 1.5 | $ | 299 | 3.7 | |||||||||||||
Cost of revenue | $ | 4,098 | $ | 4,088 | $ | 4,027 | $ | 10 | 0.2 | $ | 61 | 1.5 | |||||||||||||
Gross profit | $ | 4,330 | $ | 4,217 | $ | 3,979 | 113 | 2.7 | % | $ | 238 | 6.0 | % | ||||||||||||
Gross margin | 51.4 | % | 50.8 | % | 49.7 | % | |||||||||||||||||||
Cost of Revenue, Gross Profit and Gross Margin. Cost of revenue comprises the cost of our semiconductor devices, which consists of the cost of purchasing finished silicon wafers manufactured by independent foundries, costs associated with our purchase of assembly, test and quality assurance services and packaging materials for semiconductor products, as well as royalties and license fees paid to vendors and to non-practicing entities, or NPEs. Also included in cost of revenue is the amortization of purchased technology and inventory valuation step-up, and manufacturing overhead, including costs of personnel and equipment associated with manufacturing support, product warranty costs, provisions for excess and obsolete inventories, and stock-based compensation expense for personnel engaged in manufacturing support.
Gross margin in 2014 increased to 51.4% primarily due to a 17.2% increase in net revenue in our Infrastructure and Networking reportable segment (which products typically have higher gross margins), as well as a decline in revenue related to our cellular baseband business (which products have lower gross margins), offset in part by increases in amortization of purchased intangibles of $14 million and excess and obsolete inventory expense of $5 million. Gross margin in 2013 increased to 50.8% primarily due to a reduction of inventory valuation step-up of $71 million and a decrease in amortization of purchased intangibles of $27 million, offset in part by an increase in excess and obsolete inventory expense of $20 million and a decrease in cancellation fees of $7 million. The decrease in 2013 amortization of purchased intangible assets primarily related to completed technology and customer relationships no longer being expensed due to the asset impairment charges taken during the year (see discussion below) and other assets becoming fully amortized in 2012. The decrease in the inventory valuation step-
32
up was primarily the result of the sell through of inventory acquired from the acquisitions of NetLogic and BroadLight, Inc., or BroadLight, in 2012.
Gross margin includes $45 million, $125 million and $213 million of licensing revenue, including the income from the Qualcomm Agreement, related to our intellectual property in 2014, 2013 and 2012, respectively. Gross margin also includes $6 million, $27 million and $27 million of licensing costs related to NPEs in 2014, 2013, and 2012, respectively.
Factors That May Impact Gross Margin
Our gross margin has been affected in the past, and may continue to be affected in the future, by various factors, including, but not limited to, the following:
• | our product mix and volume of product sales (including sales to high volume customers); |
• | introduction of products with lower margins; |
• | the positions of our products in their respective life cycles; |
• | the effects of competition; |
• | the effects of competitive pricing programs and rebates; |
• | provisions for excess and obsolete inventories and their relationship to demand volatility; |
• | manufacturing cost efficiencies and inefficiencies; |
• | our ability to create cost advantages through successful integration and convergence; |
• | fluctuations in direct product costs such as silicon wafer costs and assembly, packaging and testing costs; |
• | our ability to advance to the next technology node faster than our competitors; |
• | licensing royalties payable by us, including licensing fees paid to NPEs; |
• | the consolidation of foundry subcontractors that could potentially drive increased wafer prices; |
• | product warranty costs; |
• | fair value and related amortization of acquired tangible and intangible assets; and |
• | amortization of acquired inventory valuation step-up. |
Our gross margin may also be impacted by additional stock-based compensation expense, as discussed below, and the amortization of purchased intangible assets related to future acquisitions.
Research and Development Expense
Research and development expense consists primarily of salaries and related costs, including stock-based compensation, for employees engaged in research, design and development activities. In addition, we incur development and design costs, which are primarily costs related to engineering design tools, mask and prototyping costs, testing and subcontracting; and costs related to facilities and equipment expense.
The following table presents details of research and development expense:
Year Ended December 31, | 2014 vs 2013 | 2013 vs 2012 | |||||||||||||||||||||||
2014 | 2013 | 2012 | $ Change | % Change | $ Change | % Change | |||||||||||||||||||
(In millions, except percentages) | |||||||||||||||||||||||||
Salaries and benefits | $ | 1,691 | $ | 1,783 | $ | 1,661 | $ | (92 | ) | (5.2 | )% | $ | 122 | 7.3 | % | ||||||||||
Development and design costs | 354 | 373 | 351 | (19 | ) | (5.1 | ) | 22 | 6.3 | ||||||||||||||||
Other | 328 | 330 | 306 | (2 | ) | (0.6 | ) | 24 | 7.8 | ||||||||||||||||
Research and development | $ | 2,373 | $ | 2,486 | $ | 2,318 | $ | (113 | ) | (4.5 | ) | $ | 168 | 7.2 | |||||||||||
(as a % of net revenue) | 28.2 | % | 29.9 | % | 29.0 | % | |||||||||||||||||||
Employees | 8,000 | 9,800 | 8,700 | (1,800 | ) | (18.4 | )% | 1,100 | 12.6 | % | |||||||||||||||
33
The decrease in 2014 salaries and benefits was primarily attributable to our restructuring plan related to the exit of our cellular baseband business, partially offset by increases in headcount in our Broadband and Connectivity; and Infrastructure and Networking reportable segments. In addition, the timing of both the Renesas Transaction and the exit from the cellular baseband business also impacted the year-over-year trend in salaries and benefits in 2014. The increase in 2013 salaries and benefits was primarily attributable to an increase in headcount. Approximately 80% of the 2013 increase in headcount was attributable to the Renesas Transaction. The 2013 salaries and benefits increase was offset by lower incentive compensation. The increase in development and design costs in 2013 was primarily due to an increase in engineering design tool expenses. Development and design costs vary from period to period depending on the timing of development and tape-outs of various products. As we transition to 28 nanometer or smaller geometry process technologies, tape-out costs could increase. The increase in 2013 in the Other line item in the above table is primarily attributable to increases in depreciation expense and facility expenses related to the Renesas Transaction.
We remain committed to significant research and development efforts to extend our technology leadership in the wired and wireless communications markets in which we operate. Factors that may impact research and development costs include the diversification of the markets we serve, new product opportunities, the number of design wins that go into production, changes in our compensation policies, and any expansion into new markets and technologies, including acquisitions. In 2014 approximately 50% and 30% of our products were manufactured in 40 nanometers and 65 nanometers, respectively. We are designing most new products in 40 nanometers and 28 nanometers, and are beginning to develop products leveraging FinFET technologies. We currently hold more than 10,350 U.S. and more than 3,550 foreign patents and more than 6,550 additional U.S. and foreign pending patent applications. We maintain an active program of filing for and acquiring additional U.S. and foreign patents in wired and wireless communications and other fields.
Selling, General and Administrative Expense
Selling, general and administrative expense consists primarily of salaries and related costs, including stock-based compensation, for employees engaged in selling, general and administrative activities. We also incur legal and other professional fees, and facilities and depreciation expenses, among other items.
The following table presents details of selling, general and administrative expense:
Year Ended December 31, | 2014 vs 2013 | 2013 vs 2012 | |||||||||||||||||||||||
2014 | 2013 | 2012 | $ Change | % Change | $ Change | % Change | |||||||||||||||||||
(In millions, except percentages) | |||||||||||||||||||||||||
Salaries and benefits | $ | 476 | $ | 473 | $ | 492 | $ | 3 | 0.6 | % | $ | (19 | ) | (3.9 | )% | ||||||||||
Legal and accounting fees | 74 | 98 | 84 | (24 | ) | (24.5 | ) | 14 | 16.7 | ||||||||||||||||
Other | 166 | 135 | 120 | 31 | 23.0 | 15 | 12.5 | ||||||||||||||||||
Selling, general and administrative | $ | 716 | $ | 706 | $ | 696 | $ | 10 | 1.4 | $ | 10 | 1.4 | |||||||||||||
(as a % of net revenue) | 8.5 | % | 8.5 | % | 8.7 | % | |||||||||||||||||||
Employees | 1,950 | 2,000 | 1,900 | (50 | ) | (2.5 | )% | 100 | 5.3 | % | |||||||||||||||
There was no material change to salaries and benefits in 2014, as the decrease in stock-based compensation was offset by an increase in cash salaries and benefits. Legal fees consist primarily of attorneys’ fees and expenses related to our outstanding intellectual property litigation, patent prosecution and filings, and various other transactions. Legal fees fluctuate from period to period due to the nature, scope, timing and costs of the matters in litigation. See Note 8 of Notes to the Consolidated Financial Statements for further information. The increases in the Other line item in the above table are primarily attributable to increases in facilities and depreciation expenses in both 2013 and 2014.
34
Stock-Based Compensation Expense
The following table presents details of total stock-based compensation expense that is included in each functional line item in our consolidated statements of income:
Year Ended December 31, | 2014 vs 2013 | 2013 vs 2012 | |||||||||||||||||||||||
2014 | 2013 | 2012 | $ Change | % Change | $ Change | % Change | |||||||||||||||||||
(In millions, except percentages) | |||||||||||||||||||||||||
Cost of revenue | $ | 22 | $ | 25 | $ | 27 | $ | (3 | ) | (12.0 | )% | $ | (2 | ) | (7.4 | )% | |||||||||
Research and development | 304 | 363 | 368 | (59 | ) | (16.3 | ) | (5 | ) | (1.4 | ) | ||||||||||||||
Selling, general and administrative | 111 | 130 | 148 | (19 | ) | (14.6 | ) | (18 | ) | (12.2 | ) | ||||||||||||||
Total stock-based compensation | $ | 437 | $ | 518 | $ | 543 | $ | (81 | ) | (15.6 | ) | $ | (25 | ) | (4.6 | ) | |||||||||
(as of % of net revenue) | 5.2 | % | 6.3 | % | 6.7 | % | |||||||||||||||||||
The decrease in stock-based compensation in 2014 was primarily attributable to certain assumed equity awards becoming fully vested during 2013 and the cancellation of equity awards held by employees who were terminated due to our decision to exit our cellular baseband business. The decrease in 2013 from 2012 related primarily to non-recurring accelerated vesting of equity awards in 2012 upon the termination of certain employees with change in control agreements in connection with our acquisition of NetLogic.
The following table presents details of unearned stock-based compensation currently estimated to be expensed in 2015 through 2019 related to unvested share-based payment awards:
2015 | 2016 | 2017 | 2018 | 2019 | Total | ||||||||||||||||||
(In millions) | |||||||||||||||||||||||
Unearned stock-based compensation | $ | 295 | $ | 188 | $ | 98 | $ | 16 | $ | 2 | $ | 599 | |||||||||||
If there are any modifications or cancellations of the underlying unvested awards, including the cancellation of awards held by employees impacted by our current restructuring plan, we may be required to accelerate, increase or cancel any remaining unearned stock-based compensation expense. Future stock-based compensation expense and unearned stock-based compensation will increase to the extent that we grant additional equity awards or assume unvested equity awards in connection with acquisitions. See Note 7 of Notes to Consolidated Financial Statements for a discussion of activity related to share-based awards.
Amortization of Purchased Intangible Assets
The following table presents details of the amortization of purchased intangible assets included in the cost of revenue and other operating expense categories:
Year Ended December 31, | 2014 vs 2013 | 2013 vs 2012 | |||||||||||||||||||||||
2014 | 2013 | 2012 | $ Change | % Change | $ Change | % Change | |||||||||||||||||||
(In millions, except percentages) | |||||||||||||||||||||||||
Cost of revenue | $ | 185 | $ | 171 | $ | 198 | $ | 14 | 8.2 | % | $ | (27 | ) | (13.6 | )% | ||||||||||
Other operating expenses | 29 | 57 | 113 | (28 | ) | (49.1 | ) | (56 | ) | (49.6 | ) | ||||||||||||||
$ | 214 | $ | 228 | $ | 311 | $ | (14 | ) | (6.1 | ) | $ | (83 | ) | (26.7 | ) | ||||||||||
The decrease in 2014 amortization of purchased intangible assets primarily related to customer relationships no longer being expensed due to the NetLogic asset impairment charges taken during the year, offset by additional amortization of completed technology. The decrease in 2013 amortization of purchased intangible assets primarily
35
related to completed technology and customer relationships no longer being expensed due to the asset impairments charges taken during the year (see discussion below) and other assets becoming fully amortized in 2012.
The following table presents details of the amortization of existing purchased intangible assets (including IPR&D), which is currently estimated to be expensed in 2015 and thereafter:
Purchased Intangible Asset Amortization by Year | |||||||||||||||||||||||||||
2015 | 2016 | 2017 | 2018 | 2019 | Thereafter | Total | |||||||||||||||||||||
(In millions) | |||||||||||||||||||||||||||
Cost of revenue | $ | 144 | $ | 116 | $ | 98 | $ | 83 | $ | 64 | $ | 145 | $ | 650 | |||||||||||||
Other operating expenses | 4 | 3 | 2 | 3 | 2 | — | 14 | ||||||||||||||||||||
$ | 148 | $ | 119 | $ | 100 | $ | 86 | $ | 66 | $ | 145 | $ | 664 | ||||||||||||||
We amortize our intangible assets with definitive lives using a method that reflects the pattern in which the economic benefits of the intangible asset are consumed or otherwise used or, if that pattern cannot be reliably determined, using a straight-line method. In addition, based on our current assumptions, IPR&D assets will be reclassified to development technology through 2017 and amortized over their estimated useful lives. If we acquire additional purchased intangible assets in the future, our cost of product revenue or operating expenses will be increased by the amortization of those assets.
Impairment of Goodwill and Other Long-Lived Assets
We performed annual impairment assessments of the carrying value of goodwill in October 2014, 2013 and 2012. Upon completion of these assessments, we determined no impairment was indicated as the estimated fair value of each of the reporting units exceeded its respective carrying value. For the carrying balances of our goodwill by reportable segment and a description of our valuation techniques and significant assumptions, see Note 9 of Notes to the Consolidated Financial Statements.
We recorded impairment charges of long-lived assets of $404 million, $511 million and $90 million, in 2014, 2013 and 2012, respectively. See discussion of our impairment of long-lived assets in Notes 9 and 10 of Notes to Consolidated Financial Statements as it relates to our decision to exit the cellular baseband business and wind down those operations, as well as the impairments of purchased intangible assets as they relate to certain acquisitions.
Restructuring Costs, Net
We recorded restructuring costs $158 million, $29 million and $7 million, in 2014, 2013 and 2012, respectively. See discussion of our restructuring costs in our “Exit of Cellular Baseband Business” section above and in Note 10 of Notes to Consolidated Financial Statements.
Settlement Costs (Gains)
We recorded net settlement costs of $16 million and $79 million, in 2014 and 2012, respectively, primarily related to the settlement of patent infringement claims. In 2013 we received payment of $75 million, net of contingent legal fees, and recorded this as a gain on settlement. In addition, we recorded settlement costs of $6 million, primarily related to patent infringement claims. See Note 8 of Notes to Consolidated Financial Statements.
Other Charges (Gains), Net
See discussion of our Other charges (gains), net, in Note 2 of Notes to Consolidated Financial Statements as it relates to the sale of certain Ethernet controller-related assets to QLogic in the three months ended March 31, 2014, and our charitable contribution made in September 2013. These other charges (gains) were recorded as a net operating expense (gain) in our consolidated statements of income.
36
Interest Expense and Other Income, Net
The following table presents interest expense and other income (expense), net:
Year Ended December 31, | 2014 vs 2013 | 2013 vs 2012 | |||||||||||||||||
2014 | 2013 | 2012 | $ Change | ||||||||||||||||
(In millions) | |||||||||||||||||||
Interest expense, net | $ | (36 | ) | $ | (30 | ) | $ | (30 | ) | $ | (6 | ) | $ | — | |||||
Other income, net | 9 | 3 | 10 | 6 | (7 | ) | |||||||||||||
$ | (27 | ) | $ | (27 | ) | $ | (20 | ) | $ | — | $ | (7 | ) | ||||||
Interest expense, net, reflects interest expense on our senior unsecured notes with an outstanding principal balance at December 31, 2014, of $1.60 billion, offset by interest income earned on cash, cash equivalents and marketable securities balances. Other income (expense), net, primarily includes gains and losses on foreign currency transactions, asset disposals and strategic investments.
The increases in interest expense in 2014 was driven primarily by the premium paid upon redemption of the 2015 Notes of $11 million. See discussion of our debt in Note 5 of Notes to Consolidated Financial Statements.
Provision for (Benefit of) Income Taxes
Year Ended December 31, | |||||||||||
2014 | 2013 | 2012 | |||||||||
(In millions, except percentages) | |||||||||||
Provision for (benefit of) income taxes | $ | 15 | $ | 21 | $ | (63 | ) | ||||
Effective tax rates | 2.2 | % | 4.7 | % | (9.6 | )% | |||||
The federal statutory rate was 35% for 2014, 2013 and 2012. The differences between our effective tax rates and the 35% federal statutory rate resulted primarily from foreign earnings taxed at substantially lower rates than the federal statutory rate and domestic tax losses recorded without tax benefits. See discussion of income taxes in Note 4 of Notes to Consolidated Financial Statements for further information in determining our annualized effective tax rates and a reconciliation of the federal statutory income tax rate to our effective tax rate.
We recorded tax benefits resulting from the reduction of certain foreign deferred tax liabilities of $5 million, $10 million, and $12 million in 2014, 2013 and 2012, respectively. We recorded tax benefits resulting from the expiration of statutes of limitations for the assessment of taxes in various foreign jurisdictions of $10 million, $9 million, and $13 million for 2014, 2013 and 2012, respectively. In addition, in 2012 we recorded tax benefits resulting from reductions in our domestic valuation allowance on certain deferred tax assets due to recording net deferred tax liabilities for identifiable intangible assets under purchase accounting of $51 million for certain of our acquisitions.
Previously, we operated under tax incentives in Singapore, which were effective through March 2014 and were conditional upon our meeting certain employment and investment thresholds. The impact of the Singapore tax incentives decreased Singapore taxes by $131 million, $423 million and $399 million for 2014, 2013 and 2012, respectively. The benefit of the tax incentives on net income per share (diluted) was $0.22, $0.73 and $0.69 for 2014, 2013 and 2012, respectively. For periods after March 31, 2014, we are utilizing our Irish trading companies, which results in similar foreign taxes as we incurred under our previous Singaporean tax incentives.
37
Liquidity and Capital Resources
Working Capital and Cash and Marketable Securities.
The following table presents working capital, cash and cash equivalents, and marketable securities:
December 31, | |||||||||||
2014 | 2013 | $ Change | |||||||||
(In millions) | |||||||||||
Working capital | $ | 3,522 | $ | 2,419 | $ | 1,103 | |||||
Cash and cash equivalents | $ | 2,545 | $ | 1,657 | 888 | ||||||
Short-term marketable securities | 1,061 | 775 | 286 | ||||||||
Long-term marketable securities | 2,383 | 1,939 | 444 | ||||||||
Total cash and cash equivalents and marketable securities | $ | 5,989 | $ | 4,371 | $ | 1,618 | |||||
See the summary of cash, cash equivalents, short and long-term marketable securities by major security type and discussion of market risk that follows in Item 7A. Quantitative and Qualitative Disclosures about Market Risk.
Cash Provided and Used in 2014, 2013 and 2012.
The following table presents cash provided and used:
Year Ended December 31, | |||||||||||
2014 | 2013 | 2012 | |||||||||
(In millions) | |||||||||||
Net cash provided by operating activities | $ | 1,925 | $ | 1,785 | $ | 1,931 | |||||
Net cash used in investing activities | (914 | ) | (996 | ) | (4,796 | ) | |||||
Net cash provided by (used in) financing activities | (123 | ) | (749 | ) | 336 | ||||||
Increase (decrease) in cash and cash equivalents | 888 | 40 | (2,529 | ) | |||||||
Cash and cash equivalents at beginning of period | 1,657 | 1,617 | 4,146 | ||||||||
Cash and cash equivalents at end of period | $ | 2,545 | $ | 1,657 | $ | 1,617 | |||||
Operating Activities
In 2014 our operating activities provided $1.93 billion in cash. This was primarily the result of net income of $652 million, net non-cash operating expenses of $1.19 billion and changes in operating assets and liabilities of $81 million. In 2013 our operating activities provided $1.79 billion in cash. This was primarily the result of net income of $424 million and net non-cash operating expenses of $1.43 billion, offset in part by changes in operating assets and liabilities of $67 million. In 2012 our operating activities provided $1.93 billion in cash. This was primarily the result of net income of $719 million, net non-cash operating expenses of $1.06 billion and changes in operating assets and liabilities of $152 million.
Our days sales outstanding decreased from 35 days at December 31, 2013, to 34 days at December 31, 2014. We typically bill customers on an open account basis subject to our standard net thirty day payment terms. If, in the longer term, our revenue increases, it is likely that our accounts receivable balance will also increase. Our accounts receivable could also increase if customers delay their payments or if we grant extended payment terms to customers, both of which are more likely to occur during challenging economic times when our customers may have difficulty gaining access to sufficient credit on a timely basis.
38
Our inventory days on hand increased slightly from 47 at December 31, 2013, to 48 days at December 31, 2014. In the future, our inventory levels will continue to be determined by the level of purchase orders we receive and the stage at which our products are in their respective product life cycles, our ability, and the ability of our customers, to manage inventory under hubbing arrangements, and competitive situations in the marketplace. Such considerations are balanced against the risk of obsolescence or potentially excess inventory levels.
Investing Activities
Investing activities used $914 million in cash in 2014, which was primarily the result of $730 million in net purchases of marketable securities, $262 million of capital equipment purchases mostly to support our research and development efforts and upgrading our enterprise resource planning system, $14 million in net cash used in connection various acquisitions, offset in part by $92 million primarily from the net proceeds from the sale of certain assets in the QLogic Transaction.
Investing activities used $996 million in cash in 2013, which was primarily the result of $611 million in net purchases of marketable securities, $228 million of capital equipment purchases mostly to support our research and development efforts, $142 million in net cash used in connection with the Renesas Transaction, and $15 million of purchases of strategic investments.
Investing activities used $4.80 billion in cash in 2012, which was primarily the result of $3.58 billion in net cash paid for our acquisitions, primarily NetLogic and BroadLight, $244 million of capital equipment purchases mostly to support our research and development efforts, and $997 million in net purchases of marketable securities, offset in part by $27 million of proceeds from the sale of strategic investments.
Financing Activities
Our financing activities used $123 million in cash in 2014, which was primarily the result of $522 million used to repurchase shares of our Class A common stock, the repayment of long-term debt of $400 million, dividends paid of $283 million, and $127 million in minimum tax withholding paid on behalf of employees for shares issued pursuant to restricted stock units, offset in part by $617 million in proceeds received from issuances of common stock upon the exercise of stock options and purchases under our employee stock purchase plan, and $592 million in proceeds from the issuance of long-term debt.
Our financing activities used $749 million in cash in 2013, which was primarily the result of $597 million used to repurchase shares of our Class A common stock, the repayment of long-term debt of $300 million, dividends paid of $254 million, and $130 million in minimum tax withholding paid on behalf of employees for shares issued pursuant to restricted stock units, offset in part by $532 million in proceeds received from issuances of common stock upon the exercise of stock options and pursuant to our employee stock purchase plan.
Our financing activities provided $336 million in cash in 2012, which was primarily the result of $492 million in proceeds from the issuance of long-term debt, and $311 million in proceeds received from issuances of common stock upon the exercise of stock options and pursuant to our employee stock purchase plan, offset in part dividends paid of $224 million, $153 million in minimum tax withholding paid on behalf of employees for shares issued pursuant to restricted stock units, $57 million in payments of contingent consideration and debt assumed from certain acquisitions, and $33 million used to repurchase shares of our Class A common stock.
The timing and number of stock option exercises and employee stock purchases, and the amount of cash proceeds we receive from these equity awards are not within our control. As it is now our practice to issue restricted stock units, or RSUs, instead of stock options we will likely not generate as much cash from the exercise of stock options as we have in the past. Unlike the exercise of stock options, the issuance of shares upon vesting of RSUs does not result in any cash proceeds to Broadcom and in fact requires the use of cash, as we currently allow employees to have a portion of the shares issued upon vesting of RSUs withheld to satisfy minimum statutory withholding taxes. This withholding procedure requires that we pay cash to the appropriate tax authorities on each participating employee’s behalf.
39
Short and Long-Term Financing Arrangements
At December 31, 2014, we had the following resources available to obtain short-term or long-term financings if we need additional liquidity:
Registration Statement
We have a Form S-4 acquisition shelf registration statement on file with the SEC. The registration statement on Form S-4 enables us to issue up to 30 million shares of our Class A common stock in one or more acquisition transactions. These transactions may include the acquisition of assets, businesses or securities by any form of business combination. To date no securities have been issued pursuant to the S-4 registration statement, which does not have an expiration date mandated by SEC rules.
Senior Notes
The following table summarizes details of our senior unsecured notes, or Notes:
Date | Maturity | Interest | Effective | Issuance | December 31, | ||||||||||||||||||
Issued | Date | Rate | Yield | Price | 2014 | 2013 | $ Change | ||||||||||||||||
(In millions) | |||||||||||||||||||||||
November 2010 | November 2015 | 2.375 | % | 2.494 | % | 99.444 | % | $ | — | $ | 400 | $ | (400 | ) | |||||||||
November 2011 | November 2018 | 2.700 | 2.762 | 99.609 | 500 | 500 | — | ||||||||||||||||
August 2012 | August 2022 | 2.500 | 2.585 | 99.255 | 500 | 500 | — | ||||||||||||||||
July 2014 | August 2024 | 3.500 | 3.546 | 99.615 | 350 | — | 350 | ||||||||||||||||
July 2014 | August 2034 | 4.500 | 4.546 | 99.400 | 250 | — | 250 | ||||||||||||||||
$ | 1,600 | $ | 1,400 | $ | 200 | ||||||||||||||||||
Unaccreted discount | (7 | ) | (6 | ) | (1 | ) | |||||||||||||||||
Long-term debt | $ | 1,593 | $ | 1,394 | $ | 199 | |||||||||||||||||
Proceeds from the 2024 and 2034 Notes are being utilized for general corporate purposes and a portion was also used to redeem the 2015 Notes. Proceeds from the issuance of the 2022 Notes are being utilized for general corporate purposes, which included the repayment of our 1.500% senior notes that were due in November 2013. Proceeds from the issuance of the 2018 Notes were utilized to help fund the acquisition of NetLogic and proceeds from the 2015 Notes were utilized for general corporate purposes.
The outstanding Notes described above contain a number of restrictive covenants, including, but not limited to, restrictions on our ability to grant liens on assets; enter into sale and lease-back transactions; or merge, consolidate or sell assets. Failure to comply with these covenants, or any other event of default, could result in acceleration of the principal amount and accrued and unpaid interest on the Notes. We were in compliance with all senior unsecured notes debt covenants as of December 31, 2014.
Credit Facility
In November 2010 we entered into a credit facility, with certain institutional lenders that provides for unsecured revolving facility loans, swing line loans and letters of credit in an aggregate amount of up to $500 million. We amended this credit facility in July 2014 primarily to extend the maturity date to July 31, 2019, at which time all outstanding revolving facility loans (if any) and accrued and unpaid interest must be repaid. The July 2014 amendment to the credit facility also removed the consolidated interest coverage ratio financial covenant, removed the negative covenants restricting investments and restricted payments, and removed the highest pricing in the pricing grid for determining the interest rate margins applicable to loans made under the credit facility and the commitment fee paid on the amount of the unused commitments. We have not drawn on our credit facility to date.
40
Loans made under the credit facility (other than swing line loans) bear interest, at our option, at either a Base Rate plus a margin that varies from 0.000% to 0.250% or a Eurodollar Rate plus a margin that varies from 0.625% to 1.250%. Swing line loans under the credit facility bear interest applicable to Base Rate loans. We are also required to pay a commitment fee on any unused commitments at a rate that varies from 0.060% to 0.150% per annum.
The credit facility contains customary representations, warranties and covenants. Financial covenants require us to maintain a consolidated leverage ratio of no more than 3.25:1.00. We were in compliance with all credit facility debt covenants as of December 31, 2014.
Other Notes and Borrowings
We had no other significant notes or borrowings as of December 31, 2014.
Commitments and Other Contractual Obligations
The following table presents details of our commitments and other contractual obligations, which are currently estimated to be paid in 2015 and thereafter:
Payment Obligations by Year | |||||||||||||||||||||||||||
2015 | 2016 | 2017 | 2018 | 2019 | Thereafter | Total | |||||||||||||||||||||
(In millions) | |||||||||||||||||||||||||||
Operating leases | $ | 197 | $ | 142 | $ | 95 | $ | 56 | $ | 24 | $ | 23 | $ | 537 | |||||||||||||
Inventory and related purchase obligations | 725 | — | — | — | — | — | 725 | ||||||||||||||||||||
Other obligations | 155 | 36 | 4 | — | — | — | 195 | ||||||||||||||||||||
Long-term debt and related interest | 50 | 49 | 49 | 550 | 36 | 1,368 | 2,102 | ||||||||||||||||||||
$ | 1,127 | $ | 227 | $ | 148 | $ | 606 | $ | 60 | $ | 1,391 | $ | 3,559 | ||||||||||||||
We lease our facilities and certain engineering design tools and information systems equipment under operating lease agreements. Our leased facilities comprise an aggregate of 4.3 million square feet. Our principal facilities in Irvine have lease terms that expire at various dates through 2018 with an aggregate remaining rent of $94 million (included in the table above).
Inventory and related purchase obligations represent purchase commitments for silicon wafers and assembly and test services. We depend upon third party subcontractors to manufacture our silicon wafers and provide assembly and test services. Due to lengthy subcontractor lead times, we must order these materials and services from subcontractors well in advance. We expect to receive and pay for these materials and services within the ensuing six months. Our subcontractor relationships typically allow for the cancellation of outstanding purchase orders but require payment of all expenses incurred through the date of cancellation.
Other obligations represent purchase commitments for lab test equipment, computer hardware, information systems infrastructure, mask and prototyping costs, intellectual property licensing arrangements and other commitments made in the ordinary course of business.
For purposes of the table above, obligations for the purchase of goods or services are defined as agreements that are enforceable and legally binding and that specify all significant terms, including: fixed or minimum quantities to be purchased; fixed, minimum or variable price provisions; and the approximate timing of the transaction. Our purchase orders are based on current manufacturing needs and are typically fulfilled by our vendors within a relatively short time horizon. We have additional purchase orders (not included in the table above) that represent authorizations to purchase rather than binding agreements. We do not have significant agreements for the
41
purchase of inventories or other goods specifying minimum quantities or set prices that exceed our expected requirements.
Unrecognized tax benefits were $364 million, of which $62 million would result in potential cash payment of taxes and $302 million would result in a reduction in certain net operating loss and tax credit carryforwards. We are not including any amount related to uncertain tax positions in the table presented above because of the difficulty in making reasonably reliable estimates of the timing of settlements with the respective taxing authorities. In addition to the unrecognized tax benefits, we have also recorded a liability for potential tax penalties and interest of $27 million and $6 million, respectively, at December 31, 2014.
In November 2014 we signed an agreement to purchase land for the construction of a new corporate campus, totaling up to 2 million square feet, to meet the requirements projected in our long-term business plan. The cost of the land is $128 million and is not included in the table above as the purchase is currently anticipated to close in three months ending March 31, 2015, subject to closing conditions. Assuming the completion of the purchase of land, the construction of the new facility and the associated relocation is currently expected to cost an additional $650 million through 2018. We currently expect to begin occupying the new facilities in 2017.
Prospective Capital Needs
We believe that our existing cash, cash equivalents and marketable securities, together with cash generated from operations and from the issuance of common stock through our employee stock option and purchase plans, will be sufficient to cover our working capital needs, capital expenditures, investment requirements, commitments, repurchases of our Class A common stock and quarterly dividends for at least the next 12 months. This includes our pending acquisition of land and related construction of our new corporate campus. However, it is possible that we may choose to raise additional funds or draw on our existing credit facility to finance our activities beyond the next 12 months or to consummate acquisitions of other businesses, assets, products or technologies. If needed, we may be able to raise such funds by selling equity or debt securities to the public or to selected investors or by borrowing money from financial institutions. We could also reduce certain expenditures, such as repurchases of our Class A common stock and payments of our quarterly dividends.
We earn a significant amount of our operating income outside the U.S., which is deemed to be permanently reinvested in foreign jurisdictions. For at least the next 12 months, we have sufficient cash in the U.S. and expect domestic cash flow to sustain our operating activities and cash commitments for investing and financing activities, such as acquisitions, quarterly dividends, share buy-backs and repayment of debt. In addition, we expect existing foreign cash, cash equivalents, short-term investments, and cash flows from operations to continue to be sufficient to fund our foreign operating activities and cash commitments for investing activities, such as material capital expenditures, for at least the next 12 months. As of December 31, 2014 we had approximately $3.13 billion of cash, cash equivalents, and marketable securities held by our foreign subsidiaries. We do not expect that potential taxes on a repatriation of our foreign earnings, which are permanently reinvested, would have a material effect on our overall liquidity because such potential taxes would be substantially offset by our domestic net operating loss and tax credit carryforwards. Nevertheless, some of a repatriation would be subject to US federal income taxes, less foreign tax credits. In addition, a repatriation of our foreign earnings could result in higher and more volatile income tax rates and dilution of our earnings.
In addition, even though we may not need additional funds, we may still elect to sell additional equity or debt securities or utilize or increase our existing credit facilities for other reasons. However, we may not be able to obtain additional funds on a timely basis at acceptable terms, if at all. If we raise additional funds by issuing additional equity or convertible debt securities, the ownership percentages of existing shareholders would be reduced. In addition, the equity or debt securities that we issue may have rights, preferences or privileges senior to those of our Class A common stock.
42
Although we believe that we have sufficient capital to fund our activities for at least the next 12 months, our future capital requirements may vary materially from those now planned. We anticipate that the amount of capital we will need in the future will depend on many factors, including:
• | general economic and specific conditions in the markets we address, including the continuing volatility in the technology sector and semiconductor industry, and trends in the wired and wireless communications markets in various geographic regions, including seasonality in sales of consumer products into which our products are incorporated; |
• | the overall levels of sales of our semiconductor products, licensing revenue, and gross margins; |
• | our business, product, capital expenditure and research and development plans, and product and technology roadmaps; |
• | the market acceptance of our products; |
• | acquisitions of businesses, assets, products or technologies; |
• | the unavailability of credit and financing, which may lead certain of our customers to reduce their levels of purchases or to seek credit or other accommodations from us; |
• | litigation expenses, settlements and judgments, customer indemnification claims and other types of litigation risks; |
• | payment of cash dividends; |
• | required levels of research and development and other operating costs; |
• | volume price discounts and customer rebates; |
• | the levels of inventory and accounts receivable that we maintain; |
• | licensing royalties payable by us, including licensing fees paid to NPEs; |
• | capital improvements for new and existing facilities; |
• | changes in our compensation policies; |
• | the issuance of restricted stock units and the related cash payments we make for withholding taxes due from employees; |
• | repurchases of our Class A common stock; |
• | changes in tax laws; |
• | technological upgrades and improvements in our infrastructure technology systems; |
• | our competitors’ responses to our products and our anticipation of and responses to their products; |
• | our relationships with suppliers and customers; |
• | the availability and cost of sufficient foundry, assembly and test capacity and packaging materials; and |
• | the level of exercises of stock options and stock purchases under our employee stock purchase plan. |
In addition, we may require additional capital to accommodate planned future long-term growth, hiring, infrastructure and facility needs.
Off-Balance Sheet Arrangements
At December 31, 2014, we had no material off-balance sheet arrangements, other than our facility operating leases.
Item 7A. Quantitative and Qualitative Disclosures about Market Risk
Interest Rate Risk
We manage our total portfolio to encompass a diversified pool of investment-grade securities to preserve principal and maintain liquidity. The average credit rating of our marketable securities portfolio by major credit rating agencies was Aa3/AA-. Investments in both fixed rate and floating rate instruments carry a degree of interest rate risk. Fixed rate securities may have their market value adversely impacted due to an increase in interest rates, while floating rate securities may produce less income than expected if interest rates fall. Due in part to these factors, our future investment income, net, may fall short of expectations due to changes in interest rates or if the decline in fair value of our publicly traded fixed income investments is judged to be other-than-temporary. We may suffer losses in principal if we are forced to sell securities that have declined in market value due to changes in
43
interest rates. However, because any fixed income securities we hold are classified as available-for-sale, no gains or losses are realized in the income statement due to changes in interest rates unless such securities are sold prior to maturity or unless declines in value are determined to be other-than-temporary. These securities are reported at fair value with the related unrealized gains and losses included in accumulated other comprehensive loss, a component of shareholders’ equity, net of tax.
To assess the interest rate risk associated with our investment portfolio, we performed a sensitivity analysis to determine the impact a change in interest rates would have on the value of the investment portfolio assuming a 100 basis point parallel shift in the yield curve. Based on investment positions as of December 31, 2014, a 100 basis point increase in interest rates across all maturities would result in a $36 million incremental decline in the fair market value of the portfolio. Such losses would only be realized if we sold the investments prior to maturity.
Actual future gains and losses associated with our investments may differ from the sensitivity analysis performed as of December 31, 2014, due to the inherent limitations associated with predicting the changes in the timing and level of interest rates and our actual exposures and positions.
A hypothetical increase of 100 basis points in short-term interest rates would not have a material impact on our revolving credit facility, which bears a floating interest rate. This sensitivity analysis assumes all other variables will remain constant in future periods.
Our Notes bear fixed interest rates, and therefore, would not be subject to interest rate risk.
Exchange Rate Risk
We consider our direct exposure to foreign exchange rate fluctuations to be minimal. Currently, sales to customers and arrangements with third-party manufacturers provide for pricing and payment in United States dollars and, therefore, are not subject to exchange rate fluctuations. Increases in the value of the United States dollar relative to other currencies could make our products more expensive, which could negatively impact our ability to compete. Conversely, decreases in the value of the United States dollar relative to other currencies could result in our suppliers raising their prices to continue doing business with us. Our direct exposure to foreign exchange rate fluctuations is limited primarily to employee costs for employees based outside of the U.S. Fluctuations in currency exchange rates could affect our business in the future.
Item 8. Financial Statement and Supplementary Data
The financial statements and supplementary data required by this item are included in Part IV, Item 15 of this Report.
Item 9. Changes in and Disagreements with Accountants on Accounting and Financial Disclosure
None.
Item 9A. Controls and Procedures
Evaluation of Disclosure Controls and Procedures
We are committed to maintaining disclosure controls and procedures designed to ensure that information required to be disclosed in our periodic reports filed under the Exchange Act is recorded, processed, summarized and reported within the time periods specified in the SEC’s rules and forms, and that such information is accumulated and communicated to our management, including our Chief Executive Officer and Chief Financial Officer, as appropriate, to allow for timely decisions regarding required disclosure. In designing and evaluating our disclosure controls and procedures, management recognizes that any controls and procedures, no matter how well designed and operated, can provide only reasonable assurance of achieving the desired control objectives, and management
44
necessarily is required to apply its judgment in evaluating the cost-benefit relationship of possible controls and procedures and implementing controls and procedures based on the application of management’s judgment.
Under the supervision and with the participation of our management, including our Chief Executive Officer and Chief Financial Officer, we conducted an evaluation of our disclosure controls and procedures, as such term is defined under Rules 13a-15(e) and 15d-15(e) promulgated under the Exchange Act. Based on this evaluation, our Chief Executive Officer and our Chief Financial Officer concluded that our disclosure controls and procedures were effective at a reasonable assurance level as of December 31, 2014, the end of the period covered by this Report.
Changes in Internal Control Over Financial Reporting
There has been no change in our internal control over financial reporting (as defined in Rules 13a-15(f) and 15d-15(f) of the Exchange Act) during the three months ended December 31, 2014, that has materially affected, or is reasonably likely to materially affect, our internal control over financial reporting.
Inherent Limitations on Internal Control
A control system, no matter how well conceived and operated, can provide only reasonable, not absolute, assurance that the objectives of the control system are met. Further, the benefits of controls must be considered relative to their costs. Because of the inherent limitations in all control systems, no evaluation of controls can provide absolute assurance that all control issues and instances of management override or improper acts, if any, have been detected. These inherent limitations include the realities that judgments in decision making can be faulty, and that breakdowns can occur because of simple errors or mistakes. Additionally, controls can be circumvented by the individual acts of some persons, by collusion of two or more people, or by management override of the control. The design of any system of controls is also based in part upon certain assumptions about the likelihood of future events, and there can be no assurance that any design will succeed in achieving its stated goals under all potential future conditions. Because of the inherent limitations in a cost-effective control system, misstatements due to management override, error or improper acts may occur and not be detected. Any resulting misstatement or loss may have an adverse and material effect on our business, financial condition and results of operations.
Management’s Report on Internal Control over Financial Reporting
Our management is responsible for establishing and maintaining adequate internal control over financial reporting, as such term is defined in Exchange Act Rule 13a-15(f). Under the supervision and with the participation of our management, including our principal executive officer and principal financial officer, we conducted an evaluation of the effectiveness of our internal control over financial reporting based on the framework set forth in Internal Control — Integrated Framework (1992) issued by the Committee of Sponsoring Organizations of the Treadway Commission. Based on our evaluation under the framework set forth in Internal Control — Integrated Framework (1992), our management concluded that our internal control over financial reporting was effective as of December 31, 2014. The effectiveness of our internal control over financial reporting as of December 31, 2014, has been audited by KPMG LLP, an independent registered public accounting firm, as stated in their report which is included in Part IV.
Item 9B. Other Information
None.
45
PART III
Item 10. Directors, Executive Officers and Corporate Governance
(a) Identification and Business Experience of Directors. The information under the caption “Election of Directors,” appearing in our Definitive Proxy Statement to be filed with the Securities and Exchange Commission in connection with the 2015 Annual Meeting of Shareholders, referred to as the 2015 Proxy Statement, is hereby incorporated by reference.
(b) Identification and Business Experience of Executive Officers. The information under the caption “Executive Compensation and Other Information — Executive Officers,” appearing in the 2015 Proxy Statement, is hereby incorporated by reference.
(c) Compliance with Section 16(a) of the Exchange Act. The information under the caption “Ownership of Securities — Section 16(a) Beneficial Ownership Reporting Compliance,” appearing in the 2015 Proxy Statement, is hereby incorporated by reference.
(d) Code of Ethics. The information under the caption “Corporate Governance and Board Matters,” appearing in the 2015 Proxy Statement, is hereby incorporated by reference.
(e) Audit Committee. The information under the caption “Corporate Governance and Board Matters — Audit Committee,” appearing in the 2015 Proxy Statement, is hereby incorporated by reference.
Item 11. Executive Compensation
The information under the caption “Executive Compensation and Other Information” and “Corporate Governance and Board Matters — Compensation of Non-Employee Directors,” appearing in the 2015 Proxy Statement, is hereby incorporated by reference.
Item 12. Security Ownership of Certain Beneficial Owners and Management and Related Stockholder Matters
The information under the captions “Equity Compensation Plan Information” and “Ownership of Securities,” appearing in the 2015 Proxy Statement, is hereby incorporated by reference.
Item 13. Certain Relationships and Related Transactions, and Director Independence
The information under the captions “Certain Relationships and Related Transactions” and “Corporate Governance and Board Matter — Director Independence” appearing in the 2015 Proxy Statement, is hereby incorporated by reference.
Item 14. Principal Accounting Fees and Services
The information under the caption “Audit Information — Fees Paid to Independent Registered Public Accounting Firm,” appearing in the 2015 Proxy Statement, is hereby incorporated by reference.
46
PART IV
Item 15. Exhibits, Financial Statement Schedule
(a) 1. Financial Statements.
The following Broadcom consolidated financial statements, and related notes thereto, and the related Reports of our Independent Registered Public Accounting Firm are filed as part of this Form 10-K:
Page | |
2. Financial Statement Schedules.
The following financial statement schedule of Broadcom is filed as part of this Form 10-K:
All other schedules have been omitted because they are not applicable or not required, or the information is included in the Consolidated Financial Statements or Notes thereto.
3. Exhibits.
The exhibits listed on the exhibit index following the Signature page are filed as part of, or hereby incorporated by reference into, this Form 10-K.
47
Report of Independent Registered Public Accounting Firm
The Board of Directors and Shareholders
Broadcom Corporation:
We have audited the accompanying consolidated balance sheets of Broadcom Corporation and subsidiaries as of December 31, 2014 and 2013, and the related consolidated statements of income, comprehensive income, shareholders’ equity, and cash flows for each of the years in the three-year period ended December 31, 2014. In connection with our audits of the consolidated financial statements, we also have audited the consolidated financial statement schedule of valuation and qualifying accounts. These consolidated financial statements and financial statement schedule are the responsibility of the Company’s management. Our responsibility is to express an opinion on these consolidated financial statements and financial statement schedule based on our audits.
We conducted our audits in accordance with the standards of the Public Company Accounting Oversight Board (United States). Those standards require that we plan and perform the audit to obtain reasonable assurance about whether the financial statements are free of material misstatement. An audit includes examining, on a test basis, evidence supporting the amounts and disclosures in the financial statements. An audit also includes assessing the accounting principles used and significant estimates made by management, as well as evaluating the overall financial statement presentation. We believe that our audits provide a reasonable basis for our opinion.
In our opinion, the consolidated financial statements referred to above present fairly, in all material respects, the financial position of Broadcom Corporation and subsidiaries as of December 31, 2014 and 2013, and the results of their operations and their cash flows for each of the years in the three-year period ended December 31, 2014, in conformity with U.S. generally accepted accounting principles. Also in our opinion, the related consolidated financial statement schedule, when considered in relation to the basic consolidated financial statements taken as a whole, presents fairly, in all material respects, the information set forth therein.
We also have audited, in accordance with the standards of the Public Company Accounting Oversight Board (United States), Broadcom Corporation’s internal control over financial reporting as of December 31, 2014, based on criteria established in Internal Control - Integrated Framework (1992) issued by the Committee of Sponsoring Organizations of the Treadway Commission (COSO), and our report dated January 29, 2015 expressed an unqualified opinion on the effectiveness of the Company’s internal control over financial reporting.
/s/ KPMG LLP
Irvine, California
January 29, 2015
F-1
Report of Independent Registered Public Accounting Firm
The Board of Directors and Shareholders
Broadcom Corporation:
We have audited Broadcom Corporation’s internal control over financial reporting as of December 31, 2014, based on criteria established in Internal Control - Integrated Framework (1992) issued by the Committee of Sponsoring Organizations of the Treadway Commission (COSO). Broadcom Corporation’s management is responsible for maintaining effective internal control over financial reporting and for its assessment of the effectiveness of internal control over financial reporting, included in the accompanying Management’s Report on Internal Control over Financial Reporting appearing under Item 9A. Our responsibility is to express an opinion on the Company’s internal control over financial reporting based on our audit.
We conducted our audit in accordance with the standards of the Public Company Accounting Oversight Board (United States). Those standards require that we plan and perform the audit to obtain reasonable assurance about whether effective internal control over financial reporting was maintained in all material respects. Our audit included obtaining an understanding of internal control over financial reporting, assessing the risk that a material weakness exists, and testing and evaluating the design and operating effectiveness of internal control based on the assessed risk. Our audit also included performing such other procedures as we considered necessary in the circumstances. We believe that our audit provides a reasonable basis for our opinion.
A company’s internal control over financial reporting is a process designed to provide reasonable assurance regarding the reliability of financial reporting and the preparation of financial statements for external purposes in accordance with generally accepted accounting principles. A company’s internal control over financial reporting includes those policies and procedures that (1) pertain to the maintenance of records that, in reasonable detail, accurately and fairly reflect the transactions and dispositions of the assets of the company; (2) provide reasonable assurance that transactions are recorded as necessary to permit preparation of financial statements in accordance with generally accepted accounting principles, and that receipts and expenditures of the company are being made only in accordance with authorizations of management and directors of the company; and (3) provide reasonable assurance regarding prevention or timely detection of unauthorized acquisition, use, or disposition of the company’s assets that could have a material effect on the financial statements.
Because of its inherent limitations, internal control over financial reporting may not prevent or detect misstatements. Also, projections of any evaluation of effectiveness to future periods are subject to the risk that controls may become inadequate because of changes in conditions, or that the degree of compliance with the policies or procedures may deteriorate.
In our opinion, Broadcom Corporation maintained, in all material respects, effective internal control over financial reporting as of December 31, 2014, based on criteria established in Internal Control - Integrated Framework (1992) issued by the Committee of Sponsoring Organizations of the Treadway Commission (COSO).
We also have audited, in accordance with the standards of the Public Company Accounting Oversight Board (United States), the consolidated balance sheets of Broadcom Corporation and subsidiaries as of December 31, 2014 and 2013, and the related consolidated statements of income, comprehensive income, shareholders’ equity, and cash flows for each of the years in the three-year period ended December 31, 2014, and our report dated January 29, 2015, expressed an unqualified opinion on those consolidated financial statements.
/s/ KPMG LLP
Irvine, California
January 29, 2015
F-2
CONSOLIDATED BALANCE SHEETS
(In millions, except par value)
December 31, | |||||||
2014 | 2013 | ||||||
ASSETS | |||||||
Current assets: | |||||||
Cash and cash equivalents | $ | 2,545 | $ | 1,657 | |||
Short-term marketable securities | 1,061 | 775 | |||||
Accounts receivable, net of allowance for doubtful accounts of $10 million in 2014 and $8 million in 2013 | 804 | 795 | |||||
Inventory | 531 | 525 | |||||
Prepaid expenses and other current assets | 131 | 163 | |||||
Total current assets | 5,072 | 3,915 | |||||
Property and equipment, net | 516 | 593 | |||||
Long-term marketable securities | 2,383 | 1,939 | |||||
Goodwill | 3,710 | 3,793 | |||||
Purchased intangible assets, net | 664 | 1,144 | |||||
Other assets | 126 | 111 | |||||
Total assets | $ | 12,471 | $ | 11,495 | |||
LIABILITIES AND SHAREHOLDERS’ EQUITY | |||||||
Current liabilities: | |||||||
Accounts payable | $ | 503 | $ | 585 | |||
Wages and related benefits | 220 | 243 | |||||
Deferred revenue and income | 36 | 21 | |||||
Accrued liabilities | 791 | 647 | |||||
Total current liabilities | 1,550 | 1,496 | |||||
Long-term debt | 1,593 | 1,394 | |||||
Other long-term liabilities | 277 | 234 | |||||
Commitments and contingencies | |||||||
Shareholders’ equity: | |||||||
Convertible preferred stock, $.0001 par value: Authorized shares - 6 - none issued and outstanding | — | — | |||||
Class A common stock, $.0001 par value: Authorized shares - 2,500 Issued and outstanding shares - 550 in 2014 and 531 in 2013 | — | — | |||||
Class B common stock, $.0001 par value: Authorized shares - 400 Issued and outstanding shares - 49 in 2014 and 50 in 2013 | — | — | |||||
Additional paid-in capital | 12,595 | 12,475 | |||||
Accumulated deficit | (3,455 | ) | (4,107 | ) | |||
Accumulated other comprehensive income (loss) | (89 | ) | 3 | ||||
Total shareholders’ equity | 9,051 | 8,371 | |||||
Total liabilities and shareholders’ equity | $ | 12,471 | $ | 11,495 | |||
See accompanying notes.
F-3
CONSOLIDATED STATEMENTS OF INCOME
(In millions, except per share data)
Year Ended December 31, | |||||||||||
2014 | 2013 | 2012 | |||||||||
Net revenue | $ | 8,428 | $ | 8,305 | $ | 8,006 | |||||
Cost of revenue | 4,098 | 4,088 | 4,027 | ||||||||
Gross profit | 4,330 | 4,217 | 3,979 | ||||||||
Operating expenses: | |||||||||||
Research and development | 2,373 | 2,486 | 2,318 | ||||||||
Selling, general and administrative | 716 | 706 | 696 | ||||||||
Amortization of purchased intangible assets | 29 | 57 | 113 | ||||||||
Impairments of long-lived assets | 404 | 511 | 90 | ||||||||
Restructuring costs, net | 158 | 29 | 7 | ||||||||
Settlement costs (gains) | 16 | (69 | ) | 79 | |||||||
Other charges (gains), net | (60 | ) | 25 | — | |||||||
Total operating expenses | 3,636 | 3,745 | 3,303 | ||||||||
Income from operations | 694 | 472 | 676 | ||||||||
Interest expense, net | (36 | ) | (30 | ) | (30 | ) | |||||
Other income, net | 9 | 3 | 10 | ||||||||
Income before income taxes | 667 | 445 | 656 | ||||||||
Provision for (benefit of) income taxes | 15 | 21 | (63 | ) | |||||||
Net income | $ | 652 | $ | 424 | $ | 719 | |||||
Net income per share (basic) | $ | 1.11 | $ | 0.74 | $ | 1.29 | |||||
Net income per share (diluted) | $ | 1.08 | $ | 0.73 | $ | 1.25 | |||||
Weighted average shares (basic) | 590 | 574 | 558 | ||||||||
Weighted average shares (diluted) | 601 | 584 | 576 | ||||||||
Dividends per share | $ | 0.48 | $ | 0.44 | $ | 0.40 | |||||
The following table presents details of total stock-based compensation expense included in each functional line item in the consolidated statements of income above:
Year Ended December 31, | |||||||||||
2014 | 2013 | 2012 | |||||||||
(In millions) | |||||||||||
Cost of revenue | $ | 22 | $ | 25 | $ | 27 | |||||
Research and development | 304 | 363 | 368 | ||||||||
Selling, general and administrative | 111 | 130 | 148 | ||||||||
See accompanying notes.
F-4
CONSOLIDATED STATEMENTS OF COMPREHENSIVE INCOME
(In millions)
Year Ended December 31, | |||||||||||
2014 | 2013 | 2012 | |||||||||
Net income | $ | 652 | $ | 424 | $ | 719 | |||||
Other comprehensive income (loss), net of tax: | |||||||||||
Foreign currency translation adjustments, net of $0 tax in 2014, 2013 and 2012 | (87 | ) | 35 | 14 | |||||||
Unrealized gains (losses) on marketable securities, net of $0 tax in 2014, 2013 and 2012 | (5 | ) | 1 | 3 | |||||||
Other comprehensive income (loss) | (92 | ) | 36 | 17 | |||||||
Comprehensive income | $ | 560 | $ | 460 | $ | 736 | |||||
See accompanying notes.
F-5
CONSOLIDATED STATEMENTS OF SHAREHOLDERS’ EQUITY
(In millions)
Accumulated | ||||||||||||||||||||||
Other | ||||||||||||||||||||||
Additional | Comprehensive | Total | ||||||||||||||||||||
Common Stock | Paid-In | Accumulated | Income | Shareholders’ | ||||||||||||||||||
Shares | Amount | Capital | Deficit | (Loss) | Equity | |||||||||||||||||
Balance at December 31, 2011 | 545 | $ | — | $ | 11,821 | $ | (5,250 | ) | $ | (50 | ) | $ | 6,521 | |||||||||
Shares issued pursuant to stock awards, net | 20 | — | 33 | — | — | 33 | ||||||||||||||||
Employee stock purchase plan | 5 | — | 126 | — | — | 126 | ||||||||||||||||
Equity issued in business combinations | — | — | 137 | — | — | 137 | ||||||||||||||||
Repurchases of Class A common stock | (1 | ) | — | (33 | ) | — | — | (33 | ) | |||||||||||||
Dividends paid | — | — | (224 | ) | — | — | (224 | ) | ||||||||||||||
Stock-based compensation expense | — | — | 543 | — | — | 543 | ||||||||||||||||
Other comprehensive income | — | — | — | — | 17 | 17 | ||||||||||||||||
Net income | — | — | — | 719 | — | 719 | ||||||||||||||||
Balance at December 31, 2012 | 569 | — | 12,403 | (4,531 | ) | (33 | ) | 7,839 | ||||||||||||||
Shares issued pursuant to stock awards, net | 26 | — | 263 | — | — | 263 | ||||||||||||||||
Employee stock purchase plan | 6 | — | 139 | — | — | 139 | ||||||||||||||||
Repurchases of Class A common stock | (20 | ) | — | (597 | ) | — | — | (597 | ) | |||||||||||||
Dividends paid | — | — | (254 | ) | — | — | (254 | ) | ||||||||||||||
Stock-based compensation expense | — | — | 521 | — | — | 521 | ||||||||||||||||
Other comprehensive income | — | — | — | — | 36 | 36 | ||||||||||||||||
Net income | — | — | — | 424 | — | 424 | ||||||||||||||||
Balance at December 31, 2013 | 581 | — | 12,475 | (4,107 | ) | 3 | 8,371 | |||||||||||||||
Shares issued pursuant to stock awards, net | 27 | — | 346 | — | — | 346 | ||||||||||||||||
Employee stock purchase plan | 6 | — | 140 | — | — | 140 | ||||||||||||||||
Repurchases of Class A common stock | (15 | ) | — | (522 | ) | — | — | (522 | ) | |||||||||||||
Dividends paid | — | — | (283 | ) | — | — | (283 | ) | ||||||||||||||
Stock-based compensation expense | — | — | 439 | — | — | 439 | ||||||||||||||||
Other comprehensive loss | — | — | — | — | (92 | ) | (92 | ) | ||||||||||||||
Net income | — | — | — | 652 | — | 652 | ||||||||||||||||
Balance at December 31, 2014 | 599 | $ | — | $ | 12,595 | $ | (3,455 | ) | $ | (89 | ) | $ | 9,051 | |||||||||
See accompanying notes.
F-6
CONSOLIDATED STATEMENTS OF CASH FLOWS
(In millions)
Year Ended December 31, | |||||||||||
2014 | 2013 | 2012 | |||||||||
Operating activities | |||||||||||
Net income | $ | 652 | $ | 424 | $ | 719 | |||||
Adjustments to reconcile net income to net cash provided by operating activities: | |||||||||||
Depreciation and amortization | 178 | 173 | 134 | ||||||||
Stock-based compensation expense | 437 | 518 | 543 | ||||||||
Acquisition-related items: | |||||||||||
Amortization of purchased intangible assets | 214 | 228 | 311 | ||||||||
Impairments of long-lived assets | 404 | 511 | 90 | ||||||||
Gain on sale of assets and other | (41 | ) | (2 | ) | (18 | ) | |||||
Changes in operating assets and liabilities, net of acquisitions: | |||||||||||
Accounts receivable, net | (9 | ) | (55 | ) | (16 | ) | |||||
Inventory | (7 | ) | 2 | (5 | ) | ||||||
Prepaid expenses and other assets | 14 | (25 | ) | (8 | ) | ||||||
Accounts payable | (79 | ) | 24 | 72 | |||||||
Deferred revenue | 87 | (15 | ) | 45 | |||||||
Other accrued and long-term liabilities | 75 | 2 | 64 | ||||||||
Net cash provided by operating activities | 1,925 | 1,785 | 1,931 | ||||||||
Investing activities | |||||||||||
Net purchases of property and equipment | (262 | ) | (228 | ) | (244 | ) | |||||
Net cash paid for acquired companies | (14 | ) | (142 | ) | (3,582 | ) | |||||
Proceeds from sale (purchases) of certain assets and other | 92 | (15 | ) | 27 | |||||||
Purchases of marketable securities | (3,871 | ) | (2,682 | ) | (2,551 | ) | |||||
Proceeds from sales and maturities of marketable securities | 3,141 | 2,071 | 1,554 | ||||||||
Net cash used in investing activities | (914 | ) | (996 | ) | (4,796 | ) | |||||
Financing activities | |||||||||||
Issuance of long-term debt, net | 592 | — | 492 | ||||||||
Payments of long-term debt | (400 | ) | (300 | ) | — | ||||||
Repurchases of Class A common stock | (522 | ) | (597 | ) | (33 | ) | |||||
Dividends paid | (283 | ) | (254 | ) | (224 | ) | |||||
Payment of assumed contingent consideration and debt | — | — | (57 | ) | |||||||
Proceeds from issuance of common stock | 617 | 532 | 311 | ||||||||
Minimum tax withholding paid on behalf of employees for restricted stock units | (127 | ) | (130 | ) | (153 | ) | |||||
Net cash provided by (used in) financing activities | (123 | ) | (749 | ) | 336 | ||||||
Increase (decrease) in cash and cash equivalents | 888 | 40 | (2,529 | ) | |||||||
Cash and cash equivalents at beginning of period | 1,657 | 1,617 | 4,146 | ||||||||
Cash and cash equivalents at end of period | $ | 2,545 | $ | 1,657 | $ | 1,617 | |||||
Supplemental disclosure of cash flow information | |||||||||||
Income taxes paid | $ | 27 | $ | 18 | $ | 25 | |||||
Interest paid | $ | 43 | $ | 40 | $ | 27 | |||||
See accompanying notes.
F-7
NOTES TO CONSOLIDATED FINANCIAL STATEMENTS
December 31, 2014
1. | Summary of Significant Accounting Policies |
Our Company
Broadcom Corporation (including our subsidiaries, referred to collectively in this Report as “Broadcom,” “we,” “our” and “us”) is a global leader and innovator in semiconductor solutions for wired and wireless communications. Broadcom provides one of the industry’s broadest portfolio of highly-integrated SoCs that seamlessly deliver voice, video, data and multimedia connectivity in the home, office and mobile environments.
Basis of Presentation
Our consolidated financial statements include the accounts of Broadcom and our subsidiaries. All significant intercompany accounts and transactions have been eliminated in consolidation. Income from the April 2009 agreement with Qualcomm Incorporated, or Qualcomm, is no longer broken out separately in the Consolidated Statements of Income. Such change did not affect total net revenue, net income, shareholders' equity or cash flows. See discussion below under “Income from the Qualcomm Agreement”.
Foreign Currency
The functional currency for most of our international operations is the U.S. dollar. Monetary assets and liabilities denominated in foreign currencies are remeasured at exchange rates in effect at the end of each month, and non-monetary assets, such as inventory and property, plant and equipment, at historical rates. Gains and losses from these remeasurements as well as other transaction gains and losses are reported in Other income, net, in the consolidated statements of income. Our subsidiaries that utilize foreign currency as their functional currency translate such currency into U.S. dollars using (i) the exchange rate on the balance sheet dates for assets and liabilities, and (ii) the average exchange rates prevailing during the year for revenues and expenses. Any translation adjustments resulting from this process are shown separately as a component of accumulated other comprehensive income (loss) within shareholders’ equity in the consolidated balance sheets.
Use of Estimates
The preparation of financial statements in accordance with United States generally accepted accounting principles, or GAAP, requires management to make estimates and assumptions that affect the reported amounts of assets and liabilities at the dates of the financial statements and the reported amounts of total net revenue and expenses in the reporting periods. We regularly evaluate estimates and assumptions related to revenue recognition, rebates, allowances for doubtful accounts, sales returns and allowances, warranty obligations, inventory valuation, goodwill and long-lived intangible asset valuations, deferred income tax asset valuation allowances, uncertain tax positions, tax contingencies, stock-based compensation expense, restructuring costs or reversals, litigation and other loss contingencies, gains and losses on sale of assets, strategic investments and self-insurance. These estimates and assumptions are based on current facts, historical experience and various other factors that we believe to be reasonable under the circumstances, the results of which form the basis for making judgments about the carrying values of assets and liabilities and the recording of revenue, costs and expenses that are not readily apparent from other sources. The actual results we experience may differ materially and adversely from our estimates. To the extent there are material differences between the estimates and actual results, our future results of operations will be affected.
Revenue Recognition
We derive revenue principally from sales of integrated circuit products, royalties and license fees for our intellectual property and software and related services. The timing of revenue recognition and the amount of revenue actually recognized for each arrangement depends upon a variety of factors, including the specific terms of
F-8
each arrangement and the nature of our deliverables and obligations. Determination of the appropriate amount of revenue recognized involves judgment and estimates that we believe are reasonable, but actual results may differ. We recognize product revenue when all of the following criteria are met: (i) persuasive evidence of an arrangement exists, (ii) delivery has occurred, (iii) the price to the customer is fixed or determinable, and (iv) collection of the resulting receivable is reasonably assured. These criteria are usually met at the time of product shipment. However, we do not recognize revenue when any future performance obligations remain. We record reductions of revenue for estimated product returns and pricing adjustments, such as competitive pricing programs and rebates, in the same period that the related revenue is recorded. The amount of these reductions is based on historical sales returns, analysis of credit memo data, specific criteria included in rebate agreements, and other factors known at the time. We accrue 100% of potential rebates at the time of sale and do not apply a breakage factor. We reverse the accrual for unclaimed rebate amounts as specific rebate programs contractually end and when we believe unclaimed rebates are no longer subject to payment and will not be paid. See Note 2 for a summary of our rebate activity.
Approximately 98.9% of total net revenue relates to sales of integrated circuit products, and do not relate to multiple element arrangements.
Distributor Revenue
A portion of our product sales is made through distributors under agreements allowing for pricing credits and/or rights of return. These pricing credits and/or right of return provisions prevent us from being able to reasonably estimate the final price of the inventory to be sold and the amount of inventory that could be returned pursuant to these agreements. As a result, the fixed and determinable revenue recognition criterion has not been met at the time we deliver products to our distributors. Accordingly, product revenue from sales made through these distributors is not recognized until the distributors ship the product to their customers.
Software, Royalties and Cancellation Fee Revenue
Revenue from software licenses is recognized when all of the software revenue recognition criteria are met and, if applicable, when vendor specific objective evidence, or VSOE, exists to allocate the total license fee to each element of multiple-element software arrangements, including post-contract customer support. Post-contract support is recognized ratably over the support period. When a contract contains multiple elements wherein the only undelivered element is post-contract customer support and VSOE of the fair value of post-contract customer support does not exist, revenue from the entire arrangement is recognized ratably over the support period. Software royalty revenue is recognized in arrears on a quarterly basis, based upon reports received from licensees during the period, unless collectability is not reasonably assured, in which case revenue is recognized when payment is received from the licensee. Revenue from cancellation fees is recognized when cash is received from the customer.
Licensing Revenue
We license or otherwise provide rights to use portions of our intellectual property, which includes certain patent rights essential to and/or utilized in the manufacture and sale of certain wireless products. Licensees typically pay a license fee in one or more installments and ongoing royalties based on their sales of products incorporating or using our licensed intellectual property. License fees are recognized over the estimated period of benefit to the licensee or the term specified. We recognize licensing revenue on the sale of patents when all of the following criteria are met: (i) persuasive evidence of an arrangement exist, (ii) delivery has occurred, (iii) the price to be paid by the purchaser is fixed or determinable and (iv) collection of the resulting accounts receivable is reasonably assured. These criteria are usually met at the time of patent transfer. We recognize royalty revenues based on royalties reported by licensees and when other revenue recognition criteria are met, which is generally a quarter in arrears from the period earned.
Income from the Qualcomm Agreement
On April 26, 2009, we entered into a four-year Settlement and Patent License and Non-Assert Agreement, or the Qualcomm Agreement, with Qualcomm. The Qualcomm Agreement was a multiple element arrangement which
F-9
included: (i) an exchange of intellectual property rights, including in certain circumstances, by a series of covenants not to assert claims of patent infringement under future patents issued within one to four years of the execution date of the agreement, (ii) the assignment of certain existing patents by Broadcom to Qualcomm with Broadcom retaining a royalty-free license under these patents, and (iii) the settlement of all outstanding litigation and claims between Broadcom and Qualcomm. The total proceeds of $891 million from the Qualcomm Agreement were allocated amongst the principal elements of the transaction, resulting in $826 million of deferred income, which was recognized over the four year performance period of the agreement. Net revenue includes income from the Qualcomm Agreement of $86 million and $186 million in the years December 31, 2013 and 2012, respectively. The income from the Qualcomm Agreement terminated in April 2013, however, the term of the Qualcomm Agreement will continue until the expiration of the last to expire of the covered patents.
Deferred Revenue and Income
We defer revenue and income when advance payments are received from customers before performance obligations have been completed and/or services have been performed. Deferred revenue does not include amounts from products delivered to distributors that the distributors have not yet sold through to their end customers.
Cost of Revenue
Cost of revenue comprises the cost of our semiconductor devices, which consists of the cost of purchasing finished silicon wafers manufactured by independent foundries, costs associated with our purchase of assembly, test and quality assurance services and packaging materials for semiconductor products, as well as royalties paid to vendors for use of their technology. Also included in cost of revenue is the amortization of purchased technology, and manufacturing overhead, including costs of personnel and equipment associated with manufacturing support, product warranty costs, provisions for excess and obsolete inventories, and stock-based compensation expense for personnel engaged in manufacturing support.
Concentration of Credit Risk
Sales to our recurring customers are generally made on open account while sales to occasional customers are typically made on a prepaid or letter of credit basis. We perform periodic credit evaluations of our recurring customers and generally do not require collateral. An allowance for doubtful accounts is maintained for potential credit losses, which losses historically have not been significant.
We invest our cash in U.S. Treasury and agency obligations, bank and time deposits and money market funds with major financial institutions and in corporate bonds, commercial paper and asset-backed securities. We place our cash investments in instruments that meet high credit quality standards, as specified in our investment policy guidelines. These guidelines also limit the amount of credit exposure to any one issue, issuer or type of instrument. It is generally our policy to invest in instruments that have a final maturity of no longer than three years, with a portfolio weighted average maturity of no longer than 18 months.
Fair Value of Financial Instruments
Our financial instruments consist principally of cash and cash equivalents, short- and long-term marketable securities, accounts receivable, accounts payable and long-term debt. The fair value of a financial instrument is the amount that would be received in an asset sale or paid to transfer a liability in an orderly transaction between unaffiliated market participants. Assets and liabilities measured at fair value are categorized based on whether or not the inputs are observable in the market and the degree that the inputs are observable. The categorization of financial instruments within the valuation hierarchy is based upon the lowest level of input that is significant to the fair value measurement. The hierarchy is prioritized into three levels (with Level 3 being the lowest) defined as follows:
Level 1: Inputs are based on quoted market prices for identical assets or liabilities in active markets at the measurement date.
F-10
Level 2:Inputs include quoted prices for similar assets or liabilities in active markets and/or quoted prices for identical or similar assets or liabilities in markets that are not active near the measurement date.
Level 3:Inputs include management’s best estimate of what market participants would use in pricing the asset or liability at the measurement date. The inputs are unobservable in the market and significant to the instrument’s valuation.
The fair value of our cash equivalents and certain marketable securities was determined based on “Level 1” inputs. The fair value of certain marketable securities and our long-term debt were determined based on “Level 2” inputs. The valuation techniques used to measure the fair value of our “Level 2” instruments were valued based on quoted market prices or model driven valuations using significant inputs derived from or corroborated by observable market data. We do not have any marketable securities in the “Level 3” category. We believe that the recorded values of all our other financial instruments approximate their current fair values because of their nature and respective relatively short maturity dates or durations.
Cash, Cash Equivalents and Marketable Securities
We consider all highly liquid investments that are readily convertible into cash and have a maturity of three months or less at the time of purchase to be cash equivalents. The cost of these investments approximates their fair value. We maintain an investment portfolio of various security holdings, types and maturities. We define marketable securities as income yielding securities that can be readily converted into cash. Marketable securities’ short-term and long-term classifications are based on remaining maturities at each reporting period. Examples of marketable securities include U.S. Treasury and agency obligations, commercial paper, asset-back securities and corporate bonds. We place our cash investments in instruments that meet various parameters, including credit quality standards as specified in our investment policy. We do not use derivative financial instruments.
We account for our investments in debt instruments as available-for-sale. Management determines the appropriate classification of such securities at the time of purchase and re-evaluates such classification as of each balance sheet date. Cash equivalents and marketable securities are reported at fair value with the related unrealized gains and losses included in accumulated other comprehensive income (loss), a component of shareholders’ equity, net of tax. We assess whether our investments with unrealized loss positions are other than temporarily impaired. Unrealized gains and losses and declines in value judged to be other than temporary are determined based on the specific identification method and are reported in other income, net in the consolidated statements of income.
Allowance for Doubtful Accounts
We evaluate the collectibility of accounts receivable based on a combination of factors. In cases where we are aware of circumstances that may impair a specific customer’s ability to meet its financial obligations subsequent to the original sale, we will record an allowance against amounts due, and thereby reduce the net recognized receivable to the amount we reasonably believe will be collected. For all other customers, we recognize allowances for doubtful accounts based on the length of time the receivables are past due, industry and geographic concentrations, the current business environment and our historical experience.
Inventory
Inventory consists of work in process and finished goods and is stated at the lower of cost (first-in, first-out) or market. We write down the carrying value of our inventory to net realizable value for estimated obsolescence or unmarketable inventory in an amount equal to the difference between the cost of inventory and its estimated realizable value based upon assumptions about future demand and market conditions, among other factors. Shipping and handling costs are classified as a component of cost of product revenue in the consolidated statements of income. Inventory acquired through business combinations is recorded at its acquisition date fair value which is the net realizable value less a normal profit margin depending on the stage of inventory completion.
F-11
Property and Equipment
Property and equipment are carried at cost. Depreciation and amortization are provided using the straight-line method over the assets’ estimated remaining useful lives, ranging from one to ten years. Depreciation and amortization of leasehold improvements are computed using the shorter of the remaining lease term or ten years.
Goodwill and Other Long-Lived Assets
Goodwill is recorded as the difference, if any, between the aggregate consideration paid for an acquisition and the fair value of the acquired net tangible and intangible assets. Other long-lived assets primarily represent purchased intangible assets including developed technology, customer relationships and in-process research and development, or IPR&D. We currently amortize our intangible assets using a method that reflects the pattern in which the economic benefits of the intangible assets are consumed or otherwise used or, if that pattern cannot be reliably determined, using a straight-line amortization method. We capitalize IPR&D projects acquired as part of a business combination. On completion of each project, IPR&D assets are reclassified to developed technology and amortized over their estimated useful lives.
Impairment of Goodwill and Other Long-Lived Assets
We evaluate goodwill on an annual basis in the fourth quarter or more frequently if we believe indicators of impairment exist. We first assess qualitative factors to determine whether it is more likely than not that the fair value of a reporting unit is less than its carrying amount. If we conclude that it is more likely than not that the fair value of a reporting units is less than its carrying amount, we conduct a two-step quantitative goodwill impairment test. The first step of the impairment test involves comparing the fair values of the applicable reporting units with their carrying values. We estimate the fair values of our reporting units using a combination of the income and market approach. If the carrying amount of a reporting unit exceeds the reporting unit’s fair value, we perform the second step of the goodwill impairment test. The second step of the goodwill impairment test involves comparing the implied fair value of the affected reporting unit’s goodwill with the carrying value of that goodwill. The amount, by which the carrying value of the goodwill exceeds its implied fair value, if any, is recognized as an impairment loss.
During development, IPR&D is not subject to amortization and is tested for impairment annually or more frequently if events or changes in circumstances indicate that the asset might be impaired. We first assess qualitative factors to determine whether it is more likely than not that the fair value of IPR&D is less than its carrying amount, and if so, we conduct a quantitative impairment test. The impairment test consists of a comparison of the fair value to its carrying amount. If the carrying value exceeds its fair value, an impairment loss is recognized in an amount equal to that excess. Once an IPR&D project is complete, it becomes a definite lived intangible asset and is evaluated for impairment in accordance with our policy for long-lived assets.
We test long-lived assets and purchased intangible assets (other than goodwill and IPR&D) for impairment if we believe indicators of impairment exist. We determine whether the carrying value of an asset or asset group is recoverable, based on comparisons to undiscounted expected future cash flows that the assets are expected to generate. If an asset is not recoverable, we record an impairment loss equal to the amount by which the carrying value of the asset exceeds its fair value. We primarily use the income valuation approach to determine the fair value of our long lived assets and purchased intangible assets.
Warranty
Our products typically carry a one to three year warranty. We establish reserves for estimated product warranty costs at the time revenue is recognized based upon our historical warranty experience, and additionally for any known product warranty issues. If actual costs differ from our initial estimates, we record the difference in the period they are identified. Actual claims are charged against the warranty reserve. See Note 2 for a summary of our warranty activity.
F-12
Guarantees and Indemnifications
In some agreements to which we are a party, we have agreed to indemnify the other party for certain matters, including, but not limited to product liability. We include intellectual property indemnification provisions in our standard terms and conditions of sale for our products and have also included such provisions in certain agreements with third parties. We have and will continue to evaluate and provide reasonable assistance for these other parties. This may include certain levels of financial support to minimize the impact of the litigation in which the other parties are involved. In connection with our senior unsecured notes, as described below, we have agreed to customary indemnification provisions with the underwriters. To date, there have been no known events or circumstances that have resulted in any material costs related to these indemnification provisions and no liabilities therefor have been recorded in the accompanying consolidated financial statements. However, the maximum potential amount of the future payments we could be required to make under these indemnification obligations could be significant.
We have obligations to indemnify certain of our present and former directors, officers and employees to the maximum extent not prohibited by law. Under these obligations, Broadcom is required (subject to certain exceptions) to indemnify each such director, officer and employee against expenses, including attorneys’ fees, judgments, fines and settlements, paid by such individual. The potential amount of the future payments we could be required to make under these indemnification obligations could be significant. We maintain directors’ and officers’ insurance policies that may generally limit our exposure and enable us to recover a portion of the amounts paid with respect to such obligations.
Income Taxes
We utilize the asset and liability method of accounting for income taxes, under which deferred taxes are determined based on the temporary differences between the financial statement and tax basis of assets and liabilities using tax rates expected to be in effect during the years in which the basis differences reverse. We record a valuation allowance to reduce our deferred tax assets to the amount that we believe is more likely than not to be realized. In assessing the need for a valuation allowance, we consider all positive and negative evidence, including scheduled reversals of deferred tax liabilities, projected future taxable income, tax planning strategies, and recent financial performance. Forming a conclusion that a valuation allowance is not required is difficult when there is negative evidence such as cumulative losses in recent years. As a result of our cumulative losses in the U.S. and certain foreign jurisdictions, our U.S. tax losses after tax deductions for stock-based compensation, and the full utilization of our loss carryback opportunities, we have concluded that a full valuation allowance against our net deferred tax assets is appropriate in the U.S. and certain foreign jurisdictions. In certain other foreign jurisdictions where we do not have cumulative losses, we record valuation allowances to reduce our net deferred tax assets to the amount we believe is more likely than not to be realized. In certain jurisdictions, we have tax deductions from stock-based compensation that exceed the stock-based compensation recorded for such instruments. To the extent such excess tax benefits are ultimately realized, they will increase shareholders’ equity. We utilize the with-and-without approach in determining if and when such excess tax benefits are realized, and under this approach excess tax benefits related to stock-based compensation are the last to be realized.
Income tax positions must meet a more-likely-than-not recognition threshold to be recognized. Income tax positions that previously failed to meet the more-likely-than-not threshold are recognized in the first subsequent financial reporting period in which that threshold is met. Previously recognized tax positions that no longer meet the more-likely-than-not threshold are derecognized in the first subsequent financial reporting period in which that threshold is no longer met. We recognize potential accrued interest and penalties related to unrecognized tax benefits within the consolidated statements of income as income tax expense.
Research and Development Expense
Research and development expenditures are expensed in the period incurred.
F-13
Stock-Based Compensation
Broadcom has in effect stock incentive plans under which incentive stock options have been granted to employees and restricted stock units and non-qualified stock options have been granted to employees and non-employee members of the Board of Directors. We also have an employee stock purchase plan for all eligible employees. We are required to estimate the fair value of share-based awards on the date of grant. The value of the award is principally recognized as an expense ratably over the requisite service periods. The fair value of our restricted stock units is based on the closing market price of our Class A common stock on the date of grant less our expected dividend yield. We have estimated the fair value of stock options and stock purchase rights as of the date of grant or assumption using the Black-Scholes option pricing model, which was developed for use in estimating the value of traded options that have no vesting restrictions and that are freely transferable. The Black-Scholes model considers, among other factors, the expected life of the award, the expected volatility of our stock price and the expected dividend yield. We evaluate the assumptions used to value stock options and stock purchase rights on a quarterly basis. The fair values generated by the Black-Scholes model may not be indicative of the actual fair values of our equity awards, as it does not consider other factors important to those awards to employees, such as continued employment, periodic vesting requirements and limited transferability.
Litigation and Settlement Costs
Legal costs are expensed as incurred. We are involved in disputes, litigation and other legal actions in the ordinary course of business. We continually evaluate uncertainties associated with litigation and record a charge equal to at least the minimum estimated liability for a loss contingency when both of the following conditions are met: (i) information available prior to issuance of the financial statements indicates that it is probable that an asset had been impaired or a liability had been incurred at the date of the financial statements and (ii) the loss or range of loss can be reasonably estimated. In the event of settlement discussions, this generally occurs when an agreement in principle has been reached by both parties that includes substantive terms, conditions and amounts. If a settlement has more than one element, we account for the agreement as a multiple element arrangement and allocate the consideration to the identifiable elements based on relative fair value. Past multiple element settlement agreements have included the licensing of intellectual property for future use and payments related to alleged prior infringement.
We use a relief-from-royalty method to value patented technology in settlement agreements related to alleged patent infringement, based on market royalties for similar fundamental technologies. The relief-from-royalty method estimates the cost savings that accrue to the owner of an intangible asset that would otherwise be payable as royalties or license fees on revenues earned through the use of the asset. The royalty rate used is based on an analysis of empirical, market-derived royalty rates for guideline intangible assets. Revenue is projected over the expected remaining useful life of the patented technology, or the license period if shorter. The market-derived royalty rate is then applied to estimate the royalty stream related to past revenue over the applicable alleged infringement period as well as projected revenue. We then allocate the consideration transferred to the identifiable elements based on relative fair value of the past and future royalties. The portion that is attributed to payments related to alleged prior infringement is recorded as a charge to our consolidated statements of income. The remaining portion is attributed to the licensing of intellectual property for future use and is amortized to cost of revenue using a method that reflects the pattern in which the economic benefits of the intangible asset are consumed or otherwise used or, if that pattern cannot be reliably determined, using a straight-line amortization method.
Self-Insurance
We are self-insured for certain healthcare benefits provided to our U.S. employees. The liability for the self-insured benefits is limited by the purchase of stop-loss insurance. Our stop-loss coverage provides payment for aggregate claims exceeding $0.3 million per covered person for any given year.
Accruals for losses are made based on our claim experience and actuarial estimates based on historical data. Actual losses may differ from accrued amounts. Should actual losses exceed the amounts expected and if the recorded liabilities are insufficient, an additional expense will be recorded.
F-14
Accumulated Comprehensive Income (Loss)
Accumulated other comprehensive loss on the consolidated balance sheets at December 31, 2014 and 2013 represents accumulated translation adjustments and unrecognized gains and losses on investments classified as available for sale. As of December 31, 2014, accumulated translation adjustments and unrecognized losses on investments classified as available for sale were $87 million and $2 million, respectively.
Net Income Per Share
Net income per share (basic) is calculated by dividing net income by the weighted average number of common shares outstanding during the year. Net income per share (diluted) is calculated by adjusting outstanding shares, assuming any dilutive effects of stock incentive awards calculated using the treasury stock method. Under the treasury stock method, an increase in the fair market value of our Class A common stock results in a greater dilutive effect from outstanding stock options, stock purchase rights and restricted stock units. Additionally, the exercise of employee stock options and stock purchase rights and the vesting of restricted stock units results in a further dilutive effect on net income per share.
Recent Accounting Pronouncements
In May 2014 the Financial Accountings Standards Board issued Accounting Standards Update No. 2014-09, Revenue from Contracts with Customers, or ASU 2014-09, which requires an entity to recognize the amount of revenue to which it expects to be entitled for the transfer of promised goods or services to customers. The standard will replace most existing revenue recognition guidance in U.S. GAAP when it becomes effective. The new standard is effective for us on January 1, 2017. Early application is not permitted. The standard permits the use of either the retrospective or cumulative effect transition method. We are evaluating the effect that ASU 2014-09 will have on our consolidated financial statements and related disclosures. We have not yet selected a transition method nor have we determined the effect of the standard on our ongoing financial reporting.
2. Supplemental Financial Information
Net Revenue
The following table presents details of our net revenue:
Year Ended December 31, | ||||||||
2014 | 2013 | 2012 | ||||||
Sales through direct sales force | 71.0 | % | 76.3 | % | 77.8 | % | ||
Sales under fulfillment distributor arrangements | 8.5 | 6.5 | 6.1 | |||||
Sales through distributors | 20.5 | 17.2 | 16.1 | |||||
100.0 | % | 100.0 | % | 100.0 | % | |||
Inventory
The following table presents details of our inventory:
December 31, | |||||||
2014 | 2013 | ||||||
(In millions) | |||||||
Work in process | $ | 180 | $ | 202 | |||
Finished goods | 351 | 323 | |||||
$ | 531 | $ | 525 | ||||
F-15
Property and Equipment
The following table presents details of our property and equipment:
December 31, | |||||||||
Useful Life | 2014 | 2013 | |||||||
(In years) | (In millions) | ||||||||
Leasehold improvements | 1 to 10 | $ | 237 | $ | 248 | ||||
Office furniture and equipment | 3 to 7 | 43 | 45 | ||||||
Machinery and equipment | 5 | 553 | 725 | ||||||
Computer software and equipment | 2 to 10 | 234 | 232 | ||||||
Construction in progress | N/A | 147 | 54 | ||||||
1,214 | 1,304 | ||||||||
Less accumulated depreciation and amortization | (698 | ) | (711 | ) | |||||
$ | 516 | $ | 593 | ||||||
Accrued Liabilities
The following table presents details of our accrued liabilities included in current liabilities:
December 31, | |||||||
2014 | 2013 | ||||||
(In millions) | |||||||
Accrued rebates | $ | 574 | $ | 409 | |||
Accrued royalties | 19 | 15 | |||||
Accrued settlement charges | 17 | 66 | |||||
Accrued legal costs | 10 | 15 | |||||
Accrued taxes | 28 | 20 | |||||
Warranty reserve | 6 | 19 | |||||
Restructuring liabilities | 28 | 17 | |||||
Other | 109 | 86 | |||||
$ | 791 | $ | 647 | ||||
Other Long-Term Liabilities
The following table presents details of our other long-term liabilities:
December 31, | |||||||
2014 | 2013 | ||||||
(In millions) | |||||||
Deferred revenue | $ | 105 | $ | 33 | |||
Accrued taxes | 77 | 72 | |||||
Deferred rent | 38 | 46 | |||||
Deferred tax liabilities | 17 | 35 | |||||
Accrued settlement charges | 17 | 25 | |||||
Other long-term liabilities | 23 | 23 | |||||
$ | 277 | $ | 234 | ||||
F-16
Accrued Rebate Activity
The following table summarizes the activity related to accrued rebates:
Year Ended December 31, | |||||||
2014 | 2013 | ||||||
(In millions) | |||||||
Beginning balance | $ | 409 | $ | 383 | |||
Charged as a reduction of revenue | 881 | 888 | |||||
Reversal of unclaimed rebates | (33 | ) | (21 | ) | |||
Payments | (683 | ) | (841 | ) | |||
Ending balance | $ | 574 | $ | 409 | |||
Warranty Reserve Activity
The following table summarizes activity related to the warranty reserve:
Year Ended December 31, | |||||||
2014 | 2013 | ||||||
(In millions) | |||||||
Beginning balance | $ | 19 | $ | 13 | |||
Charged to costs and expenses | 4 | 12 | |||||
Payments | (17 | ) | (6 | ) | |||
Ending balance | $ | 6 | $ | 19 | |||
Other Charges (Gains), Net
In March 2014 we sold certain Ethernet controller-related assets and provided non-exclusive licenses to intellectual property, including a non-exclusive patent license, to QLogic Corporation for a total of $209 million, referred to as the QLogic Transaction. The transaction was accounted for as a multiple element arrangement, which primarily included (i) the sale of certain assets (constituting a business for accounting purposes), (ii) the licensing of certain intellectual property, and (iii) a long-term supply agreement. In connection with the transaction, we recorded a gain on the sale of assets of $48 million (net of a goodwill adjustment of $37 million) and deferred revenue of $120 million. The revenue related to the license agreement ($76 million) and the supply agreement ($44 million) will be amortized over approximately seven years. The operating gain was recorded in “Other charges (gains), net” included in our consolidated statements of income in 2014.
In determining the fair value of the license agreement, we used the relief from royalty income approach, as well as a market approach utilizing another transaction that we had previously entered into for the same intellectual property, adjusted for changes in the market and other assumptions since that transaction. The supply agreement was valued utilizing the cost savings income approach. The relief from royalty income and cost saving income approaches employ significant unobservable inputs categorized as Level 3 inputs. The key unobservable inputs utilized include discount rates of approximately 13% to 15%, a market participant tax rate of 17%, and estimated level of future volumes and pricing based on current product and market data.
The adjustment to goodwill due to the QLogic Transaction was calculated by determining the value of the business sold in relation to the value of the Infrastructure and Networking reportable segment. The value of the business sold was determined utilizing the residual method.
F-17
In April 2009 we established the Broadcom Foundation to support science, technology, engineering and mathematics programs, as well as a broad range of community services. In September 2013 we contributed an additional $25 million to the Broadcom Foundation. This payment was recorded in “Other charges (gains), net” in our statement of income in 2013.
Computation of Net Income Per Share
The following table presents the computation of net income per share:
Year Ended December 31, | |||||||||||
2014 | 2013 | 2012 | |||||||||
(In millions, except per share data) | |||||||||||
Numerator: Net income | $ | 652 | $ | 424 | $ | 719 | |||||
Denominator for net income per share (basic) | 590 | 574 | 558 | ||||||||
Effect of dilutive securities: | |||||||||||
Stock awards | 11 | 10 | 18 | ||||||||
Denominator for net income per share (diluted) | 601 | 584 | 576 | ||||||||
Net income per share (basic) | $ | 1.11 | $ | 0.74 | $ | 1.29 | |||||
Net income per share (diluted) | $ | 1.08 | $ | 0.73 | $ | 1.25 | |||||
Net income per share (diluted) does not include the effect of anti-dilutive common share equivalents resulting from outstanding equity awards. There were 9 million, 39 million and 23 million anti-dilutive common share equivalents in 2014, 2013 and 2012, respectively.
Supplemental Cash Flow Information
In 2014 and 2013, we received $1 million in both years, related to stock option exercises that had not settled by December 31, 2013 and 2012, respectively. We had $1 million related to stock options exercises that had not settled by December 31, 2014.
At December 31, 2014, 2013 and 2012 we had billings of $22 million, $29 million and $29 million, respectively, for capital equipment that were accrued. The amounts accrued for capital equipment purchases have been excluded from the consolidated statements of cash flows and were paid in the subsequent period. In both 2014 and 2013 we also capitalized $3 million of stock-based compensation expense and $2 million in interest expense in 2014, for construction in process related to computer software and equipment.
In connection with the cash paid for acquisitions, we acquired assets (net of cash) with a fair value of $14 million, $178 million and $3.97 billion in 2014, 2013 and 2012, respectively, and assumed liabilities with a fair value of $36 million and $253 million in 2013 and 2012, respectively. In addition to the above, as part of the acquisition of NetLogic Microsystems, Inc., or NetLogic, in 2012, we assumed equity awards with a fair value of $349 million, of which $137 million was recorded as goodwill.
F-18
3. | Fair Value Measurements |
Instruments Measured at Fair Value on a Recurring Basis. The following tables present our cash and marketable securities’ costs, gross unrealized gains, gross unrealized losses and fair value by major security type recorded as cash and cash equivalents or short-term or long-term marketable securities:
December 31, 2014 | |||||||||||||||||||||||||||
Cost | Gross Unrealized Gains | Gross Unrealized Losses | Fair Value | Cash and Cash Equivalents | Short-Term Marketable Securities | Long-Term Marketable Securities | |||||||||||||||||||||
(In millions) | |||||||||||||||||||||||||||
Cash | $ | 659 | $ | — | $ | — | $ | 659 | $ | 659 | $ | — | $ | — | |||||||||||||
Level 1: | |||||||||||||||||||||||||||
Bank and time deposits | 943 | — | — | 943 | 943 | — | — | ||||||||||||||||||||
Money market funds | 83 | — | — | 83 | 83 | — | — | ||||||||||||||||||||
U.S. treasury and agency obligations | 1,434 | — | (1 | ) | 1,433 | 12 | 192 | 1,229 | |||||||||||||||||||
Subtotal | 2,460 | — | (1 | ) | 2,459 | 1,038 | 192 | 1,229 | |||||||||||||||||||
Level 2: | |||||||||||||||||||||||||||
Commercial paper | 800 | — | — | 800 | 798 | 2 | — | ||||||||||||||||||||
Corporate bonds | 1,931 | 1 | (2 | ) | 1,930 | 50 | 859 | 1,021 | |||||||||||||||||||
Asset-backed securities and other | 141 | — | — | 141 | — | 8 | 133 | ||||||||||||||||||||
Subtotal | 2,872 | 1 | (2 | ) | 2,871 | 848 | 869 | 1,154 | |||||||||||||||||||
Level 3: None | — | — | — | — | — | — | — | ||||||||||||||||||||
Total | $ | 5,991 | $ | 1 | $ | (3 | ) | $ | 5,989 | $ | 2,545 | $ | 1,061 | $ | 2,383 | ||||||||||||
December 31, 2013 | |||||||||||||||||||||||||||
Cost | Gross Unrealized Gains | Gross Unrealized Losses | Fair Value | Cash and Cash Equivalents | Short-Term Marketable Securities | Long-Term Marketable Securities | |||||||||||||||||||||
(In millions) | |||||||||||||||||||||||||||
Cash | $ | 307 | $ | — | $ | — | $ | 307 | $ | 307 | $ | — | $ | — | |||||||||||||
Level 1: | |||||||||||||||||||||||||||
Bank and time deposits | 474 | — | — | 474 | 474 | — | — | ||||||||||||||||||||
Money market funds | 277 | — | — | 277 | 277 | — | — | ||||||||||||||||||||
U.S. treasury and agency obligations | 1,005 | 1 | — | 1,006 | — | 205 | 801 | ||||||||||||||||||||
Subtotal | 1,756 | 1 | — | 1,757 | 751 | 205 | 801 | ||||||||||||||||||||
Level 2: | |||||||||||||||||||||||||||
Commercial paper | 690 | — | — | 690 | 599 | 91 | — | ||||||||||||||||||||
Corporate bonds | 1,591 | 3 | (1 | ) | 1,593 | — | 477 | 1,116 | |||||||||||||||||||
Asset-backed securities and other | 24 | — | — | 24 | — | 2 | 22 | ||||||||||||||||||||
Subtotal | 2,305 | 3 | (1 | ) | 2,307 | 599 | 570 | 1,138 | |||||||||||||||||||
Level 3: None | — | — | — | — | — | — | — | ||||||||||||||||||||
Total | $ | 4,368 | $ | 4 | $ | (1 | ) | $ | 4,371 | $ | 1,657 | $ | 775 | $ | 1,939 | ||||||||||||
There were no transfers between Level 1, Level 2 or Level 3 securities in 2014. All of our long-term marketable securities had maturities of between one and three years in duration at December 31, 2014. Our cash, cash equivalents and marketable securities at December 31, 2014 consisted of $2.86 billion held domestically, with
F-19
the remaining balance of $3.13 billion held by our foreign subsidiaries.
At December 31, 2014, we had 307 investments with a fair value of $2.38 billion that were in an unrealized loss position for less than 12 months. Our gross unrealized losses of $3 million for these investments at December 31, 2014 were due to changes in market rates. We have determined that the gross unrealized losses on these investments at December 31, 2014 are temporary in nature. We evaluate securities for other-than-temporary impairment on a quarterly basis. Impairment is evaluated considering numerous factors, and their relative significance varies depending on the situation. Factors considered include the length of time and extent to which fair value has been less than the cost basis, the financial condition and near-term prospects of the issuer, and our intent and ability to hold the investment in order to allow for an anticipated recovery in fair value.
Instruments Not Recorded at Fair Value on a Recurring Basis. We measure the fair value of our long-term debt carried at amortized cost quarterly for disclosure purposes. The estimated fair value of long-term debt is determined by Level 2 inputs and is based primarily on quoted market prices for the same or similar issues. Based on the market prices, the fair value of our long-term debt was $1.61 billion and $1.37 billion as of December 31, 2014 and 2013, respectively. The recorded values of all our accounts receivable and accounts payable approximate their current fair values because of their nature and respective relatively short maturity dates or durations.
Assets and Liabilities Recorded at Fair Value on a Non-Recurring Basis. We measure the fair value of our cost method investments when they are deemed to be other-than-temporarily impaired, assets acquired and liabilities assumed in a business acquisition, and goodwill and other long lived assets when they are held for sale or determined to be impaired and for license and settlement agreements when they are part of a multiple element arrangement. See Notes 2, 9 and 10 for discussion on fair value measurements of certain assets and liabilities recorded at fair value on a non-recurring basis.
4. | Income Taxes |
For financial reporting purposes, income (loss) before income taxes includes the following components:
Year Ended December 31, | |||||||||||
2014 | 2013 | 2012 | |||||||||
(In millions) | |||||||||||
United States | $ | 11 | $ | (171 | ) | $ | 43 | ||||
Foreign | 656 | 616 | 613 | ||||||||
$ | 667 | $ | 445 | $ | 656 | ||||||
A reconciliation of the provision for (benefit of) income taxes at the federal statutory rate compared to our provision for income taxes follows:
Year Ended December 31, | |||||||||||
2014 | 2013 | 2012 | |||||||||
(In millions) | |||||||||||
Statutory federal provision for income taxes | $ | 234 | $ | 156 | $ | 230 | |||||
Increase (decrease) in taxes resulting from: | |||||||||||
Tax credits | (107 | ) | (240 | ) | — | ||||||
Federal valuation allowance changes | 96 | 207 | (552 | ) | |||||||
Tax rate differential on foreign earnings | (215 | ) | (190 | ) | (281 | ) | |||||
Stock-based compensation expense | (46 | ) | 20 | — | |||||||
Goodwill adjustment | 13 | — | — | ||||||||
Foreign dividend distribution | — | — | 538 | ||||||||
Audit settlements and adjustments | 20 | 23 | — | ||||||||
Other | 20 | 45 | 2 | ||||||||
Provision for (benefit of) income taxes | $ | 15 | $ | 21 | $ | (63 | ) | ||||
F-20
The income tax provision (benefit) consists of the following components:
Year Ended December 31, | |||||||||||
2014 | 2013 | 2012 | |||||||||
(In millions) | |||||||||||
Current: | |||||||||||
Federal | $ | — | $ | (2 | ) | $ | (4 | ) | |||
State | — | (1 | ) | 2 | |||||||
Foreign | 41 | 29 | 32 | ||||||||
41 | 26 | 30 | |||||||||
Deferred: | |||||||||||
Federal | 1 | 2 | (50 | ) | |||||||
State | (1 | ) | 1 | (1 | ) | ||||||
Foreign | (26 | ) | (8 | ) | (42 | ) | |||||
(26 | ) | (5 | ) | (93 | ) | ||||||
$ | 15 | $ | 21 | $ | (63 | ) | |||||
Deferred income taxes reflect the net tax effects of temporary differences between the carrying amounts of assets and liabilities for financial reporting purposes and the amounts used for income tax purposes. Significant components of our deferred taxes were as follows:
December 31, | |||||||
2014 | 2013 | ||||||
(In millions) | |||||||
Deferred tax assets: | |||||||
Research and development and foreign tax credits | $ | 1,190 | $ | 1,062 | |||
Capitalized research and development costs | 49 | 77 | |||||
Net operating loss carryforwards | 100 | 78 | |||||
Reserves and accruals not currently deductible for tax purposes | 80 | 98 | |||||
Stock-based compensation | 40 | 63 | |||||
Other | 97 | 55 | |||||
Gross deferred tax assets | 1,556 | 1,433 | |||||
Valuation allowance against U.S. deferred tax assets | (1,413 | ) | (1,286 | ) | |||
Valuation allowance against deferred tax assets of certain foreign subsidiaries | (92 | ) | (81 | ) | |||
Valuation allowance | (1,505 | ) | (1,367 | ) | |||
Deferred tax assets, net | 51 | 66 | |||||
Deferred tax liabilities (primarily related to purchased intangible assets) | $ | (49 | ) | $ | (90 | ) | |
Net deferred tax assets (liabilities) | $ | 2 | $ | (24 | ) | ||
As a result of our recent cumulative tax losses in the U.S., which excludes the effect of the 2012 unusual and nonrecurring foreign dividend of approximately $1.5 billion to enable our acquisition of NetLogic in 2012, and our cumulative tax losses in certain foreign jurisdictions, and the full utilization of our loss carryback opportunities, we have concluded that a full valuation allowance should be recorded in such jurisdictions. Our net deferred tax assets primarily relate to certain foreign jurisdictions where we do not have cumulative losses.
Previously, we operated under tax incentives in Singapore, which were effective through March 2014, and were conditional upon our meeting certain employment and investment thresholds. The impact of the Singapore tax incentives decreased Singapore taxes by $131 million, $423 million and $399 million for 2014, 2013 and 2012, respectively. The benefit of the tax incentives on net income per share (diluted) was $0.22, $0.73 and $0.69 for 2014, 2013 and 2012, respectively.
F-21
Our deferred tax assets at December 31, 2014 and 2013 do not include $734 million and $726 million, respectively, of excess tax benefits from stock-based compensation that are a component of our net operating loss carryovers, research and development credits, and capitalized research and development expenses. Shareholders’ equity will be increased by $734 million to the extent such excess tax benefits are ultimately realized.
If and when recognized, the tax benefits relating to any reversal of the valuation allowance on deferred tax assets at December 31, 2014, will be accounted for as follows: approximately $1.49 billion will be recognized as a reduction of income tax expense and $11 million will be recorded as an increase in shareholders’ equity.
At December 31, 2014, we had unused federal net operating loss carryforwards of $1.05 billion expiring between 2019 and 2034, unused state net operating loss carryforwards of $2.05 billion expiring between 2015 and 2034, and unused foreign net operating loss carryforwards of $200 million (of which $188 million relates to the United Kingdom and Israel that do not have expiration dates). A valuation allowance has been provided on substantially all of these loss carryforwards. At December 31, 2014 we had Canada scientific research and experimental development expenditures of $110 million available for tax deduction in future tax years. These future tax deductions can be carried forward indefinitely.
At December 31, 2014, for our income tax filings we had foreign tax credit carryforwards of approximately $100 million, and federal, state and foreign research and development credit carryforwards of approximately $1.07 billion, $894 million and $48 million, respectively. A valuation allowance has been provided on substantially all of these credit carryforwards. These foreign tax credit carryforwards expire between 2016 and 2024, and these research and development credit carryforwards expire between 2019 and 2034, if not previously utilized. Certain state research and development credit carryforwards have no expiration date. No additional federal research and development tax credit was recorded during 2012 because the federal credit had temporarily expired for that year, but the expiration had no effect on previously generated credits. In 2013 the federal research and development tax credit was extended retroactively from January 1, 2012 to December 31, 2013, and in December of 2014 it was extended again for all of 2014. As a result, we recorded no federal research and development tax credits in 2012, in 2013 we recorded federal research and development tax credits for amounts generated in both 2012 and 2013, and in 2014 we recorded research and development tax credits for amounts generated in 2014.
At December 31, 2014, deferred taxes have not been provided on the excess of book basis over tax basis in the amount of approximately $4.85 billion in the shares of certain foreign subsidiaries because their bases differences are not expected to reverse in the foreseeable future and are considered permanent in duration. These bases differences arose primarily through purchase accounting and the undistributed book earnings of foreign subsidiaries that we intend to reinvest indefinitely. The bases differences could reverse through amortization or impairment of certain intangible assets recorded under purchase accounting, a sale of the subsidiaries, the receipt of dividends from the subsidiaries, or various other events. We believe that U.S. income taxes and foreign withholding taxes would be substantially offset upon reversal of this excess book basis due to the existence of net operating loss and tax credit carryforwards.
The following table summarizes the activity related to our unrecognized tax benefits:
Year Ended December 31, | |||||||||||
2014 | 2013 | 2012 | |||||||||
(In millions) | |||||||||||
Beginning balance | $ | 403 | $ | 331 | $ | 212 | |||||
Increase in current year | 54 | 58 | 11 | ||||||||
Expiration of the statutes of limitation for the assessment of taxes | (7 | ) | (6 | ) | (7 | ) | |||||
Decrease resulting from audits | (83 | ) | (20 | ) | — | ||||||
Increase (decrease) related to prior year tax positions | (3 | ) | 40 | — | |||||||
Increase related to acquisitions | — | — | 115 | ||||||||
Ending balance | $ | 364 | $ | 403 | $ | 331 | |||||
F-22
The unrecognized tax benefits of $364 million at December 31, 2014 included $64 million of tax benefits that, if recognized, would reduce our annual effective tax rate. The remaining $300 million, if recognized, would not result in a tax benefit since it would be fully offset with a valuation allowance. As of December 31, 2014, we recorded a liability for potential penalties and interest of $27 million and $6 million, respectively. We recognize potential accrued interest and penalties related to unrecognized tax benefits within the consolidated statements of income as income tax expense. We do not expect our unrecognized tax benefits to change significantly over the next 12 months.
In 2012 we accessed $1.5 billion of cash from our foreign subsidiaries to facilitate the acquisition of NetLogic. This $1.5 billion was treated as includable in our U.S. taxable income for 2012. Nevertheless, this did not result in a significant tax liability for us because it was substantially offset by our net operating loss and tax credit carryforwards. The acquisition of NetLogic was unusual and nonrecurring. The $3.61 billion cash purchase price to acquire NetLogic greatly exceeded the purchase price of any prior cash acquisition we have made. Our previous cash acquisitions have been for significantly lower purchase prices, and we have never previously determined it prudent or necessary to access our prior years’ foreign earnings to facilitate an acquisition. We do not currently expect any future need to access our prior years’ foreign earnings, and therefore, aside from the $1.5 billion used to facilitate the NetLogic acquisition, we intend to continue to permanently reinvest our foreign earnings.
We file federal, state and foreign income tax returns in jurisdictions with varying statutes of limitations. For federal income tax purposes, all years prior to 2010 are closed. The 2007 through 2014 tax years generally remain subject to examination by most state tax authorities. In foreign jurisdictions, the 2004 through 2014 tax years generally remain subject to examination by tax authorities.
On August 1, 2014, the Internal Revenue Service, or IRS, concluded their examination of our income tax returns for 2007 through 2009, and we executed a closing agreement with the IRS covering the 2007 through 2009 tax years, and agreed to certain adjustments for those tax years, primarily related to intercompany transfer pricing transactions. Those audit adjustments were offset by federal net operating losses and credits and did not result in any income tax liability or expense because of our valuation allowance.
5. | Debt and Credit Facility |
Senior Notes
The following table presents details of our senior unsecured notes, or the Notes, as of the dates listed below:
Date | Maturity | Interest | Effective | Issuance | December 31, | ||||||||||||||
Issued | Date | Rate | Yield | Price | 2014 | 2013 | |||||||||||||
(In millions) | |||||||||||||||||||
November 2010 | November 2015 | 2.375 | % | 2.494 | % | 99.444 | % | $ | — | $ | 400 | ||||||||
November 2011 | November 2018 | 2.700 | 2.762 | 99.609 | 500 | 500 | |||||||||||||
August 2012 | August 2022 | 2.500 | 2.585 | 99.255 | 500 | 500 | |||||||||||||
July 2014 | August 2024 | 3.500 | 3.546 | 99.615 | 350 | — | |||||||||||||
July 2014 | August 2034 | 4.500 | 4.546 | 99.400 | 250 | — | |||||||||||||
$ | 1,600 | $ | 1,400 | ||||||||||||||||
Unaccreted discount | (7 | ) | (6 | ) | |||||||||||||||
$ | 1,593 | $ | 1,394 | ||||||||||||||||
In July 2014 we issued senior unsecured notes in an aggregate principal amount of $600 million. In August 2014 we redeemed $400 million principal aggregate amount of our senior notes that were due November 2015, or the 2015 Notes. We used a portion of the net proceeds from the senior unsecured notes issued in July 2014 to redeem the 2015 Notes and intend to use the remaining net proceeds for general corporate purposes. In 2014 we recorded
F-23
$11 million of interest expense, which stemmed from $10 million of premium paid upon redemption of the 2015 Notes and $1 million related to the write-off of related debt issuance costs.
We may redeem the above outstanding Notes at any time prior to their maturity, subject to a specified make-whole premium as defined in the indenture governing the Notes. In the event of a change of control triggering event, each holder of Notes will have the right to require us to purchase for cash all or a portion of their Notes at a redemption price of 101% of the aggregate principal amount of such Notes plus accrued and unpaid interest. Default can be triggered by any missed interest or principal payment, breach of covenant, or in certain events of bankruptcy, insolvency or reorganization.
The outstanding Notes contain a number of customary representations, warranties and restrictive covenants, including, but not limited to, restrictions on our ability to grant liens on assets; enter into sale and lease-back transactions; or merge, consolidate or sell assets. Failure to comply with these covenants, or any other event of default, could result in acceleration of the principal amount and accrued but unpaid interest on the Notes.
The outstanding Notes are recorded net of original issue discount. The discount and debt issuance costs associated with the issuance of the Notes are amortized to interest expense over their respective terms. The effective rates for the fixed-rate debt include the interest on the notes and the accretion of the original issue discount.
Relative to our overall indebtedness, the outstanding Notes rank in right of payment (i) equal with all of our other existing and future senior unsecured indebtedness (ii) senior to all of our existing and future subordinated indebtedness, and (iii) effectively subordinated to all of our subsidiaries’ existing and future indebtedness and other obligations (including secured and unsecured obligations) and subordinated to our existing and future secured indebtedness and other obligations, to the extent of the assets securing such indebtedness and other obligations.
Credit Facility
In November 2010 we entered into a credit facility with certain institutional lenders that provides for unsecured revolving facility loans, swing line loans and letters of credit in an aggregate amount of up to $500 million. We amended this credit facility in July 2014 primarily to extend the maturity date to July 31, 2019, at which time all outstanding revolving facility loans (if any) and accrued and unpaid interest must be repaid. The July 2014 amendment to the credit facility also removed the consolidated interest coverage ratio financial covenant, removed the negative covenants restricting investments and restricted payments, and removed the highest pricing in the pricing grid for determining the interest rate margins applicable to loans made under the credit facility and the commitment fee paid on the amount of the unused commitments. We have not drawn on our credit facility to date.
Loans made under the credit facility (other than swing line loans) bear interest, at our option, at either a Base Rate plus a margin that varies from 0.000% to 0.250% or a Eurodollar Rate plus a margin that varies from 0.625% to 1.250%. Swing line loans under the credit facility bear interest applicable to Base Rate loans. We are also required to pay a commitment fee on any unused commitments at a rate that varies from 0.060% to 0.150% per annum.
We may also, upon the agreement of the existing lenders, increase the commitments under the credit facility by up to an additional $100 million. The credit facility contains customary representations, warranties and covenants. Financial covenants require us to maintain a consolidated leverage ratio of no more than 3.25 to 1.00.
6. | Shareholders’ Equity |
Common Stock
At December 31, 2014, we had 2.5 billion authorized shares of Class A common stock and 400 million authorized shares of Class B common stock. The shares of Class A common stock and Class B common stock are substantially identical, except that holders of Class A common stock are entitled to one vote for each share held, and holders of Class B common stock are entitled to ten votes for each share held, on all matters submitted to a vote of the shareholders. In addition, holders of Class B common stock are entitled to vote separately on the proposed
F-24
issuance of additional shares of Class B common stock in certain circumstances. The shares of Class B common stock are not publicly traded. Each share of Class B common stock is convertible at any time at the option of the holder into one share of Class A common stock and in most instances automatically converts upon sale or other transfer. The Class A common stock and Class B common stock are sometimes collectively referred to herein as “common stock.” In 2014, 2013 and 2012, 1 million, 1 million and 2 million shares, respectively, of Class B common stock were automatically converted into a like number of shares of Class A common stock upon sale or other transfer pursuant to the terms of our Articles of Incorporation.
Quarterly Dividend
In January 2010 our Board of Directors adopted a dividend policy pursuant to which we intend to pay quarterly cash dividends on our common stock. Our Board of Directors declared quarterly cash dividends of $0.12, $0.11, and $0.10 per common share payable to holders of our common stock in each quarter of 2014, 2013 and 2012, respectively. In 2014, 2013 and 2012 we paid $283 million, $254 million and $224 million, respectively, in dividends to holders of our Class A and Class B common stock.
In November 2014 our Board of Directors adopted an amendment to our existing dividend policy pursuant to which we intend to increase the quarterly cash dividend by 17% to $0.14 per share for each quarter of 2015 ($0.56 per share on an annual basis). Pursuant to this plan, on January 28, 2015, we declared a quarterly cash dividend of $0.14 per share.
Share Repurchase Program
In February 2010 we announced that our Board of Directors had authorized an evergreen share repurchase program intended to offset dilution of incremental grants of stock awards associated with our stock incentive plans. The maximum number of shares of our Class A common stock that may be repurchased in any one year under this program (including under an accelerated share repurchase agreement or similar arrangement) is equal to the total number of shares issued pursuant to our equity awards in the previous year and the current year. This program does not have an expiration date and may be suspended at any time at the discretion of the Board of Directors. It may also be complemented with one or more additional share repurchase programs in the future.
Under the evergreen program we repurchased 14.7 million, 20.2 million, and 1.0 million shares of our Class A common stock at a weighted average price of $35.53, $29.59, and $31.91 in 2014, 2013 and 2012, respectively.
In November 2014 our Board of Directors authorized an additional share repurchase program for the repurchase of such number of shares incremental to the number allowed under the evergreen program that would yield a total share repurchase for 2015 of up to $1.00 billion.
Repurchases under our share repurchase programs were and are intended to be made in open market or privately negotiated transactions in compliance with Rule 10b-18 promulgated under the Securities Exchange Act of 1934, as amended. Our share repurchase programs do not obligate us to acquire any particular amount of our stock and may be suspended at any time at our discretion.
Registration Statement
We currently have a Form S-4 acquisition shelf registration statement on file with the SEC. The acquisition shelf registration statement on Form S-4 enables us to issue up to 30 million shares of our Class A common stock in one or more acquisition transactions. These transactions may include the acquisition of assets, businesses or securities by any form of business combination. To date, no securities have been issued pursuant to the S-4 registration statement, which does not have an expiration date mandated by SEC rules.
F-25
7. | Employee Benefit Plans |
Employee Stock Purchase Plan
We have an employee stock purchase plan, or ESPP, for all eligible employees. Under the ESPP, employees may purchase shares of our Class A common stock at six-month intervals at 85% of fair market value (calculated in the manner provided in the plan). Employees purchase such stock using payroll deductions, which may not exceed 15% of their total cash compensation. Shares of Class A common stock are offered under the ESPP through a series of successive offering periods, generally with a maximum duration of 24 months, subject to an additional three-month extension under certain circumstances. The plan imposes certain limitations upon an employee’s right to acquire Class A common stock, including the following: (i) no employee may purchase more than 9,000 shares of Class A common stock on any one purchase date, (ii) no employee may be granted rights to purchase more than $25,000 worth of Class A common stock for each calendar year that such rights are at any time outstanding, and (iii) the maximum number of shares of Class A common stock purchasable in total by all participants in the ESPP on any purchase date is limited to 5 million shares. The number of shares of Class A common stock reserved for issuance under the plan automatically increases in January each year. The increase is equal to 1.25% of the total number of shares of common stock outstanding on the last trading day of the immediately preceding year, subject to an annual share limit.
In 2014, 2013 and 2012, 6 million, 6 million and 5 million shares, respectively, were issued under this plan at average per share prices of $22.89, $24.92, and $28.32, respectively. At December 31, 2014, 19 million shares were available for future issuance under this plan.
The per share fair values of rights granted in connection with the employee stock purchase plan have been estimated with the following weighted average assumptions:
Employee Stock Purchase Rights | |||||||||||
2014 | 2013 | 2012 | |||||||||
Expected life (in years) | 0.88 | 1.60 | 1.43 | ||||||||
Implied volatility | 0.26 | 0.35 | 0.39 | ||||||||
Risk-free interest rate | 0.13 | % | 0.25 | % | 0.23 | % | |||||
Expected dividend yield | 1.51 | % | 1.58 | % | 1.19 | % | |||||
Weighted average fair value | $ | 7.28 | $ | 7.80 | $ | 9.61 | |||||
Stock Incentive Plans
We have in effect stock incentive plans under which incentive stock options have been granted to employees and restricted stock units and non-qualified stock options have been granted to employees and non-employee members of the Board of Directors. Our 2012 Stock Incentive Plan, as amended and restated, or the 2012 Plan, is the successor equity incentive plan to our 1998 Stock Incentive Plan. The number of shares of Class A common stock reserved for issuance under the 2012 Plan automatically increases in January each year. The increase is equal to 4.5% of the total number of shares of common stock outstanding on the last trading day of the immediately preceding year, subject to an annual share limit.
The Board of Directors or the Plan Administrator determines eligibility and vesting schedules for all equity awards granted under the plans and, for stock options, exercise prices. We grant restricted stock units to certain employees as part of our regular annual employee equity compensation review program as well as to selected new hires and to non-employee members of the Board of Directors. Restricted stock units are share awards that entitle the holder to receive freely tradable shares of our Class A common stock upon vesting. Generally, restricted stock units vest ratably on a quarterly basis over 16 quarters from the date of grant. On a limited basis, we grant certain restricted stock units that vest in their entirety after 3 years.
F-26
In January 2011 the Compensation Committee of our Board of Directors adopted a performance restricted stock units program, or the PRSU Program. Under the PRSU Program, if the performance goals established by the Compensation Committee for a specific one-year performance cycle are achieved, our participating executive officers have the opportunity to receive grants of PRSUs (which thereafter vest quarterly over four years following the grant). These grants are at the sole discretion of the Compensation Committee. We granted 0.7 million, 0.6 million, 0.4 million under this program in 2014, 2013 and 2012, respectively. These PRSU grants were included in both the computation of stock-based compensation expense and diluted net income per share.
Beginning in 2011, we stopped granting and currently have no plans to grant stock options, other than in connection with acquisitions and currently have no outstanding stock options that are unvested.
Combined Stock Incentive Plan Activity
Restricted stock unit activity, including PRSU Program awards, is set forth below:
Restricted Stock Units Outstanding | ||||||||||
Number of Shares | Weighted Average Grant-Date Fair Value per Share | Aggregate Intrinsic Value | ||||||||
(In millions, except per share data) | ||||||||||
Balance at December 31, 2011 | 22 | $ | 32.88 | |||||||
Restricted stock units granted | 13 | 35.76 | ||||||||
Restricted stock units assumed | 6 | 37.54 | ||||||||
Restricted stock units cancelled | (2 | ) | 34.79 | |||||||
Restricted stock units vested | (14 | ) | 29.18 | $ | 480 | |||||
Balance at December 31, 2012 | 25 | 35.55 | ||||||||
Restricted stock units granted | 14 | 33.01 | ||||||||
Restricted stock units cancelled | (2 | ) | 35.04 | |||||||
Restricted stock units vested | (13 | ) | 34.03 | $ | 408 | |||||
Balance at December 31, 2013 | 24 | 34.91 | ||||||||
Restricted stock units granted | 14 | 30.35 | ||||||||
Restricted stock units cancelled | (6 | ) | 32.49 | |||||||
Restricted stock units vested | (12 | ) | 34.97 | $ | 521 | |||||
Balance at December 31, 2014 | 20 | $ | 32.38 | $ | 888 | |||||
F-27
Stock option activity is set forth below:
Options Outstanding | ||||||||||||
Number of Shares | Weighted Average Exercise Price per Share | Aggregate Intrinsic Value | Weighted-Average Remaining Contractual Term | |||||||||
(In millions, except per share data) | (In years) | |||||||||||
Balance at December 31, 2011 | 66 | $ | 27.47 | |||||||||
Options assumed | 4 | 9.71 | ||||||||||
Options cancelled | (1 | ) | 34.55 | |||||||||
Options exercised | (11 | ) | 17.09 | $ | 198 | |||||||
Balance at December 31, 2012 | 58 | 28.11 | ||||||||||
Options cancelled | (1 | ) | 37.01 | |||||||||
Options exercised | (18 | ) | 22.49 | $ | 156 | |||||||
Balance at December 31, 2013 | 39 | 30.39 | ||||||||||
Options cancelled | (1 | ) | 38.21 | |||||||||
Options exercised | (18 | ) | 26.08 | $ | 209 | |||||||
Balance at December 31, 2014 | 20 | $ | 33.84 | $ | 187 | 2.1 | ||||||
Exercisable and vested at December 31, 2014 | 20 | $ | 33.84 | $ | 187 | 2.1 | ||||||
The aggregate intrinsic value shown in the table above represents the difference between the fair market value of our Class A common stock on the date of exercise and the exercise price of each option. The aggregate intrinsic value of outstanding restricted stock units and options at December 31, 2014 was based on the closing price of our Class A common stock of $43.33 on December 31, 2014.
Stock-Based Compensation Expense
The following table presents details of total stock-based compensation expense that is included in each functional line item in the consolidated statements of income:
Year Ended December 31, | |||||||||||
2014 | 2013 | 2012 | |||||||||
(In millions) | |||||||||||
Cost of revenue | $ | 22 | $ | 25 | $ | 27 | |||||
Research and development | 304 | 363 | 368 | ||||||||
Selling, general and administrative | 111 | 130 | 148 | ||||||||
$ | 437 | $ | 518 | $ | 543 | ||||||
The following table presents details of unearned stock-based compensation currently estimated to be expensed in 2015 through 2019 related to unvested share-based payment awards:
2015 | 2016 | 2017 | 2018 | 2019 | Total | ||||||||||||||||||
(In millions) | |||||||||||||||||||||||
Unearned stock-based compensation | $ | 295 | $ | 188 | $ | 98 | $ | 16 | $ | 2 | $ | 599 | |||||||||||
The weighted-average period over which the unearned stock-based compensation is expected to be recognized is 1.33 years.
F-28
If there are any modifications or cancellations of the underlying unvested awards, we may be required to accelerate, increase or cancel any remaining unearned stock-based compensation expense. Future stock-based compensation expense and unearned stock-based compensation will increase to the extent that we grant additional equity awards or assume unvested equity awards in connection with acquisitions.
Shares Reserved For Future Issuance
We had the following shares of common stock reserved for future issuance upon the exercise or issuance of equity instruments:
Number of Shares | |
(In millions) | |
Stock options outstanding | 20 |
Authorized for future grants under stock incentive plans | 131 |
Authorized for future issuance under stock purchase plan | 19 |
Restricted stock units outstanding | 20 |
Balance at December 31, 2014 | 190 |
401(k) Savings and Investment Plan
We sponsor a defined contribution 401(k) savings and investment plan under which substantially all of our U.S. employees are eligible to participate. At our discretion, we may make contributions to this plan. We have a limited matching contribution policy under which we made $18 million, $18 million and $16 million in contributions to participants in this plan in 2014, 2013 and 2012, respectively.
8. | Commitments and Contingencies |
Claims and Litigation
We and certain of our subsidiaries are involved in various intellectual property and other proceedings, claims and litigation arising in the ordinary course of our business. We will disclose the nature of any such matters we believe to be material, along with (i) any accrual for loss contingencies associated with such legal proceedings; (ii) any determination by us that an unfavorable outcome is probable or reasonably possible; and (iii) the amount or range of any possible loss or a statement that we cannot reasonably estimate an amount or a range of possible loss.
In addition to asserted claims, from time to time we are approached by holders of intellectual property, including “non-practicing entities,” to engage in discussions about obtaining licenses to their intellectual property. We will disclose the nature of these unasserted claims if we determine that (i) it is probable an intellectual property holder will assert a claim of infringement; (ii) there is a reasonable possibility the outcome (assuming assertion) will be unfavorable; and (iii) the resulting liability would be material to our financial condition or results of operations.
While there can be no assurance, we believe that the ultimate outcome of current asserted and unasserted claims will not have a material adverse effect on our operating results, liquidity or financial position. However, our assessment of materiality may be impacted by limited information (particularly in the early stages of intellectual property proceedings), including, for example, about the patents-in-suit and Broadcom products against which the patents are being asserted. Accordingly, our assessment of materiality may change in the future based upon availability of discovery and further developments in the proceedings at issue. The results of legal proceedings are inherently uncertain, and material adverse outcomes are possible.
From time to time we may enter into confidential discussions regarding the potential settlement of pending intellectual property or proceedings, claims or litigation. There are a variety of factors that influence our decisions to settle and the amount we may choose to pay, including the strength of our case, developments in the litigation, the behavior of other interested parties, the demand on management time and the possible distraction of our employees
F-29
associated with the case and/or the possibility that we may be subject to an injunction or other equitable remedy. The settlement of any pending litigation or other proceedings could require us to make substantial settlement payments and result in us incurring substantial costs. Furthermore, the settlement or resolution of any intellectual property proceeding may require us to grant a license to certain of our intellectual property rights to the other party under a cross-license agreement or could prevent us from manufacturing or selling some of our products or limit or restrict the type of work that employees may perform for us. Settlements impacting the accompanying consolidated statements of income are described below.
Settled Intellectual Property Proceedings
In September 2009 we filed a complaint against Emulex Corporation, or Emulex, alleging patent infringement. On July 3, 2012, Broadcom and Emulex entered into a partial settlement and license agreement for various asserted patents. Emulex received a license and release related to several Broadcom patents for certain products for certain fields of use and Emulex was required to make a payment of certain amounts to Broadcom.
In November 2009 we filed a complaint against the Commonwealth Scientific and Industrial Research Organisation, or CSIRO, seeking a declaratory judgment that a certain U.S. patent number is invalid, unenforceable and not infringed. CSIRO counterclaimed for infringement. In March 2012 Broadcom and CSIRO entered into a settlement agreement resolving the litigation and the Court dismissed the parties’ claims with prejudice. The terms of the settlement agreement included a full release from liability for all asserted claims, the grant of a perpetual license under the asserted patent and all related patents to Broadcom, and the payment of certain amounts by Broadcom.
Settled Other Proceedings
In April 2008 we delivered a Notice of Arbitration and Arbitration Claim to our former independent registered public accounting firm Ernst & Young LLP, or EY, and certain related parties. The arbitration relates to the issues that led to the restatement of our financial statements for the periods from 1998 through March 31, 2006, as disclosed in an amended Annual Report on Form 10-K/A for the year ended December 31, 2005 and an amended Quarterly Report on Form 10-Q/A for the three months ended March 31, 2006, each filed with the SEC on January 23, 2007. In May 2008 EY delivered a Notice of Defense and Counterclaim. The arbitration hearing occurred in January 2013. In July 2013 we entered into a confidential settlement agreement with EY pursuant to which the parties mutually dismissed all claims, deny liability and EY paid a settlement amount to Broadcom.
Settlement Costs (Gains) and Other Related Items
In 2014 we recorded settlement costs of $16 million related to the settlement of patent infringement claims. In 2013 we received a payment of $75 million, net of contingent legal fees, related to Settled Other Proceedings, and recorded this as a gain on settlement. In addition, we recorded settlement costs of $6 million primarily related to patent infringement claims in 2013.
In 2012 we recorded net settlement costs of $79 million, which was comprised of $88 million of settlement costs related to patent infringement claims, offset by settlement gains of $9 million (primarily related to the resolution of certain employment tax matters). In 2012 we also received a payment of $58 million related to a partial settlement and license agreement. We accounted for this transaction as a multiple element arrangement and immediately recognized a $2 million gain on settlement of litigation and allocated the remaining $56 million to the licensing of intellectual property. The licensing portion will be recorded as net revenue over the ten year term of the license. See Note 1 for an additional discussion of our accounting policy under “Litigation and Settlement Costs.”
F-30
Commitments and Other Contractual Obligations
The following table presents details of our commitments and other contractual obligations, which are currently estimated to be paid in 2015 and thereafter:
Payment Obligations by Year | |||||||||||||||||||||||||||
2015 | 2016 | 2017 | 2018 | 2019 | Thereafter | Total | |||||||||||||||||||||
(In millions) | |||||||||||||||||||||||||||
Operating leases | $ | 197 | $ | 142 | $ | 95 | $ | 56 | $ | 24 | $ | 23 | $ | 537 | |||||||||||||
Inventory and related purchase obligations | 725 | — | — | — | — | — | 725 | ||||||||||||||||||||
Other obligations | 155 | 36 | 4 | — | — | — | 195 | ||||||||||||||||||||
Long-term debt and related interest | 50 | 49 | 49 | 550 | 36 | 1,368 | 2,102 | ||||||||||||||||||||
$ | 1,127 | $ | 227 | $ | 148 | $ | 606 | $ | 60 | $ | 1,391 | $ | 3,559 | ||||||||||||||
Facilities rent expense in 2014, 2013 and 2012 was $106 million, $97 million, and $90 million, respectively.
Inventory and related purchase obligations represent purchase commitments for silicon wafers and assembly and test services. We depend upon third party subcontractors to manufacture our silicon wafers and provide assembly and test services. Due to lengthy subcontractor lead times, we must order these materials and services from subcontractors well in advance. We expect to receive and pay for these materials and services within the ensuing six months. Our subcontractor relationships typically allow for the cancellation of outstanding purchase orders, but require payment of all expenses incurred through the date of cancellation.
Other obligations represent purchase commitments for lab test equipment, computer hardware, information systems infrastructure, mask and prototyping costs, intellectual property licensing arrangements and other commitments made in the ordinary course of business.
For purposes of the table above, obligations for the purchase of goods or services are defined as agreements that are enforceable and legally binding and that specify all significant terms, including: fixed or minimum quantities to be purchased; fixed, minimum or variable price provisions; and the approximate timing of the transaction. Our purchase orders are based on current manufacturing needs and are typically fulfilled by our vendors within a relatively short time horizon. We have additional purchase orders (not included in the table above) that represent authorizations to purchase rather than binding agreements. We do not have significant agreements for the purchase of inventories or other goods specifying minimum quantities or set prices that exceed our expected requirements.
Unrecognized tax benefits were $364 million, of which $62 million would result in potential cash payment of taxes and $302 million would result in a reduction in certain net operating loss and tax credit carryforwards. We are not including any amount related to uncertain tax positions in the table presented above because of the difficulty in making reasonably reliable estimates of the timing of settlements with the respective taxing authorities. In addition to the unrecognized tax benefits, we have also recorded a liability for potential tax penalties and interest of $27 million and $6 million, respectively, at December 31, 2014.
In November 2014 we signed an agreement to purchase land for the construction of a new corporate campus in Orange County, California, totaling up 2 million square feet to meet the requirements projected in our long-term business plan. The cost of the land is $128 million and is not included in the table above as the purchase is currently anticipated to close in the three months ending March 31, 2015, subject to closing conditions.
F-31
9. | Goodwill and Other Purchased Intangible Assets |
Goodwill
The following table summarizes the activity related to the carrying value of our goodwill:
Reportable Segments | |||||||||||||||
Broadband Communications | Infrastructure and Networking | Foreign Currency | Consolidated | ||||||||||||
(In millions) | |||||||||||||||
Goodwill | $ | 1,783 | $ | 3,778 | $ | (6 | ) | $ | 5,555 | ||||||
Accumulated impairment losses | (543 | ) | (1,286 | ) | — | (1,829 | ) | ||||||||
Goodwill at December 31, 2012 | 1,240 | 2,492 | (6 | ) | 3,726 | ||||||||||
Goodwill recorded in connection with acquisitions | 40 | — | — | 40 | |||||||||||
Effects of foreign currency translation | — | — | 27 | 27 | |||||||||||
Goodwill at December 31, 2013 | 1,280 | 2,492 | 21 | 3,793 | |||||||||||
Goodwill recorded in connection with acquisitions | 5 | 1 | — | 6 | |||||||||||
Transfer due to reorganization (Note 11) | $ | (26 | ) | $ | 26 | $ | — | $ | — | ||||||
Adjustment due to sale of certain assets (Note 2) | — | (37 | ) | — | (37 | ) | |||||||||
Effects of foreign currency translation | — | — | (52 | ) | (52 | ) | |||||||||
Goodwill at December 31, 2014 | $ | 1,259 | $ | 2,482 | $ | (31 | ) | $ | 3,710 | ||||||
As discussed in Notes 10 and 11, in connection with the wind-down of our cellular baseband business, we underwent certain organizational changes that resulted in the elimination of our former Mobile and Wireless reportable segment and combined our Broadband Communications reportable segment with substantially all of the remaining portion of our Mobile and Wireless reportable segment. The new combined segment is the Broadband and Connectivity reportable segment. Goodwill of $515 million in the former Mobile and Wireless reportable segment was allocated between the Broadband and Connectivity, and the Infrastructure and Networking reportable segments, in the amounts of $489 million and $26 million, respectively, based on relative fair value.
Purchased Intangible Assets
The following table presents details of our purchased intangible assets:
December 31, 2014 | December 31, 2013 | ||||||||||||||||||||||
Gross | Accumulated Amortization | Net | Gross | Accumulated Amortization | Net | ||||||||||||||||||
(In millions) | |||||||||||||||||||||||
Developed technology | $ | 1,250 | $ | (619 | ) | $ | 631 | $ | 1,492 | $ | (539 | ) | $ | 953 | |||||||||
In-process research and development | 19 | — | 19 | 130 | — | 130 | |||||||||||||||||
Customer relationships | 177 | (164 | ) | 13 | 232 | (176 | ) | 56 | |||||||||||||||
Other | 32 | (31 | ) | 1 | 34 | (29 | ) | 5 | |||||||||||||||
$ | 1,478 | $ | (814 | ) | $ | 664 | $ | 1,888 | $ | (744 | ) | $ | 1,144 | ||||||||||
In 2014 we reclassified $78 million of in-process research and development costs, or IPR&D, to developed technology, primarily related to digital front end (DFE) processors from our acquisition of NetLogic in 2012. These purchased intangible assets were subsequently impaired as discussed below.
F-32
Amortization of Purchased Intangible Assets
The following table presents details of the amortization of purchased intangible assets included in the cost of product revenue and other operating expense categories:
Year Ended December 31, | |||||||||||
2014 | 2013 | 2012 | |||||||||
(In millions) | |||||||||||
Cost of revenue | $ | 185 | $ | 171 | $ | 198 | |||||
Other operating expenses | 29 | 57 | 113 | ||||||||
$ | 214 | $ | 228 | $ | 311 | ||||||
The following table presents details of the amortization of existing purchased intangible assets (including IPR&D), which is currently estimated to be expensed in 2015 and thereafter:
Purchased Intangible Asset Amortization by Year | |||||||||||||||||||||||||||
2015 | 2016 | 2017 | 2018 | 2019 | Thereafter | Total | |||||||||||||||||||||
(In millions) | |||||||||||||||||||||||||||
Cost of revenue | $ | 144 | $ | 116 | $ | 98 | $ | 83 | $ | 64 | $ | 145 | $ | 650 | |||||||||||||
Other operating expenses | 4 | 3 | 2 | 3 | 2 | — | 14 | ||||||||||||||||||||
$ | 148 | $ | 119 | $ | 100 | $ | 86 | $ | 66 | $ | 145 | $ | 664 | ||||||||||||||
Impairment of Goodwill and Purchased Intangible Assets
Goodwill
We evaluate goodwill for potential impairment on October 1 of each year or more frequently if indicators of impairment exist. For our annual impairment evaluation in 2014 and 2013 we made a qualitative assessment of whether goodwill impairment exists and determined that it was more likely than not that the fair value of our reporting units exceeded their carrying values. Therefore, we did not perform the quantitative two-step goodwill impairment test. In addition, we qualitatively tested goodwill for impairment before and after our 2014 organizational changes (as discussed in Notes 10 and 11) and concluded that it was more likely than not that there was no impairment to goodwill. As discussed below, during our August 31, 2013 evaluation and our 2012 annual impairment evaluation, we performed the first step of the quantitative goodwill impairment assessment for each of our reporting units and determined no impairment was indicated as the estimated fair value of each of the reporting units exceeded its respective carrying value. At December 31, 2014, our book value was $9.05 billion while our market capitalization was $25.95 billion.
In light of the reduction in estimated future cash flows, which resulted in the significant impairment of purchased intangible assets related to our Infrastructure and Networking reporting unit in the three months ended June 30, 2013 (as discussed below), and as a result of our stock price decline in the three months ended September 30, 2013, we determined our goodwill had potentially been impaired. Accordingly, we performed the first step of the quantitative goodwill impairment assessment for each of our reporting units for recoverability of goodwill at August 31, 2013, but determined no impairment was indicated as the estimated fair value of each of the reporting units exceeded its respective carrying value by greater than 20%.
For the August 31, 2013 evaluation and 2012 annual impairment evaluation, we estimated the fair values of our reporting units using a combination of the income and market approach. The income approach utilizes estimates of discounted future cash flows. The market approach, based on a peer group of each reporting unit, utilizes market multiples for revenue and earnings before income taxes. The discounted cash flows for each reporting unit were based on discrete financial forecasts developed by management for planning purposes. Cash flows beyond the discrete forecasts were estimated using a terminal value calculation, which incorporated historical and forecasted
F-33
financial trends for each identified reporting unit and considered perpetual earnings growth rates for publicly traded peer companies. Future cash flows were discounted to present value by incorporating appropriate present value techniques. These techniques utilized several unobservable inputs categorized as Level 3 inputs, including discount rates, perpetual growth rates, a market participant tax rate and estimated future cash flows.
Specifically, the income approach valuations included the following assumptions for August 31, 2013 and October 1, 2012:
2013 | 2012 | ||||
Discount rate | 10.5 - 12.4% | 12.0 - 14.3% | |||
Perpetual growth rate | 3.0% - 4.0% | 4.0 | % | ||
Market participant tax rate | 15.0 | % | 15.1 | % | |
Risk free rate | 3.5 | % | 2.4 | % | |
Peer company beta | 0.82 - 1.30 | 1.19 - 1.21 | |||
Purchased Intangible Assets
In 2014 and 2013 we recorded impairment charges of $233 million and $462 million, respectively, related to our acquisition of NetLogic, included in our Infrastructure and Networking reportable segment. Of the total NetLogic impairment charges, $511 million, $120 million and $64 million related to completed technology, IPR&D and customer relationships, respectively.
In the first half of 2013 there was a steady reduction in near-term sales forecasts for NetLogic products sold into the service provider market, which caused us to review our long-term forecasts. In addition, we downwardly revised our longer term expectations of the size of the addressable market for these products. As a result of these triggering events, we performed a detailed impairment analysis of the long-lived assets associated with these products during the three months ended June 30, 2013. Based on our analysis, we determined certain assets acquired from NetLogic were not recoverable, requiring us to reduce the associated carrying value to fair value. We recorded impairment charges related to our embedded processor and our knowledge-based processor, or KBP, products of $343 million and $31 million, respectively. We also impaired $88 million of our completed technology related to our DFE processor products. For DFE, one of our smaller product lines, our customers indicated that they prefer custom solutions as opposed to standard merchant solutions. In response, we decided to redirect our efforts by focusing on developing customized solutions and have consequently fully impaired the assets related to the acquired DFE merchant product line.
In 2014 we recorded impairment charges related to our embedded processor and our KBP products of $159 million and $74 million, respectively. In 2014 we saw a continued reduction in customer design activity for MIPS-based embedded processors, which negatively impacted our previous forecast, primarily due to customers increasingly selecting alternative solutions for next generation core network architectures. The primary factor driving the impairment of our KBP assets was a long term reduction in demand for KBPs in edge and core routers, which negatively impacted our previous forecast.
In 2013 and 2012 we recorded impairment charges of $41 million and $49 million, respectively, related to our acquisition of Provigent, Inc. included in the Infrastructure and Networking reportable segment. The primary factor contributing to the Provigent impairments was the continued reduction in revenue outlook for certain products and the resulting decrease to the estimated cash flows identified with impaired assets over those respective years.
In 2014, 2013 and 2012 we recorded additional impairment charges of $27 million, $8 million and $38 million related to eight acquisitions. The primary factor contributing to the other impairment charges was the reduction in the revenue outlook for certain products and the resulting decrease to the estimated cash flows identified with the impaired assets. We also recorded an impairment charge of $3 million related to certain computer software and equipment in 2012.
F-34
In determining the amount of the impairment charges we calculated fair values as of the impairment date for acquired intangible assets. The fair value was determined using the multiple period excess earnings approach, which calculates the value based on the risk-adjusted present value of the cash flows specific to the products, allowing for a reasonable return. The fair values were determined using significant unobservable inputs categorized as Level 3 inputs. The key unobservable inputs utilized in the model include discount rates ranging from 15% to 25%, a market participant tax rates ranging from 15% to 17%, and a probability adjusted level of future cash flows based on current product and market data.
10. | Exit of Cellular Baseband Business and Other Restructuring Costs |
Restructuring Costs
On June 2, 2014, we announced that we were exploring strategic alternatives, including a potential sale and/or wind-down, for our cellular baseband business, previously included in our former Mobile and Wireless reportable segment. See Note 11 for a discussion of our reportable segments. We reached this decision based on our conclusion that the commercial and economic opportunity in this business was not sufficiently compelling to justify the continued investment, especially when compared to other opportunities within our product portfolio. On June 26, 2014, the Audit Committee of our Board of Directors approved a global restructuring plan, or the 2014 Plan, that focuses on cost reductions and operating efficiencies and better aligns our resources to areas of strategic focus.
In July 2014 we decided to pursue a wind-down of the cellular baseband business. As of December 31, 2014, we have substantially completed a reduction to our worldwide headcount by approximately 2,300 employees and terminated various contracts. We are in the process of closing or consolidating up to 19 locations.
We recorded $152 million in restructuring charges in 2014 primarily related to the exit of the cellular baseband business, which charges consist of cash-based termination benefits and contract costs to be incurred without economic benefit. Specifically, these charges are comprised of (i) $130 million for ongoing and one-time termination benefits primarily for employees performing research and development and marketing functions in the cellular baseband business and for employees performing selling, general and administrative and other corporate functions and (ii) $22 million for certain non-cancelable contract and facility costs. We expect to record additional restructuring charges of approximately $40 million over the next 12 months for costs associated with the closure and consolidation of several facilities costs.
In September 2013 our Board of Directors approved and we initiated a global restructuring plan to reduce our expenses and better align our resources to areas of strategic focus, referred to as the 2013 Plan. The 2013 Plan focused on cost reductions and operating efficiencies, including a reduction in our worldwide headcount and certain lease terminations. As part of this restructuring plan, and in connection with the closing of the Renesas Transaction, we determined that additional terminations of various Broadcom employees, as well as former Renesas employees, whose positions were expected to become redundant, and additional lease terminations would be necessary. Notification to impacted employees was substantially complete on October 21, 2013, and additional employees affected by the Renesas Transaction were notified during the remainder of the year. As a result of the 2013 Plan, we reduced our worldwide headcount by approximately 800 employees.
In connection with the 2013 Plan we recorded $47 million in restructuring costs, of which $45 million related to severance and other charges associated with our reduction in workforce across multiple locations and functions, and $2 million was related to the closure of one of our facilities. As part of the Renesas Transaction, Renesas Electronics Corporation was required to reimburse us up to $21 million for certain costs associated with employees terminated prior to June 30, 2014. In connection with this provision, we received $18 million in 2014, of which $12 million was recorded at December 31, 2013. This resulted in a reduction to the 2013 restructuring charges noted above.
In 2012 we incurred $7 million in restructuring costs primarily associated with additional costs for retention bonuses and facilities relating to an additional restructuring plan and severance and facility charges associated with synergies identified during the integration of our acquisition of NetLogic.
F-35
The following table summarizes activity related to our restructuring liabilities:
2014 | 2013 | ||||||||||
Plan | Plan | Total | |||||||||
(In millions) | |||||||||||
Balance at December 31, 2012 | $ | — | $ | — | $ | — | |||||
Charged to expense | — | 41 | 41 | ||||||||
Cash payments | — | (24 | ) | (24 | ) | ||||||
Balance at December 31, 2013 | — | 17 | 17 | ||||||||
Charged to expense | 152 | 6 | 158 | ||||||||
Cash payments | (121 | ) | (21 | ) | (142 | ) | |||||
Balance at December 31, 2014 | $ | 31 | $ | 2 | $ | 33 | |||||
Impairment Charges Related to Exit of Cellular Baseband Business
In connection with our decision to exit the cellular baseband business, previously included in our former Mobile and Wireless reportable segment, we recorded $144 million of non-cash charges for the impairment of certain long-lived assets, and $27 million of inventory charges in 2014. We wrote down the value of property and equipment related to the cellular baseband business by $118 million to reflect the fair value of these assets on an in-exchange basis. In determining the fair value of the assets, we used a market based approach to estimate the value we could receive in the open market, and subtracted the cost to sell those assets. We also performed a detailed analysis of our electronic design automation, or EDA, tools and technology licenses that relate to our cellular baseband business. Because the majority of these EDA tools and technology licenses are not transferable and will have no useful applications for our remaining operations, we recorded an impairment charge of $19 million related to these licenses. We also recorded impairment charges of purchased intangible assets of $2 million and other assets of $5 million. The impairment charges were recorded in “Impairment of Long-Lived Assets” and the inventory charge was recorded in “Cost of Revenue” included in our consolidated statements of income for the year ended December 31, 2014.
11. | Reportable Segments, Significant Customer and Geographical Information |
Reportable Segments
Our business is structured around two reportable segments: (i) Broadband and Connectivity; and (ii) Infrastructure and Networking. Our Chief Executive Officer, who is our chief operating decision maker, or CODM, reviews financial information at the reportable segment level.
Our net revenue is generated principally from sales of integrated circuit products. While we derive some revenue from other sources, that revenue is not material as it represents less than 1% of our total net revenue.
With respect to the sales of integrated circuit products, we have approximately 450 products that are grouped into approximately 60 product lines. We have concluded that these products constitute a group of similar products within each reportable segment in each of the following respects:
• | the integrated circuits marketed by each of our reportable segments are sold to one type of customer: manufacturers of wired and wireless communications equipment, which incorporate our integrated circuits into their electronic products; |
• | the integrated circuits sold by each of our reportable segments use the same standard CMOS manufacturing processes; |
• | all of our integrated circuits are manufactured, assembled and tested using the same or similar group of independent, third-party subcontractors; and |
F-36
• | all of our integrated circuits are sold through a centralized sales force and common wholesale distributors. |
Historically, Broadcom had three reportable segments, which were consistent with our target markets. These former segments were: Broadband Communications, Mobile and Wireless, and Infrastructure and Networking. In 2014 (as discussed in Notes 9 and 10), we decided to pursue a wind-down of our cellular baseband business, which business was previously included, along with the Connectivity and Voice over Internet Protocol, or VoIP, businesses, in our former Mobile and Wireless reportable segment. In connection with the wind-down, we underwent certain organizational changes that resulted in the elimination of the Mobile and Wireless reportable segment. We reassigned the responsibilities for the Connectivity and VoIP businesses as follows: the executive vice president, or EVP, responsible for the former Broadband Communications reportable segment now also manages our Connectivity business and the EVP responsible for the former Infrastructure and Networking reportable segment now also manages the VoIP business. Also, as part of this reorganization, certain research and development functions have been merged, streamlined and consolidated within the former Broadband Communications and Infrastructure and Networking reportable segments. In addition, we are now including stock-based compensation in each reportable segment and in the cellular baseband business category. Based on these organizational changes, the streamlining of research and development activities and the inclusion of stock-based compensation, and consistent with how our Chief Executive Officer, who is our chief operating decision maker, or CODM, currently reviews financial information for purposes of allocating resources and assessing performance of these businesses, we determined that we now have two operating segments, which are also our reportable segments: (i) Broadband and Connectivity and (ii) Infrastructure and Networking.
The “Cellular Baseband” category shown in the table below represents the operations of the cellular baseband business that is currently winding down. As the CODM no longer reviews the financial information for purposes of allocating resources and assessing performance of Cellular Baseband, it does not qualify as an operating and reportable segment. In addition, as Cellular Baseband has not completely ceased operations and will continue to generate revenue, albeit declining, and expenses for the foreseeable future, it does not currently meet the requirements for “discontinued operations” under applicable accounting standards. We have included Cellular Baseband net revenue and operating income (loss) in the below tables as if it did meet the requirements of a reportable segment because we believe this information is useful to users of our financial statements.
We also report an “All Other” category, which included income from the Qualcomm Agreement in prior periods, since it was principally the result of corporate efforts, and also includes operating expenses that we do not allocate to our reportable segments as these expenses are not included in the segment operating performance measures evaluated by our CODM. Operating costs and expenses that are not allocated include amortization of purchased intangible assets, amortization of acquired inventory valuation step-up and inventory charges relating to our decision to exit our cellular baseband business, impairment of goodwill and other long-lived assets, net settlement costs (gains), net restructuring costs, other charges (gains), and other miscellaneous expenses related to corporate allocations that were either over or under the original projections at the beginning of the year. We include acquisition-related items in the “All Other” category as our CODM reviews reportable segment performance exclusive of these charges. Our CODM does not review information regarding total assets, interest income or income taxes on a segment basis. The accounting policies for segment reporting are the same as for Broadcom as a whole.
All prior-period amounts have been adjusted retrospectively to reflect our reportable segment changes, as well as the inclusion of stock-based compensation. In addition, certain shared operating expenses have been reallocated to our (i) Broadband and Connectivity and (ii) Infrastructure and Networking reportable segments, which expenses represent corporate allocations not expected to be eliminated from the consolidated amounts once we complete the wind-down of Cellular Baseband.
F-37
The following tables present details of our reportable segments and the “All Other” category:
Reportable Segments | ||||||||||||||||||||||
Broadband and Connectivity | Infrastructure and Networking | Total Reportable Segments | Cellular Baseband | All Other | Consolidated | |||||||||||||||||
(In millions) | ||||||||||||||||||||||
Year Ended December 31, 2014 | ||||||||||||||||||||||
Net revenue | $ | 5,535 | $ | 2,525 | 8,060 | $ | 368 | $ | — | $ | 8,428 | |||||||||||
Operating income (loss) | 1,086 | 685 | 1,771 | (339 | ) | (738 | ) | 694 | ||||||||||||||
Year Ended December 31, 2013 | ||||||||||||||||||||||
Net revenue | $ | 5,430 | $ | 2,155 | 7,585 | $ | 634 | $ | 86 | $ | 8,305 | |||||||||||
Operating income (loss) | 1,003 | 412 | 1,415 | (369 | ) | (574 | ) | 472 | ||||||||||||||
Year Ended December 31, 2012 | ||||||||||||||||||||||
Net revenue | $ | 5,232 | $ | 1,911 | 7,143 | $ | 677 | $ | 186 | $ | 8,006 | |||||||||||
Operating income (loss) | 990 | 189 | 1,179 | (169 | ) | (334 | ) | 676 | ||||||||||||||
Included in “All Other” category: | Year Ended December 31, | ||||||||||
2014 | 2013 | 2012 | |||||||||
(In millions) | |||||||||||
Net revenue | $ | — | $ | 86 | $ | 186 | |||||
Amortization of purchased intangible assets | 214 | 228 | 311 | ||||||||
Amortization of acquired inventory step-up and inventory charges related to the exit of the cellular baseband business | 27 | 1 | 72 | ||||||||
Impairments of long-lived assets | 404 | 511 | 90 | ||||||||
Settlement costs (gains) | 16 | (69 | ) | 79 | |||||||
Restructuring costs, net | 158 | 29 | 7 | ||||||||
Other charges (gains), net | (60 | ) | 25 | — | |||||||
Miscellaneous corporate allocation variances | (21 | ) | (65 | ) | (39 | ) | |||||
Total other operating costs and expenses | $ | 738 | $ | 660 | $ | 520 | |||||
Total operating loss for the “All Other” category | $ | (738 | ) | $ | (574 | ) | $ | (334 | ) | ||
Significant Customer and Geographical Information
Sales to our significant customers, including sales to their manufacturing subcontractors, as a percentage of net revenue were as follows:
Year Ended December 31, | ||||||||
2014 | 2013 | 2012 | ||||||
Samsung | 14.2 | % | 21.3 | % | 17.3 | % | ||
Apple | 14.0 | 13.3 | 14.6 | |||||
Five largest customers as a group | 44.1 | 48.3 | 46.9 | |||||
Sales to Samsung and Apple were primarily related to our Broadband and Connectivity reportable segment. No other customer represented more than 10% of our annual net revenue in these years.
F-38
The geographical distribution of our shipments, as a percentage of product revenue was as follows:
Year Ended December 31, | ||||||||
2014 | 2013 | 2012 | ||||||
Hong Kong | 31.2 | % | 27.5 | % | 26.9 | % | ||
China (exclusive of Hong Kong) | 24.1 | 23.7 | 29.0 | |||||
Singapore, Taiwan, Thailand and Japan | 29.0 | 34.5 | 31.1 | |||||
United States | 4.3 | 3.6 | 3.6 | |||||
Europe | 2.3 | 1.4 | 1.0 | |||||
Other | 9.1 | 9.3 | 8.4 | |||||
100.0 | % | 100.0 | % | 100.0 | % | |||
We do not own or operate a fabrication facility. Four independent third-party foundries located in Asia manufacture a majority of our semiconductor devices in current production, including one foundry that accounts for approximately half of our production. Any sudden demand for an increased amount of semiconductor devices or sudden reduction or elimination of any existing source or sources of semiconductor devices could result in a material delay in the shipment of our products. In addition, substantially all of our products are assembled and tested by five different independent third-party subcontractors in Asia, including one subcontractor that accounts for approximately a third of our production. We do not have long-term agreements with any of these suppliers. Any problems associated with the fabrication facilities or the delivery, quality or cost of our products could have a material adverse effect on our business, results of operations and financial condition.
In Singapore we have warehousing and logistics operations, as well as engineering and design facilities. In addition, we perform sales and distribution-related activities in Ireland. We also have engineering design facilities in Belgium, Canada, China, Denmark, France, Greece, India, Israel, Japan, Korea, the Netherlands, Taiwan and the United Kingdom. At December 31, 2014, $128 million, or approximately 21.6%, of our tangible long-lived assets were located outside the United States.
F-39
12. Quarterly Financial Data (Unaudited)
The following table presents our unaudited quarterly financial data. In our opinion, this information has been prepared on a basis consistent with that of our audited consolidated financial statements and all necessary material adjustments, consisting of normal recurring accruals and adjustments, have been included to present fairly the unaudited quarterly financial data. Our quarterly results of operations for these periods are not necessarily indicative of future results of operations.
Net Revenue | Gross Profit | Net Income (Loss) | Diluted Net Income (Loss) Per Share | |||||||||||||
(In millions, except per share data) | ||||||||||||||||
Year Ended December 31, 2014 | ||||||||||||||||
Fourth Quarter | $ | 2,143 | $ | 1,131 | $ | 390 | (1) | $ | 0.64 | |||||||
Third Quarter | 2,260 | 1,183 | 98 | (2) | 0.16 | |||||||||||
Second Quarter | 2,041 | 1,036 | (1 | ) | (3) | — | ||||||||||
First Quarter | 1,984 | 980 | 165 | (4) | 0.28 | |||||||||||
Year Ended December 31, 2013 | ||||||||||||||||
Fourth Quarter | $ | 2,064 | $ | 1,038 | $ | 168 | (5) | $ | 0.29 | |||||||
Third Quarter | 2,146 | 1,102 | 316 | (6) | 0.55 | |||||||||||
Second Quarter | 2,090 | 1,060 | (251 | ) | (7) | (0.43 | ) | |||||||||
First Quarter | 2,005 | 1,017 | 191 | (8) | 0.33 | |||||||||||
(1) | Includes restructuring costs of $16 million and impairment of long-lived assets of $14 million. |
(2) | Includes impairment of long-lived assets charges of $200 million and restructuring costs of $114 million. |
(3) | Includes impairment of long-lived assets charges of $165 million and restructuring costs of $23 million. |
(4) | Includes impairment of long-lived assets of $25 million. |
(5) | Includes restructuring costs of $17 million. |
(6) | Includes settlement gains of $75 million, a charitable contribution of $25 million and restructuring costs of $12 million. |
(7) | Includes impairment of long-lived assets of $501 million. |
(8) | Includes impairment of long-lived assets of $10 million. |
F-40
SIGNATURES
Pursuant to the requirements of Section 13 or 15(d) of the Securities Exchange Act of 1934, the Registrant has duly caused this Report to be signed on its behalf by the undersigned, thereunto duly authorized.
BROADCOM CORPORATION, | |
a California corporation | |
(Registrant) | |
/s/ SCOTT A. MCGREGOR | |
Scott A. McGregor | |
President and Chief Executive Officer | |
Date: January 29, 2015
Pursuant to the requirements of the Securities Exchange Act of 1934, this Report has been signed below by the following persons on behalf of the Registrant and in the capacities and on the dates indicated:
Signature | Title | Date | |
/s/ SCOTT A. MCGREGOR | President and Chief Executive Officer and | January 29, 2015 | |
Scott A. McGregor | Director (Principal Executive Officer) | ||
/s/ HENRY SAMUELI | Chairman of the Board and Chief Technical Officer | January 29, 2015 | |
Henry Samueli, Ph.D. | |||
/s/ ERIC K. BRANDT | Executive Vice President and Chief Financial Officer | January 29, 2015 | |
Eric K. Brandt | (Principal Financial Officer) | ||
/s/ CINDY A. FIORILLO | Senior Vice President, Finance and Corporate Controller | January 29, 2015 | |
Cindy A. Fiorillo | (Principal Accounting Officer) | ||
/s/ ROBERT J. FINOCCHIO, JR. | Director | January 29, 2015 | |
Robert J. Finocchio, Jr. | |||
/s/ NANCY H. HANDEL | Director | January 29, 2015 | |
Nancy H. Handel | |||
/s/ EDDY W. HARTENSTEIN | Director | January 29, 2015 | |
Eddy W. Hartenstein | |||
/s/ MARIA M. KLAWE | Director | January 29, 2015 | |
Maria M. Klawe, Ph.D. | |||
/s/ JOHN E. MAJOR | Director | January 29, 2015 | |
John E. Major | |||
/s/ WILLIAM T. MORROW | Director | January 29, 2015 | |
William T. Morrow | |||
/s/ ROBERT E. SWITZ | Lead Independent Director | January 29, 2015 | |
Robert E. Switz | |||
SCHEDULE II — CONSOLIDATED VALUATION AND QUALIFYING ACCOUNTS
BROADCOM CORPORATION
Balance at | Charged | Charged to | Balance at | ||||||||||||||||
Beginning of | to Costs and | Other | End of | ||||||||||||||||
Description | Year | Expenses | Accounts | Deductions | Year | ||||||||||||||
(In millions) | |||||||||||||||||||
Year ended December 31, 2014: | |||||||||||||||||||
Deducted from asset accounts: | |||||||||||||||||||
Allowance for doubtful accounts | $ | 8 | $ | 2 | $ | — | $ | — | $ | 10 | |||||||||
Sales returns | 7 | 25 | — | (24 | ) | 8 | |||||||||||||
Restructuring liabilities | 17 | 158 | — | (142 | ) | 33 | |||||||||||||
Total | $ | 32 | $ | 185 | $ | — | $ | (166 | ) | $ | 51 | ||||||||
Year ended December 31, 2013: | |||||||||||||||||||
Deducted from asset accounts: | |||||||||||||||||||
Allowance for doubtful accounts | $ | 8 | $ | — | $ | — | $ | — | $ | 8 | |||||||||
Sales returns | 12 | 48 | — | (53 | ) | 7 | |||||||||||||
Restructuring liabilities | 1 | 41 | — | (25 | ) | 17 | |||||||||||||
Total | $ | 21 | $ | 89 | $ | — | $ | (78 | ) | $ | 32 | ||||||||
Year ended December 31, 2012: | |||||||||||||||||||
Deducted from asset accounts: | |||||||||||||||||||
Allowance for doubtful accounts | $ | 9 | $ | — | $ | — | $ | (1 | ) | $ | 8 | ||||||||
Sales returns | 10 | 31 | — | (29 | ) | 12 | |||||||||||||
Restructuring liabilities | 8 | 7 | — | (14 | ) | 1 | |||||||||||||
Total | $ | 27 | $ | 38 | $ | — | $ | (44 | ) | $ | 21 | ||||||||
S-1
EXHIBIT INDEX
Where Located | ||||||||||||
Exhibit Number | Description | Form | File No. | Exhibit No. | Filing Date | Filed Herewith | ||||||
3.1 | Second Amended and Restated Articles of Incorporation filed with the California Secretary of State on June 8, 2006 | 8-K | 000- 23993 | 3.1 | 8/10/2006 | |||||||
3.2 | Amended and Restated Bylaws, as amended through December 4, 2014 | 8-K | 000- 23993 | 3.1 | 12/19/2014 | |||||||
4.1 | Indenture, dated November 1, 2010, between the registrant and Wilmington Trust FSB | 8-K | 000- 23993 | 4.1 | 11/1/2010 | |||||||
4.2 | Second Supplemental Indenture, dated November 9, 2011, between the registrant and Wilmington Trust, National Association, including the form of Broadcom’s 2.700% Senior Notes due 2018 | 8-K | 000- 23993 | 4.1 | 11/9/2011 | |||||||
4.3 | Third Supplemental Indenture, dated August 16, 2012, between Broadcom and Wilmington Trust, National Association, including the forms of Broadcom’s 2.500% Senior Notes due 2022 | 8-K | 000- 23993 | 4.1 | 8/16/2012 | |||||||
4.4 | Fourth Supplemental Indenture, dated July 29, 2014, between Broadcom and Wilmington Trust, National Association, including the forms of Broadcom’s 3.500% Senior Notes due 2024 and 4.500% Senior Notes due 2034 | 8-K | 000- 23993 | 4.1 | 7/29/2014 | |||||||
10.1* | Performance Bonus Plan (as amended and restated October 19, 2014) | 10-Q | 000- 23993 | 10.4 | 10/21/2014 | |||||||
10.2* | Fourth Amendment dated August 9, 2010 to Letter Agreement between the registrant and Scott A. McGregor | 10-Q | 000- 23993 | 10.1 | 10/26/2010 | |||||||
10.3* | Third Amendment dated August 9, 2010 to Letter Agreement between the registrant and Eric K. Brandt | 10-Q | 000- 23993 | 10.2 | 10/26/2010 | |||||||
10.4* | Form of Revised Letter Agreement for Change in Control Severance Benefit Program dated August 9, 2010 between the registrant and each of the following executive officers: Arthur Chong, Neil Kim, and Daniel A. Marotta | 10-Q | 000- 23993 | 10.5 | 10/26/2010 | |||||||
10.5* | Letter Agreement for Change in Control Severance Benefit Program dated November 18, 2013 between the registrant and Cindy A. Fiorillo | 10-Q | 000- 23993 | 10.2 | 10/21/2014 | |||||||
10.6* | Amendment dated August 9, 2010 to Letter Agreement for Change in Control Severance Benefit Program between the registrant and Rajiv Ramaswami | 10-Q | 000- 23993 | 10.4 | 10/26/2010 | |||||||
Where Located | ||||||||||||
Exhibit Number | Description | Form | File No. | Exhibit No. | Filing Date | Filed Herewith | ||||||
10.7* | Agreement for Change in Control Severance Benefit Program dated April 1, 2013 between the registrant and Michael E. Hurlston | 10-Q | 000- 23993 | 10.1 | 4/23/2013 | |||||||
10.8* | Agreement for Change in Control Severance Benefit Program dated August 20, 2014 between the registrant and Nancy R. Phillips | 10-Q | 000- 23993 | 10.3 | 10/21/2014 | |||||||
10.9* | Severance Benefit Plan for Vice Presidents and Above and Summary Plan Description effective June 1, 2010 (Amended December 16, 2011) | 10-K | 000- 23993 | 10.7 | 1/31/2013 | |||||||
10.10* | 1998 Stock Incentive Plan, as amended and restated November 11, 2010 | 10-K | 000- 23993 | 10.14 | 2/2/2011 | |||||||
10.11* | 1998 Stock Incentive Plan form of Notice of Grant of Stock Option for executive officers | 10-K | 000- 23993 | 10.17 | 2/4/2009 | |||||||
10.12* | 1998 Stock Incentive Plan form of Stock Option Agreement for executive officers | 10-K | 000- 23993 | 10.21 | 2/4/2009 | |||||||
10.13* | 1998 Stock Incentive Plan form of Automatic Stock Option Agreement for Non-Employee Directors (under prior Director Automatic Grant Program) | 10-Q | 000- 23993 | 10.2 | 11/9/2004 | |||||||
10.14* | 1998 Stock Incentive Plan form of Restricted Stock Unit Issuance Agreement for Scott A. McGregor | 10-K | 000- 23993 | 10.18 | 2/2/2011 | |||||||
10.15* | 1998 Stock Incentive Plan form of Restricted Stock Unit Issuance Agreement for executive officers other than Scott A. McGregor | 10-K | 000- 23993 | 10.19 | 2/2/2011 | |||||||
10.16* | 1998 Stock Incentive Plan form of Restricted Stock Unit Issuance Agreement for executive officers (for RSUs governed by the Special RSU Program) | 10-K | 000- 23993 | 10.20 | 2/2/2011 | |||||||
10.17* | 1998 Stock Incentive Plan form of Restricted Stock Unit Issuance Agreement for Non-Employee Directors (Annual Award) | 10-K | 000- 23993 | 10.29 | 2/4/2009 | |||||||
10.18* | 1998 Stock Incentive Plan form of Restricted Stock Unit Issuance Agreement for Non-Employee Directors (Pro-rated Awards) | 10-K | 000- 23993 | 10.30 | 2/4/2009 | |||||||
10.19* | 1998 Stock Incentive Plan form of Restricted Stock Unit Award Agreement for Non-Employee Directors (Initial Awards under prior Director Automatic Grant Program) | 10-Q | 000- 23993 | 10.3 | 5/4/2005 | |||||||
10.20* | 2012 Stock Incentive Plan (as amended and restated January 28, 2015) | X | ||||||||||
10.21* | 2012 Stock Incentive Plan form of Restricted Stock Unit Issuance Agreement for Scott A. McGregor | 10-K | 000- 23993 | 10.20 | 1/30/2014 | |||||||
Where Located | ||||||||||||
Exhibit Number | Description | Form | File No. | Exhibit No. | Filing Date | Filed Herewith | ||||||
10.22* | 2012 Stock Incentive Plan form of Restricted Stock Unit Issuance Agreement for executive officers other than Scott A. McGregor | 10-K | 000- 23993 | 10.21 | 1/30/2014 | |||||||
10.23* | 2012 Stock Incentive Plan form of Restricted Stock Unit Issuance Agreement for executive officers (for RSUs governed by the special RSU program (3 year cliff vesting)) | 10-K | 000- 23993 | 10.22 | 1/30/2014 | |||||||
10.24* | 2012 Stock Incentive Plan form of Notice of Grant of Stock Option and form of Stock Option Agreement for executive officers | 10-K | 000- 23993 | 10.23 | 1/30/2014 | |||||||
10.25* | 2012 Stock Incentive Plan form of Restricted Stock Unit Issuance Agreement for Non-Employee Directors (Annual Award) | 10-K | 000- 23993 | 10.24 | 1/30/2014 | |||||||
10.26* | 2012 Stock Incentive Plan form of Restricted Stock Unit Issuance Agreement for Non-Employee Directors (Pro-rated Awards) | 10-K | 000- 23993 | 10.25 | 1/30/2014 | |||||||
10.27* | Restricted Stock Units Incentive Award Program (amended and restated February 20, 2014) | 10-Q | 000- 23993 | 10.2 | 4/24/2014 | |||||||
10.28* | Restricted Stock Unit Incentive Award Program — Form of Award Letter | 10-Q | 000- 23993 | 10.3 | 4/24/2014 | |||||||
10.29* | Form of Indemnification Agreement for Directors, Elected Officers and certain employees or agents of the registrant | 8-K | 000- 23993 | 10.1 | 6/24/2008 | |||||||
10.30†† | Settlement and Patent License and Non-Assert Agreement by and between Qualcomm Incorporated and the registrant | 8-K/A | 000- 23993 | 10.1 | 7/23/2009 | |||||||
10.31 | Credit Agreement, dated as of November 19, 2010, by and among the registrant, Bank of America, N.A. and the other lenders party thereto. | 8-K | 000- 23993 | 10.1 | 11/22/2010 | |||||||
10.32 | First Amendment to Credit Agreement dated as of October 31, 2011 by and among the registrant, Bank of America, N.A and other lenders party thereto. | 8-K | 000- 23993 | 10.1 | 11/1/2011 | |||||||
10.33 | Second Amendment to Credit Agreement dated as of July 31, 2014 by and among the registrant, Bank of America, N.A and other lenders party thereto. | 8-K | 000- 23993 | 10.1 | 7/31/2014 | |||||||
10.34 | Lease Agreement dated May 18, 2000 between M-D Downtown Sunnyvale, LLC and the registrant | 10-K | 000- 23993 | 10.21 | 3/31/2003 | |||||||
10.35 | Amendment dated September 30, 2005 to Lease Agreement dated May 18, 2000 between M-D Downtown Sunnyvale, LLC and the registrant | 10-K | 000- 23993 | 10.43 | 2/4/2009 | |||||||
Where Located | ||||||||||||
Exhibit Number | Description | Form | File No. | Exhibit No. | Filing Date | Filed Herewith | ||||||
10.36 | Second Amendment dated October 15, 2010 to Lease Agreement dated May 18, 2000 between M-D Downtown Sunnyvale, LLC and the registrant | 10-K | 000- 23993 | 10.36 | 2/2/2011 | |||||||
10.37†† | Lease Agreement dated December 29, 2004 between Irvine Commercial Property Company and the registrant | 10-K | 000- 23993 | 10.38 | 3/1/2005 | |||||||
10.38 | First Amendment, Second Amendment, and Third Amendment dated June 7, 2005, April 9, 2007 and April 9, 2007, respectively, to Lease dated December 29, 2004 between Irvine Commercial Property Company LLC and the registrant | 10-Q | 000- 23993 | 10.20 | 10/24/2007 | |||||||
10.39 | Fourth Amendment dated November 19, 2007 to Lease dated December 29, 2004 between Irvine Commercial Property Company LLC and the registrant | 10-K | 000- 23993 | 10.43 | 1/28/2008 | |||||||
10.40 | Fifth Amendment dated February 26, 2013 to Lease dated December 29, 2004 between The Irvine Company LLC and the registrant | 10-K | 000- 23993 | 10.38 | 1/30/2014 | |||||||
10.41 | Sixth Amendment dated May 22, 2014 to Lease dated December 29, 2004 between The Irvine Company LLC and the registrant | X | ||||||||||
10.42 | Lease Agreement dated October 31, 2007 between Irvine Commercial Property Company LLC and the registrant | 10-K | 000- 23993 | 10.44 | 1/28/2008 | |||||||
10.43 | First Amendment dated November 12, 2008 to Lease Agreement dated October 31, 2007 between Irvine Commercial Property Company LLC and the registrant | 10-K | 000- 23993 | 10.49 | 2/4/2009 | |||||||
10.44 | Second Amendment, Third Amendment, and Fourth Amendment dated July 30, 2010, September 14, 2010 and November 15, 2010, respectively, to Lease Agreement dated October 31, 2007 between Irvine Commercial Property Company LLC and the registrant | 10-K | 000- 23993 | 10.42 | 2/2/2011 | |||||||
10.45 | Fifth and Sixth Amendment dated April 24, 2011 and August 2, 2011, respectively to Lease Agreement dated October 31, 2007 between Irvine Commercial Property Company LLC and the registrant | 10-K | 000- 23993 | 10.45 | 2/1/2012 | |||||||
10.46 | Seventh Amendment dated June 28, 2012 to Lease Agreement dated October 31, 2007 between Irvine Commercial Property Company LLC and the registrant | 10-K | 000- 23993 | 10.37 | 1/30/2013 | |||||||
Where Located | ||||||||||||
Exhibit Number | Description | Form | File No. | Exhibit No. | Filing Date | Filed Herewith | ||||||
10.47 | Eighth Amendment dated February 26, 2013 to Lease Agreement dated October 31, 2007 between The Irvine Company LLC and the registrant | 10-K | 000- 23993 | 10.44 | 1/30/2014 | |||||||
10.48 | Ninth Amendment dated May 22, 2014 to Lease Agreement dated October 31, 2007 between The Irvine Company LLC and the registrant | X | ||||||||||
21.1 | Subsidiaries of the Company | X | ||||||||||
23.1 | Consent of KPMG LLP | X | ||||||||||
31.1 | Certification of the Chief Executive Officer, as required pursuant to Section 302 of the Sarbanes-Oxley Act of 2002 | X | ||||||||||
31.2 | Certification of the Chief Financial Officer, as required pursuant to Section 302 of the Sarbanes-Oxley Act of 2002 | X | ||||||||||
32 | Certifications of the Chief Executive Officer and Chief Financial Officer, as required pursuant to Section 906 of the Sarbanes-Oxley Act of 2002 | X | ||||||||||
101.INS | XBRL Instance Document | X | ||||||||||
101.SCH | XBRL Taxonomy Extension Schema Document | X | ||||||||||
101.CAL | XBRL Taxonomy Extension Calculation Linkbase Document | X | ||||||||||
101.LAB | XBRL Taxonomy Extension Label Linkbase Document | X | ||||||||||
101.PRE | XBRL Taxonomy Extension Presentation Linkbase Document | X | ||||||||||
101.DEF | XBRL Taxonomy Extension Definition Linkbase Document | X | ||||||||||
* | A contract, compensatory plan or arrangement in which directors or executive officers are eligible to participate. | |||||||||||
†† | Confidential treatment has previously been granted by the SEC for certain portions of the referenced exhibit pursuant to Rule 406 under the Securities Act. | |||||||||||