Attached files
| file | filename |
|---|---|
| 8-K - 8-K - Ameris Bancorp | v399793_8k.htm |
| EX-2.1 - EXHIBIT 2.1 - Ameris Bancorp | v399793_ex2-1.htm |
| EX-99.3 - EXHIBIT 99.3 - Ameris Bancorp | v399793_ex99-3.htm |
| EX-99.1 - EXHIBIT 99.1 - Ameris Bancorp | v399793_ex99-1.htm |
| EX-2.2 - EXHIBIT 2.2 - Ameris Bancorp | v399793_ex2-2.htm |
Exhibit 99.2
Acquisition of Merchants & Southern Banks of Florida, Inc. Purchase of 18 South Georgia and North Florida Branches Private Placement of Common Stock January 29, 2015
This presentation contains certain performance measures determined by methods other than in accordance with accounting principles generally accepted in the United States of America (“GAAP”) . Management of Ameris Bancorp (the “Company”) uses these non - GAAP measures in its analysis of the Company’s performance . The Company’s management believes that these non - GAAP measures provide a greater understanding of ongoing operations, enhance comparability of results with prior periods and demonstrate the effects of significant gains and charges in the current period . The Company’s management believes that investors may use these non - GAAP financial measures to evaluate the Company’s financial performance without the impact of unusual items that may obscure trends in the Company’s underlying performance . These disclosures should not be viewed as a substitute for financial measures determined in accordance with GAAP, nor are they necessarily comparable to non - GAAP performance measures that may be presented by other companies . Tangible common equity and Tier 1 capital ratios are non - GAAP measures . The Company calculates the Tier 1 capital using current call report instructions . The Company’s management uses these measures to assess the quality of capital and believes that investors may find them useful in their evaluation of the Company . These capital measures may, or may not be necessarily comparable to similar capital measures that may be presented by other companies . This presentation may contain statements that constitute “forward - looking statements” within the meaning of Section 27 A of the Securities Act of 1933 , as amended, and Section 21 E of the Securities Exchange Act of 1934 , as amended . The words “believe”, “estimate”, “expect”, “intend”, “anticipate” and similar expressions and variations thereof identify certain of such forward - looking statements, which speak only as of the dates which they were made . The Company undertakes no obligation to publicly update or revise any forward - looking statements, whether as a result of new information, future events or otherwise . Readers are cautioned that any such forward - looking statements are not guarantees of future performance and involve risks and uncertainties and that actual results may differ materially from those indicated in the forward - looking statements as a result of various factors . Readers are cautioned not to place undue reliance on these forward - looking statements and are referred to the Company’s periodic filings with the Securities and Exchange Commission for a summary of certain factors that may impact the Company’s results of operations and financial condition . 2 Cautionary Statements
Significant Strategic Transactions 3 Discussion Outline • Bank Acquisition • Branch Purchase • Capital Transaction and Pro Forma Results

Bank Acquisition

(1) Financial information as of December 31, 2014 Bank Acquisition – Transaction Terms and Multiples Bank Acquisition Consideration Aggregate Purchase Price Required Approvals Expected Closing Price/Tangible Book Value (1) Price/LTM Net Income (1) Core Deposit Premium (1) Merchants & Southern Banks of Florida, Inc. Gainesville, FL 100% cash $50.0 million Customary regulatory approvals Second quarter of 2015 131% 16.0x 3.7% 5
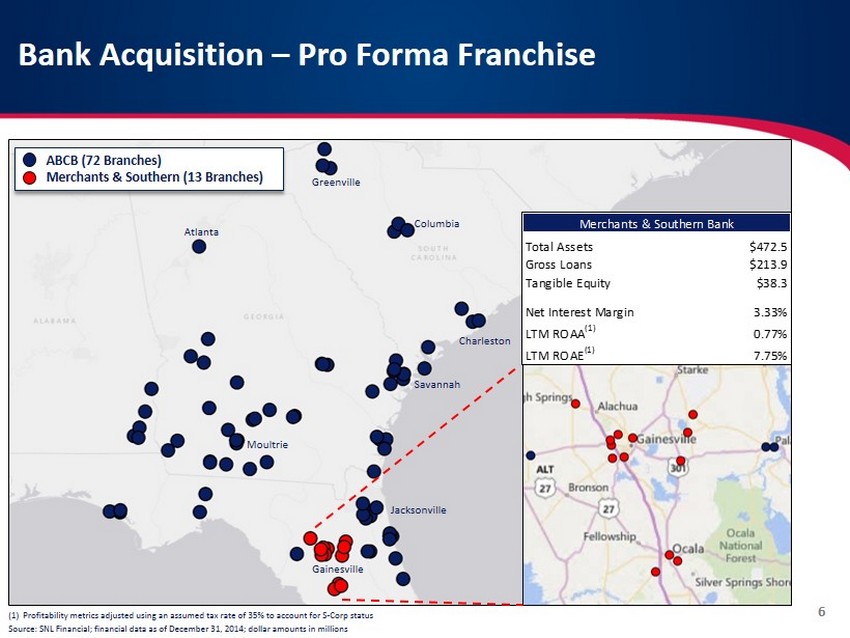
(1) Profitability metrics adjusted using an assumed tax rate of 35% to account for S - Corp status Source: SNL Financial; financial data as of December 31, 2014; dollar amounts in millions Bank Acquisition – Pro Forma Franchise ABCB (72 Branches) Merchants & Southern (13 Branches) Gainesville Jacksonville Savannah Charleston Columbia Greenville Atlanta Moultrie 6 Merchants & Southern Bank Total Assets $472.5 Gross Loans $213.9 Tangible Equity $38.3 Net Interest Margin 3.33% LTM ROAA (1) 0.77% LTM ROAE (1) 7.75%
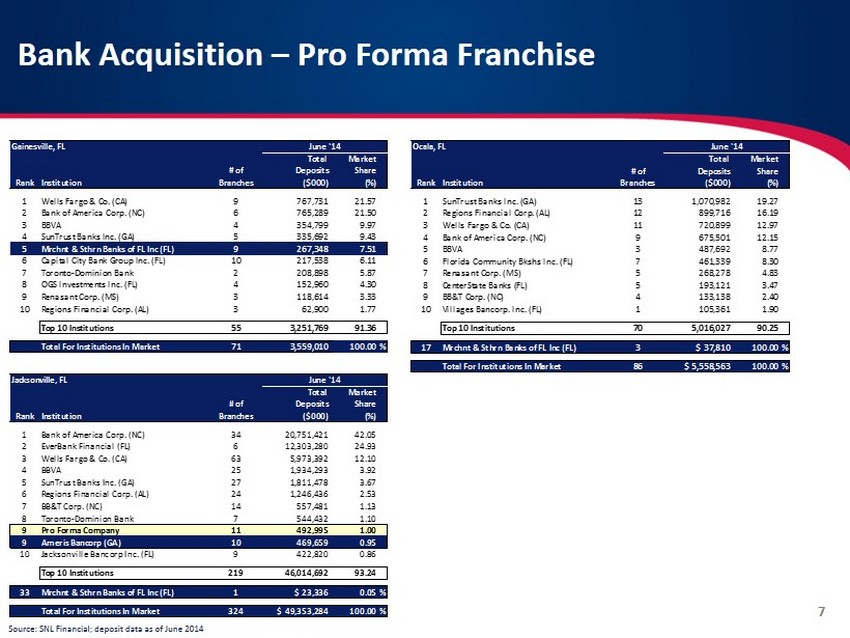
7 Bank Acquisition – Pro Forma Franchise Gainesville, FL June '14 Total Market # of Deposits Share Rank Institution Branches ($000) (%) 1 Wells Fargo & Co. (CA) 9 767,731 21.57 2 Bank of America Corp. (NC) 6 765,289 21.50 3 BBVA 4 354,799 9.97 4 SunTrust Banks Inc. (GA) 5 335,692 9.43 5 Mrchnt & Sthrn Banks of FL Inc (FL) 9 267,348 7.51 6 Capital City Bank Group Inc. (FL) 10 217,538 6.11 7 Toronto-Dominion Bank 2 208,898 5.87 8 OGS Investments Inc. (FL) 4 152,960 4.30 9 Renasant Corp. (MS) 3 118,614 3.33 10 Regions Financial Corp. (AL) 3 62,900 1.77 Top 10 Institutions 55 3,251,769 91.36 1 Total For Institutions In Market 71 3,559,010 100.00% Ocala, FL June '14 Total Market # of Deposits Share Rank Institution Branches ($000) (%) 1 SunTrust Banks Inc. (GA) 13 1,070,982 19.27 2 Regions Financial Corp. (AL) 12 899,716 16.19 3 Wells Fargo & Co. (CA) 11 720,899 12.97 4 Bank of America Corp. (NC) 9 675,501 12.15 5 BBVA 3 487,692 8.77 6 Florida Community Bkshs Inc. (FL) 7 461,339 8.30 7 Renasant Corp. (MS) 5 268,278 4.83 8 CenterState Banks (FL) 5 193,121 3.47 9 BB&T Corp. (NC) 4 133,138 2.40 10 Villages Bancorp. Inc. (FL) 1 105,361 1.90 Top 10 Institutions 70 5,016,027 90.25 17 Mrchnt & Sthrn Banks of FL Inc (FL) 3 $37,810 100.00% 1 Total For Institutions In Market 86 $5,558,563 100.00% Jacksonville, FL June '14 Total Market # of Deposits Share Rank Institution Branches ($000) (%) 1 Bank of America Corp. (NC) 34 20,751,421 42.05 2 EverBank Financial (FL) 6 12,303,280 24.93 3 Wells Fargo & Co. (CA) 63 5,973,392 12.10 4 BBVA 25 1,934,293 3.92 5 SunTrust Banks Inc. (GA) 27 1,811,478 3.67 6 Regions Financial Corp. (AL) 24 1,246,436 2.53 7 BB&T Corp. (NC) 14 557,481 1.13 8 Toronto-Dominion Bank 7 544,432 1.10 9 Pro Forma Company 11 492,995 1.00 9 Ameris Bancorp (GA) 10 469,659 0.95 10 Jacksonville Bancorp Inc. (FL) 9 422,820 0.86 Top 10 Institutions 219 46,014,692 93.24 33 Mrchnt & Sthrn Banks of FL Inc (FL) 1 $23,336 0.05% 1 Total For Institutions In Market 324 $49,353,284 100.00% Source : SNL Financial; deposit data as of June 2014

Transaction Rationale • Meaningful EPS accretion • Internal rate of return over 20% Strategic Rationale Operating Considerations Financial Impact • In - market extension with like - minded community bank • Leverages management experience and infrastructure in North Florida • Experienced Southeast acquiror – 12 deals in the last 6 years • Due diligence process completed • Represents a premier community bank operating in preferred markets • Strengthens our North Florida market presence • Provides entry point into the Gainesville and Ocala markets • Market overlap allows for cost savings opportunities 8

Branch Purchase
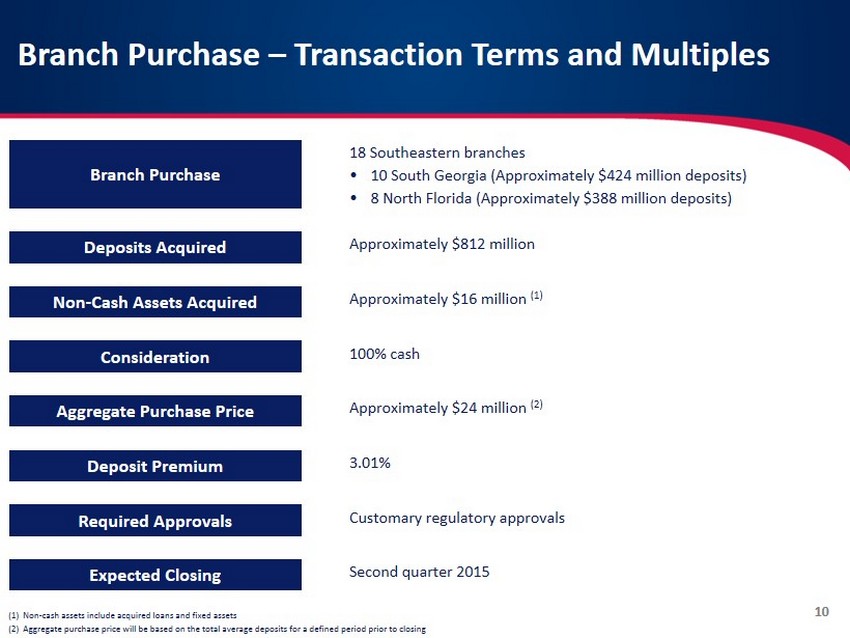
(1) Non - cash assets include acquired loans and fixed assets (2) Aggregate purchase price will be based on the total average deposits for a defined period prior to closing Branch Purchase – Transaction Terms and Multiples Branch Purchase Deposits Acquired Non - Cash Assets Acquired Consideration Required Approvals Deposit Premium 18 Southeastern branches • 10 South Georgia (Approximately $424 million deposits) • 8 North Florida (Approximately $388 million deposits) Approximately $812 million Approximately $16 million (1) 100% cash Customary regulatory approvals 3.01% 10 Aggregate Purchase Price Approximately $24 million ( 2 ) Expected Closing Second quarter 2015
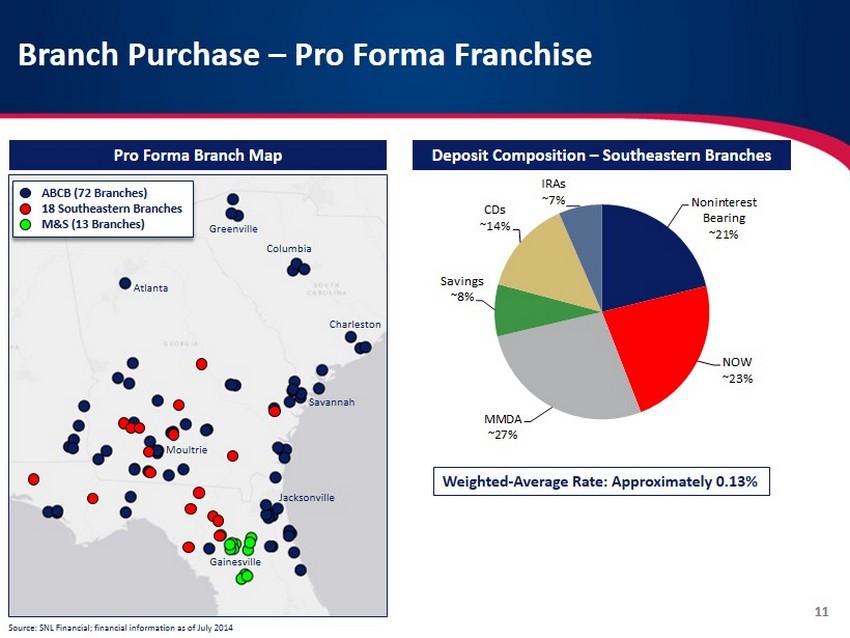
Source: SNL Financial; financial information as of July 2014 Branch Purchase – Pro Forma Franchise Pro Forma Branch Map Deposit Composition – Southeastern Branches ABCB (72 Branches) 18 Southeastern Branches M&S (13 Branches) Noninterest Bearing ~21% NOW ~23% MMDA ~27% Savings ~8% CDs ~14% IRAs ~7% 11 Jacksonville Columbia Greenville Atlanta Moultrie Savannah Charleston Weighted - Average Rate: Approximately 0.13% Gainesville

24.3% 20.8% 33.5% 9.2% 12.2% 12 Pro Forma Deposit Composition 24.2% 22.3% 29.7% 11.5% 12.3% ~21% ~23% ~42% ~0% ~14% 32.9% 0.2% 53.0% 7.4% 6.5% ABCB Southeastern Branches (1) Merchants Non-Interest Bearing Deposits MMDA & Savings Interest-Bearing Transaction CDs < $100,000 CDs > $100,000 Pro Forma ABCB (2) (1) Time deposit composition assumes that all acquired branch CDs are > $100,000 (2) Does not account for purchase accounting adjustments Financial information as of September 30, 2014 MRQ Cost of Deposits: 0.30% Cost of Deposits: Approximately 0.13% MRQ Cost of Deposits: 0.22%
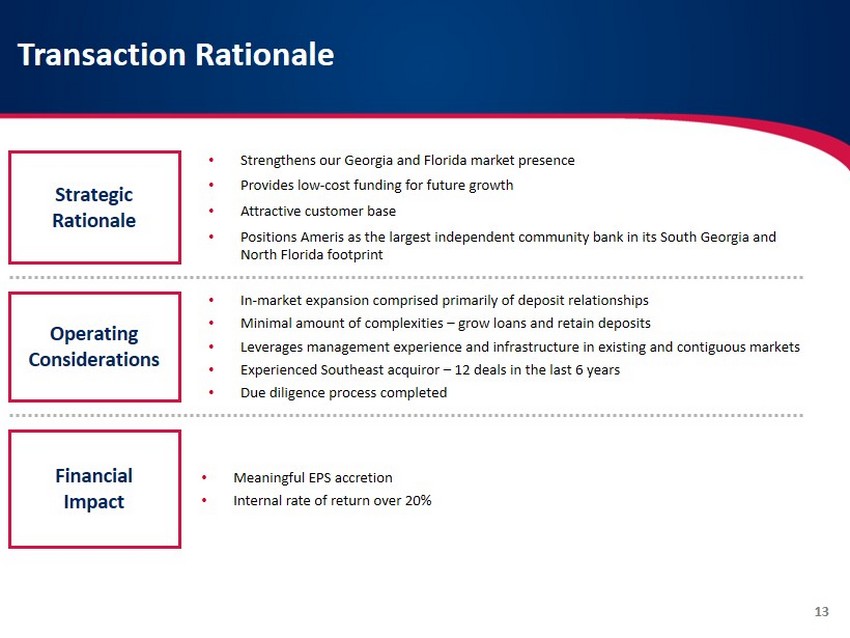
Transaction Rationale • Meaningful EPS accretion • Internal rate of return over 20% Strategic Rationale Operating Considerations Financial Impact • In - market expansion comprised primarily of deposit relationships • Minimal amount of complexities – grow loans and retain deposits • Leverages management experience and infrastructure in existing and contiguous markets • Experienced Southeast acquiror – 12 deals in the last 6 years • Due diligence process completed • Strengthens our Georgia and Florida market presence • Provides low - cost funding for future growth • Attractive customer base • Positions Ameris as the largest independent community bank in its South Georgia and North Florida footprint 13

Capital Transaction and Pro Forma Results
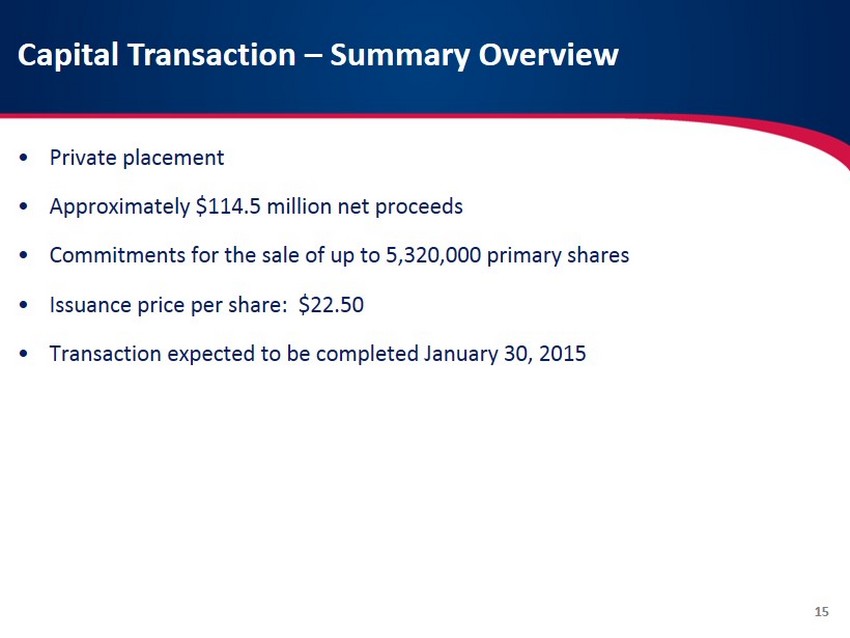
Capital Transaction – Summary Overview 15 • Private placement • Approximately $114.5 million net proceeds • Commitments for the sale of up to 5,320,000 primary shares • Issuance price per share: $ 22.50 • Transaction expected to be completed January 30, 2015

Key Pro Forma Assumptions and Financial Impact Bank Acquisition • Balance sheet and earnings growth in line with past performance • Cost savings of 33%; 75% realized in 2015 and 100% realized in 2016 and thereafter • No revenue enhancements assumed • Credit loan mark of approximately 4% • OREO mark of approximately 23% • Core deposit intangible of 1.5% amortized straight - line over 8 years • Expected closing Q2 2015 • Immediately accretive to EPS at closing • Projected to be over 15% accretive to EPS in 2016 and thereafter • Immediately accretive to tangible book value • Estimated IRR well in excess of 20% • Pro forma capital ratios to remain in excess of “well capitalized” minimums 16 Branch Purchase Capital Transaction, Bank Acquisition, Branch Purchase • 10% deposit runoff in 2015; 3% deposit growth through 2018 (distributed equally across deposit account types) • Acquired balance sheet liquidity transitions into loans over a 4 - year period; targeted 2018 asset mix – 80% loans / 20% securities • Noninterest income and expense increases are equal to projected deposit growth • Assumed yield on new loans equal to 4.0 % (current ABCB yield = 4.94%); securities 2.0%; and the cost of interest bearing deposits increasing from 0.13% to 0.36% (current ABCB cost) • Provision expense of 1.0% on new loan growth • Expected closing Q2 2015 Key Assumptions Pro Forma Financial Impact
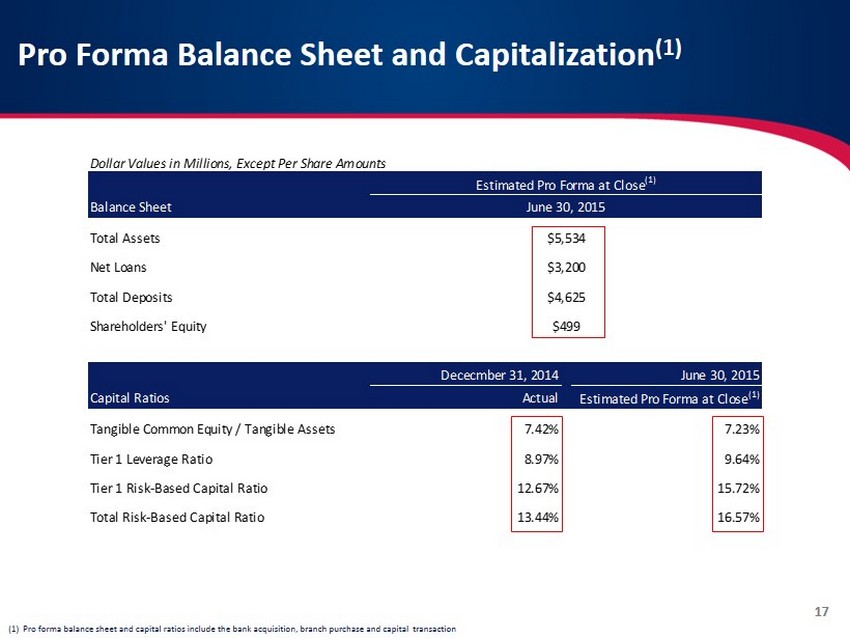
Pro Forma Balance Sheet and Capitalization (1) 17 (1) Pro forma balance sheet and capital ratios include the bank acquisition, branch purchase and capital transaction Dollar Values in Millions, Except Per Share Amounts Estimated Pro Forma at Close (1) Balance Sheet June 30, 2015 Total Assets $5,534 Net Loans $3,200 Total Deposits $4,625 Shareholders' Equity $499 Dececmber 31, 2014 June 30, 2015 Capital Ratios Actual Estimated Pro Forma at Close (1) Tangible Common Equity / Tangible Assets 7.42% 7.23% Tier 1 Leverage Ratio 8.97% 9.64% Tier 1 Risk-Based Capital Ratio 12.67% 15.72% Total Risk-Based Capital Ratio 13.44% 16.57%
Conclusion 18 • Ameris is a very attractive Southeastern banking franchise — Consistently profitable — Impressive returns…5 year total return over 170% (1) — Experienced acquiror with a seasoned management team — Well - positioned to capitalize on future growth and expansion opportunities • Pending acquisitions further enhance the Ameris franchise — Financially attractive…meaningful EPS and TBV accretion — Strategically compelling…enhances current branch franchise in core Southeastern markets — Further improves core funding — Manageable execution and conversion risk (1) Includes the compounded value of reinvested dividends over the time period

Appendix: Additional Information
Merchants & Southern Banks of Florida, Inc.
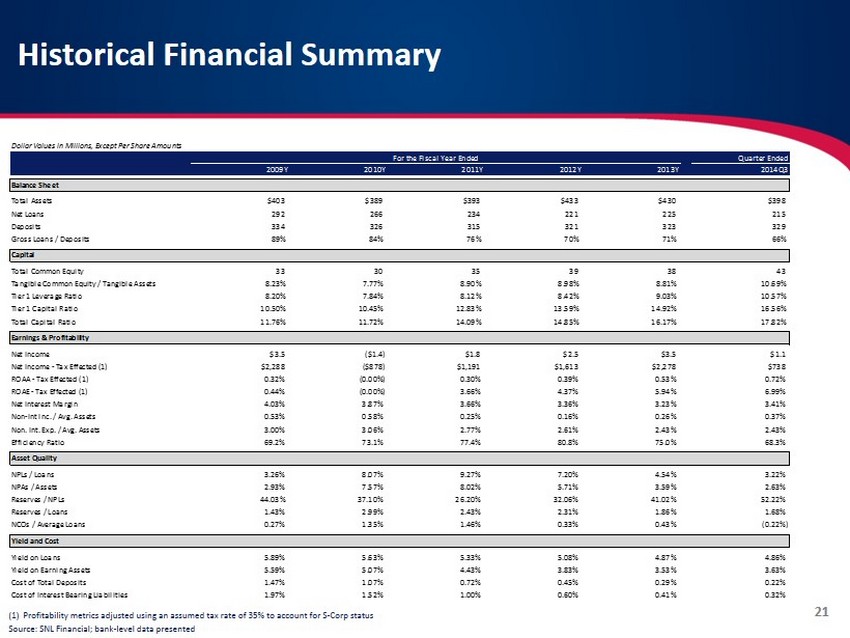
Historical Financial Summary (1) Profitability metrics adjusted using an assumed tax rate of 35% to account for S - Corp status Source: SNL Financial; bank - level data presented 21 Dollar Values in Millions, Except Per Share Amounts For the Fiscal Year Ended Quarter Ended 2009Y 2010Y 2011Y 2012Y 2013Y 2014Q3 Balance Sheet Total Assets $403 $389 $393 $433 $430 $398 Net Loans 292 266 234 221 225 215 Deposits 334 326 315 321 323 329 Gross Loans / Deposits 89% 84% 76% 70% 71% 66% Capital Total Common Equity 33 30 35 39 38 43 Tangible Common Equity / Tangible Assets 8.23% 7.77% 8.90% 8.98% 8.81% 10.69% Tier 1 Leverage Ratio 8.20% 7.84% 8.12% 8.42% 9.03% 10.57% Tier 1 Capital Ratio 10.50% 10.45% 12.83% 13.59% 14.92% 16.56% Total Capital Ratio 11.76% 11.72% 14.09% 14.85% 16.17% 17.82% Earnings & Profitability Net Income $3.5 ($1.4) $1.8 $2.5 $3.5 $1.1 Net Income - Tax Effected (1) $2,288 ($878) $1,191 $1,613 $2,278 $738 ROAA - Tax Effected (1) 0.32% (0.00%) 0.30% 0.39% 0.53% 0.72% ROAE - Tax Effected (1) 0.44% (0.00%) 3.66% 4.37% 5.94% 6.99% Net Interest Margin 4.03% 3.87% 3.66% 3.36% 3.23% 3.41% Non-Int Inc. / Avg. Assets 0.53% 0.58% 0.25% 0.16% 0.26% 0.37% Non. Int. Exp. / Avg. Assets 3.00% 3.06% 2.77% 2.61% 2.43% 2.43% Efficiency Ratio 69.2% 73.1% 77.4% 80.8% 75.0% 68.3% Asset Quality NPLs / Loans 3.26% 8.07% 9.27% 7.20% 4.54% 3.22% NPAs / Assets 2.93% 7.57% 8.02% 5.71% 3.59% 2.63% Reserves / NPLs 44.03% 37.10% 26.20% 32.06% 41.02% 52.22% Reserves / Loans 1.43% 2.99% 2.43% 2.31% 1.86% 1.68% NCOs / Average Loans 0.27% 1.35% 1.46% 0.33% 0.43% (0.22%) Yield and Cost Yield on Loans 5.89% 5.63% 5.33% 5.08% 4.87% 4.86% Yield on Earning Assets 5.59% 5.07% 4.43% 3.83% 3.53% 3.63% Cost of Total Deposits 1.47% 1.07% 0.72% 0.45% 0.29% 0.22% Cost of Interest Bearing Liabilities 1.97% 1.52% 1.00% 0.60% 0.41% 0.32%
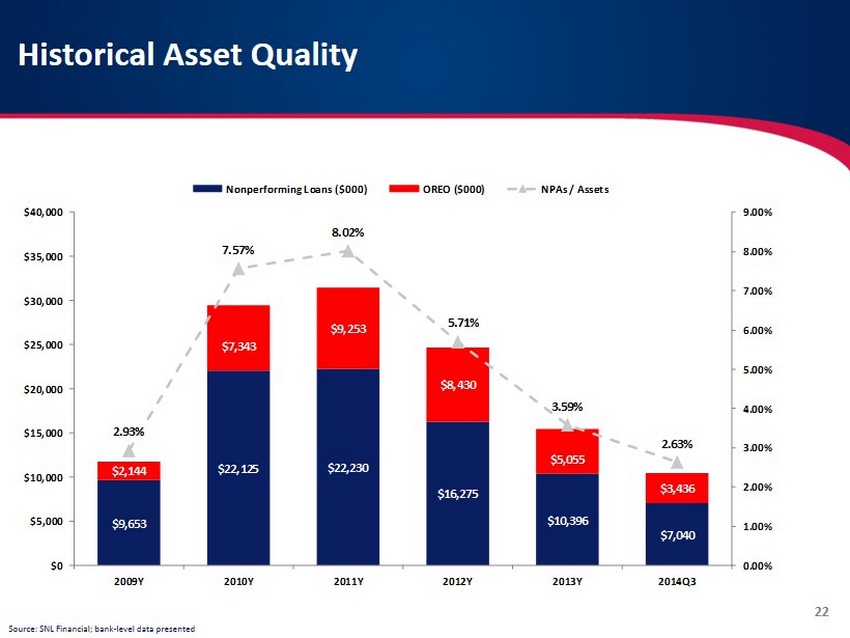
Historical Asset Quality Source: SNL Financial; bank - level data presented 22 $9,653 $22,125 $22,230 $16,275 $10,396 $7,040 $2,144 $7,343 $9,253 $8,430 $5,055 $3,436 2.93% 7.57% 8.02% 5.71% 3.59% 2.63% 0.00% 1.00% 2.00% 3.00% 4.00% 5.00% 6.00% 7.00% 8.00% 9.00% $0 $5,000 $10,000 $15,000 $20,000 $25,000 $30,000 $35,000 $40,000 2009Y 2010Y 2011Y 2012Y 2013Y 2014Q3 Nonperforming Loans ($000) OREO ($000) NPAs / Assets
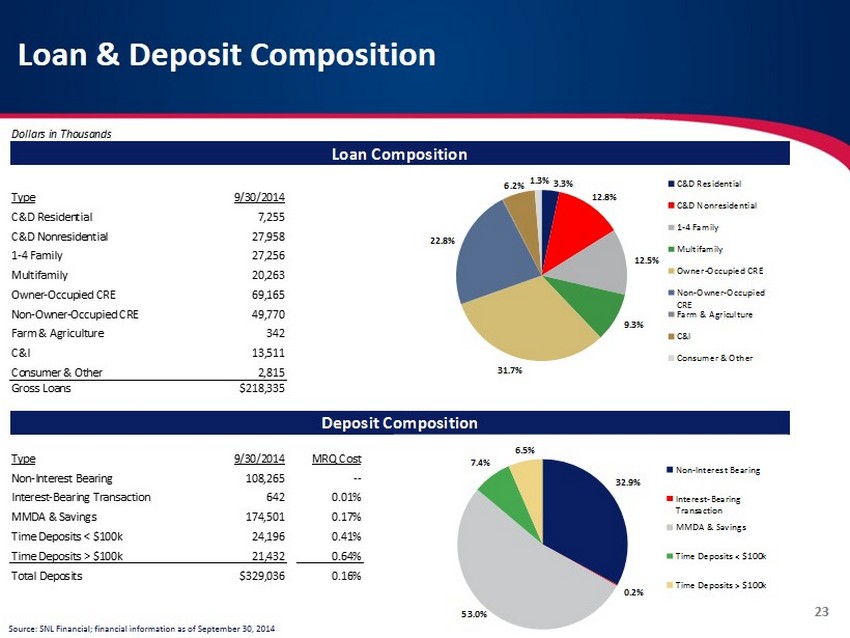
Loan & Deposit Composition Dollars in Thousands Loan Composition Type 9/30/2014 C&D Residential 7,255 C&D Nonresidential 27,958 1-4 Family 27,256 Multifamily 20,263 Owner-Occupied CRE 69,165 Non-Owner-Occupied CRE 49,770 Farm & Agriculture 342 C&I 13,511 Consumer & Other 2,815 Gross Loans $218,335 Deposit Composition Type 9/30/2014 MRQ Cost Non-Interest Bearing 108,265 -- Interest-Bearing Transaction 642 0.01% MMDA & Savings 174,501 0.17% Time Deposits < $100k 24,196 0.41% Time Deposits > $100k 21,432 0.64% Total Deposits $329,036 0.16% 32.9% 0.2% 53.0% 7.4% 6.5% Non-Interest Bearing Interest-Bearing Transaction MMDA & Savings Time Deposits < $100k Time Deposits > $100k 3.3% 12.8% 12.5% 9.3% 31.7% 22.8% 6.2% 1.3% C&D Residential C&D Nonresidential 1-4 Family Multifamily Owner-Occupied CRE Non-Owner-Occupied CRE Farm & Agriculture C&I Consumer & Other Source: SNL Financial; financial information as of September 30, 2014 23

Southeastern Branches
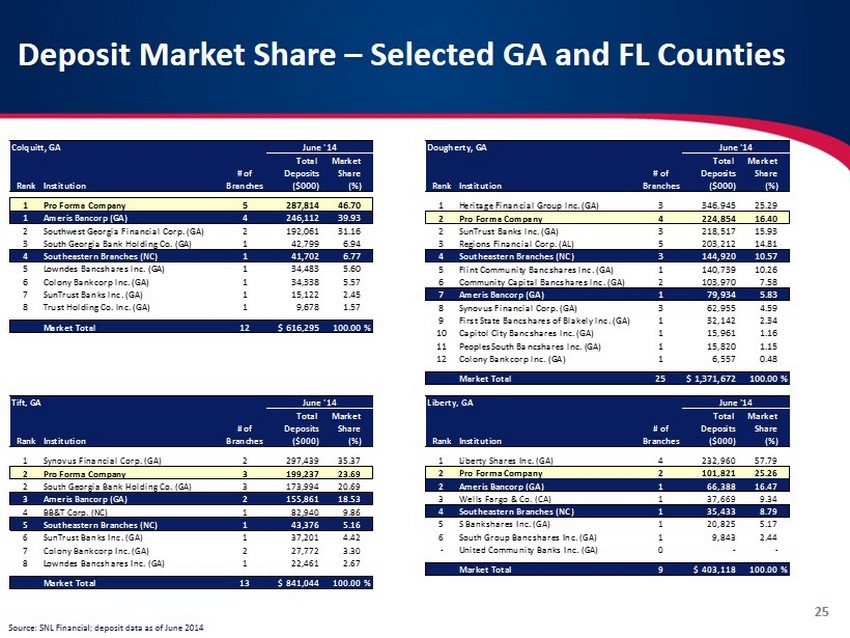
Source: SNL Financial; deposit data as of June 2014 Deposit Market Share – Selected GA and FL Counties 25 Tift, GA June '14 Total Market # of Deposits Share Rank Institution Branches ($000) (%) 1 Synovus Financial Corp. (GA) 2 297,439 35.37 2 Pro Forma Company 3 199,237 23.69 2 South Georgia Bank Holding Co. (GA) 3 173,994 20.69 3 Ameris Bancorp (GA) 2 155,861 18.53 4 BB&T Corp. (NC) 1 82,940 9.86 5 Southeastern Branches (NC) 1 43,376 5.16 6 SunTrust Banks Inc. (GA) 1 37,201 4.42 7 Colony Bankcorp Inc. (GA) 2 27,772 3.30 8 Lowndes Bancshares Inc. (GA) 1 22,461 2.67 1 Market Total 13 $841,044 100.00% Colquitt, GA June '14 Total Market # of Deposits Share Rank Institution Branches ($000) (%) 1 Pro Forma Company 5 287,814 46.70 1 Ameris Bancorp (GA) 4 246,112 39.93 2 Southwest Georgia Financial Corp. (GA) 2 192,061 31.16 3 South Georgia Bank Holding Co. (GA) 1 42,799 6.94 4 Southeastern Branches (NC) 1 41,702 6.77 5 Lowndes Bancshares Inc. (GA) 1 34,483 5.60 6 Colony Bankcorp Inc. (GA) 1 34,338 5.57 7 SunTrust Banks Inc. (GA) 1 15,122 2.45 8 Trust Holding Co. Inc. (GA) 1 9,678 1.57 1 Market Total 12 $616,295 100.00% Liberty, GA June '14 Total Market # of Deposits Share Rank Institution Branches ($000) (%) 1 Liberty Shares Inc. (GA) 4 232,960 57.79 2 Pro Forma Company 2 101,821 25.26 2 Ameris Bancorp (GA) 1 66,388 16.47 3 Wells Fargo & Co. (CA) 1 37,669 9.34 4 Southeastern Branches (NC) 1 35,433 8.79 5 S Bankshares Inc. (GA) 1 20,825 5.17 6 South Group Bancshares Inc. (GA) 1 9,843 2.44 - United Community Banks Inc. (GA) 0 - - 1 Market Total 9 $403,118 100.00% Dougherty, GA June '14 Total Market # of Deposits Share Rank Institution Branches ($000) (%) 1 Heritage Financial Group Inc. (GA) 3 346,945 25.29 2 Pro Forma Company 4 224,854 16.40 2 SunTrust Banks Inc. (GA) 3 218,517 15.93 3 Regions Financial Corp. (AL) 5 203,212 14.81 4 Southeastern Branches (NC) 3 144,920 10.57 5 Flint Community Bancshares Inc. (GA) 1 140,739 10.26 6 Community Capital Bancshares Inc. (GA) 2 103,970 7.58 7 Ameris Bancorp (GA) 1 79,934 5.83 8 Synovus Financial Corp. (GA) 3 62,955 4.59 9 First State Bancshares of Blakely Inc. (GA) 1 32,142 2.34 10 Capitol City Bancshares Inc. (GA) 1 15,961 1.16 11 PeoplesSouth Bancshares Inc. (GA) 1 15,820 1.15 12 Colony Bankcorp Inc. (GA) 1 6,557 0.48 1 Market Total 25 $1,371,672 100.00%
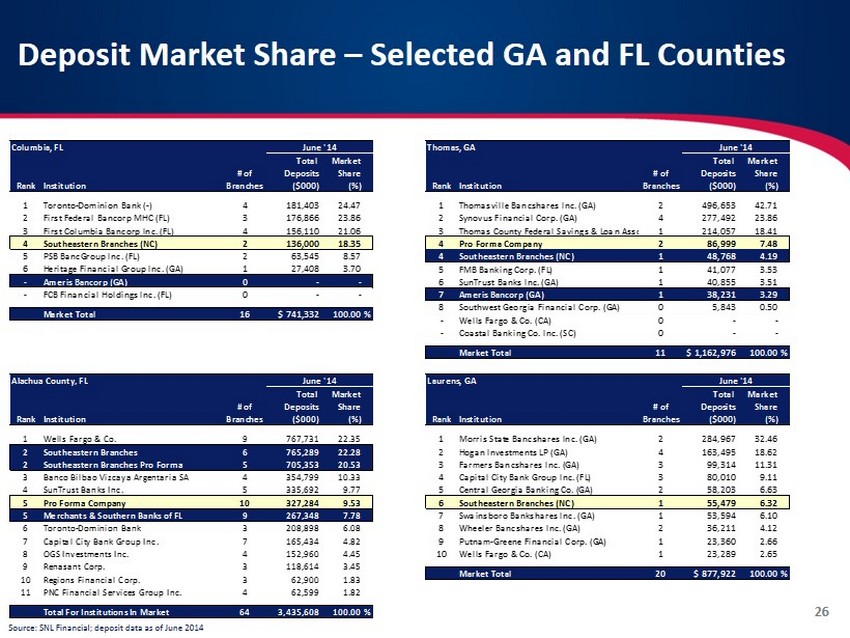
Deposit Market Share – Selected GA and FL Counties Source: SNL Financial; deposit data as of June 2014 26 Laurens, GA June '14 Total Market # of Deposits Share Rank Institution Branches ($000) (%) 1 Morris State Bancshares Inc. (GA) 2 284,967 32.46 2 Hogan Investments LP (GA) 4 163,495 18.62 3 Farmers Bancshares Inc. (GA) 3 99,314 11.31 4 Capital City Bank Group Inc. (FL) 3 80,010 9.11 5 Central Georgia Banking Co. (GA) 2 58,203 6.63 6 Southeastern Branches (NC) 1 55,479 6.32 7 Swainsboro Bankshares Inc. (GA) 1 53,594 6.10 8 Wheeler Bancshares Inc. (GA) 2 36,211 4.12 9 Putnam-Greene Financial Corp. (GA) 1 23,360 2.66 10 Wells Fargo & Co. (CA) 1 23,289 2.65 1 Market Total 20 $877,922 100.00% Thomas, GA June '14 Total Market # of Deposits Share Rank Institution Branches ($000) (%) 1 Thomasville Bancshares Inc. (GA) 2 496,653 42.71 2 Synovus Financial Corp. (GA) 4 277,492 23.86 3 Thomas County Federal Savings & Loan Association (GA)1 214,057 18.41 4 Pro Forma Company 2 86,999 7.48 4 Southeastern Branches (NC) 1 48,768 4.19 5 FMB Banking Corp. (FL) 1 41,077 3.53 6 SunTrust Banks Inc. (GA) 1 40,855 3.51 7 Ameris Bancorp (GA) 1 38,231 3.29 8 Southwest Georgia Financial Corp. (GA) 0 5,843 0.50 - Wells Fargo & Co. (CA) 0 - - - Coastal Banking Co. Inc. (SC) 0 - - 1 Market Total 11 $1,162,976 100.00% Columbia, FL June '14 Total Market # of Deposits Share Rank Institution Branches ($000) (%) 1 Toronto-Dominion Bank (-) 4 181,403 24.47 2 First Federal Bancorp MHC (FL) 3 176,866 23.86 3 First Columbia Bancorp Inc. (FL) 4 156,110 21.06 4 Southeastern Branches (NC) 2 136,000 18.35 5 PSB BancGroup Inc. (FL) 2 63,545 8.57 6 Heritage Financial Group Inc. (GA) 1 27,408 3.70 - Ameris Bancorp (GA) 0 - - - FCB Financial Holdings Inc. (FL) 0 - - 1 Market Total 16 $741,332 100.00% Alachua County, FL June '14 Total Market # of Deposits Share Rank Institution Branches ($000) (%) 1 Wells Fargo & Co. 9 767,731 22.35 2 Southeastern Branches 6 765,289 22.28 2 Southeastern Branches Pro Forma 5 705,353 20.53 3 Banco Bilbao Vizcaya Argentaria SA 4 354,799 10.33 4 SunTrust Banks Inc. 5 335,692 9.77 5 Pro Forma Company 10 327,284 9.53 5 Merchants & Southern Banks of FL 9 267,348 7.78 6 Toronto-Dominion Bank 3 208,898 6.08 7 Capital City Bank Group Inc. 7 165,434 4.82 8 OGS Investments Inc. 4 152,960 4.45 9 Renasant Corp. 3 118,614 3.45 10 Regions Financial Corp. 3 62,900 1.83 11 PNC Financial Services Group Inc. 4 62,599 1.82 1 Total For Institutions In Market 64 3,435,608 100.00%
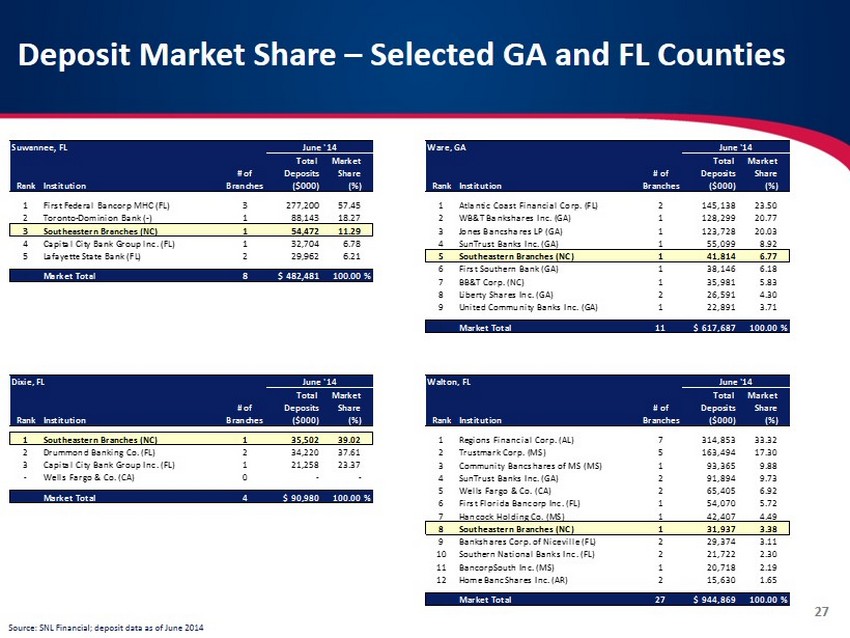
Deposit Market Share – Selected GA and FL Counties Source: SNL Financial; deposit data as of June 2014 27 Dixie, FL June '14 Total Market # of Deposits Share Rank Institution Branches ($000) (%) 1 Southeastern Branches (NC) 1 35,502 39.02 2 Drummond Banking Co. (FL) 2 34,220 37.61 3 Capital City Bank Group Inc. (FL) 1 21,258 23.37 - Wells Fargo & Co. (CA) 0 - - 1 Market Total 4 $90,980 100.00% Walton, FL June '14 Total Market # of Deposits Share Rank Institution Branches ($000) (%) 1 Regions Financial Corp. (AL) 7 314,853 33.32 2 Trustmark Corp. (MS) 5 163,494 17.30 3 Community Bancshares of MS (MS) 1 93,365 9.88 4 SunTrust Banks Inc. (GA) 2 91,894 9.73 5 Wells Fargo & Co. (CA) 2 65,405 6.92 6 First Florida Bancorp Inc. (FL) 1 54,070 5.72 7 Hancock Holding Co. (MS) 1 42,407 4.49 8 Southeastern Branches (NC) 1 31,937 3.38 9 Bankshares Corp. of Niceville (FL) 2 29,374 3.11 10 Southern National Banks Inc. (FL) 2 21,722 2.30 11 BancorpSouth Inc. (MS) 1 20,718 2.19 12 Home BancShares Inc. (AR) 2 15,630 1.65 1 Market Total 27 $944,869 100.00% Ware, GA June '14 Total Market # of Deposits Share Rank Institution Branches ($000) (%) 1 Atlantic Coast Financial Corp. (FL) 2 145,138 23.50 2 WB&T Bankshares Inc. (GA) 1 128,299 20.77 3 Jones Bancshares LP (GA) 1 123,728 20.03 4 SunTrust Banks Inc. (GA) 1 55,099 8.92 5 Southeastern Branches (NC) 1 41,814 6.77 6 First Southern Bank (GA) 1 38,146 6.18 7 BB&T Corp. (NC) 1 35,981 5.83 8 Liberty Shares Inc. (GA) 2 26,591 4.30 9 United Community Banks Inc. (GA) 1 22,891 3.71 1 Market Total 11 $617,687 100.00% Suwannee, FL June '14 Total Market # of Deposits Share Rank Institution Branches ($000) (%) 1 First Federal Bancorp MHC (FL) 3 277,200 57.45 2 Toronto-Dominion Bank (-) 1 88,143 18.27 3 Southeastern Branches (NC) 1 54,472 11.29 4 Capital City Bank Group Inc. (FL) 1 32,704 6.78 5 Lafayette State Bank (FL) 2 29,962 6.21 1 Market Total 8 $482,481 100.00%
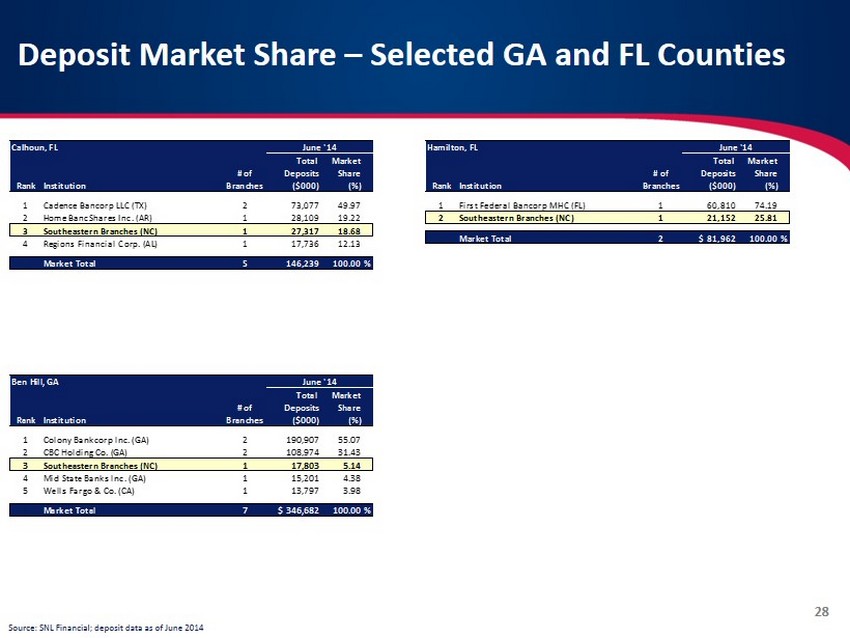
Deposit Market Share – Selected GA and FL Counties Hamilton, FL June '14 Total Market # of Deposits Share Rank Institution Branches ($000) (%) 1 First Federal Bancorp MHC (FL) 1 60,810 74.19 2 Southeastern Branches (NC) 1 21,152 25.81 1 Market Total 2 $81,962 100.00% Source: SNL Financial; deposit data as of June 2014 28 Calhoun, FL June '14 Total Market # of Deposits Share Rank Institution Branches ($000) (%) 1 Cadence Bancorp LLC (TX) 2 73,077 49.97 2 Home BancShares Inc. (AR) 1 28,109 19.22 3 Southeastern Branches (NC) 1 27,317 18.68 4 Regions Financial Corp. (AL) 1 17,736 12.13 1 Market Total 5 146,239 100.00% Ben Hill, GA June '14 Total Market # of Deposits Share Rank Institution Branches ($000) (%) 1 Colony Bankcorp Inc. (GA) 2 190,907 55.07 2 CBC Holding Co. (GA) 2 108,974 31.43 3 Southeastern Branches (NC) 1 17,803 5.14 4 Mid State Banks Inc. (GA) 1 15,201 4.38 5 Wells Fargo & Co. (CA) 1 13,797 3.98 1 Market Total 7 $346,682 100.00%