Attached files
UNITED STATES
SECURITIES AND EXCHANGE COMMISSION
Washington, D.C. 20549
FORM 10-K
x | Annual report pursuant to Section 13 or 15(d) of the Securities Exchange Act of 1934. |
For the fiscal year ended October 31, 2014 | |
OR | |
o | Transition report pursuant to Section 13 or 15(d) of the Securities Exchange Act of 1934. |
For the transition period from to . | |
COMMISSION FILE NUMBER 000-53588 | |
HIGHWATER ETHANOL, LLC
(Exact name of registrant as specified in its charter)
Minnesota | 20-4798531 | |||
(State or other jurisdiction of incorporation or organization) | (I.R.S. Employer Identification No.) | |||
24500 US Highway 14, Lamberton, MN 56152 | ||||
(Address of principal executive offices) | ||||
(507) 752-6160 | ||||
(Registrant's telephone number, including area code) | ||||
Securities registered pursuant to Section 12(b) of the Act: None
Securities registered pursuant to Section 12(g) of the Act: Membership Units
Indicate by check mark if the registrant is a well-known seasoned issuer, as defined in Rule 405 of the Securities Act.
o Yes x No
Indicate by check mark if the registrant is not required to file reports pursuant to Section 13 or 15(d) of the Act.
o Yes x No
Indicate by check mark whether the registrant (1) has filed all reports required to be filed by Section 13 or 15(d) of the Securities Exchange Act of 1934 during the preceding 12 months (or for such shorter period that the registrant was required to file such reports), and (2) has been subject to such filing requirements for the past 90 days.
x Yes o No
Indicate by check mark whether the registrant has submitted electronically and posted on its corporate Web site, if any, every Interactive Data File required to be submitted and posted pursuant to Rule 405 of Regulation S-T (§232.405 of this chapter) during the preceding 12 months (or for such shorter period that the registrant was required to submit and post such files).
x Yes o No
Indicate by check mark if disclosure of delinquent filers pursuant to Item 405 of Regulation S-K (§229.405 of this chapter) is not contained herein, and will not be contained, to the best of registrant's knowledge, in definitive proxy or information statements incorporated by reference in Part III of this Form 10-K or any amendment to this Form 10-K. x
Indicate by check mark whether the registrant is a large accelerated filer, an accelerated filer, a non-accelerated filer, or a smaller reporting company. See the definitions of "large accelerated filer," "accelerated filer" and "smaller reporting company" in Rule 12b-2 of the Exchange Act:
Large Accelerated Filer o | Accelerated Filer o |
Non-Accelerated Filer x | Smaller Reporting Company o |
Indicate by check mark whether the registrant is a shell company (as defined in Rule 12b-2 of the Exchange Act).
o Yes x No
As of April 30, 2014, the aggregate market value of the membership units held by non-affiliates (computed by reference to the most recent offering price of such membership units of $10,000) was $39,085,000. The Company is a limited liability company whose outstanding common equity is subject to significant restrictions on transfer under its Member Control Agreement. No public market for common equity of Highwater Ethanol, LLC is established and it is unlikely in the foreseeable future that a public market for its common equity will develop.
Indicate the number of shares outstanding of each of the issuer's classes of common stock, as of the latest practicable date: As of January 28, 2015, there were 4,953 membership units outstanding.
DOCUMENTS INCORPORATED BY REFERENCE
The registrant has incorporated by reference into Part III of this Annual Report on Form 10-K portions of its definitive proxy statement to be filed with the Securities and Exchange Commission within 120 days after the close of the fiscal year covered by this Annual Report.
1
INDEX
Page Number | |
2
CAUTIONARY STATEMENTS REGARDING FORWARD-LOOKING STATEMENTS
This report contains forward-looking statements that involve future events, our future financial performance and our expected future operations and actions. In some cases, you can identify forward-looking statements by terminology such as “may,” “will,” “should,” “expect,” “plan,” “anticipate,” “believe,” “estimate,” “future,” “intend,” “could,” “hope,” “predict,” “target,” “potential,” or “continue” or the negative of these terms or other similar expressions. These forward-looking statements are only our predictions based on current information and involve numerous assumptions, risks and uncertainties, including, but not limited to those listed below and those business risks and factors described elsewhere in this report and our other Securities and Exchange Commission filings.
Ÿ | Changes in the availability and price of corn and natural gas; |
Ÿ | Reduction or elimination of the Renewable Fuel Standard; |
Ÿ | Our ability to comply with the financial covenants contained in our credit agreements with our lenders; |
Ÿ | Our ability to profitably operate the ethanol plant and maintain a positive spread between the selling price of our products and our raw material costs; |
Ÿ | Results of our hedging activities and other risk management strategies; |
Ÿ | Ethanol and distillers grains supply exceeding demand and corresponding price reductions; |
Ÿ | Our ability to generate cash flow to invest in our business and service our debt; |
Ÿ | Changes in the environmental regulations that apply to our plant operations and changes in our ability to comply with such regulations; |
Ÿ | Changes in our business strategy, capital improvements or development plans; |
Ÿ | Changes in plant production capacity or technical difficulties in operating the plant; |
Ÿ | Changes in general economic conditions or the occurrence of certain events causing an economic impact in the agriculture, oil or automobile industries; |
Ÿ | Lack of transportation, storage and blending infrastructure preventing ethanol from reaching high demand markets; |
Ÿ | Changes in federal and/or state laws or policies impacting the ethanol industry; |
Ÿ | Changes and advances in ethanol production technology and the development of alternative fuels and energy sources and advanced biofuels; |
Ÿ | Competition from alternative fuel additives; |
Ÿ | Changes in interest rates and lending conditions; |
Ÿ | Decreases in the price we receive for our ethanol and distillers grains; |
Ÿ | Volatile financial or commodity markets; |
Ÿ | Our inability to secure credit or obtain additional equity financing we may require in the future; and |
Ÿ | Our ability to retain key employees and maintain labor relations. |
The cautionary statements referred to in this section also should be considered in connection with any subsequent written or oral forward-looking statements that may be issued by us or any persons acting on our behalf. We undertake no duty to update these forward-looking statements, even though our situation may change in the future. Furthermore, we cannot guarantee future results, events, levels of activity, performance, or achievements. We caution you not to put undue reliance on any forward-looking
3
statements, which speak only as of the date of this report. You should read this report and the documents that we reference in this report and have filed as exhibits, completely and with the understanding that our actual future results may be materially different from what we currently expect. We qualify all of our forward-looking statements by these cautionary statements.
AVAILABLE INFORMATION
Information is also available at our website at www.highwaterethanol.com, under “SEC Compliance,” which includes links to reports we have filed with the Securities and Exchange Commission. The contents of our website are not incorporated by reference in this Annual Report on Form 10-K.
PART I
ITEM 1. BUSINESS
Business Development
Highwater Ethanol, LLC (“we,” “our,” “Highwater Ethanol” or the “Company”) was formed as a Minnesota limited liability company organized on May 2, 2006, for the purpose of constructing, owning, and operating a 50 million gallon per year ethanol plant near Lamberton, Minnesota. Since August 2009, we have been engaged in the production of ethanol and distillers grains at the plant. We have been operating at an annual rate of approximately 57 million gallons for the fiscal year ended 2014 and anticipate we will continue to operate in this range in the future.
On November 21, 2013 (with an effective date of November 4, 2013), we entered into a Distillers Crude Corn Oil Marketing Agreement (the "Marketing Agreement") with CHS, Inc. ("CHS") wherein we agreed to sell to CHS, and CHS agrees to purchase, all crude corn oil to be produced at the plant. CHS will pay the actual price that CHS receives from its buyers less a marketing fee, actual freight and transportation costs and certain taxes related to the purchase, delivery or sale of the corn oil. The Marketing Agreement is effective for an initial term which commences on the date on which the plant commences producing corn oil pursuant to our mutual agreement. Following expiration of the initial term, the Marketing Agreement shall automatically renew for successive terms unless terminated in accordance with its terms.
On February 13, 2014, Highwater Ethanol, LLC entered into Amendment No. 1 to the Distiller's Grain Marketing Agreement with CHS, Inc. The amendment imposes a $2.00 per ton cap on the fee paid to CHS, Inc. for marketing the Company's distillers grains.
On February 26, 2014, in connection with and in preparation for the refinancing of our debt facility with First National Bank of Omaha ("FNBO"), we paid $7,639,970.54 towards the balance of our Variable Rate Note leaving a combined balance due of $20,000,000 on our Fixed Rate Note and Variable Rate Note. We also terminated our interest rate swap with FNBO. In connection with terminating the interest rate swap, we paid $234,550.
On February 27, 2014, we entered into a Credit Agreement with AgStar Financial Services, PCA ("AgStar") for the purpose of refinancing our debt facility previously held by FNBO. The Credit Agreement provides for a $20,000,000 Term Loan, a $5,000,000 Term Revolving Loan, and a $5,000,000 Revolving Line of Credit. The specifics of this refinancing are discussed in greater detail in "Item 7 - Management's Discussion and Analysis of Financial Condition and Results of Operations - Liquidity and Capital Resources" below.
In April 2014, we completed installation of our corn oil extraction equipment and began producing corn oil at our plant. Our corn oil is marketed by CHS, Inc.
On September 22, 2014, we entered into an Amended and Restated Credit Agreement with AgStar which amended the Credit Agreement with AgStar. The Company's purpose for amending its credit facility with AgStar was to refinance a portion of certain financing and credit arrangements previously held by U.S. Bank National Association, as trustee, and the City of Lamberton, Minnesota (the “City”). The Amended and Restated Credit Agreement increases the Company's Term Loan to $27,000,000 and also continues to provide the Company with a $5,000,000 Term Revolving Loan, and a $5,000,000 Revolving Line of Credit subject to terms described in "Item 7 - Management's Discussion and Analysis of Financial Condition and Results of Operations - Liquidity and Capital Resources" below.
On November 19, 2014, the board of governors declared a cash distribution of $1,125 per membership unit to the holders of units of record at the close of business on November 19, 2014, for a total distribution of $5,572,125. We paid the distribution on December 16, 2014.
4
We expect to fund our operations during the next 12 months using cash flow from our continuing operations and our current credit facilities.
Financial Information
Please refer to “ITEM 7 - Management's Discussion and Analysis of Financial Condition and Results of Operations” for information about our revenue, profit and loss measurements and total assets and liabilities and “ITEM 8 - Financial Statements and Supplementary Data” for our financial statements and supplementary data.
Principal Products
The principal products we currently produce at the ethanol plant are fuel-grade ethanol and distillers grains. In addition, we are extracting corn oil for sale. The table below shows the approximate percentage of our total revenue which is attributed to each of our products for each of our last three fiscal years.
Product | Fiscal Year 2014 | Fiscal Year 2013 | Fiscal Year 2012 | ||||||
Ethanol | 80 | % | 77 | % | 79 | % | |||
Distiller Grains | 19 | % | 23 | % | 21 | % | |||
Corn Oil | 1 | % | — | — | |||||
Ethanol
Our primary product is ethanol. Ethanol is ethyl alcohol, a fuel component made primarily from corn and various other grains. The ethanol we produce is manufactured from corn. Although the ethanol industry continues to explore production technologies employing various feedstocks, such as biomass, corn-based production technologies remain the most practical and
provide the lowest operating risks. Corn produces large quantities of carbohydrates, which convert into glucose more easily than most other kinds of biomass. The Renewable Fuels Association estimates current capacity for domestic ethanol production at approximately 15.1 billion gallons as of January 8, 2015 with approximately 3% of that capacity idled.
An ethanol plant is essentially a fermentation plant. Ground corn and water are mixed with enzymes and yeast to produce a substance called “beer,” which contains about 10% alcohol and 90% water. The “beer” is boiled to separate the water, resulting in ethyl alcohol, which is then dehydrated to increase the alcohol content. This product is then mixed with a certified denaturant to make the product unfit for human consumption and commercially saleable.
Ethanol can be used as: (i) an octane enhancer in fuels; (ii) an oxygenated fuel additive for the purpose of reducing ozone and carbon monoxide emissions; and (iii) a non-petroleum-based gasoline substitute. Approximately 95% of all ethanol is used in its primary form for blending with unleaded gasoline and other fuel products. Used as a fuel oxygenate, ethanol provides a means to control carbon monoxide emissions in large metropolitan areas. The principal purchasers of ethanol are generally the wholesale gasoline marketer or blender.
Distillers Grains
The principal co-product of the ethanol production process is distillers grains, a high protein, high-energy animal feed supplement primarily marketed to the dairy, poultry, swine and beef industries. Dry mill ethanol processing creates three forms of distiller grains: Distillers Wet Grains with Solubles (“DWS”), Distillers Modified Wet Grains with Solubles (“DMWS”) and Distillers Dried Grains with Solubles (“DDGS”). DWS is processed corn mash that contains approximately 70% moisture. DWS has a shelf life of approximately three days and can be sold only to farms within the immediate vicinity of an ethanol plant. DMWS is DWS that has been dried to approximately 50% moisture. DMWS has a slightly longer shelf life of approximately ten days and is often sold to nearby markets. DDGS is DWS that has been dried to between 10% and 12% moisture. DDGS has an almost indefinite shelf life and may be sold and shipped to any market regardless of its vicinity to an ethanol plant.
Corn Oil
In April 2014, we began separating some of the corn oil contained in our distiller's grains for sale. The corn oil that we produce is not food grade corn oil and therefore cannot be used for human consumption. However, corn oil can be used as the feedstock to produce biodiesel, as a feed ingredient and has other industrial uses.
5
Ethanol, Distillers Grains and Corn Oil Markets
As described below in “Distribution Methods” we market and distribute a majority of our ethanol, distillers grains and corn oil through professional third party marketers. Our ethanol, distillers grains and corn oil marketers make decisions with regard to where our products are marketed.
Our ethanol and distillers grains are primarily sold in the domestic market, however, as domestic production of ethanol and distillers grains continue to expand, we anticipate increased international sales of ethanol and distillers grains. However, due to high transportation costs, and the fact that we are not located near a major international shipping port, we expect a majority of our products to continue to be marketed and sold domestically.
Over the last year, exports of ethanol have increased with Canada receiving the largest percentage of ethanol produced
in the United States and Brazil a distant second. The United Arab Emirates and the Philippines have also been top destinations. Ethanol exports could continue to increase in the future if market conditions are favorable. However, the imposition by the European Union in 2013 of a tariff on ethanol which is produced in the United States has created uncertainty as to the viability of that market for ethanol produced in the United States and may require United States producers to seek out other markets for their products.
The United States ethanol industry exported a significant amount of distillers grains to China and Mexico in 2014. However, demand for distillers grains from China decreased during the second half of 2014 when China announced in June 2014 that it would stop issuing import permits for distillers grains from the United States due to the presence in some shipments of a genetically modified trait not approved for import. This announcement was followed in July 2014 by a new requirement by China of a certification by the United States government that distillers grains shipments to China are free of the genetically modified trait. This dispute was not resolved by officials from the United States and China until December 2014 when China began accepting distillers grain shipments again from the United States.
All of the corn oil we produce is marketed and distributed in the domestic market.
Distribution Methods
Ethanol
We have an exclusive marketing agreement with RPMG, Inc. (“RPMG”) for the purposes of marketing and distributing our ethanol. Because we are an owner of Renewable Products Marketing Group, LLC (“RPMG LLC”), the parent entity of RPMG, our ethanol marketing fees are based on RPMG's cost to market our ethanol. Further, as an owner, we share in the profits and losses generated by RPMG when it markets products for other producers who are not owners of RPMG LLC. Our marketing agreement provides that we can sell our ethanol either through an index arrangement or at an agreed upon fixed price. The term of our marketing agreement is perpetual until terminated according to its terms. The primary reasons for termination would be if we cease to be an owner of RPMG LLC, if there is a breach which is not cured, or if we give advance notice to RPMG that we wish to terminate. Notwithstanding our right to terminate, we may be obligated to continue to market our ethanol through RPMG for a period of time after termination. Further, following termination, we agree to accept an assignment of certain railcar leases which RPMG has secured to service us. If the marketing agreement is terminated, it would trigger a redemption of our ownership interest in RPMG LLC.
Distillers Grains
We have a distillers grains marketing agreement with CHS to market all the dried distillers grains we produce at the plant. Under the agreement, CHS charges a maximum of $2.00 per ton and a minimum of $1.50 per ton price using 2% of the FOB plant price actually received by CHS for all dried distillers grains removed by CHS from our plant. The agreement will remain in effect unless otherwise terminated by either party with 120 days notice. Under the agreement, CHS is responsible for all transportation arrangements for the distribution of our dried distillers grains. We market and sell our own distillers modified wet grains with solubles.
Corn Oil
We have a corn oil marketing agreement with CHS wherein CHS purchases all crude corn oil produced at the plant. CHS pays the actual price that CHS receives from its buyers less a marketing fee, actual freight and transportation costs and certain taxes related to the purchase, delivery or sale of the corn oil. The agreement automatically renews for successive one-year terms unless terminated by either party in accordance with its terms.
6
New Products and Services
In April 2014, we completed installation of our corn oil extraction equipment and began marketing and producing corn oil at our plant.
Sources and Availability of Raw Materials
Corn Feedstock Supply
The major raw material required for our ethanol plant to produce ethanol and distillers grains is corn. To produce 50 million gallons of ethanol per year, our ethanol plant needs approximately 18.5 million bushels of corn per year, or approximately 50,000 bushels of corn per day, as the feedstock for its dry milling process.
We have a grain procurement agreement with Meadowland Farmers Co-op (“Meadowland”). Meadowland has the exclusive right and responsibility to provide us with our daily requirements of corn meeting quality specifications set forth in the grain procurement agreement. Under the agreement, we purchase corn at the local market price delivered to the plant plus a fixed fee per bushel of corn purchased. We provide Meadowland with an estimate of our usage at the beginning of each fiscal quarter and Meadowland agrees to at all times maintain a minimum of 7 days corn usage at our ethanol plant. The initial term of the agreement is for seven years from the time we requested our first delivery of corn, which was in July 2009.
The price at which we purchase corn depends on prevailing market prices. Increases in the price of corn significantly increase our cost of goods sold. If these increases in cost of goods sold are not offset by corresponding increases in the prices we receive from the sale of our products, these increases in cost of goods sold can have a significant negative impact on our financial performance. Corn prices were lower during our 2014 fiscal year compared to the same period in 2013 due to a large 2013 corn crop which increased domestic corn supply and resulted in a larger carryover.
On November 10, 2014, the United States Department of Agriculture ("USDA") released a report estimating the 2014 corn crop at 14.4 billion bushels with yields averaging 173.4 bushels per acre. This would represent a new record yield and production in the United States. The USDA forecasted the area harvested for grain at 83.1 million acres, down 5% from 2013. Management expects that corn prices will remain lower through the winter of 2014 as a result of an increase in supply. However, weather, world supply and demand, current and anticipated stocks, agricultural policy and other factors can contribute to volatility in corn prices. If corn prices rise again, it will have a negative effect on our operating margins unless the price of ethanol and distillers grains out paces rising corn prices. Should we experience unfavorable operating conditions that prevent us from profitably operating the ethanol plant, we may need to reduce or halt production at our plant.
Utilities
Natural Gas
Natural gas is an important input to our manufacturing process. We use natural gas to dry our distillers grains products to moisture contents at which they can be stored for longer periods. This allows the distillers grains we produce to be transported greater distances to serve broader livestock markets.
We have access to an existing Northern Natural Gas interstate natural gas pipeline located approximately one half mile from our ethanol plant. We entered into a natural gas service agreement with CenterPoint Energy Resources Corp., d.b.a. CenterPoint Energy Minnesota Gas (“CenterPoint”). CenterPoint constructed for us a pipeline from the Northern Natural Gas Company (“Northern”) Town Border Station. We purchase all of our natural gas requirements from CenterPoint's pipeline. This agreement will continue until October 31, 2019.
We also have an energy management agreement with U.S. Energy Services, Inc. (“US Energy”) pursuant to which US Energy is providing us with the necessary natural gas management services. Some of their services may include an economic comparison of distribution service options, negotiation and minimization of interconnect costs, submission of the necessary pipeline “tap” request, supplying the plant with and/or negotiating the procurement of natural gas, development and implementation of a price risk management plan targeted at mitigating natural gas price volatility and maintaining profitability, providing consolidated monthly invoices that reflect all natural gas costs. In addition, US Energy is responsible for reviewing and reconciling all invoices. In exchange for these services, we pay US Energy a monthly retainer fee.
We do not anticipate any problems securing the natural gas we need to operate our ethanol plant during our 2015 fiscal year.
7
Electricity
On June 28, 2007, we entered into an agreement for electric service with Redwood Electric Cooperative, Inc., (“Redwood”) for the purchase and delivery of electric power and energy necessary to operate our ethanol plant. In exchange for its services, we pay Redwood a monthly facilities charge of approximately $12,000 plus Redwood's standard electrical rates. In addition, we agreed that in the event our ethanol plant does not continue to be operational for the entire term of the contract, we will reimburse Redwood for its expenses related to the installation of the facilities necessary to supply our electrical needs. Upon execution of the agreement, we became a member of Redwood and are bound by its articles of incorporation and bylaws. This agreement will remain in effect for 10 years following the initial billing period. In the event we wish to continue receiving electrical service from Redwood beyond the 10 year period, we will need to enter into a new agreement with Redwood at least one year prior to the expiration of the initial 10 year period. If the agreement is terminated by either party for any reason prior to the expiration of the initial ten year period, we will be required to pay for the entire amount of the facility charge for the remainder of the initial ten year period. We do not anticipate any problems securing the electricity we need to operate our ethanol plant during our 2015 fiscal year.
Water
We require a significant supply of water. We obtain water from a high capacity well. We acquired all of the necessary permits required for our water usage. Much of the water used in an ethanol plant is recycled back into the process. There are, however, certain areas of production where fresh water is needed. Those areas include the boiler makeup water and cooling tower water. Boiler makeup water is treated on-site to minimize all elements that will harm the boiler and recycled water cannot be used for this process. Cooling tower water is deemed non-contact water because it does not come in contact with the mash, and, therefore, can be regenerated back into the cooling tower process. The makeup water requirements for the cooling tower are primarily a result of evaporation. Much of our water can be recycled back into the process, which minimizes the discharge water. We expect this will have the long-term effect of lowering wastewater treatment costs. We have assessed our water needs and determined we have an adequate supply.
Research and Development
We continually conduct research and development activities associated with the development of new technologies for use in producing ethanol and distillers grains and the potential for implementation of biobutanol technology and commercial-scale production of biobutanol at our facility. Our costs associated with these activities for the fiscal year ended October 31, 2014 were insignificant.
Patents, Trademarks, Licenses, Franchises and Concessions
We do not currently hold any patents, trademarks, franchises or concessions. We were granted a license by ICM, Inc. to use certain ethanol production technology necessary to operate our ethanol plant. The cost of the license granted by ICM, Inc. was included in the amount we paid to Fagen, Inc. to design and build our ethanol plant. We were granted a license by Butamax Advanced Biofuels, LLC ("Butamax") to use certain corn oil separation technology in exchange for payment of certain license fees which are subject to being reduced under the terms of the Agreements if the corn oil separation system does not meet certain performance goals.
Seasonality Sales
We experience some seasonality of demand for our ethanol. Since ethanol is predominantly blended with conventional gasoline for use in automobiles, ethanol demand tends to shift in relation to gasoline demand. As a result, we experience some seasonality of demand for ethanol in the summer months related to increased driving. In addition, we experience some increased ethanol demand during holiday seasons related to increased gasoline demand.
Working Capital
We primarily use our working capital for purchases of raw materials necessary to operate the ethanol plant. Our primary sources of working capital are cash generated by our operations as well as our line of credit with AgStar. At October 31, 2014, we had approximately $5,000,000 available to draw on our line of credit.
8
Dependence on One or a Few Major Customers
As discussed above, we have a marketing agreement with RPMG for the marketing, sale and distribution of our ethanol and have engaged CHS, Inc. for marketing, selling and distributing our distillers dried grains with solubles and corn oil. We expect to rely on RPMG for the sale and distribution of our ethanol and CHS for the sale and distribution of our distillers dried grains with solubles and corn oil. Therefore, although there are other marketers in the industry, we are highly dependent on RPMG and CHS for the successful marketing of our products. Any loss of RPMG or CHS as our marketing agents could have a significant negative impact on our revenues. We market and sell our own distillers modified wet grains.
Federal Ethanol Supports and Governmental Regulation
Federal Ethanol Supports
The ethanol industry is dependent on several economic incentives to produce ethanol, including federal tax incentives and ethanol use mandates. One significant federal ethanol support is the Federal Renewable Fuels Standard (the “RFS”). The RFS requires that in each year, a certain amount of renewable fuels must be used in the United States. The RFS is a national program that does not require that any renewable fuels be used in any particular area or state, allowing refiners to use renewable fuel blends in those areas where it is most cost-effective. The RFS statutory volume requirement increases incrementally each year until the United States is required to use 36 billion gallons of renewable fuels by 2022. Starting in 2009, the RFS required that a portion of the RFS must be met by certain “advanced” renewable fuels. These advanced renewable fuels include ethanol that is not made from corn, such as cellulosic ethanol and biomass based biodiesel. The use of these advanced renewable fuels increases each year as a percentage of the total renewable fuels required to be used in the United States.
The United States Environmental Protection Agency (the "EPA") has the authority to waive the RFS statutory volume requirement, in whole or in part, provided one of the following two conditions have been met: (1) there is inadequate domestic renewable fuel supply; or (2) implementation of the requirement would severely harm the economy or environment of a state, region or the United States. Annually, the EPA passes a rule that establishes the number of gallons of different types of renewable fuels that must be used in the United States which is called the renewable volume obligations.
The RFS statutory volume requirement for 2014 is approximately 18.15 billion gallons, of which corn based ethanol can be used to satisfy approximately 14.4 billion gallons. The RFS statutory volume requirement for 2015 is approximately 20.5 billion gallons, of which corn based ethanol can be used to satisfy approximately 15 billion gallons. However, on November 15, 2013, the EPA announced a proposal to significantly reduce the RFS levels for 2014 to 15.21 billion gallons of which corn based ethanol could be used to satisfy only 13 billion gallons. This proposed rule would result in a lowering of the 2014 standard below the 2013 level of 13.8 billion gallons. The EPA also sought comment on several petitions it has received for partial waiver of the statutory volumes for 2014. The 60-day public comment period ended on January 28, 2014 and the rule was submitted by the EPA to the Office of Management and Budget ("OMB") for review on August 22, 2014. Furthermore, there have also been recent proposals in Congress to reduce or eliminate the RFS. On November 21, 2014, the EPA announced that it would delay finalizing the rule on the 2014 RFS standards until after the end of 2014. The EPA indicated that it intends to take action on the 2014 standards in 2015 prior to or in conjunction with action on the 2015 standards. If the EPA's proposal becomes a final rule significantly reducing the volume requirements under the RFS or if the RFS were to be otherwise reduced or eliminated by the exercise of the EPA waiver authority or by Congress, the market price and demand for ethanol could decrease which will negatively impact our financial performance. Current ethanol production capacity exceeds the EPA's proposed 2014 standard which can be satisfied by corn based ethanol.
In February 2010, the EPA issued addtional regulations governing the RFS. These additional regulations have been called RFS2. The most controversial part of RFS2 involves what is commonly referred to as the lifecycle analysis of greenhouse gas emissions. Specifically, the EPA adopted rules to determine which renewable fuels provided sufficient reductions in greenhouse gases, compared to conventional gasoline, to qualify under the RFS program. RFS2 establishes a tiered approach, where regular renewable fuels are required to accomplish a 20% greenhouse gas reduction compared to gasoline, advanced biofuels and biomass-based biodiesel must accomplish a 50% reduction in greenhouse gases, and cellulosic biofuels must accomplish a 60% reduction in greenhouse gases. Any fuels that fail to meet this standard cannot be used by fuel blenders to satisfy their obligations under the RFS program. The scientific method of calculating these greenhouse gas reductions has been a contentious issue. Many in the ethanol industry were concerned that corn based ethanol would not meet the 20% greenhouse gas reduction requirement based on certain parts of the environmental impact model that many in the ethanol industry believed was scientifically suspect. However, RFS2 as adopted by the EPA provides that corn-based ethanol from modern ethanol production processes does meet the definition of a renewable fuel under the RFS program. Our ethanol plant was grandfathered into the RFS due to the fact that it was constructed prior to the effective date of the lifecycle greenhouse gas requirement and is not required to prove compliance with the lifecycle greenhouse gas reductions. Many in the ethanol industry are concerned that certain provisions of RFS2 as adopted may
9
disproportionately benefit ethanol produced from sugarcane. This could make sugarcane based ethanol, which is primarily produced in Brazil, more competitive in the United States ethanol market. If this were to occur, it could reduce demand for the ethanol that we produce.
Most ethanol that is used in the United States is sold in a blend called E10. E10 is a blend of 10% ethanol and 90% gasoline. E10 is approved for use in all standard vehicles. Estimates indicate that the 2014 gasoline demand in the United States will be approximately 135 billion gallons. Assuming that all gasoline in the United States is blended at a rate of 10% ethanol and 90% gasoline, the maximum demand for ethanol is 13.5 billion gallons per year. This is commonly referred to as the “blending wall,” which represents a theoretical limit where more ethanol cannot be blended into the national gasoline pool. This is a theoretical limit because it is believed that it would not be possible to blend ethanol into every gallon of gasoline that is being used in the United States and it discounts the possibility of additional ethanol used in higher percentage blends such as E85 used in flex fuel vehicles.
The EPA has approved the use of E15, gasoline which is blended at a rate of 15% ethanol and 85% gasoline, in vehicles manufactured in the model year 2001 and later. However, there were still significant federal and state regulatory hurdles that needed to be addressed. The EPA has made gains towards clearing those federal regulatory hurdles. In February 2012, the EPA approved health effects and emissions testing on E15 which was required by the Clean Air Act before E15 can be sold into the market. In March 2012, the EPA approved a model Misfueling Mitigation Plan and fuel survey which must be submitted by applicants before E15 registrations can be approved. In April 2012, the EPA approved the first E15 registrations approving twenty producers who have successfully registered their product to be used as E15. Finally, in June 2012, the EPA gave the final approval to allow the sale of E15. Although management believes that these developments are significant steps towards introduction of E15 in the marketplace, there are still obstacles to meaningful market penetration by E15. Many states still have regulatory issues that prevent the sale of E15. Sales of E15 may be limited because it is not approved for use in all vehicles, the EPA requires a label that management believes may discourage consumers from using E15, and retailers may choose not to sell E15 due to concerns regarding liability. In addition, different gasoline blendstocks may be required at certain times of the year in order to use E15 due to federal regulations related to fuel evaporative emissions. This may prevent E15 from being used during certain times of the year in various states. As a result, management believes that E15 may not have an immediate impact on ethanol demand in the United States.
The Volumetric Ethanol Excise Tax Credit ("VEETC") provided a volumetric ethanol excise tax credit of 4.5 cents per gallon of gasoline that contains at least 10% ethanol (total credit of 45 cents per gallon of ethanol blended which is 4.5 divided by the 10% blend). VEETC expired on December 31, 2011. In addition to the expiration of the tax incentives, a 54 cent per gallon tariff imposed on ethanol imported into the United States also expired on December 31, 2011. The ethanol industry in the United States experienced increased competition from ethanol produced outside of the United States during 2012. These increased ethanol imports were likely at least in part due to the expiration of the tariff on imported ethanol. However, ethanol imports have decreased in 2013 and 2014.
Effect of Governmental Regulation
The government's regulation of the environment changes constantly. We are subject to extensive air, water and other environmental regulations and we have been required to obtain a number of environmental permits to construct and operate the plant. It is possible that more stringent federal or state environmental rules or regulations could be adopted, which could increase our operating costs and expenses. It also is possible that federal or state environmental rules or regulations could be adopted that could have an adverse effect on the use of ethanol. For example, changes in the environmental regulations regarding the required oxygen content of automobile emissions could have an adverse effect on the ethanol industry. Plant operations are governed by the Occupational Safety and Health Administration (“OSHA”). OSHA regulations may change such that the costs of operating the plant may increase. Any of these regulatory factors may result in higher costs or other adverse conditions effecting our operations, cash flows and financial performance.
In late 2009, California passed a Low Carbon Fuels Standard ("LCFS"). The California LCFS requires that renewable fuels used in California must accomplish certain reductions in greenhouse gases which is measured using a lifecycle analysis, similar to the RFS. On December 29, 2011, a federal district court in California ruled that the California LCFS was unconstitutional which halted implementation of the California LCFS. However, the California Air Resources Board ("CARB") appealed this court ruling and on September 18, 2013, the federal appellate court reversed the federal district court finding the LCFS constitutional and remanding the case back to federal district court to determine whether the LCFS imposes a burden on interstate commerce that is excessive in light of the local benefits. On June 30, 2014, the United States Supreme Court declined to hear the appeal of the federal appellate court ruling. In addition, a state court in California required that CARB take certain corrective actions regarding the approval of the LCFS regulations while allowing the LCFS regulations to remain in effect during this process. If
10
federal and state challenges to the LCFS are ultimately unsuccessful, the LCFS could have a negative impact on demand for corn-based ethanol and result in decreased ethanol prices.
Competition
Ethanol
We are in direct competition with numerous ethanol producers, many of whom have greater resources than we do. Following the significant growth during 2005 and 2006, the ethanol industry has grown at a much slower pace. As of January 8, 2015, the Renewable Fuels Association estimates that there are 213 ethanol production facilities in the U.S. with capacity to produce approximately 15.1 billion gallons of ethanol and another 3 plants under expansion or construction with capacity to produce an additional 100 million gallons. However, the Renewable Fuels Association estimates that approximately 3% of the ethanol production capacity in the United States is currently idled.
Since ethanol is a commodity product, competition in the industry is predominantly based on price. We have also experienced increased competition from oil companies who have started purchasing ethanol production facilities. These oil companies are required to blend a certain amount of ethanol each year. Therefore, the oil companies may be able to operate their ethanol production facilities at times when it is unprofitable for us to operate. Larger ethanol producers may be able to realize economies of scale that we are unable to realize. This could put us at a competitive disadvantage to other ethanol producers. The ethanol industry is continuing to consolidate where a few larger ethanol producers are increasing their production capacities and are controlling a larger portion of the United States ethanol production. Further, some ethanol producers own multiple ethanol plants which may allow them to compete more effectively by providing them flexibility to run certain production facilities while they have other facilities shut down. This added flexibility may allow these ethanol producers to compete more effectively, especially during periods when operation margins are unfavorable in the ethanol industry.
The largest ethanol producers include Archer Daniels Midland, Flint Hill Resources, Green Plains Renewable Energy, POET Biorefining and Valero Renewable Fuels, each of which are capable of producing significantly more ethanol than we produce. The following table identifies the majority of the largest ethanol producers in the United States along with their production capacities.
U.S. FUEL ETHANOL PRODUCTION CAPACITY
BY TOP PRODUCERS
Producers of Approximately 500
million gallons per year (mmgy) or more
Company | Current Capacity (mmgy) | |
Archer Daniels Midland | 1,762.0 | |
POET Biorefining | 1,626.0 | |
Valero Renewable Fuels | 1,240.0 | |
Green Plains Renewable Energy | 1,004.0 | |
Flint Hill Resources | 760.0 | |
Updated: January 8, 2015
The ethanol industry in the United States experienced increased competition from ethanol produced outside of the United States during 2012 which was likely the result of the expiration of the tariff on imported ethanol which expired on December 31, 2011. Although ethanol imports decreased in 2013 and 2014, increased competition from ethanol imports may continue to have
a negative impact on demand for ethanol produced in the United States which could result in lower operating margins.
We also anticipate increased competition from renewable fuels that do not use corn as the feedstock. Many of the current ethanol production incentives are designed to encourage the production of renewable fuels using raw materials other than corn. One type of ethanol production feedstock is cellulose. Cellulose is the main component of plant cell walls and is the most common organic compound on earth. Cellulose is found in wood chips, corn stalks, rice, straw, amongst other common plants. Cellulosic ethanol is ethanol produced from cellulose. Several companies and researchers have commenced pilot projects to study the feasibility of commercially producing cellulosic ethanol and are producing cellulosic ethanol on a small scale and at least three companies have reportedly begun producing on a commercial scale in the United States. A handful of other companies have begun
11
constructing commercial scale cellulosic ethanol plants in the United States some of which are expected to be operational in the first quarter of 2015. If this technology can be profitably employed on a commercial scale, it could potentially lead to ethanol that is less expensive to produce than corn based ethanol, especially if corn prices remain high. Cellulosic ethanol may also capture more government subsidies and assistance than corn based ethanol. This could decrease demand for our product or result in competitive disadvantages for our ethanol production process.
Our ethanol plant also competes with producers of other gasoline additives having similar octane and oxygenate values as ethanol. Alternative fuels, gasoline oxygenates and alternative ethanol production methods are also continually under development. The major oil companies have significantly greater resources than we have to market other additives, to develop alternative products, and to influence legislation and public perception of ethanol. These companies also have sufficient resources to begin production of ethanol should they choose to do so.
A number of automotive, industrial and power generation manufacturers are developing alternative clean power systems using fuel cells, plug-in hybrids, electric cars or clean burning gaseous fuels. Electric car technology has grown in popularity, especially in urban areas. While currently there are a limited number of vehicle recharging stations, making electric cars not feasible for all consumers, there has been increased focus on developing these recharging stations which may make electric car technology more widely available in the future. This additional competition from alternate sources could reduce the demand for ethanol, which would negatively impact our profitability.
Distillers Grains
Ethanol plants in the Midwest produce the majority of distillers grains and primarily compete with other ethanol producers in the production and sales of distillers grains. According to the Renewable Fuels Association's Ethanol Industry Outlook 2014, ethanol plants produced more than 35.5 million metric tons of distillers grains in 2012/2013 and are expected to produce an estimated 37.8 million metric tons in 2013/2014. The amount of distillers grains produced is expected to fluctuate with changes in ethanol production.
The primary consumers of distillers grains are dairy and beef cattle, according to the Renewable Fuels Association's Ethanol Industry Outlook 2014. In recent years, an increasing amount of distillers grains have been used in the swine and poultry markets. Numerous feeding trials show advantages in milk production, growth, rumen health, and palatability over other dairy cattle feeds. With the advancement of research into the feeding rations of poultry and swine, we expect these markets to expand and create additional demand for distillers grains; however, no assurance can be given that these markets will in fact expand, or if they do, that we will benefit from it. The market for distillers grains is generally confined to locations where freight costs allow it to be competitively priced against other feed ingredients. Distillers grains compete with three other feed formulations: corn gluten feed, dry brewers grain and mill feeds. The primary value of these products as animal feed is their protein content. Dry brewers grain and distillers grains have about the same protein content, and corn gluten feed and mill feeds have slightly lower protein contents.
Cost of Compliance with Environmental Laws
We are subject to extensive air, water and other environmental regulations and we were required to obtain a number of environmental permits to construct and operate the plant. Although we have been successful in obtaining all of the permits currently required, any retroactive change in environmental regulations, either at the federal or state level, could require us to obtain additional or new permits or spend considerable resources in complying with such regulations. Additionally, any changes that are made to the ethanol plant or its operations must be reviewed to determine if amended permits need to be obtained in order to implement these changes.
During the fiscal year ended October 31, 2014, we incurred costs and expenses of approximately $473,000 complying with environmental laws.
Butamax Advanced Biofuels Letter of Intent
In November 2011, we signed a non-binding letter of intent with Butamax for the purpose of discussing the possible implementation of biobutanol technology and commercial-scale production of biobutanol at our facility. We have entered into a series of definitive agreements with Butamax pursuant to which Butamax has constructed, installed and leases its corn oil separation system and licenses to the Company its corn oil separation technology. Please refer to “ITEM 1 - Business-Business Development” and “ITEM 7 - Management's Discussion and Analysis of Financial Condition and Results of Operations - Liquidity and Capital Resources.” The installation of the corn oil separation system is part of a Phase 1 project working towards the implementation of biobutanol technology at our facility. However, Phase 2 will be dependent on completion of separate
12
definitive agreements for biobutanol production. Management expects to work with Butamax towards the execution of these definitive agreements in the future. However, there is no guarantee that definitive agreements to implement biobutanol technology will be executed.
Employees
As of October 31, 2014, we had 40 full-time employees.
Financial Information about Geographic Areas
All of our operations are domiciled in the United States. All of the products sold to our customers for fiscal years 2014, 2013 and 2012 were produced in the United States and all of our long-lived assets are domiciled in the United States. We have engaged third-party professional marketers that decide where the majority of our products are marketed and we have limited control over the marketing decisions made by our third-party professional marketers. These third-party marketers may decide to sell our products in countries other than the United States. However, we anticipate that our products will primarily be marketed and sold in the United States.
ITEM 1A. RISK FACTORS
You should carefully read and consider the risks and uncertainties below and the other information contained in this report. The risks and uncertainties described below are not the only ones we face. The following risks, together with additional risks and uncertainties not currently known to us or that we currently deem immaterial could impair our financial condition and results of operations.
Risks Relating to Our Business
A decrease in the spread between the price we receive for our products and the price we pay for raw materials will have an adverse effect on our profitability. Our ability to profitably operate the ethanol plant is primarily dependent on the spread between the price we pay for corn and natural gas and the price we receive for our ethanol. While the price of ethanol typically changes in relation to corn prices, this correlation has not always been reliable historically and may not always exist. In the event that the spread between the price for our products and the costs associated with our raw materials becomes negative, we may be unable to maintain our liquidity which may adversely impact our ability to profitably operate which could negatively impact the value of our units.
Declines in the price of ethanol or distillers grains would reduce our revenues. The sale prices of ethanol and distillers grains can be volatile as a result of a number of factors such as overall supply and demand, the price of gasoline and corn, levels of government support, and the availability and price of competing products. Any lowering of ethanol or distillers grains prices, especially if it is associated with increases in corn and natural gas prices, may affect our ability to operate profitably. We anticipate the price of ethanol and distillers grains to continue to be volatile in our 2015 fiscal year. Declines in the prices we receive for our ethanol and distillers grains will lead to decreased revenues and may result in our inability to operate the ethanol plant profitably for an extended period of time which could decrease the value of our units.
Increases in the price of corn or natural gas would reduce our profitability. Our primary source of revenue is from the sale of ethanol and distillers grains. Our results of operations and financial condition are significantly affected by the cost and supply of corn and natural gas. Changes in the price and supply of corn and natural gas are subject to and determined by market forces over which we have no control including weather and general economic factors. Generally, higher corn prices will produce lower profit margins and, therefore, negatively affect our financial performance. If a period of high corn prices were to be sustained for some time, such pricing may reduce our ability to operate profitably because of the higher cost of operating our plant. We may not be able to offset any increase in the price of corn by increasing the price of our products. If we cannot offset increases in the price of corn, our financial performance may be negatively affected.
The prices for and availability of natural gas are subject to volatile market conditions. These market conditions often are affected by factors beyond our control such as higher prices as a result of colder than average weather conditions or natural disasters, overall economic conditions and foreign and domestic governmental regulations and relations. Significant disruptions in the supply of natural gas could impair our ability to manufacture ethanol and more significantly, distillers grains for our customers. Furthermore, increases in natural gas prices or changes in our natural gas costs relative to natural gas costs paid by competitors may adversely affect our results of operations and financial condition.
13
We engage in hedging transactions which involve risks that could harm our business. We are exposed to market risk from changes in commodity prices. Exposure to commodity price risk results from our dependence on corn and natural gas in the ethanol production process, along with sales of ethanol and distillers grains. We seek to minimize the risks from fluctuations in the prices of corn and natural gas through the use of derivative instruments. The effectiveness of our hedging strategies is dependent on the price of corn and natural gas and our ability to sell sufficient products to use all of the products for which we have futures contracts. Our hedging activities may not successfully reduce the risk caused by price fluctuation which may leave us vulnerable to high prices. Alternatively, we may choose not to engage in hedging transactions in the future and our operations and financial conditions may be adversely affected during periods in which prices increase. Utilizing cash for margin calls has an impact on the cash we have available for operations which could result in liquidity problems. Price movements in corn contracts are highly volatile and are influenced by many factors that are beyond our control. There are several variables that could affect the extent to which our derivative instruments are impacted by price fluctuations in the cost of corn. We may incur such costs and they may be significant which could impact our ability to profitably operate the plant and may reduct the value of our units.
Our business is not diversified. Our success depends almost entirely on our ability to profitably operate our ethanol plant. We do not have any other lines of business or other sources of revenue if we are unable to operate our ethanol plant and manufacture ethanol and distillers grains. If economic or political factors adversely affect the market for ethanol or distillers grains, we have no other line of business to fall back on. Our business would also be significantly harmed if the ethanol plant could not operate at full capacity for any extended period of time.
We have signed a letter of intent with Butamax Advanced Biofuels, LLC for the purpose of discussing the implementation of biobutanol technology at our facility; however, we may not be able to reach definitive agreements and, in the event we proceed with biobutanol technology, there are no assurances that the technology will be effective or that there will be a market for biobutanol. We entered into a letter of intent with Butamax for the purpose of discussing the conversion of our ethanol facility to a biobutanol facility. This is dependent on our executing definitive agreements related to biobutanol production. We may never enter into these definitive agreements with Butamax and therefore, may never convert our ethanol facility to a biobutanol facility. In the event we do proceed with definitive agreements and convert our facility to a biobutanol facility, there are no assurances that the biobutanol technology as developed by Butamax will be effective. Even if the technology were to be effective, there is no assurance that we would be able to profitably market the biobutanol.
If RPMG, which markets all of our ethanol, fails it may negatively impact our ability to profitably operate the ethanol plant. All of our ethanol is marketed by RPMG. Therefore, nearly all of our revenue is derived from sales that are secured by RPMG. If RPMG is unable to market our ethanol, it may negatively impact our ability to profitably operate the ethanol plant. While management believes that we could secure an alternative marketer if RPMG were to fail, switching marketers may negatively impact our cash flow and our ability to continue to operate profitably, which may decrease the value of our units.
We depend on our management and key employees, and the loss of these relationships could negatively impact our ability to operate profitably. We are highly dependent on our management team to operate our ethanol plant. We may not be able to replace these individuals should they decide to cease their employment with us, or if they become unavailable for any other reason. While we seek to compensate our management and key employees in a manner that will encourage them to continue their employment with us, they may choose to seek other employment. Any loss of these executive officers and key employees may prevent us from operating the ethanol plant profitably and could decrease the value of our units.
Changes and advances in ethanol production technology could require us to incur costs to update our plant or could otherwise hinder our ability to compete in the ethanol industry or operate profitably. Advances and changes in the technology of ethanol production are expected to occur. Such advances and changes may make the ethanol production technology installed in our plant less desirable or obsolete. These advances could also allow our competitors to produce ethanol at a lower costs than we are able. If we are unable to adopt or incorporate technological advances, our ethanol production methods and processes could be less efficient than our competitors, which could cause our plant to become uncompetitive or completely obsolete. If our competitors develop, obtain or license technology that is superior to ours or that makes our technology obsolete, we may be required to incur significant costs to enhance or acquire new technology so that our ethanol production remains competitive. Alternatively, we may be required to seek third-party licenses, which could also result in significant expenditures. These third-party licenses may not be available or, once obtained, they may not continue to be available on commercially reasonable terms. These costs could negatively impact our financial performance by increasing our operating costs and reducing our net income.
Our existing debt financing agreements contain, and our future debt financing agreements may contain, restrictive covenants that limit distributions and impose restrictions on the operation of our business. The use of debt financing makes it more difficult for us to operate because we must make principal and interest payments on the indebtedness and abide by covenants contained in our debt financing agreements. Although we have significantly reduced our level of debt, the restrictive covenants contained in our financing agreements may have important implications on our operations, including, among other things: (a)
14
limiting our ability to obtain additional debt or equity financing; (b) placing us at a competitive disadvantage because we may be more leveraged than some of our competitors; (c) subjecting all or substantially all of our assets to liens, which means that there may be no assets left for unit holders in the event of a liquidation; and (d) limiting our ability to make business and operational decisions regarding our business, including, among other things, limiting our ability to pay dividends to our unit holders, make capital improvements, sell or purchase assets or engage in transactions we deem to be appropriate and in our best interest.
We may violate the terms of our credit and capital lease agreement, including the financial covenants, which could result in our lenders demanding immediate repayment. Our credit and capital lease agreement include various financial loan covenants. We are currently in compliance with our loan covenants and management projections predict that we will be in compliance with our loan covenants for at least the next 12 months. However, unforeseen circumstances may develop which could result in us violating our loan covenants. If we violate the terms of our credit agreements, including our financial loan covenants, our lenders could deem us to be in default of our loans and require us to immediately repay the entire outstanding balance of our loans. If we do not have the funds available to repay the loans or we cannot find another source of financing, we may fail which could decrease or eliminate the value of our units.
Our inability to secure credit facilities we may require in the future could negatively impact our liquidity. While we do not currently require more financing than we have, in the future we may need additional financing. If we require financing in the future and are unable to secure such financing, or we are unable to secure the financing we require on reasonable terms, it may have a negative impact on our liquidity which could negatively impact the value of our units.
Our operations may be negatively impacted by natural disasters, severe weather conditions, and other unforeseen plant shutdowns which can negatively impact our operations. Our operations may be negatively impacted by events outside of our control such as natural disasters, severe weather including flooding and droughts, strikes, train derailments and other unforeseen events which may negatively impact our operations. If we experience any of these unforeseen circumstances which could negatively impact our operations, it may affect our cash flow and negatively impact the value of our business.
We may incur casualty losses that are not covered by insurance which could negatively impact the value of our units. We have purchased insurance which we believe adequately covers our losses from foreseeable risks. However, there are risks that we may encounter for which there is no insurance or for which insurance is not available on terms that are acceptable to us. If we experience a loss which materially impairs our ability to operate the ethanol plant which is not covered by insurance, the value of our units could be reduced or eliminated.
Risks Related to Ethanol Industry
Lack of rail transportation infrastructure and delayed rail shipments have resulted in rail logistical problems which could negatively impact our financial performance. The ethanol industry has recently been experiencing difficulty transporting the ethanol which is produced. Ethanol is typically shipped by rail. Increased shipments of coal and oil by rail, decreased shipment capacity by the railroads due to fewer railroad crews, and poor weather conditions have resulted in slowed rail travel and loading times. Delays in returning rail cars to our plant have resulted in ethanol storage capacity constraints which increases our ethanol inventory and has even required us to reduce production at our plant at times which has reduced revenue and negatively affected our financial performance. If rail logistical problems persist, they may negatively impact our ability to operate the ethanol plant profitably which could reduce the value of our units.
If China were to reinstate the ban on imports of distillers grains from the U.S or if exports of distillers grains to China were to be otherwise disrupted that could have a negative effect on the price of distillers grains in the U.S. and negatively affect our profitability. China, the largest buyer of distillers grains in the world, announced in June 2014 that it would stop issuing import permits for U.S. distillers grains due to the presence of a genetically modified trait not approved by China for import. This announcement was followed in July 2014 by an announcement of a new requirement by China of a certification by the U.S. government that distillers grains shipments to China are free of the genetically modified trait. Officials from the U.S and China were able to resolve the dispute in December 2014 and the export market to China was then re-opened. However, if China were to reinstate the ban or if exports to China were to be disrupted again in the future for any reason, export demand of distillers grains could be significantly reduced as a result. If export demand of distillers grains were to be significantly reduced, the price of distillers grains in the U.S. would likely decline which would have a negative effect on our revenue and could impact our ability to profitably operate which could in turn reduce the value of our units.
If exports to Europe continue to decline due to the imposition by the European Union of a tariff on U.S. ethanol, ethanol prices may be negatively impacted. The European Union imposed a tariff on ethanol which is produced in the United States and exported to Europe. If exports of ethanol to Europe continue to decrease as a result, it could negatively impact the
15
market price of ethanol in the United States. Any decrease in ethanol prices or demand may negatively impact our ability to profitably operate the ethanol plant.
The ethanol industry is an industry that is changing rapidly which can result in unexpected developments that could negatively impact our operations and the value of our units. The ethanol industry has grown significantly in the last fourteen years. According to the Renewable Fuels Association, the ethanol industry has grown from approximately 1.5 billion gallons of production per year in 1999 to approximately 15.1 billion gallons of current domestic ethanol production capacity. This rapid growth has resulted in significant shifts in supply and demand of ethanol over a very short period of time. As a result, past performance by the ethanol plant or the ethanol industry generally might not be indicative of future performance. We may experience a rapid shift in the economic conditions in the ethanol industry which may make it difficult to operate the ethanol plant profitably. If changes occur in the ethanol industry that make it difficult for us to operate the ethanol plant profitably, it could result in the reduction in the value of our units.
Demand for ethanol may not continue to grow unless ethanol can be blended into gasoline in higher percentage blends for all conventional automobiles. Currently, ethanol is primarily blended with gasoline for use in standard (non-flex fuel) vehicles to create a blend which is 10% ethanol and 90% gasoline. In order to expand ethanol demand, higher percentage blends of ethanol must be utilized in standard vehicles. The EPA has approved the use of E15 for standard vehicles produced in the model year 2001 and later. However, the fact that E15 has not been approved for use in all vehicles and the labeling requirements associated with E15 may result in many gasoline retailers refusing to carry E15. In addition, different gasoline blendstocks may be required at certain times of the year in order to use E15 due to federal regulations related to fuel evaporative emissions. As a result, the approval of E15 may not significantly increase demand for ethanol.
The California Low Carbon Fuel Standard may decrease demand for corn based ethanol which could negatively impact our profitability. California passed a Low Carbon Fuel Standard (LCFS) requiring that renewable fuels used in California must accomplish certain reductions in greenhouse gases which are measured using a lifecycle analysis. California represents a significant ethanol market and if we are unable to supply ethanol to California, it could significantly reduce demand for the ethanol we produce. Any decrease in ethanol demand as a result of the California LCFS could negatively impact ethanol prices which could reduce our revenues and negatively impact our ability to profitably operate the ethanol plant.
Technology advances in the commercialization of cellulosic ethanol may decrease demand for corn based ethanol which may negatively affect our profitability. The current trend in ethanol production research is to develop an efficient method of producing ethanol from cellulose-based biomass, such as agricultural waste, forest residue, municipal solid waste and energy crops. This trend is driven by the fact that cellulose-based biomass is generally cheaper than corn, and producing ethanol from cellulose-based biomass would create opportunities to produce ethanol in areas which are unable to grow corn. There are several government initiatives that offer a strong incentive to develop commercial scale cellulosic ethanol. Although subject to possible reduction by the EPA, the statutory volume requirement of the RFS provides for 16 billion gallons per year of advanced bio-fuels to be consumed in the United States by 2022. Additionally, state and federal grants have been awarded to several companies that are seeking to develop commercial-scale cellulosic ethanol plants. Commercial scale cellulosic ethanol plants are currently under construction in the United States with at least three being reportedly operational and others nearing completion. If an efficient method of producing ethanol from cellulose-based biomass on a commercial scale is successful, we may not be able to compete effectively. If we are unable to produce ethanol as cost-effectively as cellulose-based producers, our ability to general revenue will be negatively impacted.
We operate in an intensely competitive industry and compete with larger, better financed companies which could impact our ability to operate profitably. There is significant competition among ethanol producers. There are numerous producer-owned and privately-owned ethanol plants planned and operating through the United States. In addition, we have seen increased competition from oil companies that have purchased ethanol production facilities. We also face competition from ethanol producers located outside the United States. The largest ethanol producers include Archer Daniels Midland, Flint Hills Resources, Green Plains Renewable Energy, POET, and Valero Renewable Fuels, all of which are each capable of producing significantly more ethanol than we produce. Further, many believe that there will be further consolidation occurring in the ethanol industry in the future which will likely lead to a few companies that control a significant portion of the ethanol production market. We may not be able to compete with these larger producers and our inability to compete could negatively impact our financial performance.
Competition from the advancement of alternative fuels may lessen the demand for ethanol. Alternative fuels, gasoline oxygenates and ethanol production methods are continually under development. A number of automotive, industrial and power generation manufacturers are developing alternative clean power systems using fuel cells, plug-in hybrids, electric cars or clean burning gaseous fuels. Like ethanol, these emerging technologies offer an option to address worldwide energy costs, the long-term availability of petroleum reserves and environmental concerns. If these alternative technologies continue to expand and gain broad acceptance and become readily available to consumers for motor vehicle use, we may not be able to compete effectively.
16
This additional competition could reduce the demand for ethanol, resulting in lower ethanol prices that might adversely affect our financial condition.
Consumer resistance to the use of ethanol based on the belief that ethanol is expensive, uses too much corn, adds to air pollution, harms engines, and/or takes more energy to produce than it contributes may affect the demand for ethanol. Certain individuals believe that the use of ethanol will have a negative impact on gasoline prices and that ethanol production uses too much of the available corn supply. Many also believe that ethanol adds to air pollution and harms vehicle engines. Still other consumers believe that the process of producing ethanol actually uses more fossil energy, such as oil and natural gas, than the amount of energy that is produced. These consumer beliefs could potentially be wide-spread. If consumers choose not to buy ethanol based on these beliefs, it would affect the demand for the ethanol we produce which could negatively affect our profitability.
Risks Related to Regulation and Governmental Action
Government incentives for ethanol production may be eliminated in the future, which could hinder our ability to operate at a profit. The ethanol industry is assisted by various federal ethanol production and tax incentives, including the RFS
set forth in the Energy Policy Act of 2005. The RFS helps support a market for ethanol that might disappear without this incentive.
On November 15, 2013, the EPA announced a proposal to significantly reduce the RFS levels for 2014 to 15.21 billion gallons of
which corn based ethanol could be used to satisfy only 13 billion gallons. This proposed rule would result in a lowering of the 2014 standard below the 2013 level of 13.8 billion gallons. The EPA also sought comment on several petitions it has received for
partial waiver of the statutory volumes for 2014. The 60-day public comment period ended on January 28, 2014 and the rule was
submitted by the EPA to the Office of Management and Budget ("OMB") for review on August 22, 2014. Furthermore, there have also been recent proposals in Congress to reduce or eliminate the RFS. On November 21, 2014, the EPA announced that it would delay finalizing the rule on the 2014 RFS standards until after the end of 2014. The EPA indicated that it intends to take action on the 2014 standards in 2015 prior to or in conjunction with action on the 2015 standards. If the EPA's proposal becomes a final rule significantly reducing the RFS or if the RFS were to be otherwise reduced or eliminated by the exercise of the EPA waiver authority or by Congress, the market price and demand for ethanol could decrease which will negatively impact our financial performance.
The federal Volumetric Ethanol Excise Tax ("VEETC") and the United States tariff on foreign ethanol expired on December 31, 2011. VEETC and the secondary tariff on foreign ethanol expired on December 31, 2011. The elimination of tax incentives for gasoline refiners and blenders resulting from the expiration of VEETC may have a negative impact on demand for ethanol which may result in lower market ethanol prices. In addition, the loss of the United States' tariff on foreign ethanol could result in continued increases in importation of ethanol produced in other countries, especially in areas of the United States that are easily accessible by international shipping ports. Any increase in ethanol imports could negatively impact domestic ethanol prices and demand.
Changes in environmental regulations or violations of these regulations could be expensive and reduce our profitability. We are subject to extensive air, water and other environmental laws and regulations. In addition, some of these laws require our plant to operate under a number of environmental permits. These laws, regulations and permits can often require expensive pollution control equipment or operational changes to limit actual or potentials impacts to the environment. A violation of these laws and regulations or permit conditions can result in substantial fines, damages, criminal sanctions, permit revocations and/or plant shutdowns. In the future, we may be subject to legal actions brought by environmental advocacy groups and other parties for actual or alleged violations of environmental laws or our permits. Additionally, any changes in environmental laws and regulations could require us to spend considerable resources to comply with future environmental regulations. The expense of compliance could be significant enough to reduce our profitability and negatively affect our financial condition.
ITEM 2. PROPERTIES
Our plant site is made up of two adjacent parcels which together total approximately 125 acres in southwest Minnesota near Lamberton. The plant's address is 24500 U.S. Highway 14, Lamberton, Minnesota 56152. We produce all of our ethanol and distillers grains at this site. Our plant is in excellent condition and is capable of functioning at over 100% of its 50 million gallons per year nameplate production capacity.
All of our tangible and intangible property, real and personal, serves as the collateral for our credit with AgStar Financial Services, PCA ("AgStar"). In addition we have granted a security interest in the corn oil separation system to Butamax Advanced Biofuels LLC ("Butamax") to secure our obligations under the capital lease agreement. Our credit facility and our capital lease agreement with Butamax are discussed in more detail under “ITEM 7 - Management's Discussion and Analysis of Financial Condition and Results of Operations - Liquidity and Capital Resources.”
17
ITEM 3. LEGAL PROCEEDINGS
None.
ITEM 4. MINE SAFETY DISCLOSURES
None.
PART II
ITEM 5. MARKET FOR REGISTRANT'S COMMON EQUITY, RELATED MEMBER MATTERS AND ISSUER PURCHASES OF EQUITY SECURITIES
As of January 28, 2015, we have approximately 4,953 membership units outstanding and approximately 1,421 unit holders of record. There is no public trading market for our membership units.
We have, however, established a Unit Trading Bulletin Board, a private online matching service, through Farmers National Company Agstock, LLC in order to facilitate trading among our members. The Unit Trading Bulletin Board has been designed to comply with federal tax laws and Internal Revenue Service ("IRS") regulations establishing a “qualified matching service,” as well as state and federal securities laws. Our Unit Bulletin Board consists of an electronic bulletin board that provides a list of interested buyers with a list of interested sellers, along with their non-firm price quotes. The Unit Trading Bulletin Board does not automatically affect matches between potential sellers and buyers and it is the sole responsibility of sellers and buyers to contact each other to make a determination as to whether an agreement to transfer units may be reached. We do not become involved in any purchase or sale negotiations arising from our Unit Trading Bulletin Board and have no role in effecting the transactions beyond approval, as required under our member control agreement, and the issuance of new certificates. We do not give advice regarding the merits or shortcomings of any particular transaction. We do not receive, transfer or hold funds or securities as an incident of operating the Unit Trading Bulletin Board. We do not receive any compensation for creating or maintaining the Unit Trading Bulletin Board. In advertising our Unit Trading Bulletin Board, we do not characterize Highwater Ethanol as being a broker or dealer or an exchange. We do not use the Unit Trading Bulletin Board to offer to buy or sell securities other than in compliance with the securities laws, including any applicable registration requirements.
There are detailed timelines that must be followed under the Unit Trading Bulletin Board Rules and Procedures with respect to offers and sales of membership units. All transactions must comply with the Unit Trading Bulletin Board Rules, our member control agreement, and are subject to approval by our board of governors.
As a limited liability company, we are required to restrict the transfers of our membership units in order to preserve our partnership tax status. Our membership units may not be traded on any established securities market or readily traded on a secondary market (or the substantial equivalent thereof). All transfers are subject to a determination that the transfer will not cause the Company to be deemed a publicly traded partnership.
The following table contains historical information by fiscal quarter for the fiscal years ended October 31, 2014 and 2013 regarding the actual unit transactions that were completed by our unit-holders during the periods specified. We believe this most accurately represents the current trading value of the Company's units. The information was compiled by reviewing the completed unit transfers that occurred on our qualified matching service bulletin board during the quarters indicated.
Quarter | Low Price | High Price | Average Price | # of Units Traded | ||||||
2014 4th | $ | 9,500 | $ | 12,500 | $ | 9,953 | 32 | |||
2014 3rd | $ | 8,500 | $ | 9,000 | $ | 8,893 | 14 | |||
2014 2nd | $ | 6,000 | $ | 10,000 | $ | 8,488 | 16 | |||
2014 1st | $ | 5,500 | $ | 5,500 | $ | 5,500 | 10 | |||
2013 4th | $ | 5,000 | $ | 5,000 | $ | 5,000 | 1 | |||
2013 3rd | $ | 5,000 | $ | 5,000 | $ | 5,000 | 4 | |||
2013 2nd | $ | — | $ | — | $ | — | — | |||
2013 1st | $ | 5,000 | $ | 5,000 | $ | 5,000 | 1 | |||
18
The following table contains the asked prices that were posted on the Company's alternative trading service bulletin board and includes some transactions that were not completed. The Company believes the table above more accurately describes the trading value of its units as the asked prices below include some offers that never resulted in completed transactions. The information was compiled by reviewing postings that were made on the Company's alternative trading service bulletin board.
Sellers Quarter | Low Price | High Price | Average Price | # of Units Listed | ||||||
2014 4th | $ | 9,500 | $ | 12,500 | $ | 10,059 | 59 | |||
2014 3rd | $ | 5,500 | $ | 9,000 | $ | 8,294 | 17 | |||
2014 2nd | $ | 6,000 | $ | 10,000 | $ | 8,174 | 19 | |||
2014 1st | $ | 5,500 | $ | 6,000 | $ | 5,583 | 12 | |||
2013 4th | $ | 5,000 | $ | 10,000 | $ | 7,250 | 4 | |||
2013 3rd | $ | 5,000 | $ | 8,500 | $ | 6,875 | 4 | |||
2013 2nd | $ | 5,000 | $ | 8,500 | $ | 6,500 | 3 | |||
2013 1st | $ | 5,000 | $ | 7,200 | $ | 6,340 | 4 | |||
Distributions
We did not make any distributions to our members during our fiscal years ended October 31, 2014 and 2013. On November 19, 2014 the board of governors declared a cash distribution of $1,125 per membership unit to the holders of record as of the close of business on that date, for a total distribution of $5,572,125. We paid the distribution on December 16, 2014.
Our expectations with respect to our ability to make future distributions are discussed in greater detail in “ITEM 7 - Management's Discussion and Analysis of Financial Condition and Results of Operations” In addition, distributions are restricted by certain loan covenants in our construction term loan and revolving credit financing agreements. These loan covenants and restrictions are described in greater detail under “ITEM 7 - Management's Discussion and Analysis of Financial Condition and Results of Operations - Liquidity and Capital Resources.”
Performance Graph
The following graph shows a comparison of cumulative total member return since October 31, 2009, calculated on a dividend reinvested basis, for the Company, the NASDAQ Composite Index (the "NASDAQ") and an index of other companies that have the same SIC codes as the Company (the "Industry Index"). The graph assumes $100 was invested in each of our units, the NASDAQ, and the Industry Index on October 31, 2009. Note that historic stock price performance is not necessarily indicative of future unit price performance.
19
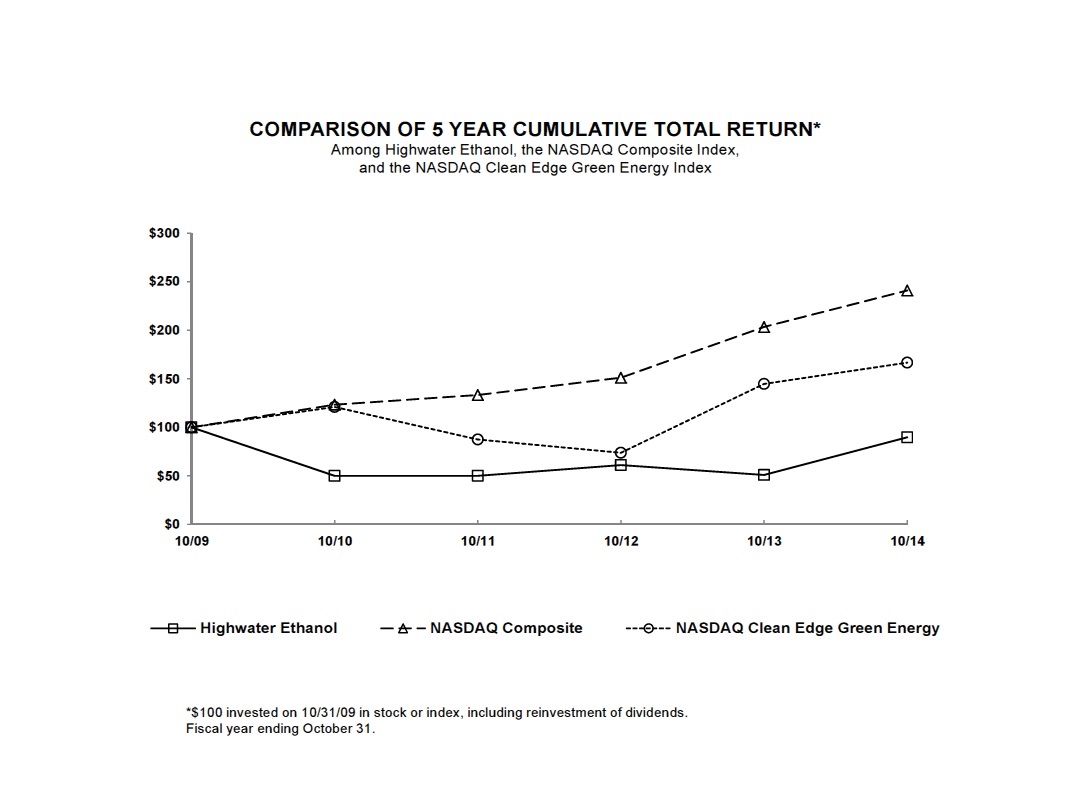
Pursuant to the rules and regulations of the Securities and Exchange Commission, the performance graph and the information set forth therein shall not be deemed to be filed for purposes of Section 18 of the Securities Exchange Act of 1934, and shall not be deemed to be incorporated by reference in any filing under the Securities Act of 1933, as amended, or the Exchange Act, except as shall be expressly set forth by specific reference in such filing.
ITEM 6. SELECTED FINANCIAL DATA
The following table presents selected financial and operating data as of the dates and for the periods indicated. The selected balance sheet financial data as of October 31, 2012, 2011 and 2010 and the selected statements of operations data and other financial data for the years ended October 31, 2011 and 2010 have been derived from our audited financial statements that are not included in this Form 10-K. The selected balance sheet financial data as of October 31, 2014 and 2013 and the selected statements of operations data and other financial data for each of the years in the three year period ended October 31, 2014 have been derived from the audited financial statements included elsewhere in this Form 10-K. You should read the following table in conjunction with "ITEM 7 - Management's Discussion and Analysis of Financial Condition and Results of Operations" and the financial statements and the accompanying notes included elsewhere in this Form 10-K. Among other things, those financial statements include more detailed information regarding the basis of presentation for the following financial data.
20
Statement of Operations Data: | 2014 | 2013 | 2012 | 2011 | 2010 | ||||||||||||||||
Revenues | $ | 139,597,173 | $ | 168,682,409 | $ | 156,648,625 | $ | 160,374,033 | $ | 104,849,565 | |||||||||||
Cost of Goods Sold | 111,405,819 | 159,305,976 | 155,785,481 | 149,540,234 | 94,993,137 | ||||||||||||||||
Gross Profit | 28,191,354 | 9,376,433 | 863,144 | 10,833,799 | 9,856,428 | ||||||||||||||||
Operating Expenses | 2,210,637 | 1,819,444 | 1,804,031 | 1,762,414 | 1,850,905 | ||||||||||||||||
Operating Income (Loss) | 25,980,717 | 7,556,989 | (940,887 | ) | 9,071,385 | 8,005,523 | |||||||||||||||
Other Expense | (4,046,541 | ) | (2,732,930 | ) | (3,184,001 | ) | (3,928,028 | ) | (5,253,117 | ) | |||||||||||
Net Income (Loss) | $ | 21,934,176 | $ | 4,824,059 | $ | (4,124,888 | ) | $ | 5,143,357 | $ | 2,752,406 | ||||||||||
Weighted Average Units Outstanding | 4,953 | 4,953 | 4,953 | 4,953 | 4,953 | ||||||||||||||||
Basic and Diluted Net Income (Loss) Per Unit | $ | 4,428.46 | $ | 973.96 | $ | (832.81 | ) | $ | 1,038.43 | $ | 555.70 | ||||||||||
Cash Distributions Per Unit | $ | — | $ | — | $ | 100.95 | $ | — | $ | — | |||||||||||
Balance Sheet Data: | 2014 | 2013 | 2012 | 2011 | 2010 | ||||||||||||||||
Current Assets | $ | 24,502,735 | $ | 15,438,420 | $ | 11,185,608 | $ | 15,695,180 | $ | 13,745,241 | |||||||||||
Net Property and Equipment | 77,484,018 | 80,312,341 | 86,459,635 | 91,811,920 | 97,558,718 | ||||||||||||||||
Other Assets | 2,826,256 | 4,048,812 | 4,052,190 | 3,422,287 | 3,147,298 | ||||||||||||||||
Total Assets | $ | 104,813,009 | $ | 99,799,573 | $ | 101,697,433 | $ | 110,929,387 | $ | 114,451,257 | |||||||||||
Current Liabilities | $ | 7,231,283 | $ | 7,244,981 | $ | 6,662,377 | $ | 7,741,800 | $ | 10,252,887 | |||||||||||
Long-Term Debt | 24,315,010 | 41,231,727 | 47,857,262 | 50,997,079 | 56,439,317 | ||||||||||||||||
Other Liabilities | — | — | 645,589 | 1,118,709 | 1,787,375 | ||||||||||||||||
Members' Equity | 73,266,716 | 51,322,865 | 46,532,205 | 51,071,799 | 45,971,678 | ||||||||||||||||
Total Liabilities & Members' Equity | $ | 104,813,009 | $ | 99,799,573 | $ | 101,697,433 | $ | 110,929,387 | $ | 114,451,257 | |||||||||||
See "ITEM 7 - Management's Discussion and Analysis of Financial Condition and Results of Operations" for further discussion of our financial results.
ITEM 7. MANAGEMENT'S DISCUSSION AND ANALYSIS OF FINANCIAL CONDITION AND RESULTS OF OPERATIONS
Results of Operations for the Fiscal Years Ended October 31, 2014 and 2013
The following table shows the results of our operations and the percentage of revenues, cost of goods sold, gross profit, operating expenses, operating profit and other items to total revenues in our statements of operations for the fiscal years ended October 31, 2014 and 2013:
21
2014 | 2013 | ||||||||||||
Statements of Operations Data | Amount | % | Amount | % | |||||||||
Revenues | $ | 139,597,173 | 100.00 | % | $ | 168,682,409 | 100.00 | % | |||||
Cost of Goods Sold | 111,405,819 | 79.81 | % | 159,305,976 | 94.44 | % | |||||||
Gross Profit | 28,191,354 | 20.19 | % | 9,376,433 | 5.56 | % | |||||||
Operating Expenses | 2,210,637 | 1.58 | % | 1,819,444 | 1.08 | % | |||||||
Operating Profit | 25,980,717 | 18.61 | % | 7,556,989 | 4.48 | % | |||||||
Other Expense, Net | (4,046,541 | ) | (2.90 | )% | (2,732,930 | ) | (1.62 | )% | |||||
Net Income | $ | 21,934,176 | 15.71 | % | $ | 4,824,059 | 2.86 | % | |||||
The following table shows the sources of our revenues for the fiscal years ended October 31, 2014 and 2013.
2014 | 2013 | |||||||||||||
Revenue Sources | Amount | Percentage of Total Revenues | Amount | Percentage of Total Revenues | ||||||||||
Ethanol Sales | $ | 111,591,475 | 79.94 | % | $ | 130,623,053 | 77.44 | % | ||||||
Modified Wet Distillers Grains Sales | 3,501,812 | 2.51 | % | 8,460,200 | 5.02 | % | ||||||||
Dried Distillers Grains Sales | 22,676,873 | 16.24 | % | 29,599,156 | 17.54 | % | ||||||||
Corn Oil Sales | 1,827,013 | 1.31 | % | — | — | % | ||||||||
Total Revenues | $ | 139,597,173 | 100.00 | % | $ | 168,682,409 | 100.00 | % | ||||||
Revenue
Ethanol
Our total revenues were lower for the fiscal year ended October 31, 2014 compared to the fiscal year ended October 31, 2013. Revenue from ethanol sales decreased by approximately 14.6% during the fiscal year ended October 31, 2014 compared to the fiscal year ended October 31, 2013 primarily due to lower ethanol prices. The average per gallon ethanol sales price we received for the fiscal year ended October 31, 2014 was approximately 12.3% lower than the average price we received for the fiscal year ended October 31, 2013. In addition, we experienced a decrease in the gallons of ethanol sold in the fiscal year ended October 31, 2014 as compared to the fiscal year ended October 31, 2013. The gallons of ethanol we sold during the fiscal year ended October 31, 2014 decreased by approximately 2.4% as compared to the number of gallons of ethanol we sold for the fiscal year ended October 31, 2013. In the ordinary course of business, we enter into forward contracts for our commodity purchases and sales. However, at October 31, 2014, we have no forward ethanol sales contracts.
Ethanol prices were lower towards the beginning of our fiscal year due to lower corn prices resulting from a record 2013 corn crop as ethanol prices tend to trend with corn prices. Ethanol prices were supported to some extent during our second and third fiscal quarters due to an increase in ethanol demand and difficulties in rail transportation of ethanol due to rail logistical problems. However, although rail difficulties helped to support higher ethanol prices, rail delays also resulted in an increase in our ethanol inventory and our decreasing, and even temporarily ceasing, production at the plant for periods in March and April which resulted in a decrease in gallons of ethanol sold. Ethanol prices trended downwards during our fourth fiscal quarter in response to a decline in corn prices due to projections of a large 2014 corn crop in the U.S.
Although ethanol prices were lower for the fiscal year ended October 31, 2014 compared to the fiscal year ended October 31, 2013, that decline in ethanol prices was less than the decline in corn prices resulting in positive operating margins. Management is optimistic that the current positive operating environment will continue and expects that changes in ethanol prices will generally be directionally consistent with changes in corn and energy prices. However, ethanol prices could continue to face downward pressure if ethanol imports increase or if domestic demand decreases. In addition, ethanol prices could be negatively impacted if the use requirements mandated by the RFS are significantly reduced or eliminated.
In the ordinary course of business, we enter into forward contracts for our commodity purchases and sales. At October 31, 2014, we have no forward ethanol sales contracts. We recorded losses related to ethanol based derivative instruments of approximately $525,000 for the fiscal year ended October 31, 2014. We recorded no losses or gains related to ethanol based derivative instruments for the fiscal year ended October 31, 2013.
22
Distillers Grains
Revenue from distillers grains decreased by approximately 31.2% during the fiscal year ended October 31, 2014 compared to the fiscal year ended October 31, 2013. This is primarily a result of lower distillers grains prices and a decrease in the number of tons of modified distillers grains sold during our fiscal year ended October 31, 2014 compared to the fiscal year ended October 31, 2013 which was offset only slightly by an increase in dried distillers grains sold. For the fiscal year ended October 31, 2014, the average price per ton that we received for our dried distillers grains was approximately 23.8% lower than during the fiscal year ended October 31, 2013. For the fiscal year ended October 31, 2014, the average price per ton that we received for our modified distillers grains was approximately 33.4% lower than during the fiscal year ended October 31, 2013.
Distillers grains prices typically change in proportion to corn prices and availability of corn. Management attributes the decrease in the average price we received for dried distillers grains and modified distillers grains to the lower corn prices we experienced during much of the fiscal year ended October 31, 2014 in response to a large 2013 corn crop and projections of a large 2014 corn crop. In addition, distillers grains prices declined due to announcements in June and July 2014, by China, the largest buyer of distillers grains in the world, that it would stop issuing import permits for U.S. distillers grains due to the presence of a genetically modified trait not approved by China for import and impose additional restrictions on such shipments. This dispute was not resolved until December 2014.
Management anticipates that distillers grains prices will continue to follow corn prices and change in relation to the availability of corn throughout our fiscal year. In addition, higher inclusion rates of distillers grains in livestock rations could boost demand and have a positive affect on distillers grains prices. However, although the export market to China has now been re-opened, if China were to reinstate the ban or place other restrictions on U.S. distillers grains in the future, export demand of distillers grains may be significantly reduced which would negatively affect the price of distillers grains in the U.S.
The tons of dried distillers grains we sold during the fiscal year ended October 31, 2014, increased by approximately 3.2% as compared to the tons of dried distillers grains we sold for the fiscal year ended October 31, 2013. The tons of modified distillers grains we sold during the fiscal year ended October 31, 2014, decreased by approximately 37.8% as compared to the fiscal year ended October 31, 2013. Overall, the number of tons of distillers grains sold decreased during our fiscal year ended October 31, 2014 compared to the fiscal year ended October 31, 2013 due primarily to decreased ethanol production and due to the fact that we began extracting corn oil in April 2014.
At October 31, 2014, we have approximately 22,600 tons of forward dried distiller grains sales contracts at various fixed prices for various delivery periods through August 2015.
Corn Oil
In April 2014, we completed installation of our corn oil extraction equipment and began producing and marketing corn oil at our plant. Management anticipates that our corn oil production will increase in the future compared to the amount of corn oil sold for the fiscal year ended October 31, 2014 since we anticipate that we will be producing corn oil for the entire fiscal year. In addition, we are still working to gain the best efficiency from the corn oil equipment which could positively affect the rate of corn oil production.
Since biodiesel production is a major source of corn oil demand, lower biodiesel demand has impacted corn oil prices. The biodiesel industry has been impacted by recent legislative changes, including the expiration of the biodiesel blenders' tax credit and uncertainty regarding the biodiesel use requirements for 2014 under the RFS. The EPA has proposed reducing the renewable fuels requirements under the RFS for 2014 in a manner that would negatively impact demand for biodiesel. In addition, corn oil prices have been impacted by lower corn prices. Management anticipates corn oil prices may also face downward pressure as additional corn oil supply enters the market.
At October 31, 2014, we have approximately 957,540 pounds of forward fixed price corn oil sales contracts at various fixed prices for various delivery periods through December 2015.
Cost of Goods Sold
Our two largest costs of production are corn (72.1% of cost of goods sold for the fiscal year ended October 31, 2014) and natural gas (7.6% of cost of goods sold for the fiscal year ended October 31, 2014). Our total cost of goods sold was approximately 30.0% less during the fiscal year ended October 31, 2014 compared to the fiscal year ended October 31, 2013.
23
Corn
Our average price per bushel of corn for the fiscal year ended October 31, 2014 decreased by approximately 38.6% as compared to the fiscal year ended October 31, 2013 due to lower corn prices. We used approximately 1.1% less bushels of corn in the fiscal year ended October 31, 2014 as compared to the fiscal year ended October 31, 2013 due to lower ethanol production in fiscal year ended October 31, 2014.
We experienced lower corn prices overall during our first and second fiscal quarters in response to a record 2013 corn crop. Corn prices in our third and fourth fiscal quarters remained low amid projections of another large corn crop for 2014 in the U.S. Management expects there to be an adequate corn supply available in our area to operate the ethanol plant and that prices during our 2015 fiscal year may continue to be lower due to plentiful supply. However, corn prices will likely remain volatile in the future depending on weather conditions and other factors.
In the ordinary course of business, we enter into forward purchase contracts for our commodity purchases. At October 31, 2014, we have no forward corn purchase contracts. We recorded losses related to corn derivative instruments of approximately $811,000 for the fiscal year ended October 31, 2014, which increased cost of sales. We recorded a gain related to corn derivative instruments of approximately $331,000 for the fiscal year ended October 31, 2013.
Natural Gas
For the fiscal year ended October 31, 2014, we purchased approximately 0.2% less natural gas as compared to the same period of 2013. This decrease in natural gas usage is primarily due to the decrease in overall distillers grains produced. Our average price per MMBTU of natural gas was 32.9% higher for the fiscal year ended October 31, 2014 compared to the fiscal year ended October 31, 2013. Natural gas prices were higher on average due to a harsh winter and colder temperatures. Management anticipates that natural gas prices will continue at their current levels unless the natural gas industry experiences production problems or if there are large increases in natural gas demand. Natural gas prices will likely increase during the winter months depending on the severity of the winter conditions experienced.
In the ordinary course of business, we entered into forward purchase contracts for our natural gas purchases. At October 31, 2014, we have 438,200 MMBTUs of forward contracts for natural gas purchases for various delivery periods through April 2015. We recorded losses related to natural gas based derivative instruments of approximately $136,000 for the fiscal year ended October 31, 2014. We recorded a gain related to natural gas based derivative instruments of approximately $41,000 for the fiscal year ended October 31, 2013.
Operating Expense
We had operating expense for the fiscal year ended October 31, 2014 of $2,210,637 compared to operating expense of $1,819,444 for the fiscal year ended October 31, 2013. Management attributes a portion of this increase in operating expense to real estate taxes and professional fees. We continue to pursue strategies to optimize efficiencies and maximize production. These efforts may result in a decrease in our operating expenses on a per gallon basis. However, because these expenses do not vary with the level of production at the plant, we expect our operating expenses to remain relatively steady.
Operating Profit
We had operating profit for the fiscal year ended October 31, 2014 of $25,980,717 compared to operating profit of $7,556,989 for the fiscal year ended October 31, 2013. Our income from operations for the fiscal year ended October 31, 2014, was 18.6% of our revenues. This increase in our profitability for the fiscal year ended October 31, 2014, was due primarily to the decrease in the price we paid for corn relative to the price we received for ethanol which contributed to positive operating margins.
Other Expense, Net
We had total other expense for the fiscal year ended October 31, 2014 of $4,046,541 compared to other expense of $2,732,930 for the fiscal year ended October 31, 2013. Our other expense for the fiscal year ended October 31, 2014 consisted primarily of interest expense and payment of a premium to terminate our capital lease with the City of Lamberton, Minnesota.
Results of Operations for the Fiscal Years Ended October 31, 2013 and 2012
24
The following table shows the results of our operations and the percentage of revenues, cost of goods sold, gross profit, operating expenses, operating profit (loss) and other items to total revenues in our statements of operations for the fiscal years ended October 31, 2013 and 2012:
2013 | 2012 | ||||||||||||
Statements of Operations Data | Amount | % | Amount | % | |||||||||
Revenues | $ | 168,682,409 | 100.00 | % | $ | 156,648,625 | 100.00 | % | |||||
Cost of Goods Sold | 159,305,976 | 94.44 | % | 155,785,481 | 99.45 | % | |||||||
Gross Profit | 9,376,433 | 5.56 | % | 863,144 | 0.55 | % | |||||||
Operating Expenses | 1,819,444 | 1.08 | % | 1,804,031 | 1.15 | % | |||||||
Operating Profit (Loss) | 7,556,989 | 4.48 | % | (940,887 | ) | (0.60 | )% | ||||||
Other Expense, Net | (2,732,930 | ) | (1.62 | )% | (3,184,001 | ) | (2.03 | )% | |||||
Net Income (Loss) | $ | 4,824,059 | 2.86 | % | $ | (4,124,888 | ) | (2.63 | )% | ||||
The following table shows the sources of our revenues for the fiscal years ended October 31, 2013 and 2012.
2013 | 2012 | |||||||||||||
Revenue Sources | Amount | Percentage of Total Revenues | Amount | Percentage of Total Revenues | ||||||||||
Ethanol Sales | $ | 130,623,053 | 77.44 | % | $ | 123,398,657 | 78.78 | % | ||||||
Modified Wet Distillers Grains Sales | 8,460,200 | 5.02 | % | 7,742,353 | 4.94 | % | ||||||||
Dried Distillers Grains Sales | 29,599,156 | 17.54 | % | 25,507,615 | 16.28 | % | ||||||||
Total Revenues | $ | 168,682,409 | 100.00 | % | $ | 156,648,625 | 100.00 | % | ||||||
Revenue
Our total revenues were higher for the fiscal year ended October 31, 2013 compared to the fiscal year ended October 31, 2012.
Ethanol
Revenue from ethanol sales increased by approximately 5.9% during the fiscal year ended October 31, 2013 compared to the fiscal year ended October 31, 2012 primarily due to higher ethanol prices. The average per gallon ethanol sales price we received for the fiscal year ended October 31, 2013 was approximately 3.7% higher than the average price we received for the fiscal year ended October 31, 2012. In addition, we experienced an increase in the gallons of ethanol sold in the fiscal year ended October 31, 2013 as compared to the fiscal year ended October 31, 2012. The gallons of ethanol we sold during the fiscal year ended October 31, 2013 increased by approximately 2.2% as compared to the number of gallons of ethanol we sold for the fiscal year ended October 31, 2012.
Distillers Grains
Revenue from distillers grains increased by approximately 14.5% during the fiscal year ended October 31, 2013 compared to the fiscal year ended October 31, 2012 primarily as result of higher distillers grains prices and an increase in the number of tons of dried distillers grains sold during our fiscal year ended October 31, 2013 compared to our fiscal year ended October 31, 2012. For the fiscal year ended October 31, 2013, the average price per ton that we received for our dried distillers grains was approximately 5.2% higher than during the fiscal year ended October 31, 2012. For the fiscal year ended October 31, 2013, the average price per ton that we received for our modified distillers grains was approximately 21.1% higher than during the fiscal year ended October 31, 2012. Conversely, the tons of dried distillers grains we sold during the fiscal year ended October 31, 2013 increased by approximately 10.8% as compared to the tons of dried distillers grains we sold for the fiscal year ended October 31, 2012. The tons of modified distillers grains we sold during the fiscal year ended October 31, 2013 decreased by approximately 9.8% as compared to the fiscal year ended October 31, 2012, however, this was offset by an increase in the price per ton we received.
Cost of Goods Sold
25
Corn
Our two largest costs of production are corn (83.1% of cost of goods sold for the fiscal year ended October 31, 2013) and natural gas (4.0% of cost of goods sold for the fiscal year ended October 31, 2013). Our total cost of goods sold was approximately 2.3% more during the fiscal year ended October 31, 2013 compared to the fiscal year ended October 31, 2012. Our average price per bushel of corn for the fiscal year ended October 31, 2013 was approximately the same as compared to the fiscal year ended October 31, 2012. We used approximately 2.9% more bushels of corn in the fiscal year ended October 31, 2013 as compared to the fiscal year ended October 31, 2012.
Natural Gas
For the fiscal year ended October 31, 2013, we purchased approximately 5.9% more natural gas as compared to the same period of 2012. This increase in natural gas usage was primarily due to an increase in production of ethanol and dried distillers grains. Our average price per MMBTU of natural gas was 6.7% lower for the fiscal year ended October 31, 2013 compared to the fiscal year ended October 31, 2012.
Operating Expense
We had operating expense for the fiscal year ended October 31, 2013 of $1,819,444 compared to operating expense of $1,804,031 for the fiscal year ended October 31, 2012. Management attributes this increase in operating expense to increased costs related to our business and property insurance, property taxes and safety supplies.
Operating Profit (Loss)
We had operating profit for the fiscal year ended October 31, 2013 of $7,556,989 compared to operating loss of $940,887 for the fiscal year ended October 31, 2012. Our income from operations for the fiscal year ended October 31, 2013, was 4.5% of our revenues. This increase in our profitability for the fiscal year ended October 31, 2013, was due primarily to an increase in the price we received for our ethanol which contributed to positive operating margins during the last three quarters of our fiscal year.
Other Expense, Net
We had total other expense for the fiscal year ended October 31, 2013 of $2,732,930 compared to other expense of $3,184,001 for the fiscal year ended October 31, 2012. Our other expense for the fiscal year ended October 31, 2013 consisted primarily of interest expense offset in part by interest rate swap gains and investment income. Management attributes this decrease in other expense primarily to a decrease in interest expense due to our having a lower outstanding balance on our loans.
Changes in Financial Condition for the Fiscal Years Ended October 31, 2014 and 2013
The following table highlights the changes in our financial condition for the fiscal year ended October 31, 2014 from our previous fiscal year ended October 31, 2013:
October 31, 2014 | October 31, 2013 | ||||||
Current Assets | $ | 24,502,735 | $ | 15,438,420 | |||
Current Liabilities | 7,231,283 | 7,244,981 | |||||
Long-Term Liabilities | 24,315,010 | 41,231,727 | |||||
Current Assets. The increase in current assets was primarily the result of an increase in our cash and cash equivalents due to positive operating margins during our fiscal year and an increase in accounts receivable and inventories. These increases were partially offset by a decrease in derivative instruments at October 31, 2014 as compared to October 31, 2013.
Current Liabilities. Current liabilities at October 31, 2014 was comparable to October 31, 2013 in total, but included a decrease in current maturities of long-term debt and a decrease in derivative instruments offset by an increase in accrued expenses.
Long-Term Liabilities. Long-term debt decreased by $16,916,717 at October 31, 2014 as compared to October 31, 2013 primarily due to scheduled and unscheduled principal repayments on our loans.
Liquidity and Capital Resources
26
Our primary sources of liquidity are our line of credit and cash generated from operations. Based on financial forecasts performed by our management, we anticipate that we will have sufficient cash from our current credit facilities and cash from our operations to continue to operate the ethanol plant at capacity for the next 12 months. We do not currently anticipate seeking additional equity or debt financing in the near term. However, higher corn prices would significantly increase our cost of goods sold. If increases in cost of goods sold can not be offset by corresponding increases in the prices we receive from the sale of our products, these increases in cost of goods sold can have a significant negative impact on our financial performance. If we experience unfavorable operating conditions in the ethanol industry that prevent us from profitably operating the ethanol plant, we could have difficulty maintaining our liquidity and we may have to secure additional debt or equity financing for working capital or other purposes.
We have entered into a series of definitive agreements with Butamax Advanced Biofuels, L.L.C. ("Butamax") pursuant to which Butamax installed and leases its corn oil separation system and licenses to the Company its corn oil separation technology. Installation began in September 2013 and we began producing corn oil in April 2014. We are also currently exploring the installation of a water line to add a third water resource. We do not currently anticipate that we will need to secure additional capital resources for any other significant purchases of property and equipment in the next 12 months.
The following table shows cash flows for the fiscal years ended October 31, 2014 and 2013:
October 31, 2014 | October 31, 2013 | |||||
Net cash provided by operating activities | $ | 27,389,463 | $ | 11,876,872 | ||
Net cash used in investing activities | (249,564 | ) | (440,225 | ) | ||
Net cash used in financing activities | (19,497,498 | ) | (4,999,455 | ) | ||
Cash Flow From Operations
We experienced an increase in our cash provided by operating activities for the fiscal year ended October 31, 2014 compared to the fiscal year ended October 31, 2013. This increase was due to an increase in our net income due to positive operating margins during the fiscal year ended October 31, 2014. During the fiscal year ended October 31, 2014, our capital needs were being adequately met through cash from our operating activities and our credit facilities.
Cash Flow From Investing Activities
We used less cash for investing activities for the fiscal year ended October 31, 2014, as compared to the fiscal year ended October 31, 2013. This decrease was primarily due to an increase in proceeds from the sale of marketable securities during the fiscal year ended October 31, 2014, offset by an increase in capital expenditures and in our equity method investments.
Cash Flow From Financing Activities
We used more cash from financing activities during the fiscal year ended October 31, 2014 as compared to the fiscal year ended October 31, 2013. This increase was primarily a result of an increase in the amount we paid towards the principal balance on our loans during the fiscal year ended October 31, 2014 as compared to the fiscal year ended October 31, 2013.
The following table shows cash flows for the fiscal years ended October 31, 2013 and 2012:
October 31, 2013 | October 31, 2012 | |||||
Net cash provided by operating activities | $ | 11,876,872 | $ | 3,855,584 | ||
Net cash used in investing activities | (440,225 | ) | (1,393,285 | ) | ||
Net cash used in financing activities | (4,999,455 | ) | (4,457,986 | ) | ||
Cash Flow From Operations
27
We experienced an increase in our cash provided by operating activities for the fiscal year ended October 31, 2013 compared to the fiscal year ended October 31, 2012. This increase was due to an increase in our net income due to positive operating margins during the last three fiscal quarters of the fiscal year ended October 31, 2013.
Cash Flow From Investing Activities
We used less cash for investing activities for the fiscal year ended October 31, 2013, as compared to the fiscal year ended October 31, 2012. This decrease was primarily due to a decrease in capital expenditures and a decrease in our equity method investments during the fiscal year ended October 31, 2013.
Cash Flow From Financing Activities
We used more cash from financing activities during the fiscal year ended October 31, 2013 as compared to the fiscal year ended October 31, 2012. This increase was primarily a result of an increase in the amount we paid towards the principal balance on our loans during the fiscal year ended October 31, 2013 as compared to the fiscal year ended October 31, 2012. However, we paid a distribution in the amount of $500,000 to our members during the fiscal year ended October 31, 2012.
Short-Term and Long-Term Debt Sources
On April 24, 2008, we entered into a Construction Loan Agreement (the “Agreement”) with First National Bank of Omaha ("FNBO") for the purpose of funding a portion of the cost of the ethanol plant. With construction complete and the ethanol plant commencing operations, the construction loan converted to a $25,200,000 Fixed Rate Note, a $20,200,000 Variable Rate Note, a $5,000,000 Long-Term Revolving Note (which was terminated on March 29, 2013), a $5,000,000 line of credit and $5,600,000 to support the issuance of letters of credit by FNBO.
On February 26, 2014, in connection with and in preparation for the refinancing of our debt facility as described below,
we paid $7,639,971 towards the balance of FNBO's Variable Rate Note, leaving a combined balance due of $20,000,000 on FNBO's Fixed Rate Note and Variable Rate Note. We also terminated our interest rate swap with FNBO. In connection with terminating the interest rate swap, we paid $234,550.
On February 27, 2014, we entered into a Credit Agreement with AgStar Financial Services, PCA as administrative agent, ("AgStar") for the purpose of refinancing our debt facility previously held by FNBO. The Credit Agreement provides for a $20,000,000 Variable Rate Term Loan, a $5,000,000 Term Revolving Loan, and a $5,000,000 Revolving Line of Credit. The availability under the Term Revolving Loan supports and will be reduced by the issuance of letters of credit. We paid a $50,000 underwriting fee and a $75,000 commitment fee in addition to other standard closing costs in connection with the refinancing.
On September 22, 2014, we entered into an Amended and Restated Credit Agreement with Ag Star which amended the Credit Agreement originally dated February 27, 2014. In connection therewith, as of the same date, we executed Amended and Restated Term Notes, Amended and Restated Term Revolving Notes, Amended and Restated Revolving Line of Credit Notes and an Amended and Restated Mortgage, Security Agreement, Assignment of Leases and Fixture Financing Statement. The purpose for the amending of the credit facility with AgStar was to refinance a portion of certain financing and credit arrangements previously held by U.S. Bank National Association, as trustee, and the City of Lamberton, Minnesota (the “City”).
The Amended and Restated Credit Agreement increases the Term Loan to $27,000,000 and also continues to provide the Company with a $5,000,000 Term Revolving Loan, and a $5,000,000 Revolving Line of Credit subject to terms described in the Amended and Restated Credit Agreement and summarized below. We paid a $25,000 underwriting fee and a $17,500 commitment fee and agreed to pay an annual facility fee of $10,000 to AgStar in addition to other standard closing costs in connection with the refinancing.
Term Loan
The Term Loan is for $27,000,000 with a variable interest rate that is equal to 30-day LIBOR rate plus 325 basis points with no minimum interest rate. The applicable interest rate at October 31, 2014 was 3.4%. We make monthly principal payments on the Term Loan of approximately $321,000 plus accrued interest. Payments are based upon a seven year amortization and the Term Loan is fully amortized. The outstanding balance on this note was $26,509,289 at October 31, 2014. We may convert the Term Loan to a fixed rate loan, subject to certain conditions as described in the Amended and Restated Credit Agreement and with the consent of AgStar.
Term Revolving Loan
28
The Term Revolving Loan is for up to $5,000,000 with a variable interest rate that is the 30-day LIBOR rate plus 325 basis points with no minimum interest rate. The Term Revolving Loan may be advanced, repaid and re-borrowed during the term. We make monthly interest payments on the Term Revolving Loan. The outstanding balance on this note was $0 at October 31, 2014. Payment of all amounts outstanding is due on September 22, 2021. We also have $2,500,000 in letters of credit outstanding at October 31, 2014 which reduce the amount available under the Term Revolving Loan. We pay interest at a rate of 1.50% on amounts outstanding for the letters of credit.
Revolving Line of Credit
We have a Revolving Line of Credit available equal to the amount of the Borrowing Base, with a maximum limit of $5,000,000. The Borrowing Base will vary and may at times be less than $5,000,000. Our Revolving Line of Credit expires on February 26, 2015 and accrues interest at the 30-day LIBOR rate plus 325 basis points with no minimum interest rate. We will make monthly interest payments on the Revolving Line of Credit. The outstanding balance on this note was $0 at October 31, 2014.
Covenants and other Miscellaneous Financing Agreement Terms
The loan facility with AgStar is secured by substantially all business assets. We executed a mortgage in favor of AgStar creating a first lien on our real estate and plant and a security interest in all personal property located on the premises and assigned in favor of AgStar, all rents and leases to our property, our marketing contracts, our risk management services contract, and our natural gas, electricity, water service and grain procurement agreements.
We are also subject to various financial and non-financial covenants that limit distributions and debt and require minimum debt service coverage, tangible net worth, and working capital requirements. Our fixed charge coverage ratio is no less than 1.15:1.00 and is measured annually by comparing our adjusted EBITDA to our scheduled payments of principal and interest plus capital expenditures and distributions. Our minimum net worth is no less than $42,000,000, which is calculated as the excess of total assets excluding various disallowed assets per the Amended and Restated Credit Agreement over total liabilities, and is measured quarterly. Our minimum working capital is $8,250,000, which is calculated as current assets plus the amount available for drawing under our Term Revolving Loan and undrawn amounts on outstanding letters of credit, less current liabilities, and is measured quarterly.
Additionally, we are limited to annual capital expenditures of $2,000,000 without prior approval, incurring additional debt over certain amounts without prior approval, and making additional investments as described in the Amended and Restated Credit Agreement without prior approval of AgStar. We are also prohibited from making distributions to our members in excess of 50% of net income in a given year without the prior approval of AgStar. We are also required to pay unused commitment fees for the Term Revolving Loan and the Revolving Line of Credit as defined in the Amended and Restated Credit Agreement.
Presently, we are meeting our liquidity needs and complying with our financial covenants and the other terms of our loan agreements with AgStar. We will continue to work with AgStar to try to ensure that the terms of our loan agreements are met going forward. However, we cannot provide any assurance that our actions will result in sustained profitable operations or that we will not be in violation of our loan covenants or in default on our principal payments in the future. Should unfavorable market conditions result in our violation of the terms or covenants of our loan and we fail to obtain a waiver of any such term or covenant, AgStar could deem us in default of our loans and require us to immediately repay a significant portion or possibly the entire outstanding balance of our loans. In the event of a default, AgStar could also elect to proceed with a foreclosure action on our plant.
Capital Leases
City of Lamberton, Minnesota
On April 24, 2008, we entered into a lease agreement with the City of Lamberton, Minnesota (the "City") in order to to finance equipment for the plant. The City financed the purchase of equipment through Solid Waste Facilities Revenue Bonds Series 2008A (the “Bonds”) in the aggregate principal amount of $15,180,000. The Bonds were set to mature on December 1, 2022. Under the capital lease agreement with the City, we started making interest payments on November 25, 2008 and monthly thereafter at an implicit interest rate of 8.5%. Monthly capital lease payments of principal were scheduled to begin on November 25, 2014. The capital lease included an option to purchase the equipment at fair market value at the end of the lease term.
29
On October 2, 2014, we paid the capital lease agreement with the City in full, retired the bonds and purchased the equipment. We paid a premium in the amount of $1,518,000 in connection with the termination of our capital lease.
Butamax
We entered into a series of related definitive agreements dated September 26, 2013 with Butamax which include an Easement for Construction and Process Demonstration Agreement, an Equipment Lease Agreement, a Technology License Agreement, a Technology Demonstration Risk Reduction Agreement and a Security Agreement (collectively, the "Agreements") pursuant to which Butamax constructed, installed and leases its corn oil separation system and licenses to the Company its proprietary, patent-protected corn oil separation technology. Pursuant to the Agreements, we agreed to give Butamax access to our plant in order to construct, install, operate, test and commercially validate its corn oil separation system. Butamax retains ownership of the corn oil separation system and technology but leases it to the Company for a term of 120 months subject to Butamax's right to remove the system if we are in breach of the Agreements. The term of the lease may also be extended or terminated pursuant to the terms of the Agreements and we are responsible for repairs and maintenance of the system and bear the risk of loss. In return, we agree to payment of certain license fees which are subject to being reduced under the terms of the Agreements if the corn oil separation system does not meet certain performance goals. The Agreements provide that the corn oil separation system shall be conveyed to the Company at the end of the term so long as we are not in breach of the Agreements. We have granted a security interest to Butamax in the corn oil separation system to secure our obligations under the Agreements. Pursuant to the Agreements, we agreed, subject to certain obligations of confidentiality, to provide Butamax with Company information on a monthly basis including business and financial information and have granted Butamax the option to have a representative present in board and committee meetings as an observer. We also agreed to give Butamax notice in the event of an issuance or sale of membership interests or convertible debt instruments. We recorded this as a capital lease, in April, 2014. The total outstanding commitment under the lease as of October 31, 2014 is approximately $2,104,000.
Contractual Cash Obligations
In addition to our long-term debt obligations, we have certain other contractual cash obligations and commitments. The following tables provide information regarding our contractual obligations and approximate commitments as of October 31, 2014:
Payment Due by Period | |||||||||||||||
Total | Less than One Year | One to Three Years | Three to Five Years | After Five Years | |||||||||||
Long-Term Debt Obligations | $ | 29,686,171 | $ | 4,321,133 | $ | 9,043,339 | $ | 8,511,480 | $ | 7,810,219 | |||||
Capital Lease Obligations | 2,222,225 | 833,328 | 1,388,897 | — | — | ||||||||||
Operating Lease Obligations | 1,380,960 | 295,920 | 591,840 | 493,200 | — | ||||||||||
Purchase Obligations | 1,974,156 | 1,974,156 | — | — | — | ||||||||||
Total Contractual Obligations | $ | 35,263,512 | $ | 7,424,537 | $ | 11,024,076 | $ | 9,004,680 | $ | 7,810,219 | |||||
Critical Accounting Estimates
Management uses various estimates and assumptions in preparing our financial statements in accordance with generally accepted accounting principles. These estimates and assumptions affect the reported amounts of assets and liabilities, the disclosure of contingent assets and liabilities, and the reported revenues and expenses. Accounting estimates that are the most important to the presentation of our results of operations and financial condition, and which require the greatest use of judgment by management, are designated as our critical accounting estimates. We have the following critical accounting estimates:
Long-Lived Assets
We review long-lived assets for impairment whenever events or changes in circumstances indicate that the related carrying amounts may not be recoverable. Impairment testing for assets requires various estimates and assumptions, including an allocation of cash flows to those assets and, if required, an estimate of the fair value of those assets. Our estimates are based upon assumptions believed to be reasonable, but which are inherently uncertain and unpredictable. These valuations require the use of management's assumptions, which do not reflect unanticipated events and circumstances that may occur. Given the significant assumptions required and the possibility that actual conditions will differ, we consider the assessment of carrying value of property and equipment to be a critical accounting estimate.
30
Inventory Valuation
We value our inventory at lower of cost or market. Our estimates are based upon assumptions believed to be reasonable, but which are inherently uncertain and unpredictable. These valuations require the use of management's assumptions which do not reflect unanticipated events and circumstances that may occur. In our analysis, we consider corn costs and ethanol prices, break-even points for our plant and our risk management strategies in place through our derivative instruments. Given the significant assumptions required and the possibility that actual conditions will differ, we consider the valuation of the lower of cost or market on inventory to be a critical accounting estimate.
Derivatives
We are exposed to market risks from changes in interest rates, corn, natural gas, and ethanol prices. We may seek to minimize these commodity price fluctuation risks through the use of derivative instruments. In the event we utilize derivative instruments, we will attempt to link these instruments to financing plans, sales plans, market developments, and pricing activities. Such instruments in and of themselves can result in additional costs due to unexpected directional price movements.
We have entered into ethanol, corn and natural gas derivatives in order to protect cash flows from fluctuations caused by volatility in commodity prices. In practice, as markets move, we actively attempt to manage our risk and adjust hedging strategies as appropriate. We do not use hedge accounting which would match the gain or loss on our hedge positions to the specific commodity contracts being hedged. Instead, we use fair value accounting for our hedge positions, which means that as the current market price of our hedge position changes, the gains and losses are immediately recognized in our cost of goods sold. The immediate recognition of hedging gains and losses under fair value accounting can cause net income (loss) to be volatile from quarter to quarter due to the timing of the change in value of the derivative instruments relative to the cost and use of the commodity being hedged.
As of October 31, 2014, the fair values of our commodity-based derivative instruments are a net liability of approximately $340,000. As the prices of the hedged commodity moves in reaction to market trends and information, our statement of operations will be affected depending on the impact such market movements have on the value of our derivative instruments. Depending on market movements, crop prospects and weather, these price protection positions may cause immediate adverse effects, but are expected to protect the Company over the term of the contracts for the hedged amounts.
In the ordinary course of business, we enter into forward contracts for our commodity purchases and sales. At October 31, 2014, we have approximately 22,600 tons of forward dried distiller grains sales contracts and 957,540 pounds of forward fixed price corn oil sales contracts at various fixed prices for various delivery periods through August 2015 and December 2015, respectively. At October 31, 2014, we also have 438,200 MMBTUs of forward contracts for natural gas purchases for various delivery periods through April 2015,
Off-Balance Sheet Arrangements
We do not have any off-balance sheet arrangements.
ITEM 7A. QUANTITATIVE AND QUALITATIVE DISCLOSURES ABOUT MARKET RISK
We are exposed to the impact of market fluctuations associated with interest rates and commodity prices as discussed below. We have no exposure to foreign currency risk as all of our business is conducted in U.S. Dollars. We use derivative financial instruments as part of an overall strategy to manage market risk. We may use cash, futures and option contracts to hedge changes to the commodity prices of corn and natural gas. We do not enter into these derivative financial instruments for trading or speculative purposes, nor do we designate these contracts as hedges for accounting purposes. We previously used a derivative financial instruments to alter our exposure to interest rate risk. We entered into a interest rate swap agreement that we did not designate as a hedge for accounting purposes. The interest rate swap was terminated in February 2014.
Interest Rate Risk
We are exposed to market risk from changes in interest rates. Exposure to interest rate risk results primarily from a Term Loan, a Term Revolving Loan and a Revolving Line of Credit bearing variable interest rates. As of October 31, 2014, we had $26,509,288 outstanding on our Term Loan. Interest accrues on the Term Loan at the one-month LIBOR rate plus 325 basis points. The applicable interest rate at October 31, 2014, was 3.4%. If we were to experience a 10% adverse change in LIBOR, the annual effect such change would have on our statement of operations, based on the amount we had outstanding on our variable interest
31
rate loans as of October 31, 2014, would be approximately $90,000. At October 31, 2014, we did not have any amounts outstanding on the Term Revolving Loan or Revolving Line of Credit.
The specifics of each note are discussed in greater detail in “Item 7 - Management's Discussion and Analysis of Financial Condition and Results of Operations - Liquidity and Capital Resources.”
Commodity Price Risk
We are exposed to market risk from changes in commodity prices. Exposure to commodity price risk results from our dependence on corn and natural gas in the ethanol production process and the sale of ethanol and distillers grains. We may seek to minimize the risks from fluctuations in the prices of raw material inputs through the use of corn commodity-based and natural gas derivatives. These derivatives are not designated as effective hedges for accounting purposes. For derivative instruments that are not accounted for as hedges, or for the ineffective portions of qualifying hedges, the change in fair value is recorded through earnings in the period of change. Corn and natural gas derivative changes in fair market value are included in costs of goods sold.
In the ordinary course of business, we enter into forward contracts for our commodity purchases and sales. At October 31, 2014, we have approximately 22,600 tons of forward dried distiller grains sales contracts and 957,540 pounds of forward fixed price corn oil sales contracts at various fixed prices for various delivery periods through August 2015 and December 2015, respectively. At October 31, 2014, we also have 438,200 MMBTUs of forward contracts for natural gas purchases for various delivery periods through April 2015.
At October 31, 2014, we have open positions for 590,000 bushels of corn on the Chicago Board of Trade and 35,000 dekatherms of natural gas. These derivatives have not been designated as an effective hedge for accounting purposes. Corn and natural gas derivatives are forecasted to settle in the next twelve months. We recorded losses due to changes in the fair value of our outstanding corn derivative positions for the fiscal year ended October 31, 2014 of approximately $811,000. For the fiscal year ended October 31, 2014, we recorded losses due to the change in fair value of our outstanding natural gas derivative positions of approximately $136,000.
As corn prices move in reaction to market trends and information, our statements of operations will be affected depending on the impact such market movements have on the value of our derivative instruments. Depending on market movements, crop prospects and weather, these price protection positions may cause immediate adverse effects, but are expected to produce long-term positive growth for us.
A sensitivity analysis has been prepared to estimate our exposure to ethanol, distillers grains, corn and natural gas price risk. Market risk related to these factors is estimated as the potential change in income resulting from a hypothetical 10% adverse change in the average cost of our corn and natural gas prices and average ethanol and distillers grains prices as of October 31, 2014 of the forward and future contracts used to hedge our market risk for corn and natural gas usage requirements. The volumes are based on our expected use and sale of these commodities for a one year period from October 31, 2014. The results of this analysis, which may differ from actual results, are approximately as follows:
Estimated Volume Requirements for the next 12 months (net of forward and futures contracts) | Unit of Measure | Hypothetical Adverse Change in Price as of 10/31/14 | Approximate Adverse Change to Income | ||||||
Natural Gas | 1,446,501 | MMBTU | 10 | % | $ | 559,796 | |||
Ethanol | 58,326,660 | Gallons | 10 | % | $ | 10,148,839 | |||
Corn | 20,252,313 | Bushels | 10 | % | $ | 6,825,029 | |||
DDGs | 163,031 | Tons | 10 | % | $ | 1,760,735 | |||
For comparison purposes, the results of our sensitivity analysis for October 31, 2013 were as follows:
32
Estimated Volume Requirements for the next 12 months (net of forward and futures contracts) | Unit of Measure | Hypothetical Adverse Change in Price as of 10/31/13 | Approximate Adverse Change to Income | ||||||
Natural Gas | 1,419,392 | MMBTU | 10 | % | $ | 538,384 | |||
Ethanol | 57,999,999 | Gallons | 10 | % | $ | 13,049,977 | |||
Corn | 19,999,966 | Bushels | 10 | % | $ | 14,505,940 | |||
DDGs | 157,457 | Tons | 10 | % | $ | 4,034,993 | |||
33
ITEM 8. FINANCIAL STATEMENTS AND SUPPLEMENTARY DATA
REPORT OF INDEPENDENT REGISTERED PUBLIC ACCOUNTING FIRM

To the Board of Governors and Members
Highwater Ethanol, LLC
We have audited the accompanying balance sheets of Highwater Ethanol, LLC (the Company) as of October 31, 2014, and 2013 and the related statements of operations, comprehensive income (loss), changes in members’ equity, and cash flows for the years then ended. These financial statements are the responsibility of the Company’s management. Our responsibility is to express an opinion on these financial statements based on our audits.
We conducted our audits in accordance with the standards of the Public Company Accounting Oversight Board (United States). Those standards require that we plan and perform the audit to obtain reasonable assurance about whether the financial statements are free of material misstatement. The Company is not required to have, nor were we engaged to perform, an audit of its internal control over financial reporting. Our audits included consideration of internal control over financial reporting as a basis for designing audit procedures that are appropriate in the circumstances, but not for the purpose of expressing an opinion on the effectiveness of the Company’s internal control over financial reporting. Accordingly, we express no such opinion. An audit also includes examining, on a test basis, evidence supporting the amounts and disclosures in the financial statements, assessing the accounting principles used and significant estimates made by management, as well as evaluating the overall financial statement presentation. We believe that our audits provide a reasonable basis for our opinion.
In our opinion, the financial statements referred to above present fairly, in all material respects, the financial position of the Company as of October 31, 2014 and 2013, and the results of its operations and its cash flows for the years then ended, in conformity with U.S. generally accepted accounting principles.
/s/ McGladrey LLP
Sioux Falls, South Dakota
January 28, 2015
34

Report of Independent Registered Public Accounting Firm
To the Board of Governors of Highwater Ethanol, LLC
In our opinion, the accompanying statements of operations, comprehensive income (loss), changes in members’ equity, and cash flows for the year ended October 31, 2012 present fairly, in all material respects, the results of operations and cash flows of Highwater Ethanol, LLC for the year ended October 31, 2012, in conformity with accounting principles generally accepted in the United States of America. These financial statements are the responsibility of the Company's management. Our responsibility is to express an opinion on these financial statements based on our audit. We conducted our audit in accordance with the standards of the Public Company Accounting Oversight Board (United States). Those standards require that we plan and perform the audit to obtain reasonable assurance about whether the financial statements are free of material misstatement. An audit includes examining, on a test basis, evidence supporting the amounts and disclosures in the financial statements, assessing the accounting principles used and significant estimates made by management, and evaluating the overall financial statement presentation. We believe that our audit provides a reasonable basis for our opinion.
/s/ Boulay PLLP
Minneapolis, Minnesota
January 29, 2013
35
HIGHWATER ETHANOL, LLC
Balance Sheets
ASSETS | October 31, 2014 | October 31, 2013 | ||||||
Current Assets | ||||||||
Cash and cash equivalents | $ | 15,511,589 | $ | 7,869,188 | ||||
Derivative instruments | 257,934 | 558,309 | ||||||
Accounts receivable | 4,382,371 | 3,271,738 | ||||||
Inventories | 4,295,191 | 3,595,878 | ||||||
Prepaids and other | 55,650 | 143,307 | ||||||
Total current assets | 24,502,735 | 15,438,420 | ||||||
Property and Equipment | ||||||||
Land and land improvements | 6,881,124 | 6,853,912 | ||||||
Buildings | 38,489,826 | 38,450,065 | ||||||
Office equipment | 589,727 | 367,508 | ||||||
Plant and process equipment | 64,015,750 | 60,890,831 | ||||||
Vehicles | 52,994 | 41,994 | ||||||
Construction in progress | 317,477 | 5,672 | ||||||
110,346,898 | 106,609,982 | |||||||
Less accumulated depreciation | (32,862,880 | ) | (26,297,641 | ) | ||||
Net property and equipment | 77,484,018 | 80,312,341 | ||||||
Other Assets | ||||||||
Investments | 2,403,452 | 1,730,626 | ||||||
Restricted marketable securities | — | 1,556,139 | ||||||
Debt issuance costs, net | 231,347 | 570,590 | ||||||
Deposits | 191,457 | 191,457 | ||||||
Total other assets | 2,826,256 | 4,048,812 | ||||||
Total Assets | $ | 104,813,009 | $ | 99,799,573 | ||||
LIABILITIES AND MEMBERS' EQUITY | October 31, 2014 | October 31, 2013 | ||||||
Current Liabilities | ||||||||
Accounts payable | $ | 1,897,610 | $ | 1,714,221 | ||||
Accrued expenses | 1,034,907 | 553,942 | ||||||
Customer deposits | — | 22,317 | ||||||
Derivative instruments | — | 427,091 | ||||||
Current maturities of long-term debt | 4,298,766 | 4,527,410 | ||||||
Total current liabilities | 7,231,283 | 7,244,981 | ||||||
Long-Term Debt | 24,315,010 | 41,231,727 | ||||||
Commitments and Contingencies | ||||||||
Members' Equity | ||||||||
Members' equity, 4,953 units issued and outstanding | 73,266,716 | 51,322,865 | ||||||
Total Liabilities and Members’ Equity | $ | 104,813,009 | $ | 99,799,573 | ||||
Notes to Financial Statements are an integral part of this Statement.
36
HIGHWATER ETHANOL, LLC
Statements of Operations
Fiscal Year Ended | Fiscal Year Ended | Fiscal Year Ended | |||||||||
October 31, 2014 | October 31, 2013 | October 31, 2012 | |||||||||
Revenues | $ | 139,597,173 | $ | 168,682,409 | $ | 156,648,625 | |||||
Cost of Goods Sold | 111,405,819 | 159,305,976 | 155,785,481 | ||||||||
Gross Profit | 28,191,354 | 9,376,433 | 863,144 | ||||||||
Operating Expenses | 2,210,637 | 1,819,444 | 1,804,031 | ||||||||
Operating Profit (Loss) | 25,980,717 | 7,556,989 | (940,887 | ) | |||||||
Other Income (Expense) | |||||||||||
Interest income | 19,956 | 68,009 | 70,859 | ||||||||
Other income | 248,208 | 23,930 | 67,757 | ||||||||
Bond termination premium | (1,518,000 | ) | — | — | |||||||
Interest expense | (3,311,128 | ) | (4,048,031 | ) | (4,282,900 | ) | |||||
Gain on interest rate swap | 427,091 | 769,925 | 741,480 | ||||||||
Income from equity method investments | 87,332 | 453,237 | 218,803 | ||||||||
Total other expense, net | (4,046,541 | ) | (2,732,930 | ) | (3,184,001 | ) | |||||
Net Income (Loss) | $ | 21,934,176 | $ | 4,824,059 | $ | (4,124,888 | ) | ||||
Weighted Average Units Outstanding | 4,953 | 4,953 | 4,953 | ||||||||
Net Income (Loss) Per Unit | $ | 4,428.46 | $ | 973.96 | $ | (832.81 | ) | ||||
Distributions Per Unit | $ | — | $ | — | $ | 100.95 | |||||
Notes to Financial Statements are an integral part of this Statement.
37
HIGHWATER ETHANOL, LLC
Statements of Comprehensive Income (Loss)
Year Ended | Year Ended | Year Ended | |||||||||
October 31, 2014 | October 31, 2013 | October 31, 2012 | |||||||||
Net Income (Loss) | $ | 21,934,176 | $ | 4,824,059 | $ | (4,124,888 | ) | ||||
Other Comprehensive Income (Loss) | |||||||||||
Unrealized losses on restricted marketable securities, net of reclassification adjustment for loss recognized in net income | 9,675 | (33,399 | ) | (51,478 | ) | ||||||
Comprehensive Income (Loss) | $ | 21,943,851 | $ | 4,790,660 | $ | (4,176,366 | ) | ||||
Notes to Financial Statements are an integral part of this Statement.
38
HIGHWATER ETHANOL, LLC
Statement of Changes in Members' Equity
Members' Equity | Accumulated Other Comprehensive Income (Loss) | Total Members Equity | |||||||||
Balance - October 31, 2011 | $ | 50,996,597 | $ | 75,202 | $ | 51,071,799 | |||||
Net loss | (4,124,888 | ) | — | (4,124,888 | ) | ||||||
Member distributions | (500,000 | ) | — | (500,000 | ) | ||||||
Equity adjustment in investee | 136,772 | — | 136,772 | ||||||||
Unrealized loss on restricted marketable securities | — | (51,478 | ) | (51,478 | ) | ||||||
Balance - October 31, 2012 | 46,508,481 | 23,724 | 46,532,205 | ||||||||
Net income | 4,824,059 | — | 4,824,059 | ||||||||
Unrealized loss on restricted marketable securities | — | (33,399 | ) | (33,399 | ) | ||||||
Balance - October 31, 2013 | 51,332,540 | (9,675 | ) | 51,322,865 | |||||||
Net income | 21,934,176 | — | 21,934,176 | ||||||||
Amount reclassified from accumulated other comprehensive income - realized loss on restricted marketable securities | 14,115 | 14,115 | |||||||||
Unrealized loss on restricted marketable securities | — | (4,440 | ) | (4,440 | ) | ||||||
Balance - October 31, 2014 | $ | 73,266,716 | $ | — | $ | 73,266,716 | |||||
Notes to Financial Statements are an integral part of this Statement.
39
HIGHWATER ETHANOL, LLC
Statements of Cash Flows
Fiscal Year Ended | Fiscal Year Ended | Fiscal Year Ended | |||||||||
October 31, 2014 | October 31, 2013 | October 31, 2012 | |||||||||
Cash Flows from Operating Activities | |||||||||||
Net income (loss) | $ | 21,934,176 | $ | 4,824,059 | $ | (4,124,888 | ) | ||||
Adjustments to reconcile net income (loss) to net cash provided by operations | |||||||||||
Depreciation and amortization | 6,904,482 | 6,580,350 | 6,556,622 | ||||||||
Income from equity method investments | (87,332 | ) | (453,237 | ) | — | ||||||
Interest payments made from restricted cash | — | — | 67,276 | ||||||||
Non-cash patronage income | (197,494 | ) | — | — | |||||||
Change in fair value of derivative instruments | — | — | 138,662 | ||||||||
Increase in restricted short-term investments from net interest earned | — | — | (67,276 | ) | |||||||
Change in assets and liabilities | |||||||||||
Restricted marketable securities | 28,484 | (56,697 | ) | (134,472 | ) | ||||||
Realized loss on marketable security | 14,115 | — | — | ||||||||
Accounts receivable, including members | (1,110,633 | ) | 1,656,053 | 2,566,060 | |||||||
Inventories | (699,313 | ) | 550,548 | 21,444 | |||||||
Derivative instruments | (126,716 | ) | (1,067,517 | ) | (741,479 | ) | |||||
Prepaids and other | 87,657 | (74,675 | ) | 9,195 | |||||||
Accounts payable | 183,389 | (27,162 | ) | (554,736 | ) | ||||||
Accrued expenses | 480,965 | (77,167 | ) | 119,176 | |||||||
Customer deposits | (22,317 | ) | 22,317 | — | |||||||
Net cash provided by operating activities | 27,389,463 | 11,876,872 | 3,855,584 | ||||||||
Cash Flows from Investing Activities | |||||||||||
Proceeds from sale of marketable securities | 1,523,215 | — | — | ||||||||
Capital expenditures | (1,384,779 | ) | (206,159 | ) | (938,976 | ) | |||||
Proceeds from sale of property and equipment | — | 28,500 | — | ||||||||
Investment in equity method investment | (388,000 | ) | (262,566 | ) | (454,309 | ) | |||||
Net cash used in investing activities | (249,564 | ) | (440,225 | ) | (1,393,285 | ) | |||||
Cash Flows from Financing Activities | |||||||||||
Payments on long-term debt | (54,786,562 | ) | (4,999,455 | ) | (3,957,986 | ) | |||||
Advances on long-term debt | 35,289,064 | — | — | ||||||||
Member distributions | — | — | (500,000 | ) | |||||||
Net cash used in financing activities | (19,497,498 | ) | (4,999,455 | ) | (4,457,986 | ) | |||||
Net Increase (Decrease) in Cash and Cash Equivalents | 7,642,401 | 6,437,192 | (1,995,687 | ) | |||||||
Cash and cash equivalents – Beginning of Period | 7,869,188 | 1,431,996 | 3,427,683 | ||||||||
Cash and cash equivalents – End of Period | $ | 15,511,589 | $ | 7,869,188 | $ | 1,431,996 | |||||
Supplemental Cash Flow Information | |||||||||||
Cash paid for interest expense | $ | 2,695,085 | $ | 3,635,989 | $ | 3,871,613 | |||||
Supplemental Disclosure of Noncash Financing and Investing Activities | |||||||||||
Unrealized gain (loss) on restricted marketable securities | $ | 9,675 | $ | (33,399 | ) | $ | (51,478 | ) | |||
Capital lease financing | $ | 2,352,137 | $ | — | $ | — | |||||
Investment in RPMG included in accounts payable | $ | — | $ | — | $ | 275,000 | |||||
Investment in RPMG included in long-term liabilities | $ | — | $ | — | $ | 222,652 | |||||
Equity adjustment in investee | $ | — | $ | — | $ | 136,772 | |||||
Notes to Financial Statements are an integral part of this Statement.
40
HIGHWATER ETHANOL, LLC
Notes to Financial Statements
October 31, 2014 and 2013
1. SUMMARY OF SIGNIFICANT ACCOUNTING POLICIES
Nature of Business
Highwater Ethanol, LLC, (a Minnesota Limited Liability Company) operates a 50 million gallon per year ethanol plant in Lamberton, Minnesota. The Company produces and sells fuel ethanol and co-products of the fuel ethanol production process, in the continental United States, Mexico and Canada.
Accounting Estimates
Management uses estimates and assumptions in preparing these financial statements in accordance with generally accepted accounting principles. Those estimates and assumptions affect the reported amounts of assets and liabilities, the disclosure of contingent assets and liabilities, and the reported revenues and expenses. The Company uses estimates and assumptions in accounting for significant matters, among others, the carrying value of property and equipment and related impairment testing, inventory valuation, and derivative instruments. Actual results could differ from those estimates and such differences may be material to the financial statements. The Company periodically reviews estimates and assumptions and the effects of revisions are reflected in the period in which the revision is made.
Revenue Recognition
The Company generally sells ethanol and related products pursuant to marketing agreements. The Company’s products are shipped FOB shipping point. Revenues are recognized when the customer has taken title and has assumed the risks and rewards of ownership, prices are fixed or determinable and collectability is reasonably assured. For ethanol sales, title transfers when loaded into the rail car and for distiller’s grains when the loaded rail cars leave the plant facility.
In accordance with the Company’s agreements for the marketing and sale of ethanol and related products, marketing fees and freight due to the marketers are deducted from the gross sales price at the time incurred. Revenue is recorded net of these marketing fees and freight as they do not provide an identifiable benefit that is sufficiently separable from the sale of ethanol and related products.
Cash and Cash Equivalents
The Company maintains its accounts primarily at one financial institution. At times throughout the year, the cash balances may exceed amounts insured by the Federal Deposit Insurance Corporation. The Company does not believe it is exposed to any significant credit risk on cash and cash equivalent balances.
Derivative Instruments
Derivatives are recognized in the balance sheets and the measurement of these instruments are at fair value. In order for a derivative to qualify as a hedge, specific criteria must be met and appropriate documentation maintained. Gains and losses from derivatives that do not qualify as hedges, or are undesignated, must be recognized immediately in earnings. If the derivative does qualify as a hedge, depending on the nature of the hedge, changes in the fair value of the derivative will be either offset against the change in fair value of the hedged assets, liabilities, or firm commitments through earnings or recognized in other comprehensive income until the hedged item is recognized in earnings.
Contracts are evaluated to determine whether the contracts are derivatives. Certain contracts that literally meet the definition of a derivative may be exempted as “normal purchases or normal sales”. Normal purchases and normal sales are contracts that provide for the purchase or sale of something other than a financial instrument or derivative instrument that will be delivered in quantities expected to be used or sold over a reasonable period in the normal course of business. Contracts that meet the requirements of normal purchases or sales are documented as normal and exempted from accounting as derivatives, therefore, are not marked to market in our financial statements.
The Company entered into corn commodity-based and natural gas derivatives in order to protect cash flows from fluctuations caused by volatility in prices. These derivatives are not designated as effective hedges for accounting purposes. For derivative instruments that are not accounted for as hedges, or for the ineffective portions of qualifying hedges, the change in fair value is
41
HIGHWATER ETHANOL, LLC
Notes to Financial Statements
October 31, 2014 and 2013
recorded through earnings in the period of change. Corn and natural gas derivative changes in fair market value are included in costs of goods sold.
Restricted Marketable Securities
The Company maintained restricted marketable securities in debt securities as part of the capital lease financing agreements described in Note 9. The restricted marketable securities consisted primarily of municipal obligations, U.S. treasury government obligations, and corporate obligations. Restricted marketable securities are classified as “available-for-sale” and are carried at their estimated fair market value based on quoted market prices at year end.
Accounts Receivable
Credit terms are extended to customers in the normal course of business. The Company routinely monitors accounts receivable and customer balances are generally kept current at 30 days or less. The Company generally requires no collateral.
Accounts receivable are recorded at their estimated net realizable value. Accounts are considered past due if payment is not made on a timely basis in accordance with the Company’s credit terms. Accounts considered uncollectible are written off. The Company’s estimate of the allowance for doubtful accounts is based on historical experience, its evaluation of the current status of receivables, and unusual circumstances, if any. At October 31, 2014 and 2013, the Company believed that such amounts would be collectible and an allowance was not considered necessary.
Inventories
Inventories consist of raw materials, supplies, work in process and finished goods. Raw materials and supplies are stated at the lower of cost (first-in, first-out method) or market. Work in process and finished goods are stated at the lower of average cost or market.
Property and Equipment
Property and equipment is stated at cost. Depreciation is provided over an estimated useful life by use of the straight line method. Maintenance and repairs are expensed as incurred; major improvements and betterments are capitalized. The present value of capital lease obligations is classified as long-term debt and the related assets will be included with property and equipment. Amortization of property and equipment under capital lease is included with depreciation expense.
Depreciation is computed using the straight-line method over the following estimated useful lives:
Minimum Years | Maximum Years | |
Land improvements | 15 | 20 |
Buildings | 10 | 20 |
Office equipment | 5 | 5 |
Plant and process equipment | 10 | 20 |
Vehicles | 7 | 7 |
Carrying Value of Long-Lived Assets
Long-lived assets, such as property and equipment, and other long-lived assets subject to amortization, are reviewed for impairment whenever events or changes in circumstances indicate that the carrying amount of an asset may not be recoverable. If circumstances require a long-lived asset be tested for possible impairment, the Company first compares undiscounted cash flows expected to be generated by an asset to the carrying value of the asset. If the carrying value of the long-lived asset is not recoverable on an undiscounted cash flow basis, impairment is recognized to the extent that the carrying value exceeds its fair value. Fair value is determined through various valuation techniques including discounted cash flow models, quoted market values and third-party independent appraisals, as considered necessary.
42
HIGHWATER ETHANOL, LLC
Notes to Financial Statements
October 31, 2014 and 2013
In August 2009, the Company completed construction of its ethanol production facilities with installed capacity of 50 million gallons per year. The carrying value of these facilities at October 31, 2014 was $77,484,018. In accordance with the Company’s policy for evaluating impairment of long-lived assets described above, when a triggering event occurs management evaluates the recoverability of the facilities based on projected future cash flows from operations over the facilities’ estimated useful lives. In determining the projected future undiscounted cash flows, the Company makes significant assumptions concerning the future viability of the ethanol industry, the future price of corn in relation to the future price of ethanol and the overall demand in relation to production and supply capacity. The Company has not recorded any impairment as of October 31, 2014 and 2013.
Fair Value of Financial Instruments
The carrying value of cash and cash equivalents, accounts receivable, and accounts payable, and other working capital items approximate fair value at October 31, 2014 and 2013 due to the short maturity nature of these instruments.
The carrying value of restricted marketable securities approximate their fair value based on quoted market prices at year end. The carrying value of derivative instruments approximates fair value based on widely accepted valuation techniques including discounted cash flow analysis which includes observable market-based inputs.
The Company believes the carrying amount of the long-term debt approximates the fair value due to a significant portion of total indebtedness containing variable interest rates and this rate is a market interest rate for these borrowings.
Equity Method Investments
The Company has an investment interest in an unlisted company, Renewable Fuels Marketing Group, LLC (RPMG), who markets the Company’s ethanol. This investment is a flow-through entity and is being accounted for by the equity method of accounting under which the Company’s share of RPMG net income is recognized as income in the Company’s statements of operations and added to the investment account. Distributions or dividends received from the investment are treated as a reduction of the investment account. The Company has a 7% interest in RPMG. The Company consistently follows the practice of recognizing the net income based on a one month lag. Therefore, the net income which is reported in the Company’s statements of operations for the years ended October 31, 2014, 2013 and 2012 is based on the investee’s results of operations for the twelve month periods ended September 30, 2014, 2013 and 2012.
The Company is one of eight member owner investors in Lawrenceville Tank, LLC. The Company will have a 7% ownership, and Lawrenceville Tank, LLC will own and operate a trans load/tank facility in Atlanta, Georgia area. This will provide another area of opportunity for the Company’s ethanol production to be marketed by RPMG. The Company has invested total commitments of $385,000 as of October 31, 2014.
Debt Issuance Costs
Costs associated with the issuance of debt are recorded as debt issuance costs and are amortized over the term of the related debt by use of the effective interest method.
Net Income (Loss) per Unit
Basic net income (loss) per unit is computed by dividing net income (loss) by the weighted average number of members’ units outstanding during the period. Diluted net income per unit is computed by dividing net income by the weighted average number of members’ units and members’ unit equivalents outstanding during the period. There were no member unit equivalents outstanding during the periods presented; accordingly, for all periods presented, the Company’s basic and diluted net income (loss) per unit are the same.
Income Taxes
The Company is treated as a partnership for federal and state income tax purposes and generally does not incur income taxes. Instead, their income or losses are included in the income tax returns of the members and partners. Accordingly, no provision or liability for federal or state income taxes has been included in these financial statements.
43
HIGHWATER ETHANOL, LLC
Notes to Financial Statements
October 31, 2014 and 2013
The Company recognizes and measures tax benefits when realization of the benefits is uncertain under a two-step approach. The first step is to determine whether the benefit meets the more-likely-than-not condition for recognition and the second step is to determine the amount to be recognized based on the cumulative probability that exceeds 50%. The Company has not recognized any liability for unrecognized tax benefits and has not identified any uncertain tax positions.
The Company files income tax returns in the U.S. federal and Minnesota state jurisdictions. The Company is no longer subject to U.S. federal and state income tax examinations by tax authorities for years before 2010.
Railcar Damages Accrual
In accordance with the railcar lease agreements, the Company is required to pay for damages considered to be in excess of normal wear and tear at the termination of the lease. The Company accrues the estimated cost for railcar damages over the term of the lease.
Environmental Liabilities
The Company’s operations are subject to environmental laws and regulations adopted by various governmental entities in the jurisdiction in which it operates. These laws require the Company to investigate and remediate the effects of the release or disposal of materials at its location. Accordingly, the Company has adopted policies, practices, and procedures in the areas of pollution control, occupational health, and the production, handling, storage, and use of hazardous materials to prevent material environmental or other damage, and to limit the financial liability, which could result from such events. Environmental liabilities are recorded when the liability is probable and the costs can be reasonably estimated.
Segment Reporting
Operating segments are defined as components of an enterprise for which separate financial information is available that is evaluated regularly by the chief operating decision maker or decision making group in deciding how to allocate resources and in assessing performance. The Company has determined that it has one reportable business segment, the manufacture and marketing of fuel-grade ethanol and the co-products of the ethanol production process. The Company's chief operating decision maker reviews financial information of the Company as a whole for purposes of assessing financial performance and making operating decisions. Accordingly, the Company considers itself to be operating in a single industry segment.
Recent Accounting Pronouncement
In May 2014, the FASB issued ASU No. 2014-09 (ASU 2014-09), Revenue from Contracts with Customers, which supersedes nearly all existing revenue recognition guidance under U.S. GAAP. The new standard requires a company to recognize revenue when it transfers goods or services to customers in an amount that reflects the consideration that the company expects to receive for those goods or services. Additionally, the guidance requires improved disclosures to help users of financial statements better understand the nature, amount, timing, and uncertainty of revenue and cash flows arising from contracts with customers. ASU 2014-09 is effective for annual reporting periods beginning after December 15, 2016, including interim periods within that reporting period, which is the Company’s first quarter of fiscal year 2018. Early application is not permitted. The new standard allows for the amendment to be applied either retrospectively to each prior reporting period presented or retrospectively as a cumulative-effect adjustment as of the date of adoption. The Company is evaluating the effect that ASU 2014-09 will have on its consolidated financial statements and related disclosures, including which transition method it will adopt.
2. UNCERTAINTIES
The Company derives substantially all of its revenues from the sale of ethanol and distillers grains. These products are commodities and the market prices for these products display substantial volatility and are subject to a number of factors which are beyond the control of the Company. The Company’s most significant manufacturing inputs are corn and natural gas. The price of these commodities is also subject to substantial volatility and uncontrollable market factors. In addition, these input costs do not necessarily fluctuate with the market prices for ethanol and distillers grains. As a result, the Company is subject to significant risk that its operating margins can be reduced or eliminated due to the relative movements in the market prices of its products and major manufacturing inputs. As a result, market fluctuations in the price of or demand for these commodities can have a significant adverse effect on the Company’s operations, profitability, and availability of cash flows to make loan payments and maintain
44
HIGHWATER ETHANOL, LLC
Notes to Financial Statements
October 31, 2014 and 2013
compliance with the loan agreement.
3. CONCENTRATIONS
The Company has identified certain concentrations that are present in their business operations. The Company’s revenue from ethanol sales and distiller sales are derived from a single customer under an ethanol marketing agreement and a distillers marketing agreement as described in Note 13. The Company purchases all corn from a single supplier, a related party, under a grain procurement agreement described in Note 13. The Company has a revenue concentration in that its revenue is generated from the sales of primarily two products, ethanol and distillers grains.
The Company sold all ethanol produced to a related party under an ethanol marketing agreement described in Note 13. Total sales for the years ended October 31, 2014, 2013 and 2012 were $111,591,475, $130,623,053 and $123,398,657, respectively. Accounts receivable as of October 31, 2014 and 2013 were $3,315,756 and $2,312,825, respectively.
4. FAIR VALUE MEASUREMENTS
Various inputs are considered when determining the value of financial instruments. The inputs or methodologies used for valuing financial instruments are not necessarily an indication of the risk associated with investing in these instruments. These inputs are summarized in the three broad levels listed below:
• | Level 1 inputs are quoted prices in active markets for identical assets or liabilities as of the reporting date. Active markets are those in which transactions for the asset or liability occur with sufficient frequency and volume to provide pricing information on an ongoing basis. |
• | Level 2 inputs include the following: |
◦ | Quoted prices in active markets for similar assets or liabilities. |
◦ | Quoted prices in markets that are not active for identical or similar assets or liabilities. |
◦ | Inputs other than quoted prices that are observable for the asset or liability. |
◦ | Inputs that are derived primarily from or corroborated by observable market data by correlation or other means. |
• | Level 3 inputs are unobservable inputs for the asset or liability. |
The following table provides information on those assets (liabilities) measured at fair value on a recurring basis.
Fair Value as of | Fair Value Measurement Using | |||||||||||||||
October 31, 2014 | Level 1 | Level 2 | Level 3 | |||||||||||||
Derivative instrument - commodities | $ | (339,011 | ) | $ | (339,011 | ) | $ | — | $ | — | ||||||
Fair Value as of | Fair Value Measurement Using | |||||||||||||||
October 31, 2013 | Level 1 | Level 2 | Level 3 | |||||||||||||
Restricted marketable securities | $ | 1,556,139 | $ | 1,556,139 | $ | — | $ | — | ||||||||
Derivative instrument - interest rate swap | $ | (427,091 | ) | $ | — | $ | (427,091 | ) | $ | — | ||||||
Derivative instrument - commodities | $ | (467,015 | ) | $ | (467,015 | ) | $ | — | $ | — | ||||||
The fair value of restricted marketable securities is based on quoted market prices in an active market. The Company determined the fair value of the interest rate swap by using widely accepted valuation techniques including discounted cash flow analysis on the expected cash flows of each instrument and observable market-based inputs. The analysis reflects the contractual terms of the swap agreement, including the period to maturity and uses observable market-based inputs and uses the market standard methodology of netting the discounted future fixed cash receipts and the discounted expected variable cash payments. The Company determines the fair value of the commodities contracts by obtaining the fair value measurements from an independent pricing service based on dealer quotes and live trading levels from the Chicago Board of Trade.
45
HIGHWATER ETHANOL, LLC
Notes to Financial Statements
October 31, 2014 and 2013
5. RESTRICTED MARKETABLE SECURITIES
The cost and fair value of the Company's restricted marketable securities consist of the following at October 31, 2013:
Amortized Cost | Gross Unrealized Losses | Fair Value | |||||||
Restricted marketable securities - Long-term municipal obligations | $ | 1,565,814 | $ | (9,675 | ) | $ | 1,556,139 | ||
The long-term restricted marketable securities relate to the debt service reserve fund required by the capital lease agreement. The Company had unrealized loss of $9,675 and unrealized gains of $23,724 included in accumulated other comprehensive income at, October 31, 2013 and October 31, 2012, respectively. The Company sold the marketable securities and had a realized loss of $14,115 during the year ended October 31, 2014.
6. INVENTORIES
Inventories consisted of the following at:
October 31, 2014 | October 31, 2013 | |||||||
Raw materials | $ | 1,653,015 | $ | 986,199 | ||||
Spare parts and supplies | 1,603,984 | 1,241,515 | ||||||
Work in process | 710,583 | 883,278 | ||||||
Finished goods | 327,609 | 484,886 | ||||||
Total | $ | 4,295,191 | $ | 3,595,878 | ||||
7. DERIVATIVE INSTRUMENTS
As of October 31, 2014, the Company had entered into corn and natural gas derivative instruments, which are required to be recorded as either assets or liabilities at fair value in the balance sheet. The Company uses these instruments to manage risks from changes in market rates and prices. They are not used for speculative purposes. Derivatives qualify for treatment as hedges when there is a high correlation between the change in fair value of the derivative instrument and the related change in value of the underlying hedged item. The Company may designate the hedging instruments based upon the exposure being hedged as a fair value hedge, a cash flow hedge or a hedge against foreign currency exposure. The derivative instruments outstanding at October 31, 2014 are not designated as effective hedges for accounting purposes.
Interest Rate Swap
As of October 31, 2013, the Company had an interest rate swap with a notional amount of approximately $16,582,000 that effectively fixed the interest rate for a corresponding amount of long term debt at 7.6%. On February 26, 2014 the Company terminated the interest rate swap. During the years ended October 31, 2014 and 2013, the company paid $481,159 and $794,795 respectively, including $234,550 upon termination. These amounts are included in interest expense.
Corn and Natural Gas Contracts
As of October 31, 2014, the Company has open positions for 590,000 bushels of corn and 35,000 dekatherms of natural gas. Management expects all open positions outstanding as of October 31, 2014 to be realized within the next twelve months.
The following tables provide details regarding the Company's derivative instruments at October 31:
46
HIGHWATER ETHANOL, LLC
Notes to Financial Statements
October 31, 2014 and 2013
Instrument | Balance Sheet location | Liabilities | ||||||
2014 | 2013 | |||||||
Interest rate swap | Current liabilities | $ | — | $ | (427,091 | ) | ||
Corn, natural gas and ethanol contracts | ||||||||
In loss position | $ | (339,011 | ) | $ | (467,015 | ) | ||
Deposits with broker | 596,945 | 1,025,324 | ||||||
Current assets | $ | 257,934 | $ | 558,309 | ||||
Corn, natural gas and ethanol contracts totaling $467,015 as of October 31, 2013 were netted with deposits with broker, to be consistent with the 2014 presentation.
The following tables provide details regarding the gains (losses) from the Company's derivative instruments in the statements of operations, none of which are designated as hedging instruments:
Statement of | Year Ended October 31 | |||||||||||
Operations location | 2014 | 2013 | 2012 | |||||||||
Interest rate swap | Other income (expense) | $ | 427,091 | $ | 769,925 | $ | 741,480 | |||||
Ethanol contracts | Revenues | (524,706 | ) | — | — | |||||||
Corn contracts | Cost of goods sold | (810,856 | ) | 331,488 | 481,013 | |||||||
Natural gas contracts | Cost of goods sold | (135,785 | ) | 41,198 | (419,021 | ) | ||||||
8. INVESTMENT IN RPMG
The financial statements of RPMG are summarized as of and for the years ended September 30 as follows:
September 30, 2014 | September 30, 2013 | |||||
Current assets | $ | 117,836,343 | $ | 138,356,633 | ||
Other assets | 1,240,202 | 688,613 | ||||
Current liabilities | 77,868,455 | 104,550,866 | ||||
Long-term liabilities | 16,000 | — | ||||
Members' equity | 41,192,090 | 34,494,380 | ||||
Revenue | 4,221,333,376 | 4,107,686,492 | ||||
Net income | 3,946,180 | 5,879,093 | ||||
9. DEBT FINANCING
Long-term debt consists of the following at:
47
HIGHWATER ETHANOL, LLC
Notes to Financial Statements
October 31, 2014 and 2013
October 31, 2014 | October 31, 2013 | ||||||
Variable Rate Term Loan (AgStar) | $ | 26,509,288 | $ | — | |||
Capital leases, see terms below | 2,104,488 | 15,180,000 | |||||
Fixed rate note payable (FNBO) | — | 18,098,700 | |||||
Variable rate note payable (FNBO) | — | 12,480,437 | |||||
Total | 28,613,776 | 45,759,137 | |||||
Less amounts due within one year | 4,298,766 | 4,527,410 | |||||
Net long-term debt | $ | 24,315,010 | $ | 41,231,727 | |||
Bank Financing
On February 27, 2014, the Company entered into a Credit Agreement with Ag Star Financial Services, PCA ("AgStar") for the purpose of refinancing the debt facility previously held by First National Bank of Omaha ("FNBO"). AgStar's Credit Agreement provides for a $20,000,000 Term Loan, a $5,000,000 Term Revolving Loan, and a $5,000,000 Revolving Line of Credit. The availability under the Term Revolving Loan supports and will be reduced by the issuance of letters of credit. The Company paid a $50,000 underwriting fee and a $75,000 commitment fee in addition to other standard closing costs in connection with the refinancing.
On February 26, 2014, in connection with and in preparation for the refinancing of the debt facility, the Company paid $7,639,971 towards the balance of FNBO's Variable Rate Note, leaving a combined balance due of $20,000,000 on FNBO's Fixed Rate Note and Variable Rate Note. The Company also terminated the interest rate swap. In connection with terminating the interest rate swap, the Company paid $234,550.
On September 22, 2014, the Company entered into an Amended and Restated Credit Agreement withAg Star which amended the Credit Agreement originally dated February 27, 2014. The purpose for the amendment was to refinance a portion of a credit arrangement previously held by U.S. Bank National Association, as trustee, and the City of Lamberton, Minnesota (the “City”).
The Amended and Restated Credit Agreement increases the Term Loan to $27,000,000 and also continues to provide the Company with a $5,000,000 Term Revolving Loan, and a $5,000,000 Revolving Line of Credit subject to terms described in the Amended and Restated Credit Agreement and summarized below. The Company paid a$25,000 underwriting fee and a $17,500 commitment fee and agreed to pay an annual facility fee of $10,000 to AgStar in addition to other standard closing costs in connection with the refinancing.
Term Loan
The Term Loan is for $27,000,000 with a variable interest rate that is the greater of the 30-day LIBOR rate plus 325 basis points with no minimum interest rate. Monthly principal payments are due on the Term Loan of approximately $321,000 plus accrued interest. Payments are based upon a seven year amortization and the Term Loan is fully amortized. The outstanding balance on this note was $26,509,288 at October 31, 2014. The Company may convert the Term Loan to a fixed rate loan, subject to certain conditions as described in the Amended and Restated Credit Agreement and with the consent of AgStar.
Term Revolving Loan
The Term Revolving Loan is for up to $5,000,000 with a variable interest rate that is the 30-day LIBOR rate plus 325 basis points with no minimum interest rate. The Term Revolving Loan may be advanced, repaid and re-borrowed during the term. Monthly interest payments are due on the Term Revolving Loan. Payment of all amounts outstanding is due on September 22, 2021. The outstanding balance was $0 at October 31, 2014. As of October 31, 2014, the Company has $2,500,000 in letters of credit outstanding which reduce the amount available under the Term Revolving Loan. The Company pays interest at a rate of 1.5% on amounts outstanding for the letters of credit.
48
HIGHWATER ETHANOL, LLC
Notes to Financial Statements
October 31, 2014 and 2013
Revolving Line of Credit
The Company has a Revolving Line of Credit available equal to the amount of the Borrowing Base, with a maximum limit of $5,000,000. The Borrowing Base will vary and may at times be less than $5,000,000. The Revolving Line of Credit expires on February 26, 2015 and accrues interest at the 30-day LIBOR rate plus 325 basis points with no minimum interest rate. Monthly interest payments are due on the Revolving Line of Credit. The outstanding balance was $0 at October 31, 2014.
Covenants and other Miscellaneous Terms
The loan facility with AgStar is secured by substantially all business assets. The Company executed a mortgage creating a first lien on its real estate and plant and a security interest in all personal property located on the premises and assigned all rents and leases to property, marketing contracts, risk management services contract, and natural gas, electricity, water service and grain procurement agreements.
The Company is also subject to various financial and non-financial covenants that limit distributions and debt and require minimum debt service coverage, tangible net worth, and working capital requirements. The fixed charge coverage ratio is no less than 1.15:1.00 and is measured annually by comparing adjusted EBITDA to scheduled payments of principal and interest plus capital expenditures and distributions. The minimum net worth is no less than $42,000,000, which is calculated as the excess of total assets excluding various disallowed assets per the Amended and Restated Credit Agreement over total liabilities, and is measured quarterly. The minimum working capital is $8,250,000, which is calculated as current assets plus the amount available for drawing under our Term Revolving Loan, and undrawn amounts on outstanding letters of credit less current liabilities, and is measured quarterly.
The Company is limited to annual capital expenditures of $2,000,000 without prior approval, incurring additional debt over certain amounts without prior approval, and making additional investments as described in the Amended and Restated Credit Agreement, and is also prohibited from making distributions to members in excess of 50% of net income in a given year without prior approval.
The Company is also required to pay unused commitment fees for the Term Revolving Loan and the Revolving Line of Credit as defined in the Amended and Restated Credit Agreement.
Capital Leases
City of Lamberton, Minnesota
In April 2008, the Company entered into a lease agreement with the City of Lamberton, Minnesota, (the City) in order to finance equipment for the plant. The City financed the purchase of equipment through Solid Waste Facilities Revenue Bonds Series 2008A totaling $15,180,000. Under the equipment lease agreement with the City, the Company started making interest payments on November 25, 2008 and monthly thereafter at an implicit interest rate of 8.5%. Monthly capital lease payments for principal were scheduled to begin on November 25, 2014. The capital lease included an option to purchase the equipment at fair market value at the end of the lease term.
On October 2, 2014, the Company paid the capital lease in full, retired the bonds and purchased the equipment. The Company paid a premium in the amount of $1,518,000in connection with the termination of the capital lease.
Butamax
The Company entered into a series of related definitive agreements, dated September 26, 2013, with Butamax which include an Easement for Construction and Process Demonstration Agreement, an Equipment Lease Agreement, a Technology License Agreement, a Technology Demonstration Risk Reduction Agreement and a Security Agreement (collectively, the "Agreements") pursuant to which Butamax has agreed to construct, install and lease its corn oil separation system and license to the Company its proprietary, patent-protected corn oil separation technology. Pursuant to the Agreements, the Company agreed to give Butamax access to the plant in order to construct, install, operate, test and commercially validate a corn oil separation system. Butamax retains ownership of the corn oil separation system and technology but agrees to lease it to the Company for a term of 120 months subject to Butamax's right to remove the system if the Company is in breach of the Agreements. The term of the lease may also be extended or terminated pursuant to the terms of the Agreements. The Company is responsible for repairs and
49
HIGHWATER ETHANOL, LLC
Notes to Financial Statements
October 31, 2014 and 2013
maintenance of the system and bear the risk of loss. In return, the Company agrees to payment of certain license fees which are subject to being reduced under the terms of the Agreements if the corn oil separation system does not meet certain performance goals. The Agreements provide that the corn oil separation system shall be conveyed to the Company at the end of the term so long as the Company is not in breach of the Agreements. The Company granted a security interest to Butamax in the corn oil separation system to secure its obligations under the Agreements. Pursuant to the Agreements, the Company agreed, subject to certain obligations of confidentiality, to provide Butamax with Company information on a monthly basis including business and financial information and have granted Butamax the option to have a representative present in board and committee meetings as an observer. The Company also agreed to give Butamax notice in the event of an issuance or sale of membership interests or convertible debt instruments. The Company recorded this as a capital lease in April 2014, and the balance as of October 31, 2014 was $2,104,488.
The estimated maturities of the long-term debt at October 31, 2014 are as follows:
2015 | $ | 4,298,766 | |
2016 | 4,651,284 | ||
2017 | 4,404,487 | ||
2018 | 3,857,160 | ||
2019 | 3,857,160 | ||
2020 and thereafter | 7,544,919 | ||
Long-term debt | $ | 28,613,776 | |
10. LEASES
The Company leases rail cars and equipment under operating and capital leases. Rail car leases include additional payments for usage beyond specified levels. Total lease expense for the years ending October 31, 2014, 2013 and 2012 was approximately $218,000, $240,000, and $222,000 respectively.
Future minimum lease payments under the leases are as follows at October 31, 2014:
Operating | Capital | |||||
2015 | $ | 295,920 | $ | 833,328 | ||
2016 | 295,920 | 833,328 | ||||
2017 | 295,920 | 555,569 | ||||
2018 | 295,920 | — | ||||
2019 | 197,280 | — | ||||
Total | $ | 1,380,960 | 2,222,225 | |||
Less amount representing interest | 117,737 | |||||
Present value of minimum lease payments (included in note 9) | $ | 2,104,488 | ||||
11. MEMBERS' EQUITY
The Company has one class of membership units, and is authorized to issue up to 10,000 units,which include certain transfer restrictions as specified in the operating agreement and pursuant to applicable tax and securities law, with each unit representing a pro rata ownership in the Company’s capital, profits, losses and distributions. Income and losses are allocated to all members based upon their respective percentage of units held.
12. INCOME TAXES
The Company has adopted an October 31 fiscal year end, but has a tax year end of December 31. The differences between financial statement basis and tax basis of assets are estimated as follows:
50
HIGHWATER ETHANOL, LLC
Notes to Financial Statements
October 31, 2014 and 2013
October 31, 2014 | October 31, 2013 | |||||||
Financial statement basis of total assets | $ | 104,813,009 | $ | 99,799,573 | ||||
Derivative instruments - commodities | 339,011 | 467,015 | ||||||
Organizational and start-up costs | 2,576,124 | 2,840,342 | ||||||
Book to tax depreciation | (25,584,226 | ) | (27,846,650 | ) | ||||
Income tax basis of total assets | $ | 82,143,918 | $ | 75,260,280 | ||||
The differences between the financial statement basis and tax basis of the Company's liabilities are estimated as follows:
October 31, 2014 | October 31, 2013 | |||||||
Financial statement basis of total liabilities | $ | 31,546,293 | $ | 48,476,708 | ||||
Less: Interest rate swap | — | (427,091 | ) | |||||
Income tax basis of total liabilities | $ | 31,546,293 | $ | 48,049,617 | ||||
13. COMMITMENTS AND CONTINGENCIES
Marketing Agreements
The Company has an ethanol marketing agreement with a marketer (RPMG) to purchase, market, and distribute all the ethanol produced by the Company. The Company also entered into a member control agreement with the marketer whereby the Company made capital contributions and became a minority owner of the marketer. The member control agreement became effective on February 1, 2011 and provides the Company a membership interest with voting rights. The marketing agreement will terminate if the Company ceases to be a member. The Company will assume certain of the member’s rail car leases if the agreement is terminated. The Company can sell its ethanol either through an index arrangement or at an agreed upon fixed price. The marketing agreement is perpetual until terminated according to the agreement. The Company may be obligated to continue to market its ethanol through the marketer for a period of time. The amended agreement requires minimum capital amounts invested as required under the agreement.
The Company has a distillers grains marketing agreement with a marketer to market all the dried distillers grains produced at the plant. Under the agreement the marketer charges a maximum of $2.00 per ton and a minimum of $1.50 per ton price using 2% of the FOB plant price actually received by them for all dried distillers grains removed. The agreement will remain in effect unless otherwise terminated by either party with 120 days notice. Under the agreement, the marketer is responsible for all transportation arrangements for the distribution of the dried distillers grains. The Company markets and sells its modified and wet distillers grains.
The Company has a crude corn oil marketing agreement with a marketer to market all corn oil to be produced at the plant. Under the agreement, the marketer will execute contracts with buyers after giving prior notice of the terms and conditions thereof to the Company and receiving direction from the Company to accept such contracts. For all corn oil sold, the Company will receive the actual price received from buyers less a marketing fee, actual freight and transportation costs and certain taxes related to the purchase, delivery or sale. The Company agrees to provide corn oil meeting certain specifications as provided in the agreement and the agreement provides for a process for rejection of nonconforming corn oil. The agreement automatically renews for successive one-year terms unless terminated in accordance with the agreement.
Grain Procurement Contract
The Company has a grain procurement agreement with a grain elevator to provide all of the corn needed for the operation of the ethanol plant. Under the agreement, the Company purchases corn at the local market price delivered to the plant plus a fixed fee per bushel of corn. The agreement expires in August 2016.
Regulatory Agencies
The Company is subject to oversight from regulatory agencies regarding environmental concerns which arise in the ordinary course of its business.
Forward Contracts
At October 31, 2014, the Company has approximately 22,600 tons of forward dried distiller grains sales contracts and 957,540 pounds of forward fixed price corn oil sales contracts at various fixed prices for various delivery periods through August 2015 and December 2015, respectively. At October 31, 2014, the Company also has 438,200 MMBTUs of forward contracts for natural gas purchases for various delivery periods through April 2015, which represents approximately 61.1% of the Company’s projected usage for the corresponding time period.
14. QUARTERLY FINANCIAL DATA (UNAUDITED)
First Quarter | Second Quarter | Third Quarter | Fourth Quarter | ||||||||||||
Fiscal Year Ended October 31, 2014 | |||||||||||||||
Revenues | $ | 38,587,712 | $ | 32,042,415 | $ | 37,172,560 | $ | 31,794,486 | |||||||
Gross profit | 9,200,333 | 7,044,814 | 5,245,115 | 6,701,092 | |||||||||||
Operating income | 8,551,490 | 6,494,307 | 4,776,195 | 6,158,725 | |||||||||||
Net income | 7,753,542 | 5,985,350 | 4,289,316 | 3,905,968 | |||||||||||
Basic and diluted earnings per unit | 1,565.42 | 1,208.43 | 866.00 | 788.61 | |||||||||||
First Quarter | Second Quarter | Third Quarter | Fourth Quarter | ||||||||||||
Fiscal Year Ended October 31, 2013 | |||||||||||||||
Revenues | $ | 43,201,533 | $ | 42,638,894 | $ | 44,801,707 | $ | 38,040,275 | |||||||
Gross profit (loss) | (529,082 | ) | 1,986,332 | 2,611,765 | 5,307,418 | ||||||||||
Operating income (loss) | (1,057,604 | ) | 1,549,396 | 2,211,508 | 4,853,689 | ||||||||||
Net income (loss) | (1,746,420 | ) | 770,314 | 1,565,598 | 4,234,567 | ||||||||||
Basic and diluted earnings (loss) per unit | (352.60 | ) | 155.52 | 316.09 | 854.95 | ||||||||||
First Quarter | Second Quarter | Third Quarter | Fourth Quarter | ||||||||||||
Fiscal Year Ended October 31, 2012 | |||||||||||||||
Revenues | $ | 39,827,576 | $ | 33,771,321 | $ | 39,240,928 | $ | 43,808,800 | |||||||
Gross profit (loss) | 2,337,847 | (980,751 | ) | 185,590 | (679,542 | ) | |||||||||
Operating income (loss) | 1,822,732 | (1,467,528 | ) | (203,503 | ) | (1,092,588 | ) | ||||||||
Net income (loss) | 965,975 | (2,330,276 | ) | (1,068,852 | ) | (1,691,735 | ) | ||||||||
Basic and diluted earnings (loss) per unit | 195.03 | (470.48 | ) | (215.80 | ) | (341.56 | ) | ||||||||
51
HIGHWATER ETHANOL, LLC
Notes to Financial Statements
October 31, 2014 and 2013
The above quarterly financial data is unaudited, but in the opinion of management, all adjustments necessary for a fair presentation of the selected data for these periods presented have been included.
15. SUBSEQUENT EVENT
On November 19, 2014 the board of governors declared a cash distribution of $1,125 per membership unit to the holders of record as of the close of business on November 19, 2014, for a total distribution of $5,572,125. The distribution was paid on December 16, 2014.
52
ITEM 9. CHANGES IN AND DISAGREEMENTS WITH ACCOUNTANTS ON ACCOUNTING AND FINANCIAL DISCLOSURE
None.
ITEM 9A. CONTROLS AND PROCEDURES
Disclosure Controls and Procedures
Our management is responsible for maintaining disclosure controls and procedures that are designed to ensure that information required to be disclosed in the reports that the Company files or submits under the Securities Exchange Act of 1934, as amended (the “Exchange Act”) is recorded, processed, summarized and reported within the time periods specified in the Securities and Exchange Commission's rules and forms. In addition, the disclosure controls and procedures must ensure that such information is accumulated and communicated to our management, including our Chief Executive Officer and Chief Financial Officer, as appropriate, to allow timely decisions regarding required financial and other required disclosures.
Our management, including our Chief Executive Officer (the principal executive officer), Brian Kletscher, along with our Chief Financial Officer (the principal financial officer), Lucas Schneider, have reviewed and evaluated the effectiveness of our disclosure controls and procedures (as defined in Rule 13a-15(e) and Rule 15d-15(e) under the Exchange Act) as of October 31, 2014. Based on this review and evaluation, these officers have concluded that our disclosure controls and procedures are effective to ensure that information required to be disclosed in the reports that we file or submit under the Exchange Act is recorded, processed, summarized and reported within the time periods required by the forms and rules of the Securities and Exchange Commission; and to ensure that the information required to be disclosed by an issuer in the reports that it files or submits under the Exchange Act is accumulated and communicated to our management including our principal executive and principal financial officers, or persons performing similar functions, as appropriate to allow timely decisions regarding required disclosure.
Internal Control Over Financial Reporting
Inherent Limitations Over Internal Controls
Our internal control over financial reporting is designed to provide reasonable assurance regarding the reliability of financial reporting and the preparation of financial statements for external purposes in accordance with generally accepted accounting principles. Our internal control over financial reporting includes those policies and procedures that:
(i) pertain to the maintenance of records that, in reasonable detail, accurately and fairly reflect the transactions and dispositions of our assets;
(ii) provide reasonable assurance that transactions are recorded as necessary to permit preparation of financial statements in accordance with generally accepted accounting principles, and that our receipts and expenditures are being made only in accordance with authorizations of our management and directors; and
(iii) provide reasonable assurance regarding prevention or timely detection of unauthorized acquisition, use, or disposition of our assets that could have a material effect on the financial statements.
Management, including our Chief Executive Officer and Chief Financial Officer, does not expect that our internal controls will prevent or detect all errors and all fraud. A control system, no matter how well designed and operated, can provide only reasonable, not absolute, assurance that the objectives of the control system are met. Further, the design of a control system must reflect the fact that there are resource constraints, and the benefits of controls must be considered relative to their costs. Because of the inherent limitations in all control systems, no evaluation of internal controls can provide absolute assurance that all control issues and instances of fraud, if any, have been detected. Also, any evaluation of the effectiveness of controls in future periods are subject to the risk that those internal controls may become inadequate because of changes in business conditions, or that the degree of compliance with the policies or procedures may deteriorate.
Management's Annual Report on Internal Control Over Financial Reporting
Our management is responsible for establishing and maintaining adequate internal control over financial reporting (as defined in Rule 13a-15(f) under the Securities Exchange Act of 1934, as amended). Management conducted an evaluation of the effectiveness of our internal control over financial reporting based on the criteria set forth in Internal Control-Integrated Framework
53
issued by the Committee of Sponsoring Organizations of the Treadway Commission in 1992 (“COSO”). Based on this evaluation, management has concluded that our internal control over financial reporting was effective as of October 31, 2014.
This annual report does not include an attestation report of our registered public accounting firm regarding internal control over financial reporting. As we are a non-accelerated filer, management's report is not subject to attestation by our registered public accounting firm pursuant to Section 404(b) of the Sarbanes-Oxley Act of 2002 that permits us to provide only management's report in this annual report.
Changes in Internal Control over Financial Reporting
There were no changes in our internal control over financial reporting during the fourth quarter of our 2014 fiscal year, which were identified in connection with management’s evaluation required by paragraph (d) of rules 13a-15 and 15d-15 under the Exchange Act, that have materially affected, or are reasonably likely to materially affect, our internal control over financial reporting.
ITEM 9B. OTHER INFORMATION
None.
PART III
ITEM 10. DIRECTORS, EXECUTIVE OFFICERS AND CORPORATE GOVERNANCE
The information required by this Item is incorporated by reference from the definitive proxy statement for our 2015 annual meeting of members to be filed with the Securities Exchange Commission within 120 days after the end of our 2014 fiscal year. This proxy statement is referred to in this report as the 2015 Proxy Statement.
ITEM 11. EXECUTIVE COMPENSATION
The information required by this Item is incorporated by reference from the 2015 Proxy Statement.
ITEM 12. SECURITY OWNERSHIP OF CERTAIN BENEFICIAL OWNERS AND MANAGEMENT AND RELATED MEMBER MATTERS
The information required by this Item is incorporated by reference from the 2015 Proxy Statement.
ITEM 13. CERTAIN RELATIONSHIPS AND RELATED TRANSACTIONS, AND DIRECTOR INDEPENDENCE
The information required by this Item is incorporated by reference from the 2015 Proxy Statement.
ITEM 14. PRINCIPAL ACCOUNTING FEES AND SERVICES
The information required by this Item is incorporated by reference from the 2015 Proxy Statement.
PART IV
ITEM 15. EXHIBITS, FINANCIAL STATEMENT SCHEDULES
Exhibits Filed as Part of this Report and Exhibits Incorporated by Reference.
The following exhibits and financial statements are filed as part of, or are incorporated by reference into, this report:
(1) | Financial Statements |
The financial statements appear beginning at page 35 of this report.
54
(2) | Financial Statement Schedules |
All supplemental schedules are omitted as the required information is inapplicable or the information is presented in the financial statements or related notes.
(3) | Exhibits |
Exhibit No. | Exhibit | Filed Herewith | Incorporated by Reference | ||
3.1 | Articles of Organization of the registrant. | Exhibit 3.1 to the registrant's registration statement on Form SB-2 (Commission File 333-137482). | |||
3.2 | Second Amended and Restated Member Control Agreement of the registrant. | Exhibit 3.2 to the registrant's registration Form 10-Q filed with the Commission on March 22, 2011. | |||
4.1 | Form of Membership Unit Certificate. | Exhibit 4.2 to the registrant's registration statement on Form SB-2 (Commission File 333-137482). | |||
10.1 | Grain Procurement Agreement and Amendment with Meadowland Farmers Co-op. | Exhibit 10.6 to the registrant's registration statement on Form SB-2 (Commission File 33-137482). | |||
10.2 | Energy Management Agreement dated June 8, 2006 between Highwater Ethanol, LLC and U.S. Energy Services, Inc. | Exhibit 10.9 to the registrant's registration statement on Form SB-2 (Commission File 33-137482). | |||
10.3 | Redwood Electric Service Agreement dated June 28, 2007. | Exhibit 99.1 to the registrant's Form 8-K filed with the Commission on July 3, 2007. | |||
10.4 | Distillers Grains Marketing Agreement with CHS, Inc. dated October 11, 2007. | Exhibit 10.4 to the registrant's Form 10-KSB filed with the Commission on January 29, 2008. | |||
10.5 | Lease Agreement dated April 1, 2008 with the City of Lamberton, MN. | Exhibit 10.2 to the registrant's Form 10-QSB filed with the Commission on June 13, 2008. | |||
10.6 | Trust Indenture dated April 1, 2008 with the City of Lamberton, MN and U.S. Bank National Association. | Exhibit 10.3 to the registrant's Form 10-QSB filed with the Commission on June 13, 2008. | |||
10.7 | Guaranty Agreement dated April 1, 2008 with U.S. Bank National Association. | Exhibit 10.4 to the registrant's Form 10-QSB filed with the Commission on June 13, 2008. | |||
10.8 | Mortgage, Security Agreement, Assignment of Leases and Rents and Fixture Financing Statement dated April 1, 2008 with U.S. Bank National Association. | Exhibit 10.6 to the registrant's Form 10-QSB filed with the Commission on June 13, 2008. | |||
10.9 | Security Agreement dated April 1, 2008 with U.S. Bank National Association. | Exhibit 10.7 to the registrant's Form 10-QSB filed with the Commission on June 13, 2008. | |||
10.10 | Intercreditor Agreement dated April 24, 2008 with First National Bank of Omaha and U.S. Bank National Association. | Exhibit 10.8 to the registrant's Form 10-QSB filed with the Commission on June 13, 2008. | |||
10.11 | Construction Loan Agreement dated April 24, 2008 with First National Bank of Omaha. | Exhibit 10.10 to the registrant's Form 10-QSB filed with the Commission on June 13, 2008. | |||
10.12 | Construction Loan Mortgage, Security Agreement, Assignment of Leases and Rents and Fixture Financing Statement dated April 24, 2008 with First National Bank of Omaha. | Exhibit 10.11 to the registrant's Form 10-QSB filed with the Commission on June 13, 2008. | |||
10.13 | Security Agreement dated April 25, 2008 with First National Bank of Omaha. | Exhibit 10.12 to the registrant's Form 10-QSB filed with the Commission on June 13, 2008. | |||
55
10.14 | $10,000,000 Construction Note dated April 24, 2008 with First National Bank of Omaha. | Exhibit 10.13 to the registrant's Form 10-QSB filed with the Commission on June 13, 2008. | |||
10.15 | $2,000,000 Construction Note dated April 25, 2008 with First National Bank of Omaha. | Exhibit 10.14 to the registrant's Form 10-QSB filed with the Commission on June 13, 2008. | |||
10.16 | $9,000,000 Construction Note dated April 25, 2008 with First National Bank of Omaha. | Exhibit 10.15 to the registrant's Form 10-QSB filed with the Commission on June 13, 2008. | |||
10.17 | $13,646,000 Construction Note dated April 25, 2008 with First National Bank of Omaha. | Exhibit 10.16 to the registrant's Form 10-QSB filed with the Commission on June 13, 2008. | |||
10.18 | $500,000 Construction Note dated April 25, 2008 with First National Bank of Omaha. | Exhibit 10.17 to the registrant's Form 10-QSB filed with the Commission on June 13, 2008. | |||
10.19 | $1,000,000 Construction Note dated April 25, 2008 with First National Bank of Omaha. | Exhibit 10.18 to the registrant's Form 10-QSB filed with the Commission on June 13, 2008. | |||
10.20 | $14,254,000 Construction Note dated April 25, 2008 with First National Bank of Omaha. | Exhibit 10.19 to the registrant's Form 10-QSB filed with the Commission on June 13, 2008. | |||
10.21 | Promissory Note and Continuing Letter of Credit Agreement dated April 24, 2008 with First National Bank of Omaha. | Exhibit 10.20 to the registrant's Form 10-QSB filed with the Commission on June 13, 2008. | |||
10.22 | Centerpoint Natural Gas Agreement dated June 26, 2008. | Exhibit 10.26 to the registrant's Form 10-QSB filed with the Commission on September 15, 2008. | |||
10.23 | Trinity Industries Leasing Company Railroad Car Lease Agreement dated July 1, 2009. | Exhibit 10.2 to the registrant's Form 10-Q filed with the Commission on June 15, 2009. | |||
10.24 | Interest Rate Swap Agreement dated April 25, 2008. | Exhibit 10.1 to the registrant's Form 10-Q filed with the Commission on September 21, 2009. | |||
10.25 | First Amendment to Construction Loan Agreement dated August 11, 2009. | Exhibit 10.2 to the registrant's Form 10-Q filed with the Commission on September 21, 2009. | |||
10.26 | First Amendment and Restated Revolving Promissory Note dated August 11, 2009. | Exhibit 10.3 to the registrant's Form 10-Q filed with the Commission on September 21, 2009. | |||
10.27 | First Amendment and Restated Revolving Promissory Note (1 million) dated August 11, 2009. | Exhibit 10.4 to the registrant's Form 10-Q filed with the Commission on September 21, 2009. | |||
10.28 | First Amendment and Restated Revolving Promissory Note (2646 million) dated August 11, 2009. | Exhibit 10.5 to the registrant's Form 10-Q filed with the Commission on September 21, 2009. | |||
10.29 | Fixed Rate Note between First National Bank of Omaha and Highwater Ethanol, LLC dated February 26, 2010. | Exhibit 10.1 to the registrant's Form 10-Q filed with the Commission on March 17, 2010. | |||
10.30 | Fixed Rate Note between Heritage Bank and Highwater Ethanol, LLC dated February 26, 2010. | Exhibit 10.2 to the registrant's Form 10-Q filed with the Commission on March 17, 2010. | |||
10.31 | Fixed Rate Note between United FCS and Highwater Ethanol, LLC dated February 26, 2010. | Exhibit 10.3 to the registrant's Form 10-Q filed with the Commission on March 17, 2010. | |||
10.32 | Fixed Rate Note between AgStar Financial Services, PCA and Highwater Ethanol, LLC dated February 26, 2010. | Exhibit 10.4 to the registrant's Form 10-Q filed with the Commission on March 17, 2010. | |||
10.33 | Fixed Rate Note between Deere Credit and Highwater Ethanol, LLC dated February 26, 2010. | Exhibit 10.5 to the registrant's Form 10-Q filed with the Commission on March 17, 2010. | |||
56
10.34 | Fixed Rate Note between First Bank & Trust and Highwater Ethanol, LLC dated February 26, 2010. | Exhibit 10.6 to the registrant's Form 10-Q filed with the Commission on March 17, 2010. | |||
10.35 | Fixed Rate Note between Granite Falls Bank and Highwater Ethanol, LLC dated February 26, 2010. | Exhibit 10.7 to the registrant's Form 10-Q filed with the Commission on March 17, 2010. | |||
10.36 | Variable Rate Note between Highwater Ethanol, LLC and First National Bank of Omaha dated February 26, 2010. | Exhibit 10.8 to the registrant's Form 10-Q filed with the Commission on March 17, 2010. | |||
10.37 | Variable Rate Note between Heritage Bank and Highwater Ethanol, LLC dated February 26, 2010. | Exhibit 10.9 to the registrant's Form 10-Q filed with the Commission on March 17, 2010. | |||
10.38 | Variable Rate Note between United FCS and Highwater Ethanol, LLC dated February 26, 2010. | Exhibit 10.10 to the registrant's Form 10-Q filed with the Commission on March 17, 2010. | |||
10.39 | Variable Rate Note between AgStar Financial Services, PCA and Highwater Ethanol, LLC dated February 26, 2010. | Exhibit 10.11 to the registrant's Form 10-Q filed with the Commission on March 17, 2010. | |||
10.40 | Variable Rate Note between Deere Credit and Highwater Ethanol, LLC dated February 26, 2010. | Exhibit 10.12 to the registrant's Form 10-Q filed with the Commission on March 17, 2010. | |||
10.41 | Variable Rate Note between First Bank & Trust and Highwater Ethanol, LLC dated February 26, 2010. | Exhibit 10.13 to the registrant's Form 10-Q filed with the Commission on March 17, 2010. | |||
10.42 | Variable Rate Note between Granite Falls Bank and Highwater Ethanol, LLC dated February 26, 2010. | Exhibit 10.14 to the registrant's Form 10-Q filed with the Commission on March 17, 2010. | |||
10.43 | Long Term Revolving Note between Highwater Ethanol, LLC and First National Bank of Omaha dated February 26, 2010. | Exhibit 10.15 to the registrant's Form 10-Q filed with the Commission on March 17, 2010. | |||
10.44 | Long Term Revolving Rate Note between Heritage Bank and Highwater Ethanol, LLC dated February 26, 2010. | Exhibit 10.16 to the registrant's Form 10-Q filed with the Commission on March 17, 2010. | |||
10.45 | Long Term Revolving Rate Note between United FCS and Highwater Ethanol, LLC dated February 26, 2010. | Exhibit 10.17 to the registrant's Form 10-Q filed with the Commission on March 17, 2010. | |||
10.46 | Long Term Revolving Rate Note between AgStar Financial Services, PCA and Highwater Ethanol, LLC dated February 26, 2010. | Exhibit 10.18 to the registrant's Form 10-Q filed with the Commission on March 17, 2010. | |||
10.47 | Long Term Revolving Rate Note between Deere Credit and Highwater Ethanol, LLC dated February 26, 2010. | Exhibit 10.19 to the registrant's Form 10-Q filed with the Commission on March 17, 2010. | |||
10.48 | Long Term Revolving Rate Note between First Bank & Trust and Highwater Ethanol, LLC dated February 26, 2010. | Exhibit 10.20 to the registrant's Form 10-Q filed with the Commission on March 17, 2010. | |||
10.49 | Long Term Revolving Rate Note between Granite Falls Bank and Highwater Ethanol, LLC dated February 26, 2010. | Exhibit 10.21 to the registrant's Form 10-Q filed with the Commission on March 17, 2010. | |||
10.50 | RPMG Ethanol Fuel Marketing Agreement dated February 1, 2011.+ | Exhibit 10.50 to the registrant's Form 10-K filed with the Commission on February 3, 2011. | |||
10.51 | Third Amendment of Construction Loan Agreement dated January 28, 2011. | Exhibit 10.51 to the registrant's Form 10-K filed with the Commission on February 3, 2011. | |||
10.52 | First Amended and Restated Variable Rate Note between Highwater Ethanol, LLC and First National Bank of Omaha dated January 31, 2011. | Exhibit 10.52 to the registrant's Form 10-K filed with the Commission on February 3, 2011. | |||
57
10.53 | First Amended and Restated Variable Rate Note between Heritage Bank and Highwater Ethanol, LLC dated January 31, 2011. | Exhibit 10.53 to the registrant's Form 10-K filed with the Commission on February 3, 2011. | |||
10.54 | First Amended and Restated Variable Rate Note between United FCS and Highwater Ethanol, LLC dated January 31, 2011. | Exhibit 10.54 to the registrant's Form 10-K filed with the Commission on February 3, 2011. | |||
10.55 | First Amended and Restated Variable Rate Note between AgStar Financial Services, PCA and Highwater Ethanol, LLC dated January 31, 2011. | Exhibit 10.55 to the registrant's Form 10-K filed with the Commission on February 3, 2011. | |||
10.56 | First Amended and Restated Variable Rate Note between Deere Credit and Highwater Ethanol, LLC dated January 31, 2011. | Exhibit 10.56 to the registrant's Form 10-K filed with the Commission on February 3, 2011. | |||
10.57 | First Amended and Restated Variable Rate Note between First Bank & Trust and Highwater Ethanol, LLC dated January 31, 2011. | Exhibit 10.57 to the registrant's Form 10-K filed with the Commission on February 3, 2011. | |||
10.58 | First Amended and Restated Variable Rate Note between Granite Falls Bank and Highwater Ethanol, LLC dated January 31, 2011. | Exhibit 10.58 to the registrant's Form 10-K filed with the Commission on February 3, 2011. | |||
10.59 | First Amended and Restated Long Term Revolving Note between Highwater Ethanol, LLC and First National Bank of Omaha dated January 31, 2011. | Exhibit 10.59 to the registrant's Form 10-K filed with the Commission on February 3, 2011. | |||
10.60 | First Amended and Restated Long Term Revolving Rate Note between Heritage Bank and Highwater Ethanol, LLC dated January 31, 2011. | Exhibit 10.60 to the registrant's Form 10-K filed with the Commission on February 3, 2011. | |||
10.61 | First Amended and Restated Long Term Revolving Rate Note between United FCS and Highwater Ethanol, LLC dated January 31, 2011. | Exhibit 10.61 to the registrant's Form 10-K filed with the Commission on February 3, 2011. | |||
10.62 | First Amended and Restated Long Term Revolving Rate Note between AgStar Financial Services, PCA and Highwater Ethanol, LLC dated January 31, 2011. | Exhibit 10.62 to the registrant's Form 10-K filed with the Commission on February 3, 2011. | |||
10.63 | First Amended and Restated Long Term Revolving Rate Note between Deere Credit and Highwater Ethanol, LLC dated January 31, 2011. | Exhibit 10.63 to the registrant's Form 10-K filed with the Commission on February 3, 2011. | |||
10.64 | First Amended and Restated Long Term Revolving Rate Note between First Bank & Trust and Highwater Ethanol, LLC dated January 31, 2011. | Exhibit 10.64 to the registrant's Form 10-K filed with the Commission on February 3, 2011. | |||
10.65 | First Amended and Restated Long Term Revolving Rate Note between Granite Falls Bank and Highwater Ethanol, LLC dated January 31, 2011. | Exhibit 10.65 to the registrant's Form 10-K filed with the Commission on February 3, 2011. | |||
10.66 | Fourth Amendment of Construction Loan Agreement between First National Bank of Omaha and Highwater Ethanol, LLC dated February 26, 2011. | Exhibit 10.1 to the registrant's Form 10-Q filed with the Commission on March 22, 2011. | |||
10.67 | Amended and Restated Revolving Promissory Note with Deere Credit, Inc. dated February 26, 2011. | Exhibit 10.2 to the registrant's Form 10-Q filed with the Commission on March 22, 2011. | |||
58
10.68 | Third Amended and Restated Revolving Promissory Note with First National Bank of Omaha dated February 26, 2011. | Exhibit 10.3 to the registrant's Form 10-Q filed with the Commission on March 22, 2011. | |||
10.69 | Third Amended and Restated Revolving Promissory Note with First Bank & Trust dated February 26, 2011. | Exhibit 10.4 to the registrant's Form 10-Q filed with the Commission on March 22, 2011. | |||
10.70 | Fifth Amendment of Construction Loan Agreement between First National Bank of Omaha and Highwater Ethanol, LLC dated August 26, 2011. | Exhibit 10.1 to the registrant's Form 10-Q filed with the Commission on September 12, 2011. | |||
10.71 | Fourth Amended and Restated Revolving Promissory Note between First National Bank of Omaha and Highwater Ethanol, LLC dated August 26, 2011. | Exhibit 10.2 to the registrant's Form 10-Q filed with the Commission on September 12, 2011. | |||
10.72 | Fourth Amended and Restated Revolving Promissory note between First National Bank of Omaha and Highwater Ethanol, LLC dated August 26, 2011. | Exhibit 10.3 to the registrant's Form 10-Q filed with the Commission on September 12, 2011. | |||
10.73 | Fifth Amended and Restated Revolving Promissory Note between First National Bank of Omaha and Highwater Ethanol, LLC dated April 1, 2012. | Exhibit 10.1 to the registrant's Form 10-Q filed with the Commission on June 12, 2012. | |||
10.74 | Fifth Amended and Restated Revolving Promissory Note between First National Bank of Omaha and Highwater Ethanol, LLC dated April 1, 2012. | Exhibit 10.2 to the registrant's Form 10-Q filed with the Commission on June 12, 2012. | |||
10.75 | Sixth Amendment of Construction Loan Agreement between First National Bank of Omaha and Highwater Ethanol, LLC dated April 1, 2012. | Exhibit 10.3 to the registrant's Form 10-Q filed with the Commission on June 12, 2012. | |||
10.76 | Amended and Restated Ethanol Marketing Agreement between RPMG, Inc. and Highwater Ethanol, LLC dated August 27, 2012. + | Exhibit 10.1 to the registrant's Form 10-Q filed with the Commission on September 14, 2012. | |||
10.77 | Seventh Amendment of Construction Loan Agreement between First National Bank of Omaha and Highwater Ethanol, LLC dated January 25, 2013 | Exhibit 10.77 to the registrant's Form 10-K filed with the Commission on January 29, 2013. | |||
10.78 | Eighth Amendment of Construction Loan Agreement dated March 29, 2013. | Exhibit 10.1 to the registrant's Form 10-Q filed with the Commission on June 10, 2013. | |||
10.79 | 2014 Bonus Plan for CEO and CFO | Exhibit 10.85 to the registrant's Form 10-K filed with the Commission on January 16, 2014 | |||
10.80 | Employment Agreement between Highwater Ethanol, LLC and Brian Kletscher dated February 26, 2014. | Exhibit 99.2 to the registrant's Form 8-K filed with the Commission on February 28, 2014 | |||
10.81 | Employment Agreement between Highwater Ethanol, LLC and Lucas Schneider dated February 26, 2014. | Exhibit 99.1 to the registrant's Form 8-K filed with the Commission on February 28, 2014 | |||
10.82 | Amendment No. 1 to Distiller's Grain Marketing Agreement between Highwater Ethanol, LLC and CHS, Inc. dated February 13, 2014. | Exhibit 10.1 to the registrant's Form 10-Q filed with the Commission on March 17, 2014 | |||
10.83 | Credit Agreement between Highwater Ethanol, LLC and AgStar Financial Services, PCA dated February 27, 2014. | Exhibit 10.2 to the registrant's Form 10-Q filed with the Commission on March 17, 2014 | |||
59
10.84 | Revolving Line of Credit Note between Highwater Ethanol, LLC and AgStar Financial Services, PCA dated February 27, 2014. | Exhibit 10.3 to the registrant's Form 10-Q filed with the Commission on March 17, 2014 | |||
10.85 | Revolving Line of Credit Note between Highwater Ethanol, LLC and United Farm Credit Services, PCA dated February 27, 2014. | Exhibit 10.3 to the registrant's Form 10-Q filed with the Commission on March 17, 2014 | |||
10.86 | Revolving Line of Credit Note between Highwater Ethanol, LLC and Badgerland Financial, ACA dated February 27, 2014. | Exhibit 10.4 to the registrant's Form 10-Q filed with the Commission on March 17, 2014 | |||
10.87 | Term Note between Highwater Ethanol, LLC and AgStar Financial Services, PCA dated February 27, 2014. | Exhibit 10.5 to the registrant's Form 10-Q filed with the Commission on March 17, 2014 | |||
10.88 | Term Note between Highwater Ethanol, LLC and United Farm Credit Services, PCA dated February 27, 2014. | Exhibit 10.6 to the registrant's Form 10-Q filed with the Commission on March 17, 2014 | |||
10.89 | Term Note between Highwater Ethanol, LLC and Badgerland Financial, ACA dated February 27, 2014. | Exhibit 10.7 to the registrant's Form 10-Q filed with the Commission on March 17, 2014 | |||
10.90 | Term Revolving Note between Highwater Ethanol, LLC and AgStar Financial Services, PCA dated February 27, 2014. | Exhibit 10.8 to the registrant's Form 10-Q filed with the Commission on March 17, 2014 | |||
10.91 | Term Revolving Note between Highwater Ethanol, LLC and United Farm Credit Services, PCA dated February 27, 2014. | Exhibit 10.9 to the registrant's Form 10-Q filed with the Commission on March 17, 2014 | |||
10.92 | Term Revolving Note between Highwater Ethanol, LLC and Badgerland Financial, ACA dated February 27, 2014. | Exhibit 10.10 to the registrant's Form 10-Q filed with the Commission on March 17, 2014 | |||
10.93 | Security Agreement between Highwater Ethanol, LLC and AgStar Financial Services, PCA dated February 27, 2014. | Exhibit 10.11 to the registrant's Form 10-Q filed with the Commission on March 17, 2014 | |||
10.94 | Mortgage, Security Agreement, Assignment and Leases and Rents and Fixture Financing Statement between Highwater Ethanol, LLC and AgStar Financial Services, PCA dated February 27, 2014. | Exhibit 10.12 to the registrant's Form 10-Q filed with the Commission on March 17, 2014 | |||
10.95 | Irrevocable Standby Letter of Credit No. 101 between Highwater Ethanol, LLC and AgStar Financial Services, PCA dated February 27, 2014. | Exhibit 10.13 to the registrant's Form 10-Q filed with the Commission on March 17, 2014 | |||
10.96 | Easement for Construction and Process Demonstration Agreement between Butamax Advanced Biofuels LLC and Highwater Ethanol, LLC dated September 26, 2013.+ | Exhibit 10.79 to the registrant's Form 10-K/A filed with the Commission on May 22, 2014 | |||
10.97 | Equipment Lease Agreement between Butamax Advanced Biofuels LLC and Highwater Ethanol, LLC dated September 26, 2013.+ | Exhibit 10.80 to the registrant's Form 10-K/A filed with the Commission on May 22, 2014 | |||
10.98 | Technology Demonstration Risk Reduction Agreement between Butamax Advanced Biofuels LLC and Highwater Ethanol, LLC dated September 26, 2013.+ | Exhibit 10.81 to the registrant's Form 10-K/A filed with the Commission on May 22, 2014 | |||
10.99 | Security Agreement between Butamax Advanced Biofuels LLC and Highwater Ethanol, LLC dated September 26, 2013.+ | Exhibit 10.82 to the registrant's Form 10-K/A filed with the Commission on May 22, 2014 | |||
10.100 | Technology License Agreement between Butamax Advanced Biofuels LLC and Highwater Ethanol, LLC dated September 26, 2013.+ | Exhibit 10.83 to the registrant's Form 10-K/A filed with the Commission on May 22, 2014 | |||
60
10.101 | Distillers Crude Corn Oil Marketing Agreement between CHS Inc. and Highwater Ethanol, LLC dated November 4, 2013.+ | Exhibit 10.84 to the registrant's Form 10-K/A filed with the Commission on May 22, 2014 | |||
10.102 | Amended and Restated Credit Agreement dated September 22, 2014 | X | |||
10.103 | Amended and Restated Revolving Line of Credit AgStar dated September 22, 2014 | X | |||
10.104 | Amended and Restated Revolving Line of Credit Badgerland dated September 22, 2014 | X | |||
10.105 | Amended and Restated Revolving Line of Credit United FCS dated September 22, 2014 | X | |||
10.106 | Amended and Restated Term Note Badgerland dated September 22, 2014 | X | |||
10.107 | Amended and Restated Term Note United FCS dated September 22, 2014 | X | |||
10.108 | Amended and Restated Term Note AgStar dated September 22, 2014 | X | |||
10.109 | Amended and Restated Term Revolving Note AgStar dated September 22, 2014 | X | |||
10.110 | Amended and Restated Term Revolving Note Badgerland dated September 22, 2014 | X | |||
10.111 | Amended and Restated Term Revolving Note United FCS dated September 22, 2014 | X | |||
10.112 | Amended and Restated Mortgage dated September 22, 2014 | X | |||
14.1 | Code of Ethics of Highwater Ethanol, LLC adopted on June 26, 2008. | Exhibit 14.1 to the registrant's Form 10-K filed with the Commission on January 29, 2013. | |||
31.1 | Certificate Pursuant to 17 CFR 240.13a-14(a) | X | |||
31.2 | Certificate Pursuant to 17 CFR 240.13a-14(a) | X | |||
32.1 | Certificate Pursuant to 18 U.S.C. Section 1350 | X | |||
32.2 | Certificate Pursuant to 18 U.S.C. Section 1350 | X | |||
101 | The following financial information from Highwater Ethanol, LLC's Annual Report on Form 10-K for the fiscal year ended October 31, 2014, formatted in XBRL (eXtensible Business Reporting Language): (i) Balance Sheets as of October 31, 2014 and October 31, 2013, (ii) Statements of Operations for the fiscal years ended October 31, 2014, 2013 and 2012, (iii) Statement of Changes in Members' Equity and Comprehensive Income (Loss); (iv) Statements of Cash Flows for the fiscal years ended October 31, 2014, 2013 and 2012, and (v) the Notes to Financial Statements.** | ||||
(+) Confidential Treatment Requested.
(X) Filed herewith
** Furnished herewith.
61
SIGNATURES
Pursuant to the requirements of Section 13 or 15(d) of the Securities Exchange Act of 1934, the registrant has duly caused this report to be signed on its behalf by the undersigned, thereunto duly authorized.
HIGHWATER ETHANOL, LLC | |||
Date: | January 28, 2015 | /s/ Brian Kletscher | |
Brian Kletscher | |||
Chief Executive Officer | |||
(Principal Executive Officer) | |||
Date: | January 28, 2015 | /s/ Lucas Schneider | |
Lucas Schneider | |||
Chief Financial Officer | |||
(Principal Financial and Accounting Officer) | |||
62
Pursuant to the requirements of the Securities Exchange Act of 1934, this report has been signed below by the following persons on behalf of the registrant and in the capacities and on the dates indicated.
Date: | January 28, 2015 | /s/ David Moldan | |
David Moldan, Chairman and Governor | |||
Date: | January 28, 2015 | /s/ Timothy VanDerWal | |
Timothy VanDerWal, Vice Chairman and Governor | |||
Date: | January 28, 2015 | /s/ Warren Pankonin | |
Warren Pankonin, Secretary and Governor | |||
Date: | January 28, 2015 | /s/ Luke Spalj | |
Luke Spalj, Treasurer and Governor | |||
Date: | January 28, 2015 | /s/ Russell Derickson | |
Russell Derickson, Governor | |||
Date: | January 28, 2015 | /s/ William Garth | |
William Garth, Governor | |||
Date: | January 28, 2015 | /s/ George Goblish | |
George Goblish, Governor | |||
Date: | January 28, 2015 | /s/ Ronald Jorgenson | |
Ronald Jorgenson, Governor | |||
Date: | January 28, 2015 | /s/ Michael Landuyt | |
Michael Landuyt, Governor | |||
63