Attached files
| file | filename |
|---|---|
| 8-K - FORM 8-K - UMB FINANCIAL CORP | d858597d8k.htm |
| EX-99.1 - EX-99.1 - UMB FINANCIAL CORP | d858597dex991.htm |
 Quality endures.
Fourth Quarter & Year-End 2014
January 27, 2015
UMB Financial
Exhibit 99.2 |
 Cautionary Notice about Forward-Looking Statements
2
This presentation contains, and our other communications may contain,
forward-looking statements within the meaning of the Private Securities
Litigation Reform Act of 1995. These statements can be identified by the fact that they do not relate strictly
to historical or current facts. Forward-looking statements often use words such
as “believe,” “expect,”
“anticipate,”
“intend,”
“estimate,”
“project,”
“outlook,”
“forecast,”
“target,”
“trend,”
“plan,”
“goal,”
or other words of comparable meaning or future-
tense or conditional verbs such as “may,”
“will,”
“should,”
“would,”
or “could.”
Forward-looking statements convey our
expectations, intentions, or forecasts about future events, circumstances, results,
or aspirations. All forward-looking statements are subject to
assumptions, risks, and uncertainties, which may change over time and many of
which are beyond our control. You should not rely on any forward-looking
statement as a prediction or guarantee about the future. Our actual future
objectives, strategies, plans, prospects, performance, condition, or results may differ materially from
those set forth in any forward-looking statement. Some of the factors that may
cause actual results or other future events, circumstances, or aspirations
to differ from those in forward-looking statements are described in our Annual Report on Form
10-K for the year ended December 31, 2013, our subsequent Quarterly
Reports on Form 10-Q or Current Reports on Form 8-
K, or other applicable documents that are filed or furnished with the Securities
and Exchange Commission (SEC). Any forward-looking statement made by us
or on our behalf speaks only as of the date that it was made. We do not undertake
to update any forward-looking statement to reflect the impact of events,
circumstances, or results that arise after the date that the statement was
made. You, however, should consult further disclosures (including disclosures of a forward-looking nature)
that we may make in any subsequent Annual Report on Form 10-K, Quarterly Report
on Form 10-Q, Current Report on Form 8-K, or other applicable
document that is filed or furnished with the SEC. |
 Performance Highlights |
 Earnings Summary –
4Q 2014
$ in thousands, except per-share data; unaudited
4
4Q'14
4Q'13
3Q'14
vs. 4Q'13
vs. 3Q'14
Net Interest Income
90,914
$
85,914
$
87,526
$
5.8
3.9
Noninterest Income
115,248
135,607
126,475
(15.0)
(8.9)
Total Revenue
206,162
221,521
214,001
(6.9)
(3.7)
Noninterest Expense
166,713
170,426
161,461
(2.2)
3.3
Income Before Provision & Taxes
39,449
51,095
52,540
(22.8)
(24.9)
Provision for loan losses
3,000
4,000
4,500
(25.0)
(33.3)
Income before Taxes
36,449
47,095
48,040
(22.6)
(24.1)
Income Tax Provision
9,509
12,432
12,410
(23.5)
(23.4)
Net Income
26,940
$
34,663
$
35,630
$
(22.3)
(24.4)
Diluted EPS
0.59
$
0.77
$
0.78
$
(23.4)
(24.4)
Dividends per share
0.235
0.225
0.225
4.4
4.4
WASO
44,920,106
44,511,742
44,890,309
0.9
0.1
% variance |
 Earnings Summary –
Full-Year 2014
$ in thousands, except per-share data; unaudited
5
2014
2013
2012
'14 to '13
'13 to '12
Net Interest Income
350,055
$
333,269
$
320,056
$
5.0
4.1
Noninterest Income
498,688
491,833
458,122
1.4
7.4
Total Revenue
848,743
825,102
778,178
2.9
6.0
Noninterest Expense
666,926
624,178
590,454
6.8
5.7
Income Before Provision & Taxes
181,817
200,924
187,724
(9.5)
7.0
Provision for loan losses
17,000
17,500
17,500
(2.9)
-
Income before Taxes
164,817
183,424
170,224
(10.1)
7.8
Income Tax Provision
44,162
49,459
47,507
(10.7)
4.1
Net Income
120,655
$
133,965
$
122,717
$
(9.9)
9.2
Diluted EPS
2.65
$
3.20
$
3.04
$
(17.2)
5.3
Dividends per share
0.910
0.870
0.830
4.6
4.8
WASO
44,844,578
41,275,839
40,034,428
8.6
3.1
Variance |
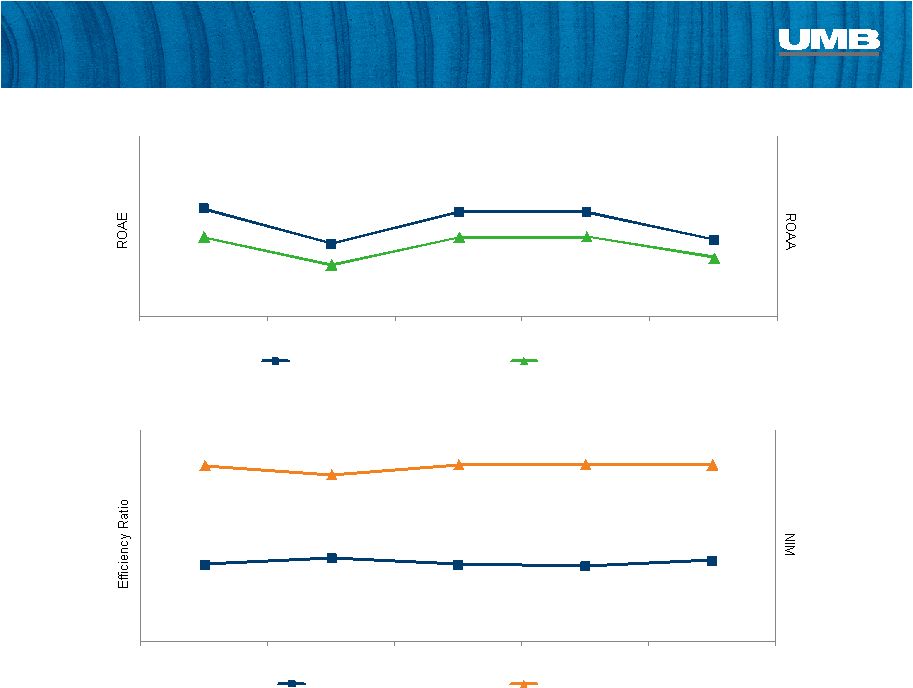 9.08%
6.13%
8.77%
8.77%
6.47%
0.89%
0.58%
0.89%
0.90%
0.66%
4Q'13
1Q'14
2Q'14
3Q'14
4Q'14
Return on Avg Equity
Return on Avg Assets
73.64%
79.67%
73.32%
72.25%
77.46%
2.51%
2.39%
2.53%
2.53%
2.52%
4Q'13
1Q'14
2Q'14
3Q'14
4Q'14
Efficiency Ratio
Net Interest Margin
Performance Metrics
ROAE/ROAA
Efficiency Ratio/NIM
6 |
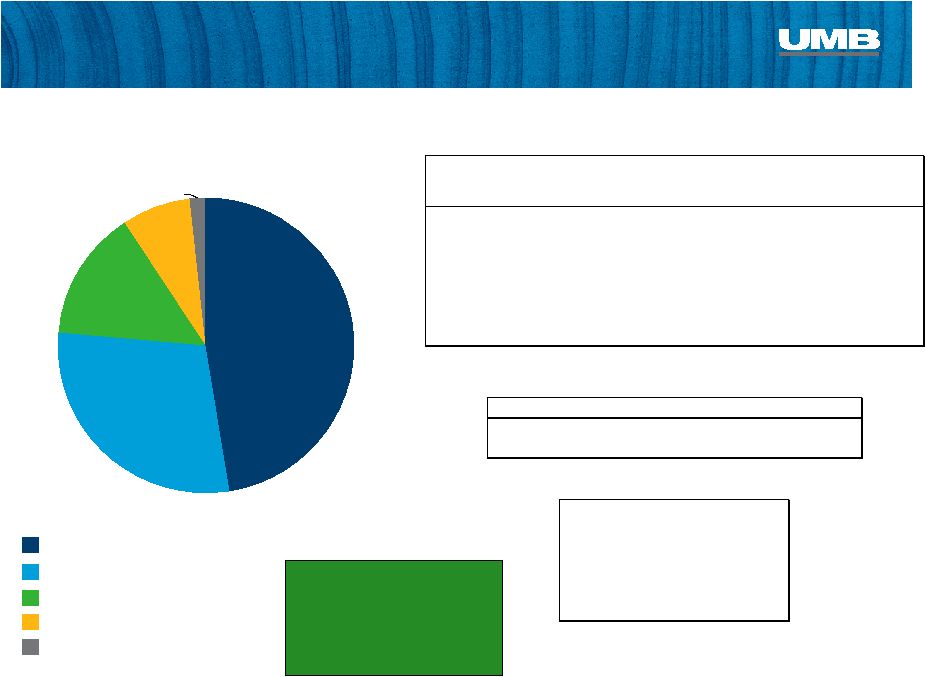    4
th
Quarter 2014
Average Balance, AFS:
$6.8 billion
Average Yield:
1.84%
Investment Mix
Securities Available for Sale,
At December 31, 2014
Agencies
High Quality Investment Portfolio
7
Corporates
Municipals
Mortgage-Backed Securities
Treasuries
AFS Portfolio Statistics
47.4%
29.0%
14.3%
7.5%
1.8%
Roll off
Purchased
($ millions)
Yield
($ millions)
Yield
1Q'14
$528
1.53%
$618
1.26%
2Q'14
$275
2.23%
$560
1.35%
3Q'14
$244
1.98%
$311
1.45%
4Q'14
$285
2.12%
$382
1.55%
Scheduled Cash Flow
1Q'15
$335
2.06%
Next 12 months
$1,238
1.79%
Securities Gains
$ in thousands
4Q'13
(10)
$
1Q'14
1,470
$
2Q'14
2,569
$
3Q'14
26
$
4Q'14
62
$
Duration/Life
(in months)
at 12/31/14
at 09/30/14
Avg. Life Total
43.62
45.15
Duration Total
37.71
40.20 |
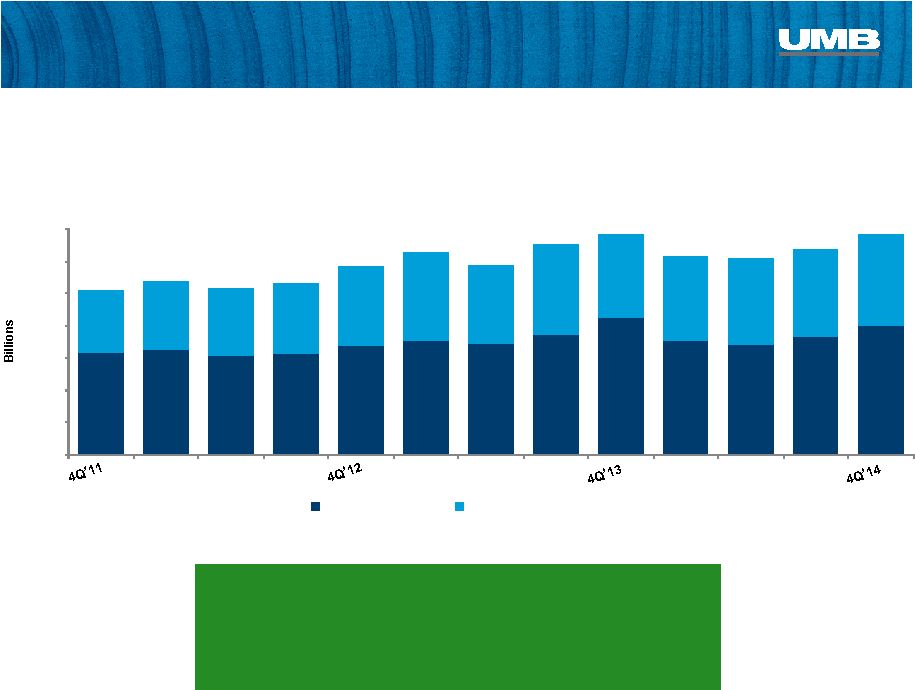 38.8%
42.2%
38.0%
41.4%
$0.0
$2.0
$4.0
$6.0
$8.0
$10.0
$12.0
$14.0
Interest Bearing
Non-Interest Bearing
Deposit Growth
Deposits & % of Free Funds
At period end; $ billions
4Q’14
Cost of Funds 0.15%
Including DDA 0.09%
8
$10.2
$13.6
$11.7
$13.6 |
 Select Balance Sheet Items
9
$ in thousands, average balances; unaudited
vs. Dec '13
vs. Sep '14
Avg. Balance
Avg. Balance
Avg. Balance
Assets
Loans, net of unearned interest
7,320,930
$
3.49
6,483,711
$
3.62
6,996,363
$
3.50
12.9
4.6
Total securities
7,155,056
1.91
6,969,863
1.97
6,992,618
1.92
2.7
2.3
Total earning assets
15,150,747
2.61
14,453,720
2.60
14,575,849
2.62
4.8
3.9
Allowance for loan losses
(77,527)
(75,135)
(77,347)
3.2
0.2
Total assets
16,231,622
$
15,533,761
$
15,638,322
$
4.5
3.8
Liabilities and Shareholders' Equity
Interest-bearing deposits
7,446,164
$
0.16
7,795,495
$
0.15
7,444,093
$
0.16
(4.5)
0.0
Total interest-bearing liabilities
8,988,438
0.15
8,973,635
0.14
8,797,486
0.15
0.2
2.2
Noninterest-bearing demand deposits
5,403,856
4,903,429
5,060,662
10.2
6.8
Shareholders' Equity
1,651,969
1,514,145
1,612,470
9.1
2.4
Total liabilities and shareholders' equity
16,231,622
$
15,533,761
$
15,638,322
$
4.5
3.8
Net interest spread
2.46
2.47
2.47
Net interest margin
2.52
2.51
2.53
% variance
December 31, 2014
December 31, 2013
September 30, 2014
Avg Yield
/ Rate %
Avg Yield
/ Rate %
Avg Yield
/ Rate %
Three Months Ended |
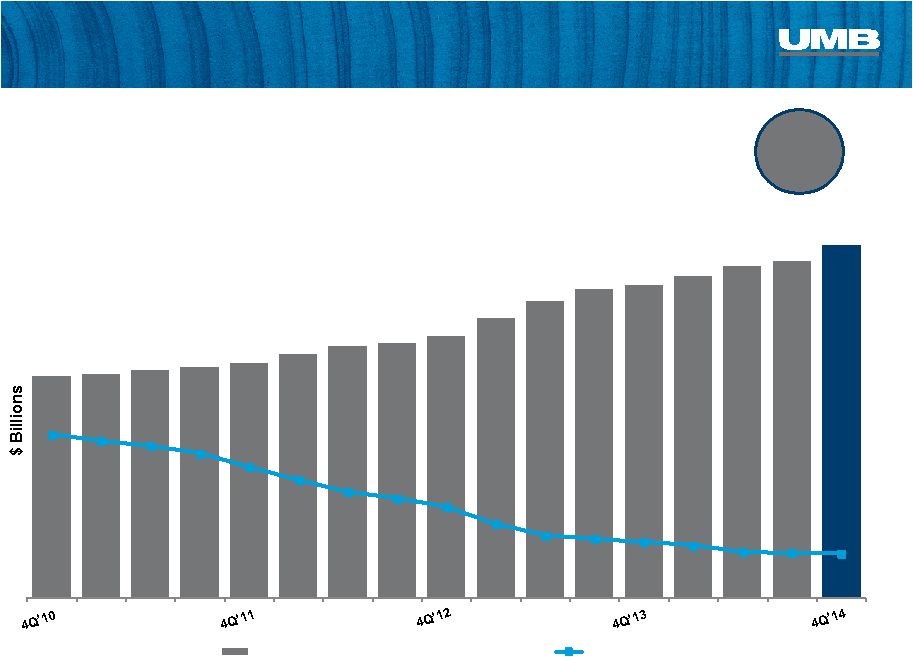 Consistent Loan Growth
5 Year
CAGR
11.1%
10
Average Loans & Loan Yields
$4.6
$4.9
$5.4
$6.5
$7.3
4.81%
4.45%
4.01%
3.62%
3.49%
Average Loans, Net of Unearned Interest
Average Loan Yield |
 $4,187
$3,737
$3,713
$3,985
$4,176
0.26%
0.23%
0.22%
0.23%
0.23%
4Q'13
1Q'14
2Q'14
3Q'14
4Q'14
Net Charge-offs
NCOs/Avg Loans
Quality Credit Metrics
Net Charge-Offs
$000’s
11
$30,706
$30,153
$27,175
$32,662
$27,382
0.47%
0.45%
0.39%
0.46%
0.37%
4Q'13
1Q'14
2Q'14
3Q'14
4Q'14
Nonperforming Loans
NPLs/Loans
Nonperforming Loans
$000’s |
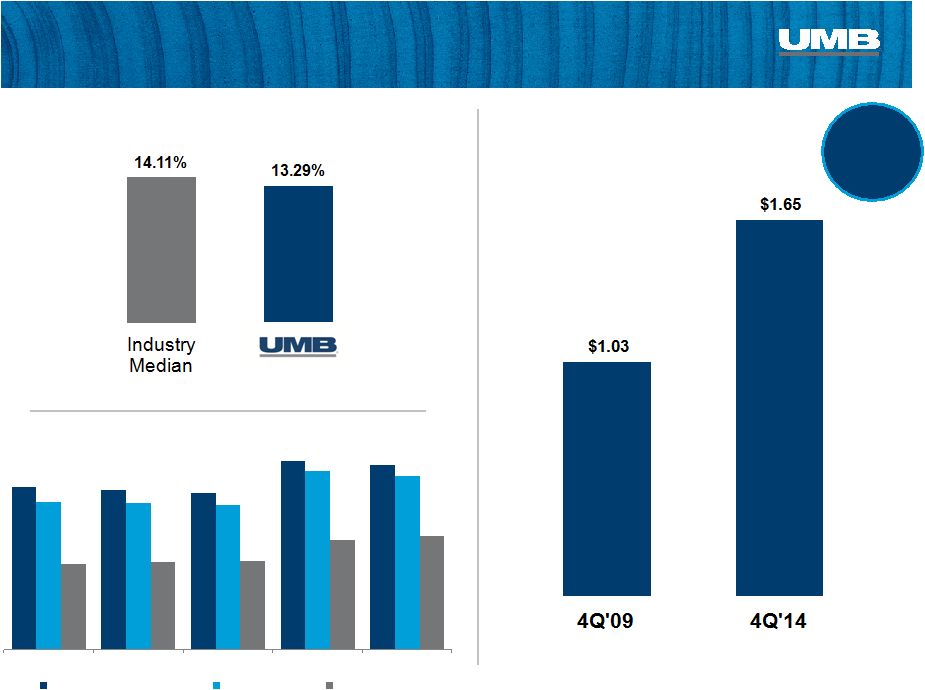 12.45
12.20
11.92
14.43
14.04
11.30
11.20
11.05
13.61
13.29
6.56
6.71
6.81
8.41
8.72
2010
2011
2012
2013
2014
Total Risk-Based Capital
Tier 1 Capital
Tier 1 Leverage
Tier 1 Capital Ratio vs. Industry
4Q 2014
12
Average Equity
($ billions)
5 yr
CAGR
10.0%
Capital Ratio Trends
Industry Median as of 3Q14; Source: SNL Financial
Balance Sheet –
Strong Capital Position |
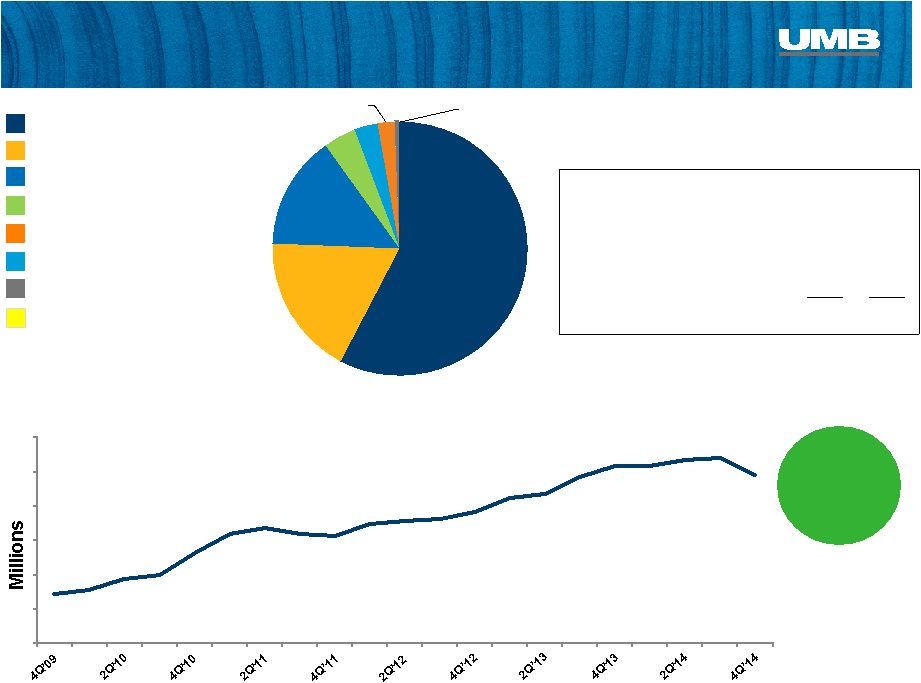 59.9%
18.6%
15.0%
4.2%
3.1%
2.3%
0.7%
0.1%
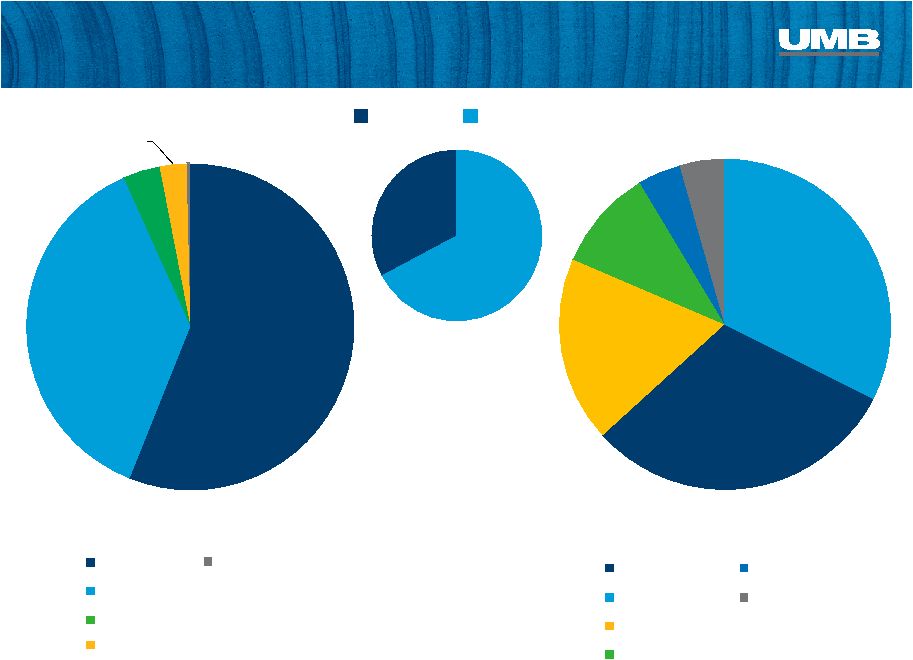
Bankcard Fees
Noninterest Income Highlights –
4Q 2014
5 Year
CAGR
15.0%
Trust & Securities Processing Composition:
Trading & Investment Banking
Other
Deposit Service Charges
Trust & Securities Processing
Brokerage Fees
Gains on Sale of Securities
($ millions)
Insurance Fees
13
Source of income:
4Q'14
4Q'13
Institutional Investment Mgmt.
$29.1
$34.3
Asset Servicing
$22.2
$20.5
Bank (inst. & personal asset mgmt.)
$17.8
$16.9
$69.1
$71.7
Excludes ($4,487) from Equity Earnings on Alternative Investments, which represents
(3.9%) of noninterest income $34.4
$46.3
$51.1
$58.3
$71.7
$69.1
Trust & Securities Processing Revenue |
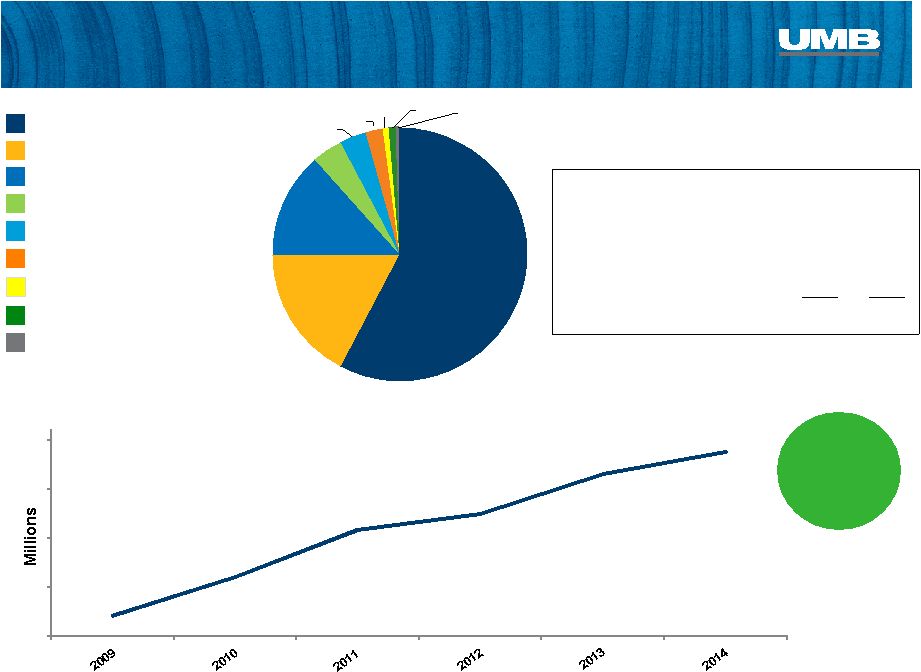 57.8%
17.1%
13.5%
3.9%
3.4%
2.2%
0.8%
0.8%
0.6%
Bankcard Fees
Noninterest Income Highlights –
Full-Year 2014
Trust & Securities Processing Composition:
Equity Earnings/Alternatives
Trading & Investment Banking
Other
Deposit Service Charges
Trust & Securities Processing
Brokerage Fees
Gains on Sale of Securities
($ millions)
Insurance Fees
14
Source of income:
2014
2013
Institutional Investment Mgmt.
$130.5
$124.5
Asset Servicing
$88.1
$79.7
Bank (inst. & personal asset mgmt.)
$69.5
$61.7
$288.1
$265.9
$120.5
$160.4
$208.4
$225.1
$265.9
$288.1
5 Year
CAGR
19.0%
Trust & Securities Processing Revenue |
 0%
20%
40%
60%
80%
100%
$100
$200
$300
$400
$500
$600
$700
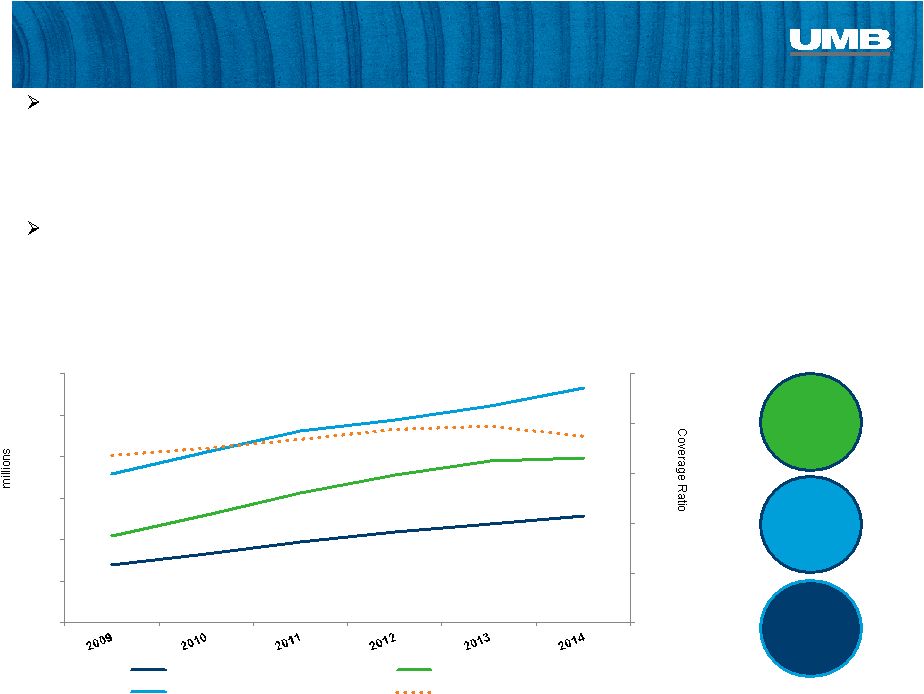
Salary/Benefit Expense
Noninterest Income
Total Noninterest Expense
Coverage Ratio*
Non-Int
Expense
5yr
CAGR
7.7%
Noninterest Expense
4th
Quarter
noninterest
expense
decreased
2.2%,
or
$3.7
million,
to
$166.7
million
vs.
4Q’13
Salary
5yr
CAGR
8.3%
Non-Int
Income
5yr
CAGR
10.0%
Managed FTE Costs; Growing Noninterest Income
15
* Noninterest Income/Noninterest Expense
Demonstrating Annual
Operating Leverage
Full-year 2014 noninterest expense increased 6.8%, or $42.7 million, to $666.9
million vs. 2013 Primary drivers:
•
Contingency reserve expense related to Prairie Capital Management was $20.3
million in 2014 versus $0 in 2013 •
Salary and benefit expense increased $18.9 million, or 5.6%
•
Equipment expense increased by $4.4 million, or 8.9%
Primary drivers:
•
Other
expense
decreased
by
$9.7
million,
or
64.8%,
primarily
due
to
a
$7.7
million
decrease
in
fair
value
adjustments
on contingent consideration liabilities.
•
Processing fees decreased $1.4 million, or 9.6%, driven by reduced distribution
fees paid by Scout |
 Business Segment Updates |
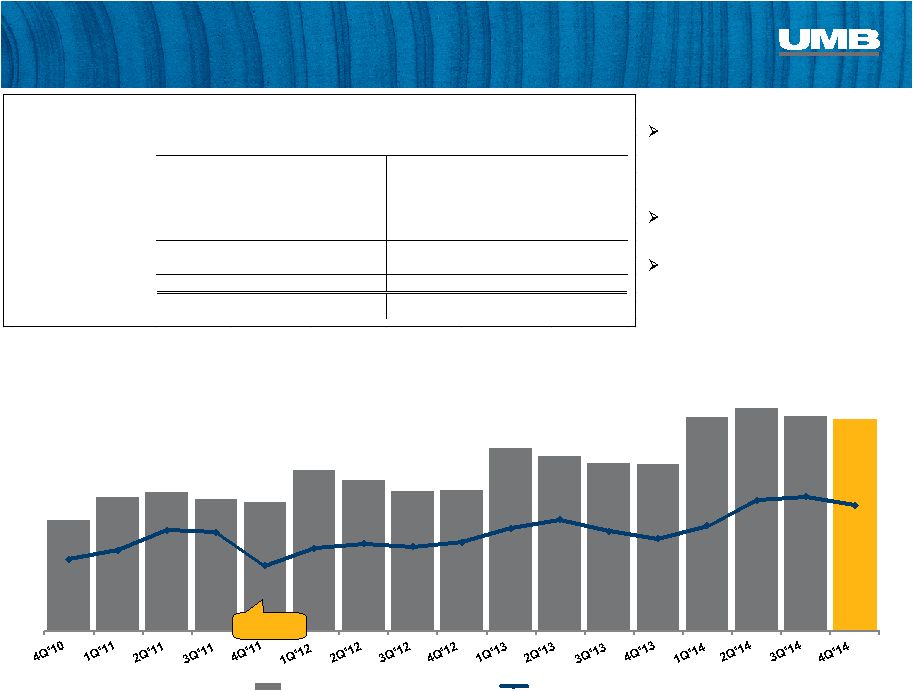
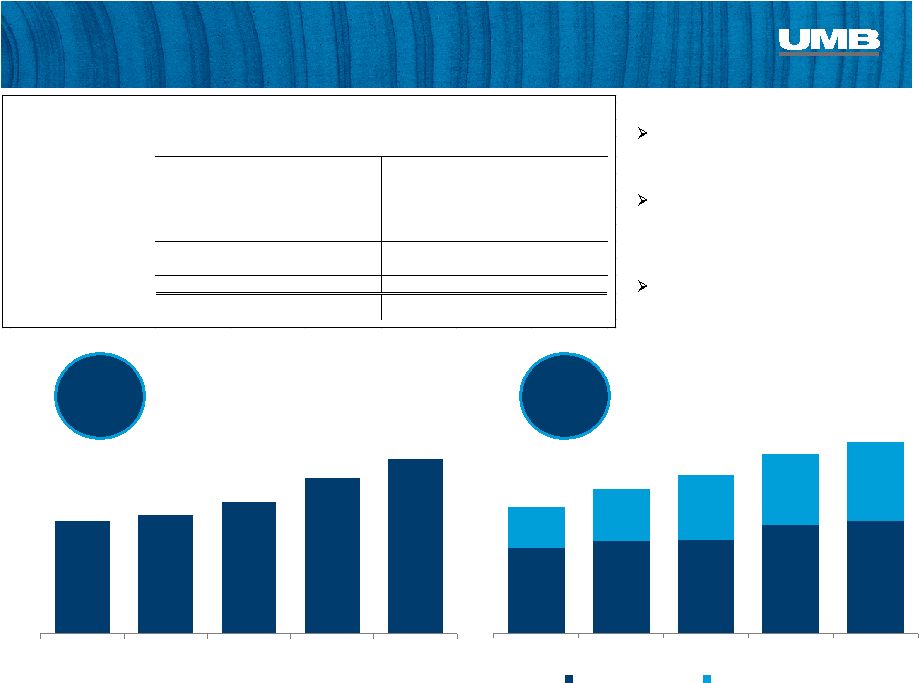 $8.5
$9.6
$10.5
$11.9
$12.7
33.1%
35.6%
40.5%
39.5%
40.9%
2010
2011
2012
2013
2014
Interest Bearing
Non-Interest Bearing
$4.5
$4.8
$5.3
$6.2
$7.0
2010
2011
2012
2013
2014
Bank
17
Average Net Loans
$ in billions
5 yr
CAGR
9.7%
5 yr
CAGR
10.8%
Average Deposits
$ in billions
Net loans grew for the 19
consecutive quarter, increasing by
14.6% year-over-year to $7.4 billion
AUM for individual and institutional
bank clients stood at $11.6 billion at
year-end and its 5-year compound
annual growth rate is 20.8%
Private Banking average loans
increased 31.5% to $428.2 million vs.
4Q’13
4 Quarter 2014 Highlights
% Change
% Change
Y/Y
Y/Y
2014
2013
2014
2013
Net interest income
292,357
$
285,112
$
2.5%
75,862
$
73,874
$
2.7%
Provision for loan losses
9,175
5,535
65.8%
1,617
1,765
-8.4%
Noninterest income
194,223
210,535
-7.7%
42,380
62,406
-32.1%
Noninterest expense
405,065
376,307
7.6%
97,070
99,080
-2.0%
NI before taxes
72,340
113,805
-36.4%
19,555
35,435
-44.8%
Income tax expense
19,487
28,548
-31.7%
5,158
8,918
-42.2%
Net income
52,853
$
85,257
$
-38.0%
14,397
$
26,517
$
-45.7%
pre-tax profit margin
14.9%
23.0%
16.5%
26.0%
12 mos Ended
December 31,
3 mos Ended
December 31,
Bank
Segment
Results
$
in
000s,
unaudited
th
th |
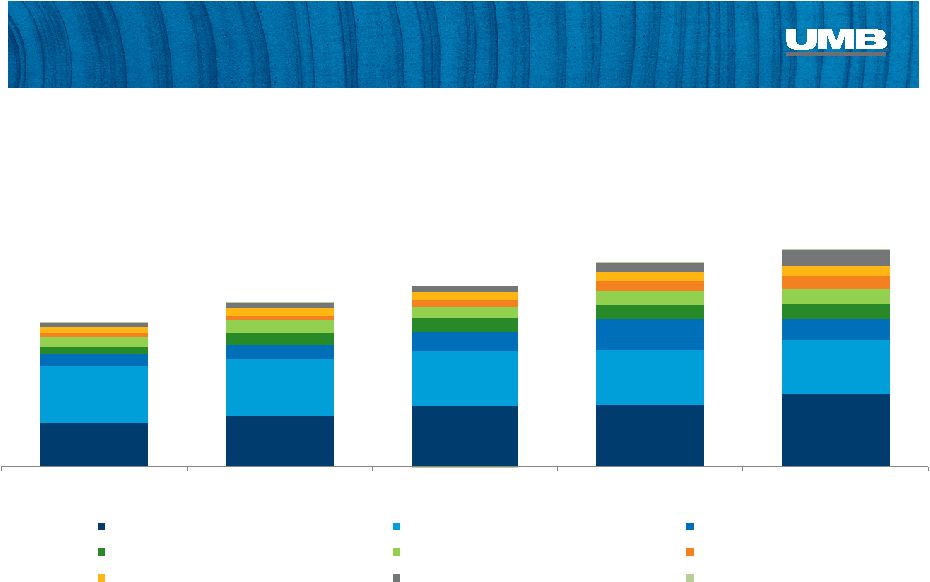
 Bank -
Lending
18
Diverse Loan Book
(Actual Loan Balances at December 31)
*includes C&I, real estate construction and leases
45.2%
55.0%
28.3%
25.0%
10.4%
$5.0B
$6.5B
8.6%
8.9%
$5.7B
$7.5B
5.7%
4.2%
4.3%
3.0%
$4.6B
1.4%
2010
2011
2012
2013
2014
Commercial & Industrial*
Commercial Real Estate
Home Equity
Credit Card
Consumer Real Estate
Consumer -
Other |
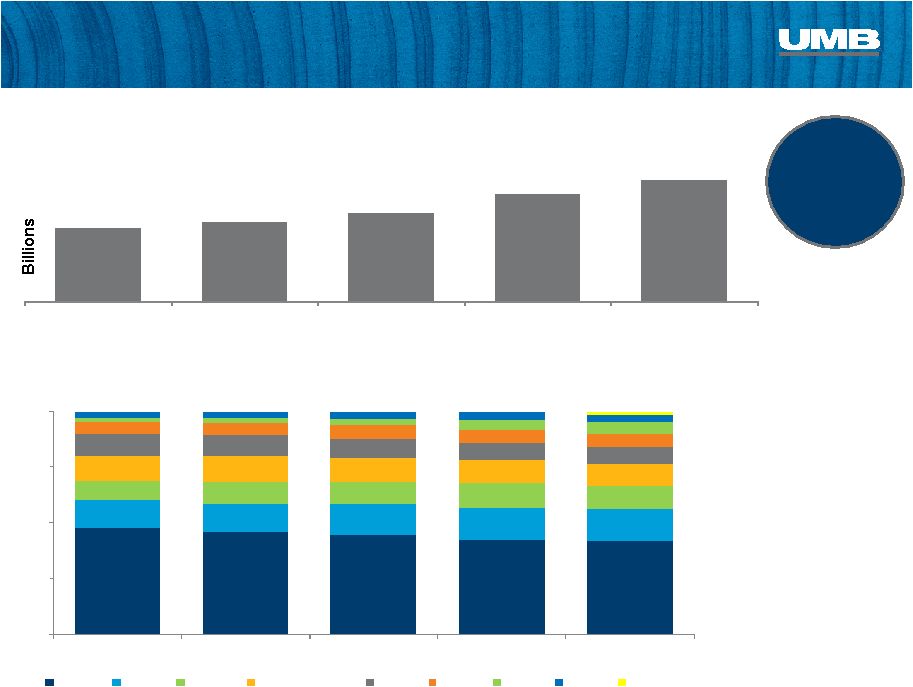
 Bank -
Deposits
Diverse Sources of Deposits
(Average Deposits for 12 Months Ended December 31)
19
29.9%
33.3%
40.3%
24.9%
8.1%
9.8%
4.6%
6.8%
7.0%
6.8%
2.4%
6.2%
4.2%
2.8%
7.5%
4.5%
$8.5B
$9.6B
$10.5B
$11.9B
$12.7B
0.7%
0.2%
2010
2011
2012
2013
2014
Commercial/Treasury Mgmt
Consumer Banking
Asset Servicing
Private Wealth Mgmt
Institutional Asset Mgmt
Healthcare Svcs
Small Business Banking
Inst. Banking & Investor Services
Other |
 $3.49
$3.75
$4.19
$5.09
$5.74
2010
2011
2012
2013
2014
Commercial Loans By Region
Average C&I and CRE Loan Balances for Twelve Months Ended December 31
47.8%
45.9%
44.1%
42.6%
42.1%
0%
50%
100%
2010
2011
2012
2013
2014
KC
CO
STL
Greater MO
KS
OK
AZ
NE
TX
Bank –
Commercial Banking
High Growth Regions
2014 vs. 2013
•
Texas
+493.9%
•
Arizona
+41.1%
•
Kansas
+13.7%
Loan Balances
$ in billions, Average C&I and CRE Loan Balances for Twelve Months Ended
December 31 5 yr
CAGR
11.1%
20 |
 Bank –
Private Wealth Mgmt. & Consumer Banking
21
$436
$533
$574
$566
$644
$479
$559
$608
$663
$755
47.7%
48.8%
48.5%
46.1%
46.0%
2010
2011
2012
2013
2014
Balances
Unused Commitments
Utilization
$7.4B
$7.6B
$8.8B
$10.2B
$11.6B
$0.91B
$1.09B
$1.18B
$1.23B
$1.40B
Home Equity Lines of Credit
$ in millions
Assets Under Management
$ in millions
$5,490
$5,366
$6,390
$7,044
$7,610
$1,744
$2,035
$2,219
$2,853
$3,603
$152
$188
$226
$351
$419
2010
2011
2012
2013
2014
Private Wealth & Institutional Asset Mgmt
Prairie Capital Management
Brokerage Assets |
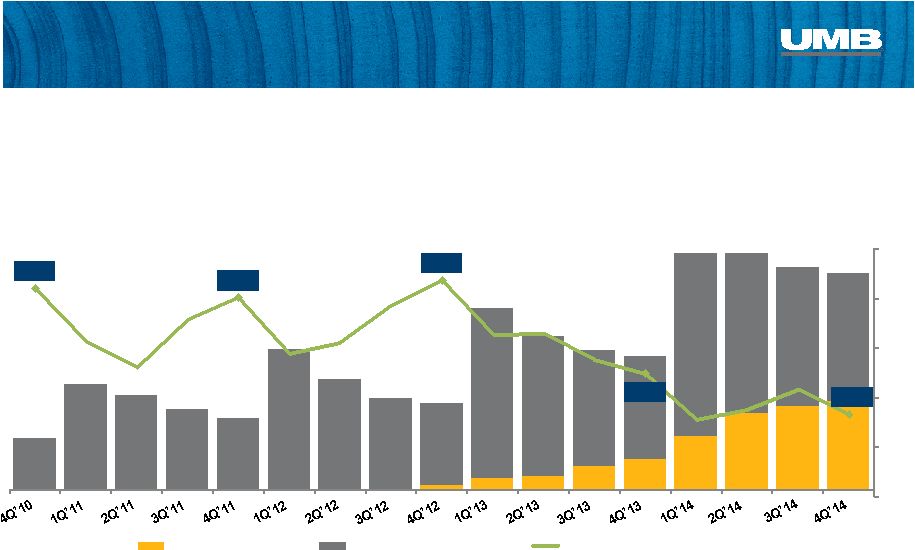
 $31.2
$32.2
$32.4
$30.6
$31.2
4Q'13
1Q'14
2Q'14
3Q'14
4Q'14
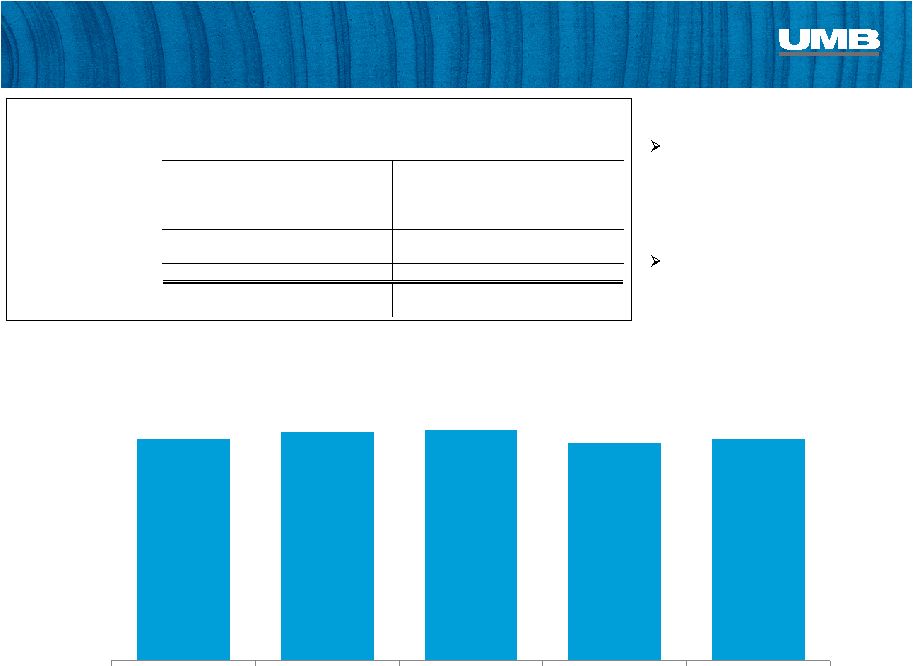
Institutional Investment Management
22
Total Scout Assets Under Management
$ in billions
Reams was selected by Russell
Investments to replace PIMCO in
a $2.7B sub-advised mandate
covering our Low Duration and
Core Plus products
Assets under management have
grown at a 4-year CAGR of
11.9% since the acquisition of
Reams at the end of 2010.
4 Quarter 2014 Highlights
Institutional Investment Management Segment Results
$ in 000s, unaudited
% Change
% Change
Y/Y
Y/Y
2014
2013
2014
2013
Net Interest income
(3)
$
(32)
$
90.6%
-
$
(10)
$
100.0%
Noninterest income
131,226
126,442
3.8%
29,212
34,892
-16.3%
Noninterest expense
92,008
88,336
4.2%
23,156
29,582
-21.7%
NI before taxes
39,215
38,074
3.0%
6,056
5,300
14.3%
Income tax expense
10,331
10,002
3.3%
1,445
1,127
28.2%
Net income
28,884
$
28,072
$
2.9%
4,611
$
4,173
$
10.5%
pre-tax profit margin
29.9%
30.1%
20.7%
15.2%
December 31,
12 mos Ended
3 mos Ended
December 31,
th |
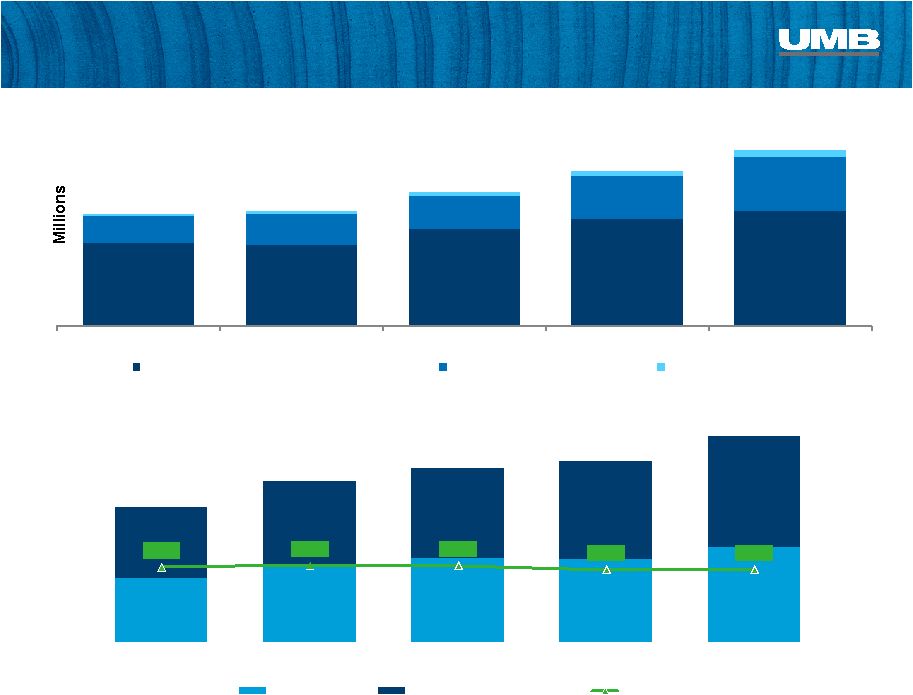
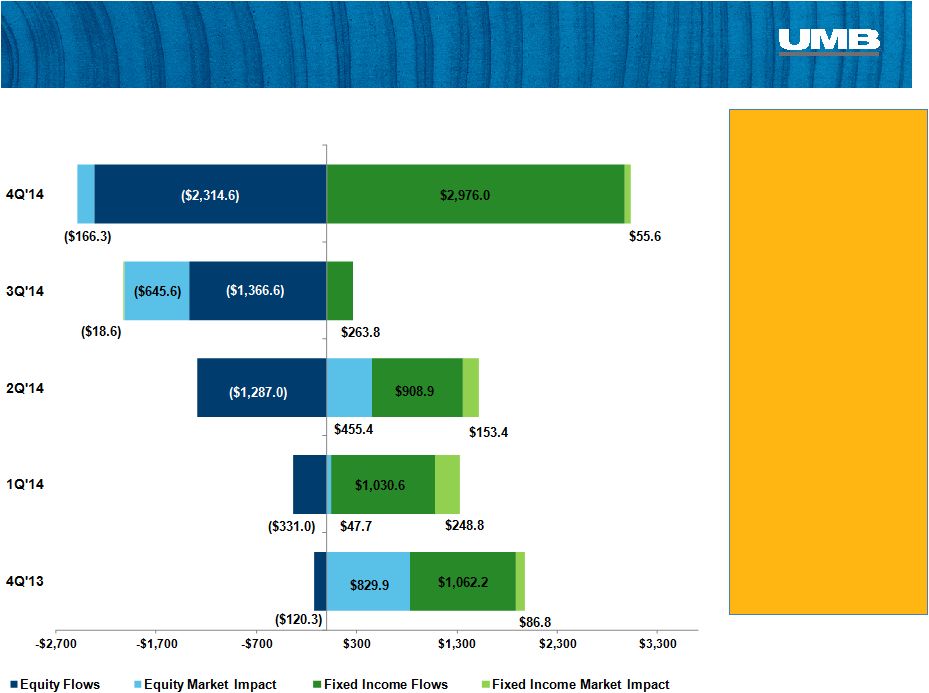  AUM
Drivers $ in millions
$230.7
$996.1
Total Change
($millions)
$32,394.3
$32,163.5
Total AUM
($millions)
Institutional Investment Management
23
$1,858.5
$31,167.4
($1,767.0)
$30,627.3
$550.7
$31,178.1 |
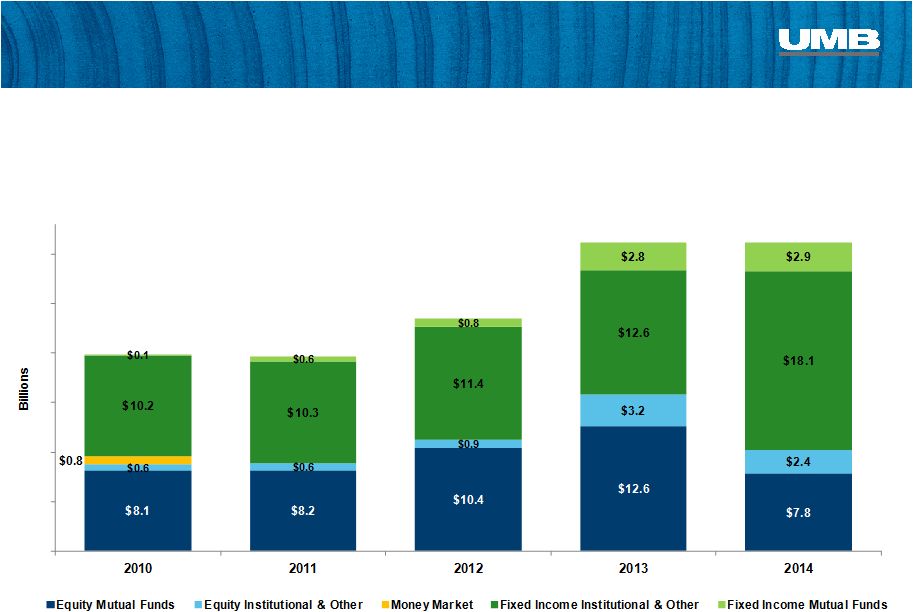 Total AUM
$31.2B
$19.9B
$19.7B
Institutional Investment Management
24
$23.5B
$31.2B |
 32.4%
30.8%
18.2%
10.0%
4.2%
4.4%
AUM by Strategy –
As of December 31, 2014
Equity Strategies
International
Mid Cap
International ADR
Emerging Markets
Global
Small Cap
Other:
25
Fixed Income Strategies
Core Plus
Low Duration
Long Duration
Core
Intermediate
Unconstrained
Unconstrained UCITS
Real Return
Equity
Fixed Income
67%
33%
56.1%
37.2%
3.7%
2.6%
0.4%
Other:
Large Cap
Equity Opportunity
Global Aggregate |
 $1.08
$1.31
$1.36
$1.29
$1.26
$1.58
$1.48
$1.37
$1.38
$1.79
$1.72
$1.64
$1.63
$2.10
$2.18
$2.11
$2.08
$14.6
$14.2
$15.7
$15.9
$18.0
Purchase Volume ($ billions)
Interchange ($ millions)
Payment Solutions
Total Card Purchase Volume
& Interchange Revenue
26
Durbin
effective
Credit and debit card purchase
volume increased 27.3% vs. 4Q’13
to $2.1 billion and for the full year
reached nearly $8.5 billion
HSA deposits and assets grew by
42.8% vs. 4Q’13 to $917.5 million
The number of Health Savings
Accounts increased by 34.4% year-
over-year and now stands at more
than 588,000
4 Quarter 2014 Highlights
th
% Change
% Change
Y/Y
Y/Y
2014
2013
2014
2013
Net interest income
52,251
$
45,832
$
14.0%
14,003
$
11,505
$
21.7%
Provision for loan losses
7,825
11,965
-34.6%
1,383
2,235
-38.1%
Noninterest income
84,477
74,223
13.8%
21,479
17,737
21.1%
Noninterest expense
94,177
86,746
8.6%
26,507
23,121
14.6%
NI before taxes
34,726
21,344
62.7%
7,592
3,886
95.4%
Income tax expense
9,311
6,739
38.2%
2,029
1,271
59.6%
Net income
25,415
$
14,605
$
74.0%
5,563
$
2,615
$
112.7%
pre-tax profit margin
25.4%
17.8%
21.4%
13.3%
3 mos Ended
December 31,
December 31,
12 mos Ended
Payment
Solutions
Segment
Results
$
in
000s,
unaudited |
 8.9%
16.9%
23.4%
22.7%
32.5%
37.7%
41.0%
$252.3
$512.2
$461.2
$393.8
$350.0
$682.2
$536.4
$448.0
$421.4
$881.3
$748.6
$680.2
$649.1
$1,150.0
$1,152.1
$1,082.9
$1,052.3
0.41%
0.40%
0.42%
0.32%
0.28%
0.20%
0.25%
0.30%
0.35%
0.40%
0.45%
Virtual Card Volume
Other Healthcare Volume
Effective Interchange Rate *
Payment Solutions
27
Healthcare Purchase Volume Trends
$millions
* Interchange revenue from Healthcare cards divided by purchase volume on
Healthcare cards |
 $84.2
$125.1
$169.8
$255.2
$298.5
$399.6
$595.0
$841.7
$16.7
$15.4
$20.9
$24.7
$24.9
$30.9
$47.4
$75.8
2005
2006
2007
2008
2009
2010
2011
2012
2013
2014
HSA $ Deposits (in millions)
HSA $ Assets (in millions)
Payment Solutions
28
Healthcare Deposits and Assets
$millions
$36.6M
$65.8M
$100.8M
$140.5M
$190.7M
$279.9M
$323.3M
$430.5M
$642.4M
$917.5M
Healthcare
provided
6.2% of Total
Avg. Deposits
in 2014 |
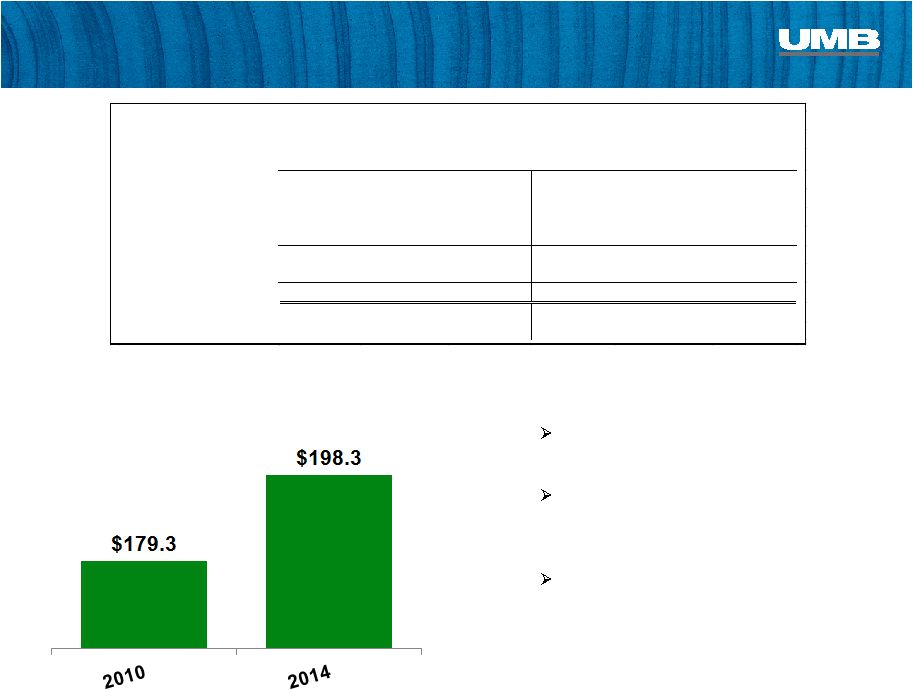 Asset Servicing
29
Assets Under Administration
$billions
Assets in the IMST increased 99% year-
over-year and now stand at $11.8 billion.
The number of funds serviced grew by
143 in the past 12 months, an increase of
nearly 14%
UMB Fund Services was named “Best
Administrator –
Liquid Alternatives”
at
HFMWeek’s 2014 US Hedge Fund
Services Awards in November
4 Quarter 2014 Highlights
th
% Change
% Change
Y/Y
Y/Y
2014
2013
2014
2013
Net interest income
5,450
$
2,357
$
131.2%
1,049
$
545
$
92.5%
Noninterest income
88,762
80,633
10.1%
22,177
20,572
7.8%
Noninterest expense
75,676
72,789
4.0%
19,980
18,643
7.2%
NI before taxes
18,536
10,201
81.7%
3,246
2,474
31.2%
Income tax expense
5,033
4,170
20.7%
877
1,116
-21.4%
Net income
13,503
$
6,031
$
123.9%
2,369
$
1,358
$
74.4%
pre-tax profit margin
19.7%
12.3%
14.0%
11.7%
3 mos Ended
December 31,
December 31,
12 mos Ended
Asset
Servicing
Segment
Results
$
in
000s,
unaudited |
 Asset Servicing
Fund Accounting & Administration
Alternative Asset Servicing
Custody
Transfer Agency
30
$30.5
$35.9
$44.1
$63.0
$72.1
116
160
179
219
249
2010
2011
2012
2013
2014
Assets Under Administration
# of Funds Serviced
$21.3
$24.7
$26.3
$27.9
$31.5
406
467
532
514
579
2010
2011
2012
2013
2014
Assets Under Administration
# of Funds Serviced
$101.4
$115.6
$54.9
$68.0
$62.4
470
499
443
411
454
2010
2011
2012
2013
2014
Assets Under Administration
# of Custody Accounts
554.9
802.4
946.8
1,280.1
1,111.2
227
256
270
301
349
2010
2011
2012
2013
2014
# of Shareholders
# of Funds Serviced |
 Strengths We are Leveraging
Diversified
revenue
Growing fee
businesses
Leadership
Success building a smartly
diversified financial services
company
Building scale through
strategic acquisitions
Professional management
teams leading highly engaged
workforce across the footprint
31 |
 Building a company
for the next 100 years.
UMB Financial
Fourth Quarter & Year-End 2014 |