Attached files
| file | filename |
|---|---|
| 8-K - FORM 8-K - CIT GROUP INC | e62411_8k.htm |
| EX-99.1 - PRESS RELEASE - CIT GROUP INC | e62411ex99-1.htm |
Exhibit 99.2

® CIT Fourth Quarter 2014 Financial Results J anuary 27, 2015

1 Important Notices This presentation contains forward - looking statements within the meaning of applicable federal securities laws that are based upon our current expectations and assumptions concerning future events, which are subject to a number of risks and uncertainties that could cause actual results to differ materially from those anticipated . The words “expect,” “anticipate,” “estimate,” “forecast,” “initiative,” “objective,” “plan,” “goal,” “project,” “outlook,” “priorities,” “target,” “intend,” “evaluate,” “pursue,” “commence,” “seek,” “may,” “would,” “could,” “should,” “believe,” “potential,” and “continue,” or the negative of any of those words or similar expressions are intended to identify forward - looking statements . All statements contained in this presentation, other than statements of historical fact, including without limitation, statements about our plans, strategies, prospects and expectations regarding future events and our financial performance, are forward - looking statements that involve certain risks and uncertainties . While these statements represent our current judgment on what the future may hold, and we believe these judgments are reasonable, these statements are not guarantees of any events or financial results, and our actual results may differ materially . Important factors that could cause our actual results to be materially different from our expectations include, among others, the risk that CIT is unsuccessful in implementing its strategy and business plan, the risk that CIT is unable to react to and address key business and regulatory issues, the risk that CIT is unable to achieve the projected revenue growth from its new business initiatives or the projected expense reductions from efficiency improvements, and the risk that CIT becomes subject to liquidity constraints and higher funding costs . We describe these and other risks that could affect our results in Item 1 A, “Risk Factors,” of our latest Annual Report on Form 10 - K for the year ended December 31 , 2013 , which was filed with the Securities and Exchange Commission . Accordingly, you should not place undue reliance on the forward - looking statements contained in this presentation . These forward - looking statements speak only as of the date on which the statements were made . CIT undertakes no obligation to update publicly or otherwise revise any forward - looking statements, except where expressly required by law . This presentation is to be used solely as part of CIT management’s continuing investor communications program . This presentation shall not constitute an offer or solicitation in connection with any securities .

2 Pre - Tax ROA Meeting Near - term Target 4 Q14 Earnings Call (1) Includes Transportation & International Finance (TIF) and North American Commercial Finance (NACF) (2) CIT Corporate excludes restructuring expenses and debt restructuring (3) Includes Non - Strategic Portfolios, Discontinued Ops, restructuring expenses and debt restructuring (4) Reflects 2Q Debt restructuring in the TRS which i mpacted TIF’s and NACF’s net finance margin by $7 million and other income by $8 million ($ Millions) Commercial Franchises (1) + CIT Corporate (2) Portfolio Repositioning (3) Total CIT Pre - tax income: $799 Pre - tax ROAEA: ~2.5% Pre - tax Income Non - Strategic Portfolios: ($102) Restructuring Expenses: ($31) Debt Restructuring (4) : $15 Pre - tax income: $681 Pre - tax ROAEA: ~2.0% Pre - tax Discontinued Ops: $56 Pre - tax Discontinued Ops: $56 4 Q Highlights Pre - tax income: $257 Pre - tax ROAEA: ~3.0% Non - Strategic Portfolios: ($28) Restructuring Expenses: ($7) Pre - tax income: $222 Pre - tax ROAEA: ~2.6% Full Year 2014 Benefit from Discrete Asset Sales in Commercial Franchises Offset Portfolio Repositioning Losses

3 Commercial Franchises Benefitted from Discrete Asset Sales 4 Q14 Earnings Call 3Q '14 4Q '14 Commercial Franchises – 4Q Pre - Tax Return on AEA ~85 bps Benefit f rom Discrete Asset Sales ~3.0% ~ 2.2% 4Q Activity + Lower reserve build + Higher other i ncome - Higher operating expenses - compensation, strategic initiatives, deposit and debt related costs Benefit f rom Discrete Asset Sales: ~ 85 bps ▪ ~35 bps - Aircraft sale gain to JV ▪ ~30 bps - Gains from problem loan resolutions ▪ ~15 bps - Gain on Sale of LP Investments to comply with Volcker Rule ▪ ~ 5 bps - Net benefit from UK portfolio sales ~ 2.2% 4Q Activity

4 ($ Millions except per share data) Noteworthy I tems in 4Q ’14 Items in 4Q14 Results Reported Diluted EPS $1.37 Impact Segment Item Line Item Total Pre - tax After tax Per share NSP AHFS - Impairments Other Income ($10) ($7) ($0.04) Corporate Restructuring Expenses Operating Expenses ($7) ($7) ($0.04) Corporate Intl. Tax VA Reversal Tax Provision - $44 $0.24 EPS based on 183.6 million average diluted shares outstanding $ impacts are rounded 4 Q14 Earnings Call

5 Profitability Metrics (1) 4 Q14 Earnings Call (1) % of a verage e arning a ssets (2) Adjusted for debt refinancing costs (3) Includes debt extinguishment costs FY’14 Near - term Outlook Comments Net Finance Margin (2) 4.23% 3.75% - 4.25% Benefiting from elevated interest recoveries, suspended depreciation and strong utilization Expect to trend to middle of the target range with continued variability Credit Provision (0.30%) (0.35%) – (0.75%) Subject to volatility as individual larger accounts migrate in and out of non - accrual status or get resolved Expect low end of target range Other Income 0.91% 0.75% - 1.00% Variability from asset sales and portfolio repositioning Expect low end of target range Operating Expenses (3) (ex. restructuring) (2.74%) (2.00%) – (2.50%) Potential headwind driven by portfolio repositioning and integration costs Expect high end of target range Pre - tax Income (ROAEA) 2.04% ~2.0% Lower portfolio repositioning costs (x CTA from country exits) offset by asset sale activity in Commercial Franchises Assumes current interest rate environment AEA (in millions) 33,395 5 - 10% Growth Headwinds from portfolio repositioning Organic growth expected at lower end of target range Near - term outlook excludes impact of Currency Translation Adjustment

6 (1) Includes International VA reversal impact of $4 4 million, $0.24 diluted EPS in 4Q14 and U.S. VA reversal impact of $375 million, $2.01 diluted EPS in 3Q14 (2) Average earning assets (AEA) is computed using month end balances and is the average of finance receivables, operating lease equ ipment and financing and leasing assets held for sale less the credit balances of factoring clients. (3) Excluding accelerated FSA net discount / premium and other charges on debt redemptions and accelerated OID (original issue discount) on debt extinguishment related to the TRS facility. Adjusted net finance margin is a non - GAAP measure ; please see the non - GAAP disclosures in our fourth quarter press release for a reconciliation of non - GAAP to GAAP financial information . (4) Operating expenses in 4Q14 includes loss on extinguishment of debt of $3.1 million. (5) Average finance receivables (AFR) is computed using month end balances and is the average of finance receivables (as defined be low). It excludes operating lease equipment. (6) Finance receivables (FR) include loans, direct financing lease and leverage lease receivables and factoring receivables. (7) Capital ratios are preliminary as of 12/31/14 At or For the Period Ended 4Q ’14 3Q ’14 2Q ’14 1Q ’14 4Q ’13 FY ’ 14 FY ’ 13 EPS (Diluted) – Total (1) $1.37 $2.76 $1.29 $0.59 $0.65 $5.96 $3.35 EPS (Diluted) – Continuing Ops. (1) $1.37 $2.76 $1.02 $0.58 $0.61 $5.69 $3.19 EPS (Diluted) impact from VA Reversal $0.24 $2.01 - - - $2.21 - Book Value Per Share $50.13 $49.10 $46.42 $45.10 $44.78 $50.13 $44.78 Tangible Book Value Per Share $46.83 $45.87 $44.16 $42.94 $42.98 $46.83 $42.98 Continuing Ops. Profitability Metrics as a % of AEA (2) Net Finance Margin 4.34% 4.26% 4.35% 4.01% 4.23% 4.25% 4.61% Adjusted Net Finance Margin (3) 4.34% 4.26% 4.26% 4.01% 4.29% 4.23% 4.71% Provision for Credit Losses (0.17%) (0.45%) (0.12%) (0.46%) (0.19%) (0.30%) (0.22%) Other Income 1.36% 0.28% 1.13% 0.89% 1.66% 0.91% 1.27% Operating Expenses (4) (2.93%) (2.74%) (2.71%) (2.91%) (3.70%) (2.83%) (3.22%) Pre - tax Income 2.59% 1.36% 2.64% 1.53% 2.00% 2.04% 2.44% Net Charge - offs (% of AFR (5) ) 0.47% 0.39% 0.45% 0.76% 0.32% 0.52% 0.44% Non - accrual Loans (% of FR (6) ) 0.82% 1.02% 1.02% 1.18% 1.29% 0.82% 1.29% Total Capital Ratio (7) 15.2% 15.0% 16.7% 16.8% 17.4% 15.2% 17.4% Tier 1 Capital Ratio (7) 14.5% 14.3% 16.0% 16.1% 16.7% 14.5% 16.7% Performance Highlights & Trends 4 Q14 Earnings Call
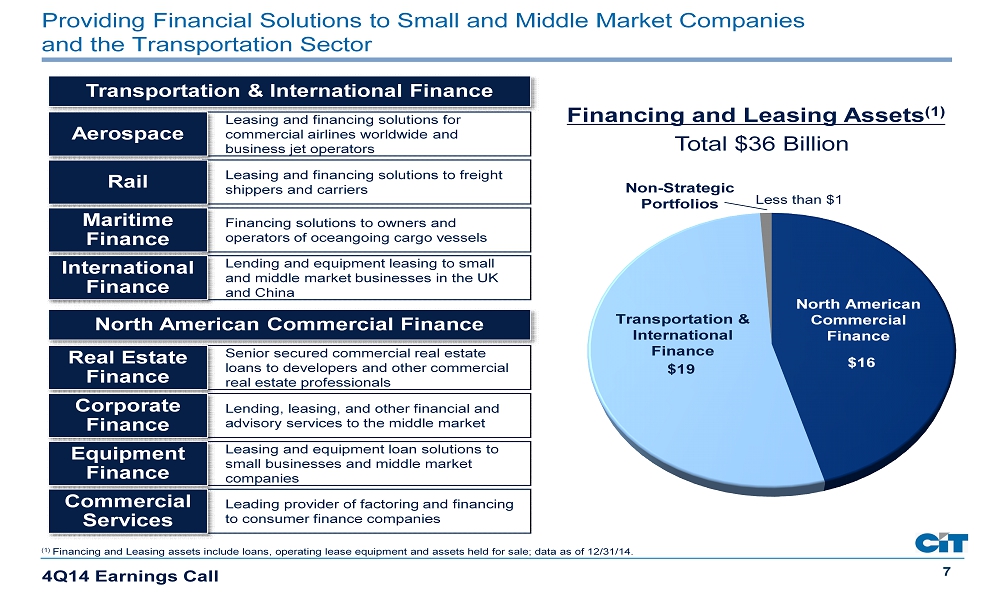
7 Providing Financial Solutions to Small and Middle Market Companies and the Transportation Sector (1) Financing and Leasing assets include loans, operating lease equipment and assets held for sale; data as of 12/31/14. Financing and Leasing Assets (1 ) Total $ 36 Billion Leasing and financing solutions for commercial airlines worldwide and business jet operators Aerospace $16 $19 Less than $1 North American Commercial Finance Non - Strategic Portfolios Transportation & International Finance Transportation & International Finance Leasing and financing solutions to freight shippers and carriers Rail Financing solutions to owners and operators of oceangoing cargo vessels Maritime Finance Lending and equipment leasing to small and middle market businesses in the UK and China International Finance Senior secured commercial real estate loans to developers and other commercial real estate professionals Real Estate Finance North American Commercial Finance Lending, leasing, and other financial and advisory services to the middle market Corporate Finance Leasing and equipment loan solutions to small businesses and middle market companies Equipment Finance Leading provider of factoring and financing to consumer finance companies Commercial Services 4 Q14 Earnings Call

8 ($ Billions ) Financing and Leasing Assets Portfolio Trends – (Continuing Operations) 27.2 28.1 25.9 26.2 26.8 16.1 16.8 18.3 20.3 21.1 43.3 44.9 44.2 46.5 47.9 25% 30% 35% 40% 45% 50% 0.0 10.0 20.0 30.0 40.0 50.0 60.0 4Q '13 1Q '14 2Q '14 3Q '14 4Q '14 Total Assets Total Assets All Other Assets CIT Bank Assets CIT Bank Assets % of Total Assets CIT Bank Assets % to Total Assets 4 Q14 Earnings Call 16.4 17.6 18.4 19.1 19.0 15.0 15.2 15.7 16.4 16.2 32.7 33.9 34.7 36.1 35.6 0.0 10.0 20.0 30.0 40.0 4Q '13 1Q '14 2Q '14 3Q '14 4Q '14 TIF NACF NSP

9 Adjusted Net Finance Margin (1) Trend 4 Q14 Earnings Call 4.14% 3.91% 4.00% 4.06% 4.04% 4.29% 4.01% 4.26% 4.26% 4.34% 0% 1% 2% 3% 4% 5% 6% 4Q '13 1Q '14 2Q '14 3Q '14 4Q '14 As % of AEA Net Finance Margin Less Other Items Other Items (2) ( 1 ) Adjusted Net Finance Margin is reported net finance revenue increased by accelerated FSA net discount/(premium) on debt extinguishment s a nd repurchases and debt related prepayment costs, reduced by accelerated OID accretion; as a % of average earning assets (2) Other items include suspended depreciation, interest recoveries / prepayments and other loan and debt FSA ▪ Adjusted net finance margin less other items within near - term outlook range ▪ Variability primarily driven by: ▪ S uspended depreciation on equipment in held for sale ▪ Interest recoveries on problem loan resolutions ▪ Accelerated deferred fees on prepayments Near - term outlook : 3 .75% - 4.25% of AEA

10 Asset Quality Trends – ( Continuing Operations) ($ Millions) 241 218 190 201 161 0.3% 0.8% 0.5% 0.4% 0.5% 0.0% 0.3% 0.6% 0.9% 1.2% 1.5% 0 50 100 150 200 250 300 4Q '13 1Q '14 2Q '14 3Q '14 4Q '14 Net Charge - offs % to AFR Non – accrual Loans Non - accrual Loans & Net Charge - offs Non-accrual Loans Net Charge-offs % to AFR 356 353 341 358 346 1.9% 1.9% 1.8% 1.8% 1.8% 1.5% 1.7% 1.9% 2.1% 2.3% 2.5% 2.7% 2.9% 0 50 100 150 200 250 300 350 400 450 500 4Q '13 1Q '14 2Q '14 3Q '14 4Q '14 Allowance for Loan Losses % to FR Allowance for Loan Losses Allowance for Loan Losses Allowance for Loan Losses Allowance for Loan Losses % to FR (1) (1) 4Q’14, 3Q’14, 2Q’14, 1Q’14 and 4Q’13 include approximately $7 million, $11 million, $12 million, $14 million and $5 million res pectively, of charge - offs related to the transfer of loans to held for sale; exclusive of these charge - offs, net charge - offs as a % to AFR would have been 34 bps,17 bps, 21 bps, 46 bps and 23 bps respectively. 4 Q14 Earnings Call
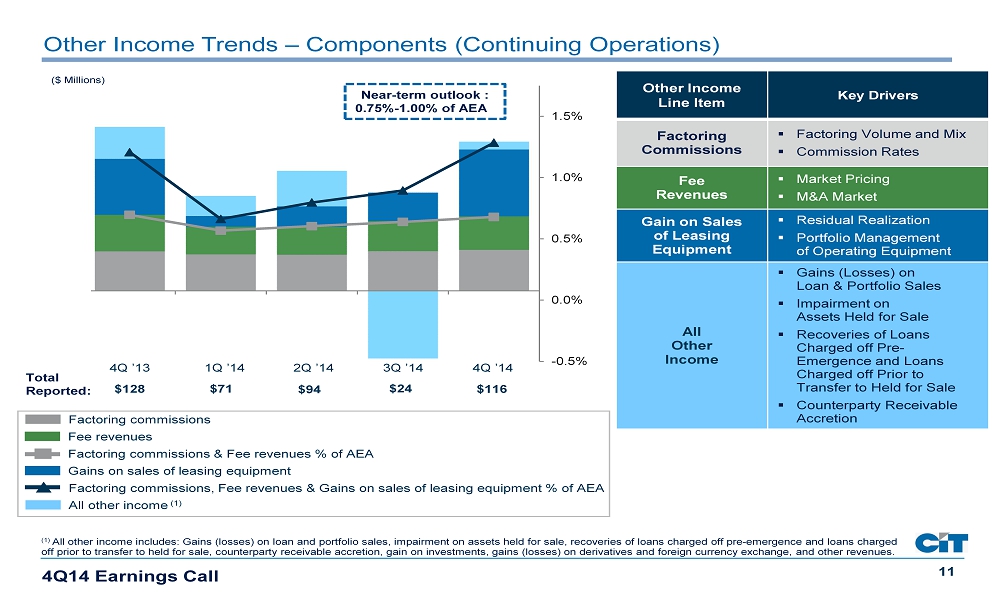
11 Other Income Trends – Components (Continuing Operations) 4 Q14 Earnings Call (1) All other income includes: Gains (losses) on loan and portfolio sales, impairment on assets held for sale, recoveries of loans charged off pre - emergence and loans charged off prior to transfer to held for sale, counterparty receivable accretion, gain on investments, gains (losses ) on derivatives and foreign currency exchange, and other revenues. -0.5% 0.0% 0.5% 1.0% 1.5% -55 -30 -5 20 45 70 95 120 145 $ 71 $ 94 $24 Factoring commissions Fee revenues Gains on sales of leasing equipment All other income (1) Factoring commissions & Fee revenues % of AEA Factoring commissions, Fee revenues & Gains on sales of leasing equipment % of AEA Other Income Line Item Key Drivers Factoring Commissions ▪ Factoring Volume and Mix ▪ Commission Rates Fee Revenues ▪ Market Pricing ▪ M&A Market Gain on Sales of Leasing Equipment ▪ Residual Realization ▪ Portfolio Management of Operating Equipment All Other Income ▪ Gains (Losses) on Loan & Portfolio Sales ▪ Impairment on Assets Held for Sale ▪ Recoveries of Loans Charged off Pre - Emergence and Loans Charged off Prior to Transfer to Held for Sale ▪ Counterparty Receivable Accretion ($ Millions) $128 4Q ’13 2Q ’14 3Q ’14 4Q ’14 1Q ’14 $116 Total Reported: Near - term outlook : 0.75% - 1.00% of AEA

12 211 210 205 211 226 284 234 225 235 252 2.87% 2.79% 2.64% 2.63% 2.86% 0.0% 0.5% 1.0% 1.5% 2.0% 2.5% 3.0% 3.5% 0 50 100 150 200 250 300 350 400 4Q '13 1Q '14 2Q '14 3Q '14 4Q '14 Operating Expenses Operating Expenses (1) Trends – (Continuing Operations) ($ Millions) % to AEA ex. Restructuring Charges 4 Q14 Earnings Call Restructuring Charges All Other Operating Expenses Tax Agreement Settlement Deposit Related & Debt Extinguishment Costs % of AEA ex. Restructuring Charges / Tax Settlement Near - term outlook : 2.00% - 2.50% of AEA (1) 4Q ’14 includes debt extinguishment costs of $3.1 million (1)

13 APPENDIX 4 Q14 Earnings Call
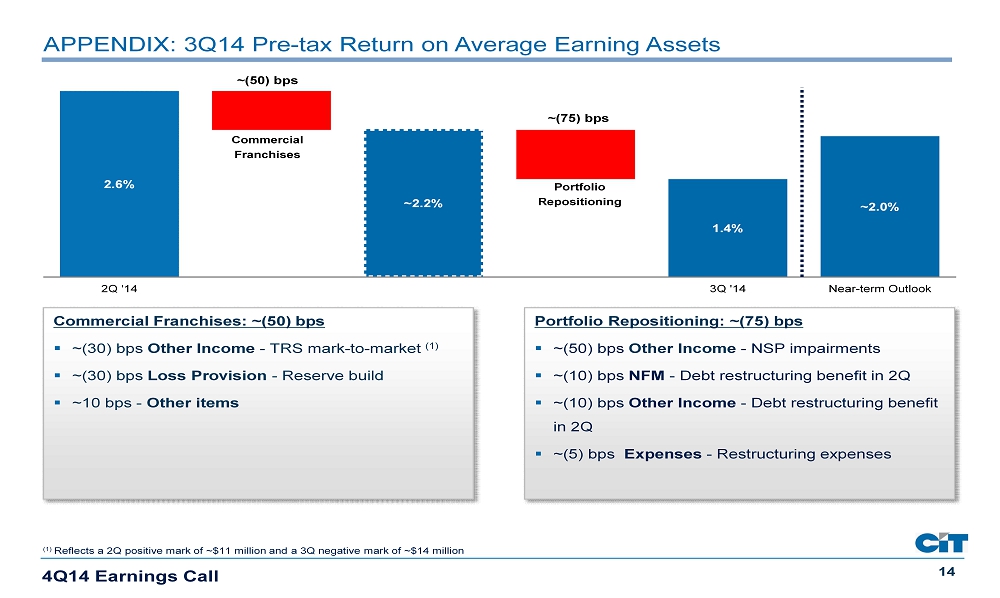
14 APPENDIX: 3Q14 Pre - tax Return on Average Earning Assets 4Q14 Earnings Call 2.6% ~2.2% 1.4% ~2.0 % 2Q '14 3Q '14 Near-term Outlook Portfolio Repositioning: ~(75) bps ▪ ~(50) bps Other Income - NSP impairments ▪ ~(10) bps NFM - Debt restructuring benefit in 2Q ▪ ~(10) bps Other Income - Debt restructuring benefit in 2Q ▪ ~(5) bps Expenses - Restructuring expenses Commercial Franchises: ~(50) bps ▪ ~(30) bps Other Income - TRS mark - to - market (1) ▪ ~(30) bps Loss Provision - Reserve build ▪ ~10 bps - Other items Commercial Franchises ~(50) bps Portfolio Repositioning ~(75) bps ( 1 ) Reflects a 2Q positive mark of ~$11 million and a 3Q negative mark of ~$14 million