Attached files
| file | filename |
|---|---|
| 8-K - 8-K - Sabra Health Care REIT, Inc. | a8-kstifelprensentationjan.htm |
2015 Stifel Senior Housing and Healthcare Real Estate Conference January 27, 2015 Relationship driven. Investor focused.
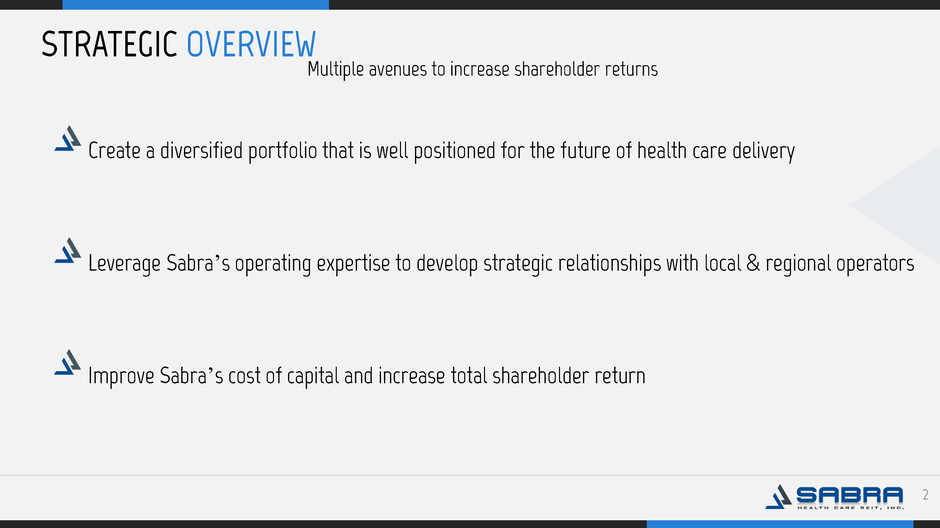
. 2 STRATEGIC OVERVIEW Multiple avenues to increase shareholder returns Create a diversified portfolio that is well positioned for the future of health care delivery Leverage Sabra’s operating expertise to develop strategic relationships with local & regional operators Improve Sabra’s cost of capital and increase total shareholder return
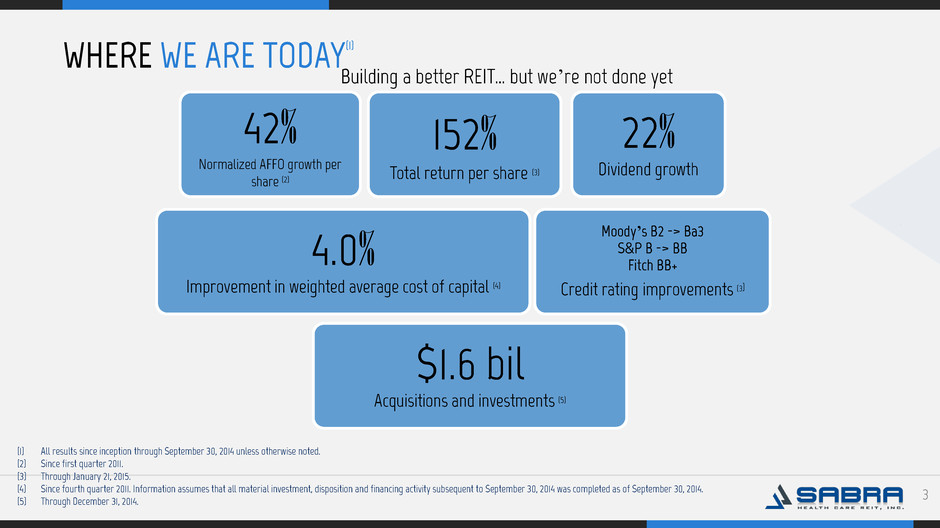
. 3 WHERE WE ARE TODAY(1) Building a better REIT… but we’re not done yet (1) All results since inception through September 30, 2014 unless otherwise noted. (2) Since first quarter 2011. (3) Through January 21, 2015. (4) Since fourth quarter 2011. Information assumes that all material investment, disposition and financing activity subsequent to September 30, 2014 was completed as of September 30, 2014. (5) Through December 31, 2014. $1.6 bil Acquisitions and investments (5) 4.0% Improvement in weighted average cost of capital (4) 42% Normalized AFFO growth per share (2) 152% Total return per share (3) Moody’s B2 -> Ba3 S&P B -> BB Fitch BB+ Credit rating improvements (3) 22% Dividend growth
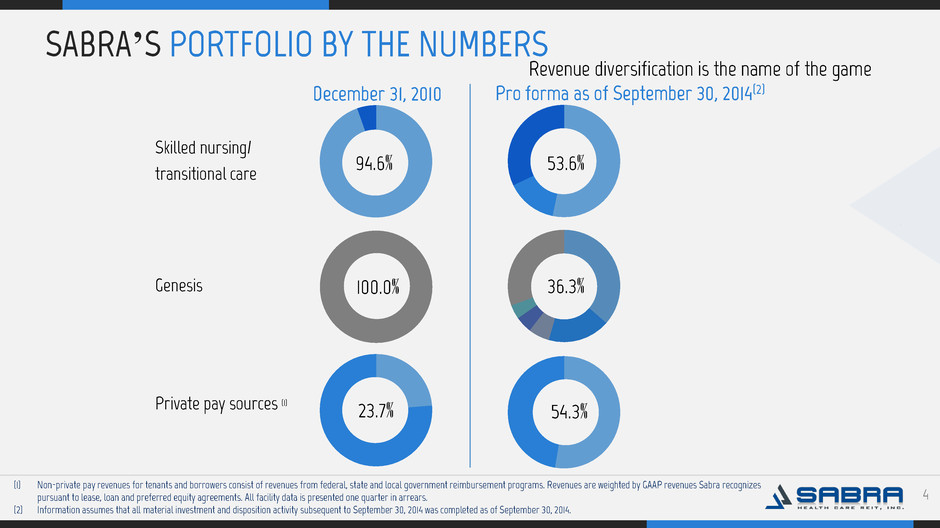
. 4 SABRA’S PORTFOLIO BY THE NUMBERS Revenue diversification is the name of the game Skilled nursing/ transitional care Genesis 1) Includes revenues from all investment activity through May 27, 2014 Private pay sources (1) (1) Non-private pay revenues for tenants and borrowers consist of revenues from federal, state and local government reimbursement programs. Revenues are weighted by GAAP revenues Sabra recognizes pursuant to lease, loan and preferred equity agreements. All facility data is presented one quarter in arrears. (2) Information assumes that all material investment and disposition activity subsequent to September 30, 2014 was completed as of September 30, 2014. December 31, 2010 Pro forma as of September 30, 2014(2) 53.6% 94.6% 100.0% 23.7% 36.3% 54.3%
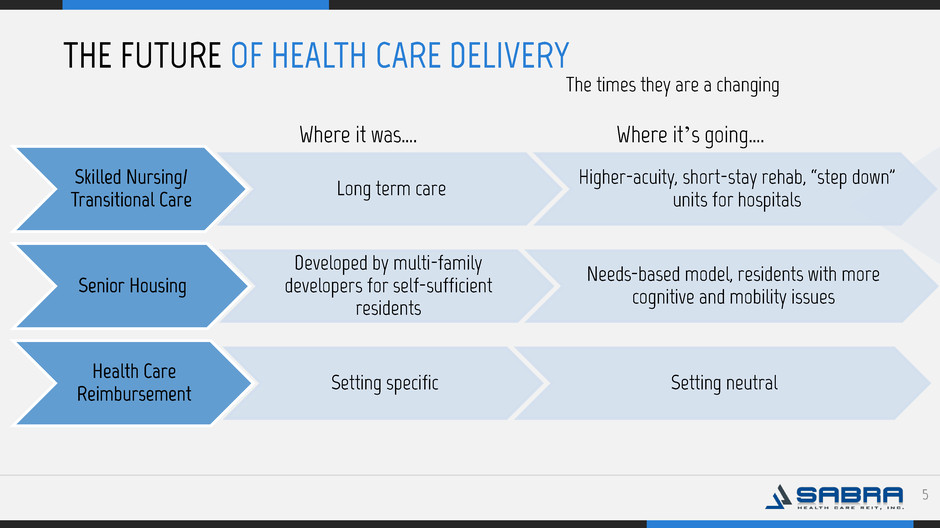
. 5 THE FUTURE OF HEALTH CARE DELIVERY The times they are a changing Skilled Nursing/ Transitional Care Long term care Higher-acuity, short-stay rehab, “step down” units for hospitals Senior Housing Developed by multi-family developers for self-sufficient residents Needs-based model, residents with more cognitive and mobility issues Health Care Reimbursement Setting specific Setting neutral Where it was…. Where it’s going….
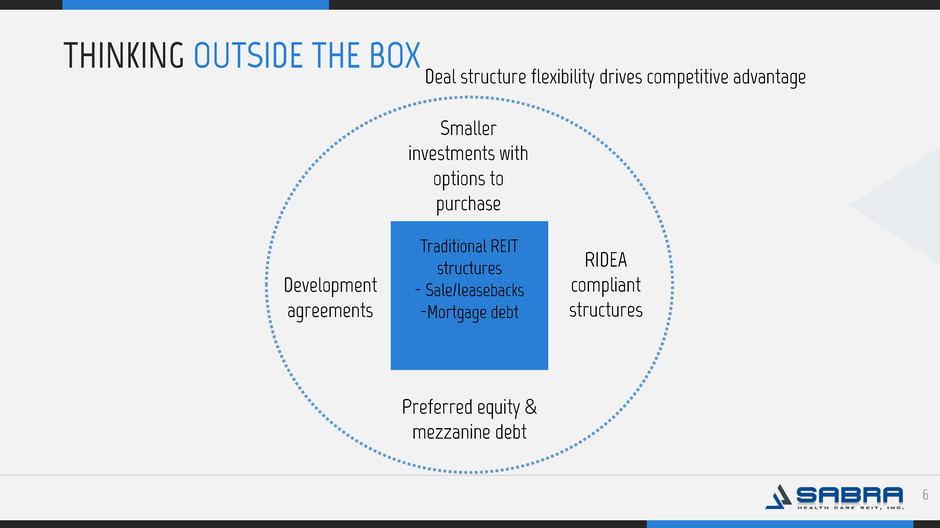
. 6 Traditional REIT structures - Sale/leasebacks -Mortgage debt THINKING OUTSIDE THE BOX Deal structure flexibility drives competitive advantage Smaller investments with options to purchase RIDEA compliant structures Preferred equity & mezzanine debt Development agreements
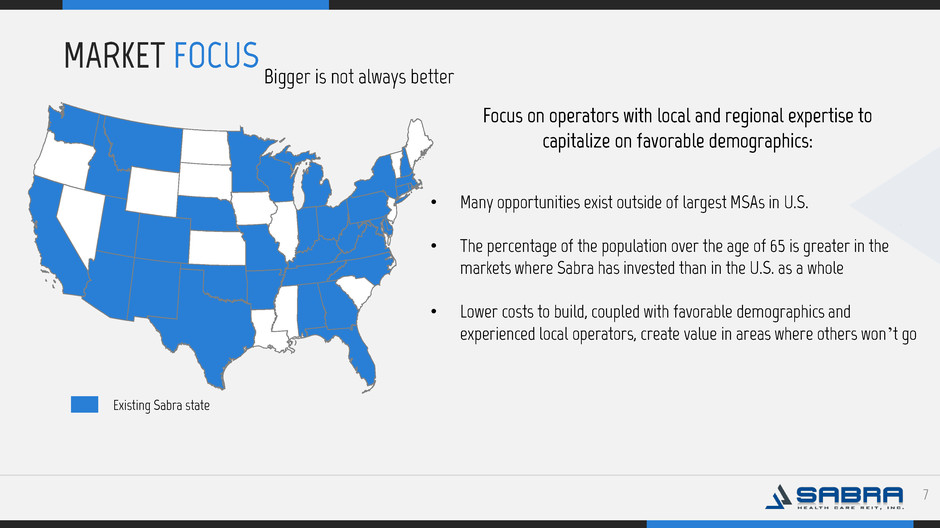
. 7 MARKET FOCUS Bigger is not always better • Many opportunities exist outside of largest MSAs in U.S. • The percentage of the population over the age of 65 is greater in the markets where Sabra has invested than in the U.S. as a whole • Lower costs to build, coupled with favorable demographics and experienced local operators, create value in areas where others won’t go Focus on operators with local and regional expertise to capitalize on favorable demographics: Existing Sabra state
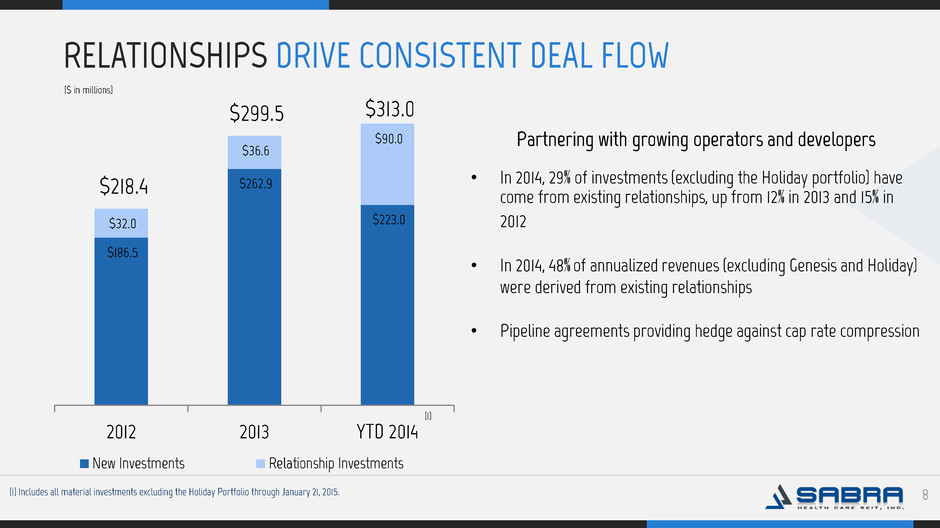
. 8 RELATIONSHIPS DRIVE CONSISTENT DEAL FLOW Partnering with growing operators and developers $186.5 $262.9 $223.0 $32.0 $36.6 $90.0 $218.4 $299.5 $313.0 2012 2013 YTD 2014 New Investments Relationship Investments • In 2014, 29% of investments (excluding the Holiday portfolio) have come from existing relationships, up from 12% in 2013 and 15% in 2012 • In 2014, 48% of annualized revenues (excluding Genesis and Holiday) were derived from existing relationships • Pipeline agreements providing hedge against cap rate compression ($ in millions) (1) (1) Includes all material investments excluding the Holiday Portfolio through January 21, 2015.
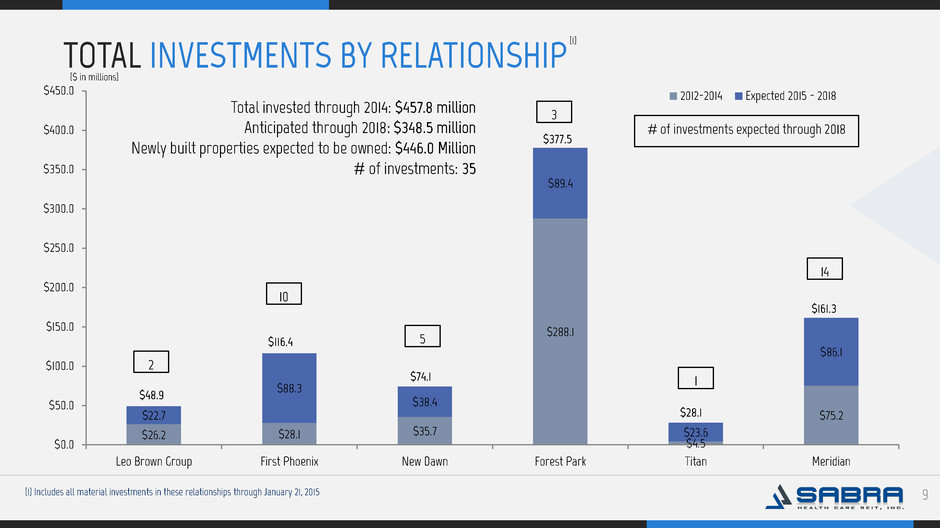
. 9 TOTAL INVESTMENTS BY RELATIONSHIP ($ in millions) (1) (1) Includes all material investments in these relationships through January 21, 2015 $26.2 $28.1 $35.7 $288.1 $4.5 $75.2 $22.7 $88.3 $38.4 $89.4 $23.6 $86.1 $48.9 $116.4 $74.1 $377.5 $28.1 $161.3 $0.0 $50.0 $100.0 $150.0 $200.0 $250.0 $300.0 $350.0 $400.0 $450.0 Leo Brown Group First Phoenix New Dawn Forest Park Titan Meridian 2012-2014 Expected 2015 - 2018 2 # of investments expected through 2018 14 1 3 10 5 Total invested through 2014: $457.8 million Anticipated through 2018: $348.5 million Newly built properties expected to be owned: $446.0 Million # of investments: 35
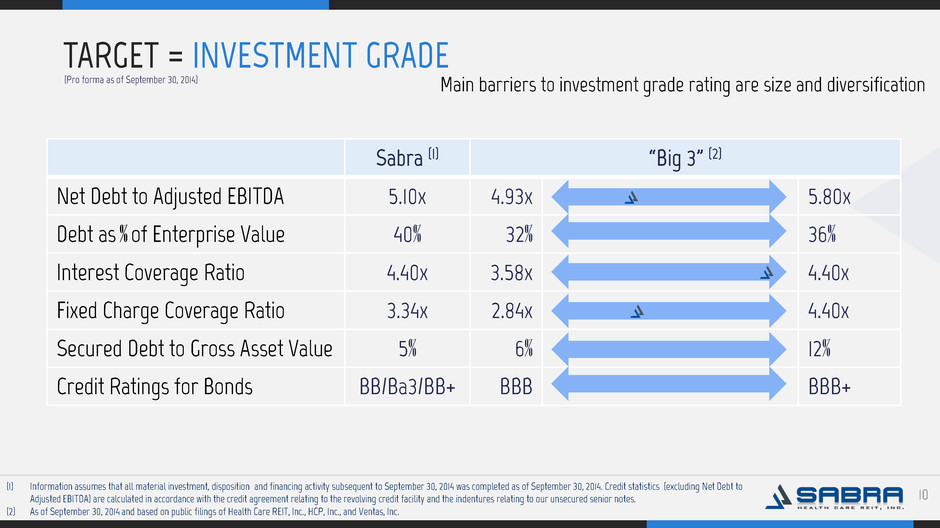
. 10 TARGET = INVESTMENT GRADE Main barriers to investment grade rating are size and diversification Sabra (1) “Big 3” (2) Net Debt to Adjusted EBITDA 5.10x 4.93x 5.80x Debt as % of Enterprise Value 40% 32% 36% Interest Coverage Ratio 4.40x 3.58x 4.40x Fixed Charge Coverage Ratio 3.34x 2.84x 4.40x Secured Debt to Gross Asset Value 5% 6% 12% Credit Ratings for Bonds BB/Ba3/BB+ BBB BBB+ (Pro forma as of September 30, 2014) (1) Information assumes that all material investment, disposition and financing activity subsequent to September 30, 2014 was completed as of September 30, 2014. Credit statistics (excluding Net Debt to Adjusted EBITDA) are calculated in accordance with the credit agreement relating to the revolving credit facility and the indentures relating to our unsecured senior notes. (2) As of September 30, 2014 and based on public filings of Health Care REIT, Inc., HCP, Inc., and Ventas, Inc.
Portfolio Performance
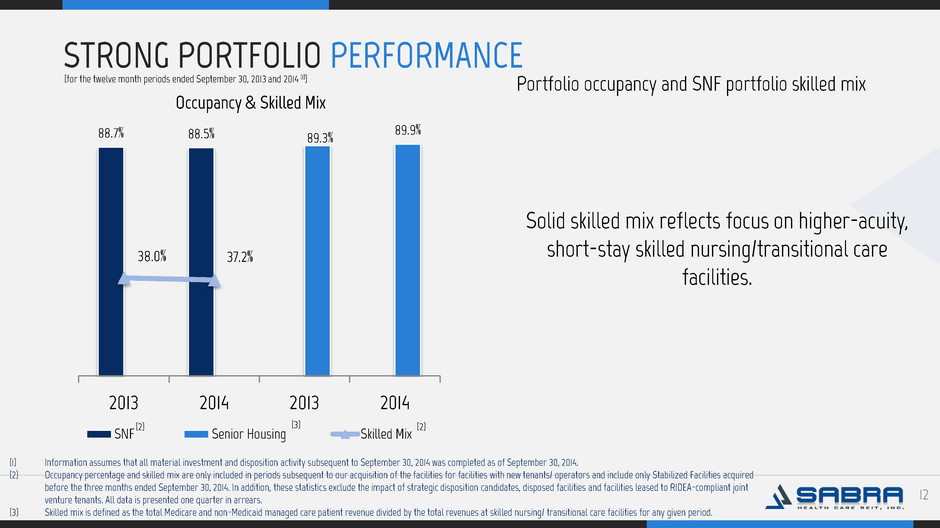
. 12 STRONG PORTFOLIO PERFORMANCE Portfolio occupancy and SNF portfolio skilled mix 88.7% 88.5% 89.3% 89.9% 38.0% 37.2% 2013 2014 2013 2014 SNF Senior Housing Skilled Mix Occupancy & Skilled Mix Solid skilled mix reflects focus on higher-acuity, short-stay skilled nursing/transitional care facilities. (1) Information assumes that all material investment and disposition activity subsequent to September 30, 2014 was completed as of September 30, 2014. (2) Occupancy percentage and skilled mix are only included in periods subsequent to our acquisition of the facilities for facilities with new tenants/ operators and include only Stabilized Facilities acquired before the three months ended September 30, 2014. In addition, these statistics exclude the impact of strategic disposition candidates, disposed facilities and facilities leased to RIDEA-compliant joint venture tenants. All data is presented one quarter in arrears. (3) Skilled mix is defined as the total Medicare and non-Medicaid managed care patient revenue divided by the total revenues at skilled nursing/ transitional care facilities for any given period. (for the twelve month periods ended September 30, 2013 and 2014 (1)) (2) (2) (3)
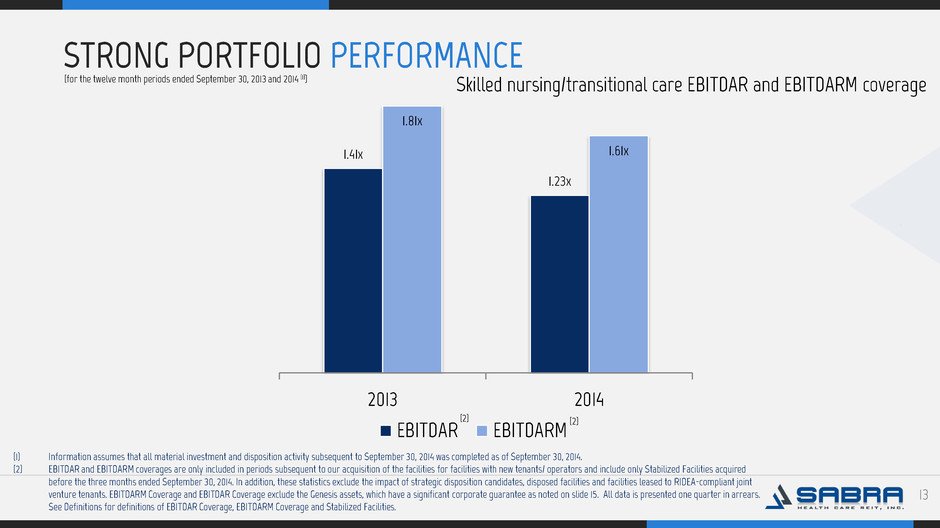
. 13 STRONG PORTFOLIO PERFORMANCE Skilled nursing/transitional care EBITDAR and EBITDARM coverage 1.41x 1.23x 1.81x 1.61x 2013 2014 EBITDAR EBITDARM (2) (1) Information assumes that all material investment and disposition activity subsequent to September 30, 2014 was completed as of September 30, 2014. (2) EBITDAR and EBITDARM coverages are only included in periods subsequent to our acquisition of the facilities for facilities with new tenants/ operators and include only Stabilized Facilities acquired before the three months ended September 30, 2014. In addition, these statistics exclude the impact of strategic disposition candidates, disposed facilities and facilities leased to RIDEA-compliant joint venture tenants. EBITDARM Coverage and EBITDAR Coverage exclude the Genesis assets, which have a significant corporate guarantee as noted on slide 15. All data is presented one quarter in arrears. See Definitions for definitions of EBITDAR Coverage, EBITDARM Coverage and Stabilized Facilities. (2) (for the twelve month periods ended September 30, 2013 and 2014 (1))
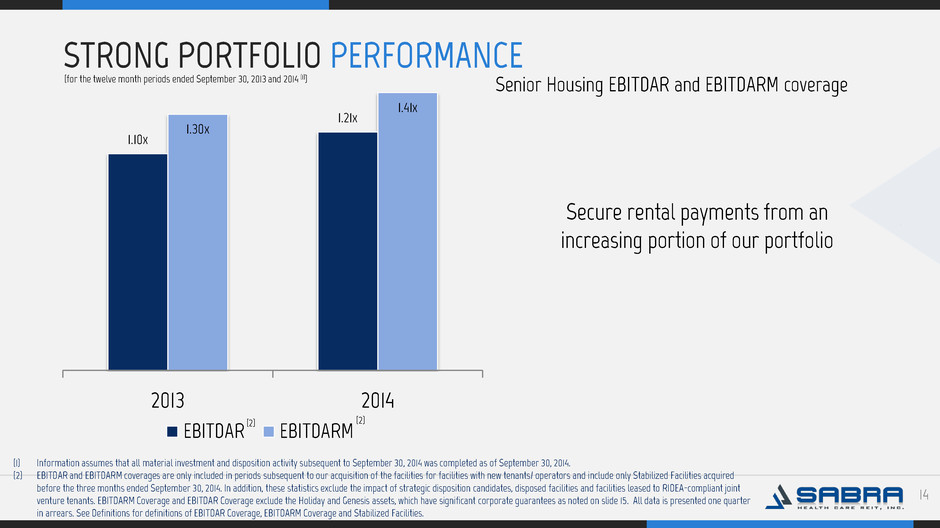
. 14 STRONG PORTFOLIO PERFORMANCE Senior Housing EBITDAR and EBITDARM coverage 1.10x 1.21x 1.30x 1.41x 2013 2014 EBITDAR EBITDARM (2) Secure rental payments from an increasing portion of our portfolio (1) Information assumes that all material investment and disposition activity subsequent to September 30, 2014 was completed as of September 30, 2014. (2) EBITDAR and EBITDARM coverages are only included in periods subsequent to our acquisition of the facilities for facilities with new tenants/ operators and include only Stabilized Facilities acquired before the three months ended September 30, 2014. In addition, these statistics exclude the impact of strategic disposition candidates, disposed facilities and facilities leased to RIDEA-compliant joint venture tenants. EBITDARM Coverage and EBITDAR Coverage exclude the Holiday and Genesis assets, which have significant corporate guarantees as noted on slide 15. All data is presented one quarter in arrears. See Definitions for definitions of EBITDAR Coverage, EBITDARM Coverage and Stabilized Facilities. (2) (for the twelve month periods ended September 30, 2013 and 2014 (1))
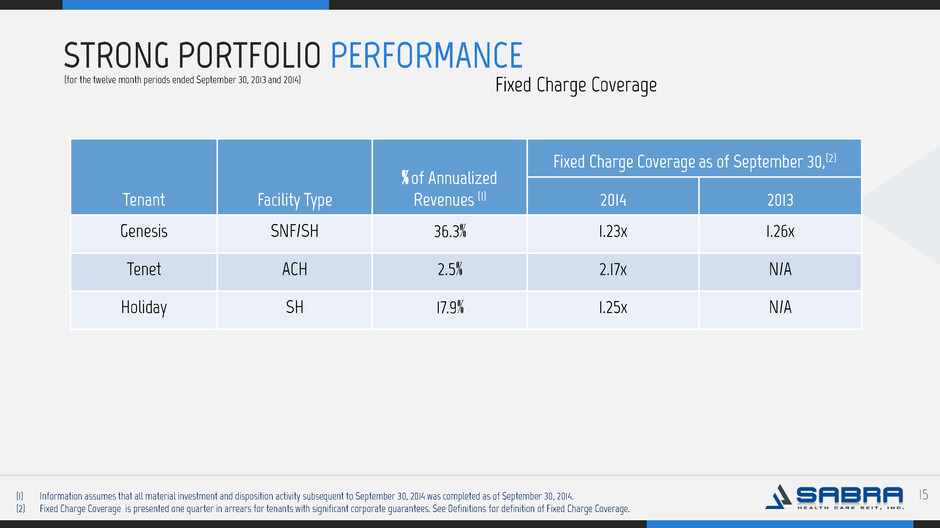
. 15 STRONG PORTFOLIO PERFORMANCE Fixed Charge Coverage (1) Information assumes that all material investment and disposition activity subsequent to September 30, 2014 was completed as of September 30, 2014. (2) Fixed Charge Coverage is presented one quarter in arrears for tenants with significant corporate guarantees. See Definitions for definition of Fixed Charge Coverage. (for the twelve month periods ended September 30, 2013 and 2014) Tenant Facility Type % of Annualized Revenues (1) Fixed Charge Coverage as of September 30,(2) 2014 2013 Genesis SNF/SH 36.3% 1.23x 1.26x Tenet ACH 2.5% 2.17x N/A Holiday SH 17.9% 1.25x N/A
Financial Overview
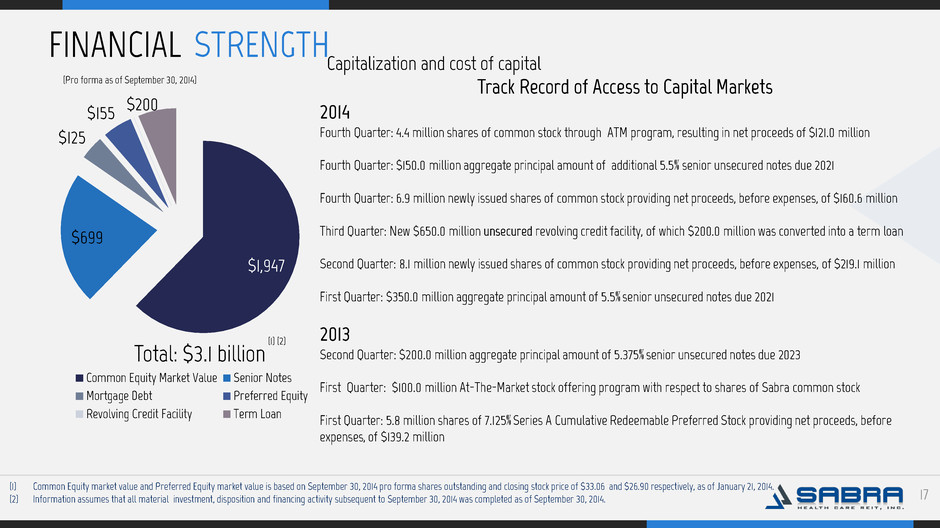
. 17 Capitalization and cost of capital $1,947 $699 $125 $155 $200 Common Equity Market Value Senior Notes Mortgage Debt Preferred Equity Revolving Credit Facility Term Loan (1) (2) (1) Common Equity market value and Preferred Equity market value is based on September 30, 2014 pro forma shares outstanding and closing stock price of $33.06 and $26.90 respectively, as of January 21, 2014. (2) Information assumes that all material investment, disposition and financing activity subsequent to September 30, 2014 was completed as of September 30, 2014. Track Record of Access to Capital Markets 2014 Fourth Quarter: 4.4 million shares of common stock through ATM program, resulting in net proceeds of $121.0 million Fourth Quarter: $150.0 million aggregate principal amount of additional 5.5% senior unsecured notes due 2021 Fourth Quarter: 6.9 million newly issued shares of common stock providing net proceeds, before expenses, of $160.6 million Third Quarter: New $650.0 million unsecured revolving credit facility, of which $200.0 million was converted into a term loan Second Quarter: 8.1 million newly issued shares of common stock providing net proceeds, before expenses, of $219.1 million First Quarter: $350.0 million aggregate principal amount of 5.5% senior unsecured notes due 2021 2013 Second Quarter: $200.0 million aggregate principal amount of 5.375% senior unsecured notes due 2023 First Quarter: $100.0 million At-The-Market stock offering program with respect to shares of Sabra common stock First Quarter: 5.8 million shares of 7.125% Series A Cumulative Redeemable Preferred Stock providing net proceeds, before expenses, of $139.2 million FINANCIAL STRENGTH Total: $3.1 billion (Pro forma as of September 30, 2014)
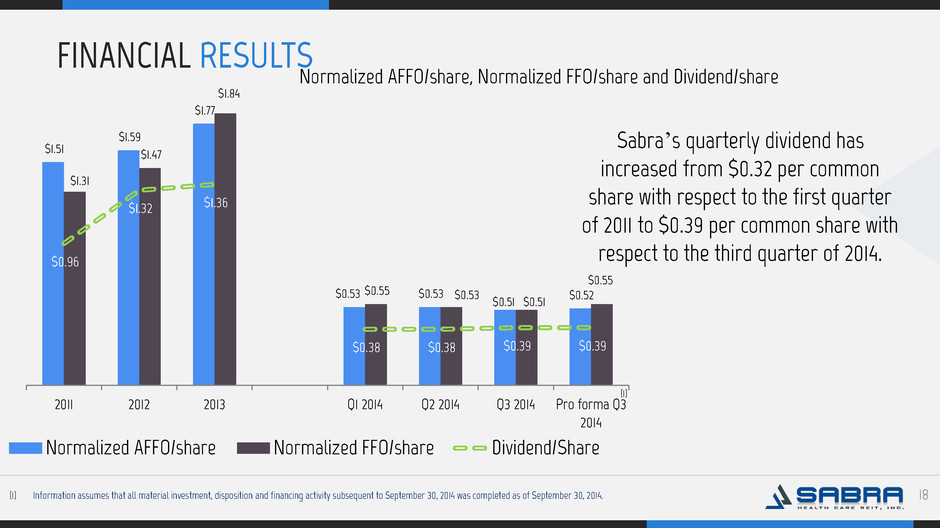
. 18 FINANCIAL RESULTS Normalized AFFO/share, Normalized FFO/share and Dividend/share $1.51 $1.59 $1.77 $0.53 $0.53 $0.51 $0.52 $1.31 $1.47 $1.84 $0.55 $0.53 $0.51 $0.55 $0.96 $1.32 $1.36 $0.38 $0.38 $0.39 $0.39 2011 2012 2013 Q1 2014 Q2 2014 Q3 2014 Pro forma Q3 2014 Normalized AFFO/share Normalized FFO/share Dividend/Share Sabra’s quarterly dividend has increased from $0.32 per common share with respect to the first quarter of 2011 to $0.39 per common share with respect to the third quarter of 2014. (1) Information assumes that all material investment, disposition and financing activity subsequent to September 30, 2014 was completed as of September 30, 2014. (1)
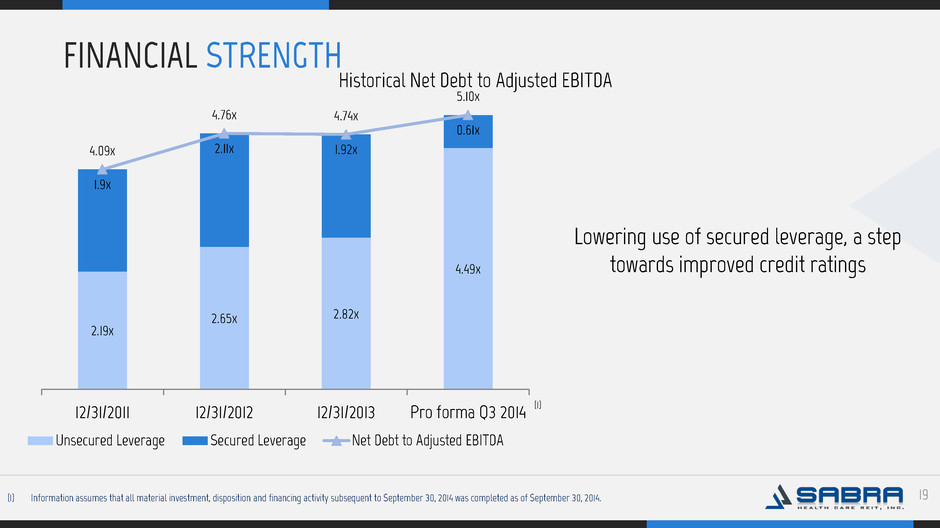
. 19 FINANCIAL STRENGTH Historical Net Debt to Adjusted EBITDA 2.19x 2.65x 2.82x 4.49x 1.9x 2.11x 1.92x 0.61x 4.09x 4.76x 4.74x 5.10x 12/31/2011 12/31/2012 12/31/2013 Pro forma Q3 2014 Unsecured Leverage Secured Leverage Net Debt to Adjusted EBITDA Lowering use of secured leverage, a step towards improved credit ratings (1) Information assumes that all material investment, disposition and financing activity subsequent to September 30, 2014 was completed as of September 30, 2014. (1)
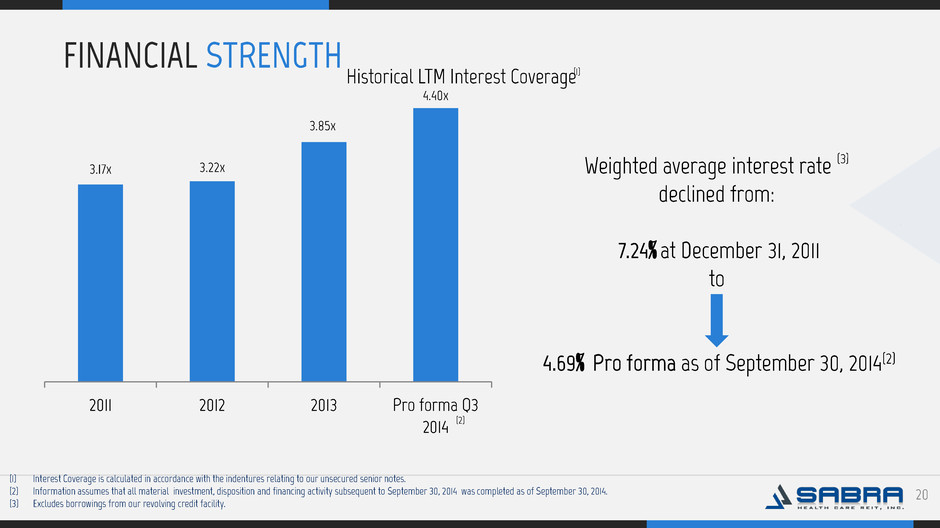
. 20 FINANCIAL STRENGTH Historical LTM Interest Coverage 3.17x 3.22x 3.85x 4.40x 2011 2012 2013 Pro forma Q3 2014 Weighted average interest rate (3) declined from: 7.24% at December 31, 2011 to 4.69% Pro forma as of September 30, 2014(2) (1) Interest Coverage is calculated in accordance with the indentures relating to our unsecured senior notes. (2) Information assumes that all material investment, disposition and financing activity subsequent to September 30, 2014 was completed as of September 30, 2014. (3) Excludes borrowings from our revolving credit facility. (1) (2)
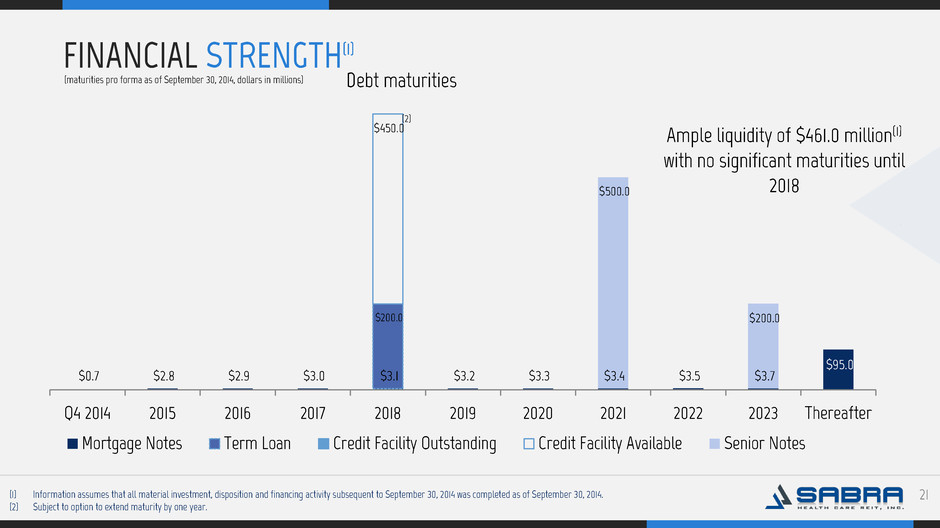
. 21 FINANCIAL STRENGTH(1) Debt maturities $0.7 $2.8 $2.9 $3.0 $3.1 $3.2 $3.3 $3.4 $3.5 $3.7 $95.0 $200.0 $450.0 $500.0 $200.0 Q4 2014 2015 2016 2017 2018 2019 2020 2021 2022 2023 Thereafter Mortgage Notes Term Loan Credit Facility Outstanding Credit Facility Available Senior Notes Ample liquidity of $461.0 million(1) with no significant maturities until 2018 (1) Information assumes that all material investment, disposition and financing activity subsequent to September 30, 2014 was completed as of September 30, 2014. (2) Subject to option to extend maturity by one year. (maturities pro forma as of September 30, 2014, dollars in millions) (2)
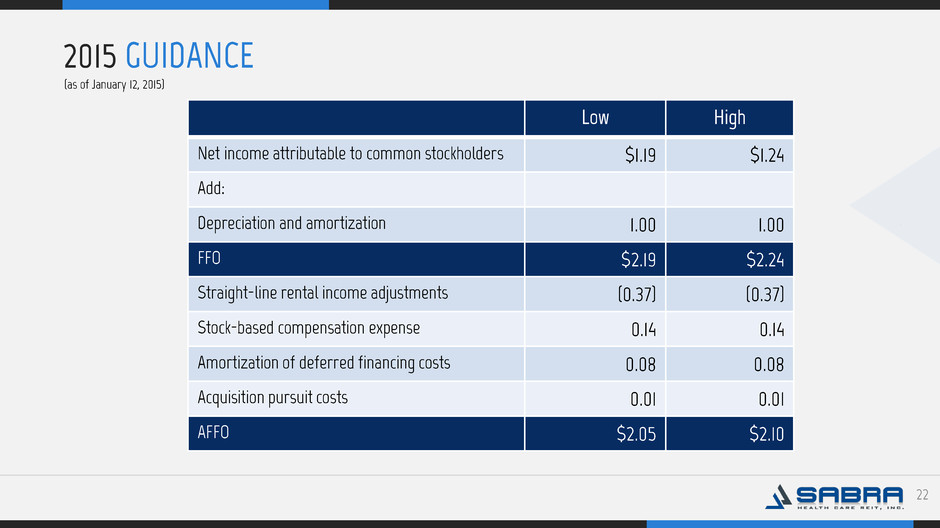
. 22 2015 GUIDANCE Low High Net income attributable to common stockholders $1.19 $1.24 Add: Depreciation and amortization 1.00 1.00 FFO $2.19 $2.24 Straight-line rental income adjustments (0.37) (0.37) Stock-based compensation expense 0.14 0.14 Amortization of deferred financing costs 0.08 0.08 Acquisition pursuit costs 0.01 0.01 AFFO $2.05 $2.10 (as of January 12, 2015)
Appendix
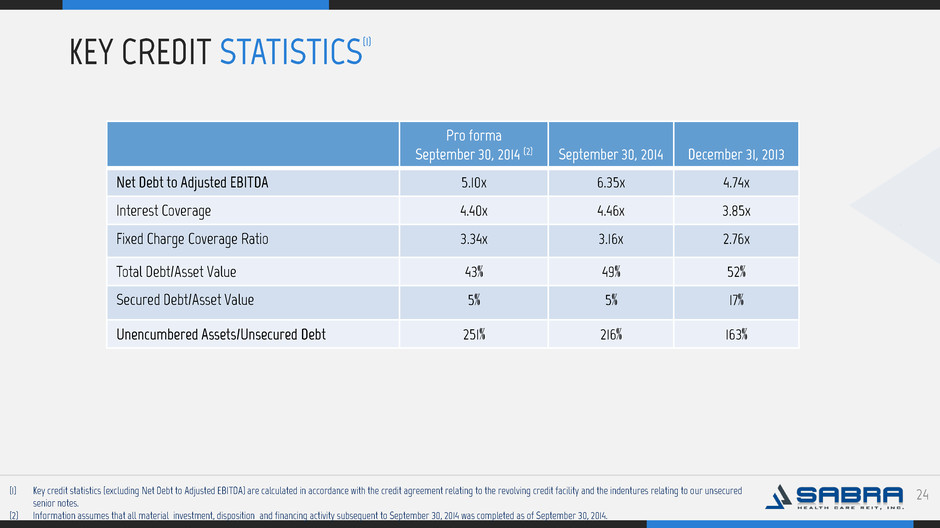
. 24 KEY CREDIT STATISTICS(1) Option One Option Three Ma Pro forma September 30, 2014 (2) September 30, 2014 December 31, 2013 Net Debt to Adjusted EBITDA 5.10x 6.35x 4.74x Interest Coverage 4.40x 4.46x 3.85x Fixed Charge Coverage Ratio 3.34x 3.16x 2.76x Total Debt/Asset Value 43% 49% 52% Secured Debt/Asset Value 5% 5% 17% Unencumbered Assets/Unsecured Debt 251% 216% 163% (1) Key credit statistics (excluding Net Debt to Adjusted EBITDA) are calculated in accordance with the credit agreement relating to the revolving credit facility and the indentures relating to our unsecured senior notes. (2) Information assumes that all material investment, disposition and financing activity subsequent to September 30, 2014 was completed as of September 30, 2014.
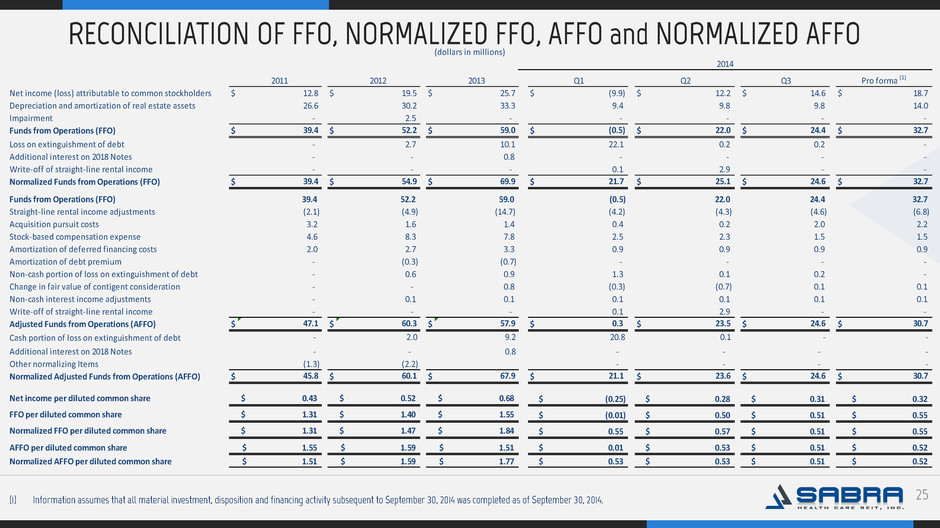
. 25 RECONCILIATION OF FFO, NORMALIZED FFO, AFFO and NORMALIZED AFFO Option One Option Three Ma (1) Information assumes that all material investment, disposition and financing activity subsequent to September 30, 2014 was completed as of September 30, 2014. 2011 2012 2013 Net income (loss) attributable to common stockholders $ 12.8 $ 19.5 $ 25.7 $ (9.9) $ 12.2 $ 14.6 $ 18.7 Depreciation and amortization of real estate assets 26.6 30.2 33.3 9.4 9.8 9.8 14.0 Impairment - 2.5 - - - - - Funds from Operations (FFO) $ 39.4 $ 52.2 $ 59.0 $ (0.5) $ 22.0 $ 24.4 $ 32.7 Loss on extinguishment of debt - 2.7 10.1 22.1 0.2 0.2 - Additional interest on 2018 Notes - - 0.8 - - - - Write-off of straight-line rental income - - - 0.1 2.9 - - Normalized Funds from Operations (FFO) $ 39.4 $ 54.9 $ 69.9 $ 21.7 $ 25.1 $ 24.6 $ 32.7 Funds from Operations (FFO) 39.4 52.2 59.0 (0.5) 22.0 24.4 32.7 Straight-line rental income adjustments (2.1) (4.9) (14.7) (4.2) (4.3) (4.6) (6.8) Acquisition pursuit costs 3.2 1.6 1.4 0.4 0.2 2.0 2.2 Stock-based compensation expense 4.6 8.3 7.8 2.5 2.3 1.5 1.5 Amortization of deferred financing costs 2.0 2.7 3.3 0.9 0.9 0.9 0.9 Amortization of debt premium - (0.3) (0.7) - - - - Non-cash portion of loss on extinguishment of debt - 0.6 0.9 1.3 0.1 0.2 - Change in fair value of contigent consideration - - 0.8 (0.3) (0.7) 0.1 0.1 Non-cash interest income adjustments - 0.1 0.1 0.1 0.1 0.1 0.1 Write-off of straight-line rental income - - - 0.1 2.9 - - Adjusted Funds from Operations (AFFO) $ 47.1 $ 60.3 $ 57.9 $ 0.3 $ 23.5 $ 24.6 $ 30.7 Cash portion of loss on extinguishment of debt - 2.0 9.2 20.8 0.1 - - Additional interest on 2018 Notes - - 0.8 - - - - Other normalizing Items (1.3) (2.2) - - - - Normalized Adjusted Funds from Operations (AFFO) $ 45.8 $ 60.1 $ 67.9 $ 21.1 $ 23.6 $ 24.6 $ 30.7 Net income per diluted common share $ 0.43 $ 0.52 $ 0.68 (0.25)$ 0.28$ 0.31$ 0.32$ FFO per diluted common share $ 1.31 $ 1.40 $ 1.55 (0.01)$ 0.50$ 0.51$ 0.55$ N rmalized FFO per diluted common share $ 1.31 $ 1.47 $ 1.84 0.55$ 0.57$ 0.51$ 0.55$ AFFO per diluted common share 1.55$ 1.59$ 1.51$ 0.01$ 0.53$ 0.51$ 0.52$ N rmalized AFFO per diluted common share 1.51$ 1.59$ 1.77$ 0.53$ 0.53$ 0.51$ 0.52$ Pro forma (1) (dollars in millions) Q3 Q2 Q1 2014
. 26 FORWARD LOOKING STATEMENTS Option One Option Three Ma This presentation contains “forward-looking” statements that may be identified, without limitation, by the use of “expects,” “believes,” “intends,” “should” or comparable terms or the negative thereof. Forward- looking statements in this presentation also include all statements regarding expected future financial position, results of operations, cash flows, liquidity, financing plans, business strategy, the expected amounts and timing of dividends, projected expenses and capital expenditures, competitive position, growth opportunities and potential investments, plans and objectives for future operations and compliance with and changes in governmental regulations. These statements are made as of the date hereof and are subject to known and unknown risks, uncertainties, assumptions and other factors—many of which are out of the Company’s control and difficult to forecast—that could cause actual results to differ materially from those set forth in or implied by our forward-looking statements. These risks and uncertainties include but are not limited to: our dependence on Genesis HealthCare LLC (“Genesis”) until we are able to further diversify our portfolio; our dependence on the operating success of our tenants; the dependence of our tenants on reimbursement from governmental and other third-party payors; the significant amount of and our ability to service our indebtedness; covenants in our debt agreements that may restrict our ability to make acquisitions, incur additional indebtedness and refinance indebtedness on favorable terms; increases in market interest rates; our ability to raise capital through equity and debt financings; the relatively illiquid nature of real estate investments; competitive conditions in our industry; the loss of key management personnel or other employees; the impact of litigation and rising insurance costs on the business of our tenants; uninsured or underinsured losses affecting our properties and the possibility of environmental compliance costs and liabilities; our ability to maintain our status as a REIT; compliance with REIT requirements and certain tax matters related to our status as a REIT; and other factors discussed from time to time in our news releases, public statements and/or filings with the Securities and Exchange Commission (the “SEC”), especially the “Risk Factors” sections of our Annual and Quarterly Reports on Forms 10-K and 10-Q. Forward-looking statements made in this presentation are not guarantees of future performance, events or results, and you should not place undue reliance on these forward-looking statements, which speak only as of the date hereof. The Company assumes no, and hereby disclaims any, obligation to update any of the foregoing or any other forward-looking statements as a result of new information or new or future developments, except as otherwise required by law. TENANT AND BORROWER INFORMATION This presentation includes information regarding our tenants that lease properties from us and our borrowers. The information related to these tenants and borrowers that is provided in this presentation has been provided by the tenants and borrowers. We have not independently verified this information. We have no reason to believe that such information is inaccurate in any material respect. We are providing this data for informational purposes only.
. 27 NON-GAAP FIANANCIAL MEASURES Option One Option Three Ma This presentation includes the following financial measures defined as non-GAAP financial measures by the SEC: funds from operations (“FFO”), Normalized FFO, adjusted FFO (“AFFO”), Normalized AFFO and Adjusted EBITDA (defined below). These measures may be different than non-GAAP financial measures used by other companies and the presentation of these measures is not intended to be considered in isolation or as a substitute for financial information prepared and presented in accordance with U.S. generally accepted accounting principles. FFO is calculated in accordance with The National Association of Real Estate Investment Trusts’ definition of “funds from operations,” and is defined as net income attributable to common stockholders (computed in accordance with GAAP), excluding gains or losses from real estate dispositions, plus real estate depreciation and amortization and impairment charges. Normalized FFO represents FFO adjusted for certain income and expense items that the Company does not believe are indicative of its ongoing operating results. AFFO is defined as FFO excluding non-cash revenues (including, but not limited to, straight-line rental income adjustments and write-offs and non-cash interest income adjustments), non-cash expenses (including, but not limited to, stock-based compensation expense, amortization of deferred financing costs and amortization of debt premiums/discounts), acquisition pursuit costs and changes in fair value of contingent consideration. Normalized AFFO represents AFFO adjusted for one-time start-up costs and certain income and expense items that the Company does not believe are indicative of its ongoing operating results. Earnings before interest, taxes, depreciation and amortization ("EBITDA") excluding the impact of stock based compensation expense under the Company's long-term equity award program ("Adjusted EBITDA") is an important non-GAAP supplemental measure of operating performance. Reconciliations of these non-GAAP financial measures to the GAAP financial measures we consider most comparable are provided in the reconciliations found in the Appendix of this presentation.
. 28 DEFINITIONS Option One Option Three Ma Acute Care Hospital. A facility designed to provide extended medical and rehabilitation care for patients who are clinically complex and have multiple acute or chronic conditions. EBITDAR Coverage. EBITDAR for the trailing 12 month periods prior to and including the period presented divided by the same period cash rent. Cash rent used for recently acquired facilities and facilities subject to lease restructuring is the first year rental rate. EBITDAR Coverage is a supplemental measure of an operator/tenant's ability to meet their cash rent and other obligations to the Company. However, its usefulness is limited by, among other things, the same factors that limit the usefulness of EBITDAR. All facility and tenant data are derived solely from information provided by operators/tenants and relevant guarantors without independent verification by the Company. All such data is presented one quarter in arrears. The Company excludes the impact of strategic disposition candidates and facilities leased to RIDEA-compliant joint venture tenants. The Company only includes EBITDAR Coverage for Stabilized Facilities acquired beginning in the quarter subsequent to the acquisition date and only for periods when the property was operated subject to a lease with the Company. EBITDAR Coverage for facilities with new tenants/operators are only included in periods subsequent to the Company's acquisition of the facilities. EBITDAR Coverage is not presented for tenants with significant corporate guarantees. EBITDARM Coverage. EBITDARM for the trailing 12 month periods prior to and including the period presented divided by the same period cash rent. Cash rent used for recently acquired facilities and facilities subject to lease restructurings is the first year rental rate. EBITDARM coverage is a supplemental measure of a property's ability to generate cash flows for the operator/tenant (not the Company) to meet the operator's/tenant's related cash rent and other obligations to the Company. However, its usefulness is limited by, among other things, the same factors that limit the usefulness of EBITDARM. All facility and tenant data are derived solely from information provided by operators/tenants and relevant guarantors without independent verification by the Company. All such data is presented one quarter in arrears. The Company excludes the impact of strategic disposition candidates and facilities leased to RIDEA-compliant joint venture tenants. The Company only includes EBITDARM Coverage for Stabilized Facilities acquired beginning in the quarter subsequent to the acquisition date and only for periods when the property was operated subject to a lease with the Company. EBITDARM Coverage for facilities with new tenants/operators are only included in periods subsequent to the Company's acquisition of the facilities. EBITDARM Coverage is not presented for tenants with significant corporate guarantees. Fixed Charge Coverage. EBITDAR (including adjustments for one-time and pro forma items) for the period indicated (one quarter in arrears) for all operations of any entities that guarantee the tenants' lease obligations to the Company divided by the same period cash rent expense, interest expense and mandatory principal payments for operations of any entity that guarantees the tenants' lease obligation to the Company. Fixed Charge Coverage is a supplemental measure of a guarantor's ability to meet the operator/tenant's cash rent and other obligations to the Company should the operator/tenant be unable to do so itself. However, its usefulness is limited by, among other things, the same factors that limit the usefulness of EBITDAR. Fixed Charge Coverage is calculated by the Company as described above based on information provided by guarantors without independent verification by the Company and may differ from similar metrics calculated by the guarantors. .
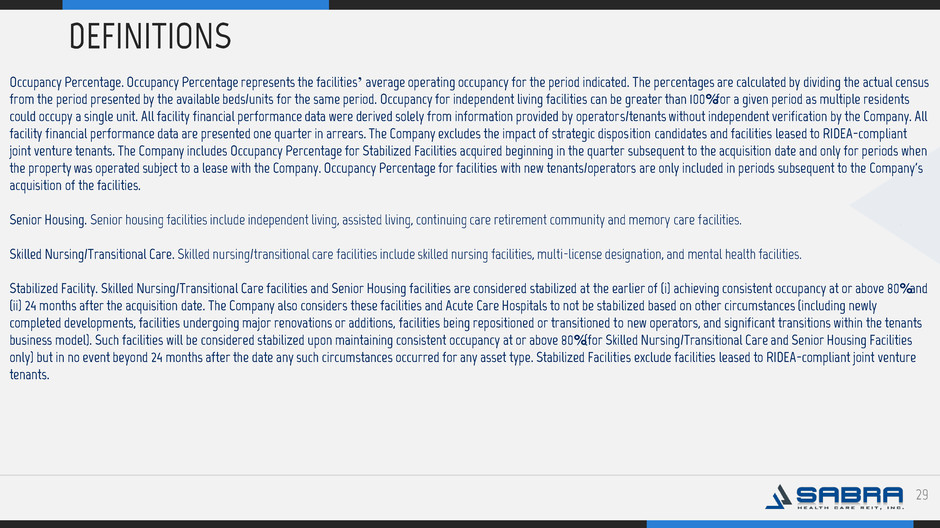
. 29 DEFINITIONS Option One Ma Occupancy Percentage. Occupancy Percentage represents the facilities’ average operating occupancy for the period indicated. The percentages are calculated by dividing the actual census from the period presented by the available beds/units for the same period. Occupancy for independent living facilities can be greater than 100% for a given period as multiple residents could occupy a single unit. All facility financial performance data were derived solely from information provided by operators/tenants without independent verification by the Company. All facility financial performance data are presented one quarter in arrears. The Company excludes the impact of strategic disposition candidates and facilities leased to RIDEA-compliant joint venture tenants. The Company includes Occupancy Percentage for Stabilized Facilities acquired beginning in the quarter subsequent to the acquisition date and only for periods when the property was operated subject to a lease with the Company. Occupancy Percentage for facilities with new tenants/operators are only included in periods subsequent to the Company's acquisition of the facilities. Senior Housing. Senior housing facilities include independent living, assisted living, continuing care retirement community and memory care facilities. Skilled Nursing/Transitional Care. Skilled nursing/transitional care facilities include skilled nursing facilities, multi-license designation, and mental health facilities. Stabilized Facility. Skilled Nursing/Transitional Care facilities and Senior Housing facilities are considered stabilized at the earlier of (i) achieving consistent occupancy at or above 80% and (ii) 24 months after the acquisition date. The Company also considers these facilities and Acute Care Hospitals to not be stabilized based on other circumstances (including newly completed developments, facilities undergoing major renovations or additions, facilities being repositioned or transitioned to new operators, and significant transitions within the tenants business model). Such facilities will be considered stabilized upon maintaining consistent occupancy at or above 80% (for Skilled Nursing/Transitional Care and Senior Housing Facilities only) but in no event beyond 24 months after the date any such circumstances occurred for any asset type. Stabilized Facilities exclude facilities leased to RIDEA-compliant joint venture tenants.
