Attached files
| file | filename |
|---|---|
| 8-K - INDEPENDENT BANK CORP 8-K 1-23-2015 - INDEPENDENT BANK CORP /MI/ | form8k.htm |
| EX-99.1 - EXHIBIT 99.1 - INDEPENDENT BANK CORP /MI/ | ex99_1.htm |
| EX-99.2 - EXHIBIT 99.2 - INDEPENDENT BANK CORP /MI/ | ex99_2.htm |
Exhibit 99.3
INDEPENDENT BANK CORPORATIONEARNINGS CONFERENCE CALL4TH QUARTER - 2014 January 23, 2015

CAUTIONARY NOTE REGARDING FORWARD-LOOKING STATEMENTS This presentation contains forward-looking statements within the meaning of the Private Securities Litigation Reform Act of 1995, including statements of goals, intentions, and expectations as to future trends, plans, events, or results of Independent Bank Corporation’s operations and policies, including, but not limited to, Independent Bank Corporation’s outlook on earnings and the sufficiency of the allowance for loan losses, and statements regarding asset quality, projections of future revenue, earnings or other measures of economic performance, Independent Bank Corporation’s plans and expectations regarding non-performing assets, business opportunities, and general economic conditions. Forward-looking statements include expressions such as “will,” “may,” “should,” “believe,” “expect,” “forecast,” “anticipate,” “estimate,” “project,” “intend,” “likely,” “optimistic” and “plan,” and similar words or phrases, which are necessarily statements of belief as to expected outcomes of future events. These statements are based on current and anticipated economic conditions, nationally and in Independent Bank Corporation’s markets, interest rates and interest rate policy, competitive factors, and other conditions which by their nature are not susceptible to accurate forecast and are subject to significant uncertainty. Because of these uncertainties and the assumptions on which this presentation and the forward-looking statements are based, actual future operations and results may differ materially from those indicated in this presentation. For a discussion of certain factors, risks and uncertainties which could cause actual future operations and results to differ from estimates and projections discussed in these forward-looking statements, please read the “Risk Factors” section in Independent Bank Corporation’s 2013 Annual Report on Form 10-K. You should not place undue reliance on any such forward-looking statement. These forward-looking statements are not guarantees of future performance. Independent Bank Corporation does not undertake to publicly revise or update forward-looking statements in this presentation to reflect events or circumstances that arise after the date of this presentation. 2

Agenda4th Quarter 2014 Earnings Conference Call Formal Remarks.William B. (Brad) Kessel, President and Chief Executive OfficerRobert N. Shuster, Executive Vice President and Chief Financial OfficerQuestion and Answer session.Closing Remarks.Note: This presentation is available at www.IndependentBank.com in the Investor Relations area under the “Presentations” tab. 3
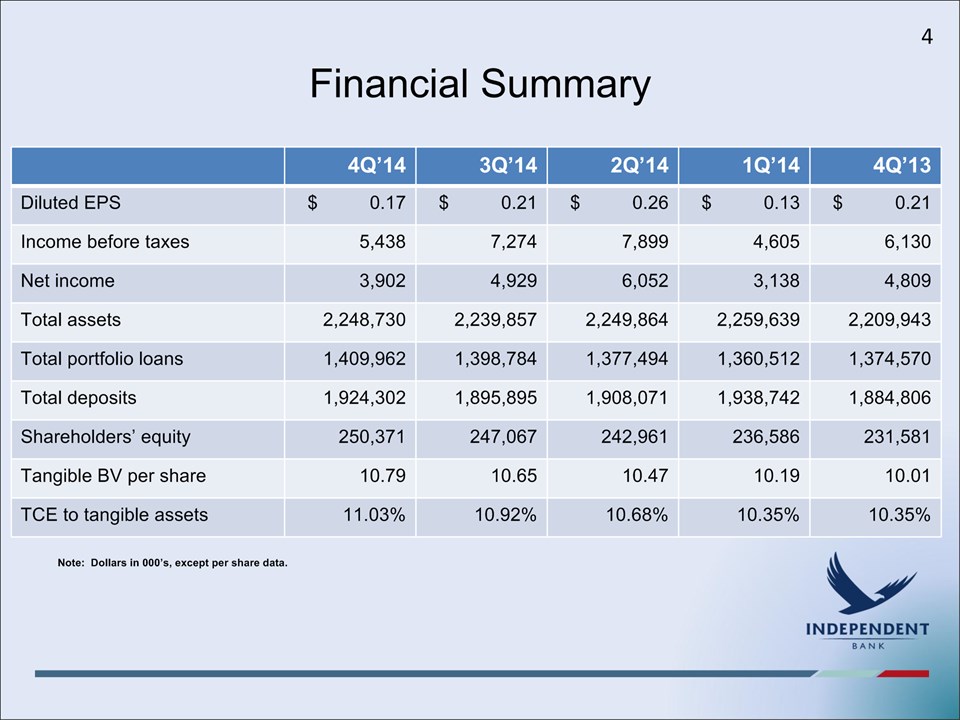
Financial Summary 4Q’14 3Q’14 2Q’14 1Q’14 4Q’13 Diluted EPS $ 0.17 $ 0.21 $ 0.26 $ 0.13 $ 0.21 Income before taxes 5,438 7,274 7,899 4,605 6,130 Net income 3,902 4,929 6,052 3,138 4,809 Total assets 2,248,730 2,239,857 2,249,864 2,259,639 2,209,943 Total portfolio loans 1,409,962 1,398,784 1,377,494 1,360,512 1,374,570 Total deposits 1,924,302 1,895,895 1,908,071 1,938,742 1,884,806 Shareholders’ equity 250,371 247,067 242,961 236,586 231,581 Tangible BV per share 10.79 10.65 10.47 10.19 10.01 TCE to tangible assets 11.03% 10.92% 10.68% 10.35% 10.35% Note: Dollars in 000’s, except per share data. 4
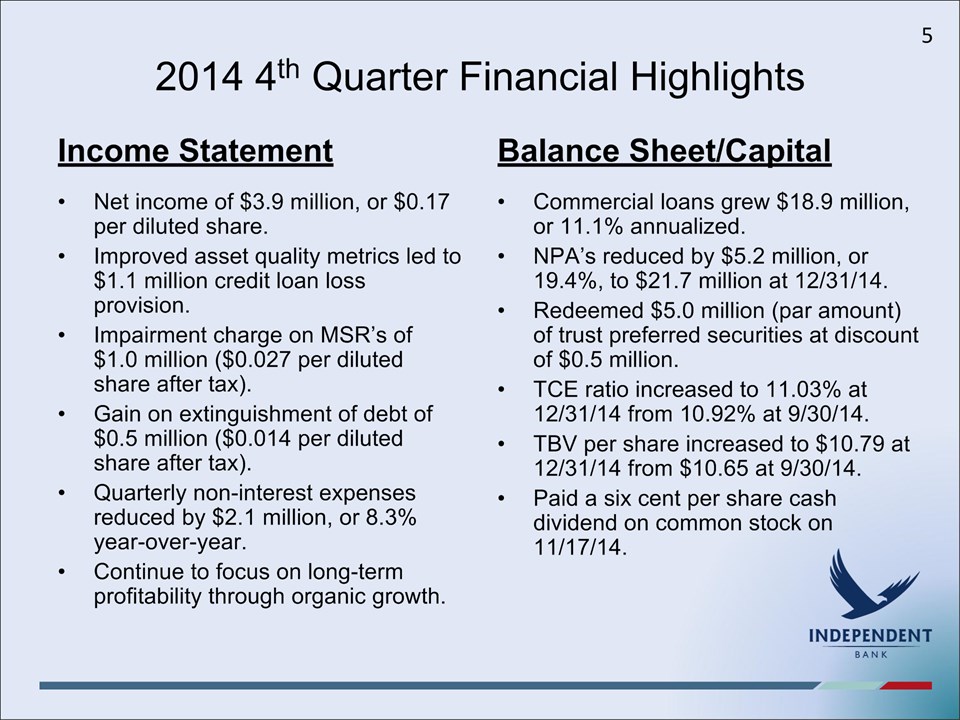
2014 4th Quarter Financial Highlights Income Statement Net income of $3.9 million, or $0.17 per diluted share.Improved asset quality metrics led to $1.1 million credit loan loss provision.Impairment charge on MSR’s of $1.0 million ($0.027 per diluted share after tax).Gain on extinguishment of debt of $0.5 million ($0.014 per diluted share after tax).Quarterly non-interest expenses reduced by $2.1 million, or 8.3% year-over-year.Continue to focus on long-term profitability through organic growth. Balance Sheet/Capital Commercial loans grew $18.9 million, or 11.1% annualized.NPA’s reduced by $5.2 million, or 19.4%, to $21.7 million at 12/31/14.Redeemed $5.0 million (par amount) of trust preferred securities at discount of $0.5 million.TCE ratio increased to 11.03% at 12/31/14 from 10.92% at 9/30/14. TBV per share increased to $10.79 at 12/31/14 from $10.65 at 9/30/14.Paid a six cent per share cash dividend on common stock on 11/17/14. 5

2014 Annual Financial Highlights Income Statement Net income of $18.0 million, or $0.77 per diluted share.Pretax earnings increased by $2.6 million, or 11.3%, year-over-year.Improved asset quality metrics led to $3.1 million credit loan loss provision. Loan net charge-offs declined by 59.8% year-over year.Interchange income increased by $0.8 million, or 10.9%, year-over-year due primarily to impact of new debit card agreement.Non-interest expenses reduced by $14.2 million, or 13.6% year-over-year. Balance Sheet/Capital Total portfolio loans grew $35.4 million, or 2.6% year-over-year (led by commercial loan growth of $55.7 million, or 8.8%).NPA’s reduced $14.5 million, or 40.1% year-over-year. NPA’s equaled 0.96% of total assets at 12/31/14.Total deposits grew $39.5 million, or 2.1% year-over-year. TBV per share increased by 7.8% to $10.79 at 12/31/14, from $10.01 at 12/31/13. 6
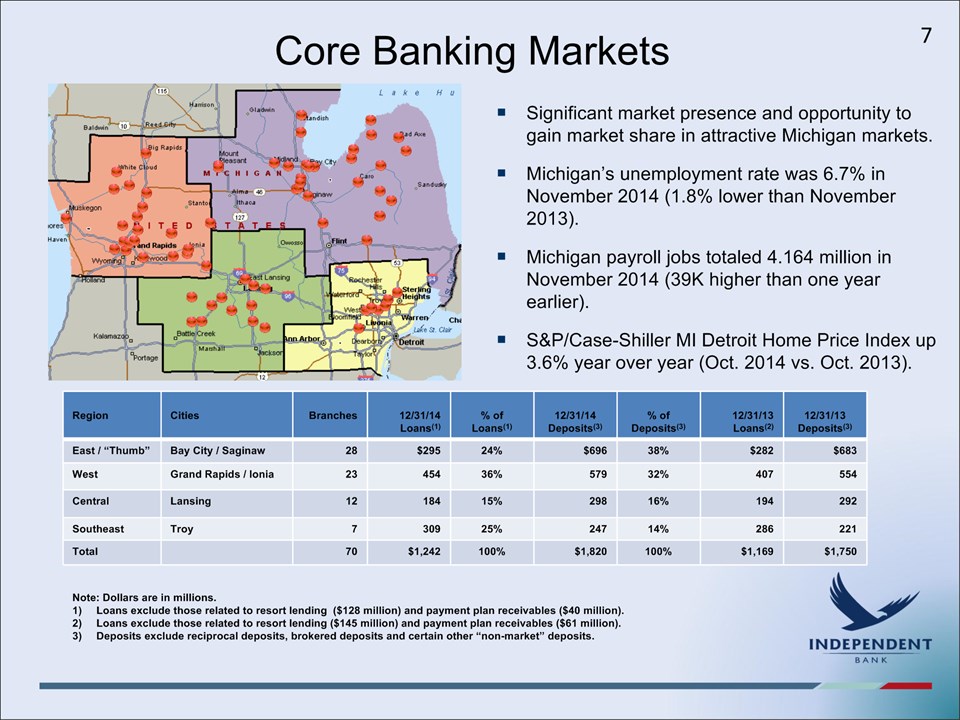
Core Banking Markets Significant market presence and opportunity to gain market share in attractive Michigan markets. Michigan’s unemployment rate was 6.7% in November 2014 (1.8% lower than November 2013).Michigan payroll jobs totaled 4.164 million in November 2014 (39K higher than one year earlier).S&P/Case-Shiller MI Detroit Home Price Index up 3.6% year over year (Oct. 2014 vs. Oct. 2013). Region Cities Branches 12/31/14 Loans(1) % ofLoans(1) 12/31/14Deposits(3) % of Deposits(3) 12/31/13 Loans(2) 12/31/13 Deposits(3) East / “Thumb” Bay City / Saginaw 28 $295 24% $696 38% $282 $683 West Grand Rapids / Ionia 23 454 36% 579 32% 407 554 Central Lansing 12 184 15% 298 16% 194 292 Southeast Troy 7 309 25% 247 14% 286 221 Total 70 $1,242 100% $1,820 100% $1,169 $1,750 Note: Dollars are in millions.Loans exclude those related to resort lending ($128 million) and payment plan receivables ($40 million).Loans exclude those related to resort lending ($145 million) and payment plan receivables ($61 million). Deposits exclude reciprocal deposits, brokered deposits and certain other “non-market” deposits. 7
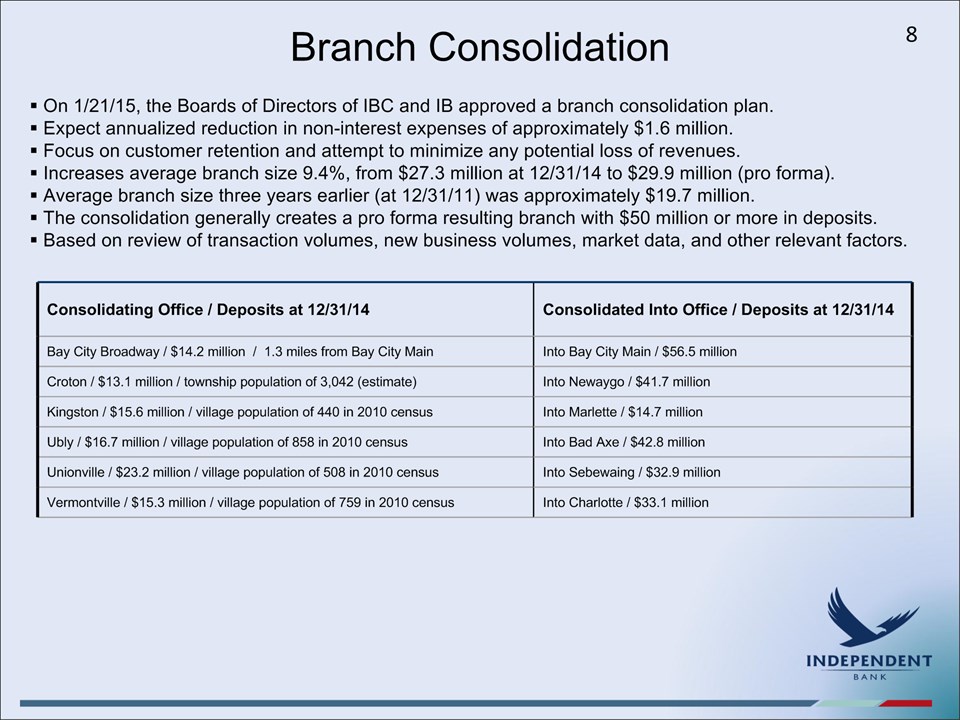
Branch Consolidation Consolidating Office / Deposits at 12/31/14 Consolidated Into Office / Deposits at 12/31/14 Bay City Broadway / $14.2 million / 1.3 miles from Bay City Main Into Bay City Main / $56.5 million Croton / $13.1 million / township population of 3,042 (estimate) Into Newaygo / $41.7 million Kingston / $15.6 million / village population of 440 in 2010 census Into Marlette / $14.7 million Ubly / $16.7 million / village population of 858 in 2010 census Into Bad Axe / $42.8 million Unionville / $23.2 million / village population of 508 in 2010 census Into Sebewaing / $32.9 million Vermontville / $15.3 million / village population of 759 in 2010 census Into Charlotte / $33.1 million 8 On 1/21/15, the Boards of Directors of IBC and IB approved a branch consolidation plan. Expect annualized reduction in non-interest expenses of approximately $1.6 million. Focus on customer retention and attempt to minimize any potential loss of revenues. Increases average branch size 9.4%, from $27.3 million at 12/31/14 to $29.9 million (pro forma). Average branch size three years earlier (at 12/31/11) was approximately $19.7 million. The consolidation generally creates a pro forma resulting branch with $50 million or more in deposits. Based on review of transaction volumes, new business volumes, market data, and other relevant factors.
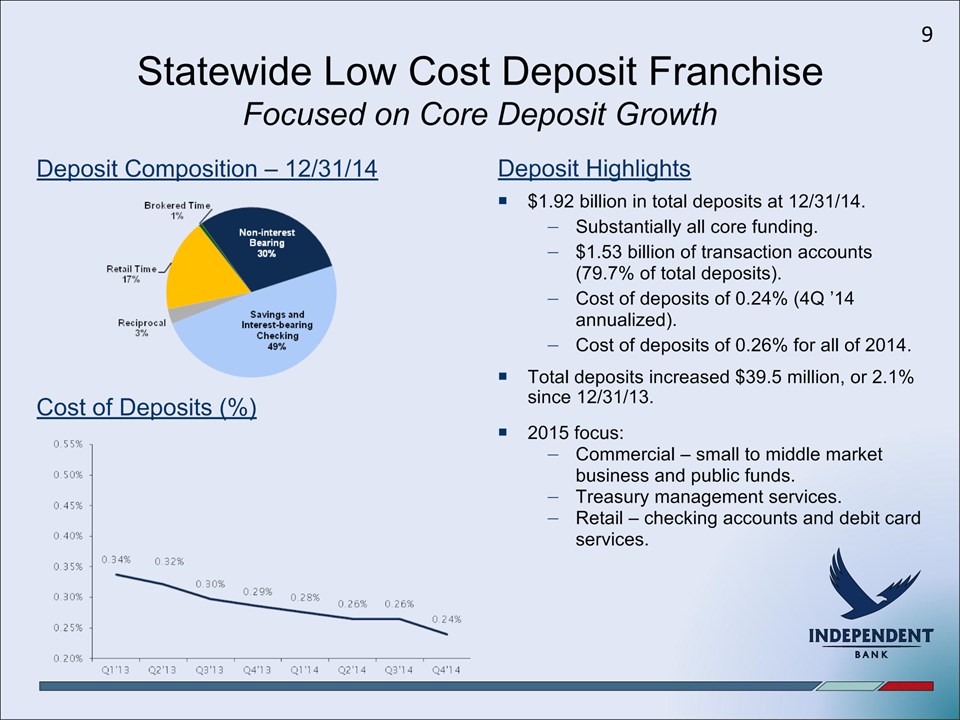
Statewide Low Cost Deposit FranchiseFocused on Core Deposit Growth $1.92 billion in total deposits at 12/31/14.Substantially all core funding.$1.53 billion of transaction accounts (79.7% of total deposits).Cost of deposits of 0.24% (4Q ’14 annualized).Cost of deposits of 0.26% for all of 2014.Total deposits increased $39.5 million, or 2.1% since 12/31/13.2015 focus:Commercial – small to middle market business and public funds.Treasury management services.Retail – checking accounts and debit card services. Cost of Deposits (%) Deposit Composition – 12/31/14 Deposit Highlights 9

Diversified Loan PortfolioFocused on High Quality Growth Three consecutive quarters of net loan growth in 2014.$1.43 billion in total loans at 12/31/14 (including $23.7 million of loans held for sale).2014 lending results include:Commercial loan growth of $55.7 million, or 8.8%. Line usage at 48.5% 4Q’14 vs. 47.1% 4Q’13.Consumer installment loan growth of $14.3 million, or 7.5%.Residential mortgage loan originations of $265.5 million and loan sales of $223.5 million (net gains of $5.6 million).2015 focus:Commercial – businesses with $1 million to $50 million in annual sales.Consumer – through branch network, internet and indirect channels.Residential mortgage – purchase money (both salable and portfolio) and QRM and home equity lending opportunities. Current low interest rates could spur higher refinances. Loan Composition – 12/31/14 Yield on Loans (%) Lending Highlights 10
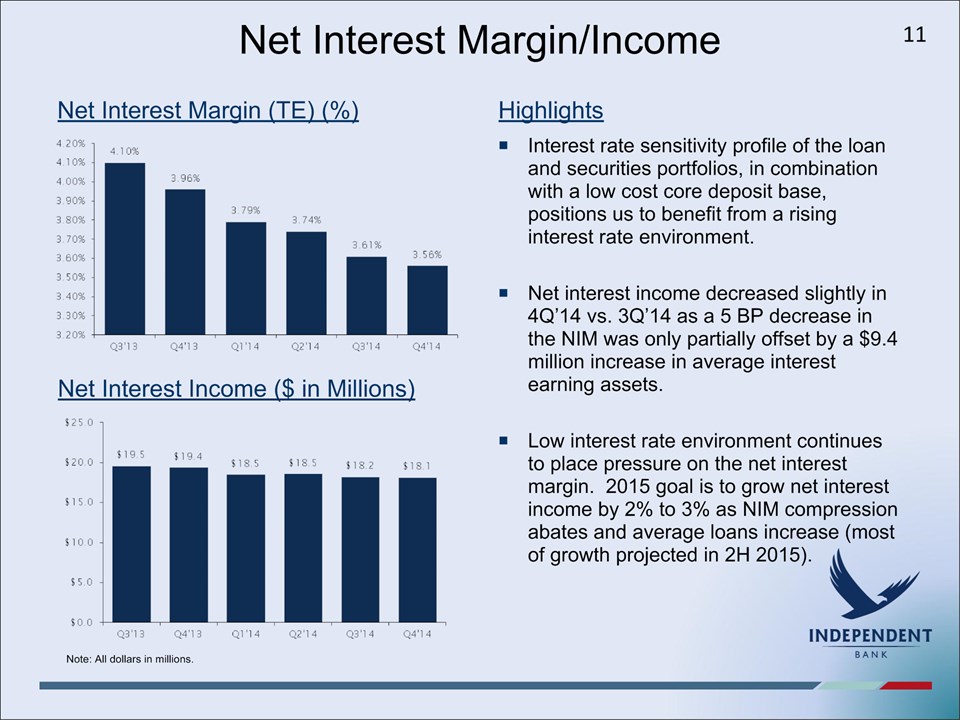
Net Interest Margin/Income Interest rate sensitivity profile of the loan and securities portfolios, in combination with a low cost core deposit base, positions us to benefit from a rising interest rate environment.Net interest income decreased slightly in 4Q’14 vs. 3Q’14 as a 5 BP decrease in the NIM was only partially offset by a $9.4 million increase in average interest earning assets.Low interest rate environment continues to place pressure on the net interest margin. 2015 goal is to grow net interest income by 2% to 3% as NIM compression abates and average loans increase (most of growth projected in 2H 2015). Net Interest Margin (TE) (%) Highlights Net Interest Income ($ in Millions) Note: All dollars in millions. 11
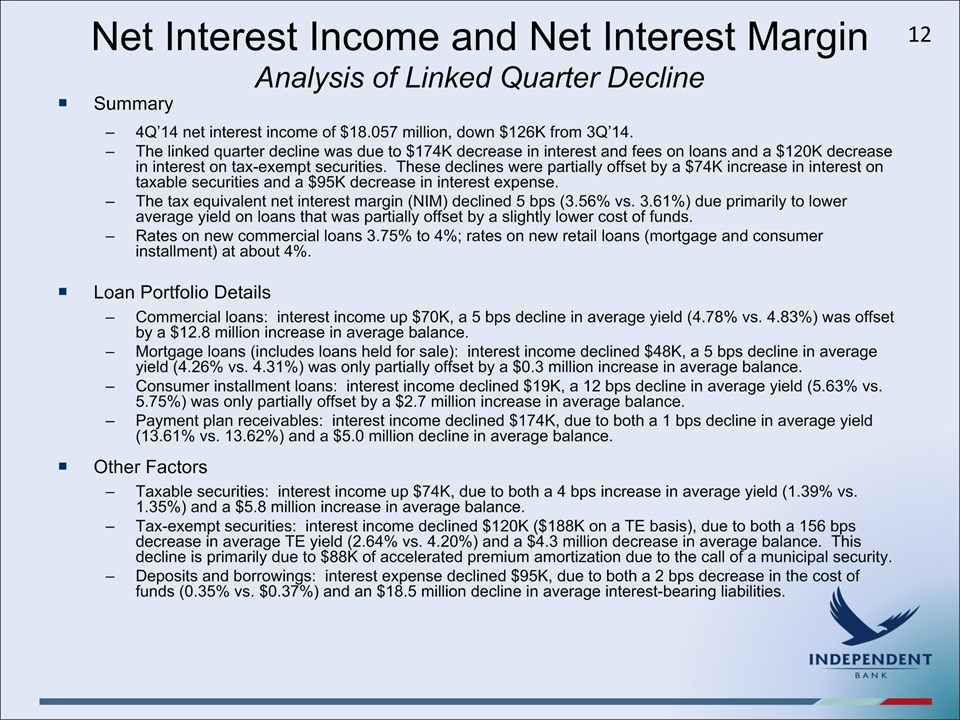
Net Interest Income and Net Interest MarginAnalysis of Linked Quarter Decline Summary4Q’14 net interest income of $18.057 million, down $126K from 3Q’14. The linked quarter decline was due to $174K decrease in interest and fees on loans and a $120K decrease in interest on tax-exempt securities. These declines were partially offset by a $74K increase in interest on taxable securities and a $95K decrease in interest expense.The tax equivalent net interest margin (NIM) declined 5 bps (3.56% vs. 3.61%) due primarily to lower average yield on loans that was partially offset by a slightly lower cost of funds.Rates on new commercial loans 3.75% to 4%; rates on new retail loans (mortgage and consumer installment) at about 4%.Loan Portfolio DetailsCommercial loans: interest income up $70K, a 5 bps decline in average yield (4.78% vs. 4.83%) was offset by a $12.8 million increase in average balance.Mortgage loans (includes loans held for sale): interest income declined $48K, a 5 bps decline in average yield (4.26% vs. 4.31%) was only partially offset by a $0.3 million increase in average balance.Consumer installment loans: interest income declined $19K, a 12 bps decline in average yield (5.63% vs. 5.75%) was only partially offset by a $2.7 million increase in average balance. Payment plan receivables: interest income declined $174K, due to both a 1 bps decline in average yield (13.61% vs. 13.62%) and a $5.0 million decline in average balance. Other FactorsTaxable securities: interest income up $74K, due to both a 4 bps increase in average yield (1.39% vs. 1.35%) and a $5.8 million increase in average balance.Tax-exempt securities: interest income declined $120K ($188K on a TE basis), due to both a 156 bps decrease in average TE yield (2.64% vs. 4.20%) and a $4.3 million decrease in average balance. This decline is primarily due to $88K of accelerated premium amortization due to the call of a municipal security.Deposits and borrowings: interest expense declined $95K, due to both a 2 bps decrease in the cost of funds (0.35% vs. $0.37%) and an $18.5 million decline in average interest-bearing liabilities. 12

Non-interest Income 2014 Non-interest Income Breakout Highlights Diverse sources of non-interest income which totaled $9.2 million in 4Q’14.2014 total non-interest income represents approximately 34.6% of total revenue (net interest income and non-interest income).New debit card brand agreement executed in January 2014 (expected to increase net interchange revenues by approximately $1 million annually). Debit card conversion took place from June to September 2014. 4Q’14 interchange revenue up $0.35 million ($1.4 million annualized) compared to 4Q’13.4Q’14 mortgage loan servicing includes a $1.0 million impairment charge on MSR’s compared to a $0.7 million recovery in 4Q’13. At 12/31/14 mortgage loans serviced for others totaled $1.66 billion with a weighted average coupon rate of 4.44%. Non-interest Income Trends 13

Non-interest Expense Non-interest Expense ($ in Millions) Highlights Full-year total non-interest expenses declined $14.2 million, or 13.6%, in 2014 as compared to 2013. Q4’14 total non-interest expenses increased over Q3’14 due primarily to an increase in compensation and benefits.Target for 2015 is total non-interest expenses at $21 million to $22 million per quarter (with an average at $21.3 million) – representing a 5.4% reduction over 2014 actual.Compensation and benefits increased $0.7 million in 4Q’14 compared to 3Q’14 due primarily to an increase in performance-based compensation. This increase is due to timing of accrual and when certain incentive targets were reached (such as decline in non-performing assets). On a full-year basis performance-based compensation declined (see below) in 2014 as compared to 2013.On a full-year basis, compensation and benefits declined $0.7 million in 2014. Regular compensation increased $0.3 million due to lower deferral of direct loan origination costs ($0.6 million) offset by lower salaries ($0.3 million) due to staffing reductions (average FTE’s declined 3.8%). Performance-based compensation decreased $1.4 million ($0.8 million in incentive-based compensation, $0.3 million in loan production based compensation and $0.3 million for the ESOP). Payroll taxes and employee benefits increased $0.3 million due primarily to increased health care costs. Note: Efficiency ratio is defined as non-interest expense, excluding amortization of intangibles and non-recurring expense, as a percent of net interest income and non-interest income, excluding realized gains on securities and non-recurring items. 14
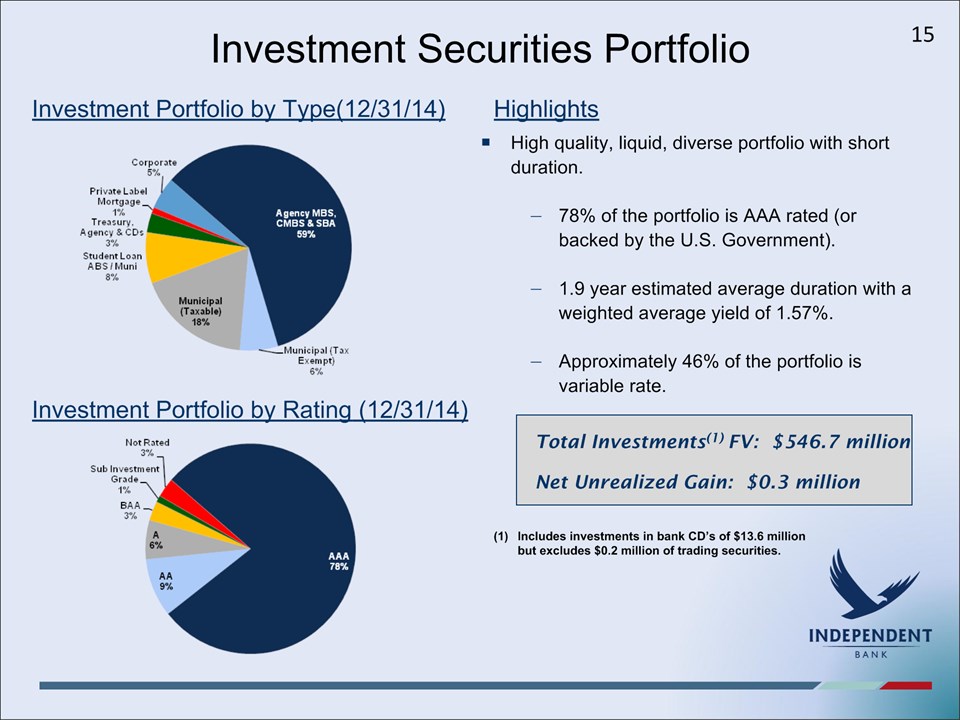
Investment Securities Portfolio High quality, liquid, diverse portfolio with short duration.78% of the portfolio is AAA rated (or backed by the U.S. Government).1.9 year estimated average duration with a weighted average yield of 1.57%.Approximately 46% of the portfolio is variable rate. Total Investments(1) FV : $546.7 millionNet Unrealized Gain: $0.3 million Includes investments in bank CD’s of $13.6 million but excludes $0.2 million of trading securities. Investment Portfolio by Type (12/31/14) Investment Portfolio by Rating (12/31/14) Highlights 15
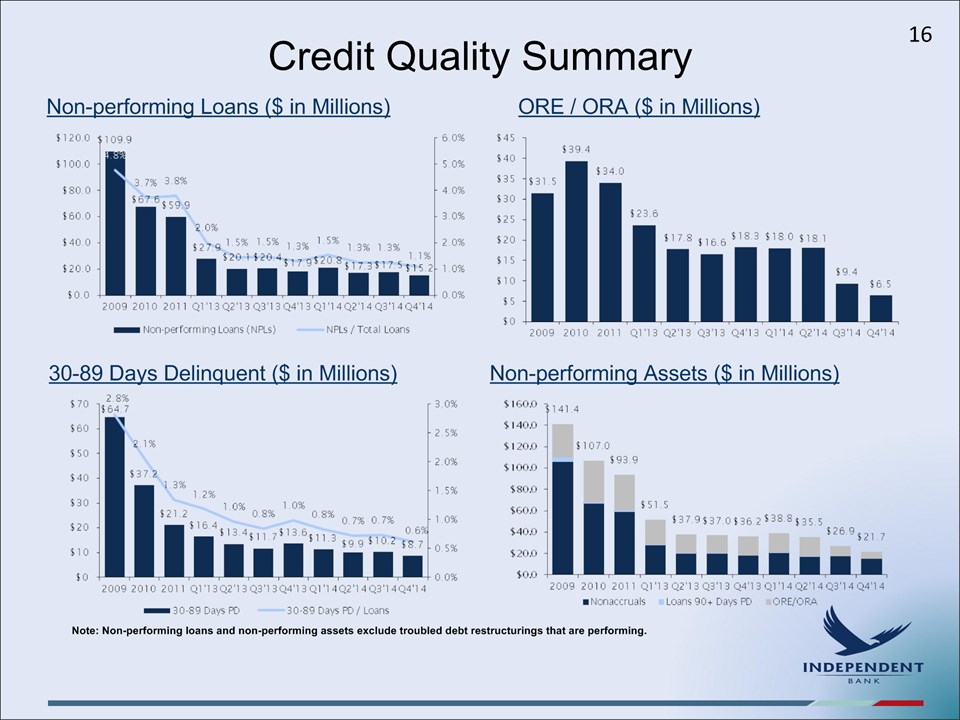
Credit Quality Summary Non-performing Loans ($ in Millions) 30-89 Days Delinquent ($ in Millions) ORE / ORA ($ in Millions) Non-performing Assets ($ in Millions) Note: Non-performing loans and non-performing assets exclude troubled debt restructurings that are performing. 16
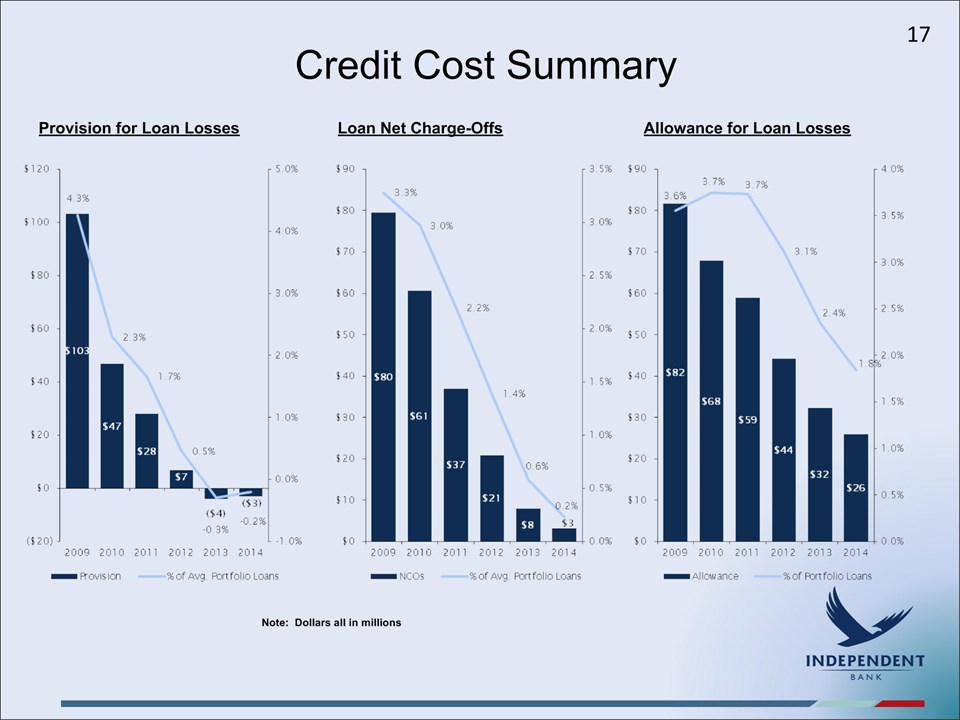
Credit Cost Summary 17 Provision for Loan Losses Loan Net Charge-Offs Allowance for Loan Losses Note: Dollars all in millions
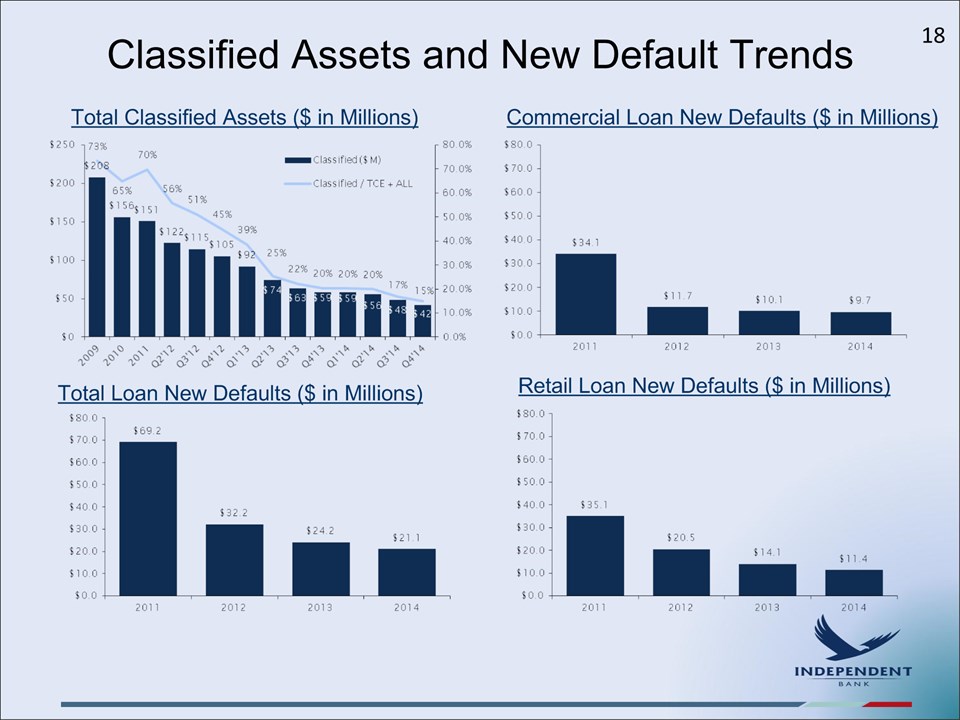
Classified Assets and New Default Trends Total Classified Assets ($ in Millions) Commercial Loan New Defaults ($ in Millions) Total Loan New Defaults ($ in Millions) Retail Loan New Defaults ($ in Millions) 18
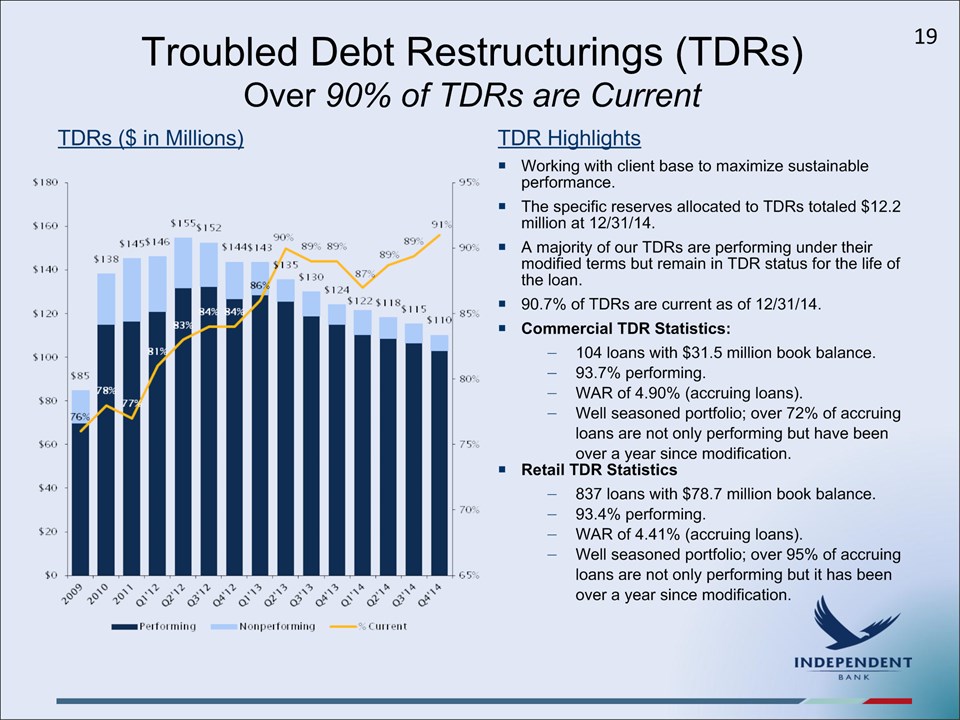
Troubled Debt Restructurings (TDRs)Over 90% of TDRs are Current Working with client base to maximize sustainable performance.The specific reserves allocated to TDRs totaled $12.2 million at 12/31/14.A majority of our TDRs are performing under their modified terms but remain in TDR status for the life of the loan.90.7% of TDRs are current as of 12/31/14.Commercial TDR Statistics:104 loans with $31.5 million book balance.93.7% performing.WAR of 4.90% (accruing loans).Well seasoned portfolio; over 72% of accruing loans are not only performing but have been over a year since modification.Retail TDR Statistics837 loans with $78.7 million book balance.93.4% performing.WAR of 4.41% (accruing loans).Well seasoned portfolio; over 95% of accruing loans are not only performing but it has been over a year since modification. TDRs ($ in Millions) TDR Highlights 19
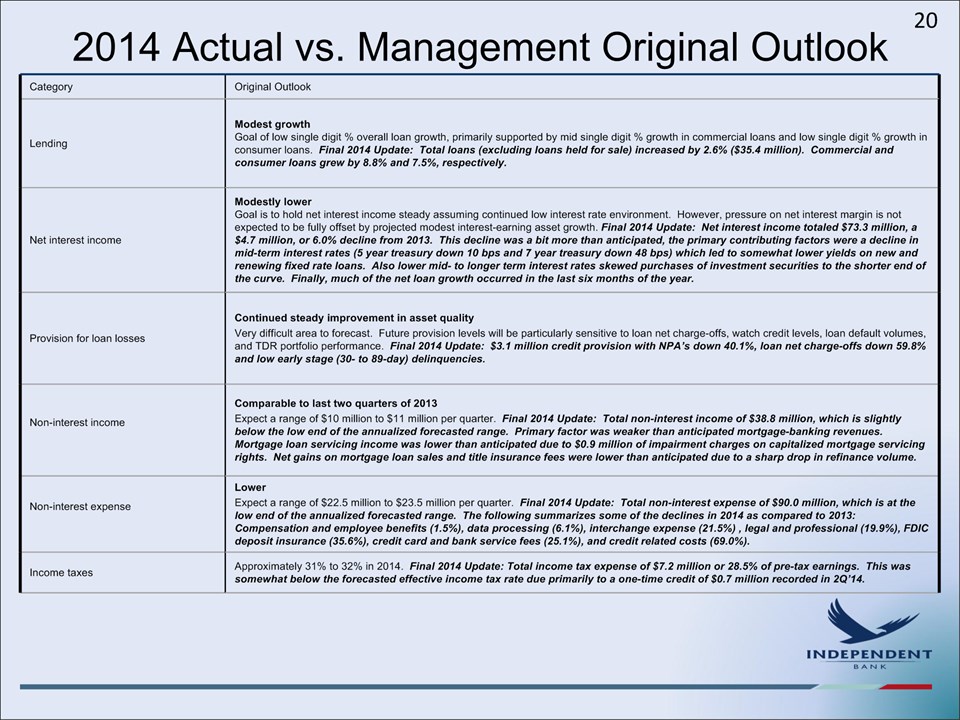
2014 Actual vs. Management Original Outlook Category Original Outlook Lending Modest growthGoal of low single digit % overall loan growth, primarily supported by mid single digit % growth in commercial loans and low single digit % growth in consumer loans. Final 2014 Update: Total loans (excluding loans held for sale) increased by 2.6% ($35.4 million). Commercial and consumer loans grew by 8.8% and 7.5%, respectively. Net interest income Modestly lowerGoal is to hold net interest income steady assuming continued low interest rate environment. However, pressure on net interest margin is not expected to be fully offset by projected modest interest-earning asset growth. Final 2014 Update: Net interest income totaled $73.3 million, a $4.7 million, or 6.0% decline from 2013. This decline was a bit more than anticipated, the primary contributing factors were a decline in mid-term interest rates (5 year treasury down 10 bps and 7 year treasury down 48 bps) which led to somewhat lower yields on new and renewing fixed rate loans. Also lower mid- to longer term interest rates skewed purchases of investment securities to the shorter end of the curve. Finally, much of the net loan growth occurred in the last six months of the year. Provision for loan losses Continued steady improvement in asset qualityVery difficult area to forecast. Future provision levels will be particularly sensitive to loan net charge-offs, watch credit levels, loan default volumes, and TDR portfolio performance. Final 2014 Update: $3.1 million credit provision with NPA’s down 40.1%, loan net charge-offs down 59.8% and low early stage (30- to 89-day) delinquencies. Non-interest income Comparable to last two quarters of 2013Expect a range of $10 million to $11 million per quarter. Final 2014 Update: Total non-interest income of $38.8 million, which is slightly below the low end of the annualized forecasted range. Primary factor was weaker than anticipated mortgage-banking revenues. Mortgage loan servicing income was lower than anticipated due to $0.9 million of impairment charges on capitalized mortgage servicing rights. Net gains on mortgage loan sales and title insurance fees were lower than anticipated due to a sharp drop in refinance volume. Non-interest expense LowerExpect a range of $22.5 million to $23.5 million per quarter. Final 2014 Update: Total non-interest expense of $90.0 million, which is at the low end of the annualized forecasted range. The following summarizes some of the declines in 2014 as compared to 2013: Compensation and employee benefits (1.5%), data processing (6.1%), interchange expense (21.5%) , legal and professional (19.9%), FDIC deposit insurance (35.6%), credit card and bank service fees (25.1%), and credit related costs (69.0%). Income taxes Approximately 31% to 32% in 2014. Final 2014 Update: Total income tax expense of $7.2 million or 28.5% of pre-tax earnings. This was somewhat below the forecasted effective income tax rate due primarily to a one-time credit of $0.7 million recorded in 2Q’14. 20

Management 2015 Outlook(1) Category Outlook Lending Modest growthGoal of mid single digit % overall loan growth, primarily supported by mid single digit % growth in commercial loans and consumer loans with modest increases in mortgage loans and payment plan receivables. Expect much of this growth to occur in the last three quarters of 2015. This growth forecast also assumes a stable to somewhat improving Michigan economy. Net interest income Modestly higherGoal of low single digit % increase in net interest income over 2014. Pressure on the net interest margin is expected to abate by mid-2015. Growth in net interest income over 4Q’14 level expected by 2Q’15 with continued acceleration in last half of 2015 due primarily to growth in loans as described above. Forecast assumes short-term interest rates remain at current levels until 4Q’15 (modest 0.25% increase in the federal funds rates expected) and mid- to long-term rates up slightly over year end 2014 levels. Provision for loan losses Steady to slightly improving asset quality metricsVery difficult area to forecast. Future provision levels will be particularly sensitive to loan net charge-offs, watch credit levels, loan default volumes, and TDR portfolio performance. The allowance as a percentage of total loans was at 1.84% at 12/31/14. Any credit provision in 2015 would largely be a function of recoveries of previously charged-off loans, pay-downs in the TDR portfolio (permitting the release of specific reserves) and low levels of new loan defaults. Non-interest income Forecasted quarterly range of $9.5 million to $10 million with total for the year similar to 2014Expect mortgage-banking revenues and mortgage lending volumes in 2015 to be similar to 2014. Expect modestly lower service charges on deposits (continued decline in NSF occurrences and related fees) and lower other non-interest income (due to decline in rental income on ORE properties). Expect higher interchange revenue (due to full year under new debit card brand agreement). Non-interest expense Forecasted quarterly range of $21 to $22 million with full year low to mid-single digit % decline vs. 2014The expected decline in non-interest expenses compared to 2014 is primarily concentrated in compensation and benefits, occupancy and equipment and loan and collection costs. This reflects the branch consolidation, staffing reductions and reduced levels of non-performing assets and watch credits. The reduced expenses are expected to be concentrated in the last three quarters of 2015. Income taxes Approximately 31% to 32% in 2015. 21 (1) Outlook as of 1/22/15
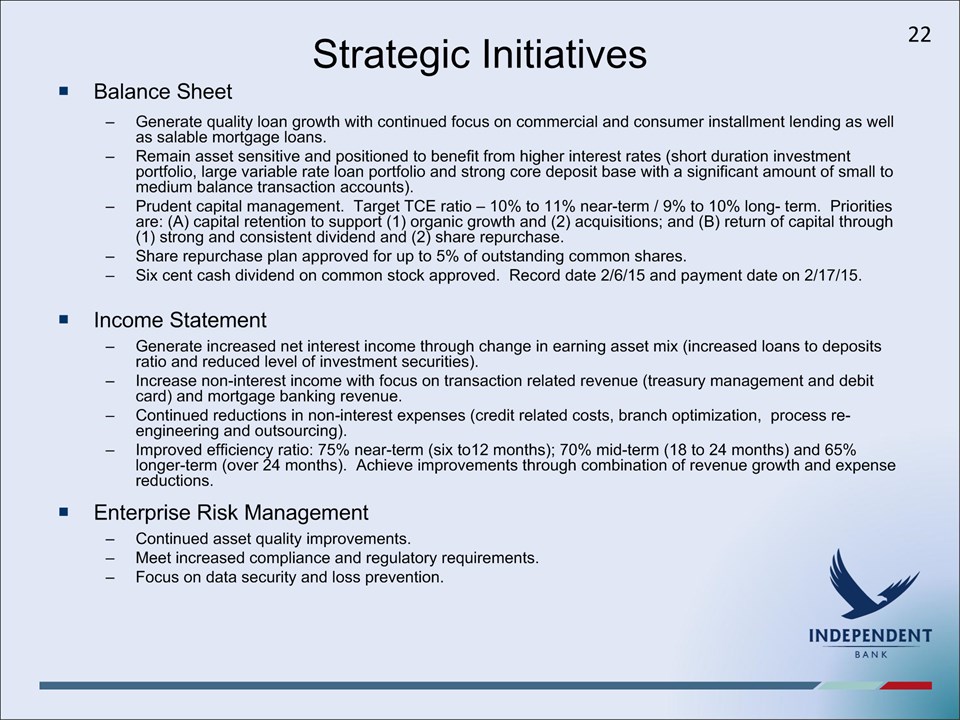
Strategic Initiatives Balance SheetGenerate quality loan growth with continued focus on commercial and consumer installment lending as well as salable mortgage loans.Remain asset sensitive and positioned to benefit from higher interest rates (short duration investment portfolio, large variable rate loan portfolio and strong core deposit base with a significant amount of small to medium balance transaction accounts).Prudent capital management. Target TCE ratio – 10% to 11% near-term / 9% to 10% long- term. Priorities are: (A) capital retention to support (1) organic growth and (2) acquisitions; and (B) return of capital through (1) strong and consistent dividend and (2) share repurchase.Share repurchase plan approved for up to 5% of outstanding common shares.Six cent cash dividend on common stock approved. Record date 2/6/15 and payment date on 2/17/15.Income StatementGenerate increased net interest income through change in earning asset mix (increased loans to deposits ratio and reduced level of investment securities).Increase non-interest income with focus on transaction related revenue (treasury management and debit card) and mortgage banking revenue.Continued reductions in non-interest expenses (credit related costs, branch optimization, process re-engineering and outsourcing).Improved efficiency ratio: 75% near-term (six to12 months); 70% mid-term (18 to 24 months) and 65% longer-term (over 24 months). Achieve improvements through combination of revenue growth and expense reductions. Enterprise Risk ManagementContinued asset quality improvements.Meet increased compliance and regulatory requirements.Focus on data security and loss prevention. 22
Independent Bank Corporation4th Quarter 2014 Earnings Conference Call Question and Answer SessionClosing RemarksThank you for attending !NASDAQ: IBCP 23