Attached files
| file | filename |
|---|---|
| 8-K - 8-K - POPULAR, INC. | d855769d8k.htm |
 Investor Presentation
Fourth Quarter 2014
Exhibit 99.1 |
 Forward Looking Statements
The information contained in this presentation includes forward-looking statements within
the meaning of the Private Securities Litigation Reform Act of 1995.
These forward-looking statements are
based on management’s current expectations and involve risks and uncertainties that may
cause the Company's actual results to differ materially from any future results
expressed or implied by such forward-looking statements. Factors that may cause
such a difference include, but are not limited to (i) the rate of growth in the economy
and employment levels, as well as general business and economic conditions; (ii)
changes in interest rates, as well as the magnitude of such changes; (iii) the fiscal
and monetary policies of the federal government and its agencies; (iv) changes in federal bank
regulatory and supervisory policies, including required levels of capital; (v) the relative
strength or weakness of the consumer and commercial credit sectors and of the real
estate markets in Puerto Rico and the other markets in which borrowers are located;
(vi) the performance of the stock and bond markets; (vii) competition in the financial
services industry; (viii) possible legislative, tax or regulatory changes; (ix) the
impact of the Dodd-Frank Act on our businesses, business practice and cost
of
operations;
and
(x)
additional
Federal
Deposit
Insurance
Corporation
assessments.
Other
than
to the extent required by applicable law, the Company undertakes no obligation to
publicly update or revise any forward-looking statement. Please refer to our Annual
Report on Form 10-K for the year ended December 31, 2013 and other SEC reports for
a discussion of those factors that could impact our future results. The financial
information included in this presentation for the quarter and year ended December 31,
2014 is based on preliminary unaudited data and is subject to change. 1
|
 2014 Full Year
Highlights •
NPLs increased by $27 million YoY; ratio at 3.2%
•
NPL inflows, excluding consumer loans, up by $22 million YoY
•
NCOs ratio of 0.92%³
compared to 1.19%³
last year
•
Reported net loss of $309 million for 2014; adjusted net income of $305 million¹ •
Strong margins: Popular, Inc. 4.67%²
adjusted
Credit
(excluding
covered loans)
TARP
Earnings
2
BPNA
Restructuring
•
Completed TARP repayment on July 2, 2014 without raising additional equity
•
Strong capital ratios post TARP repayment
1
Adjusted
net
income
from
continuing
operations;
see
appendix
for
reconciliation
to
GAAP.
²
GAAP net interest margin was 3.16%. See appendix for reconciliation to GAAP.
³
Excludes net write-downs related to BPNA‘s legacy and classified assets sales for 2014
and BPPR’s NPL sales for 2013. •
Completed transactional portion of US restructuring
•
Strategic focus going forward on NY metro and South Florida regions
|
 Category
Market
position
Market
share
Total Deposits (Net of brokered) *
1
40%
Total Loans *
1
37%
Commercial & Construction Loans *
1
40%
Credit Cards ¹
1
52%
Mortgage Loan Production ¹
1
32%
Personal Loans *
1
31%
Auto Loans/Leases
2
18%
Assets Under Management
3
16%
Q3 2014
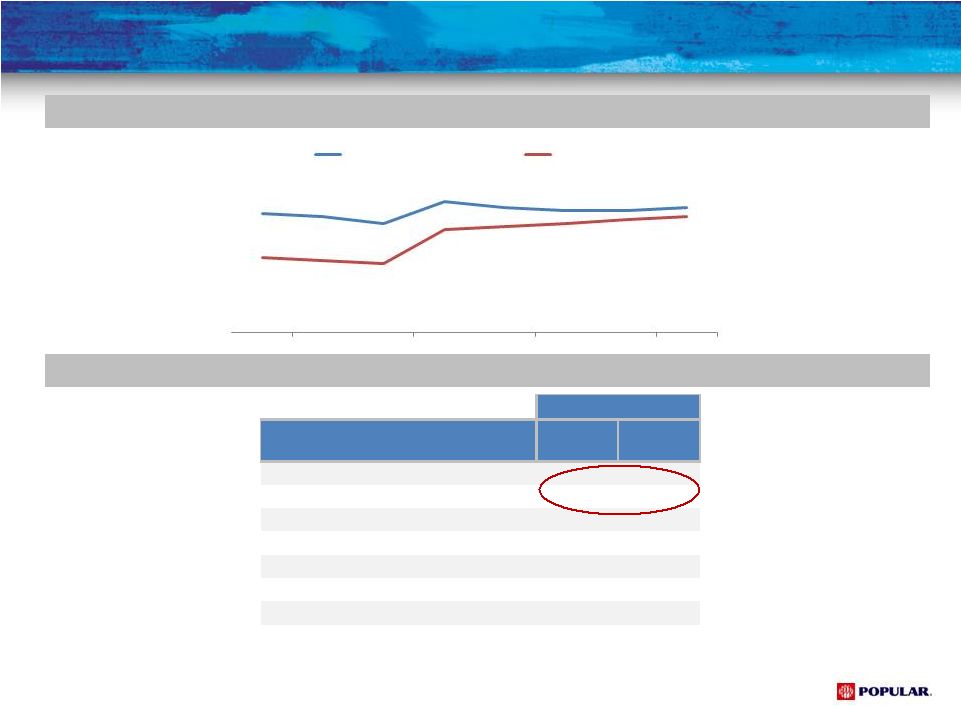
Popular’s Puerto Rico Market Share by Category
Market Leadership in Puerto Rico
3
Source: Puerto Rico Office of the Commissioner of Financial Institutions, COSSEC, and 10K
Reports.*Information included pertains to PR Commercial Banks and Credit Unions.
¹
Mortgage loan production and credit card data for certain competitors is not publicly
available; figures presented for competitors were estimated. Popular’s Puerto
Rico Market Share Trend
38%
37%
35%
42%
40%
39%
39%
40%
24%
23%
22%
33%
34%
35%
36%
37%
2007
2008
2009
2010
2011
2012
2013
Q3 2014
Total Deposits (net of brokered)
Total Loans |
 Q4 2014
Highlights •
NPL ratio unchanged at 3.2%
•
NPL inflows up $83 million QoQ
•
NCOs
of
1.04%
compared
to
0.83%
last
quarter;
increase
of
$10
million
•
Reported
net
income
of
$53
million;
adjusted
net
income
of
$81
million
•
Strong
margins:
Popular,
Inc.
4.70%
adjusted;
BPPR
5.15%
Credit
(excluding
covered loans)
BPNA
Restructuring
Earnings
•
Robust
capital;
Tier
1
Common
Equity
ratio
of
15.9%
4
Capital
•
California transaction completed in Q4 2014
•
US operational restructuring initiative on track; expected completion first half
of 2015
1
Adjusted
net
income
from
continuing
operations;
see
appendix
for
reconciliation
to
GAAP.
²
GAAP net interest margin was 4.45%. See appendix for reconciliation to GAAP.
³
Excludes net write-downs related to BPNA‘s legacy and classified assets sales.
4
Capital
ratios
for
the
current
quarter
are
preliminary.
2
1
3
3
4 |
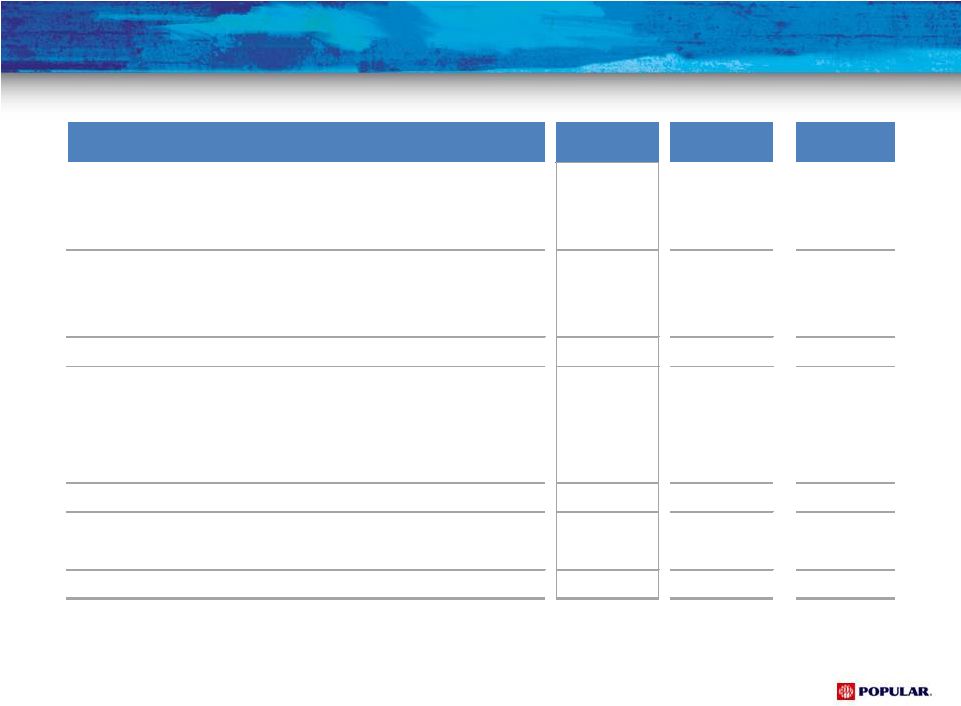  Financial Summary
(non-GAAP)¹ 5
____________________
¹
Unaudited. See Appendix for reconciliation to GAAP.
($ in thousands)
Q4 14
Q3 14
Variance
Net interest income
345,452
$
347,084
$
(1,632)
$
FDIC loss share expense
(18,693)
(19,910)
1,217
Other non-interest income
126,904
129,194
(2,290)
Gross revenues
453,663
456,368
(2,705)
Provision for loan losses – non-covered loans
50,759
56,216
(5,457)
Provision for loan losses – covered loans
(3,646)
12,463
(16,109)
Total provision for loan losses
47,113
68,679
(21,566)
Net revenues
406,550
387,689
18,861
Personnel costs
107,762
104,542
3,220
OREO expenses
20,016
19,745
271
Other operating expenses
182,966
178,063
4,903
Total operating expenses
310,744
302,350
8,394
Income from continuing operations before income tax
95,806
85,339
10,467
Income tax expense
14,995
3,610
11,385
Income from continuing operations
80,811
$
81,729
$
(918)
$ |
 BPNA
Restructuring-Operational Reorganization 6
•
California transaction closed in Q4 2014 for $8.1 million net gain
•
Strategic focus going forward on NY metro and South Florida regions
•
US operational restructuring initiative progress on track with expected completion
first half of 2015
Annualized cost savings of $34 million beginning in Q2 2015
Operational
Reorganization
Balance Sheet
Management
•
Sold approximately $93 million book value of legacy and classified assets in bulk
transactions during Q4
US region ended Q4 2014 with total NPLs of $19 million or 0.55% of loans
•
$638 million in high cost repo funding refinanced in Q3 2014; blended cost over 4%
Total refinancing penalty of $40 million; $19 million recognized
in Q4 2014
BPNA’s
adjusted
NIM
increased
to
3.82%¹
from
3.23%¹
in
Q3
Lower
risk
profile
and
smaller
balance
sheet
to
yield
additional
excess
capital
____________________
¹
GAAP net interest margin was 2.40% and 1.82% for Q4 and Q3, respectively. See appendix for
reconciliation to GAAP. |
 14.8
19.2
20.4
11.1
15.9
18.2
19.5
11.4
16.5
16.9
19.6
Tier 1 Common
Tier 1 Capital
Total Capital
Tangible Common Equity
Q4 2013 (Basel I)
Q4 2014 (Basel I)
Q4 2014 (Basel III)
Capital
7
¹
Capital ratios for the current quarter are preliminary. Basel III capital ratios calculated
under the transitional Capital Rules for non-advanced approach banking organizations
in effect as of January 1, 2015. •
Tier 1 Common Equity capital ratio of 15.9%; exceeds YE 2013 ratio before TARP repayment
•
We expect to remain “well-capitalized”
under Basel III rules issued by the Federal Reserve
Popular,
Inc.
Capital
Ratios¹
% |
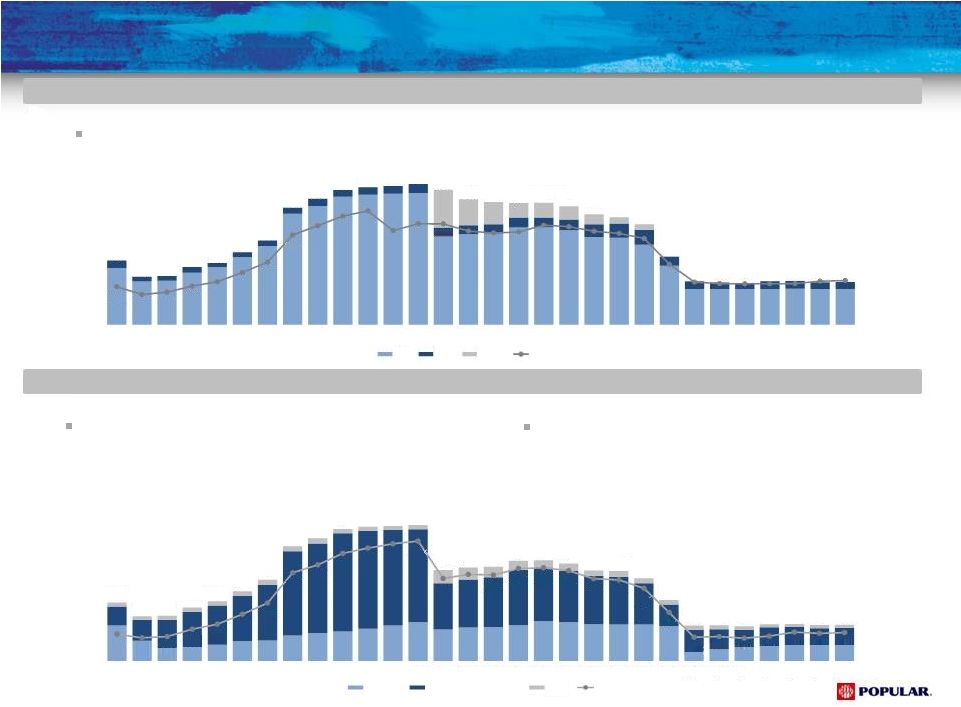 Non-Performing
Assets ($MM) Non-Performing Assets
8
•
NPLs, excluding covered loans, remained stable at 3.2% of loans, increasing
slightly by $3 million QoQ •
NPAs, including covered loans, down by $16 million QoQ
Non-Performing Loans ($MM)
BPPR NPLs of $606 million, or 3.8% of loans, increased $14 million
-
Commercial NPLs up $13 million; includes the addition of a $75
million public sector borrower, in part offset by the return to
accrual of the $51 million addition in Q1 2014
-
Mortgage NPLs increased $8 million
US operations NPLs of $19 million, or 0.6% of loans, declined
$11 million
-
Commercial and legacy NPLs down $6 million and $4
million, respectively, primarily due to loan resolutions
-
Mortgage NPLs down $2 million, mainly related to NPL loan
sales
________________________________
Metrics exclude covered loans. Differences due to rounding.
635
625
1,008
771
781
923
1,028
1,203
1,404
1,978
2,116
2,276
2,313
2,330
2,344
1,572
1,614
1,625
1,732
1,738
1,682
1,563
1,550
1,425
1,051
614
618
598
640
622
3.1%
2.8%
2.9%
3.5%
3.9%
4.7%
5.6%
8.0%
8.7%
9.6%
10.0%
10.4%
10.6%
7.6%
7.9%
7.9%
8.4%
8.4%
8.2%
7.6%
7.5%
6.8%
4.9%
2.9%
2.9%
2.8%
2.9%
3.3%
3.2%
3.2%
0.0%
2.0%
4.0%
6.0%
8.0%
10.0%
12.0%
14.0%
Q3 07
Q4 07
Q1 08
Q2 08
Q3 08
Q4 08
Q1 09
Q2 09
Q3 09
Q4 09
Q1 10
Q2 10
Q3 10
Q4 10
Q1 11
Q2 11
Q3 11
Q4 11
Q1 12
Q2 12
Q3 12
Q4 12
Q1 13
Q2 13
Q3 13
Q4 13
Q1 14
Q2 14
Q3 14
Q4 14
Mortgage
Commercial & Construction
Other
NPL/Loans (HIP)
956
928
1,142
852
866
1,026
1,101
1,293
1,500
2,084
2,245
2,402
2,448
2,539
2,623
2,489
2,314
2,277
2,254
2,365
2,311
2,178
2,120
2,002
1,420
993
944
932
956
943
2.4%
1.9%
2.1%
2.5%
2.7%
3.3%
4.0%
5.7%
6.3%
6.9%
7.2%
6.0%
6.4%
6.4%
6.0%
5.8%
5.9%
6.3%
6.2%
5.9%
5.8%
5.5%
3.8%
2.7%
2.6%
2.6%
2.6%
2.6%
2.8%
2.8%
Q3 07
Q4 07
Q1 08
Q2 08
Q3 08
Q4 08
Q1 09
Q2 09
Q3 09
Q4 09
Q1 10
Q2 10
Q3 10
Q4 10
Q1 11
Q2 11
Q3 11
Q4 11
Q1 12
Q2 12
Q3 12
Q4 12
Q1 13
Q2 13
Q3 13
Q4 13
Q1 14
Q2 14
Q3 14
Q4 14
NPLs
OREO
NPL HFS
NPAs/Total Assets
OREOs
decreased
by
$21
million,
primarily
from
the
sale
of
commercial
properties
from
the
covered
OREO
portfolio. |
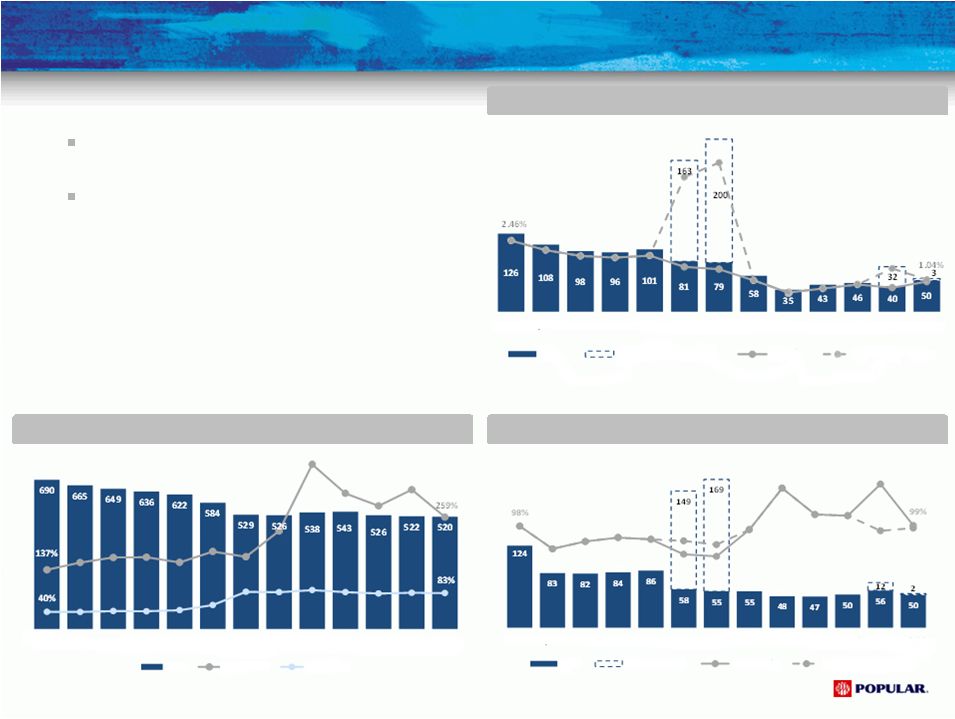
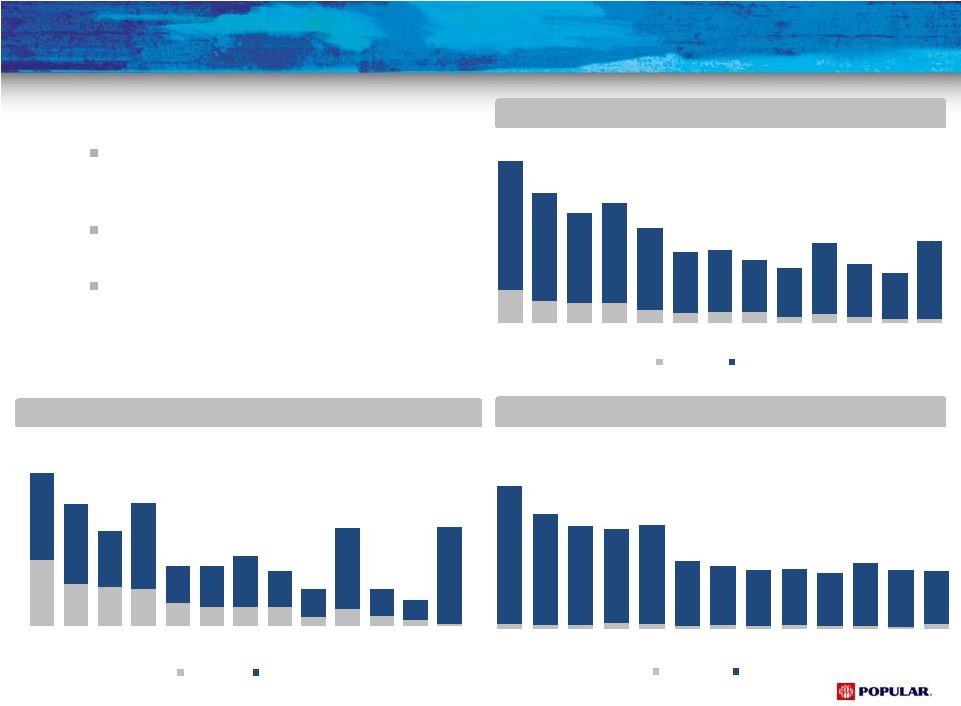 Mortgage NPL
Inflows ($MM) Total NPL Inflows ($MM)
NPL Inflows
PR commercial inflows up $89 million; includes
the impact of a single $75 million public sector
credit
PR mortgage NPL inflows declined by $6 million,
or 7%
US total NPL inflows remained essentially
unchanged at $10 million
Commercial, Construction & Legacy NPL Inflows ($MM)
Excludes consumer loans
9
76
48
45
42
26
22
22
22
10
19
11
7
2
101
93
65
100
43
48
59
42
32
94
31
23
113
Q4 11
Q1 12
Q2 12
Q3 12
Q4 12
Q1 13
Q2 13
Q3 13
Q4 13
Q1 14
Q2 14
Q3 14
Q4 14
US Inflows
PR Inflows
________________________________
Metrics exclude covered loans. Differences due to rounding.
8
6
6
10
8
5
7
5
6
4
5
3
8
232
187
166
157
167
110
99
94
94
89
105
95
89
Q4 11
Q1 12
Q2 12
Q3 12
Q4 12
Q1 13
Q2 13
Q3 13
Q4 13
Q1 14
Q2 14
Q3 14
Q4 14
US Inflows
PR Inflows
84
55
51
52
34
26
29
27
16
23
16
9
10
333
279
231
257
210
158
158
136
126
183
136
119
202
Q4 11
Q1 12
Q2 12
Q3 12
Q4 12
Q1 13
Q2 13
Q3 13
Q4 13
Q1 14
Q2 14
Q3 14
Q4 14
US Inflows
PR Inflows
•
Total NPL inflows increased by $83 million QoQ |
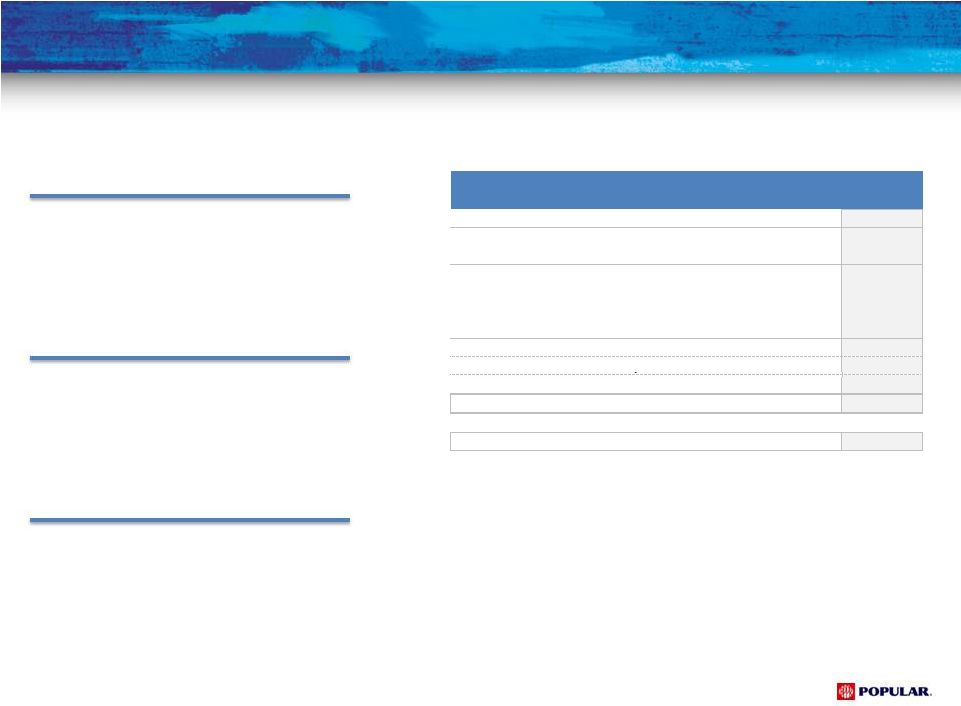
 ALLL ($MM),
ALLL-to-NCO and ALLL-to-NPL Ratios NCO ($MM) and NCO-to-Loan
Ratio Provision ($MM) and Provision-to-NCO Ratio
Asset Quality
•
NCOs up $10 million QoQ (excluding write-downs), in part due
to higher recoveries in Q3 2014
•
Provision decreased by $17 million QoQ
•
ALLL essentially flat at $520 million, decreasing by $2 million
QoQ; ALLL to loans at 2.68% vs. 2.69% in Q3 2014
•
ALLL to NPL coverage ratio stable at 83% in Q4 2014 vs. 84% in
Q3 2014
10
________________________________
Metrics exclude covered loans. Differences due to rounding.
Q4 11
Q1 12
Q2 12
Q3 12
Q4 12
Q1 13
Q2 13
Q3 13
Q4 13
Q1 14
Q2 14
Q3 14
Q4 14
ALLL
ALLL/NCO
ALLL/NPL
Q4 11
Q1 12
Q2 12
Q3 12
Q4 12
Q1 13
Q2 13
Q3 13
Q4 13
Q1 14
Q2 14
Q3 14
Q4 14
PLLL
Bulk Sale PLLL
PLLL/NCO
Bulk Sale PLLL/NCO
Q4 11
Q1 12
Q2 12
Q3 12
Q4 12
Q1 13
Q2 13
Q3 13
Q4 13
Q1 14
Q2 14
Q3 14
Q4 14
NCO
Bulk Sale Charge-offs
NCO%
Bulk Sale NCO%
NCO ratio of 1.04% vs. 0.83% in Q3 2014
Provision to NCO of 99% |
 PR Public Sector
Exposure •
Loans to the Government of Puerto Rico
and Public Corporations are either
collateralized loans or obligations that
have a specific source of income or
revenues identified for their repayment.
11
•
Loans to various municipalities are
backed by unlimited taxing power or
real and personal property taxes
collected within such municipalities.
Our current direct exposure to the PR government, instrumentalities, and municipalities is $1.0
billion, of which approximately $811 million is outstanding, up $84 million from Q3
2014. PR Central Government & Public Corporations
Municipalities
•
Indirect exposure includes loans or
instruments that are payable by non-
governmental entities and have a
government guarantee to cover any
shortfall in collateral in the event of
borrower default. Majority are single-
family mortgage related.
Indirect Exposure
_________________________________
¹
Includes PR government banks and COFINA.
Outstanding PR government exposure
($ in millions)
Loans
Securities
Total
Central Government ¹
100
$
61
$
161
$
Public Corporations
PRASA
100
1
101
PREPA
75
-
75
PRHTA
-
-
-
OTHER
-
-
-
Total Central Govt & Public Corp.
275
62
337
as % of Tier 1 Capital
8.7%
Municipalities
414
60
474
Direct Government Exposure
689
$
122
$
811
$
Indirect Exposure
321
$
49
$
370
$
|
 Driving
Shareholder Value •
Robust capital with Tier 1 Common Equity of 15.9%
•
TARP repayment and BPNA transactions move us toward a more active capital
management process
12
•
Unique franchise in PR provides strong, stable revenue-generating capacity
•
Continued stability in Popular’s credit metrics
•
EVTC ownership, BHD stake and restructured US operations
Capital
Additional
Value
Earnings |
 Investor
Presentation Fourth Quarter 2014
APPENDIX |
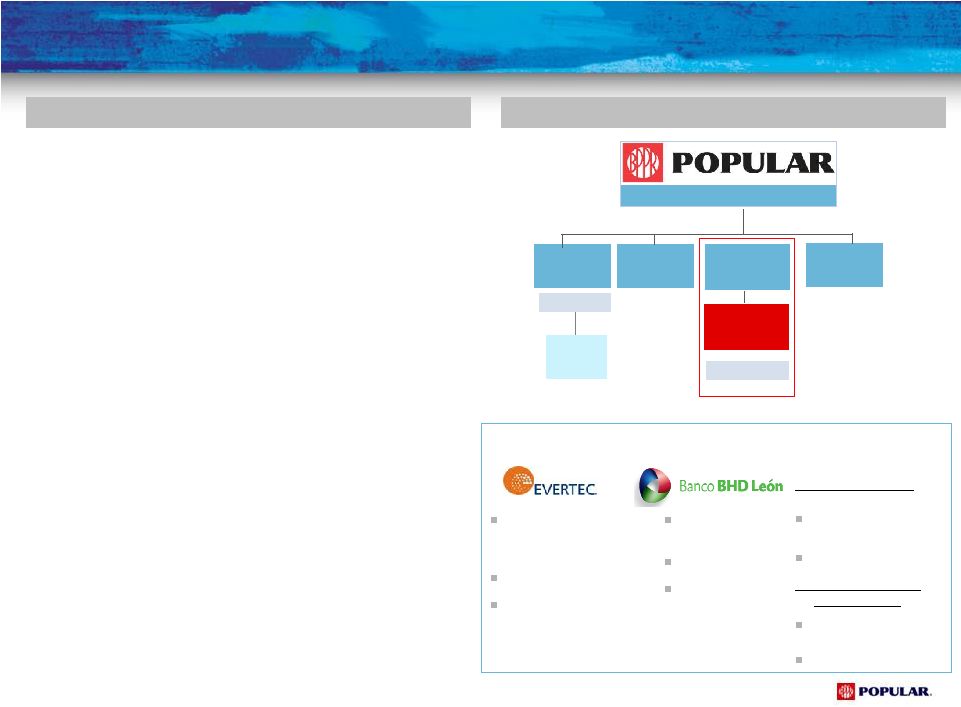 Selected
equity investments (first two under “corporate”
segment and third and fourth under PR):
14
Who We Are –
Popular, Inc.
Franchise
•
Financial services company
•
Headquartered in San Juan, Puerto Rico
•
$33 billion in assets (bank holding company in the U.S.)
among top 40
•
$22 billion in total loans
•
$25 billion in total deposits
•
224 banking branches serving customers in Puerto Rico,
New York, New Jersey, Florida, and U.S. and British Virgin
Islands
•
NASDAQ ticker symbol: BPOP
•
Market Cap: $3.5 billion
_____________________________________
Note: Information as of December 31, 2014
*Doing business as Popular Community Bank.
Summary Corporate Structure
Assets = $33.1 bn
Popular Auto,
Inc.
Banco Popular
de Puerto Rico
Popular
Securities, Inc.
Assets = $27.4 bn
Assets = $5.5bn
Banco Popular
North America*
Puerto Rico operations
Popular
Insurance, Inc.
Popular North
America, Inc.
U.S. banking operations
Transaction processing,
business processes
outsourcing
14.96% stake
Adjusted EBITDA of $184.4
million for the twelve months
ended September 30, 2014
Dominican Republic
bank
15.82% stake
2013 approximate
net income $111
million
PRLP 2011 Holdings, LLC
Construction and
commercial loans vehicle
24.9% stake
PR Asset Portfolio 2013-1
International, LLC
Construction, commercial
loans and OREOs vehicle
24.9% stake |
 15
GAAP Reconciliation Full Year 2014
_____________________________________
* Unaudited.
¹
Covered loans represent loans acquired in the Westernbank FDIC-assisted transaction that
are covered under FDIC loss sharing agreements. ²
Excludes the impact of $414.1 million TARP discount amortization and the impact of $39 million
pertaining to US repos refinancing. GAAP net interest margin was 3.16%. (In
thousands) Actual
Results
(US GAAP)
TARP discount
amortization
BPNA
Reorganization
Income Tax
Adjustments
Other
Adjustments
Indemnification
Asset
Adjustment
Adjusted
Results
(Non-GAAP)
Net interest income (expense)
$ 945,072
$ (414,068)
$ (39,254)
$
$ 1,398,394
Provision
for
loan
losses
–
non-covered
loans
223,999
12,828
-
-
-
211,171
Provision
for
loan
losses
–
covered
loans ¹
46,135
-
-
-
-
46,135
Net interest income (expense) after provision for
674,938
(414,068)
(52,082)
-
-
-
1,141,088
Net gain on sale of loans, including valuation
adjustments on loans held-for-sale
40,591
-
1,684
-
-
-
38,907
FDIC loss share expense
(103,024)
-
-
-
-
12,492
(115,516)
Other non-interest income
455,479
-
-
-
-
-
455,479
Personnel costs
418,679
-
-
-
2,974
415,705
Net occupancy expenses
86,707
-
-
-
1,895
84,812
Loss on early extinguishment of debt
532
-
532
-
-
-
-
Restructuring costs
26,725
-
26,725
-
-
-
-
Other operating expenses
661,041
-
-
-
-
-
661,041
(Loss) income from continuing operations before
income tax
(125,700)
(414,068)
(77,655)
-
(4,869)
12,492
358,400
Income tax expense
60,802
-
-
4,655
-
2,498
53,649
(Loss) income from continuing operations
$ (186,502)
$ (414,068)
$ (77,655)
$ (4,655)
$ (4,869)
$ 9,994
$ 304,751
Basic and diluted EPS from continuing operations
(1.85)
$
Net interest margin
4.67%
²
Tangible common book value per common share
35.93
$
Market value per common share
34.05
$
2014 *
-
$
-
$
- |
 16
GAAP Reconciliation Q4 2014
_____________________________________
* Unaudited.
¹
Covered loans represent loans acquired in the Westernbank FDIC-assisted transaction that
are covered under FDIC loss sharing agreements. ²
Excludes the impact of $18.6 million pertaining to US repos refinancing. US GAAP net interest margin
was 4.45%. (In thousands)
Actual
Results
(US GAAP)
BPNA
Reorganization
Other
Adjustments
Adjusted
Results
(Non-GAAP)
Net interest income (expense)
$ 326,861
$ (18,591)
$ 345,452
Provision
for
loan
losses
–
non-covered
loans
51,637
878
-
50,759
Reversal
of
provision
for
loan
losses
–
covered
loans ¹
(3,646)
-
-
(3,646)
Net interest income (expense) after provision for loan losses
278,870
(19,469)
-
298,339
Net gain on sale of loans, including valuation adjustments on loans
held-for-sale 10,946
1,684
-
9,262
FDIC loss share expense
(18,693)
-
-
(18,693)
Other non-interest income
117,642
-
-
117,642
Personnel costs
110,736
-
2,974
107,762
Net occupancy expenses
23,877
-
1,895
21,982
Loss on early extinguishment of debt
532
532
-
-
Restructuring costs
13,861
13,861
-
-
Other operating expenses
181,000
-
-
181,000
Income (loss) from continuing operations before income tax
58,759
(32,178)
(4,869)
95,806
Income tax expense
14,995
-
-
14,995
Income (loss) from continuing operations
$ 43,764
$ (32,178)
$ (4,869)
$ 80,811
Basic and diluted EPS from continuing operations
0.41
$
Net interest margin
4.70%
²
Tangible common book value per common share
35.93
$
Market value per common share
34.05
$
Q4 2014 *
$
- |
 17
GAAP Reconciliation Q3 2014
_____________________________________
* Unaudited.
¹
Covered loans represent loans acquired in the Westernbank FDIC-assisted transaction that
are covered under FDIC loss sharing agreements. ²
Excludes the impact of $21 million pertaining to US repos refinancing. US GAAP net interest
margin was 4.36%. (In thousands)
Actual
Results
BPNA (US GAAP)
Reorganization
Income Tax
Adjustments
Indemnification
Asset
Adjustment
Adjusted
Results
(Non-GAAP)
Net interest income (expense)
$ 326,421
$ (20,663)
$ 347,084
Provision
for
loan
losses
–
non-covered
loans
68,166
11,950
-
-
56,216
Provision
for
loan
losses
–
covered
loans ¹
12,463
-
-
-
12,463
Net interest income (expense) after provision for loan losses
245,792
(32,613)
-
-
278,405
FDIC loss share expense
(4,864)
-
-
15,046
(19,910)
Other non-interest income
129,194
-
-
-
129,194
Restructuring costs
8,290
8,290
-
-
-
Other operating expenses
302,350
-
-
-
302,350
Income (loss) from continuing operations before income tax
59,482
(40,903)
-
15,046
85,339
Income tax expense
26,667
-
20,048
3,009
3,610
Income (loss) from continuing operations
$ 32,815
$ (40,903)
$ (20,048)
$ 12,037
$ 81,729
Basic and diluted EPS from continuing operations
0.31
$
Net interest margin
4.64%
²
Tangible common book value per common share
36.24
$
Market value per common share
29.44
$
Q3 2014 *
$
-
$
- |
 Business
Segments (GAAP)* 18
___________________
Unaudited
¹
Excludes discontinued operations.
²
Non-fully taxable equivalent.
($ in millions)
Financial Results
Q4 14
Q3 14
Variance
Q4 14
Q3 14
Variance
Net interest income
311
$
316
$
(5)
$
31
$
26
$
5
$
Non-interest income
85
96
(11)
18
17
1
Gross revenues
396
412
(16)
49
43
6
Provision for loan losses – non-covered loans
52
62
(10)
(1)
6
(7)
Provision for loan losses – covered loans
(4)
12
(16)
-
-
-
Total provision for loan losses
48
74
(26)
(1)
6
(7)
Operating expenses
241
245
(4)
64
48
16
Income tax expense
27
31
(4)
1
1
-
Income (loss) from continuing operations
80
$
62
$
18
$
(15)
$
(12)
$
(3)
$
Income from discontinued operations, net of tax
-
$
-
$
-
$
9
$
30
$
(21)
$
Net income (loss)
80
$
62
$
18
$
(6)
$
18
$
(24)
$
($ in millions)
Balance Sheet Highlights
Q4 14
Q3 14
Variance
Q4 14
Q3 14
Variance
Total assets
27,351
$
26,765
$
586
$
5,503
$
7,133
$
(1,630)
$
Total loans ¹
18,564
18,567
(3)
3,488
3,624
(136)
Total deposits ¹
21,426
20,986
440
3,459
3,551
(92)
($ in millions)
Asset Quality (including covered assets)
Q4 14
Q3 14
Variance
Q4 14
Q3 14
Variance
Non-performing loans held-in-portfolio
624
$
607
$
17
$
19
$
30
$
(11)
$
Non-performing assets
874
871
3
54
72
(18)
Allowance for loan losses
571
579
(8)
31
32
(1)
Net interest margin ²
5.15%
5.25%
-0.10%
2.40%
1.82%
0.58%
PR
US
* |
 Consolidated
Credit Summary (Excluding Covered Loans) 19
1
1
1
1
1
1
1
1
________________________________
1
Excluding provision for loan losses and net write-downs related to the classified and
legacy assets sale Numbers may not add to total due to rounding.
$ in millions
Q4 14
Q3 14
Q2 14
Q1 14
Q4 13
Loans Held in Portfolio (HIP)
$19,404
$19,359
$19,635
$21,612
$21,612
Performing HFS
87
158
93
94
109
NPL HFS
19
20
4
1
1
Total Non Covered Loans
19,511
19,537
19,732
21,707
21,722
Non-performing loans (NPLs)
$625
$622
$640
$635
$598
Commercial
$259
$252
$278
$307
$279
Construction
$14
$19
$22
$22
$24
Legacy
$2
$6
$8
$12
$15
Mortgage
$300
$295
$286
$252
$233
Consumer
$47
$47
$43
$39
$44
Leases
$3
$3
$3
$3
$3
NPLs HIP to loans HIP
3.22%
3.21%
3.26%
2.94%
2.77%
Net charge-offs (NCOs)
$50
$40
$46
$43
$35
Commercial
$13
$0
$10
$11
$15
Construction
($0)
($1)
($1)
($2)
($2)
Legacy
($4)
$0
($1)
($5)
($5)
Mortgage
$12
$13
$10
$9
$8
Consumer
$28
$27
$26
$28
$18
Leases
$1
$1
$1
$1
$1
Write-downs
$3
$32
$20
$0
$0
NCOs to average loans HIP
1.04%
0.83%
0.94%
0.80%
0.66%
Provision for loan losses (PLL)
$50
$56
$50
$47
$48
PLL to average loans HIP
1.02%
1.16%
1.02%
0.88%
0.89%
PLL to NCOs
0.99x
1.39x
1.08x
1.10x
1.35x
Allowance for loan losses (ALL)
$520
$522
$526
$543
$538
ALL to loans HIP
2.68%
2.69%
2.68%
2.51%
2.49%
ALL to NPLs HIP
83.11%
83.88%
82.26%
85.40%
90.05% |
 $19,404
$15,938
BPPR Commercial & Construction Distribution
Loan Composition (Held-in Portfolio)
De-risked Loan Portfolios
•
The Corporation has derisked its loan portfolios by
reducing its exposure in asset classes with
historically high loss content
•
In the BPPR commercial portfolio reductions
include:
Commercial portfolio, including construction,
has decreased from 55% of total loans held-
in-portfolio to 41%
Construction portfolio is down by 87% since
Q4 2007
SME
1
lending is down by 55% from Q4 2007
•
Collateralized exposure now represents a larger
portion of consumer loan portfolio
•
Unsecured loans credit quality has improved as
overall FICO scores have increased
20
________________________________
1
Small and Medium Enterprise
2
NCOs
distribution
represents
the
percentage
allocation
of
NCOs
from
Q1
2008
through
Q2
2014
per
each
loan
category.
Numbers may not add to total due to rounding.
NCOs
($mm)
(%)
($mm)
(%)
($mm)
(%)
Distribution
(2)
CRE SME ¹
$2,938
33%
$1,519
23%
($1,419)
-48%
24%
C&I SME ¹
2,287
25%
809
12%
(1,478)
-65%
29%
C&I Corp
1,592
18%
1,946
30%
354
22%
5%
Construction
1,231
14%
159
2%
(1,072)
-87%
37%
CRE Corp
892
10%
1,967
30%
1,075
121%
4%
Multifamily
64
1%
134
2%
70
109%
1%
Total
$9,004
$6,534
($2,470)
-27%
100%
Q4 2007
Q4 2014
Variance
5,451
6,503
252
$ in millions
Q4 2007
Q4 2014
Q4 2007
Q4 2014
Q4 2007
Q4 2014
Variance
Commercial
$7,774
$6,375
$4,515
$1,759
$12,288
$8,134
($4,154)
Consumer
3,552
3,389
1,698
481
5,249
3,870
Mortgage
2,933
3,139
1,052
6,071
Construction
1,231
159
237
93
1,468
Leases
814
564
-
-
814
564
Legacy
-
-
2,130
81
2,130
81
Total
$16,304
$11,718
$3,466
$28,021
Puerto Rico
US
Total
432
(1,379)
(1,216)
(250)
(2,049)
($8,617)
Legacy portfolio is comprised of certain commercial, construction and lease financings lending
products exited by the US. |
 Popular, Inc.
Credit Ratings •
Our senior unsecured ratings have remained stable:
Moody’s:
B2
Negative
Fitch:
BB-
Stable Outlook
S&P:
B+
Stable Outlook
•
May 2014: Moody’s downgraded BPOP to B2; outlook negative
•
February 2014: Moody’s placed BPOP on review for downgrade
•
October 2013: Moody’s revised outlook to negative
•
January 2013: Fitch raised to BB-
from B+; outlook stable
•
December 2012: Moody’s downgraded BPOP to B1; outlook stable
•
April
2012:
Moody’s
placing
most
of
the
PR
banks
under
review
with
the
possibility
of
downgrades, due to the state of the Puerto Rico economy
•
January 2012: Fitch raised BPOP’s outlook to positive
•
December 2011: S&P raised its ratings on BPPR to BB from BB-
and changed outlook to stable
given revised bank criteria to regional banks
21 |
 Investor
Presentation Fourth Quarter 2014 |