Attached files
| file | filename |
|---|---|
| 8-K - 8-K - JOHNSON CONTROLS INC | fy15q18-kearningsresults.htm |
| EX-99.1 - EXHIBIT 99.1 - JOHNSON CONTROLS INC | fy15q1exh991-johnsonctrls.htm |

If you can read this Click on the icon to choose a picture or Reset the slide. To Reset: Right click on the slide thumbnail and select ‘reset slide’ or choose the ‘Reset’ button on the ‘Home’ ribbon (next to the font choice box) If you can read this Click on the icon to choose a picture or Reset the slide. To Reset: Right click on the slide thumbnail and select ‘reset slide’ or choose the ‘Reset’ button on the ‘Home’ ribbon (next to the font choice box) 1/6 2/6 4/6 5/6 1/4 3/4 1/2 Johnson Controls, Inc. — Exhibit 99.2 January 22, 2015 Quarterly update FY 2015 first quarter

Johnson Controls, Inc. — 2 1/6 2/6 4/6 5/6 1/4 3/4 1/2 Agenda Introduction Glen Ponczak, Vice President, Global Investor Relations Overview Alex Molinaroli, Chairman and Chief Executive Officer Business results Bruce McDonald, Vice Chairman and Executive Vice President Financial review Brian Stief, Executive Vice President and Chief Financial Officer Q&A FORWARD-LOOKING STATEMENTS Johnson Controls, Inc. has made statements in this document that are forward-looking and, therefore, are subject to risks and uncertainties. All statements in this document other than statements of historical fact are statements that are, or could be, deemed "forward-looking statements" within the meaning of the Private Securities Litigation Reform Act of 1995. In this document, statements regarding future financial position, sales, costs, earnings, cash flows, other measures of results of operations, capital expenditures or debt levels and plans, objectives, outlook, targets, guidance or goals are forward-looking statements. Words such as “may,” “will,” “expect,” “intend,” “estimate,” “anticipate,” “believe,” “should,” “forecast,” “project” or “plan” or terms of similar meaning are also generally intended to identify forward-looking statements. Johnson Controls cautions that these statements are subject to numerous important risks, uncertainties, assumptions and other factors, some of which are beyond Johnson Controls’ control, that could cause Johnson Controls’ actual results to differ materially from those expressed or implied by such forward-looking statements. These factors include required regulatory approvals that are material conditions for proposed transactions to close, strength of the U.S. or other economies, automotive vehicle production levels, mix and schedules, energy and commodity prices, availability of raw materials and component products, currency exchange rates, and cancellation of or changes to commercial contracts, as well as other factors discussed in Item 1A of Part I of Johnson Controls’ most recent Annual Report on Form 10-K for the year ended September 30, 2014. Shareholders, potential investors and others should consider these factors in evaluating the forward-looking statements and should not place undue reliance on such statements. The forward-looking statements included in this document are only made as of the date of this document, and Johnson Controls assumes no obligation, and disclaims any obligation, to update forward-looking statements to reflect events or circumstances occurring after the date of this document.
Johnson Controls, Inc. — 3 1/6 2/6 4/6 5/6 1/4 3/4 1/2 Record 2015 First Quarter* Net revenues: $10.7 billion, up 1% (up 5%, excluding currency) vs. $10.6 billion in Q1 2014 Segment income: $768 million, up 18% vs. $650 million in Q1 2014 EPS: $0.79 per diluted share, up 20% vs. $0.66 in Q1 2014 Improved profitability 7.2 percent segment income margin 110 basis point increase year-over- year *From continuing operations, excluding transaction / integration costs.

Johnson Controls, Inc. — 4 1/6 2/6 4/6 5/6 1/4 3/4 1/2 2015 First Quarter Macro Environment Higher global automotive industry production North America +5% Europe –2% (Eastern Europe down / Western Europe up) China +6% Aftermarket battery demand returning to normal Channel inventories stabilized Volumes up 4% in Q1 Strengthening US dollar offsets lower commodity costs Expect minimal full year P/L impact Expect headwind in fiscal Q2 Continued improvement in commercial HVAC demand
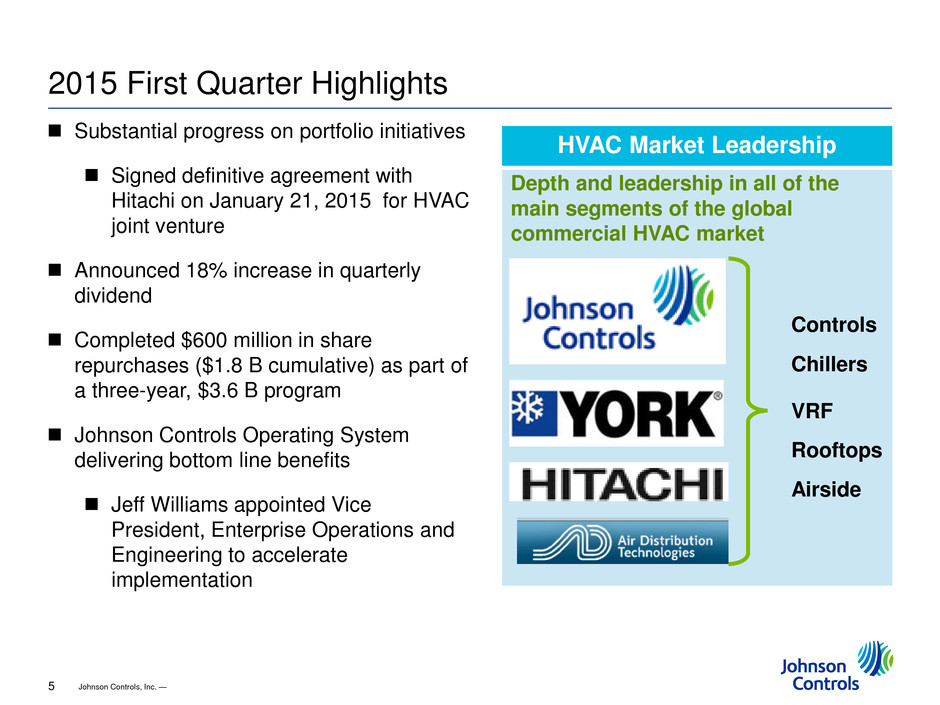
Johnson Controls, Inc. — 5 1/6 2/6 4/6 5/6 1/4 3/4 1/2 HVAC Market Leadership Substantial progress on portfolio initiatives Signed definitive agreement with Hitachi on January 21, 2015 for HVAC joint venture Announced 18% increase in quarterly dividend Completed $600 million in share repurchases ($1.8 B cumulative) as part of a three-year, $3.6 B program Johnson Controls Operating System delivering bottom line benefits Jeff Williams appointed Vice President, Enterprise Operations and Engineering to accelerate implementation VRF Rooftops Chillers Airside Controls Depth and leadership in all of the main segments of the global commercial HVAC market 2015 First Quarter Highlights
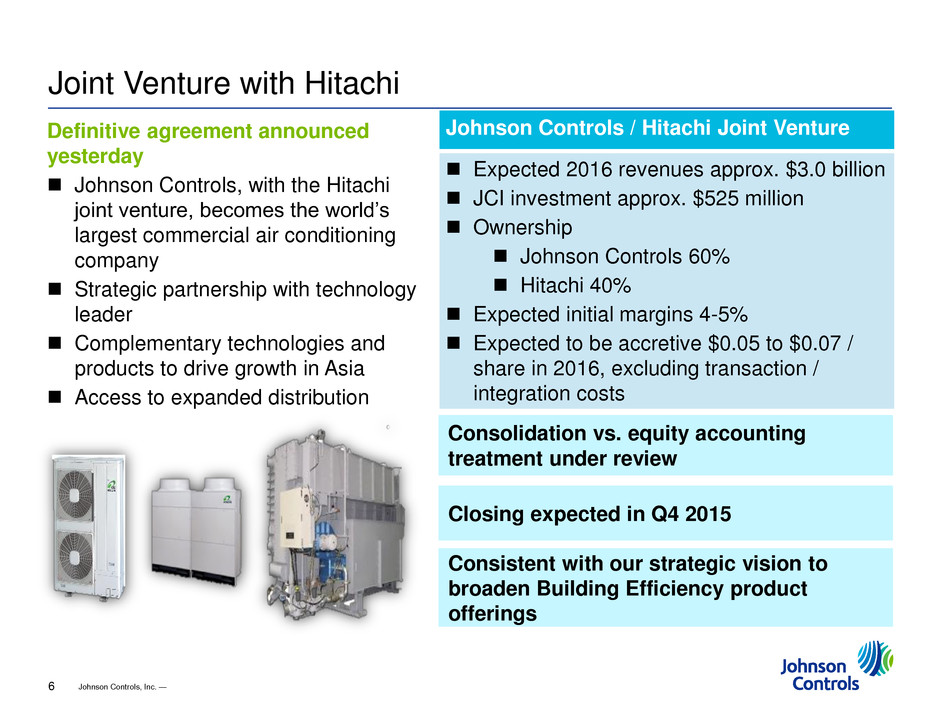
Johnson Controls, Inc. — 6 1/6 2/6 4/6 5/6 1/4 3/4 1/2 Definitive agreement announced yesterday Johnson Controls, with the Hitachi joint venture, becomes the world’s largest commercial air conditioning company Strategic partnership with technology leader Complementary technologies and products to drive growth in Asia Access to expanded distribution Closing expected in Q4 2015 Johnson Controls / Hitachi Joint Venture Expected 2016 revenues approx. $3.0 billion JCI investment approx. $525 million Ownership Johnson Controls 60% Hitachi 40% Expected initial margins 4-5% Expected to be accretive $0.05 to $0.07 / share in 2016, excluding transaction / integration costs Consistent with our strategic vision to broaden Building Efficiency product offerings Consolidation vs. equity accounting treatment under review Joint Venture with Hitachi
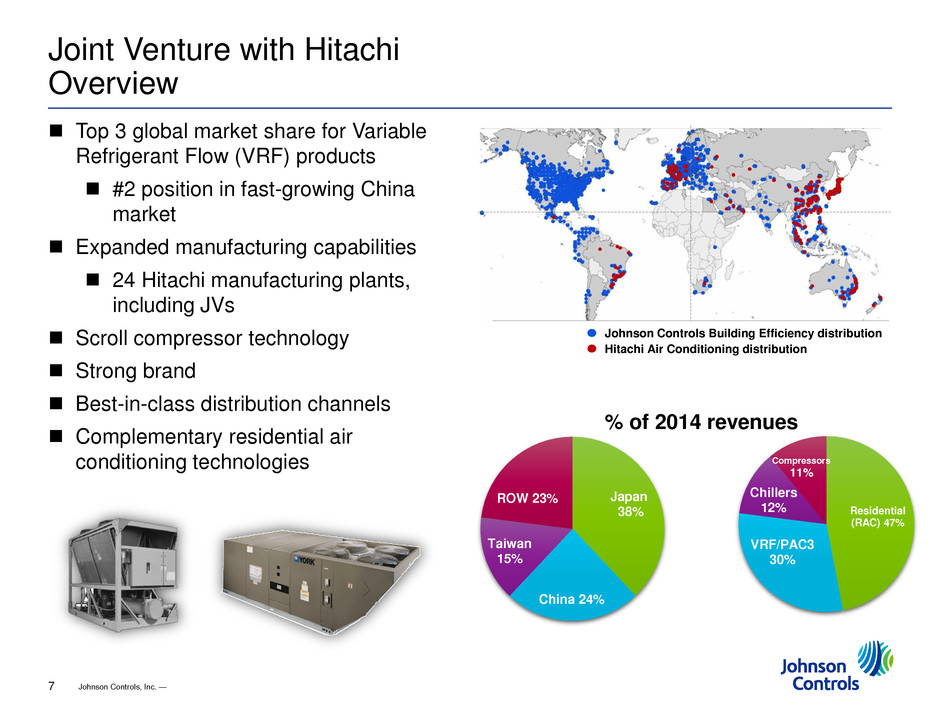
Johnson Controls, Inc. — 7 1/6 2/6 4/6 5/6 1/4 3/4 1/2 Joint Venture with Hitachi Overview Top 3 global market share for Variable Refrigerant Flow (VRF) products #2 position in fast-growing China market Expanded manufacturing capabilities 24 Hitachi manufacturing plants, including JVs Scroll compressor technology Strong brand Best-in-class distribution channels Complementary residential air conditioning technologies Johnson Controls Building Efficiency distribution Hitachi Air Conditioning distribution Japan 38% China 24% Taiwan 15% ROW 23% Residential (RAC) 47% VRF/PAC3 30% Chillers 12% Compressors 11% % of 2014 revenues
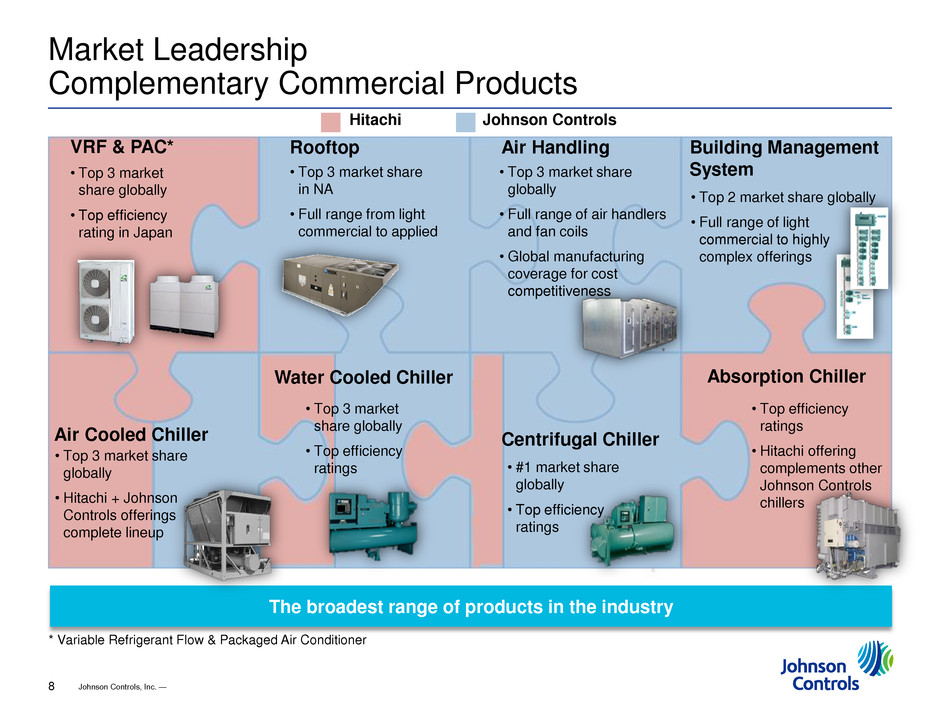
Johnson Controls, Inc. — 8 1/6 2/6 4/6 5/6 1/4 3/4 1/2 VRF & PAC* Rooftop Air Handling Building Management System Air Cooled Chiller Water Cooled Chiller Centrifugal Chiller Absorption Chiller • Top 3 market share globally • Top efficiency rating in Japan • Top 3 market share in NA • Full range from light commercial to applied • Top 3 market share globally • Full range of air handlers and fan coils • Global manufacturing coverage for cost competitiveness • Top 2 market share globally • Full range of light commercial to highly complex offerings • Top 3 market share globally • Hitachi + Johnson Controls offerings complete lineup • Top 3 market share globally • Top efficiency ratings • Top efficiency ratings • Hitachi offering complements other Johnson Controls chillers • #1 market share globally • Top efficiency ratings The broadest range of products in the industry * Variable Refrigerant Flow & Packaged Air Conditioner Johnson Controls Hitachi Market Leadership Complementary Commercial Products
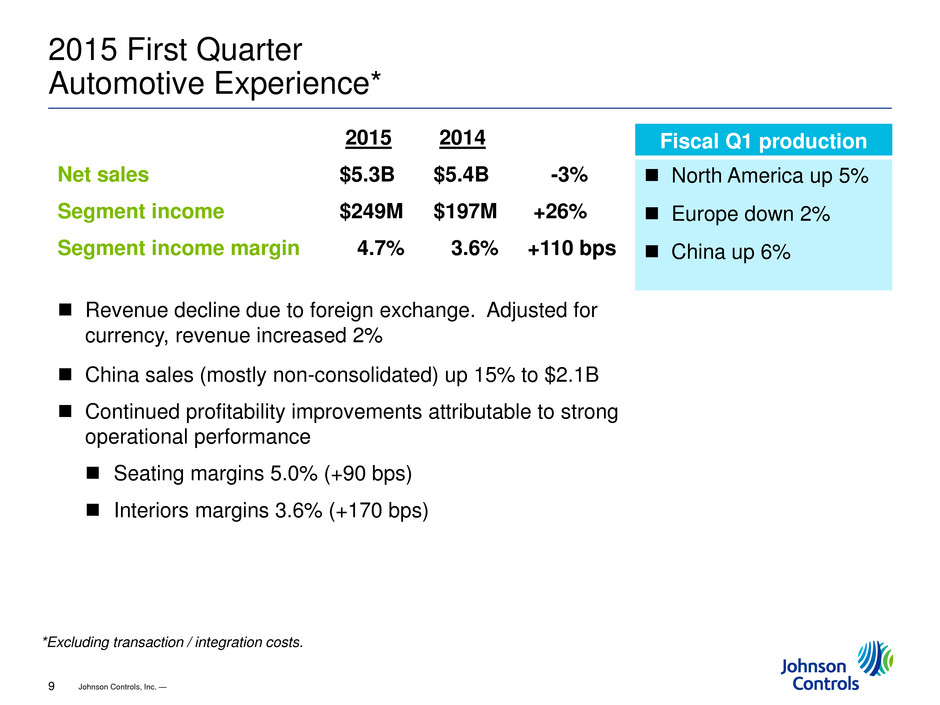
Johnson Controls, Inc. — 9 1/6 2/6 4/6 5/6 1/4 3/4 1/2 2015 First Quarter Automotive Experience* Fiscal Q1 production North America up 5% Europe down 2% China up 6% 2015 2014 Net sales $5.3B $5.4B -3% Segment income $249M $197M +26% Segment income margin 4.7% 3.6% +110 bps Revenue decline due to foreign exchange. Adjusted for currency, revenue increased 2% China sales (mostly non-consolidated) up 15% to $2.1B Continued profitability improvements attributable to strong operational performance Seating margins 5.0% (+90 bps) Interiors margins 3.6% (+170 bps) *Excluding transaction / integration costs.
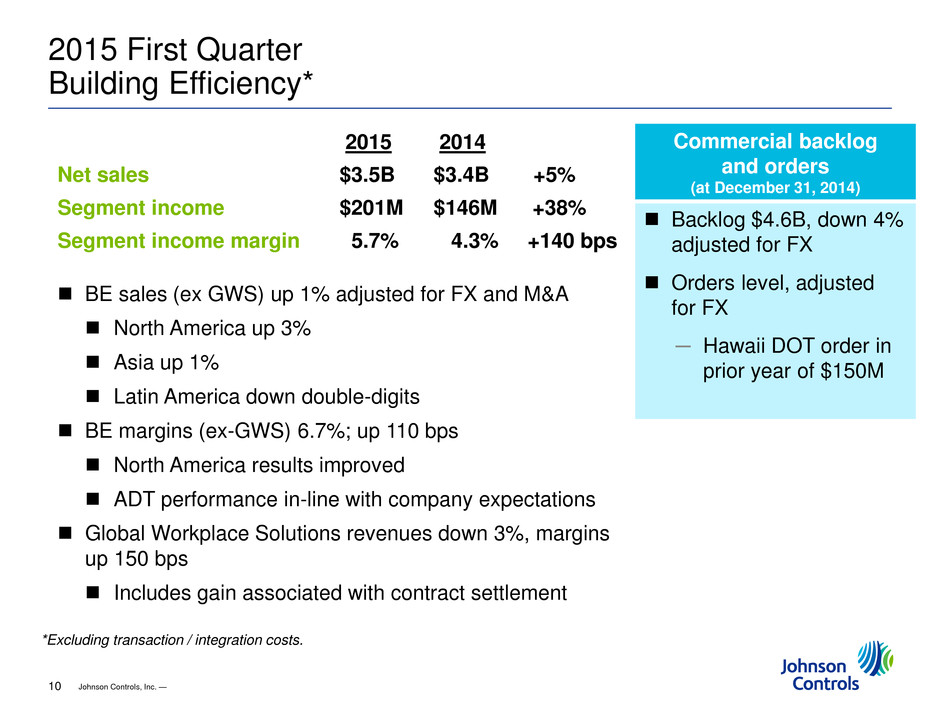
Johnson Controls, Inc. — 10 1/6 2/6 4/6 5/6 1/4 3/4 1/2 2015 First Quarter Building Efficiency* Commercial backlog and orders (at December 31, 2014) Backlog $4.6B, down 4% adjusted for FX Orders level, adjusted for FX ─ Hawaii DOT order in prior year of $150M 2015 2014 Net sales $3.5B $3.4B +5% Segment income $201M $146M +38% Segment income margin 5.7% 4.3% +140 bps BE sales (ex GWS) up 1% adjusted for FX and M&A North America up 3% Asia up 1% Latin America down double-digits BE margins (ex-GWS) 6.7%; up 110 bps North America results improved ADT performance in-line with company expectations Global Workplace Solutions revenues down 3%, margins up 150 bps Includes gain associated with contract settlement *Excluding transaction / integration costs.
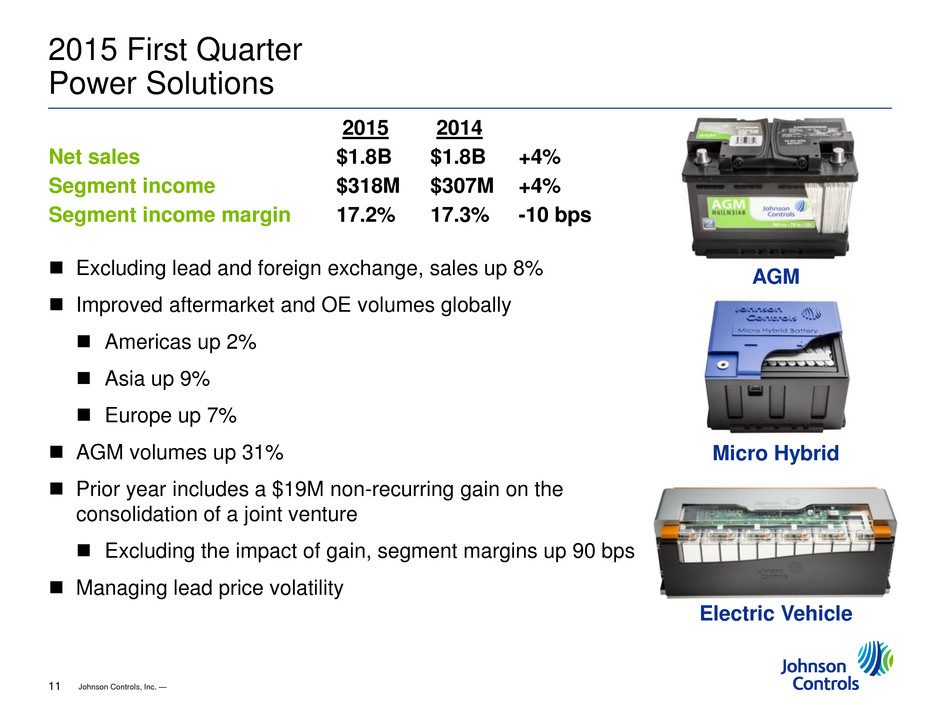
Johnson Controls, Inc. — 11 1/6 2/6 4/6 5/6 1/4 3/4 1/2 2015 2014 Net sales $1.8B $1.8B +4% Segment income $318M $307M +4% Segment income margin 17.2% 17.3% -10 bps Excluding lead and foreign exchange, sales up 8% Improved aftermarket and OE volumes globally Americas up 2% Asia up 9% Europe up 7% AGM volumes up 31% Prior year includes a $19M non-recurring gain on the consolidation of a joint venture Excluding the impact of gain, segment margins up 90 bps Managing lead price volatility 2015 First Quarter Power Solutions Micro Hybrid Electric Vehicle AGM
Johnson Controls, Inc. — 12 1/6 2/6 4/6 5/6 1/4 3/4 1/2 Automotive Interiors joint venture Regulatory approval received in most major geographies Chinese approvals expected in March with formal joint venture signing expected in April On track for July 1, 2015 closing Global Workplace Solutions divestiture Divestiture process tracking as expected Strong buyer interest Anticipate a Q3 announcement Brookfield Asset Management to purchase JCI interest in Brookfield Johnson Controls Canada (BJCC) and Brookfield Johnson Controls Australia/NZ (BJCA) joint ventures; estimate proceeds of $200M in Q2 Update on Portfolio Initiatives
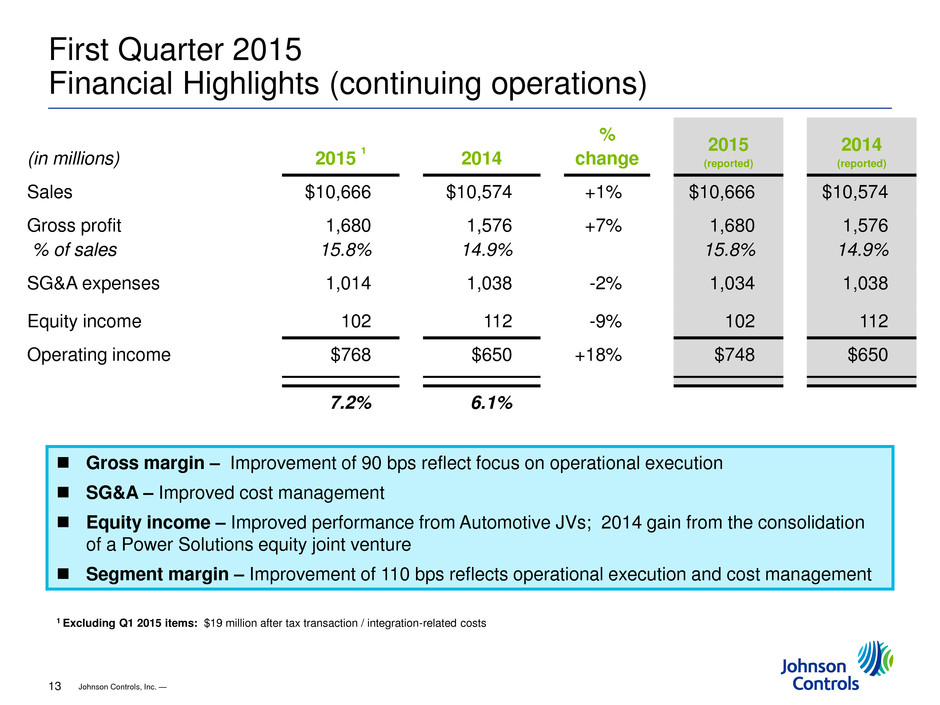
Johnson Controls, Inc. — 13 1/6 2/6 4/6 5/6 1/4 3/4 1/2 First Quarter 2015 Financial Highlights (continuing operations) (in millions) 2015 1 2014 % change 2015 (reported) 2014 (reported) Sales $10,666 $10,574 +1% $10,666 $10,574 Gross profit % of sales 1,680 15.8% 1,576 14.9% +7% 1,680 15.8% 1,576 14.9% SG&A expenses 1,014 1,038 -2% 1,034 1,038 Equity income 102 112 -9% 102 112 Operating income $768 $650 +18% $748 $650 7.2% 6.1% Gross margin – Improvement of 90 bps reflect focus on operational execution SG&A – Improved cost management Equity income – Improved performance from Automotive JVs; 2014 gain from the consolidation of a Power Solutions equity joint venture Segment margin – Improvement of 110 bps reflects operational execution and cost management 1 Excluding Q1 2015 items: $19 million after tax transaction / integration-related costs
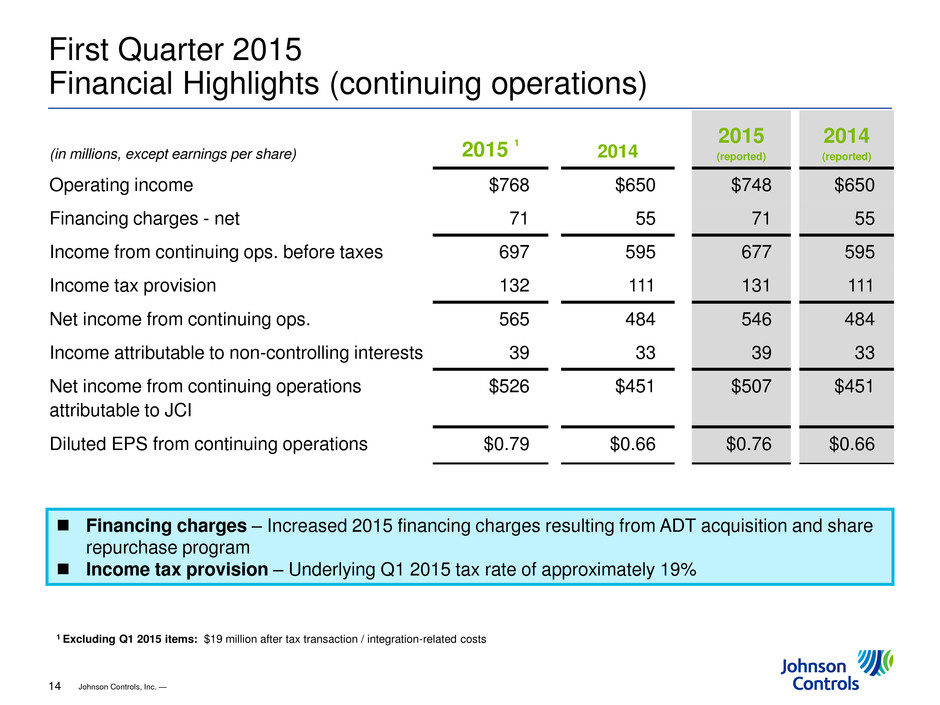
Johnson Controls, Inc. — 14 1/6 2/6 4/6 5/6 1/4 3/4 1/2 First Quarter 2015 Financial Highlights (continuing operations) (in millions, except earnings per share) 2015 1 2014 2015 (reported) 2014 (reported) Operating income $768 $650 $748 $650 Financing charges - net 71 55 71 55 Income from continuing ops. before taxes 697 595 677 595 Income tax provision 132 111 131 111 Net income from continuing ops. 565 484 546 484 Income attributable to non-controlling interests 39 33 39 33 Net income from continuing operations attributable to JCI $526 $451 $507 $451 Diluted EPS from continuing operations $0.79 $0.66 $0.76 $0.66 Financing charges – Increased 2015 financing charges resulting from ADT acquisition and share repurchase program Income tax provision – Underlying Q1 2015 tax rate of approximately 19% 1 Excluding Q1 2015 items: $19 million after tax transaction / integration-related costs
Johnson Controls, Inc. — 15 1/6 2/6 4/6 5/6 1/4 3/4 1/2 Balance Sheet / Cash Flow / Financial Guidance Q1 free cash flow improved $0.2 billion from Q1 FY14 Year-over-year improvement in trade working capital as a percentage of sales, adjusted for businesses held for sale Capital spending in line with company expectations Share repurchases of $0.6 billion in Q1 Net debt to capitalization of 40.5% at 12/31/14 2015 second quarter outlook Diluted EPS: $0.74 - $0.76* 2015 full year outlook Reaffirming fiscal 2015 guidance Diluted EPS: $3.55 - $3.70* *Excludes transaction / integration costs
