Attached files
| file | filename |
|---|---|
| EX-31.4 - EX-31.4 - Covidien plc | d853205dex314.htm |
| EX-31.3 - EX-31.3 - Covidien plc | d853205dex313.htm |
Table of Contents
UNITED STATES
SECURITIES AND EXCHANGE COMMISSION
Washington, D.C. 20549
FORM 10-K/A
Amendment No. 1
(Mark One)
| x | ANNUAL REPORT PURSUANT TO SECTION 13 OR 15(d) OF THE SECURITIES EXCHANGE ACT OF 1934 |
For the fiscal year ended September 26, 2014
OR
| ¨ | TRANSITION REPORT PURSUANT TO SECTION 13 OR 15(d) OF THE SECURITIES EXCHANGE ACT OF 1934 |
001-33259
(Commission File Number)
COVIDIEN PUBLIC LIMITED COMPANY
(Exact name of registrant as specified in its charter)
| Ireland | 98-0624794 | |
| (Jurisdiction of Incorporation) | (IRS Employer Identification No.) |
20 On Hatch, Lower Hatch Street
Dublin 2, Ireland
(Address of registrant’s principal executive office)
+353 (1) 438-1700
(Registrant’s telephone number)
Securities registered pursuant to Section 12(b) of the Act:
| Title of each class |
Name of each exchange on which registered | |
| Ordinary Shares, Par Value $0.20 | New York Stock Exchange |
Securities registered pursuant to Section 12(g) of the Act: None
Indicate by check mark if the registrant is a well-known seasoned issuer, as defined in Rule 405 of the Securities Act. Yes x No ¨
Indicate by check mark if the registrant is not required to file reports pursuant to Section 13 or Section 15(d) of the Act. Yes ¨ No x
Indicate by check mark whether the registrant (1) has filed all reports required to be filed by Section 13 or 15(d) of the Securities Exchange Act of 1934 during the preceding 12 months (or for such shorter period that the registrant was required to file such reports), and (2) has been subject to such filing requirements for the past 90 days. Yes x No ¨
Indicate by check mark whether the registrant has submitted electronically and posted on its corporate Website, if any, every Interactive Data File required to be submitted and posted pursuant to Rule 405 of Regulation S-T (§232.405 of this chapter) during the preceding 12 months (or for such shorter period that the registrant was required to submit and post such files). Yes x No ¨
Indicate by check mark if disclosure of delinquent filers pursuant to Item 405 of Regulation S-K is not contained herein, and will not be contained, to the best of registrant’s knowledge, in definitive proxy or information statements incorporated by reference in Part III of this Form 10-K or any amendment to this Form 10-K x.
Indicate by check mark whether the registrant is a large accelerated filer, an accelerated filer, a non-accelerated filer, or a smaller reporting company. See the definitions of “large accelerated filer,” “accelerated filer” and “smaller reporting company” in Rule 12b-2 of the Exchange Act.
| Large accelerated filer | x | Accelerated filer | ¨ | |||
| Non-accelerated filer | ¨ | Smaller reporting company | ¨ | |||
Indicate by check mark whether the registrant is a shell company (as defined in Rule 12b-2 of the Exchange Act). Yes ¨ No x
The aggregate market value of the voting and non-voting common equity held by non-affiliates of the registrant (assuming solely for the purposes of this calculation that all directors and executive officers of the registrant are “affiliates”) computed by reference to the price at which shares were last sold as of the last business day of the registrant’s most recently completed second fiscal quarter, was approximately $32,604 million.
The number of ordinary shares outstanding as of January 20, 2015 was 454,507,245.
Table of Contents
EXPLANATORY NOTE
Covidien plc (as referred to herein, “Covidien,” the “Company,” the “Registrant,” “we” or “our”) is filing this Amendment No. 1 on Form 10-K/A (this “Form 10-K/A”) to its Annual Report on Form 10-K for the fiscal year ended September 26, 2014, which was filed with the U.S. Securities and Exchange Commission (the “SEC”) on November 24, 2014 (the “Form 10-K”), to include certain information omitted from the Form 10-K in accordance with applicable SEC rules and regulations. Other than with respect to the Equity Compensation Plan information in Item 12 of the Form 10-K, the Registrant is hereby amending and replacing in their entirety Items 10, 11, 12, 13 and 14 in the Form 10-K to include such omitted information and Item 15 to include certifications with respect to this Form 10-K/A.
Except as described above, this Form 10-K/A does not amend, update or change any other items or disclosures in the Form 10-K, including any of the financial information disclosed in Parts II and IV of the Form 10-K, and does not purport to reflect any information or events subsequent to the filing of the Form 10-K. Accordingly, this Form 10-K/A should be read in conjunction with the Form 10-K and with the Registrant’s other filings with the SEC.
ii
Table of Contents
| Page | ||||
| Part III | ||||
| Item 10. | Directors, Executive Officers and Corporate Governance | 1 | ||
| Item 11. | Executive Compensation | 4 | ||
| Item 12. | Security Ownership of Certain Beneficial Owners and Management and Related Stockholder Matters | 34 | ||
| Item 13. | Certain Relationships and Related Transactions, and Director Independence | 35 | ||
| Item 14. | Principal Accounting Fees and Services | 37 | ||
| Part IV | ||||
| Item 15. | Exhibits, Financial Statement Schedules | 38 | ||
| Signatures | S-1 | |||
iii
Table of Contents
| Item 10. | Directors, Executive Officers and Corporate Governance |
Board of Directors
José E. Almeida - Mr. Almeida, age 52, has served as the Chairman of our Board of Directors since March 2012. He has served on our Board of Directors since becoming Covidien’s President and Chief Executive Officer in July 2011. Prior to assuming the role of President and Chief Executive Officer of Covidien, Mr. Almeida served, from October 2006 to June 2011, as the President of our Medical Devices business segment. Prior to that, from April 2004 to September 2006, Mr. Almeida was President of Covidien’s International business. From January 2003 to April 2004, Mr. Almeida was Chief Operating Officer of Greatbatch, Inc., a developer and manufacturer of power sources and components for implantable medical devices. Mr. Almeida joined the Company in 1995 as Director of Corporate Engineering and then held several positions of increasing responsibility, including Vice President of European Manufacturing and Vice President of Global Manufacturing, through December 2002. Mr. Almeida is Chairman of the Advanced Medical Technology Association (AdvaMed), a medical device trade association, and also serves on AdvaMed’s Executive Committee and as Chairman of its Board Committee on Ethics and Health Care Compliance. In addition, Mr. Almeida currently serves as a director of Analog Devices, Inc., EMC Corporation and State Street Corporation.
As our Chairman, President and Chief Executive Officer, Mr. Almeida is focused on positioning the Company for the future. After almost 18 years with the Company during which he, among other things, ran our largest business segment, led our international business and oversaw manufacturing operations, Mr. Almeida is familiar with all aspects of the business. Serving as a director of both State Street Corporation and AdvaMed, Mr. Almeida also understands the responsibilities of a board member. With his keen global perspective, results-driven nature, commitment to operational intensity and depth of Company knowledge, Mr. Almeida is an invaluable member of our Board of Directors.
Joy A. Amundson - Ms. Amundson, age 60, joined our Board of Directors in June 2012. Ms. Amundson is a principal of Amundson Partners, Inc., a healthcare consulting firm. From August 2004 to October 2010, Ms. Amundson was the President of Baxter BioScience Corporation and Vice President of Baxter International, Inc. Prior to Baxter, she was with Amundson Partners for three years. Prior to joining Amundson Partners, she was with Abbott Laboratories for over 20 years, where she held several key positions, including Senior Vice President. Ms. Amundson began her business career in sales and brand management with Procter & Gamble, a packaged goods company, from 1977 to 1982. Ms. Amundson previously served as a director of ApaTech, Dial Corporation, Ilex Oncology, Inc., Inamed Corporation and Oridion Medical Ltd. and currently serves as a director of ABIVAX.
From her years as President of Baxter BioScience Corporation as well as her position as a principal of a healthcare consulting firm and over 20 years as an executive of Abbott Laboratories, Ms. Amundson has deep insight into the healthcare industry. These positions, coupled with her Master’s Degree in management from Northwestern University’s Kellogg Graduate School of Management, also afford Ms. Amundson an understanding of what it takes to be a leader and guide a business successfully. In addition, her experience on numerous boards of directors gives her perspective on the critical role the board of directors plays in guiding a company at the very highest level. With her depth and breadth of experience, Ms. Amundson is a well-rounded and valuable member of our Board of Directors.
Craig Arnold - Mr. Arnold, age 54, joined our Board of Directors in June 2007 in connection with our establishment as a stand-alone public company. Mr. Arnold is the Vice Chairman and Chief Operating Officer, Industrial Sector of Eaton Corporation, a diversified industrial manufacturer. From 2000 to 2008 he served as Senior Vice President of Eaton Corporation and President of the Fluid Power Group of Eaton. Prior to joining Eaton, Mr. Arnold was employed in a series of progressively more responsible positions at General Electric Company from 1983 to 2000. Mr. Arnold previously served as a director of Unocal Corporation, where he also was a member of the audit committee.
With his years of managerial experience, both at Eaton and at General Electric, Mr. Arnold brings to the Board of Directors demonstrated management ability at senior levels. His position as Chief Operating Officer of the Eaton Industrial Sector gives Mr. Arnold critical insights into the operational requirements of a large, multinational company. In addition, in previously serving on the audit committee of another public company, Mr. Arnold gained valuable experience dealing with accounting principles and financial reporting rules and regulations, evaluating financial results and generally overseeing the financial reporting process of a large corporation.
Robert H. Brust - Mr. Brust, age 71, joined our Board of Directors in June 2007 in connection with our establishment as a stand-alone public company. Mr. Brust served as the Chief Financial Officer of Sprint Nextel Corporation, a wireless and wireline communications company, from May 2008 until his retirement in April 2011. From February 2007 to May 2008, Mr. Brust was retired. From January 2000 to February 2007, Mr. Brust served as Executive Vice President of Eastman Kodak Company, a provider of photographic products and services, and, from January 2000 to November 2006, he also served as Chief Financial Officer of Kodak. Prior to joining Kodak, Mr. Brust was Senior Vice President and Chief Financial Officer of Unisys Corporation from 1997 to
1
Table of Contents
1999. He also worked in a variety of financial and financial management positions at General Electric Company from 1965 to 1997. Mr. Brust is currently a director of Smith & Wesson Holding Corporation and previously served as a director of Delphi Corporation and Applied Materials, Inc.
Mr. Brust is an experienced financial leader. His service as Chief Financial Officer of Sprint Nextel Corporation, the Eastman Kodak Company and Unisys Corporation as well as his 31 years at General Electric Company make him a valuable asset, both on our Board of Directors and on our Audit Committee. Mr. Brust’s positions have provided him with a wealth of knowledge in dealing with financial and accounting matters. The depth and breadth of his exposure to complex financial issues at such large corporations makes him a skilled advisor.
Christopher J. Coughlin - Mr. Coughlin, age 62, joined our Board of Directors in June 2007 in connection with our establishment as a stand-alone public company. He is currently a non-employee senior advisor to McKinsey & Company, a strategy consulting firm. Mr. Coughlin served as an advisor to Tyco International, a global provider of security products and services, fire protection and detection products and services, valves and controls, and other industrial products from December 2010 to September 2012. From March 2005 to December 2010, Mr. Coughlin served as Executive Vice President and Chief Financial Officer of Tyco International. Prior to joining Tyco International, Mr. Coughlin served as Chief Operating Officer of The Interpublic Group of Companies, Inc., from June 2003 to December 2004. He joined Interpublic from Pharmacia Corporation, where he was Chief Financial Officer from 1998 to 2003. Previously, he held the position of Executive Vice President and Chief Financial Officer of Nabisco Holdings, where he also served as President of Nabisco International. Mr. Coughlin is currently the non-executive Chairman of The Dun & Bradstreet Corporation board and a director of Actavis plc and Alexion Pharmaceuticals, Inc. He previously served as a director of Perrigo Company, Monsanto Company, Interpublic, Forest Laboratories, Inc. (acquired by Actavis plc) and Dipexium Pharmaceuticals, Inc.
As Chief Financial Officer of Tyco International, Pharmacia Corporation and Nabisco Holdings and as Chief Operating Officer of The Interpublic Group of Companies, Mr. Coughlin has demonstrated leadership capability and extensive knowledge of complex financial and operational issues facing large organizations. He brings an understanding of operations and financial strategy in challenging environments. In addition, Mr. Coughlin is able to draw upon, among other things, his knowledge of the medical device industry in general and Covidien’s business in particular, garnered while Covidien constituted the healthcare business of Tyco International.
Randall J. Hogan, III - Mr. Hogan, age 59, joined our Board of Directors in June 2007 in connection with our establishment as a stand-alone public company. Mr. Hogan has served as Chief Executive Officer of Pentair, Inc., an industrial manufacturing company, since January 2001 and was appointed Chairman in May 2002. From December 1999 to December 2000, he was President and Chief Operating Officer of Pentair and from March 1998 to December 1999, he was Executive Vice President and President of Pentair’s Electrical and Electronic Enclosures Group. Prior to joining Pentair, he was President of the Carrier Transicold Division of United Technologies Corporation. Before that, he was with the Pratt & Whitney division of United Technologies, General Electric Company and McKinsey & Company. Mr. Hogan currently serves as chairman of the board of the Federal Reserve Bank of Minneapolis and previously served as a director of Unisys Corporation.
Having served in the roles of Chairman, Chief Executive Officer, President and Chief Operating Officer of Pentair, Mr. Hogan offers a wealth of management experience and business acumen. Running a public company gives Mr. Hogan front-line exposure to many of the issues facing public companies, particularly on the operational, financial and corporate governance fronts. Mr. Hogan’s service on the Board of Directors and Governance Committee of Unisys as well as on the board of the Federal Reserve Bank of Minneapolis further augments his range of knowledge, providing experience on which he can draw while serving as a member of our Board and Chairman of our Audit Committee.
Dennis H. Reilley - Mr. Reilley, age 61, joined our Board of Directors in June 2007 in connection with our establishment as a stand-alone public company and served as the Chairman of our Board of Directors until October 2008. Mr. Reilley has been our Lead Director since March 2013. From 2000 to April 2007, Mr. Reilley served as Chairman of Praxair, Inc., a supplier of industrial gases and high-performance surface coatings. Mr. Reilley also served as Chief Executive Officer of Praxair from 2000 to December 2006. Prior to joining Praxair, Mr. Reilley held many key positions at E.I. du Pont de Nemours and Company from 1989 to 1998 when he was named Chief Operating Officer. Earlier in his career he held various managerial positions at Conoco. Mr. Reilley is currently a director of The Dow Chemical Company and non-executive Chairman of Marathon Oil Corporation.
As Chairman and Chief Executive Officer of Praxair and Chief Operating Officer of DuPont, Mr. Reilley took on significant management, strategic and operational responsibilities. With his knowledge of the complex issues facing global companies today and his understanding of what makes businesses work effectively and efficiently, Mr. Reilley provides valuable insight to our Board. Mr. Reilley’s experience as Chairman of the Praxair Board of Directors as well as his service on the Governance and Compensation Committees of H.J. Heinz and Marathon Oil, the Audit Committee of H.J. Heinz and on the Audit and Compensation Committees of Dow Chemical, position him well to serve as our Lead Director.
Stephen H. Rusckowski - Mr. Rusckowski, age 57, joined our Board of Directors in December 2013. Mr. Rusckowski has been the President and Chief Executive Officer of Quest Diagnostics Incorporated, a provider of medical diagnostic testing, information and
2
Table of Contents
services, since May 2012. Prior to May 2012, since November 2006, Mr. Rusckowski was the Chief Executive Officer of Philips Healthcare, the largest unit of Royal Philips Electronics, and a member of the Board of Management of Royal Philips Electronics and its Executive Committee. Prior to that role, Mr. Rusckowski was CEO of the Imaging Systems business group within the company. Before joining Philips, he led Hewlett-Packard/Agilent Technologies Healthcare Solutions Group as Senior Vice President and General Manager. He joined Philips when it acquired Agilent’s Healthcare Solutions Group in 2001. Mr. Rusckowski currently serves as a director of Quest Diagnostics.
With his extensive executive experience, including in strategic planning and international operations, Mr. Rusckowski brings to the board demonstrated leadership capability and business acumen. As the CEO of a public company, he is familiar with numerous issues faced by a public company, particularly on the operational, financial and corporate governance fronts. His experience with multinational corporations operating in the healthcare industry makes him an ideal member of our Board of Directors.
Joseph A. Zaccagnino - Mr. Zaccagnino, age 68, joined our Board of Directors in June 2007 in connection with our establishment as a stand-alone public company. Mr. Zaccagnino, who has held leadership positions in the healthcare sector for over 40 years, served as President, Chief Executive Officer and Director of Yale New Haven Health System and its flagship Yale-New Haven Hospital, one of the country’s largest and most prominent academic medical center hospitals and the primary teaching and research affiliate of the Yale University School of Medicine, from 1991 until his retirement in 2005. Yale New Haven Health System facilities include free-standing: acute care adult and children’s hospitals; psychiatric and cancer hospitals; rehabilitation services; ambulatory surgery, outpatient diagnostic imaging, primary care and emergency centers; and health insurance products. Mr. Zaccagnino previously served as a director of NewAlliance Bancshares, Inc. Mr. Zaccagnino is currently a director of Mallinckrodt plc where he serves on the Compliance Committee and is Chairman of the Nominating and Governance Committee.
Nationally, Mr. Zaccagnino has served as Chairman of the Board of the National Committee for Quality Healthcare and as Chairman of the Board of VHA Inc., a network of healthcare organizations and physicians who collaborate on best clinical and operating practices and which provides supply chain and group purchasing services through its subsidiary, Novation. His broad healthcare management and governance experience and his knowledge of healthcare policy and regulation, patient care delivery and financing and of clinical research and medical technology assessment provides our Board with unique insights and a keen perspective on the complexities of the healthcare industry and on the priorities of and challenges facing both our Company and our major customers.
Executive Officers
Please see the information contained under the heading “Executive Officers of the Registrant” in the Form 10-K filed by the Company with the SEC on November 24, 2014.
Audit Committee
The Board has a separately designated Audit Committee established in accordance with the Securities Exchange Act of 1934. The Audit Committee monitors the integrity of our financial statements, the independence and qualifications of the independent auditors, the performance of our internal auditors and independent auditors, our compliance with legal and certain regulatory requirements and the effectiveness of our internal controls. The Audit Committee is also responsible for selecting, retaining, evaluating, setting the remuneration of and, if appropriate, recommending the termination of our independent auditors. The members of the Audit Committee are Craig Arnold, Robert H. Brust and Randall J. Hogan, III, each of whom is independent under SEC rules and NYSE listing standards applicable to audit committee members. Mr. Hogan is the Chair of the Audit Committee. The Board has determined that Mr. Brust and Mr. Hogan are audit committee financial experts. The Audit Committee operates under a charter approved by the Board of Directors, which is posted on our website at www.covidien.com.
Compensation Committee Interlocks and Insider Participation
The members of the Compensation and Human Resources Committee of our Board of Directors (the “Compensation Committee”) are Dennis H. Reilley and Stephen H. Rusckowski. No member of our Compensation Committee during fiscal 2014 is or has been an officer or employee of Covidien, and no member of our Compensation Committee during fiscal 2014 had any relationships requiring disclosure by Covidien under the SEC’s rules requiring disclosure of certain relationships and related-party transactions. No executive officer of Covidien during fiscal 2014 served on the compensation committee or board of directors of any company that employed any member of our Compensation Committee or Board.
Section 16(a) Beneficial Ownership Reporting Compliance
Section 16(a) of the Securities Exchange Act of 1934 requires our officers and directors and persons who beneficially own more than 10 percent of our ordinary shares to file reports of ownership and changes in ownership of such ordinary shares with the SEC . These persons are required by SEC regulations to furnish us with copies of all Section 16(a) forms they file. As a matter of practice, our administrative staff assists our officers and directors in preparing initial reports of ownership and reports of changes in ownership and files those reports on their behalf. Based on our review of the copies of such forms we have received, as well as information provided and representations made by the reporting persons, we believe that all required Section 16(a) reports were timely filed during our fiscal year ended September 26, 2014.
Code of Ethics
We have adopted the Covidien Guide to Business Conduct, which applies to all of our employees, officers and directors. The Guide to Business Conduct meets the requirements of a “code of ethics” as defined by SEC regulations and applies to our Chief Executive Officer, Chief Financial Officer and Chief Accounting Officer, as well as all other employees, as indicated above. The Guide to Business Conduct also meets the requirements of a code of business conduct and ethics under the listing standards of the NYSE. The Guide to Business Conduct is posted on our website at www.covidien.com under the heading “Investor Relations - Corporate Governance.” We disclose any material amendments to the Guide to Business Conduct, as well as any waivers for executive officers or directors, on our website.
3
Table of Contents
| Item 11. | Executive Compensation |
Compensation Discussion and Analysis
This Compensation Discussion and Analysis (“CD&A”) relates to our Chief Executive Officer, Chief Financial Officer and the three other most highly compensated executive officers of the Company in fiscal 2014.
Executive Summary
The Compensation Committee has adopted an integrated executive compensation program that is intended to align our named executive officers’ interests with those of our shareholders and to promote the creation of shareholder value without encouraging excessive or unnecessary risk-taking. Additionally, the Compensation Committee has tied a majority of our named executive officers’ compensation to a number of key performance measures that contribute to or reflect shareholder value. Specifically, in addition to a base salary, our named executive officers’ compensation package includes an annual incentive compensation program that is based on the Company’s attainment of objective pre-established financial performance metrics and long-term equity awards consisting in part of performance share units (“PSUs”) which are tied to relative total shareholder return performance. Our executive compensation programs have played a significant role in our ability to attract and retain the experienced, successful executive team that drives our financial results over time.
Company Performance and Executive Compensation in 2014
The Company finished fiscal 2014 with a strong operating performance.
| • | Net sales increased 4% on a reported basis in fiscal 2014, as the negative impact of foreign exchange rates reduced the sales growth rate by one percentage point. |
| • | The Company generated strong cash flow and again returned a substantial portion of free cash flow to shareholders. Following three years of returning more than 70% of free cash flow to shareholders, more than 50% was returned in fiscal 2014, despite restrictions in the Medtronic transaction agreement entered into in June 2014 and Irish Takeover Rules, which limited our ability to repurchase shares. We define free cash flow as cash provided by operating activities minus capital expenditures. |
| • | The Company continued to make investments in selling and marketing to enable its future growth. Emerging markets continued to be a key focus area, as overall sales grew 14% in fiscal 2014, led by an increase of 16% in the BRIC (Brazil, Russia, India, China) countries. |
Our positive financial results for fiscal 2014 directly affected our named executive officers’ compensation. The Company’s strong performance for all three Company-wide fiscal 2014 annual incentive plan performance targets resulted in payouts under the 2014 annual incentive plan to our corporate-level named executive officers at 163% of target performance level. In addition, PSUs vesting at the end of fiscal 2014 were paid out at two times the target award, which reflect the Company’s fiscal 2012-2014 total shareholder return in the top quartile of peer group performance for that same period. Other financial and operating highlights include the following:
| • | The Company increased its dividend by 13%, the sixth consecutive double-digit annual increase. |
| • | The Company made several strategic acquisitions in fast-growing, high margin product categories and divested its Confluent biosurgery product line to enable even greater focus on growth initiatives. |
| • | Maintaining its focus on innovation, the Company launched more than 20 new products across the business and opened three Covidien Centers of Innovation in emerging markets. |
4
Table of Contents
Consideration of Say-on-Pay Results
In making its decisions regarding named executive officer compensation, the Compensation Committee considers the results of the management say-on-pay proposal which is presented to shareholders for approval annually. After considering the strong support the proposal received (the say-on-pay proposal received support of over 94% of the votes cast in both 2014 and 2013) as well as the Committee’s view of the value of consistency from year to year in both our approach to compensation and the selection of balanced elements of compensation, the Committee concluded that no changes to the elements of compensation for our named executive officers from fiscal 2013 to fiscal 2014 were necessary. As a result, our compensation policies and decisions, explained in detail in this CD&A, continue to be focused on long-term financial performance to drive shareholder value.
Executive Compensation Governance Structure
The Company is committed to integrity and the highest standards of ethical conduct. The following aspects of the Company’s compensation program reinforce that commitment and illustrate our commitment to good governance.
| What We DO | What We Do NOT Do | |
| Align pay with performance, emphasizing performance-based compensation, rather than entitlements such as perquisites
Defer a significant amount of incentive compensation, discouraging short-term risk taking at the expense of long-term results
Maintain an executive incentive compensation recoupment (claw-back) policy to promote accountability
Require forfeiture of awards and recoupment of profits realized on equity awards in the event of a termination of employment for cause
Retain an independent compensation consultant who provides no other services to the Company
Maintain a cap on annual and long-term incentive award payouts to limit windfalls
Utilize robust share ownership guidelines to promote long-term ownership, long-term shareholder perspective and responsible practices
Conduct an annual risk review by the Compensation Committee of our incentive compensation program |
No employment agreements
No 280G excise tax assistance (gross-ups) upon a change in control
No short-selling or options trading, hedging transactions or speculative transactions in Company shares permitted
No excessive perquisites
No tax gross-ups on perquisites
No option repricing or backdating of options | |
2014 Compensation Elements and Decisions
When setting compensation for named executive officers, the Compensation Committee focuses on total direct compensation. Total direct compensation includes three major components - base salary, annual incentive compensation and long-term equity incentive awards - all of which are designed to work together to drive a complementary set of behaviors and outcomes.
| • | Base salary. Base salary is intended to reflect the market value of each named executive officer’s role, with differentiation for individual capability. |
| • | Annual incentive compensation. Annual incentive compensation in the form of a market-competitive, performance-based cash bonus is designed to focus our executives on pre-set objectives each year and drive specific behaviors that foster short-term and long-term growth and profitability. |
| • | Long-term equity incentive awards. Long-term incentive compensation generally consists of grants of PSUs, stock options and time-vesting restricted stock units. Long-term incentive compensation is designed to (i) align the interests of named executive officers with the interests of our shareholders in long-term growth and stock performance and reward executives for shareholder value creation, (ii) recognize executives for their contributions to the Company, (iii) highlight the strategic significance of each named executive officer’s role and (iv) promote retention. |
5
Table of Contents
In addition to receiving direct compensation, named executive officers also participate in various employee benefit programs, as described near the end of this CD&A, which programs are generally the same as those provided to the Company’s broad-based employee population.
As described in this CD&A under “How We Determine Compensation - Key Considerations in Determining Compensation,” two of the core principles of the Company’s compensation philosophy are that compensation should support effective governance, and that compensation should be viewed from a total direct compensation perspective, considering each direct compensation element with a view to the aggregate value and effect of all other direct compensation elements. Accordingly, in setting compensation, the Compensation Committee considers whether the direct compensation elements, individually and in the aggregate, create incentives that encourage behavior consistent with the overall interests of the Company.
In determining compensation packages for our named executive officers, the Compensation Committee seeks to strike an appropriate balance between fixed and variable compensation and between short- and long-term compensation. We believe that making a significant portion of our named executive officers’ compensation variable and long-term supports our pay-for-performance executive compensation philosophy while also mitigating potential excessive risk-taking behavior.
The following charts illustrate, for fiscal 2014, the distribution of value among the three elements of direct compensation - base salary, target annual incentive awards and long-term equity incentives - for our Chief Executive Officer and for the other named executive officers. (The long-term equity incentive component is based on the dollar value awarded by the Compensation Committee before conversion to the various forms of equity awards - see the “Long-Term Incentive Awards” section of this CD&A.) Of target total direct compensation, 89% of our CEO’s and 80% of the other named executive officers’ was variable, either because it is subject to performance goals, the fluctuations of our stock price, or both.
Elements of Compensation
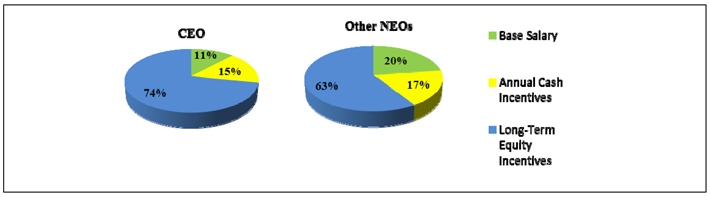
Base Salary
Base salary, which represents only 11% of our Chief Executive Officer’s target total direct compensation and 20% of target total direct compensation for the other named executive officers, is paid in order to provide a fixed component of compensation for the named executive officers. Each named executive officer’s base salary is designed to be competitive with comparable positions in our peer group companies and market data, generally targeting the market median, with high performers and/or specialized talent receiving above the 50th percentile. The components of market data are described in the “How We Determine Compensation - Peer Group Reviews and Market Data” section of this CD&A. Actual base salary may be above or below market median based on a variety of factors, including the complexity and unique challenges of the position and the individual skills, experience, background and performance of the executive. In setting base salaries for named executive officers for calendar year 2014, the Compensation Committee reviewed, among other things, a summary prepared by its independent compensation consultant, Steven Hall & Partners, which detailed each named executive officer’s 2013 base salary and total cash compensation as well as proposed 2014 base salary and target cash compensation compared to 2014 market data.
6
Table of Contents
The Compensation Committee approved base salary increases, which became effective December 31, 2013, as follows:
| Executive Officer |
2013 Base Salary(1) | 2014 Base Salary(1) | % Change | |||||||||
| José E. Almeida |
$ | 1,225,000 | $ | 1,250,000 | 2.0 | % | ||||||
| Charles J. Dockendorff |
$ | 787,600 | $ | 811,200 | 3.0 | % | ||||||
| John H. Masterson |
$ | 585,500 | $ | 603,100 | 3.0 | % | ||||||
| Bryan C. Hanson |
$ | 562,400 | $ | 607,400 | (2) | 8.0 | % | |||||
| Peter L. Wehrly |
$ | 562,400 | $ | 584,900 | 4.0 | % | ||||||
| (1) | The Compensation Committee sets base salaries on a calendar year basis. Accordingly, the base salary amounts noted in this table, which represent calendar year base salaries, differ from the base salary amounts set forth in the Summary Compensation Table because the Summary Compensation Table reports amounts actually earned during our fiscal year, from September 28, 2013 to September 26, 2014. |
| (2) | On July 16, 2014, the Compensation Committee approved an increase in Mr. Hanson’s base salary from $607,400 to $702,000 in connection with Mr. Hanson’s assumption of the role of Group President, Covidien. Mr. Hanson assumed his new role, and the increase in his compensation took effect, at the beginning of Covidien’s fiscal year 2015. |
In setting Mr. Almeida’s compensation when he was named President and Chief Executive Officer in fiscal 2011, the Compensation Committee considered, among other things, the compensation of Chief Executive Officers of peer companies, the compensation of the Company’s then President and Chief Executive Officer and the business experience of Mr. Almeida. For his initial year as President and Chief Executive Officer, the Compensation Committee established Mr. Almeida’s compensation at the 35th percentile of compensation paid to Chief Executive Officers of our peer companies to allow for increases in his compensation as he developed as Chief Executive Officer. Mr. Almeida’s base salary was increased to just under the 50th percentile of the market for calendar 2012 and 2013. Based on Mr. Almeida’s positive performance evaluation, the Company’s continued profitability, a review of total direct compensation and a comparison to market data, the Committee determined that Mr. Almeida’s base salary for 2014 should be increased by 2%. Given the Company’s 2013 spin-off of its pharmaceuticals business - and resulting decrease in the market data revenue scope - the 2% increase placed Mr. Almeida’s base salary just above the 75th percentile of market data for 2014. The Compensation Committee considered desired marketplace positioning as well as potential future Company plans that could impact the size and complexity of the Chief Executive Officer role, and determined the increase was appropriate.
The 2014 annual base salary increases for Messrs. Dockendorff, Masterson, Hanson and Wehrly were based on a consideration of individual performance, assessment of the value of the individual to the Company, a review of total direct compensation, internal equity considerations and a comparison to market data as discussed in the “How We Determine Compensation” section of this CD&A. In setting Mr. Hanson’s base salary, the Compensation Committee also considered a recent corporate reorganization and the resulting increase in the scope of Mr. Hanson’s role and the size of the business for which he is responsible. Accordingly, Mr. Hanson’s base salary for 2014 was increased 8% as compared to his 2013 base salary. While Mr. Hanson’s base salary for 2013 positioned him at approximately the 50th percentile of base salary compensation paid to executives in comparable positions, given that the market data revenue scope against which Mr. Hanson’s base salary was compared more than doubled from 2013 to 2014, this 8% increase in base salary for 2014 positioned Mr. Hanson just below the 50th percentile of base salary compensation paid to executives in comparable positions, based on market data. While Mr. Wehrly’s base salary for 2013 also positioned him at approximately the 50th percentile of base salary compensation paid to executives in comparable positions, given that the market data revenue scope against which Mr. Wehrly’s base salary was compared decreased slightly for 2014, the 4% increase in his base salary for 2014 positioned him just below the 75th percentile of base salary compensation paid to executives in comparable positions, based on market data.
Messrs. Masterson and Dockendorff both received 3% annual base salary increases for 2014, which positioned them just above the 75th percentile and between the 50th and 75th percentile, respectively, of base salary compensation paid to executives in comparable positions, based on market data. Messrs. Masterson and Dockendorff received salary increases in recognition of their consistently high performance and long-term contributions to the Company as well as the key role each played during fiscal 2013 in furthering a number of the Company’s most important strategic initiatives, including the successful spin-off of the Company’s pharmaceuticals business. Mr. Dockendorff led a number of initiatives which resulted in increased net sales and operating income and generated substantial cash flow. Mr. Masterson, among other things, successfully managed the Company’s risk profile and continued to enhance the Company’s stringent compliance program. In addition, Messrs. Dockendorff and Masterson each received the highest possible performance rating in recognition of their successes during the year.
7
Table of Contents
Annual Incentive Compensation
Annual incentive compensation supports the Compensation Committee’s pay-for-performance philosophy and aligns individual goals with Company goals. Under our annual incentive plan, which is an element of our Stock and Incentive Plan, employees are eligible for cash awards based on the Company’s attainment of pre-established performance metrics. Consistent with its past practice, the Compensation Committee structured the 2014 annual incentive plan as follows:
| • | At the beginning of the fiscal year, the Compensation Committee established performance measures and goals, which included the financial and strategic metrics being assessed, performance targets for each metric, including threshold annual performance requirements to earn an award, and maximum performance scores. |
| • | Also at the beginning of the fiscal year, the Compensation Committee set individual target awards for each executive, expressed as a percentage of base salary, based on the executive’s level of responsibility and upon an examination of compensation information from our peer group and market data. |
| • | After the close of the fiscal year, the Compensation Committee received a report from management regarding Company and business unit performance against the pre-established performance goals. Awards were based on each named executive officer’s individual award target percentage and the overall Company and/or individual business unit’s performance relative to the specific performance goal, as certified by the Compensation Committee. |
Setting Annual Performance Metrics. The Compensation Committee sets the performance metrics as well as the performance targets for each metric. There are two primary classifications of performance metrics utilized in the annual incentive plan, Core Financial Metrics and Strategic Focus Metrics. Each performance metric represents part of the total award calculation, with the Core Financial Metrics accounting for, in the aggregate, 70% of the performance score and the Strategic Focus Metrics accounting for, in the aggregate, 30% of the performance score. The weight of each element of the Core Financial Metrics and Strategic Focus Metrics is shown in the “Fiscal 2014 Annual Incentive Plan Results” table below.
| • | Core Financial Metrics. For the fiscal 2014 annual incentive plan, the Core Financial Metrics applicable to Messrs. Almeida, Dockendorff and Masterson, all of whom served as executive officers at the corporate level, were based on Company sales growth and Company net income. The Core Financial Metrics applicable to Mr. Hanson, who was Group President, Medical Devices and U.S. during fiscal 2014, were sales growth for Medical Devices worldwide and operating income for Medical Devices in the U.S. The Core Financial Metrics applicable to Mr. Wehrly, who was Group President, Developed Markets during fiscal 2014, were sales growth and operating income for Developed Markets. The Compensation Committee chose to keep sales growth and net/operating income as performance measures because they are important drivers of shareholder value and are key metrics in the Company’s strategic plan. |
| • | Strategic Focus Metrics. For fiscal 2014, the Strategic Focus Metric applicable to Messrs. Almeida, Dockendorff, Masterson and Wehrly was based on Company cash flow. Company cash flow was utilized as a Strategic Focus Metric to drive focus and accountability on this key strategic priority of the Company. Company cash flow was also a Strategic Focus Metric for Mr. Hanson, along with sales growth for Medical Devices in the U.S. |
Establishing Minimum Performance Requirements and Maximum Payout Caps. In addition to setting the performance metrics, at the beginning of the fiscal year the Compensation Committee also established threshold, target and maximum performance requirements for each named executive officer. For fiscal 2014, the threshold performance requirement established for at least one of the Core Financial Metrics applicable to each named executive officer had to be achieved in order for any payout to be made to the executive under the annual incentive plan. If the maximum performance requirement for a metric applicable to a named executive officer is exceeded, any payout associated with that metric is capped at the maximum performance level. For fiscal 2014, the Company exceeded the minimum performance levels at the applicable Company and business unit levels.
8
Table of Contents
For the Core Financial Metrics and the Strategic Focus Metrics, thresholds and maximums for fiscal 2014 were as follows:
| Performance Metric |
Threshold |
Maximum | ||
| Sales Growth (Company, Developed Markets and Medical Devices – U.S.) |
2.5 percentage points below target |
1.5 percentage points above target | ||
| Sales Growth (Medical Devices – worldwide) |
2.6 percentage points below target |
1.8 percentage points above target | ||
| Net Income (Company) |
95% of target | 105% of target | ||
| Cash Flow (Company) |
95% of target | 105% of target | ||
| Operating Income (Medical Devices – U.S.) |
92% of target | 108% of target | ||
| Operating Income (Developed Markets) |
97% of target | 102% of target |
Establishing Individual Target Awards. In setting individual target awards for fiscal 2014, the Compensation Committee reviewed, for each named executive officer, the individual target awards applicable in fiscal 2013, the total cash compensation established for fiscal 2013 and the projected cash compensation for fiscal 2014, considering how the total cash compensation of each named executive officer compared to peer group and related market data, and the responsibilities of each named executive officer. Following this review, and in light of peer group data and the overall compensation of each named executive officer, the Compensation Committee determined to maintain the individual target awards for Messrs. Dockendorff, Masterson and Wehrly at the same level as fiscal 2013: 85% for Mr. Dockendorff and 80% for Messrs. Masterson and Wehrly. Given his continued strong performance as chief executive officer and extremely positive performance review, the Compensation Committee increased the individual target award for Mr. Almeida from 130% for fiscal 2013 to 133% for fiscal 2014. In addition, in light of Mr. Hanson’s expanding role in the Company and increased responsibilities, the Compensation Committee increased his individual target award from 80% for fiscal 2013 to 85% for fiscal 2014. In July 2014, the Compensation Committee approved a further increase in Mr. Hanson’s individual target award from 85% to 90% in connection with Mr. Hanson’s assumption of the role of Group President, Covidien. Mr. Hanson assumed his new role, and the increase in his compensation took effect, at the beginning of Covidien’s fiscal year 2015. These individual target award levels placed the named executives’ target annual incentive at approximately comparable percentiles as their base salaries relative to peer group positions. Threshold award payments are 50% of target, and maximum award payments are 200% of target amounts.
Calculating Performance Scores. In calculating the annual incentive plan results, if the applicable threshold for at least one Core Financial Metric is met, then a performance multiplier for each performance metric is determined and the overall performance score is calculated. For each performance metric (whether a Core Financial Metric or a Strategic Focus Metric), the performance multiplier would be 0 if performance is below threshold, 0.5x if performance is at threshold, 1x if performance is at target and 2x if performance is at or above the maximum performance level. The performance multiplier for performance between threshold and maximum is determined by linear interpolation. The performance multiplier for each performance metric is multiplied by the weighting percentage to obtain a performance score for that metric. The performance scores for each metric are added together for an overall performance score. That overall performance score is then multiplied by the applicable executive officer’s individual target award to arrive at his actual payment amount.
9
Table of Contents
The table below summarizes the performance metrics, weighting, targets, actual results and the resulting performance multipliers and scores that determined the fiscal 2014 annual incentive awards for our named executive officers. The actual award payments are reported in the “Non-Equity Incentive Plan Compensation” column of the Summary Compensation Table and the threshold, target and maximum bonus amounts are reported in the “Estimated Future Payouts Under Non-Equity Incentive Plan Awards” column of the Fiscal 2014 Grants of Plan-Based Awards Table.
Fiscal 2014 Annual Incentive Plan Results
| Executive Officer |
Performance Metrics |
Weight | Performance Target (1) |
Performance Results |
Performance Multiplier |
Performance Score |
||||||||||||||||||
| (dollars in millions) | ||||||||||||||||||||||||
| José E. Almeida
Charles J. Dockendorff
John H. Masterson |
Core Financial Metrics (70%) |
Net Income (Company) |
35 | % | $ | 1,837 | $ | 1,928 | 1.994x | 70 | % | |||||||||||||
| Sales Growth (Company) |
35 | % | 4.5 | % | 4.3 | % | .944x | 33 | % | |||||||||||||||
| Strategic Focus Metrics (30%) |
Cash Flow (Company) |
30 | % | $ | 1,717 | $ | 1,982 | 2.0x | 60 | % | ||||||||||||||
|
|
|
|
|
|
|
|
|
|
|
|||||||||||||||
| Performance Score Total |
|
163 | % | |||||||||||||||||||||
|
|
|
|
|
|
|
|
|
|
|
|||||||||||||||
| Bryan C. Hanson | Core Financial Metrics (70%) | Operating Income (Medical Devices – U.S.) |
35 | % | — | (2) | — | (2) | 1.829x | 64 | % | |||||||||||||
| Sales Growth (Medical Devices – worldwide) |
35 | % | — | (2) | — | (2) | .924x | 32 | % | |||||||||||||||
| Strategic Focus Metrics (30%) |
Cash Flow (Company) |
15 | % | $ | 1,717 | $ | 1,982 | 2.0x | 30 | % | ||||||||||||||
| Sales Growth (Medical Devices – U.S.) |
15 | % | — | (2) | — | (2) | 1.072x | 16 | % | |||||||||||||||
|
|
|
|
|
|
|
|
|
|
|
|||||||||||||||
| Performance Score Total |
|
142 | % | |||||||||||||||||||||
|
|
|
|
|
|
|
|
|
|
|
|||||||||||||||
| Peter L. Wehrly | Core Financial Metrics (70%) | Operating Income (Developed Markets) |
35 | % | $ | 1,579 | $ | 1,559 | .7523x | 26 | % | |||||||||||||
| Sales Growth (Developed Markets) |
35 | % | 3.3 | % | 3.2 | % | .977x | 34 | % | |||||||||||||||
| Strategic Focus Metrics (30%) |
Cash Flow (Company) |
30 | % | $ | 1,717 | $ | 1,982 | 2.0x | 60 | % | ||||||||||||||
|
|
|
|
|
|
|
|
|
|
|
|||||||||||||||
| Performance Score Total |
|
120 | % | |||||||||||||||||||||
|
|
|
|
|
|
|
|
|
|
|
|||||||||||||||
| (1) | The performance metrics established for compensation purposes include non-GAAP financial measures which exclude the effects of potential special or non-operating items which the Compensation Committee believes may mask the underlying operating results and/or business trends of the Company or business unit, as applicable. The categories of these potential extraordinary items are specified at the beginning of the fiscal year when the performance measure is approved and, for the 2014 annual incentive plan, included certain special tax restructuring charges, legal settlements and costs, revenue adjustments related to businesses exited or sold, acquisitions, goodwill or other intangible asset impairment charges, changes in accounting policies and allocation methodologies, tax planning strategies, loss or gain on the disposal of business and non-budgeted strategic investments approved by the Chief Executive Officer and the Chief Financial Officer. |
10
Table of Contents
For the 2014 annual incentive plan, the performance targets were calculated as follows:
| • | Sales growth is the total change in net trade sales for fiscal year 2014 in US dollars, calculated using fiscal 2013 foreign exchange rates, divided by fiscal year 2013 net trade sales in order to eliminate the effect of currency fluctuations. |
| • | Net income is a non-GAAP financial measure which excludes the items noted above. |
| • | Operating income is the operating income of the applicable business unit, calculated using the foreign exchange rate applied in setting the business unit’s annual operating plan in order to eliminate the effect of currency fluctuations. |
| • | Cash flow means free cash flow, which is net cash provided by operating activities minus capital expenditures. |
| (2) | The business unit financial goals were set at levels consistent with and necessary to achieve the Company-wide financial performance goals reflected in this table and thus reflect a similar degree of difficulty as the Company-wide criteria. Because we do not provide business unit level guidance, we are not disclosing these competitively sensitive goals. |
Long-Term Incentive Awards
Plan Structure
The Compensation Committee uses long-term incentive compensation in the form of equity awards to deliver competitive compensation that recognizes employees for their contributions to the Company and aligns the interests of named executive officers with shareholders by focusing them on long-term growth and stock performance. Recognizing that long-term incentives are generally the most significant element of total remuneration at the senior level and also acknowledging that long-term incentives are a crucial part of the total direct compensation package that the Company offers, for fiscal 2014, the Compensation Committee, with input from its consultant, Steven Hall & Partners, conducted a review of the Company’s long-term incentive structure. The Compensation Committee considered the proportion of long-term incentive value to be allocated to vehicles with service-based vesting versus vehicles with performance-based vesting. Based on this evaluation, the Compensation Committee determined that the long-term incentive vehicles of PSUs, stock options and restricted stock units continued to serve the Company well.
As in fiscal 2013, for fiscal 2014 grants, the dollar value awarded to each named executive officer was allocated between the long-term incentive vehicles as follows:
| • | 40% of the dollar value was allocated to PSUs with performance-based vesting over a three-year vesting period based on relative total shareholder return; |
| • | 40% of the dollar value was allocated to stock options with a four-year vesting period; and |
| • | 20% of the dollar value was allocated to restricted stock units with time-based vesting over a four-year vesting period. |
The Compensation Committee considers this allocation appropriate, as performance-orientation is reflected in PSUs and stock options (which only have value to the extent the Company’s stock price increases from the stock price on the grant date), while grants of restricted stock units allow the program to support retention, even in down stock markets. In addition, the Compensation Committee took into consideration the fact that consistency of program vehicles is likely to enhance understanding of the function and benefits of the long-term incentives offered.
The Compensation Committee also reviewed the performance share plan payout criteria for fiscal 2014 and determined that relative total shareholder return (total shareholder return for the Company as compared to total shareholder return of companies comprising the PSU peer group index), measured over the three-year performance period, continued to be the appropriate metric for PSUs. As with the fiscal 2013 awards, the fiscal 2014 PSU awards payout at target and at 200% of target upon achievement of relative total shareholder return at the 50th and 75th percentiles, respectively. Total shareholder return in the top quartile of peer group performance is a key long-term financial goal of the Company. For the fiscal 2013 grant, the Compensation Committee increased the performance level for threshold payout from the 25th percentile to the 30th percentile of relative total shareholder return in response to market trends. The Compensation Committee determined that the 30th percentile continued to be appropriate for the 2014 fiscal grants.
For the fiscal 2014 PSU grant, the PSU peer group selected by the Compensation Committee is comprised of the following 16 healthcare companies that generally replicate the Company’s mix of businesses, including all eight members of the peer group established by the Company for purposes of establishing fiscal 2014 compensation:
| PSU Peer Group | ||||
| Abbott Laboratories | C.R. Bard, Inc. | St. Jude Medical, Inc. | ||
| Baxter International Inc. | Johnson & Johnson | Stryker Corporation | ||
| Becton, Dickinson & Company | Hospira, Inc. | Thermo Fisher Scientific, Inc. | ||
| Boston Scientific Corporation | Medtronic, Inc. | Waters Corporation | ||
| Cardinal Health, Inc. | PerkinElmer, Inc. | Zimmer Holdings, Inc. | ||
| CareFusion Corporation | ||||
11
Table of Contents
Individual Equity Grants
When setting long-term incentive compensation for named executive officers, the Compensation Committee employs the process described in the “How We Determine Compensation” section of this CD&A. After the Compensation Committee established a dollar value for each named executive officer’s fiscal 2014 annual long-term incentive compensation award, that dollar value was then allocated between PSUs, stock options and restricted stock units as described above, with the exact number of PSUs and restricted stock units based on the closing price of a Company share on the grant date and the exact number of stock options based on such closing price and the applicable Black-Scholes ratio.
The table below compares the dollar value awarded by the Compensation Committee to each named executive officer as long-term incentive compensation during fiscal 2014 versus the dollar value awarded to each named executive officer during fiscal 2013.
| Executive Officer |
Fiscal 2013(1) | Fiscal 2014(1) | % Change | |||||||||
| José E. Almeida |
$ | 7,250,000 | $ | 8,100,000 | 12 | % | ||||||
| Charles J. Dockendorff |
$ | 2,280,000 | $ | 2,280,000 | 0 | % | ||||||
| John H. Masterson |
$ | 1,050,000 | $ | 1,500,000 | 43 | % | ||||||
| Bryan C. Hanson |
$ | 1,848,000 | $ | 2,300,000 | 24 | % | ||||||
| Peter L. Wehrly |
$ | 1,400,000 | $ | 2,000,000 | 43 | % | ||||||
| (1) | The amounts in the table above differ from the grant date fair value of the awards reported in the Grants of Plan-Based Awards Table. The amounts in the table above are the dollar amounts awarded by the Compensation Committee while the grant date fair value of each award reported in the Grants of Plan-Based Awards Table is the award value for accounting purposes. The award value for accounting purposes is calculated by application of a Monte Carlo simulation model for PSUs and by application of the Black-Scholes ratio for stock options. |
In determining the dollar value of long-term incentive compensation awarded to each named executive officer for his fiscal 2014 annual long-term incentive award, the Compensation Committee considered more than just the percentage increase from the value of the prior year’s award. The Compensation Committee also considered individual performance, including performance ratings, the executive officer’s total direct compensation (i.e., base salary, annual incentive compensation and long-term incentive compensation in the aggregate) and mix of compensation for the previous fiscal year, the resulting compensation mix projected for fiscal 2014, previous equity grants and the dollar value of the proposed equity grant relative to market data and to proposed equity grants for other executive officers.
The 2014 long-term incentive grants placed all five named executive officers just under or above the 75th percentile of long-term incentive peer market data. The Compensation Committee determined that the 12% increase in Mr. Almeida’s long-term incentive grant value was appropriate in light of his fiscal 2013 accomplishments, including the successful spin-off of the Company’s pharmaceuticals business, and also given that long-term incentive compensation is a particularly important component of Mr. Almeida’s total direct compensation. As our CEO, he plays the greatest role in establishing the Company’s direction and is uniquely positioned to focus the Company on long-term growth and maximize shareholder value. The Compensation Committee believes that he should have the greatest proportion of his compensation aligned with the long-term interests of shareholders. The Compensation Committee approved significant increases in the value of the long-term incentive awards issued to Messrs. Masterson, Hanson and Wehrly to reflect the Company’s strong focus on long-term incentive compensation and shareholder alignment and to ensure retention of these highly-valued senior executives. The Compensation Committee intends to return to historical practices and benchmarking guidelines for fiscal 2015.
Total Direct Compensation
In establishing the three major components of compensation payable to our named executive officers - base salary, annual incentive compensation and long-term equity incentive awards - the Compensation Committee assessed each component against market data applicable to the respective component. The Compensation Committee also considered the total direct compensation payable to named executive officers, which aggregates all three major components of compensation, so that the Compensation Committee could assess each named executive officer’s total compensation against market data. Following the establishment of all three major components of compensation payable to our executive officers, Mr. Almeida was just under and Mr. Dockendorff was just above the 75th percentile of total direct compensation paid to executives in comparable positions, based on market data. For their respective positions, Mr. Masterson was above the 75th percentile and Messrs. Hanson and Wehrly were slightly below the 75th percentile. The Compensation Committee believed that the level of overall compensation for each of these named executive officers, driven in large part by the value of the long-term incentive awards, was appropriate to reward and retain the seasoned executives in a time of strategic change for the Company and also to reinforce the Company’s focus on long-term shareholder value.
12
Table of Contents
Other Benefits
Retirement Benefits
We maintain retirement plans to assist our named executive officers with retirement income planning and increase the attractiveness of employment with us. For our named executive officers, we currently provide:
| • | a tax-qualified defined contribution 401(k) plan, the Covidien Retirement Savings and Investment Plan, that is available to all eligible United States employees (the “Retirement Savings Plan”); and |
| • | a non-qualified deferred compensation plan, the Covidien Supplemental Savings and Retirement Plan, in which executive officers and other eligible United States senior employees may participate. |
For more information regarding our non-qualified deferred compensation plan, see “Non-Qualified Deferred Compensation” below.
Health and Welfare and Other Benefits
Health and Welfare Benefits. As part of our overall compensation offering, our health and welfare benefits are intended to be competitive with peer companies. The health and welfare benefits we provide to our named executive officers are offered to all of our eligible United States-based employees and include medical, dental, prescription drug, vision, life insurance, accidental death and dismemberment, business travel accident, personal and family accident, flexible spending accounts, short- and long-term disability coverage and the employee assistance program. The Company also provides Mr. Almeida with supplemental long-term disability insurance, which commenced when he became our President and Chief Executive Officer on July 1, 2011. The Company does not provide tax assistance with respect to premiums paid by the Company for this insurance coverage (i.e., no “gross-ups”).
Perquisites. Although the Company does not have a perquisite program, the Compensation Committee determined that it was in the Company’s and the executives’ best interests to establish an executive physical program which offers comprehensive and coordinated annual physical examinations at a nominal cost to the Company. Other than the executive physical program and the limited use of corporate aircraft described below, we do not provide our named executive officers with any perquisites. The Compensation Committee believes that the emphasis on performance-based compensation, rather than on entitlements such as perquisites, is consistent with its compensation philosophy.
Airplane Usage. The Compensation Committee believes that it is important to have a corporate aircraft policy due to the security and efficiency benefits that such a policy provides to us. Personal travel for our named executive officers is permitted only if such use is at no incremental cost to the Company and is approved in advance by the Chief Executive Officer or if there are unusual circumstances, such as a medical or family emergency, that the Chairman of the Compensation Committee or the Chief Executive Officer believe warrant such use. Additionally, our policy permits our Chief Executive Officer to use our corporate aircraft for personal travel, up to forty (40) block hours per fiscal year. Pursuant to current income tax rules applicable to personal use of aircraft, the Company imputes income to named executive officers for any personal use based on the Standard Industry Fare Level rates set by the Civil Aeronautics Division of the Department of Transportation. This imputed income amount is included in a named executive officer’s earnings at the end of the year and reported as W-2 income to the Internal Revenue Service. The Company does not provide tax assistance with respect to this imputed income (i.e., no “gross-ups”).
Employee Stock Purchase Plan. We maintain a broad-based employee stock purchase plan which provides eligible employees, including our named executive officers, with the opportunity to purchase Company shares. We believe that providing an employee stock purchase plan is consistent with our philosophy that compensation should align the interests of executive officers and shareholders and promote a long-term shareholder perspective. Eligible employees authorize payroll deductions to be made for the purchase of Company shares. The Company provides a fifteen percent (15%) matching contribution on up to $25,000 of an employee’s payroll deductions in any calendar year. All shares are purchased on the open market by a designated broker. Mr. Masterson participated in the employee stock purchase plan in 2014.
Charitable Contributions. Pursuant to Covidien’s Matching Gift Program, the Company matches employee contributions to charitable organizations up to $10,000. The Company also has a directed giving program applicable to members of the senior executive leadership team, which includes all of the named executive officers. Pursuant to the directed giving program, the Company will make donations, up to $10,000 in the aggregate per executive, or up to $100,000 in the aggregate in the case of the Chief Executive Officer, to a 501(c)(3)-qualified charity or charities designated by the executive and approved by the Company.
13
Table of Contents
Severance and Change in Control Benefits. The Company maintains executive severance and change in control benefit plans. The Compensation Committee believes that providing severance and change in control benefits to our named executive officers is appropriate, given the fact that these are standard benefits provided by peer companies and also given the need to provide for continuity of management in the event of an actual or potential change in control.
Severance Plan. Under the severance plan, benefits are payable to any named executive officer upon an involuntary termination of employment for any reason other than cause, permanent disability or death. Severance benefits, in the form of base salary, bonus and health benefits are generally payable for 18 months (24 months for our Chief Executive Officer) following termination of employment.
Change in Control Plan. Under the change in control plan, benefits are payable to any named executive officer upon an involuntary termination of employment or good reason resignation that occurs during a period shortly before and continuing for two years after a change in control (a double trigger arrangement). Benefits are generally payable following termination of employment in a lump sum cash payment equal to two times (2.99 times for our Chief Executive Officer) the sum of the executive’s base salary and the average of the executive’s bonus for the previous three fiscal years. Additional benefits provided upon a change in control termination include full vesting of outstanding stock options and restricted stock units (subject to the terms of the applicable award agreements, PSUs will vest only to the extent the Compensation Committee determines that the applicable vesting requirements have been or will be met), continued Company subsidy for health plan premiums for a 24 month period (36 months for our Chief Executive Officer) and outplacement services. Receipt of these benefits is conditioned upon the named executive officer signing a release of any claims against the Company. Any severance or related benefits provided under the change in control plan will be in lieu of payments that would otherwise be payable under the severance plan. The Compensation Committee has carefully evaluated these arrangements and believes that it is important to provide named executive officers with protection in the event that their employment is terminated in connection with a change in control or their position is modified in such a way as to diminish their authority, responsibilities or compensation. Maintaining a double trigger for payment of change in control benefits helps to provide that protection while simultaneously precluding the named executive officer from receiving benefits solely due to a change in control (a single trigger arrangement). The change in control plan does not provide for tax gross-up amounts which otherwise would have been payable as a result of the application of Internal Revenue Code Section 280G to certain payments made under the change in control plan.
How We Determine Compensation
Key Considerations in Setting Compensation
Our compensation program is designed to reflect and advance the following core principles:
| Our Core Principles |
How We Achieve This Goal | |||
| Align Interests | • | Emphasize long-term incentive awards that motivate executives to create shareholder value | ||
| • | Use share ownership guidelines to promote a long-term shareholder perspective | |||
| • | Require management to sign non-compete agreements | |||
| Support Effective Governance | • | In assessing the contributions of a particular executive officer, review not only the results but also how those results were achieved, the long-term impact of the results and whether decisions, actions and results were consistent with the values of the Company | ||
| • | Impose share ownership guidelines to promote long-term ownership | |||
| • | Maintain a cap on annual and long-term incentive award payouts to limit windfalls | |||
| • | Encourage simplicity and transparency in plan design | |||
| • | Establish clear processes for administering equity and employee benefit plans | |||
| Reflect Total Direct Compensation Perspective | • | Maintain and communicate an explicit role for each element of direct compensation | ||
|
• |
Decisions regarding each element of compensation are made with a view to the aggregate value and effect of all other elements | |||
| Pay Competitively, Targeting the Market Median | • | Pay competitively, but not excessively, in order to attract talented executive officers who can achieve our long-term strategic goals and create shareholder value | ||
|
• |
Recognize the need to pay at the upper end of market data to attract or retain executive officers with a high potential or demonstrated record of contributing to our successes | |||
|
• |
Offer total direct compensation that generally targets the market median and which is fair and reasonable in light of the executive officer’s responsibilities, experience and performance, with the ability to pay above or below the median where appropriate | |||
14
Table of Contents
| Align Compensation to Support Our Business and Talent Strategy | • | Design compensation to support our business strategy to broaden our innovation focus, execute on customer-focused portfolio investments, optimize spending to invest in innovation and growth, capitalize on emerging markets opportunities and develop talent and culture to drive innovation and inclusion | ||
|
• |
Recognize individual performance through merit increases and individual adjustments to equity grant levels | |||
|
• |
Standardize pay levels and programs across the Company to facilitate cross-Company career progression | |||
|
• |
Use equity grants to signal potential and nurture career commitment | |||
|
• |
Emphasize pay-for-performance through annual and long-term incentive plans rather than retirement benefits or entitlements such as perquisites | |||
| Emphasize Performance-Based Compensation | • | Utilize a mix of incentive plans that balance short- and long-term objectives | ||
|
• |
Provide potential upside for exceeding performance targets (capped at a market-competitive degree of leverage) with downside risk for missing performance targets | |||
|
• |
Balance retention with reward for shareholder value creation, while also seeing that the elements, individually and in the aggregate, do not encourage excessive risk-taking | |||
|
• |
Establish long-term performance metrics consistent with our ability to quantify long-term goals, in a meaningful way, with respect to these metrics | |||
| Clear Compensation Goals and Practices | • | Clearly and consistently communicate our total rewards philosophy to executives | ||
|
• |
Limit the number of separate compensation plans/programs we provide | |||
|
• |
Minimize the number of performance metrics per plan | |||
|
• |
Promote continuity in plan design and align executive programs across the Company | |||
| Effective Target-Setting | • | Establish performance targets in a rigorous manner to incentivize employees to innovate and collaborate without taking excessive risks | ||
|
• |
Draw from a variety of sources when establishing targets, including information regarding the historical performance of the Company and competitors, anticipated market dynamics and growth rates, Company business strategy, Company financial forecasts and guidance as well as management and Board judgment | |||
Compensation Committee Role and Input from Management
The Compensation Committee is responsible for the Company’s executive compensation strategies, structure, policies and programs and must specifically approve compensation actions relating to our executive officers. For each executive officer, other than our Chief Executive Officer, the Compensation Committee relies on input from our Chief Executive Officer and our Senior Vice President of Human Resources in setting the executive officer’s performance objectives, evaluating the actual performance of the executive officer against those objectives and making appropriate decisions regarding salary and incentive awards. The Chief Executive Officer and Senior Vice President of Human Resources participate in Compensation Committee meetings, at the request of the Compensation Committee, to provide background information and explanations supporting compensation recommendations, including the results of the annual performance evaluations that our Chief Executive Officer conducts on each named executive officer, as well as a Talent and Leadership Review, or TLR, performance rating. Additionally, in light of Mr. Almeida’s relationship with Mr. Hanson, who is Mr. Almeida’s brother-in-law, the Compensation Committee determined that it would be appropriate for the Chief Financial Officer and the Senior Vice President of Human Resources to participate in Mr. Hanson’s performance assessments along with the Chief Executive Officer. In addition, the Compensation Committee reviews and approves all compensation actions relating to Mr. Hanson.
The Compensation Committee conducts the annual performance evaluation of our Chief Executive Officer. Generally, the process begins with the Compensation Committee approving an evaluation form which is then completed by the Chief Executive Officer as a self-evaluation. This completed self-evaluation is submitted to the full Board of Directors for review along with a blank evaluation for completion by each Director. The Chair of the Compensation Committee compiles the results. The Compensation Committee reviews and discusses the results, after which the Chairman of the Compensation Committee leads a further discussion with the full Board of Directors, not including the Chief Executive Officer. Following this extensive discussion with the Board of Directors, the Lead Director provides feedback to the Chief Executive Officer. The Compensation Committee uses these evaluations and discussions along with market data in setting the Chief Executive Officer’s compensation.
15
Table of Contents
Compensation Consultant
The Compensation Committee has the sole authority to retain, compensate and terminate any independent compensation consultants of its choosing. During fiscal 2014, Steven Hall & Partners served as the Compensation Committee’s independent compensation consultant. The Compensation Committee has assessed the independence of Steven Hall & Partners and determined that the compensation consultant is independent and that no conflicts of interest exist currently or existed during fiscal 2014. Steven Hall & Partners reports directly to the Compensation Committee and does not provide services to, or on behalf of, any other part of our business. Steven Hall & Partners typically provides the Compensation Committee with advice on compensation program design and best practices and, as noted below, produces the comparative information derived from the peer group and published survey data that the Compensation Committee reviews. Major services provided during fiscal 2014 by Steven Hall & Partners under its engagement with the Compensation Committee included: (1) preparing the market study described below; (2) reviewing the Company’s compensation peer group; (3) analyzing the Company’s share allocation and utilization as compared with eight peer companies; (4) providing regulatory updates; (5) providing advice with respect to incentive plan design changes; and (6) confirming long-term incentive calculations at year-end. Steven Hall & Partners is the only compensation consultant who played a role in determining or recommending the amount or form of executive compensation for fiscal 2014.
Peer Group Review and Market Data
When reviewing compensation programs for the named executive officers, the Compensation Committee considers the compensation practices of specific peer companies and reviews compensation data from general industry published surveys.
In selecting the peer group from among companies with annual revenues generally within the range of one-half to two times our annual revenues, the Compensation Committee considered various other factors relating to similarly-situated medical device and pharmaceutical companies, including net income and market capitalization. The Compensation Committee reviews this peer group on an on-going basis and modifies it as circumstances warrant. In light of the Company’s exiting the Pharmaceuticals business in 2013, the Compensation Committee determined that the two pharmaceuticals companies included in the peer group utilized in setting compensation for 2013 need not be included in the peer group to be utilized for setting compensation for 2014. The Compensation Committee determined that the 2013 peer group otherwise remained appropriate for setting compensation for 2014, as it continued to represent our primary competitors for capital, executive talent and, in some cases, business within our industry.
The following table sets forth the peer group approved by the Compensation Committee for purposes of setting 2014 compensation, along with fiscal 2013 financial information for each. The table also includes information regarding Covidien’s relative position in the peer group in each of the categories.
| Company |
Fiscal Year End |
Revenue | Net Income | Market Capitalization at 3/31/2014 |
||||||||||||
| (dollars in millions) | ||||||||||||||||
| Baxter International Inc. |
12/13 | $ | 15,259 | $ | 2,012 | $ | 39,802 | |||||||||
| Becton, Dickinson & Company |
9/13 | 8,054 | 1,293 | 22,599 | ||||||||||||
| Boston Scientific Corporation |
12/13 | 7,143 | (121 | ) | 17,893 | |||||||||||
| Medtronic, Inc. |
4/13 | 16,590 | 3,467 | 61,590 | ||||||||||||
| St. Jude Medical, Inc. |
12/13 | 5,501 | 723 | 18,564 | ||||||||||||
| Stryker Corporation |
12/13 | 9,021 | 1,006 | 30,812 | ||||||||||||
| Thermo Fisher Scientific, Inc. |
12/13 | 13,090 | 1,273 | 47,647 | ||||||||||||
| Zimmer Holdings, Inc. |
12/13 | 4,623 | 761 | 15,942 | ||||||||||||
| Covidien plc |
9/13 | 10,235 | 1,700 | 33,202 | ||||||||||||
| Rank |
4 of 9 | 3 of 9 | 4 of 9 | |||||||||||||
As noted above, the Compensation Committee also reviews a market study prepared by its independent compensation consultant (the results of which we refer to throughout this CD&A as the “market data”). The market data compiled by the Compensation Committee’s independent compensation consultant included information regarding base salary, annual incentive awards and the value of equity awards. The study included data derived from a number of sources, including the proxy statements of the Company’s peer group companies, the 2013 Radford Global Technology Survey, the 2013 Towers Watson US General Industry Executive Database, the 2013 Aon-Hewitt Total Compensation - U.S., the 2013 Equilar ExecutiveInsight Total Compensation Report, the Towers Watson 2012 Survey Report on Top Management Compensation, the 2012 US Mercer Benchmark Database - Executive and, for companies with revenue of approximately $10.6 billion, general industry data as well as data for the medical instruments industry where available and as appropriate. The Compensation Committee did not strictly tie target compensation for our named executive officers to any one
16
Table of Contents
type of peer group data, but instead considered all of these sources in determining the appropriate level of compensation for our executives. Data drawn from our peer group proxy statements were given greater consideration for the chief executive officer and chief financial officer positions than for group head positions.
Use of Tally Sheets
In setting compensation for each named executive officer, in addition to reviewing market data, the Compensation Committee reviews each named executive officer’s total annual compensation from the previous four years. The Compensation Committee uses individual tally sheets prepared by our human resources department and the Compensation Committee’s compensation consultant as a presentation format to facilitate this review. The tally sheets identify the value of each pay element, including base salary, annual incentive bonus, sign-on bonus or other cash payments, long-term incentives, grant date value of equity awards and retirement benefits. The tally sheets also reflect current share ownership and equity awards held as well as the value of termination and change-in-control payments under various potential termination and change-in-control scenarios. Reviewing the tally sheets helps the Compensation Committee to balance the various elements of compensation so that no one element is weighted too heavily and so that there is an appropriate mix between fixed and variable compensation and between short- and long-term compensation, consistent with our belief that our executive compensation program should not encourage excessive or unnecessary risk-taking.
Talent and Leadership Review
The Company utilizes a Talent and Leadership Review, or TLR, process to manage its talent and organizational capability with the goal of maximizing organizational excellence and business success. TLR assists the Company in understanding its leadership strengths and gaps, helps identify key and emerging talent and provides insight into current organizational capability versus strategic goals and objectives. As part of the TLR process, the Chief Executive Officer in conjunction with the Senior Vice President of Human Resources assigns to each executive officer a rating on two discrete dimensions: leadership competency and potential. Three possible ratings can be assigned in each of these two dimensions. For leadership competency, the ratings are exceptional, effective, and not yet competent. For potential, the ratings are key talent, promotable and highly valued. While the TLR process is intended to assist in evaluating the needs of the Company from a human resources perspective, these performance ratings are also considered by the Chief Executive Officer in formulating compensation recommendations to the Compensation Committee. These performance ratings impacted both base salary decisions as well as decisions regarding the value of long-term incentive compensation awards.
Other Compensation Policies and Arrangements
Executive Compensation Recoupment Policy
Accountability is one of our core values. To encourage our senior executives to take responsibility and affirm the Company’s commitment to integrity and the highest standards of ethical conduct, to reinforce these values through our compensation program, and to support good governance practices, we maintain an Executive Compensation Recoupment Policy (the “Recoupment Policy”). The Recoupment Policy requires that the Company recoup, or “claw-back”, portions of incentive compensation paid to our executive officers if there is a restatement of the Company’s financial statements due to the material noncompliance by the Company with financial reporting requirements under applicable securities laws or regulations and the amount of incentive compensation that was awarded to an executive officer during the three (3) fiscal years immediately preceding the date of the restatement (or such other period as may be required under applicable securities laws or regulations) is higher than the amount of incentive compensation that would have been awarded to the executive officer had the financial results subject to the restatement been properly reported. For this purpose, incentive compensation includes any compensation determined to be incentive compensation pursuant to regulations to be issued by the SEC.
In addition, our equity awards are subject to a claw-back provision, pursuant to which we may recover the amount of any profit the named executive officer realized upon the exercise of options or vesting of other equity awards during the 12-month period that occurs immediately prior to the officer’s involuntary termination for cause.
Executive Officer Share Retention and Ownership Guidelines
Share Retention. The Compensation Committee has determined that it is in the best interests of the Company for all named executive officers to have meaningful share ownership positions in Covidien in order to reinforce the alignment of management and shareholder interests. Accordingly, the Compensation Committee adopted share retention and ownership guidelines for named executive officers. Under these guidelines, named executive officers are expected to hold company equity with a value expressed as a multiple of base salary as follows:
| Chief Executive Officer | 5 times base salary | |
| Other Named Executive Officers | 3 times base salary |
17
Table of Contents
In determining an executive’s ownership, shares held directly as well as shares underlying restricted stock units subject to time-based vesting and their accompanying dividend equivalent units are included. Shares underlying unexercised stock options and unvested PSUs and their accompanying dividend equivalent units are not included in the calculation. Executives are required to achieve the requisite ownership position within five years of first becoming subject to the share ownership guidelines. As of the end of the fiscal year, each named executive officer had achieved shareholdings in excess of the applicable multiple set forth above.
Hedging and Pledging Policy. The Company’s Insider Trading Policy prohibits directors and employees, including named executive officers, from engaging in purchases or sales of puts, calls, cashless collars, options or similar rights and obligations or engaging in any other hedging activity involving Covidien securities, other than the exercise of a Company-issued stock option. In fiscal 2013, the Insider Trading Policy was amended to prohibit directors and employees, including named executive officers, from engaging at any time in short sales of Company securities, purchasing Covidien securities on margin, borrowing against Company securities held in a margin account, or pledging Company securities as collateral for a loan (unless the individual can clearly demonstrate the financial capacity to repay the loan without resorting to the pledged securities).
Deductibility of Executive Compensation
Internal Revenue Code Section 162(m) limits to $1 million the tax deduction available to public companies for annual compensation that is paid to covered employees (generally, the named executive officers other than the Chief Financial Officer), unless the compensation qualifies as performance-based or is otherwise exempt from Code Section 162(m). In evaluating compensation programs applicable to our named executive officers (including the Stock and Incentive Plan, under which our named executive officers receive annual incentive bonuses and equity awards), the Compensation Committee considers the potential impact on the Company of Code Section 162(m) while maintaining maximum flexibility in the design of our compensation programs and in making appropriate payments to named executive officers.
Compensation Committee Report on Executive Compensation
The Compensation Committee has reviewed and discussed with management the foregoing Compensation Discussion and Analysis and, based on such review and discussions, has recommended to the Board of Directors that the Compensation Discussion and Analysis be included in this Form 10-K/A.
Compensation and Human Resources Committee
Dennis H. Reilley, Chairman
Stephen H. Rusckowski
18
Table of Contents
Executive Compensation Tables
The following tables and notes present the compensation provided to our Chief Executive Officer, Chief Financial Officer and the three other most highly compensated executive officers in fiscal 2014 (our “named executive officers”). For a more complete understanding of each table, please read the notes following the table.
Summary Compensation
The information included in the Summary Compensation Table below reflects compensation of our named executive officers for the fiscal year ended September 26, 2014 (“fiscal 2014”) and, where applicable, the fiscal years ended September 27, 2013 (“fiscal 2013”) and September 28, 2012 (“fiscal 2012”).
SUMMARY COMPENSATION TABLE
| Name and Principal Position |
Fiscal Year |
Salary ($) |
Stock Awards ($) |
Option Awards ($) |
Non-Equity Incentive Plan Compensation ($) |
Change in Pension Value and Non-Qualified Deferred Compensation Earnings ($) |
All Other Compensation ($) |
Total ($) |
||||||||||||||||||||||||
| (A) |
(B) | (C) | (E) | (F) | (G) | (H) | (I) | (J) | ||||||||||||||||||||||||
| José E. Almeida Chairman, President and Chief Executive Officer |
|
2014 2013 |
|
$ $ $ |
1,243,269 1,211,538 1,154,808 |
|
$ $ $ |
5,670,021 5,103,983 4,549,997 |
|
$ $ $ |
3,394,184 2,822,832 2,699,141 |
|
$ $ $ |
2,707,069 1,605,718 1,682,517 |
|
$
|
82 — — |
|
$ $ $ |
567,778 427,425 193,265 |
|
$ $ $ |
13,582,403 11,171,496 10,279,728 |
| ||||||||
| Charles J. Dockendorff Executive Vice President and Chief Financial Officer |
|
2014 2013 |
|
$ $ $ |
804,846 783,454 764,204 |
|
$ $ $ |
1,596,020 1,605,162 1,747,191 |
|
$ $ $ |
955,373 887,767 1,036,456 |
|
$ $ $ |
1,122,754 675,017 722,981 |
|
$ $ $ |
126,406 117,083 38,716 |
|
$ $ $ |
103,349 125,652 115,745 |
|
$ $ $ |
4,708,748 4,194,135 4,425,293 |
| ||||||||
| Bryan C. Hanson Group President, Medical Devices & U.S. |
|
2014 2013 |
|
$ $ $ |
595,285 556,585 535,200 |
|
$ $ $ |
1,610,042 1,300,989 1,223,049 |
|
$ $ $ |
963,739 719,527 725,547 |
|
$ $ $ |
736,501 585,184 355,965 |
|
$
|
535 — — |
|
$ $ $ |
80,688 54,142 529,980 |
|
$ $ $ |
3,986,790 3,216,427 3,369,741 |
| ||||||||
| Peter L. Wehrly Group President, Developed Markets |
|
2014 2013 |
|
$ $ $ |
578,842 556,585 536,546 |
|
$ $ $ |
1,400,046 985,599 1,019,202 |
|
$ $ $ |
838,034 545,111 604,623 |
|
$ $ $ |
563,767 426,713 650,127 |
|
|
— — — |
|
$ $ $ |
59,360 72,215 151,828 |
|
$ $ $ |
3,440,049 2,586,223 2,962,326 |
| ||||||||
| John H. Masterson Senior Vice President and General Counsel |
|
2014 2013 |
|
$ $ $ |
598,361 580,896 563,931 |
|
$ $ $ |
1,049,976 739,181 727,989 |
|
$ $ $ |
628,525 408,803 431,834 |
|
$ $ $ |
785,628 472,288 500,867 |
|
$ $ $ |
37,696 35,073 10,429 |
|
$ $ $ |
58,291 65,097 72,364 |
|
$ $ $ |
3,158,477 2,301,338 2,307,414 |
| ||||||||
Stock Awards (Column E) and Option Awards (Column F) Reflects the aggregate grant date fair value, computed in accordance with Accounting Standards Codification 718 (“ASC 718”), of restricted stock unit, PSU and stock option awards issued to each of our named executive officers during the 2012, 2013 and 2014 fiscal years, as applicable. Further information regarding the 2014 awards is included in the Fiscal 2014 Grants of Plan-Based Awards Table, the Outstanding Equity Awards at 2014 Fiscal Year-End Table and the CD&A, beginning on page 4.
In the case of PSUs, the grant date fair value is based on the probable outcome of the market-based performance conditions, calculated based on the application of a Monte Carlo simulation model. The actual amounts which vest are determined at the end of the three-year performance cycle and are based on total shareholder return for the Company as compared to total shareholder return of companies comprising a PSU peer group (i.e., relative total shareholder return). Depending upon whether and the extent to which the performance conditions are met, the number of shares for which the PSUs are settled may range from zero to 200%.
Amounts in these columns do not correspond to the actual value that may be recognized by the named executive officers, which may be higher or lower based on a number of factors, including the Company’s stock price performance and applicable vesting. For additional information relating to assumptions made in the valuation of current year awards reflected in these columns, see Note 23 to the Consolidated Financial Statements included in our Annual Report on Form 10-K for the fiscal year ended September 26, 2014.
19
Table of Contents
Non-Equity Incentive Plan Compensation (Column G) Represents annual incentive cash awards paid to the named executive officers under our 2014 Annual Incentive Plan. For information regarding the calculation of these awards, see the CD&A, beginning on page 4.
Change in Pension Value and Non-Qualified Deferred Compensation Earnings (Column H) The amounts reported for Messrs. Almeida and Hanson are attributable to an increase in the actuarial present value of their respective accumulated benefit under the frozen Kendall Pension Plan at September 27, 2014, as compared to September 27, 2013. The amounts reported for Messrs. Dockendorff and Masterson include $3,144 and $576, respectively, which are attributable to the increase in present value of their accumulated benefit under the Kendall Pension Plan. Mr. Wehrly is not eligible to participate in the Kendall Pension Plan because it was frozen before he commenced employment with the Company. For more information, see the 2014 Pension Benefits Table and related narrative.
Amounts for Messrs. Dockendorff and Masterson also include above-market earnings on amounts credited to the Supplemental Savings Plan. All investments offered under the Supplemental Savings Plan mirror investments offered under the Retirement Savings Plan (our 401(k) plan), except that the Supplemental Savings Plan includes an additional investment alternative, the Enhanced Moody’s Rate, which is available to eligible employees, including Messrs. Dockendorff and Masterson. During fiscal 2014, the Enhanced Moody’s Rate produced above-market earnings of $123,262 for Mr. Dockendorff and $37,120 for Mr. Masterson. For more information, see the Fiscal 2014 Non-Qualified Deferred Compensation Table and related narrative.
All Other Compensation (Column I) Represents the aggregate dollar amount for each named executive officer for Company contributions to the Retirement Savings Plan, Company credits to the Supplemental Savings Plan, personal benefits, insurance premiums and other compensation as described below. The following table shows the specific amounts included in Column I of the Summary Compensation Table for fiscal 2014.
ALL OTHER COMPENSATION
| Name and Principal Position |
Company Contributions to Retirement Savings Plan |
Company Credits to Supplemental Savings Plan |
Perquisites and Other Personal Benefits |
Total | ||||||||||||
| (A) |
(B) | (C) | (D) | (E) | ||||||||||||
| José E. Almeida |
$ | 15,468 | $ | 155,189 | $ | 397,121 | $ | 567,778 | ||||||||
| Charles J. Dockendorff |
$ | 18,200 | $ | 85,149 | — | $ | 103,349 | |||||||||
| Bryan C. Hanson |
$ | 15,382 | $ | 53,029 | $ | 12,277 | $ | 80,688 | ||||||||
| Peter L. Wehrly |
$ | 15,313 | $ | 44,047 | — | $ | 59,360 | |||||||||
| John H. Masterson |
$ | 15,390 | $ | 42,901 | — | $ | 58,291 | |||||||||
Perquisites & Other Personal Benefits (Column D) The amount reported for Mr. Almeida includes $3,200 for an annual physical under the Company’s executive physical program; $17,123 for insurance premiums paid by the Company for supplemental long-term disability insurance; and $376,798 attributable to personal use of Company aircraft. The value of flights on corporate aircraft is based on the total variable incremental cost incurred by the Company in providing such flights, calculated on an annualized per hour basis. The variable costs associated with such flights include fuel, trip-related maintenance, crew travel expenses, on-board catering, landing and parking fees and other variable costs. As Company-owned aircraft are used predominantly for business purposes, we have not included fixed costs, such as pilots’ salaries, insurance and standard maintenance, which do not change based on usage. Mr. Almeida was taxed on the imputed income attributable to his personal use of Company aircraft and the value of insurance premiums paid by the Company during fiscal 2014 and the Company did not provide him with any tax assistance, i.e., did not provide a tax gross-up with respect to that income. The amount reported for Mr. Hanson includes $2,035 for an annual physical; and $10,242 for costs incurred with his spouse’s attendance at a President’s Club event. Mr. Hanson was taxed on the imputed income attributable to his spouse’s attendance at a President’s Club event and the Company did not provide him with any tax assistance, i.e., did not provide a tax gross-up with respect to that income.
Grants of Plan-Based Awards
The following table provides information concerning the annual incentive cash awards and equity incentive awards granted to each of our named executive officers in fiscal 2014.
| • | “AIP” is the annual incentive cash award payable pursuant to our 2014 Annual Incentive Plan. |
| • | “PSUs” are restricted stock unit awards subject to performance-based vesting. |
| • | “RSUs” are restricted stock unit awards subject to time-based vesting. |
| • | “Options” are nonqualified stock options subject to time-based vesting. |
20
Table of Contents
FISCAL 2014 GRANTS OF PLAN-BASED AWARDS
| Name |
Grant Date |
Date
of Committee Action |
Estimated Future
Payouts |
Estimated Future
Payouts |
All other Stock Awards: Number of Shares of Stock or Units (#) |
All other Option Awards: Number of Securities Underlying Options (#) |
Exercise or Base Price of Option Awards ($/Sh) |
Grant Date Fair Value of Stock and Option Awards ($) |
||||||||||||||||||||||||||||||||||||||||
| Threshold ($) |
Target ($) |
Maximum ($) |
Threshold (#) |
Target (#) |
Maximum (#) |
|||||||||||||||||||||||||||||||||||||||||||
| (A) |
(B) |
|
(C) | (D) | (E) | (F) | (G) | (H) | (I) | (J) | (K) | (L) | ||||||||||||||||||||||||||||||||||||
| José E. Almeida |
||||||||||||||||||||||||||||||||||||||||||||||||
| AIP |
$ | 831,250 | $ | 1,662,500 | $ | 3,325,000 | ||||||||||||||||||||||||||||||||||||||||||
| PSUs |
12/2/2013 | 11/20/2013 | 24,004 | 48,007 | 96,014 | $ | 4,049,991 | |||||||||||||||||||||||||||||||||||||||||
| RSUs |
12/2/2013 | 11/20/2013 | 24,004 | $ | 1,620,030 | |||||||||||||||||||||||||||||||||||||||||||
| Options |
12/2/2013 | 11/20/2013 | 231,265 | $ | 67.49 | $ | 3,394,184 | |||||||||||||||||||||||||||||||||||||||||
| Charles J. Dockendorff |
||||||||||||||||||||||||||||||||||||||||||||||||
| AIP |
$ | 344,760 | $ | 689,520 | $ | 1,379,040 | ||||||||||||||||||||||||||||||||||||||||||
| PSUs |
12/2/2013 | 11/20/2013 | 6,757 | 13,513 | 27,026 | $ | 1,139,990 | |||||||||||||||||||||||||||||||||||||||||
| RSUs |
12/2/2013 | 11/20/2013 | 6,757 | $ | 456,030 | |||||||||||||||||||||||||||||||||||||||||||
| Options |
12/2/2013 | 11/20/2013 | 65,095 | $ | 67.49 | $ | 955,373 | |||||||||||||||||||||||||||||||||||||||||
| Bryan C. Hanson |
||||||||||||||||||||||||||||||||||||||||||||||||
| AIP |
$ | 258,145 | $ | 516,290 | $ | 1,032,580 | ||||||||||||||||||||||||||||||||||||||||||
| PSUs |
12/2/2013 | 11/20/2013 | 6,816 | 13,632 | 27,264 | $ | 1,150,030 | |||||||||||||||||||||||||||||||||||||||||
| RSUs |
12/2/2013 | 11/20/2013 | 6,816 | $ | 460,012 | |||||||||||||||||||||||||||||||||||||||||||
| Options |
12/2/2013 | 11/20/2013 | 65,665 | $ | 67.49 | $ | 963,739 | |||||||||||||||||||||||||||||||||||||||||
| Peter L. Wehrly |
||||||||||||||||||||||||||||||||||||||||||||||||
| AIP |
$ | 233,960 | $ | 467,920 | $ | 935,840 | ||||||||||||||||||||||||||||||||||||||||||
| PSUs |
12/2/2013 | 11/20/2013 | 5,927 | 11,854 | 23,708 | $ | 1,000,033 | |||||||||||||||||||||||||||||||||||||||||
| RSUs |
12/2/2013 | 11/20/2013 | 5,927 | $ | 400,013 | |||||||||||||||||||||||||||||||||||||||||||
| Options |
12/2/2013 | 11/20/2013 | 57,100 | $ | 67.49 | $ | 838,034 | |||||||||||||||||||||||||||||||||||||||||
| John H. Masterson |
||||||||||||||||||||||||||||||||||||||||||||||||
| AIP |
$ | 241,240 | $ | 482,480 | $ | 964,960 | ||||||||||||||||||||||||||||||||||||||||||
| PSUs |
12/2/2013 | 11/20/2013 | 4,445 | 8,890 | 17,780 | $ | 749,983 | |||||||||||||||||||||||||||||||||||||||||
| RSUs |
12/2/2013 | 11/20/2013 | 4,445 | $ | 299,993 | |||||||||||||||||||||||||||||||||||||||||||
| Options |
12/2/2013 | 11/20/2013 | 42,825 | $ | 67.49 | $ | 628,525 | |||||||||||||||||||||||||||||||||||||||||
Non-Equity Incentive Plan Awards (Columns C through E) Reflect threshold, target and maximum award amounts for fiscal 2014 pursuant to the 2014 Annual Incentive Plan, which is an element of our Stock and Incentive Plan. The actual amounts earned by each named executive officer pursuant to such awards are set forth in Column G of the Summary Compensation Table.
Equity Incentive Plan Awards (Columns F through H) Reflect threshold, target and maximum award amounts for the FY14-FY16 performance cycle pursuant to PSUs issued as part of our fiscal 2014 annual equity awards. The actual amounts, if any, earned by each named executive officer pursuant to such awards are determined by the Compensation Committee at the end of the three-year performance cycle and are based upon total shareholder return for the Company as compared to the total shareholder return of companies comprising a PSU peer group (i.e., relative total shareholder return). Threshold, target and maximum award amounts are payable upon achievement of relative total shareholder return in the 30th, 50th and 75th percentile, respectively. Dividend equivalent units will be credited on PSUs only if, and to the extent that, dividends are payable on ordinary shares, and will vest only if the applicable performance criteria are satisfied and the Compensation Committee certifies vesting for the underlying PSUs. For more information regarding PSUs, see the CD&A beginning on page 4.
Stock Awards and Option Awards (Columns I and J) Reflect the number of shares underlying restricted stock unit awards and stock option awards, respectively, that were granted as part of our fiscal 2014 annual equity awards and which vest one-quarter annually beginning on the first anniversary of the grant date. Dividend equivalent units will be credited on restricted stock unit awards only if, and to the extent that, dividends are payable on ordinary shares, and will vest according to the same schedule as the underlying restricted stock units.
Grant Date Fair Value (Column L) In the case of PSUs issued as part of our 2014 annual equity awards, the grant date fair value is based on the probable outcome of the market-based performance conditions, calculated based on the application of a Monte Carlo simulation model. Depending upon whether and the extent to which the respective performance conditions are met, the number of shares for which the PSUs are settled may range from zero to 200%.
21
Table of Contents
Outstanding Equity Awards at Fiscal Year-End
The following table provides information regarding outstanding stock option awards and unvested restricted stock unit and PSU awards held by each named executive officer as of September 26, 2014. Restricted stock unit and PSU awards listed in the table include dividend equivalent units credited on such awards. Dividend equivalent units vest according to the same schedule as the underlying restricted stock unit award and, in the case of PSUs, if the applicable performance criteria are satisfied and the Compensation Committee certifies vesting of the underlying PSUs. Unless otherwise specified, the market value of outstanding stock awards in the table is calculated by multiplying the number of unvested restricted units or PSUs by $89.98, the closing price of our stock on September 26, 2014.
22
Table of Contents
Outstanding Equity Awards at Fiscal Year-End
The following table provides information regarding outstanding stock option awards and unvested restricted stock unit and PSU awards held by each named executive officer as of September 26, 2014. Restricted stock unit and PSU awards listed in the table include dividend equivalent units credited on such awards. Dividend equivalent units vest according to the same schedule as the underlying restricted stock unit award and, in the case of PSUs, if the applicable performance criteria are satisfied and the Compensation Committee certifies vesting of the underlying PSUs. Unless otherwise specified, the market value of outstanding stock awards in the table is calculated by multiplying the number of unvested restricted units or PSUs by $89.98, the closing price of our stock on September 26, 2014
OUTSTANDING EQUITY AWARDS AT 2014 FISCAL YEAR-END
| Option Awards | Stock Awards | |||||||||||||||||||||||||||||||
| Name |
Number of Securities Underlying Unexercised Options (#) Exercisable |
Number of Securities Underlying Unexercised Options (#) Unexercisable |
Option Exercise Price ($) |
Option Expiration Date |
Number of Shares or Units of Stock That Have Not Vested (#) |
Market Value of Shares or Units of Stock That Have Not Vested ($) |
Equity Incentive Plan Awards: Number of Unearned Shares, Units or Other Rights That Have Not Vested (#) |
Equity Incentive Plan Awards: Market or Payout Value of Unearned Shares, Units or Other Rights That Have Not Vested ($) |
||||||||||||||||||||||||
| (A) |
(B) | (C) | (D) | (E) | (F) | (G) | (H) | (I) | ||||||||||||||||||||||||
| José E. Almeida |
5,270 | (6) | $ | 474,195 | 123,676 | (11) | $ | 11,611,940 | ||||||||||||||||||||||||
|
|
131,032 |
|
0 | $ | 43.44 | 11/30/2019 | 2,116 | (7) | $ | 190,398 | 113,804 | (12) | $ | 10,240,084 | ||||||||||||||||||
| 128,437 | 42,813 | (1) | $ | 39.18 | 11/30/2020 | 15,461 | (8) | $ | 1,391,181 | 97,226 | (13) | $ | 8,748,395 | |||||||||||||||||||
| 25,986 | 8,664 | (2) | $ | 49.48 | 06/30/2021 | 21,338 | (9) | $ | 1,919,993 | |||||||||||||||||||||||
| 134,183 | 134,183 | (3) | $ | 42.39 | 11/30/2021 | 24,307 | (10) | $ | 2,187,144 | |||||||||||||||||||||||
|
|
62,615 0 |
|
|
187,848 231,265 |
(4) (5) |
$ $ |
52.53 67.49 |
|
|
12/02/2022 12/01/2023 |
|
|||||||||||||||||||||
| Charles J. Dockendorff |
4,080 | (6) | $ | 367,118 | 47,490 | (11) | $ | 4,458,836 | ||||||||||||||||||||||||
| 107,632 | 0 | $ | 43.44 | 11/30/2019 | 5,935 | (8) | $ | 534,031 | 35,790 | (12) | $ | 3,220,384 | ||||||||||||||||||||
| 99,437 | 33,146 | (1) | $ | 39.18 | 11/30/2020 | 6,708 | (9) | $ | 603,586 | 27,366 | (13) | $ | 2,462,393 | |||||||||||||||||||
| 51,525 | 51,526 | (3) | $ | 42.39 | 11/30/2021 | 6,842 | (10) | $ | 615,643 | |||||||||||||||||||||||
|
|
19,692 0 |
|
|
59,077 65,095 |
(4) (5) |
$ $ |
52.53 67.49 |
|
|
12/02/2022 12/01/2023 |
|
|||||||||||||||||||||
| Bryan C. Hanson |
1,309 | (6) | $ | 117,784 | 33,240 | (11) | $ | 3,120,904 | ||||||||||||||||||||||||
| 0 | 10,634 | (1) | $ | 39.18 | 11/30/2020 | 705 | (7) | $ | 63,436 | 29,006 | (12) | $ | 2,609,960 | |||||||||||||||||||
| 2,889 | 2,890 | (2) | $ | 49.48 | 06/30/2021 | 4,154 | (8) | $ | 373,777 | 27,608 | (13) | $ | 2,484,168 | |||||||||||||||||||
| 0 | 36,070 | (3) | $ | 42.39 | 11/30/2021 | 5,437 | (9) | $ | 489,221 | |||||||||||||||||||||||
|
|
0 0 |
|
|
47,882 65,665 |
(4) (5) |
$ $ |
52.53 67.49 |
|
|
12/02/2022 12/01/2023 |
|
6,902 | (10) | $ | 621,042 | |||||||||||||||||
| Peter L. Wehrly |
1,019 | (6) | $ | 91,690 | 27,700 | (11) | $ | 2,600,753 | ||||||||||||||||||||||||
| 24,336 | 0 | $ | 43.44 | 11/30/2019 | 851 | (7) | $ | 76,573 | 27,218 | (12) | $ | 1,976,861 | ||||||||||||||||||||
| 0 | 8,286 | (1) | $ | 39.18 | 11/30/2020 | 3,462 | (8) | $ | 311,511 | 5,397 | (13) | $ | 2,160,060 | |||||||||||||||||||
| 10,459 | 3,487 | (2) | $ | 49.48 | 06/30/2021 | 4,118 | (9) | $ | 370,538 | |||||||||||||||||||||||
| 30,057 | 30,058 | (3) | $ | 42.39 | 11/30/2021 | 6,001 | (10) | $ | 539,970 | |||||||||||||||||||||||
| 12,091 | $ | 52.53 |
|
12/02/2022 12/01/2023 |
|
|||||||||||||||||||||||||||
| 0 | 36,275 | (4) | $ | 67.49 | ||||||||||||||||||||||||||||
| 57,100 | (5) | |||||||||||||||||||||||||||||||
| John H. Masterson |
1,869 | (6) | $ | 168,173 | 19,784 | (11) | $ | 1,857,520 | ||||||||||||||||||||||||
| 0 | 15,192 | (1) | $ | 39.18 | 11/30/2020 | 2,472 | (8) | $ | 222,431 | 16,476 | (12) | $ | 1,482,510 | |||||||||||||||||||
| 0 | 21,468 | (3) | $ | 42.39 | 11/30/2021 | 3,089 | (9) | $ | 277,948 | 18,004 | (13) | $ | 1,620,000 | |||||||||||||||||||
|
|
9,068 0 |
|
|
27,204 42,825 |
(4) (5) |
$ $ |
52.53 67.49 |
|
|
12/02/2022 12/01/2023 |
|
4,500 | (10) | $ | 404,910 | |||||||||||||||||
23
Table of Contents
Footnotes
Unless otherwise specified, stock option and restricted stock unit awards vest one-quarter annually, beginning on the first anniversary of the grant date.
The number of shares subject to stock option, restricted stock unit and PSU awards and the exercise price for stock option awards reflect adjustments made pursuant to the terms of our Stock and Incentive Plan and the applicable award agreement to reflect the spin-off of our former Pharmaceuticals business on June 28, 2013. Outstanding equity awards, whether vested but unexercised stock options or unvested awards at the time of spin-off, were adjusted using a factor of 1.096 times the quantity of shares granted and exercise prices for stock options were adjusted using the inverse of such factor. Each award retained its original terms and conditions after adjustment.
| (1) | Represents stock options granted on December 1, 2010. |
| (2) | Represents stock options granted on July 1, 2011 to Messrs. Almeida, Hanson and Wehrly in connection with their respective promotions. |
| (3) | Represents stock options granted on December 1, 2011. |
| (4) | Represents stock options granted on December 3, 2012. |
| (5) | Represents stock options granted on December 2, 2013. |
| (6) | Represents restricted stock units granted on December 1, 2010. |
| (7) | Represents restricted stock units granted on July 1, 2011 to Messrs. Almeida, Hanson and Wehrly in connection with their respective promotions. |
| (8) | Represents restricted stock units granted on December 1, 2011. |
| (9) | Represents restricted stock units granted on December 3, 2012. |
| (10) | Represents restricted stock units granted on December 2, 2013. |
| (11) | Represents PSUs granted on December 1, 2011 that vested on October 3, 2014, shortly after the end of the FY12-FY14 performance cycle. The amounts reported in Column I and J are based on actual achievement, which was two hundred percent (200%) of target, and are valued by using the closing price of our stock on the vesting date, which was $93.89. |
| (12) | Represents PSUs granted on December 3, 2012 that vest within sixty days after the end of the FY13-FY15 performance cycle (such performance cycle ends September 25, 2015) only to the extent that the Compensation Committee certifies that the applicable performance criteria have been satisfied. The amounts reported in this column are based on achievement of maximum performance through the end of fiscal 2014. |
| (13) | Represents PSUs granted on December 2, 2013 that vest within sixty days after the end of the FY14-FY16 performance cycle (such performance cycle ends September 30, 2016) only to the extent that the Compensation Committee certifies that the applicable performance criteria have been satisfied. The amounts reported in this column are based on achievement of maximum performance through the end of fiscal 2014. |
24
Table of Contents
Option Exercises and Stock Vested
The following table provides information regarding the number of Company stock options that were exercised by named executive officers during fiscal 2014 and the value realized from the exercise of such awards. The table also provides information regarding the vesting of restricted stock unit and PSU awards during fiscal 2014.
FISCAL 2014 OPTION EXERCISES AND STOCK VESTED
| Name |
Option Awards | Stock Awards | ||||||||||||||
| Number of Shares Acquired on Exercise (#) |
Value Realized on Exercise ($) |
Number of Shares Acquired on Vesting (#) |
Value Realized on Vesting ($) |
|||||||||||||
| (A) |
(B) | (C) | (D) | (E) | ||||||||||||
| José E. Almeida |
151,166 | $ | 5,815,983 | 90,207 | $ | 7,642,689 | ||||||||||
| Charles J. Dockendorff |
180,730 | $ | 5,726,621 | 12,712 | $ | 865,468 | ||||||||||
| Bryan C. Hanson |
55,706 | $ | 1,296,036 | 25,922 | $ | 1,747,572 | ||||||||||
| Peter L. Wehrly |
20,980 | $ | 631,208 | 26,717 | $ | 1,801,820 | ||||||||||
| John H. Masterson |
38,093 | $ | 1,031,003 | 5,685 | $ | 387,021 | ||||||||||
Stock Awards (Columns D and E) For Messrs. Hanson and Wehrly, includes shares received upon the vesting of the Asia Growth Initiative that vested on November 20, 2013, after the end of the FY11-FY13 performance cycle and upon certification by the Compensation Committee that the applicable performance criteria were satisfied. Actual achievement and payout was at one hundred sixty seven percent (167%) of target, resulting in the following shares and payout values, calculated by using the closing price of our stock on the vesting date, which was $66.37: Mr. Hanson, 19,008 shares with a payout value of $1,261,561; and Mr. Wehrly, 20,998 shares with a payout value of $1,393,637.
Pension Benefits
2014 PENSION BENEFITS
| Name |
Plan Name | Number of Years Credited Service(1) (#) |
Present Value of Accumulated Benefit(2) ($) |
Payments During Last Fiscal Year ($) |
||||||||||
| (A) |
(B) | (C) | (D) | (E) | ||||||||||
| José E. Almeida |
Kendall Pension Plan(3) | 0.2 | $ | 1,725 | — | |||||||||
| Charles J. Dockendorff |
Kendall Pension Plan(3) Kendall Pension Plan(4) |
|
5.1 0.7 |
|
$ $ |
62,968 13,926 |
|
|
— — |
| ||||
| Bryan C. Hanson |
Kendall Pension Plan(3) | 2.7 | $ | 8,529 | — | |||||||||
| Peter L. Wehrly |
— | — | — | — | ||||||||||
| John H. Masterson |
Kendall Pension Plan(3) | 2.1 | $ | 13,734 | — | |||||||||
Footnotes
| (1) | The number of years of service credited under the Kendall Pension Plan for the named executive officers is less than the number of actual years of service because the years of credited service were frozen as of July 1, 1995. |
| (2) | All assumptions are as detailed in accordance with the Accounting Standards Codification 715 (formerly referred to as SFAS 87) actuarial reports for the fiscal year ending September 26, 2014, with the exception of the following: (a) retirement age is the earliest age at which unreduced payment of all benefits can be received; and (b) no pre-retirement mortality, disability or termination is assumed. The amounts are calculated as being payable at age 60, the earliest retirement age at which an unreduced benefit is payable. For additional information relating to assumptions made with respect to our pension plan, see Note 17 to the Consolidated Financial Statements included in our Annual Report on Form 10-K for the fiscal year ended September 26, 2014. |
| (3) | Represents benefit payable under the cash balance component. |
| (4) | Represents benefit payable under the final average pay component. |
25
Table of Contents
Messrs. Almeida, Dockendorff, Hanson and Masterson participate in the Kendall Pension Plan, which was frozen with respect to all future benefit accruals (except interest crediting on the cash balance benefit) as of July 1, 1995. The Pension Plan has two components:
| • | a final average pay benefit, which was frozen as of May 31, 1990; and |
| • | a cash balance benefit. |
Mr. Dockendorff is entitled to benefits payable pursuant to both components, while Messrs. Almeida, Hanson and Masterson are entitled only to the cash balance benefit.
Participants retiring on their normal retirement date (age 65) are entitled to a monthly pension calculated as the sum of:
| • | the benefit accrued under the provisions of the plan as in effect on June 1, 1990, including the value of the benefit derived from employee contributions; and |
| • | with respect to accruals on or after June 1, 1990, the actuarial equivalent of the participant’s current account. |
The current account is credited with interest at the one-year Treasury bill rate in effect on January 1st for each calendar year and service credits as follows:
| Tier |
Years of Benefit Service | Percent of Compensation | ||||
| I |
0-2 | 4.75 | % | |||
| II |
3-9 | 5.25 | % | |||
| III |
10-14 | 6.00 | % | |||
| IV |
15-19 | 7.00 | % | |||
| V |
20+ | 7.50 | % | |||
Participants desiring to retire before normal retirement age may do so after attaining age 55 and completing five years of continuous service. If a participant chooses to retire before normal retirement age, the applicable accrued benefit as of June 1, 1990 will be reduced by 0.33% per month for each month commencement precedes age 60. Mr. Dockendorff currently is eligible for early retirement.
Non-Qualified Deferred Compensation
The following table provides information with respect to fiscal 2014 non-qualified deferred compensation for each named executive officer.
FISCAL 2014 NON-QUALIFIED DEFERRED COMPENSATION
| Name |
Executive Contributions in Last FY ($) |
Registrant Contributions in Last FY ($) |
Aggregate Earnings in Last FY ($) |
Aggregate Withdrawals/ Distributions ($) |
Aggregate Balance at Last FYE ($) |
|||||||||||||||
| (A) |
(B) | (C) | (D) | (E) | (F) | |||||||||||||||
| José E. Almeida |
$ | 894,880 | $ | 155,189 | $ | 343,673 | — | $ | 4,497,703 | |||||||||||
| Charles J. Dockendorff |
$ | 924,245 | $ | 85,149 | $ | 977,615 | — | $ | 17,187,263 | |||||||||||
| Bryan C. Hanson |
$ | 154,188 | $ | 53,029 | $ | 198,300 | $ | 257,270 | $ | 1,655,261 | ||||||||||
| Peter L. Wehrly |
— | $ | 44,047 | $ | 15,250 | — | $ | 219,168 | ||||||||||||
| John H. Masterson |
$ | 44,095 | $ | 42,901 | $ | 363,264 | — | $ | 5,468,551 | |||||||||||
Executive Contributions in Last Fiscal Year (Column B) For all named executive officers other than Mr. Wehrly, reflects deferrals from fiscal 2014 base salary that also are reported in Column C (Salary) of the Summary Compensation Table for fiscal 2014 as follows: Mr. Almeida, $252,593; Mr. Dockendorff, $417,982; Mr. Hanson, $78,114; and Mr. Masterson, $44,095. For Messrs. Almeida, Dockendorff and Hanson, also reflects deferrals of their 2013 Annual Incentive Plan bonus payment paid for fiscal 2013, which is also included in Column G (Non-Equity Incentive Plan Compensation) of the Summary Compensation Table for fiscal 2013, the year in which the bonus was earned, as follows: Mr. Almeida, $642,287; Mr. Dockendorff, $506,263; and Mr. Hanson, $76,074.
Registrant Contributions in Last Fiscal Year (Column C) Amounts reported in Column C are included in Column I of the Summary Compensation Table for fiscal 2014.
26
Table of Contents
Aggregate Earnings in Last Fiscal Year (Column D) Includes earnings credited to the named executive officer’s account in the Supplemental Savings Plan. Earnings on amounts credited to the Supplemental Savings Plan are determined by investment selections made by each named executive officer in investment alternatives that generally mirror investment choices offered under the Retirement Savings Plan (our 401(k) plan). With respect to amounts credited to a predecessor plan, eligible employees, including Messrs. Dockendorff and Masterson, are entitled to select the Enhanced Moody’s Rate as an investment alternative for amounts that were credited to such plan on their behalf prior to our assumption of the plan. The Enhanced Moody’s Rate is published in Moody’s Bond Record (or www.moodys.com) under the heading “Moody’s Long-Term Corporate Bond Yield Average” and is equal to the average corporate bond yield (based on seasoned bonds with remaining maturities of at least 20 years) published as of the fiscal year-end of the Company preceding the plan year for which the rate is to be used. During the 2014 fiscal year, the Enhanced Moody’s Rate was 4.6375%, which exceeded 120% of the applicable federal long-term rate with compounding by 1.0275 percentage points. The excess attributable to this higher rate of return is also reported in Column H (Change in Pension Value and Non-Qualified Deferred Compensation Earnings) of the Summary Compensation Table for Messrs. Dockendorff and Masterson as above-market earnings for fiscal 2014 and is quantified in the related narrative.
Aggregate Balance at Last Fiscal Year End (Column F) Includes the following amounts reported in the Company’s Summary Compensation Tables for previous fiscal years: Mr. Almeida, $1,819,064; Mr. Dockendorff, $587,371; Mr. Hanson, $815,803; Mr. Wehrly, $85,252; and Mr. Masterson, $336,017.
Under the Supplemental Savings Plan, participants, including named executive officers, may defer up to 50% of their base salary and 100% of their annual bonus. We provide matching credits based on the participant’s deferred base salary and bonus at the same rate such participant is eligible to receive matching contributions under the Retirement Savings Plan and Company credits on any cash compensation (i.e., base and bonus) that the participant earns during a calendar year in excess of applicable IRS limits ($255,000 for 2013 and $260,000 for 2014). Participants are fully vested in matching and Company credits (including earnings on such credits) upon completion of two years of service. The Supplemental Savings Plan is a non-qualified deferred compensation plan that is maintained as an unfunded “top-hat” plan. Amounts credited to the Supplemental Savings Plan as participant deferrals or Company credits may also be credited with earnings (or losses) based upon investment selections made by each participant from investments that generally mirror investments offered under the Retirement Savings Plan. Participants may elect whether they will receive a distribution of their Supplemental Savings Plan account balances upon termination of employment or at a specified date. Distributions can be made in a lump sum or in up to 15 annual installments.
Under the Retirement Savings Plan, the Company makes an automatic contribution of three percent (3%) of an employee’s eligible pay, irrespective of whether the employee contributes to such plan. Additionally, we match fifty cents ($0.50) for every one dollar ($1.00) employees contribute, up to the first six percent (6%) of eligible pay. Employees who were credited with more than 20 years of service as of December 31, 2009 are “grandfathered” for a five (5) year period (i.e., until December 31, 2014) and continue to receive matching contributions in accordance with the formula in place on December 31, 2009. Mr. Dockendorff had more than 20 years of service as of December 31, 2009 and is a “grandfathered” participant. Accordingly, we will continue to match, through December 31, 2014, seven dollars ($7.00) for every one dollar ($1.00) that Mr. Dockendorff contributes, up to the first five percent (5%) of eligible pay.
Potential Payments upon Termination
Severance Plan. For all named executive officers, severance benefits are payable pursuant to the Covidien Severance Plan for U.S. Officers and Executives. Under the Severance Plan, benefits are payable to eligible executives, including named executive officers, upon an involuntary termination of employment for any reason other than cause, permanent disability or death. Post-termination benefits consist of:
| • | continuation of base salary for a period of 18 months (24 months for the Chief Executive Officer); |
| • | payment of 1.5 times the average of the executive’s bonus for the previous three fiscal years, paid over a period of 18 months (two times the average of the previous three fiscal year bonuses, paid over a period of 24 months for the Chief Executive Officer); |
| • | continuation of health and dental benefits at active employee rates for a period of up to 18 months (24 months for the Chief Executive Officer); |
| • | 12 months accelerated vesting of unvested stock options; |
| • | 12 months to exercise vested stock options (unless a longer period is provided in the applicable award agreement); |
| • | outplacement services, in our discretion, for up to 12 months; and |
| • | payment of a pro-rata portion of the executive’s annual incentive cash award for the fiscal year during which such executive’s employment terminates. |
27
Table of Contents
Upon a termination of employment other than for cause, including an involuntary termination of employment where the executive becomes eligible for severance benefits, executives, including named executive officers, forfeit all unvested restricted stock unit and PSU awards and any stock options which do not vest within 12 months after the executive’s employment termination date.
Change in Control Plan. For all named executive officers, severance benefits upon a change in control are payable pursuant to the Covidien Change in Control Severance Plan for Certain U.S. Officers and Executives instead of the Severance Plan. Under the Change in Control Plan, benefits are payable to eligible executives, including named executive officers, only if the plan’s double trigger requirements are satisfied, meaning that, in order to receive any of the following benefits, the executive must experience an involuntary termination of employment or good reason resignation during a period that begins 60 days before and ends 2 years after a change in control. Post-termination benefits consist of:
| • | a single lump sum payment equal to 24 months of the executive’s base salary (36 months for the Chief Executive Officer, provided that the amount paid does not exceed 2.99 times his base salary); |
| • | a single lump sum payment equal to two times the average of the executive’s bonus for the previous three fiscal years (2.99 times the average of the previous three fiscal year bonuses for the Chief Executive Officer); |
| • | continuation of health and dental benefits at active employee rates for a period of up to 24 months (36 months for the Chief Executive Officer); |
| • | full vesting of unvested stock options; |
| • | 12 months to exercise vested stock options (unless a longer period is provided in the applicable award agreement); |
| • | full vesting of unvested restricted stock unit awards which are subject solely to time-based vesting; |
| • | full vesting of unvested PSUs if, and to the extent that, the Compensation Committee determines that the applicable performance criteria have been or will be attained or would have been attained during the 24-month period after the executive’s employment terminates (36-month period for the Chief Executive Officer); |
| • | outplacement services, in our discretion, for up to 12 months; and |
| • | payment of a pro-rata portion of the executive’s annual incentive cash award for the fiscal year during which such executive’s employment terminates. |
The payment of benefits under our Severance Plan and our Change in Control Plan is conditioned upon the executive executing a general release in favor of the Company and is subject to the terms of the Non-Competition, Non-Solicitation, and Confidentiality Agreement by and between the executive and the Company, under which the executive agrees not to disclose confidential Company information at any time and not to compete with the Company nor solicit our employees or customers, for a period of one year following termination of employment. We may cancel benefits that are payable or seek to recover benefits previously paid if the executive does not comply with these provisions or violates the release of claims. Payments may be delayed until six months after termination of employment if necessary to comply with Internal Revenue Code Section 409A.
Upon a termination of employment for cause, executives, including named executive officers, are not eligible for severance benefits under our Severance Plan or our Change in Control Plan and forfeit all unvested stock options, restricted stock unit and PSU awards. In addition, the stock option, restricted stock unit and PSU awards include a “claw-back” feature pursuant to which we may recover the amount of any profit the named executive officer realized upon the exercise of options, or the vesting of any restricted stock unit or PSU award, during the 12-month period that occurs immediately prior to the executive officer’s involuntary termination of employment for cause. For purposes of our Severance Plan and our Change in Control Plan, as well as the “claw-back” feature discussed in the preceding sentence, “cause” means substantial failure or refusal of the named executive officer to perform the duties and responsibilities of his job as required by the Company, violation of any fiduciary duty owed to the Company, conviction of a felony or misdemeanor, dishonesty, theft, violation of Company rules or policy, including a violation of our Guide to Business Conduct, or other egregious conduct that has or could have a serious and detrimental impact on the Company and its employees.
Other Termination Benefits. The terms of our annual incentive plan and equity plan provide for certain benefits upon a named executive officer’s termination of employment due to death, disability or retirement. For this purpose, normal retirement occurs where an executive officer terminates employment after attaining age 60 and the sum of the executive’s age and years of service equals at least 70 and early retirement occurs where an executive officer terminates employment after attaining age 55 and the sum of the executive’s age plus years of service equals at least 60. Under the annual incentive plan, named executive officers are eligible to receive a pro-rated annual incentive cash award based on the number of days that the executive officer was employed by the Company during the fiscal year upon death, disability or normal or early retirement. Under the equity plan, named executive officers are eligible to receive full vesting of stock options, restricted stock units and PSUs upon death, disability or normal retirement and pro-rated vesting of such awards upon early retirement, based on the number of whole months that the executive officer was employed by the Company during the applicable vesting period. The terms of the Severance Plan provide that if, during the applicable severance period, the executive officer attains the requisite age for either early or normal retirement, then the executive officer is entitled to the
28
Table of Contents
applicable retirement treatment as of the employment termination date. As of the end of fiscal 2014, Mr. Dockendorff had satisfied the requirements for normal retirement, Mr. Wehrly had satisfied the requirements for early retirement and Mr. Masterson satisfied the requirements for early retirement under the Severance Plan in the event of his involuntary termination of employment.
The table below reflects the amount of compensation that would become payable to each of our named executive officers under existing plans if the named executive officer’s employment had terminated on September 26, 2014, the last day of our 2014 fiscal year, given the named executive’s service levels as of such date and, if applicable, based on our closing stock price as of that date, which was $89.98. These benefits are in addition to benefits available prior to the occurrence of any termination of employment, including under then-exercisable stock options, and benefits available generally to salaried employees, such as distributions under the Retirement Savings Plan.
The actual amounts that would be paid upon a named executive officer’s termination of employment or in connection with a change in control can be determined only at the time of any such event. Due to a number of factors that may affect the amount of any benefits provided upon the events discussed below, actual amounts paid or distributed may be higher or lower than indicated in the table. Factors that could affect these amounts include the timing during the year of any such event, our stock price, the executive’s age and years of service, the attained level of performance for PSUs, and any additional agreements or arrangements we may enter into in connection with any change in control or termination of employment.
POTENTIAL PAYMENTS UPON TERMINATION
| Name and Termination Scenario |
Cash Severance |
Bonus | Option Awards |
Stock Awards |
Welfare Benefits and Outplacement |
Total | ||||||||||||||||||
| (A) |
(B) | (C) | (D) | (E) | (F) | (G) | ||||||||||||||||||
| José E. Almeida |
||||||||||||||||||||||||
| Involuntary Termination (other than for cause) |
$ | 5,442,548 | $ | 2,707,069 | $ | 9,363,904 | $ | 11,501,868 | $ | 71,099 | $ | 29,086,488 | ||||||||||||
| Death or Disability |
— | $ | 2,707,069 | $ | 21,147,619 | $ | 36,653,258 | — | $ | 60,507,946 | ||||||||||||||
| Change in Control Termination |
$ | 8,136,609 | $ | 2,707,069 | $ | 21,147,619 | $ | 36,653,258 | $ | 83,233 | $ | 68,727,788 | ||||||||||||
| Charles J. Dockendorff |
||||||||||||||||||||||||
| Involuntary Termination (other than for cause) |
$ | 2,368,801 | $ | 1,122,754 | $ | 7,812,359 | $ | 12,219,726 | $ | 64,735 | $ | 23,588,375 | ||||||||||||
| Normal Retirement |
— | $ | 1,122,754 | $ | 7,812,359 | $ | 12,219,726 | — | $ | 21,154,839 | ||||||||||||||
| Death or Disability |
— | $ | 1,122,754 | $ | 7,812,359 | $ | 12,219,726 | — | $ | 21,154,839 | ||||||||||||||
| Change in Control Termination |
$ | 3,158,401 | $ | 1,122,754 | $ | 7,812,359 | $ | 12,219,726 | $ | 71,099 | $ | 24,384,339 | ||||||||||||
| Bryan C. Hanson |
||||||||||||||||||||||||
| Involuntary Termination (other than for cause) |
$ | 1,694,964 | $ | 736,501 | $ | 2,482,473 | $ | 3,091,320 | $ | 64,735 | $ | 8,069,993 | ||||||||||||
| Death or Disability |
— | $ | 736,501 | $ | 5,643,810 | $ | 9,851,247 | — | $ | 16,231,558 | ||||||||||||||
| Change in Control Termination |
$ | 2,259,951 | $ | 736,501 | $ | 5,643,810 | $ | 9,851,247 | $ | 71,099 | $ | 18,562,608 | ||||||||||||
| Peter L. Wehrly |
||||||||||||||||||||||||
| Involuntary Termination (other than for cause) |
$ | 1,525,241 | $ | 563,767 | $ | 2,051,273 | $ | 4,098,187 | $ | 64,735 | $ | 8,303,203 | ||||||||||||
| Early Retirement |
— | $ | 563,767 | $ | 1,730,228 | $ | 4,098,187 | — | $ | 6,392,182 | ||||||||||||||
| Death or Disability |
— | $ | 563,767 | $ | 4,635,291 | $ | 8,103,301 | — | $ | 13,302,359 | ||||||||||||||
| Change in Control Termination |
$ | 2,033,655 | $ | 563,767 | $ | 4,635,291 | $ | 8,103,301 | $ | 71,099 | $ | 15,407,113 | ||||||||||||
| John H. Masterson |
||||||||||||||||||||||||
| Involuntary Termination (other than for cause) |
$ | 1,708,080 | $ | 785,628 | $ | 1,862,959 | $ | 2,567,883 | $ | 64,735 | $ | 6,989,285 | ||||||||||||
| Death or Disability |
— | $ | 785,628 | $ | 3,775,340 | $ | 5,739,048 | — | $ | 10,300,016 | ||||||||||||||
| Change in Control Termination |
$ | 2,277,439 | $ | 785,628 | $ | 3,775,340 | $ | 5,739,048 | $ | 71,099 | $ | 12,648,554 | ||||||||||||
29
Table of Contents
Cash Severance (Column B)
Involuntary Termination (other than for cause). For all named executive officers other than Mr. Almeida, represents continuation of the named executive officer’s base salary, as of September 26, 2014, for an 18-month severance period, plus an amount equal to 1.5 times the average of the named executive officer’s annual incentive cash awards for the previous three fiscal years (i.e., fiscal 2013, 2012 and 2011), payable during the 18-month severance period and on our normal payroll schedule. For Mr. Almeida, represents continuation of his base salary, as of September 26, 2014, for a 24-month severance period, plus an amount equal to two times the average of his annual incentive cash awards for the previous three fiscal years, payable during the 24-month severance period and on our normal payroll schedule.
Change in Control Termination. Represents a lump sum payment equal to two times (2.99 times for Mr. Almeida) (a) the named executive officer’s base salary as of September 26, 2014 plus (b) the average of the named executive officer’s annual incentive cash awards for the previous three years.
Bonus (Column C)
Represents the pro-rata payment of the annual incentive cash award based on the number of days that the named executive officer was employed by the Company during the fiscal year. Because we have assumed that the applicable termination of employment occurred on the last day of our 2014 fiscal year, the amounts reported in Column C for this scenario represent the full annual incentive cash award payable to each named executive officer for fiscal 2014. Because Messrs. Dockendorff and Wehrly satisfied the requirements for normal and early retirement, respectively, pursuant to our annual incentive plan, they are entitled to a pro-rata payment of the annual incentive cash award. Because we have assumed that the applicable retirement occurred on the last day of our 2014 fiscal year, the amounts reported in Column C under the “Normal Retirement” and “Early Retirement” scenarios represent the full annual incentive cash award payable to Messrs. Dockendorff and Wehrly.
Option Awards (Column D)
Involuntary Termination (other than for cause). For all named executive officers other than Mr. Dockendorff, represents the value as of September 26, 2014 of outstanding options held by the named executive officer that would have vested during the 12-month period that immediately follows September 26, 2014 (i.e., from September 26, 2014 to September 26, 2015). For Mr. Dockendorff, who would have been deemed to satisfy the requirements for normal retirement under the Severance Plan upon an involuntary termination of employment, represents the value that would have been attained upon the full vesting of all unvested options he held on September 26, 2014.
Normal Retirement/Early Retirement. As of September 26, 2014, Mr. Dockendorff satisfied the requirements for normal retirement and Mr. Wehrly satisfied the requirements for early retirement under our equity plan. The amount reported in Column D for Mr. Dockendorff for this scenario represents the value attributable to option awards which would have become fully vested on September 26, 2014, had Mr. Dockendorff voluntarily terminated employment on such date. The amount reported in Column D for Mr. Wehrly for this scenario represents the value attributable to the following option awards which would have vested on September 26, 2014, had Mr. Wehrly voluntarily terminated employment on such date: the December, 2010, July 2011, December 2011 and December 2012 option awards. Mr. Wehrly did not satisfy the requirements for early retirement with respect to the December 2013 option award because such award requires that the employee retire at least 12 months after the grant date to receive early retirement treatment. Because the assumed employment termination date (September 26, 2014) is less than 12 months after the December 2013 grant date, Mr. Wehrly was not entitled to pro-rata vesting of the December 2013 option award as of the last day of fiscal 2014.
Death or Disability and Change in Control Termination. Represents the full vesting of unvested options held by the named executive officer on September 26, 2014.
30
Table of Contents
Stock Awards (Column E)
Involuntary Termination (other than for cause). For Messrs. Almeida and Hanson, represents the value of the PSU award issued in December 2011 which vested on October 3, 2014 and which the executive officer would have been entitled to receive upon an involuntary termination of employment on the last day of the fiscal year. For Mr. Dockendorff, represents the value that would have been attained upon the full vesting of all unvested restricted stock unit and PSU awards he held on September 26, 2014. For Messrs. Wehrly and Masterson, represents the value of the PSU award issued in December 2011 which vested on October 3, 2014 and which the executive officer would have been entitled to receive upon an involuntary termination of employment on the last day of the fiscal year and the value attributable to the following restricted stock and PSU awards which would have become pro-rata vested on September 26, 2014, had Messrs. Wehrly and Masterson involuntarily terminated employment on such date: restricted stock awards granted in December, 2010, July 2011 (only for Mr. Wehrly), December 2011 and December 2012; and PSU awards granted in December 2012. Messrs. Wehrly and Masterson did not satisfy the requirements for early retirement with respect to the restricted unit and PSU awards granted in December 2013 because such awards require that the employee retire at least 12 months after the grant date to receive early retirement treatment. Because the assumed employment termination date (September 26, 2014) is less than 12 months after the December 2013 grant date, Messrs. Wehrly and Masterson were not entitled to pro-rata vesting of the December 2013 restricted unit and PSU awards as of the last day of fiscal 2014. For purposes of this scenario, amounts attributable to PSU awards are based on the following assumptions: for the December 2011 awards, the actual number of shares that vested after the conclusion of the FY12-FY14 performance cycle; for the December 2012 and December 2013 awards, the number of shares that would have vested based on achievement of maximum performance.
Normal Retirement/Early Retirement. With respect to Mr. Dockendorff who, as of September 26, 2014, satisfied the requirements for normal retirement under our equity plan, the amount includes the value attributable to restricted stock unit and PSU awards which would have become fully vested on September 26, 2014, had Mr. Dockendorff voluntarily terminated employment on such date. With respect to Mr. Wehrly who, as of September 26, 2014, satisfied the requirements for early retirement under our equity plan, the amount includes the value attributable to following restricted stock and PSU awards which would have become pro-rata vested on September 26, 2014, had Mr. Wehrly voluntarily terminated employment on such date: restricted stock awards granted in December, 2010, July, 2011, December, 2011 and December 2012; and PSU awards granted in December, 2011 and December, 2012. Mr. Wehrly did not satisfy the requirements for early retirement with respect to the restricted unit and PSU awards granted in December 2013 because such awards require that the employee retire at least 12 months after the grant date to receive early retirement treatment. Because the assumed employment termination date (September 26, 2014) is less than 12 months after the December 2013 grant date, Mr. Wehrly was not entitled to pro-rata vesting of the December 2013 restricted unit and PSU awards as of the last day of fiscal 2014. For purposes of this scenario, amounts attributable to PSU awards are based on the following assumptions: for the December 2011 awards, the actual number of shares that vested after the conclusion of the FY12-FY14 performance cycle; for the December 2012 and December 2013 awards, the number of shares that would have vested based on achievement of maximum performance.
Death or Disability and Change in Control Termination. Represents the value that would have been attained upon the full vesting of all unvested restricted stock unit and PSU awards held by the named executive officer as of September 26, 2014. For purposes of this scenario, amounts attributable to PSU awards are based on the following assumptions: (1) for the December 2011 awards, the actual number of shares that vested after the conclusion of the FY12-FY14 performance cycle; (2) for the December 2012 and December 2013 awards, the number of shares that would have vested based on achievement of maximum performance.
Welfare Benefits and Outplacement Services (Column F) Represents the employer portion of the premium paid on behalf of the named executive officer for continued coverage under the Company’s medical, dental and vision plans during the applicable severance period. Amounts for calendar year 2014 and 2015 are based on actual rates determined by the Company for the respective plan in such years, while the rates for subsequent years, where applicable, are assumed based on the historic percentage increase in rates for such coverage. Although payable in our discretion, for purposes of this column we assume that we would pay $45,000 for outplacement services upon an involuntary termination (other than for cause) and a change in control termination.
31
Table of Contents
Compensation of Non-Employee Directors
The Board of Directors has approved a compensation structure for non-employee directors consisting of equity awards, an annual cash retainer and, for some positions, supplemental cash retainers.
Cash Retainers
Board Members. Each non-employee director receives an annual cash retainer which is generally paid on a quarterly basis. Directors joining the Board other than on the first day of a quarter receive a cash retainer pro-rated for the number of days served during their initial quarter of service. In May 2014, the annual cash retainer was increased from $100,000 to $120,000, resulting in an effective cash retainer of $110,000 for the year.
Committee Chairs. The Chair of the Compliance Committee receives a supplemental annual cash retainer of $10,000. The Chair of the Compensation and Human Resources Committee receives a supplemental annual cash retainer of $15,000. The Chair of the Audit Committee receives a supplemental annual cash retainer of $20,000. The supplemental annual cash retainer for the Chair of the Nominating and Governance Committee and was increased from $10,000 to $15,000 in May 2014, resulting in an effective cash retainer of $12,500 for the year.
Committee Members. Each member of the Audit Committee (including the Chair) and each member of the Compensation and Human Resources Committee (including the Chair) also receives a supplemental annual cash retainer of $5,000.
Lead Director. The supplemental annual cash retainer for the Lead Director was increased from $35,000 to $50,000 in May 2014, resulting in an effective cash retainer of $42,500 for the year.
Equity Awards
Restricted Units. At the time of our 2014 Annual General Meeting, each non-employee director received an annual grant of restricted units with a value of $160,000. In May 2014, the annual grant value was increased by $30,000 to $190,000 and each director received a grant of restricted units with a value of $30,000. The fiscal 2014 awards vest on the date of the Company’s 2015 Annual General Meeting or, if earlier, at the time of the consummation of the Medtronic transaction. Restricted units also accrue dividend equivalent units until the restricted units vest and shares are issued. Directors joining the Board three or more months before the vesting date of the outstanding annual director award receive an equity award pro-rated for the number of days served from the date of appointment through the vesting of such outstanding director award. Mr. Rusckowski, who joined our board on December 1, 2013, received a pro-rated restricted stock unit award which vested at our 2014 Annual General Meeting.
Other
Pursuant to Covidien’s Matching Gift Program, the Company matches employee contributions to charitable organizations up to $10,000 and director contributions to charitable organizations up to $25,000. Directors are also reimbursed for reasonable out-of-pocket expenses incurred in attending Board, Board committee, and shareholder meetings and are also permitted to use the corporate aircraft to travel to and from such meetings.
Director Share Retention and Ownership Guidelines
As set forth in our Corporate Governance Guidelines, all non-employee directors are required to hold Covidien shares with a value equal to five times (5x) the annual cash retainer. To achieve the required ownership threshold, Directors are required to hold all shares (net of any shares withheld for taxes) resulting from the vesting of annual equity awards. In determining a director’s ownership, shares held directly as well as shares underlying restricted units subject to time-based vesting and their accompanying dividend equivalent units are included. Shares underlying unexercised stock options are not included in the calculation. Each of our directors has holdings in excess of this requirement, with the exception of Mr. Rusckowski, who joined our Board on December 1, 2013.
32
Table of Contents
The following table provides information concerning the compensation paid to our non-employee directors for service on our Board during the fiscal year ended September 26, 2014. Compensation for José E. Almeida, our President and Chief Executive Officer, is shown in the Summary Compensation Table on page 19. Mr. Almeida receives no compensation for his services as a director.
2014 Director Compensation Table
| Name |
Fees Earned or Paid in Cash ($) |
Stock Awards(1) ($) |
Other Compensation(2) ($) |
Total ($) |
||||||||||||
| (a) |
(b) | (c) | (g) | (h) | ||||||||||||
| Joy A. Amundson |
$ | 110,000 | (3) | $ | 190,054 | $ | 22,000 | $ | 321,554 | |||||||
| Craig Arnold |
$ | 115,000 | (4) | $ | 190,054 | — | $ | 305,054 | ||||||||
| Robert H. Brust |
$ | 115,000 | (4) | $ | 190,054 | — | $ | 305,054 | ||||||||
| Christopher J. Coughlin |
$ | 110,000 | (5) | $ | 190,054 | $ | 25,000 | $ | 325,054 | |||||||
| Randall J. Hogan, III |
$ | 135,000 | (6) | $ | 190,054 | — | $ | 325,054 | ||||||||
| Martin D. Madaus |
$ | 62,813 | (7) | $ | 190,054 | — | $ | 227,867 | ||||||||
| Dennis H. Reilley |
$ | 172,500 | (8) | $ | 190,054 | — | $ | 362,554 | ||||||||
| Stephen H. Rusckowski |
$ | 97,083 | (9) | $ | 237,972 | (10) | — | $ | 335,055 | |||||||
| Joseph A. Zaccagnino |
$ | 122,500 | (11) | $ | 190,054 | $ | 25,000 | $ | 337,554 | |||||||
| (1) | The amounts in column (c) reflect the aggregate grant date fair value of restricted units granted in fiscal 2014, calculated in accordance with Accounting Standards Codification 718. The grant date fair value does not necessarily correspond to the actual value that will be recognized by each director, which will likely vary based on a number of factors, including our financial performance, stock price fluctuations and applicable vesting. As of September 26, 2014, each current director listed in the table above had 2,703 restricted units (including dividend equivalent units) outstanding. As of September 26, 2014, Messrs. Arnold, Coughlin, Hogan, Reilley and Zaccagnino, held options to purchase 10,521 ordinary shares received as compensation for serving on our board during 2007, our first year as an independent public company. No stock options were granted to non-employee directors in fiscal 2014. |
| (2) | Reflects Company match, up to $25,000, of directors’ charitable contributions pursuant to Covidien’s Matching Gift Program. |
| (3) | Includes annual retainer. |
| (4) | Includes annual retainer and Audit Committee member retainer. |
| (5) | Includes annual retainer and Compliance Committee Chair retainer. |
| (6) | Includes annual retainer, Audit Committee member retainer and Audit Committee Chair retainer. |
| (7) | Includes for two and one-half quarters, annual retainer and Compensation and Human Resources Committee member retainer. Dr. Madaus retired from our Board, effective April 30, 2014. |
| (8) | Includes annual retainer, Compensation and Human Resources Committee member retainer, Compensation and Human Resources Committee Chair retainer and Lead Director retainer. |
| (9) | Includes, beginning December 1,2013 when Mr. Rusckowski joined the Board, annual retainer and the Compensation and Human Resources Committee member retainer. |
| (10) | Includes Mr. Rusckowski’s December 2013 pro-rated equity award as well as the 2014 director awards. |
| (11) | Includes annual retainer and Nominating and Governance Committee Chair retainer. |
33
Table of Contents
| Item 12. | Security Ownership of Certain Beneficial Owners and Management and Related Stockholder Matters |
Security Ownership of Management and Certain Beneficial Owners
The following tables show the number of Covidien ordinary shares beneficially owned:
| • | as of January 1, 2015, by each current director, each executive officer named in the Summary Compensation Table and our directors and executive officers as a group; and |
| • | as of the date indicated, by each owner of 5% or more of our outstanding ordinary shares. |
A person is deemed to be a beneficial owner of ordinary shares if he or she, either alone or with others, has the power to vote or to dispose of those ordinary shares or the right to acquire such power within 60 days of the date of the table. Ordinary shares subject to stock options presently exercisable or exercisable within 60 days of January 1, 2015, restricted stock units and dividend equivalent units are deemed to be outstanding and beneficially owned by the person holding the securities for the purpose of computing the percentage ownership of that person, but are not treated as outstanding for the purpose of computing the percentage of any other person. There were 454,006,720 Covidien ordinary shares outstanding as of January 1, 2015. The tables below are based on information furnished by the persons named, public filings and our records.
Directors and Executive Officers
| Name of Beneficial Owner |
Number of Covidien Ordinary Shares Beneficially Owned |
Percentage Ownership |
||||||
| Named Executive Officers |
||||||||
| José E. Almeida1 |
961,131 | * | ||||||
| Charles J. Dockendorff2 |
509,191 | * | ||||||
| Bryan C. Hanson3 |
128,110 | * | ||||||
| John H. Masterson4 |
138,612 | * | ||||||
| Peter L. Wehrly5 |
186,753 | * | ||||||
| Non-Employee Directors |
||||||||
| Joy A. Amundson6 |
24,043 | * | ||||||
| Craig Arnold6 |
27,913 | * | ||||||
| Robert H. Brust6 |
5,897 | * | ||||||
| Christopher J. Coughlin7 |
192,074 | * | ||||||
| Randall J. Hogan, III8 |
27,796 | * | ||||||
| Dennis H. Reilley6 |
46,532 | * | ||||||
| Stephen H. Rusckowski6 |
3,152 | * | ||||||
| Joseph A. Zaccagnino6 |
27,427 | * | ||||||
| All directors and executive officers as a group (22 persons)9 |
3,215,745 | * | ||||||
| * | Represents less than 1% of outstanding ordinary shares. |
| 1 | Includes 54,429 restricted stock units, 712,589 ordinary shares issuable upon the exercise of stock options presently exercisable or exercisable within 60 days of January 1, 2015 and 34,330 shares held in a Grantor Retained Annuity Trust. |
| 2 | Includes 16,383 restricted stock units, 373,160 ordinary shares issuable upon the exercise of stock options presently exercisable or exercisable within 60 days of January 1, 2015 and 88,753 shares held in a Grantor Retained Annuity Trust. |
| 3 | Includes 34,403 restricted stock units and 63,935 ordinary shares issuable upon the exercise of stock options presently exercisable or exercisable within 60 days of January 1, 2015. |
| 4 | Includes 8,429 restricted stock units and 54,768 ordinary shares issuable upon the exercise of stock options presently exercisable or exercisable within 60 days of January 1, 2015. |
| 5 | Includes 12,176 restricted stock units and 126,625 ordinary shares issuable upon the exercise of stock options presently exercisable or exercisable within 60 days of January 1, 2015. |
34
Table of Contents
| 6 | Includes 2,714 restricted stock units and 10,521 ordinary shares issuable upon the exercise of stock options presently exercisable or exercisable within 60 days of January 1, 2015. |
| 7 | Includes 2,714 restricted stock units, 134,638 ordinary shares issuable upon the exercise of stock options presently exercisable or exercisable within 60 days of January 1, 2015 and 7,970 shares held in a Grantor Retained Annuity Trust. |
| 8 | Includes 2,714 restricted stock units, 10,521 ordinary shares issuable upon the exercise of stock options presently exercisable or exercisable within 60 days of January 1, 2015 and 64 shares held in a trust over which Mr. Hogan has shared dispositive and voting power. |
| 9 | Includes, for executive officers not specifically named in the table, an aggregate of 644,116 ordinary shares issuable upon the exercise of stock options presently exercisable or exercisable within 60 days of January 1, 2015. |
5% Beneficial Owners
| Name and Address of Beneficial Owner |
Number of Covidien Ordinary Shares Beneficially Owned |
Percentage Ownership |
||||||
| BlackRock Inc. |
25,902,585 | 1 | 5.7 | % | ||||
| 1 | The number of ordinary shares beneficially owned by BlackRock Inc. (“BlackRock”) was provided by BlackRock pursuant to a Form 13G/A filed February 3, 2014. |
| Item 13. | Certain Relationships and Related Transactions, and Director Independence |
Transactions with Related Persons
The Board’s Nominating and Governance Committee is responsible for the review and, if appropriate, approval or ratification of “related-person transactions” involving Covidien or its subsidiaries and related persons. Under SEC rules, a related person is a director, nominee for director, executive officer or a beneficial owner of 5% or more of Covidien’s shares, and their immediate family members. Our Board of Directors has adopted written policies and procedures that apply to any transaction or series of transactions in which the Company or a subsidiary is a participant, the amount involved exceeds $120,000 and a related person has a direct or indirect material interest.
Covidien personnel in the legal and finance departments review transactions involving related persons. If they determine that a related person could have a material interest in such a transaction, the transaction is forwarded to the Nominating and Governance Committee for review. The Nominating and Governance Committee determines whether the related person has a material interest in a transaction and may, in its discretion, approve, ratify, rescind or take other action with respect to the transaction. The Nominating and Governance Committee reviews all material facts related to the transaction and takes into account, among other factors it deems appropriate, whether the transaction is on terms no less favorable to the Company than terms generally available to an unaffiliated third-party under the same or similar circumstances, the extent of the related person’s interest in the transaction and, if applicable, the availability of other sources of comparable products or services. The following transaction was considered and ratified by the Nominating and Governance Committee:
Bryan C. Hanson, one of our named executive officers, is Group President, Covidien. Mr. Hanson’s brother-in-law is employed by Covidien in its vascular therapies business. In fiscal 2014, Mr. Hanson’s brother-in-law received total cash compensation of approximately $279,593 and an equity award valued at $50,000. His compensation was commensurate with that of his peers.
Peter L. Wehrly, one of our named executive officers, is Group President, Developed Markets. Mr. Wehrly’s daughter is employed by Covidien. In fiscal 2014, Mr. Wehrly’s daughter received total cash compensation of approximately $122,361. She did not receive any equity awards. Her compensation was commensurate with that of her peers.
Independence of Directors
Covidien’s governance guidelines include criteria adopted by the Board to assist it in making determinations regarding the independence of its members. The criteria, summarized below, are consistent with the NYSE listing standards regarding director independence. To be considered independent, the Board must determine that a director does not have a material relationship, directly
35
Table of Contents
or indirectly, with Covidien. In assessing independence, the Board considers all relevant facts and circumstances. In particular, when assessing the materiality of a director’s relationship with the Company, the Board considers the issue not just from the standpoint of the director, but also from that of the persons or organizations with which the director has an affiliation. A director will not be considered independent if he or she:
| • | is, or has been within the last three years, an employee of Covidien; |
| • | has an immediate family member who is, or has been within the last three years, an executive officer of Covidien; |
| • | is a current partner or employee of our auditor; |
| • | has an immediate family member who is a current partner of our auditor or who is an employee of our auditor and personally works on our audit; |
| • | has been, or has an immediate family member who has been, within the last three years, a partner or employee of our auditor who personally worked on our audit during that time; |
| • | is, or an immediate family member is, or has been within the last three years, employed as an executive officer of a public company that has or had on the compensation committee of its Board an executive officer of Covidien (during the same period of time); |
| • | has, or has an immediate family member who has, received more than $120,000 in direct compensation from Covidien, other than director and committee fees, in any twelve month period within the last three years; |
| • | is a current employee, or has an immediate family member who is a current executive officer, of a company that has made payments to, or received payments from, Covidien for property or services in an amount which, in any of the last three fiscal years, exceeds the greater of $1 million or 2% of such other company’s consolidated gross revenues; or |
| • | is, or his or her spouse is, an executive officer, director or trustee of a charitable organization to which Covidien’s contributions, not including our matching of charitable contributions by employees, exceed, in any single year within the last three fiscal years, the greater of $1 million or 2% of such organization’s total charitable receipts during that year. |
The Board has considered the independence of its members in light of these independence criteria. In connection with its independence considerations, the Board has reviewed Covidien’s relationships with organizations with which our directors are affiliated and has determined that such relationships were established in the ordinary course of business. The Board has further determined that none of these current business relationships are material to us, any of the organizations involved, or our directors. Based on these considerations, the Board has determined that each of our directors, other than José E. Almeida, our Chairman, President and Chief Executive Officer, satisfies the criteria and is independent. These independent directors are: Joy A. Amundson, Craig Arnold, Robert H. Brust, Christopher J. Coughlin, Randall J. Hogan, III, Dennis H. Reilley, Stephen H. Rusckowski and Joseph A. Zaccagnino. Each independent director is expected to notify the chair of the Nominating and Governance Committee, as soon as reasonably practicable, of changes in his or her personal circumstances that may affect the Board’s evaluation of his or her independence.
36
Table of Contents
| Item 14. | Principal Accounting Fees and Services |
Audit and Non-Audit Fees
Set forth below are the aggregate fees for professional services rendered to Covidien by Deloitte & Touche LLP for the period September 28, 2013 through September 26, 2014 (“Fiscal 2014”) and the period September 29, 2012 through September 27, 2013 (“Fiscal 2013”).
| Fiscal 2014 | Fiscal 2013 | |||||||
| (in thousands) | ||||||||
| Audit Fees |
$ | 11,460 | $ | 11,425 | ||||
| Audit-Related Fees |
860 | 4,047 | ||||||
| Tax Fees |
4,245 | 3,200 | ||||||
| All Other Fees |
0 | 1,064 | ||||||
|
|
|
|
|
|||||
| Total |
$ | 16,565 | $ | 19,736 | ||||
Audit Fees include fees for professional services rendered for the year-end audits of our consolidated financial statements and internal control over financial reporting, reviews of the financial statements included in our Quarterly Reports on Form 10-Q, consents, statutory filings, statutory audits, Irish statutory audits and discontinued operations reclassification.
Audit-Related Fees primarily relate to carve-out audits, separation plan audit procedures, and services related to mergers and acquisitions.
Tax Fees include fees for tax compliance services such as assistance with the preparation of federal and state returns ($2.91 million for Fiscal 2014 and $3.20 million for Fiscal 2013) as well as fees for tax planning services ($1.34 million for Fiscal 2014 and $0 for Fiscal 2013).
All Other Fees for Fiscal 2013 include services relating to project methodology and support for a marketing excellence program.
Policy on Audit Committee Pre-Approval of Audit and Permissible Non-Audit Services
The Audit Committee has adopted a pre-approval policy that provides guidelines for audit, audit-related, tax and other permissible non-audit services that may be provided by our independent auditors. Pursuant to the policy, our Corporate Controller supports the Audit Committee by providing a list of proposed services to the Committee, monitoring the services and fees pre-approved by the Committee, providing periodic reports to the Committee with respect to pre-approved services and coordinating with management and the independent auditors to support compliance with the policy.
Under the policy, the Audit Committee annually pre-approves the audit fee and terms of the engagement, as set forth in the engagement letter. The Committee also annually approves a specified list of audit, audit-related and tax services. Any service not included in the specified list of services must be submitted to the Committee for pre-approval. The independent auditors may not begin work on any engagement without confirmation of Committee pre-approval from our Corporate Controller or his delegate.
Pursuant to the policy, the Audit Committee has delegated to its Chair the authority to pre-approve the engagement of the independent auditors in his discretion. The Chair reports all such pre-approvals to the Committee at the next Committee meeting.
37
Table of Contents
| Item 15. | Exhibits, Financial Statement Schedules |
| (a) | (1) and (2) See Item 8 - Financial Statements and Supplementary Data, filed on November 24, 2014. |
| (3) | Exhibit Index: |
| Exhibit Number |
Exhibit | |
| 2.1 | Separation and Distribution Agreement by and among Tyco International Ltd., Covidien Ltd., and Tyco Electronics Ltd., dated as of June 29, 2007 (Incorporated by reference to Exhibit 2.1 to the Registrant’s Current Report on Form 8-K filed on July 5, 2007). | |
| 2.2 | Separation and Distribution Agreement between Covidien plc and Mallinckrodt plc, dated June 28, 2013 (Incorporated by reference to Exhibit 2.1 to the Registrant’s Current Report on Form 8-K filed on July 1, 2013). | |
| 2.3 | Transaction Agreement, dated as of June 15, 2014, by and among Covidien plc, Medtronic, Inc., Kalani I Limited, Makani II Limited, Aviation Acquisition Co., Inc. and Aviation Merger Sub, LLC (Incorporated by reference to Exhibit 2.1 to the Registrant’s Current Report on Form 8-K filed on June 16, 2014). | |
| 2.4 | Appendix III to the Rule 2.5 Announcement, dated as of June 15, 2014 (Conditions Appendix) (Incorporated by reference to Exhibit 2.2 to the Registrant’s Current Report on Form 8-K filed on June 16, 2014). | |
| 2.5 | Expenses Reimbursement Agreement, dated as of June 15, 2014, by and between Covidien plc and Medtronic, Inc. (Incorporated by reference to Exhibit 2.1 to the Registrant’s Current Report on Form 8-K filed on June 16, 2014). | |
| 3.1 | Memorandum and Articles of Association, as amended March 20, 2013 (Incorporated by reference to Exhibit 3.1 to the Registrant’s Current Report on Form 8-K filed on March 26, 2013). | |
| 3.2 | Certificate of Incorporation of Covidien plc (Incorporated by reference to Exhibit 3.2 to the Registrant’s Current Report on Form 8-K filed on June 5, 2009). | |
| 4.1(a) | Indenture by and among Covidien International Finance S.A. (as Issuer), Covidien Ltd. (as Guarantor) and Deutsche Bank Trust Company Americas (as Trustee), dated as of October 22, 2007 (Incorporated by reference to Exhibit 4.1(a) to the Registrant’s Current Report on Form 8-K filed on October 22, 2007). | |
| 4.1(b) | First Supplemental Indenture by and among Covidien International Finance S.A. (as Issuer), Covidien Ltd. (as Guarantor) and Deutsche Bank Trust Company Americas (as Trustee), dated as of October 22, 2007 (Incorporated by reference to Exhibit 4.1(b) to the Registrant’s Current Report on Form 8-K filed on October 22, 2007). | |
| 4.1(c) | Second Supplemental Indenture by and among Covidien International Finance S.A. (as Issuer), Covidien Ltd. (as Guarantor) and Deutsche Bank Trust Company Americas (as Trustee), dated as of October 22, 2007 (Incorporated by reference to Exhibit 4.1(c) to the Registrant’s Current Report on Form 8-K filed on October 22, 2007). | |
| 4.1(d) | Third Supplemental Indenture by and among Covidien International Finance S.A. (as Issuer), Covidien Ltd. (as Guarantor) and Deutsche Bank Trust Company Americas (as Trustee), dated as of October 22, 2007 (Incorporated by reference to Exhibit 4.1(d) to the Registrant’s Current Report on Form 8-K filed on October 22, 2007). | |
| 4.1(e) | Fourth Supplemental Indenture by and among Covidien International Finance S.A. (as Issuer), Covidien Ltd. (as Guarantor) and Deutsche Bank Trust Company Americas (as Trustee), dated as of October 22, 2007 (Incorporated by reference to Exhibit 4.1(e) to the Registrant’s Current Report on Form 8-K filed on October 22, 2007). | |
| 4.1(f) | Fifth Supplemental Indenture by and among Covidien International Finance S.A. (as Issuer), Covidien Ltd. (as Guarantor), Covidien plc (as Guarantor) and Deutsche Bank Trust Company Americas (as Trustee), dated June 4, 2009 (Incorporated by reference to Exhibit 4.1 to the Registrant’s Current Report on Form 8-K filed on June 5, 2009). | |
| 4.1(g) | Sixth Supplemental Indenture, dated as of June 28, 2010, among Covidien International Finance S.A. (as Issuer), Covidien Ltd. (as Guarantor), Covidien plc (as Guarantor) and Deutsche Bank Trust Company Americas (as Trustee) (Incorporated by reference to Exhibit 4.1 to the Registrant’s Current Report on Form 8-K filed on June 28, 2010). | |
| 4.1(h) | Seventh Supplemental Indenture, dated as of May 30, 2012, among Covidien International Finance S.A. (as Issuer), Covidien Ltd. (as Guarantor), Covidien plc (as Guarantor) and Deutsche Bank Trust Company Americas (as Trustee) (Incorporated by reference to Exhibit 4.1 to the Registrant’s Current Report on Form 8-K filed on May 30, 2012). | |
| 4.1(i) | Eighth Supplemental Indenture, dated as of May 16, 2013, among Covidien International Finance S.A. (as Issuer), Covidien Ltd. (as Guarantor), Covidien plc (as Guarantor) and Deutsche Bank Trust Company Americas (as Trustee) (Incorporated by reference to Exhibit 4.1 to the Registrant’s Current Report on Form 8-K filed on May 16, 2013). | |
38
Table of Contents
No other instruments defining the rights of holders of long-term debt are filed since the total amount of securities authorized under any such instrument does not exceed 10% of the total assets of the Registrant on a consolidated basis. The Company agrees to furnish a copy of such instruments to the SEC upon request.
| Exhibit Number |
Exhibit | |
| 10.1 | Tax Sharing Agreement by and among Tyco International Ltd., Covidien Ltd., and Tyco Electronics Ltd., dated as of June 29, 2007 (Incorporated by reference to Exhibit 10.1 to the Registrant’s Current Report on Form 8-K filed on July 5, 2007). | |
| 10.2 | FY09 Grant U.S. Option Terms and Conditions (Incorporated by reference to Exhibit 10.3 to the Registrant’s Current Report on Form 8-K filed on September 23, 2014).(1) | |
| 10.3 | FY09 Grant U.S. Restricted Stock Unit Terms and Conditions (Incorporated by reference to Exhibit 10.2 to the Registrant’s Current Report on Form 8-K filed on November 25, 2008).(1) | |
| 10.4 | Form of Non-Competition, Non-Solicitation, and Confidentiality Agreement for executive officers and certain key employees (Incorporated by reference to Exhibit 10.4 to the Registrant’s Quarterly Report on Form 10-Q filed on January 29, 2009).(1) | |
| 10.5 | Covidien Stock and Incentive Plan (as amended and restated) (Incorporated by reference to Exhibit 10.1 to the Registrant’s Current Report on Form 8-K filed on March 26, 2013).(1) | |
| 10.6 | Covidien Employee Stock Purchase Plan (as amended and restated) (Incorporated by reference to Exhibit 10.2 to the Registrant’s Current Report on Form 8-K filed on June 5, 2009).(1) | |
| 10.7 | Deed Poll of Assumption relating to Covidien Ltd. Employee Equity Plans, dated June 4, 2009 (Incorporated by reference to Exhibit 10.3 to the Registrant’s Current Report on Form 8-K filed on June 5, 2009).(1) | |
| 10.8 | Director Grant Restricted Stock Unit Terms and Conditions (Incorporated by reference to Exhibit 10.2 to the Registrant’s Current Report on Form 8-K filed on March 23, 2009).(1) | |
| 10.9 | Founders’ Grant Standard Option Terms and Conditions (Incorporated by reference to Exhibit 10.4 to the Registrant’s Current Report on Form 8-K filed on September 23, 2014).(1) | |
| 10.10 | Covidien Severance Plan for U.S. Officers and Executives, as amended and restated (Incorporated by reference to Exhibit 10.1 to the Registrant’s Current Report on Form 8-K filed on September 23, 2014).(1) | |
| 10.11 | Covidien Change in Control Severance Plan for Certain U.S. Officers and Executives, as amended and restated (Incorporated by reference to Exhibit 10.1 to the Registrant’s Current Report on Form 8-K filed on March 26, 2013).(1) | |
| 10.12 | Covidien Supplemental Savings and Retirement Plan, as amended and restated (Incorporated by reference to Exhibit 10.1 to the Registrant’s Quarterly Report on Form 10-Q filed on January 26, 2010).(1) | |
| 10.13 | Founders’ Grant Standard Option Terms and Conditions for Directors (Incorporated by reference to Exhibit 10.13 to the Registrant’s Current Report on Form 8-K filed on July 5, 2007).(1) | |
| 10.14 | Form of Deed of Indemnification by and between Covidien plc and Covidien plc’s Directors and Secretary (Incorporated by reference to Exhibit 10.4 to the Registrant’s Form 10-Q filed on August 5, 2013). | |
| 10.15 | Amended and Restated Five-Year Senior Credit Agreement among Covidien International Finance S.A., Covidien plc, the lenders party thereto and Citibank, N.A., as administrative agent, dated as of May 23, 2014 (Incorporated by reference to Exhibit 10.1 to the Registrant’s Current Report on Form 8-K filed on May 28, 2014). | |
| 10.16 | Form of Terms and Conditions of Option Award (Incorporated by reference to Exhibit 10.2 to the Registrant’s Current Report on Form 8-K filed on September 23, 2014).(1) | |
39
Table of Contents
| 10.17 | Form of Terms and Conditions of Restricted Unit Award (Incorporated by reference to Exhibit 10.3 to the Registrant’s Quarterly Report on Form 10-Q filed on January 26, 2010).(1) | |
| 10.18 | Form of Terms and Conditions of Performance Unit Award (Incorporated by reference to Exhibit 10.4 to the Registrant’s Quarterly Report on Form 10-Q filed on January 26, 2010).(1) | |
| 10.19 | Amended Terms and Conditions of Performance Unit Awards FY12-FY14 (Incorporated by reference to Exhibit 10.3 to the Registrant’s Current Report on Form 8-K filed on March 26, 2013).(1) | |
| 10.20 | Amended Terms and Conditions of Performance Unit Awards FY13-FY15 (Incorporated by reference to Exhibit 10.4 to the Registrant’s Current Report on Form 8-K filed on March 26, 2013).(1) | |
| 10.21 | Tax Matters Agreement between Covidien plc and Mallinckrodt plc, dated June 28, 2013 (Incorporated by reference to Exhibit 10.1 to the Registrant’s Current Report on Form 8-K filed on July 1, 2013). | |
| 10.22 | Employee Matters Agreement between Covidien plc and Mallinckrodt plc, dated June 28, 2013 (Incorporated by reference to Exhibit 10.2 to the Registrant’s Current Report on Form 8-K filed on July 1, 2013). | |
| 10.23 | Transition Services Agreement between Covidien plc and Mallinckrodt plc, dated June 28, 2013 (Incorporated by reference to Exhibit 10.3 to the Registrant’s Current Report on Form 8-K filed on July 1, 2013). | |
| 10.24 | Form of Indemnification Agreement between Covidien Ltd. and Covidien plc’s Directors and Secretary (Incorporated by reference to Exhibit 10.5 to the Registrant’s Form 10-Q filed on August 5, 2013). | |
| 21.1 | Subsidiaries of the Registrant.(2) | |
| 23.1 | Consent of Deloitte and Touche LLP.(2) | |
| 24.1 | Power of Attorney (included on signature page hereto).(2) | |
| 31.1 | Certification by the Chief Executive Officer pursuant to 18 U.S.C. Section 1350, as Adopted Pursuant to Section 302 of the Sarbanes-Oxley Act of 2002.(2) | |
| 31.2 | Certification by the Chief Financial Officer pursuant to 18 U.S.C. Section 1350, as Adopted Pursuant to Section 302 of the Sarbanes-Oxley Act of 2002.(2) | |
| 31.3 | Certification by the Chief Executive Officer pursuant to 18 U.S.C. Section 1350, as Adopted Pursuant to Section 302 of the Sarbanes-Oxley Act of 2002 (filed herewith). | |
| 31.4 | Certification by the Chief Financial Officer pursuant to 18 U.S.C. Section 1350, as Adopted Pursuant to Section 302 of the Sarbanes-Oxley Act of 2002 (filed herewith). | |
| 32.1 | Certification by the Chief Executive Officer and Chief Financial Officer pursuant to 18 U.S.C. Section 1350, as Adopted Pursuant to Section 906 of the Sarbanes-Oxley Act of 2002.(2) | |
| 101 | The following materials from Covidien’s annual report on Form 10-K for the fiscal year ended September 26, 2014 formatted in Extensible Business Reporting Language (XBRL): (i) Consolidated Statements of Income, (ii) Consolidated Statements of Comprehensive Income, (iii) Consolidated Balance Sheets, (iv) Consolidated Statements of Shareholders’ Equity, (v) Consolidated Statements of Cash Flows and (vi) Notes to the Consolidated Financial Statements.(2) | |
| (1) | Management contract or compensatory plan. |
| (2) | Previously filed or furnished, as applicable, as an exhibit to the Company’s Annual Report on Form 10-K for the fiscal year ended September 26, 2014 filed with the SEC on November 24, 2014. |
| (b) | See Item 15(a)(3) above. |
| (c) | See Item 15(a)(2) above. |
40
Table of Contents
Pursuant to the requirements of Section 13 or 15(d) of the Securities Exchange Act of 1934, the Registrant has duly caused this report to be signed on its behalf by the undersigned, thereunto duly authorized.
| COVIDIEN PLC | ||||
| Dated: January 22, 2015 | ||||
| /s/ Charles J. Dockendorff | ||||
| Charles J. Dockendorff | ||||
| Executive Vice President and Chief Financial Officer | ||||
| (Principal Financial Officer) | ||||
S-1