Attached files
| file | filename |
|---|---|
| 8-K - 8-K - ASSOCIATED BANC-CORP | d856206d8k.htm |
| EX-99.1 - EX-99.1 - ASSOCIATED BANC-CORP | d856206dex991.htm |
 ASSOCIATED
BANC-CORP
4Q 2014 EARNINGS PRESENTATION
JANUARY 22, 2015
Exhibit 99.2 |
 FORWARD-LOOKING STATEMENTS
Important
note
regarding
forward-looking
statements:
Statements
made
in
this
presentation
which
are
not
purely
historical
are
forward-looking
statements,
as
defined
in
the
Private
Securities
Litigation
Reform
Act
of
1995.
This
includes
any
statements
regarding
management’s
plans,
objectives,
or
goals
for
future
operations,
products
or
services,
and
forecasts
of
its
revenues,
earnings,
or
other
measures
of
performance.
Such
forward-looking
statements
may
be
identified
by
the
use
of
words
such
as
“believe”,
“expect”,
“anticipate”,
“plan”,
“estimate”,
“should”,
“will”,
“intend”,
“outlook”,
or
similar
expressions.
Forward-
looking
statements
are
based
on
current
management
expectations
and,
by
their
nature,
are
subject
to
risks
and
uncertainties.
Actual
results
may
differ
materially
from
those
contained
in
the
forward-looking
statements.
Factors
which
may
cause
actual
results
to
differ
materially
from
those
contained
in
such
forward-looking
statements
include
those
identified
in
the
Company’s
most
recent
Form
10-K
and
subsequent
SEC
filings.
Such
factors
are
incorporated
herein
by
reference.
1 |
 2014
HIGHLIGHTS 2
Solid
Earnings
with
Continued
Balance
Sheet
Growth
•
Average loans of $16.8 billion were up 8% from 2013
Commercial up 10% and Residential Mortgage up 13% from last year
•
Average Deposits of $17.6 billion were up 1% from 2013
Average checking balances up 2% from last year
•
Net Interest Income of $681 million was up 5% from 2013
Net Interest Margin of 3.08% compared to 3.17% last year
•
2014 Dividends of $0.37/share, up 12% from 2013
•
Repurchased 14.3 million shares of stock during 2014
•
Capital ratios remain strong and above Basel III targets
•
Net Income available to common shareholders of $186 million or $1.16 per
share •
2014 return on Tier 1 Common Equity of 9.9%, compared to 9.8% for 2013
Fourth quarter 2014 return on Tier 1 Common Equity of 10.4%
Net Interest Income
&
Net Interest Margin
Noninterest Income
&
Expenses
Capital
Balance Sheet
Net Income
&
ROT1CE
•
Noninterest income of $290 million declined $23 million, or 7% from 2013
Mortgage banking income declined $28 million from last year
•
Noninterest Expense of $679 million was down $1 million from 2013
Personnel expense declined $7 million from last year
|
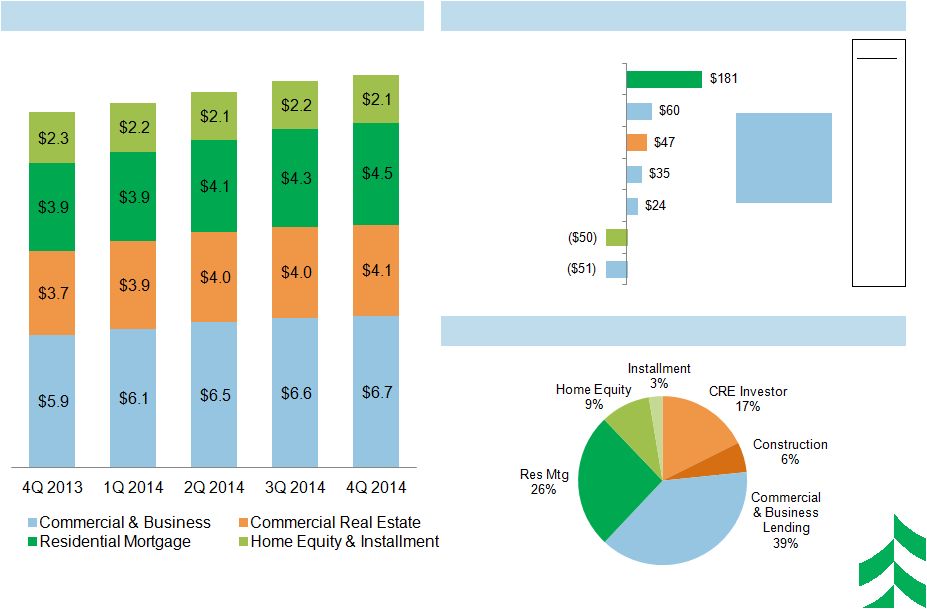
 LOAN
PORTFOLIO – ANNUAL TREND
3
2014 Average Net Loan Change (from 2013)
Loan Mix –
2014 Annual (Average)
($ in millions)
Home Equity & Installment
Commercial Real Estate
Residential Mortgage
Power & Utilities
Oil & Gas
Mortgage Warehouse
General Commercial Loans
Average Annual Loans ($ in billions)
$16.8
+13%
% Chg
+8%
+71%
+5%
$14.7
+34%
$15.7
$13.3
$13.2
Total
Commercial
& Business
Lending
+12%
+2%
(12%) |
 LOAN
PORTFOLIO – QUARTERLY TREND
4
4Q 2014 Average Net Loan Change (+$246 mln)
Loan Mix –
4Q 2014 (Average)
($ in millions)
Home Equity & Installment
Commercial Real Estate
Residential Mortgage
Power & Utilities
Oil & Gas
Mortgage Warehouse
General Commercial Loans
Average Quarterly Loans ($ in billions)
$17.4
+4%
% Chg
+1%
+1%
+5%
$16.6
+4%
$17.1
$16.2
$15.7
Total
Commercial
& Business
Lending
+1%
(13%)
(2%) |
 OIL AND
GAS LENDING 5
Please
Note:
For
more
information
on
Associated
Banc-Corp’s
oil
and
gas
lending,
please
refer
to
the
presentation
posted
on
their
Investor
Relation
site
at
www.investor.associatedbank.com/presentations
•
Associated Bank’s Oil & Gas business is focused exclusively on the upstream
sector which is also referred
to
as
the
‘Exploration
and
Production’
or
‘E&P’
sector.
•
We focus on the small to mid-size independent segment, both public and private.
We are an asset- based lender whereby we are collateralized by a lien on
oil and gas reserves. •
Generally, we are a participant in a syndicated loan.
•
Price redeterminations are formally performed on a semi-annual basis; however,
we continuously review commodity prices as they change.
•
Associated’s Oil & Gas book (outstanding balance is driven by respective
borrowing bases) –
48 clients
–
Aggregate commitments of more than $1 billion; average commitment is $23
million. –
As of 12-31-14, outstanding balance was $754 million; approximately 4% of
total loans. •
Recent
stress
test
indicates
adequate
specific
reserves
for
this
portfolio. |
 COMMERCIAL LINE UTILIZATION TRENDS
6
Line utilization increased in Commercial & Business Lending
Change from 3Q 14
Commercial Real
Estate (including
construction)
-
80 bps
Commercial &
Business Lending
-
60 bps |
 GROWING
NET INTEREST INCOME WHILE MARGIN COMPRESSES
7
Yield on Interest-earning Assets
Cost of Interest-bearing Liabilities
Net Interest Income & Net Interest Margin
($ in millions)
Total Loan Yield
Total Interest-earning Yield
flat |
 NONINTEREST INCOME ANNUAL TRENDS
($ IN MILLIONS)
Core Fee-based
1
Revenue
Mortgage Banking (net) Income
Total Noninterest Income
1
–
Core
Fee-based
Revenue
=
Trust
service
fees
plus
Service
charges
on
deposit
accounts
plus
Card-based
and
other
nondeposit
fees
plus
Insurance
commissions
plus
Brokerage
and
annuity
commissions.
This
is
a
non-GAAP
measure.
Please
refer
to
the
press
release
tables
for
a
reconciliation
to
noninterest
income.
2
–
Other
Noninterest
Income
=
Total
Noninterest
Income
minus
net
Mortgage
Banking
Income
minus
Core
Fee-based
Revenue.
This
is
a
non-GAAP
measure.
Please
refer
to
the
press
release
tables
for
a
reconciliation
to
noninterest
income.
Other Noninterest Income
2
8 |
 NONINTEREST INCOME QUARTERLY TRENDS
($ IN MILLIONS)
Core Fee-based
1
Revenue
Mortgage Banking (net) Income
Total Noninterest Income
Other Noninterest Income
2
9
1
–
Core
Fee-based
Revenue
=
Trust
service
fees
plus
Service
charges
on
deposit
accounts
plus
Card-based
and
other
nondeposit
fees
plus
Insurance
commissions
plus
Brokerage
and
annuity
commissions.
This
is
a
non-GAAP
measure.
Please
refer
to
the
press
release
tables
for
a
reconciliation
to
noninterest
income.
2
–
Other
Noninterest
Income
=
Total
Noninterest
Income
minus
net
Mortgage
Banking
Income
minus
Core
Fee-based
Revenue.
This
is
a
non-GAAP
measure.
Please
refer
to
the
press
release
tables
for
a
reconciliation
to
noninterest
income. |
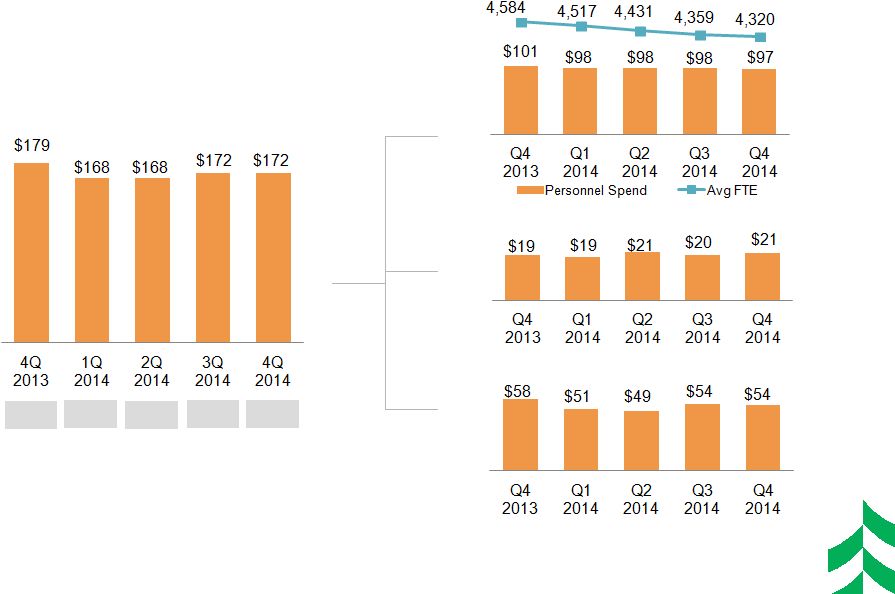
 NONINTEREST EXPENSE ANNUAL TRENDS
($ IN MILLIONS)
Technology
3
Spend
Total Noninterest Expense
Other
Non-Personnel
Spend
4
Personnel
Spend
/
FTE
2
Trend
1
–
Efficiency
ratio
=
Noninterest
expense,
excluding
other
intangible
amortization,
divided
by
sum
of
taxable
equivalent
net
interest
income
plus
noninterest
income,
excluding
investment
securities
gains/losses,
net,
and
asset
gains/losses,
net.
This
is
a
non-GAAP
financial
measure.
Please
refer
to
the
appendix
for
a
reconciliation
of
this
measure.
2
–
FTE
=
Average
Full
Time
Equivalent
Employees
3
–
Technology
Spend
=
Technology
and
Equipment
expenses
4
–
Other
Non-Personnel
Spend
=
Total
Noninterest
Expense
less
Personnel
and
Technology
spend
Efficiency Ratio
1
62%
70%
69%
70%
69%
10 |
 NONINTEREST EXPENSE QUARTERLY TRENDS
($ IN MILLIONS)
Technology
3
Spend
Total Noninterest Expense
Other
Non-Personnel
Spend
4
Personnel
Spend
/
FTE
2
Trend
1
–
Efficiency
ratio
=
Noninterest
expense,
excluding
other
intangible
amortization,
divided
by
sum
of
taxable
equivalent
net
interest
income
plus
noninterest
income,
excluding
investment
securities
gains/losses,
net,
and
asset
gains/losses,
net.
This
is
a
non-GAAP
financial
measure.
Please
refer
to
the
appendix
for
a
reconciliation
of
this
measure.
2
–
FTE
=
Average
Full
Time
Equivalent
Employees
3
–
Technology
Spend
=
Technology
and
Equipment
expenses
4
–
Other
Non-Personnel
Spend
=
Total
Noninterest
Expense
less
Personnel
and
Technology
spend
Efficiency
Ratio
1
73%
69%
68%
69%
70%
11 |
 CREDIT
QUALITY INDICATORS ($ IN MILLIONS)
12 |
 INSURANCE BUSINESS ACQUISITION
13
•
On
January
16,
2015,
Associated
Banc-Corp
announced
its
agreement
to
acquire
Ahmann
&
Martin
Co.,
a
risk
and
employee
benefits
consulting
firm
based
in
Minnesota.
The
firm
will
be
merged
into
Associated
Financial
Group,
our
insurance
brokerage
subsidiary.
–
After
adjusting
for
the
effects
of
the
acquisition,
and
based
on
expected
pro
forma
insurance
revenues
of
over
$70
million,
Associated
expects
to
rank
among
the
Top
50
insurance
brokerage
firms
in
the
USA
1
.
•
Strategically,
this
transaction
is
expected
to:
–
Increase
the
scale
of
our
insurance
business,
particularly
in
the
Twin
Cities
–
Enhance
our
product
and
geographic
capabilities,
with
greater
P&C
specialty
capabilities
–
Better
balance
our
insurance
revenue
base
between
P&C
and
Benefits
lines
–
Provide
more
cross-sell
opportunities
•
The
transaction
includes
stock
consideration
of
approximately
$48
million
and
contingent
cash
consideration
of
up
to
$8
million,
subject
to
certain
conditions.
•
The
transaction
is
expected
to
close
in
February
2015
and
is
expected
to
be
accretive
to
2017
EPS.
1
–
Source:
www.BusinessInsurance.com
–
BI
Survey |
 2015
OUTLOOK 14
1
–
Outlook
incorporates
effects
of
Ahmann
&
Martin
Co.
acquisition.
Balance Sheet
•
High single digit annual average loan growth
•
Maintain Loan/Deposit ratio under 100%
Margin
•
NIM for 1Q 2015 expected to be approximately 2.95% with
modest compression throughout the year
Noninterest
Income
1
•
Up mid to upper single digits from 2014
Noninterest
Expense
1
•
Up low single digits from 2014 with a continued focus on
efficiency initiatives
Capital
•
Continue to follow stated corporate priorities for capital
deployment
Provision
•
Expected to increase with loan growth and changes in risk
grade or other indications of credit quality |
 APPENDIX
15
*
*
*
*
*
*
*
*
*
* |
 RECONCILIATION AND DEFINITIONS OF
NON-GAAP ITEMS
4Q 2013
1Q 2014
2Q 2014
3Q 2014
4Q 2014
Efficiency Ratio Reconciliation:
Efficiency ratio (1)
73.70%
70.41%
69.70%
69.44%
70.33%
Taxable equivalent adjustment
(1.49)
(1.35)
(1.32)
(1.36)
(1.40)
Asset gains, net
0.80
0.22
0.26
1.36
1.05
Other intangible amortization
(0.42)
(0.42)
(0.41)
(0.40)
(0.32)
Efficiency ratio, fully taxable equivalent (1)
72.59%
68.86%
68.23%
69.04%
69.66%
(1)
Efficiency
ratio
is
defined
by
the
Federal
Reserve
guidance
as
noninterest
expense
divided
by
the
sum
of
net
interest
income
plus
noninterest
income,
excluding
investment
securities
gains
/
losses,
net.
Efficiency
ratio,
fully
taxable
equivalent,
is
noninterest
expense,
excluding
other
intangible
amortization,
divided
by
the
sum
of
taxable
equivalent
net
interest
income
plus
noninterest
income,
excluding
investment
securities
gains
/
losses,
net
and
asset
gains
/
losses,
net.
This
efficiency
ratio
is
presented
on
a
taxable
equivalent
basis,
which
adjusts
net
interest
income
for
the
tax-favored
status
of
certain
loans
and
investment
securities.
Management
believes
this
measure
to
be
the
preferred
industry
measurement
of
net
interest
income
as
it
enhances
the
comparability
of
net
interest
income
arising
from
taxable
and
tax-exempt
sources
and
it
excludes
certain
specific
revenue
items
(such
as
investment
securities
gains
/
losses,
net
and
asset
gains
/
losses,
net).
2010
2011
2012
2013
2014
Efficiency Ratio Reconciliation:
Efficiency ratio (1)
65.35%
73.64%
72.16%
71.04%
69.97%
Taxable equivalent adjustment
(1.60)
(1.74)
(1.59)
(1.45)
(1.36)
Asset gains (losses), net
(0.77)
(0.92)
(0.86)
0.39
0.73
Other intangible amortization
(0.52)
(0.54)
(0.45)
(0.42)
(0.39)
Efficiency ratio, fully taxable equivalent (1)
62.46%
70.44%
69.26%
69.56%
68.95%
Tier
1
common
equity,
a
non-GAAP
financial
measure,
is
used
by
banking
regulators,
investors
and
analysts
to
assess
and
compare
the
quality
and
composition
of
our
capital
with
the
capital
of
other
financial
services
companies.
Management
uses
Tier
1
common
equity,
along
with
other
capital
measures,
to
assess
and
monitor
our
capital
position.
Tier
1
common
equity
(period
end
and
average)
is
Tier
1
capital
excluding
qualifying
perpetual
preferred
stock
and
qualifying
trust
preferred
securities.
16 |