Attached files
| file | filename |
|---|---|
| 8-K - 8-K - US BANCORP \DE\ | d853192d8k.htm |
| EX-99.1 - EX-99.1 - US BANCORP \DE\ | d853192dex991.htm |
 Richard K. Davis
Chairman, President and CEO
Andy Cecere
Vice Chairman and COO
U.S. Bancorp
4Q14 Earnings
Conference Call
U.S. Bancorp
4Q14 Earnings
Conference Call
January 21, 2015
Exhibit 99.2 |
 Forward-looking Statements and Additional Information
The following information appears in accordance with the Private
Securities Litigation Reform Act of 1995:
This presentation contains forward-looking statements about U.S. Bancorp.
Statements that are not historical or current facts, including statements
about beliefs and expectations, are forward-looking statements and are based on
the information available to, and assumptions and estimates made
by,
management
as
of
the
date
made.
These
forward-looking
statements
cover,
among
other
things,
anticipated
future
revenue
and
expenses
and
the
future
plans
and
prospects
of
U.S.
Bancorp.
Forward-looking
statements
involve
inherent
risks
and
uncertainties,
and
important
factors could cause actual results to differ materially from those
anticipated. A reversal or slowing of the current economic recovery or another
severe
contraction
could
adversely
affect
U.S.
Bancorp’s
revenues
and
the
values
of
its
assets
and
liabilities.
Global
financial
markets
could
experience a recurrence of significant turbulence, which could reduce the
availability of funding to certain financial institutions and lead to a
tightening of credit, a reduction of business activity, and increased market
volatility. Stress in the commercial real estate markets, as well as a
downturn
in
the
residential
real
estate
markets,
could
cause
credit
losses
and
deterioration
in
asset
values.
In
addition,
U.S.
Bancorp’s
business
and financial performance is likely to be negatively impacted by
recently enacted and future legislation and regulation. U.S. Bancorp’s
results could also be adversely affected by deterioration in general
business and economic conditions; changes in interest rates; deterioration in the credit quality
of its loan portfolios or in the value of the collateral securing those loans;
deterioration in the value of securities held in its investment securities
portfolio; legal and regulatory developments; increased competition from both banks
and non-banks; changes in customer behavior and preferences; breaches in
data security; effects of mergers and acquisitions and related integration; effects of critical accounting policies and
judgments; and management’s ability to effectively manage credit risk,
residual value risk, market risk, operational risk, interest rate risk and
liquidity risk.
For discussion of these and other risks that may cause actual results to differ
from expectations, refer to U.S. Bancorp’s Annual Report on
Form 10-K for the year ended December 31, 2013, on file with the Securities and
Exchange Commission, including the sections entitled “Risk
Factors”
and
“Corporate
Risk
Profile”
contained
in
Exhibit
13,
and
all
subsequent
filings
with
the
Securities
and
Exchange
Commission
under
Sections 13(a), 13(c), 14 or 15(d) of the Securities Exchange Act of 1934.
Forward-looking statements speak only as of the date they are made, and
U.S. Bancorp undertakes no obligation to update them in light of new information or future events.
This
presentation
includes
non-GAAP
financial
measures
to
describe
U.S.
Bancorp’s
performance.
The
calculations
of
these
measures
are
provided within or in the appendix of the presentation. These disclosures
should not be viewed as a substitute for operating results determined in
accordance with GAAP, nor are they necessarily comparable to non-GAAP
performance measures that may be presented by other companies. |
 3
4Q14 Earnings
Conference Call
2014 Full Year Highlights
Record net income of $5.9 billion; $3.08 per diluted common share
Industry-leading profitability measures, including ROA of 1.54%, ROCE of 14.7%
and efficiency ratio of 53.2%
Average loan growth of 6.3% vs. 2013 and average deposit growth of 6.5%
vs. 2013
Net charge-offs declined 8.9% vs. 2013
Nonperforming assets declined 11.2% vs. 2013
Capital generation continues to reinforce capital position
•
Common equity tier 1 capital ratio of 9.0% estimated for the Basel III fully
implemented standardized approach
•
Repurchased 54 million shares of common stock during 2014
•
In total, returned $4.0 billion, or 72%, of our earnings in 2014
to shareholders |
 4
4Q14 Earnings
Conference Call
4Q14 Highlights
Net income of $1.5 billion; $0.79 per diluted common share
Positive operating leverage on a year-over-year basis
Average loan growth of 5.9% vs. 4Q13 (5.5% excluding Charter One
acquisition)
and 1.0% vs. 3Q14
Average deposit growth of 7.2% vs. 4Q13 (5.5% excluding Charter One
acquisition) and 1.6% vs. 3Q14
Net charge-offs declined 8.3% vs. 3Q14
Nonperforming assets declined 6.0% vs. 3Q14
Capital generation continues to reinforce capital position
•
Common equity tier 1 capital ratio of 9.0% estimated for the Basel III fully
implemented standardized approach
•
Common
equity
tier
1
capital
ratio
of
9.7%;
Tier
1
capital
ratio
of
11.3%
Returned 66% of earnings to shareholders in 4Q14
•
Repurchased 11 million shares of common stock during the quarter
|
 5
4Q14 Earnings
Conference Call
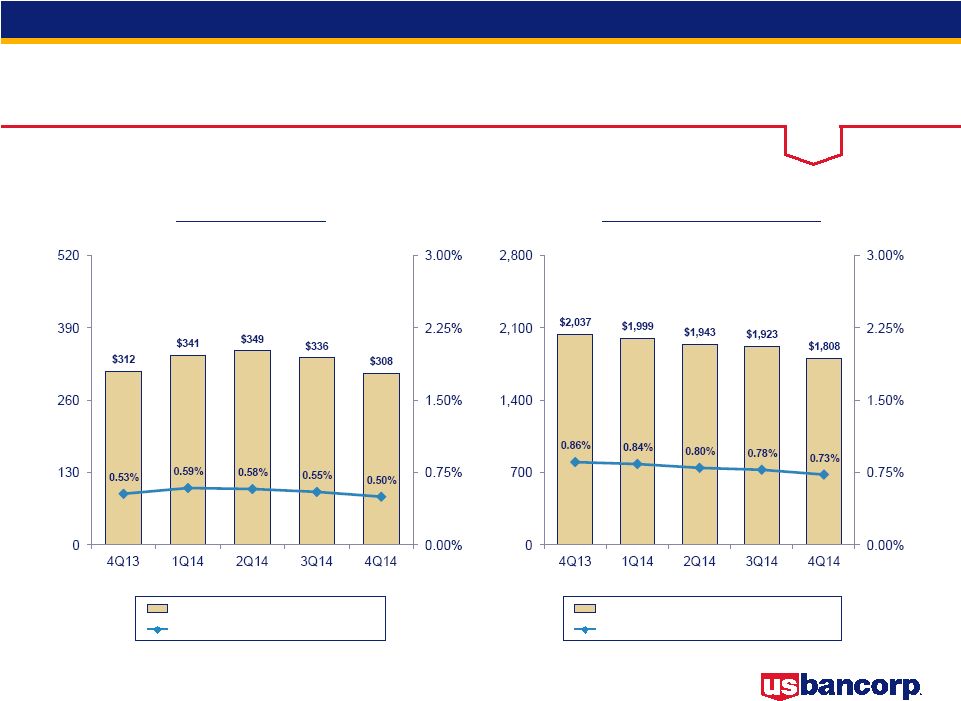
Performance Ratios
Return on Average Common Equity
and Return on Average Assets
Efficiency Ratio and
Net Interest Margin
Return on Avg Common Equity
Return on Avg Assets
Efficiency Ratio
Net Interest Margin
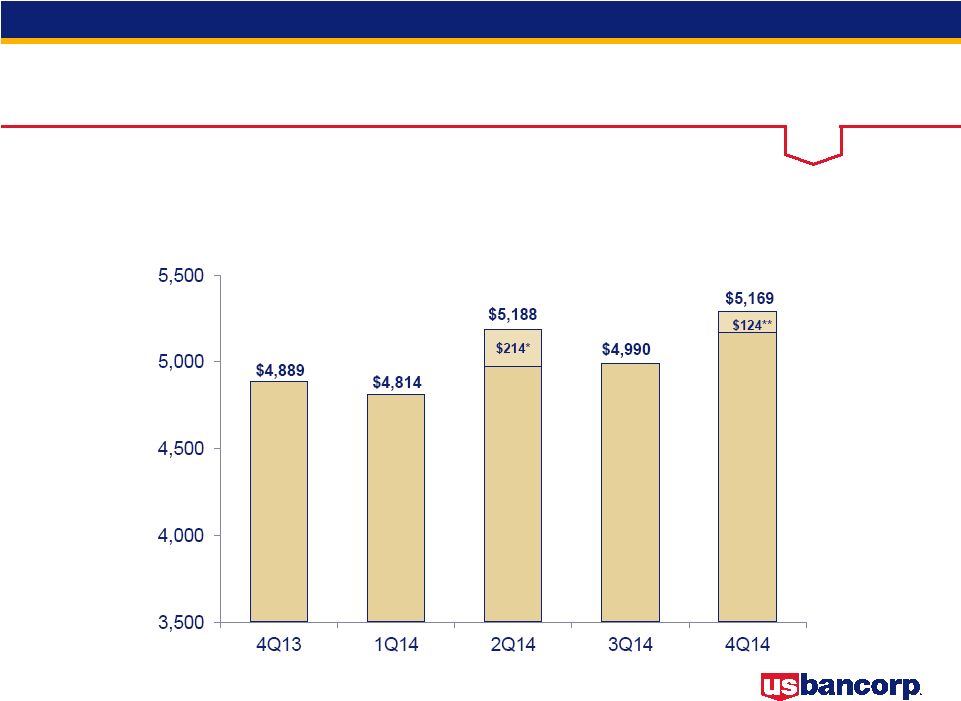
* Excluding $214 million gain on Visa Inc. Class B common stock sale and $200
million FHA DOJ settlement ** Excluding $124 million gain related to an
equity interest in Nuveen and $88 million expense for charitable contributions and legal accruals
Efficiency ratio computed as noninterest expense divided by the sum of net interest
income on a taxable-equivalent basis and noninterest income excluding
securities gains (losses) net |
 6
4Q14 Earnings
Conference Call
* Gain on Visa Inc. Class B common stock sale
** Gain related to an equity interest in Nuveen
Taxable-equivalent basis
Revenue Growth
Year-Over-Year Change
(4.4%)
(1.2%)
4.9%
2.0%
5.7%
$ in millions |
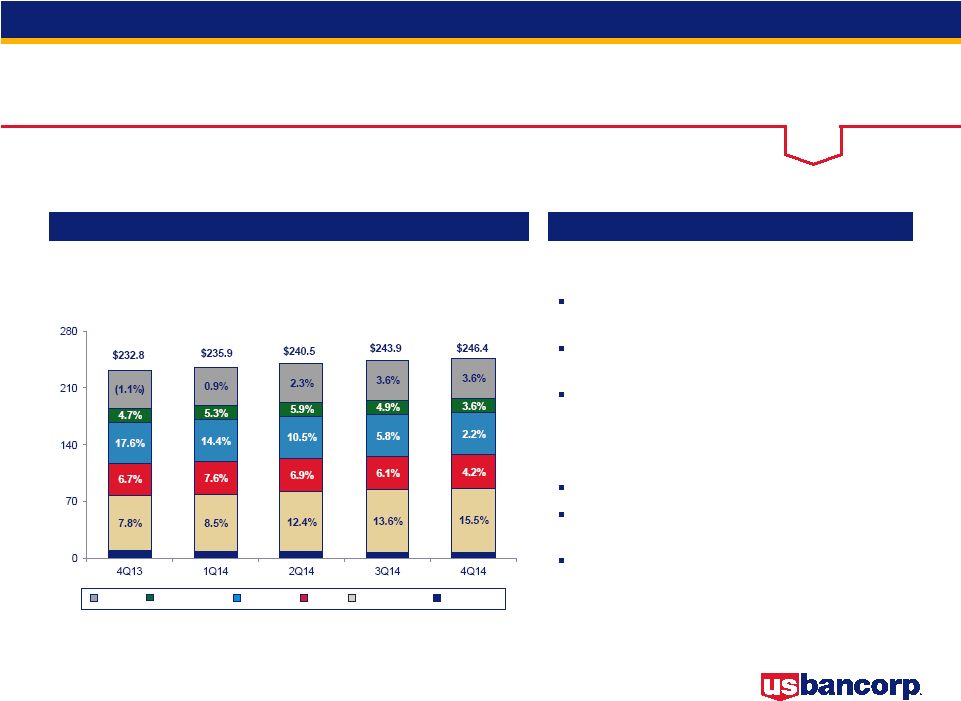
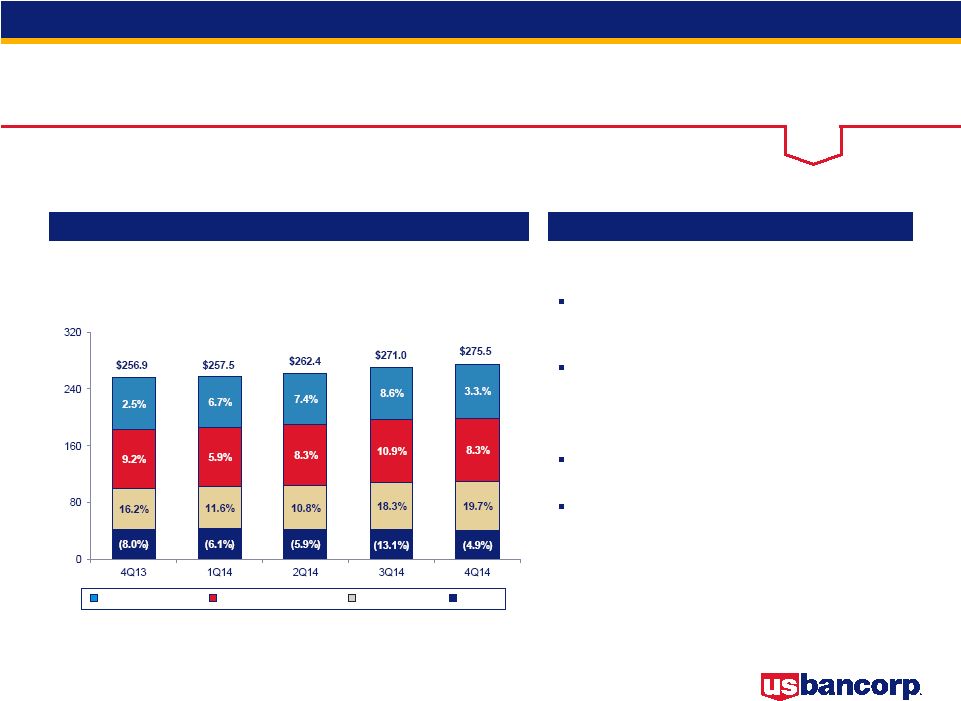
 7
4Q14 Earnings
Conference Call
Loan and Deposit Growth
Year-Over-Year Growth
Average Balances
$ in billions
4Q14 Acquisition Adjusted
Loan Growth = 5.5%
Deposit Growth = 5.5% |
 8
4Q14 Earnings
Conference Call
Credit Quality
* Note: The loss sharing agreement for the commercial and commercial real estate
loans acquired from the FDIC, which comprised the majority of the
nonperforming covered assets, expired at the end of the fourth quarter of 2014
Net Charge-offs
Nonperforming Assets*
$ in millions
Net Charge-offs (Left Scale)
NCOs to Avg Loans (Right Scale)
Nonperforming Assets (Left Scale)
NPAs to Loans plus ORE (Right Scale) |
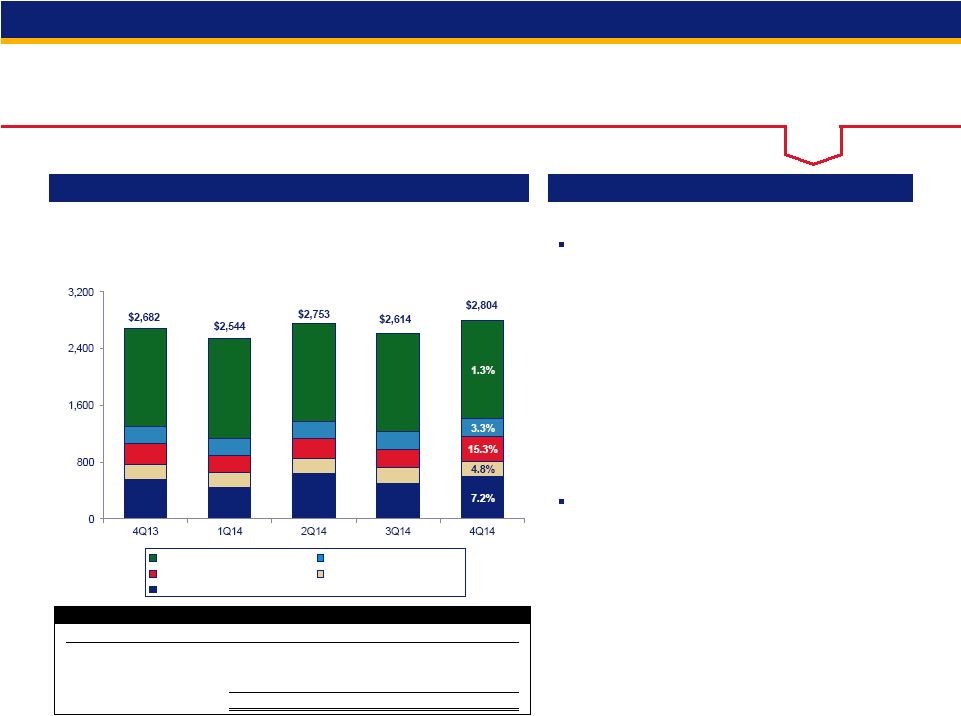
 9
4Q14 Earnings
Conference Call
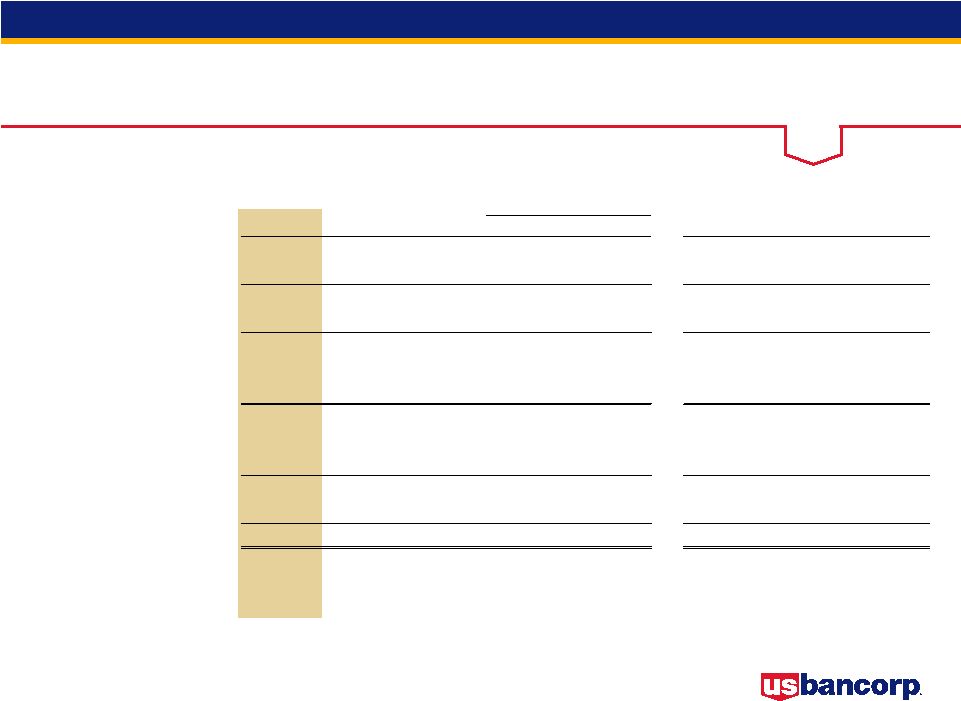
Earnings Summary
$ and shares in millions, except per-share data
Taxable-equivalent basis
FY
FY
4Q14
3Q14
4Q13
vs 3Q14
vs 4Q13
2014
2013
% B/(W)
Net Interest Income
2,799
$
2,748
$
2,733
$
1.9
2.4
10,997
$
10,828
$
1.6
Noninterest Income
2,370
2,242
2,156
5.7
9.9
9,164
8,774
4.4
Total Revenue
5,169
4,990
4,889
3.6
5.7
20,161
19,602
2.9
Noninterest Expense
2,804
2,614
2,682
(7.3)
(4.5)
10,715
10,274
(4.3)
Operating Income
2,365
2,376
2,207
(0.5)
7.2
9,446
9,328
1.3
Net Charge-offs
308
336
312
8.3
1.3
1,334
1,465
8.9
Excess Provision
(20)
(25)
(35)
(20.0)
(42.9)
(105)
(125)
(16.0)
Income before Taxes
2,077
2,065
1,930
0.6
7.6
8,217
7,988
2.9
Applicable Income Taxes
576
579
459
0.5
(25.5)
2,309
2,256
(2.3)
Noncontrolling Interests
(13)
(15)
(15)
13.3
13.3
(57)
104
nm
Net Income
1,488
1,471
1,456
1.2
2.2
5,851
5,836
0.3
Preferred Dividends/Other
68
66
67
(3.0)
(1.5)
268
284
5.6
NI to Common
1,420
$
1,405
$
1,389
$
1.1
2.2
5,583
$
5,552
$
0.6
Diluted EPS
0.79
$
0.78
$
0.76
$
1.3
3.9
3.08
$
3.00
$
2.7
Average Diluted Shares
1,796
1,807
1,832
0.6
2.0
1,813
1,849
1.9
% B/(W) |
 10
4Q14 Earnings
Conference Call
4Q14 Results -
Key Drivers
vs. 4Q13
Net Revenue increase of 5.7% (3.2% increase excluding notable item)
•
Net interest income increase of 2.4%; net interest margin
of 3.14% vs. 3.40% in 4Q13
•
Noninterest income increase of 9.9% (4.2% increase
excluding notable item)
Noninterest expense increase of 4.5% (1.3% increase
excluding notable items)
Provision for credit losses increased by $11 million
•
Net charge-offs lower by $4 million, or 1.3%
•
Provision lower than NCOs by $20 million vs. $35 million in 4Q13
vs. 3Q14
Net Revenue increase of 3.6% (1.1% increase excluding notable item)
•
Net interest income increase of 1.9%; net interest margin of 3.14% vs. 3.16% in
3Q14 •
Noninterest income increase of 5.7% (0.2% increase excluding notable item)
Noninterest expense increase of 7.3% (3.9% increase excluding notable items)
Provision for credit losses lower by $23 million
•
Net charge-offs decreased by $28 million, or 8.3%
•
Provision lower than NCOs by $20 million vs. $25 million in 3Q14
$ in millions
4Q14
Revenue Items
Nuveen gain
124
$
Expense Items
Charitable contributions
35
$
Accruals for legal matters
53
$
Notable Items |
 11
4Q14 Earnings
Conference Call
Capital Position
RWA = risk-weighted assets
*
2014
amounts
and
ratios
calculated
under
the
Basel
III
transitional
standardized
approach;
December
31,
2013,
under
Basel
I
$ in billions
4Q14
3Q14
2Q14
1Q14
4Q13
Total U.S. Bancorp shareholders' equity
43.5
$
43.1
$
42.7
$
42.1
$
41.1
$
Standardized Approach
Basel III transitional standardized approach/Basel I *
Common equity tier 1 capital
30.9
30.2
29.8
29.5
27.9
Tier 1 capital
36.0
35.4
34.9
34.6
33.4
Total risk-based capital
43.2
42.5
41.0
40.7
39.3
Common equity tier 1 capital ratio
9.7%
9.7%
9.6%
9.7%
9.4%
Tier 1 capital ratio
11.3%
11.3%
11.3%
11.4%
11.2%
Total risk-based capital ratio
13.6%
13.6%
13.2%
13.5%
13.2%
Leverage ratio
9.3%
9.4%
9.6%
9.7%
9.6%
Common equity tier 1 capital to RWA estimated for the
Basel III fully implemented standardized approach
9.0%
9.0%
8.9%
9.0%
8.8%
Advanced Approaches
Common equity tier 1 capital to RWA for the Basel III
transitional advanced approaches
12.4%
12.4%
12.3%
Common equity tier 1 capital to RWA estimated for the
Basel III fully implemented advanced approaches
11.8%
11.8%
11.7%
Tangible common equity ratio
7.5%
7.6%
7.5%
7.8%
7.7%
Tangible common equity as a % of RWA
9.3%
9.3%
9.2%
9.3%
9.1% |
 12
4Q14 Earnings
Conference Call |
 13
4Q14 Earnings
Conference Call
Appendix |
 14
4Q14 Earnings
Conference Call
Average Loans
Key Points
$ in billions
vs. 4Q13
Average total loans grew by $13.6 billion, or 5.9%
(5.5% excluding Charter One acquisition)
Average total loans, excluding covered loans,
were higher by 7.1%
Average total commercial loans increased $10.7
billion, or 15.5%; average commercial real estate
loans increased $1.6 billion, or 4.2%
vs. 3Q14
Average total loans grew by $2.6 billion, or 1.0%
Average total loans, excluding covered loans,
were higher by 1.2%
Average total commercial loans increased $2.3
billion, or 2.9%; average commercial real estate
loans increased $0.1 billion, or 0.3%
Year-Over-Year Growth
5.7%
6.0%
6.8%
6.3%
5.9%
Covered
Commercial
CRE
Res Mtg
Retail
Credit Card
Average Loans |
 15
4Q14 Earnings
Conference Call
Average Deposits
Average Deposits
Key Points
$ in billions
vs. 4Q13
Average total deposits increased by $18.6
billion, or 7.2% (5.5% excluding Charter One
acquisition)
Average low-cost deposits (NIB, interest
checking, money market and savings)
increased by $20.7 billion, or 9.6%
vs. 3Q14
Average total deposits increased by $4.5
billion, or 1.6%
Average low-cost deposits increased by $5.6
billion, or 2.4%
Year-Over-Year Growth
5.4%
5.1%
6.0%
7.4%
7.2%
Time
Money Market
Checking and Savings
Noninterest-bearing |
 16
4Q14 Earnings
Conference Call
Net Interest Income
Net Interest Income
Key Points
$ in millions
Taxable-equivalent basis
vs. 4Q13
Average earning assets grew by $35.4 billion,
or 11.1%
Net interest margin lower by 26 bps (3.14%
vs. 3.40%) driven by:
•
Lower reinvestment rates on investment securities,
as well as growth in the investment portfolio at
lower average rates, lower loan fees, and lower
rates on new loans
•
Partially offset by lower funding costs
vs. 3Q14
Average earning assets grew by $8.5 billion,
or 2.5%
Net interest margin lower by 2 bps (3.14% vs.
3.16%) driven by:
•
Growth in lower rate investment securities
•
Partially offset by interest recoveries
Year-Over-Year Change
(1.8%)
(0.1%)
2.7%
1.3%
2.4% |
 17
4Q14 Earnings
Conference Call
Noninterest Income
Noninterest Income
Key Points
$ in millions
Payments = credit and debit card revenue, corporate payment products revenue and
merchant processing; Service charges = deposit service charges,
treasury management fees and ATM processing services vs. 4Q13
Noninterest income increased by $214 million, or
9.9%, driven by:
•
Higher trust and investment management fees (8.4% increase)
due to account growth, improved market conditions and
business expansion
•
Higher merchant processing services revenue (4.6% increase)
due to an increase in product fees and higher volumes, partially
offset by lower rates; higher credit and debit card revenue (3.4%
increase) and corporate payment products revenue (4.8%
increase) due to higher transaction volumes
•
Higher other income due to higher equity investment gains and
increased revenue from tax-advantaged projects
•
Lower commercial products revenue (9.9% decrease) due to
lower tax-advantaged project syndication fees
vs. 3Q14
Noninterest income increased by $128 million, or
5.7%, driven by:
•
Higher credit and debit card revenue (8.4% increase) due to
seasonally higher sales volumes
•
Higher commercial products revenue (4.8% increase) due to
higher loan and tax-advantaged project syndication fees
•
Higher trust and investment management fees (2.2% increase)
due to improved market conditions and higher fees
•
Higher other income primarily due to the Nuveen gain and
higher revenue from tax-advantaged projects
•
Lower corporate payments revenue (10.8% decrease) due to
seasonally higher 3Q government-related transaction volumes
•
Mortgage revenue decrease of $25 million
Year-Over-Year Change
(7.4%)
(2.6%)
7.4%
3.0%
9.9%
All Other
Mortgage
Service Charges
Trust and Inv Mgmt
Payments
4Q13
1Q14
2Q14
3Q14
4Q14
Nuveen Gain
-
$
-
$
-
$
-
$
124
$
Visa Gain
-
-
214
-
-
Total
-
$
-
$
$ 214
-
$
124
$
Notable Noninterest Income Items |
 18
4Q14 Earnings
Conference Call
Noninterest Expense
Noninterest Expense
Key Points
$ in millions
vs. 4Q13
Noninterest expense was higher by $122 million, or
4.5%, driven by:
•
Higher compensation expense (4.4% increase) reflecting the
impact of merit increases, acquisitions, and higher staffing for
risk and compliance activities
•
Higher marketing and business development expense (25.2%
increase) due to charitable contributions
•
Higher professional services expense (11.9% increase) due to
higher costs across a majority of the lines of business
•
Higher other expense primarily due to the legal accruals
•
Partially offset by a reduction in employee benefits (10.9%
decrease) driven by lower pension costs
vs. 3Q14
Noninterest expense was higher by $190 million, or
7.3%, driven by:
•
Higher marketing and business development expense (65.4%
increase) primarily due to charitable contributions and
advertising costs
•
Higher professional services expense (29.4% increase) due to
seasonally higher costs across a majority of the lines of
business including risk and compliance activities
•
Higher other expense primarily due to seasonally higher costs
related to investments in tax-advantaged projects and the legal
accruals
Year-Over-Year Change
(0.1%)
3.0%
7.7%
1.9%
4.5%
All Other
Tech and Communications
Prof Svcs, Marketing and PPS
Occupancy and Equipment
Compensation and Benefits
4Q13
1Q14
2Q14
3Q14
4Q14
Charitable contributions
-
$
-
$
-
$
-
35
$
Accruals for legal matters
-
-
-
-
53
FHA DOJ settlement
-
-
200
-
-
Total
-
$
-
$
200
$
-
$
88
$
Notable Noninterest Expense Items |
 19
4Q14 Earnings
Conference Call
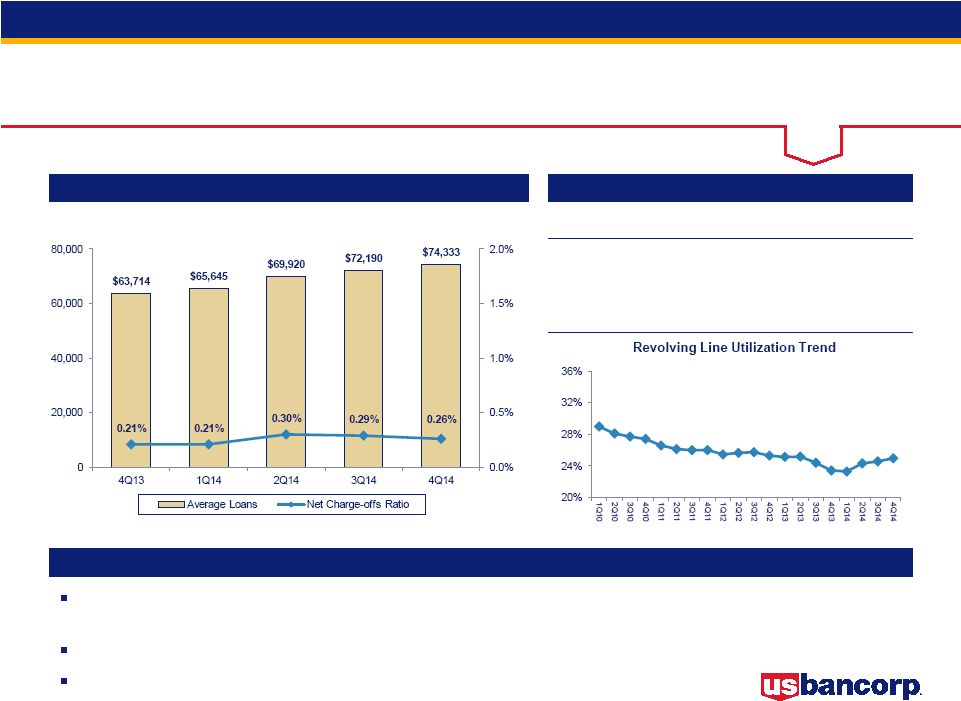
Credit Quality
-
Commercial Loans
Average Loans and Net Charge-offs Ratios
Key Statistics
Comments
Continued new client growth led to 3.0% linked quarter loan growth and 16.7%
year-over-year growth; utilization rates improved modestly
Net charge-offs below historic norms and were largely unchanged
Nonperforming loans and delinquencies continued at historically low levels
4Q13
3Q14
4Q14
Average Loans
$63,714
$72,190
$74,333
30-89 Delinquencies
0.33%
0.23%
0.27%
90+ Delinquencies
0.08%
0.05%
0.05%
Nonperforming Loans
0.19%
0.22%
0.13%
$ in millions |
 20
4Q14 Earnings
Conference Call
Credit Quality
-
Commercial Leases
Average Loans and Net Charge-offs Ratios
Key Statistics
Comments
Commercial lease balances increased slightly
Gross
charge-offs
declined
while
recoveries
increased
leading
to
a
modest
net
recovery
Nonperforming loans and delinquencies continued at modest levels
4Q13
3Q14
4Q14
Average Loans
$5,210
$5,155
$5,292
30-89 Delinquencies
0.85%
0.83%
0.78%
90+ Delinquencies
0.00%
0.00%
0.00%
Nonperforming Loans
0.23%
0.23%
0.24%
$ in millions |
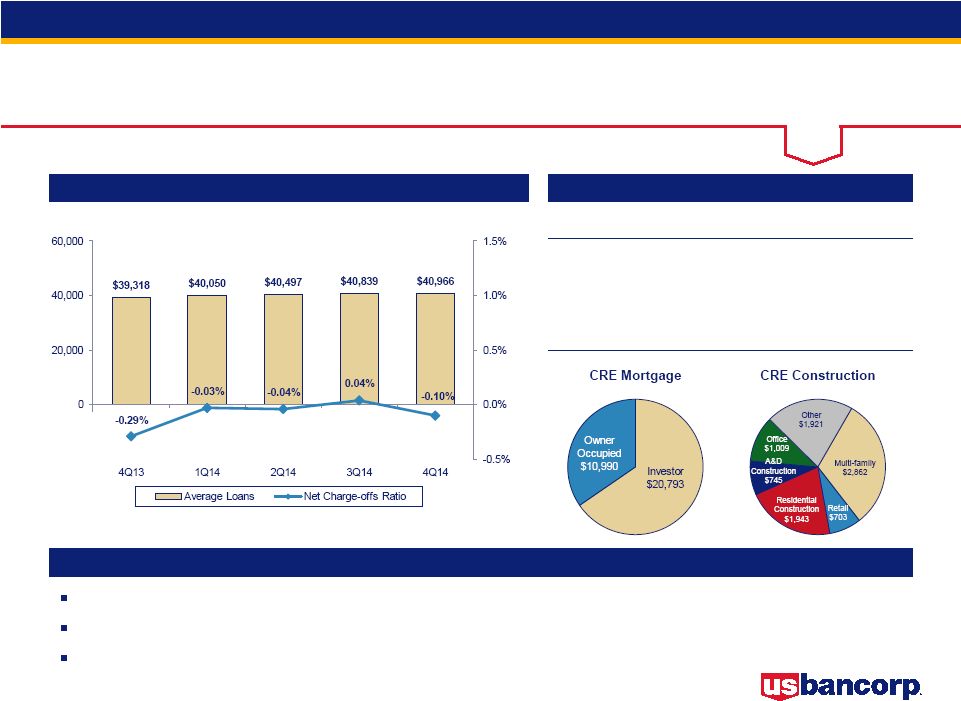 21
4Q14 Earnings
Conference Call
Credit Quality
-
Commercial Real Estate
Average Loans and Net Charge-offs Ratios
Key Statistics
Comments
Average loans increased 0.3% on a linked quarter basis and 4.2%
year-over-year Credit quality is stable at low levels;
non-performing loans were stable quarter-over-quarter Net
recovery ratio of 0.10% 4Q13
3Q14
4Q14
Average Loans
$39,318
$40,839
$40,966
30-89 Delinquencies
0.24%
0.12%
0.26%
90+ Delinquencies
0.07%
0.03%
0.05%
Nonperforming Loans
0.76%
0.59%
0.61%
Performing TDRs*
$390
$284
$365
$ in millions
*
TDR
=
troubled
debt
restructuring |
 22
4Q14 Earnings
Conference Call
Credit Quality
-
Residential Mortgage
Average Loans and Net Charge-offs Ratios
Key Statistics
Comments
Modest growth in high-quality originations (weighted average FICO 756, weighted
average LTV 70%), as average loans increased 2.2% year over year
82% of the balances have been originated since the beginning of 2009; the
origination quality metrics and performance to date have significantly
outperformed prior vintages with similar seasoning
4Q13
3Q14
4Q14
Average Loans
$50,732
$51,994
$51,872
30-89 Delinquencies
0.70%
0.46%
0.43%
90+ Delinquencies
0.65%
0.41%
0.40%
Nonperforming Loans
1.51%
1.62%
1.67%
$ in millions
**
Excludes
GNMA
loans,
whose
repayments
are
insured
by
the
FHA
or
guaranteed
by
the
Department
of
VA
($2,244
million
4Q14) |
 23
4Q14 Earnings
Conference Call
4Q13
3Q14
4Q14
Average Loans
$17,366
$17,753
$17,990
30-89 Delinquencies
1.25%
1.23%
1.24%
90+ Delinquencies
1.17%
1.10%
1.13%
Nonperforming Loans
0.43%
0.22%
0.16%
Credit Quality -
Credit Card
Average Loans and Net Charge-offs Ratios
Key Statistics
Comments
Average loans increased 1.3% on a linked quarter basis; up 3.6%
year-over-year Delinquencies and losses have stabilized near
historically low levels with some seasonal impacts on delinquencies
Nonperforming loans continued to decline
$ in millions |
 24
4Q14 Earnings
Conference Call
Credit Quality -
Home Equity
Average Loans and Net Charge-offs Ratios
Key Statistics
Comments
High-quality originations (weighted average FICO on commitments was 756,
weighted average CLTV
70%)
originated
primarily
through
the
retail
branch
network
to
existing
bank
customers
on
their primary residence
Net charge-offs ratio declined on a linked quarter and year-over-year
basis 4Q13
3Q14
4Q14
Average Loans
$15,488
$15,704
$15,853
30-89 Delinquencies
0.66%
0.51%
0.54%
90+ Delinquencies
0.32%
0.26%
0.26%
Nonperforming Loans
1.08%
1.05%
1.07%
Subprime: 2%
Wtd Avg LTV**: 90%
NCO: 4.92%
$ in millions
Prime: 95%
Wtd Avg LTV**: 72%
NCO: 0.37%
** LTV at origination
Other: 3%
Wtd Avg LTV**: 72%
NCO: 0.00% |
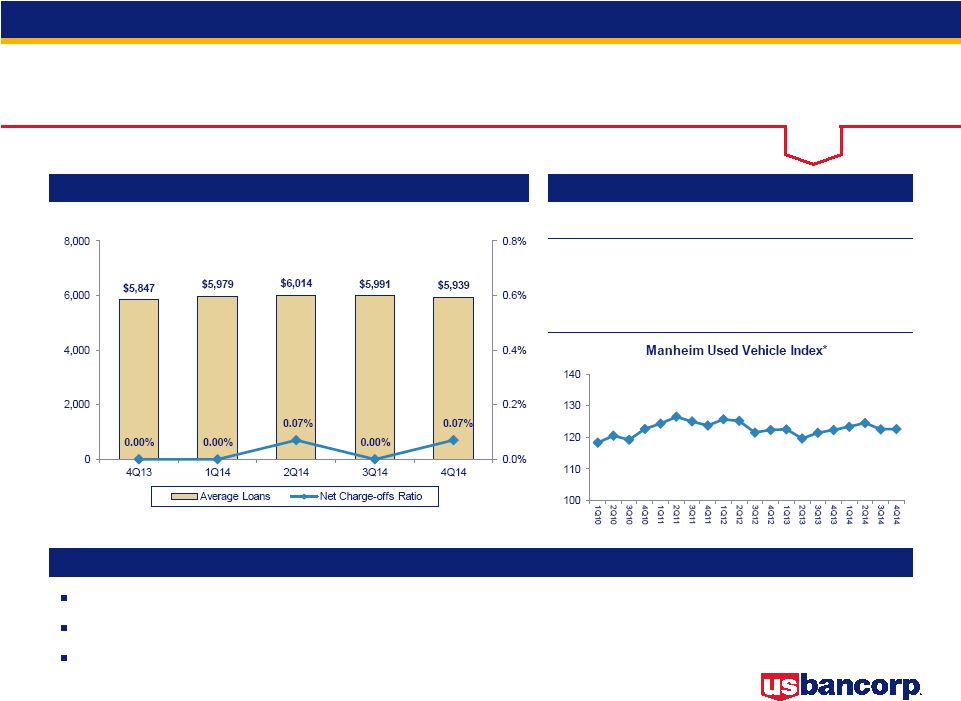 25
4Q14 Earnings
Conference Call
Credit Quality -
Retail Leasing
Average Loans and Net Charge-offs Ratios
Key Statistics
Comments
Year-over-year growth (1.6%) driven by high-quality originations
(weighted average FICO 788) Delinquencies remained relatively stable at very
low levels Strong used auto values continued to contribute to historically
low net charge-offs 4Q13
3Q14
4Q14
Average Loans
$5,847
$5,991
$5,939
30-89 Delinquencies
0.18%
0.14%
0.18%
90+ Delinquencies
0.00%
0.02%
0.02%
Nonperforming Loans
0.02%
0.02%
0.02%
$ in millions
* Manheim Used Vehicle Value Index source: www.manheimconsulting.com, January 1995
= 100, quarter value = average of monthly ending values |
 26
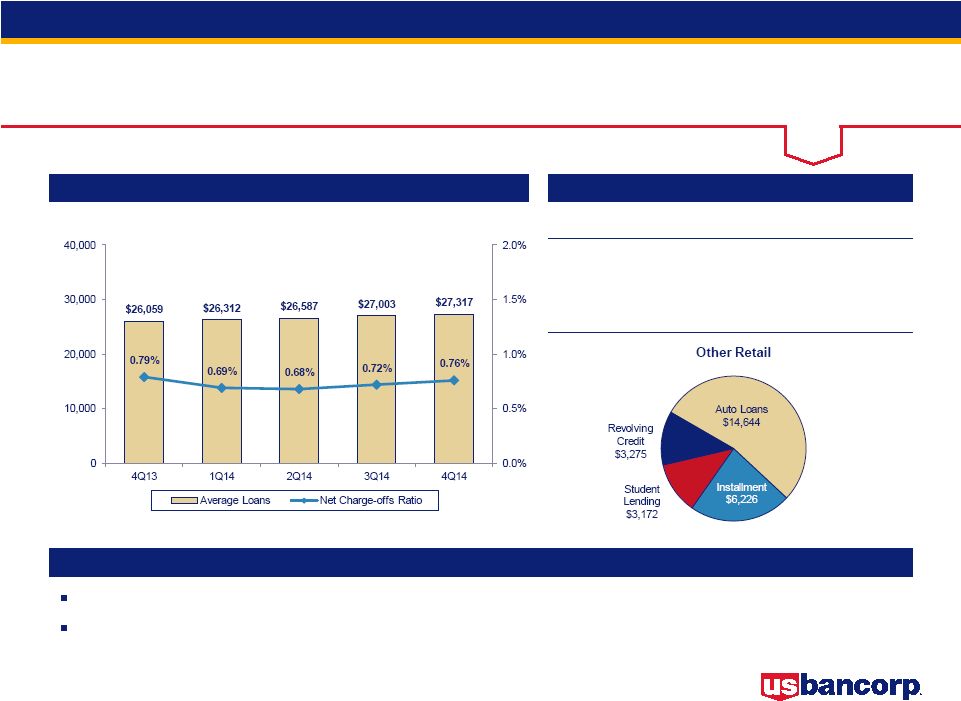
4Q14 Earnings
Conference Call
Credit Quality -
Other Retail
Average Loans and Net Charge-offs Ratios
Key Statistics
Comments
Auto
loan
growth
continued
to
offset
declines
in
student
lending
loan
balances
Net charge-offs and delinquencies remained low on a linked quarter and
year-over-year basis 4Q13
3Q14
4Q14
Average Loans
$26,059
$27,003
$27,317
30-89 Delinquencies
0.50%
0.49%
0.51%
90+ Delinquencies
0.14%
0.13%
0.12%
Nonperforming Loans
0.09%
0.06%
0.06%
$ in millions |
 27
4Q14 Earnings
Conference Call
Credit Quality -
Auto Loans
Average Loans and Net Charge-offs Ratios
Key Statistics
Comments
Continued growth in auto loans driven by high-quality originations in the
Indirect Channel (weighted average FICO 766)
Net charge-offs increased due to seasonality as well as growth initiatives
beginning to mature 4Q13
3Q14
4Q14
Average Loans
$13,409
$14,404
$14,644
30-89 Delinquencies
0.34%
0.41%
0.45%
90+ Delinquencies
0.04%
0.05%
0.03%
Nonperforming Loans
0.02%
0.03%
0.03%
$ in millions
Auto Loans are included in Other Retail category
Direct: 6%
Wtd Avg FICO: 748
NCO: 0.15%
Indirect: 94%
Wtd Avg FICO: 763
NCO: 0.34% |
 28
4Q14 Earnings
Conference Call
Mortgage Repurchase
Mortgages Repurchased and Make-whole Payments
Mortgage Representation and Warranties Reserve
$ in millions
4Q14
3Q14
2Q14
1Q14
4Q13
Beginning Reserve
$62
$69
$75
$83
$176
Net Realized Losses
(15)
(1)
(2)
(10)
(63)
Change in Reserve
(1)
(6)
(4)
2
(30)
Ending Reserve
$46
$62
$69
$75
$83
Mortgages
repurchased
and make-whole
payments
$14
$19
$36
$36
$32
Repurchase activity lower than
peers due to:
•
Conservative credit and
underwriting culture
•
Disciplined origination process -
primarily conforming
loans
( 95% sold to GSEs)
Do not participate in private
placement securitization market
Outstanding repurchase and
make-whole requests balance
= $19 million |
 29
4Q14 Earnings
Conference Call
Non-GAAP Financial Measures
(Dollars in Millions, Unaudited)
4Q14
3Q14
2Q14
1Q14
4Q13
Total equity
$44,168
$43,829
$43,386
$42,743
$41,807
Preferred stock
(4,756)
(4,756)
(4,756)
(4,756)
(4,756)
Noncontrolling interests
(689)
(688)
(686)
(689)
(694)
Goodwill (net of deferred tax liability) (1)
(8,403)
(8,503)
(8,548)
(8,352)
(8,343)
Intangible assets, other than mortgage servicing rights
(824)
(877)
(925)
(804)
(849)
Tangible common equity (a)
29,496
29,005
28,471
28,142
27,165
Tangible common equity (as calculated above)
29,496
29,005
28,471
28,142
27,165
Adjustments (2)
172
187
224
239
224
Common equity tier 1 capital estimated for the Basel III fully
implemented standardized and advanced approaches (b)
29,668
29,192
28,695
28,381
27,389
Tier 1 capital, determined in accordance with prescribed
regulatory requirements using Basel I definition
33,386
Preferred stock
(4,756)
Noncontrolling interests, less preferred stock not
eligible for Tier 1 capital
(688)
Tier 1 common equity using Basel I definition (c)
27,942
(1) Includes goodwill related to certain investments in unconsolidated financial institutions per
prescribed regulatory requirements beginning March 31, 2014. (2) Includes net losses on cash
flow hedges included in accumulated other comprehensive income and other adjustments. (3)
2014 amounts calculated under the Basel III transitional standardized approach; December 31, 2013,
calculated under Basel I. (4) Includes higher risk-weighting for unfunded loan commitments,
investment securities, residential mortgages, mortgage servicing rights and other adjustments.
(5)
Primarily reflects higher risk-weighting for mortgage servicing rights.
|
 30
4Q14 Earnings
Conference Call
Non-GAAP Financial Measures
(Dollars in Millions, Unaudited)
4Q14
3Q14
2Q14
1Q14
4Q13
Total assets
$402,529
$391,284
$389,065
$371,289
$364,021
Goodwill (net of deferred tax liability) (1)
(8,403)
(8,503)
(8,548)
(8,352)
(8,343)
Intangible assets, other than mortgage servicing rights
(824)
(877)
(925)
(804)
(849)
Tangible assets (d)
393,302
381,904
379,592
362,133
354,829
Risk-weighted assets, determined in accordance with prescribed
regulatory requirements (3) (e)
317,398
*
311,914
309,929
302,841
297,919
Adjustments (4)
11,110
*
12,837
12,753
13,238
13,712
Risk-weighted assets estimated for the Basel III fully implemented
standardized approach (f)
328,508
*
324,751
322,682
316,079
311,631
Risk-weighted assets, determined in accordance with prescribed
transitional advanced approaches regulatory requirements
248,596
*
243,909
241,929
Adjustments (5)
3,270
*
3,443
3,383
Risk-weighted assets estimated for the Basel III fully implemented
advanced approaches (g)
251,866
*
247,352
245,312
Ratios *
Tangible common equity to tangible assets (a)/(d)
7.5
7.6
7.5
7.8
7.7
%
Tangible common equity to risk-weighted assets (a)/(e)
9.3
9.3
9.2
9.3
9.1
Tier 1 common equity to risk-weighted assets using Basel I definition (c)/(e)
--
--
--
--
9.4
Common equity tier 1 capital to risk-weighted assets estimated for the
Basel III fully implemented standardized approach (b)/(f)
9.0
9.0
8.9
9.0
8.8
Common equity tier 1 capital to risk-weighted assets estimated for the
Basel III fully implemented advanced approaches (b)/(g)
11.8
11.8
11.7
*
Preliminary data. Subject to change prior to filings with applicable regulatory agencies.
(1) Includes goodwill related to certain investments in unconsolidated financial institutions
per prescribed regulatory requirements beginning March 31, 2014. (2) Includes net losses on cash
flow hedges included in accumulated other comprehensive income and other adjustments. (3)
2014 amounts calculated under the Basel III transitional standardized approach; December 31, 2013,
calculated under Basel I. (4) Includes higher risk-weighting for unfunded loan commitments,
investment securities, residential mortgages, mortgage servicing rights and other adjustments.
(5)
Primarily reflects higher risk-weighting for mortgage servicing rights.
|
 U.S.
Bancorp 4Q14 Earnings
Conference Call
U.S. Bancorp
4Q14 Earnings
Conference Call
January 21, 2015 |