Attached files
| file | filename |
|---|---|
| 8-K - 8-K - SUNEDISON, INC. | d854788d8k.htm |
Exhibit 99.1
Forward-Looking Statements
This report contains “forward-looking statements” within the meaning of Section 27A of the Securities Act of 1933 and Section 21E of the Securities Exchange Act of 1934. Such forward-looking statements are subject to certain risks, uncertainties and assumptions, including the timing of the completion of the acquisition, and typically can be identified by the use of words such as “expect,” “estimate,” “anticipate,” “forecast,” “intend,” “project,” “target,” “plan,” “believe” and similar terms and expressions. Certain matters discussed in this presentation and conference call are forward-looking statements, including that SunEdison expects total energy systems (solar and wind) completed to be between 2,100 MW and 2,300 MW in 2015, between 2,800 MW and 3,000 MW in 2016 and between 3,800 MW and 4,000 MW in 2017. TerraForm expects dividend per share to grow at a 24% CAGR growth rate. The forward-looking statements contained in this presentation represent the SunEdison and TerraForm’s judgment as of the date of this presentation and are based on current expectations and assumptions. Although SunEdison and TerraForm believe that their expectations and assumptions are reasonable, they can give no assurance that these expectations and assumptions will prove to have been correct, and actual results may vary materially. Factors that could cause actual results to differ materially from those set forth in the forward-looking statements include, among others: the failure of counterparties to fulfill their obligations under off-take agreements; price fluctuations, termination provisions and buyout provisions in offtake agreements; our ability to utilize our deferred tax assets or other tax assets or benefits; changes to the accounting treatment of our transactions or the impact of accounting changes and pronouncements; delays or unexpected costs during the completion of projects under construction; TerraForm Power’s ability to successfully identify, evaluate and consummate acquisitions from SunEdison, Inc. or third parties, including the acquisition of the wind generating projects from Sellers; SunEdison and TerrForm’s ability to complete the First Wind Acquisition and achieve the expected benefits of that transaction as well as the benefits from existing joint ventures; to government regulation; operating and financial restrictions under agreements governing indebtedness; SunEdison and TerraForm’s ability to borrow additional funds and access capital markets; SunEdison’s ability to achieve some or all of the expected benefits of announced public equity offerings; SunEdison and TerraForm’s ability to compete against traditional and renewable energy companies; and hazards customary to the power production industry and power generation operations, such as unusual weather conditions and outages. Furthermore, any dividends are subject to available capital, market conditions and compliance with associated laws and regulations. SunEdison and TerraForm undertake no obligation to update or revise any forward-looking statements, whether as a result of new information, future events or otherwise. The foregoing review of factors that could cause SunEdison and TerraForm’s actual results to differ materially from those contemplated in the forward-looking statements included in this report should be considered in connection with information regarding risks and uncertainties that may affect SunEdison and TerraForm’s future results included in SunEdison and TerraForm’s filings with the Securities and Exchange Commission at www.sec.gov.
SunEdison R
3
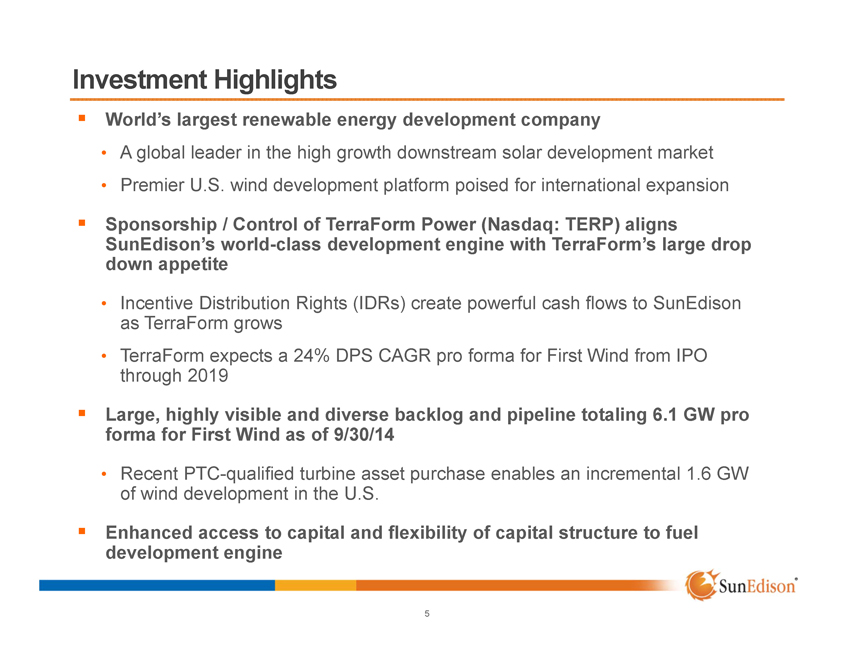
Investment Highlights
World’s largest renewable energy development company
A global leader in the high growth downstream solar development market
Premier U.S. wind development platform poised for international expansion
Sponsorship / Control of TerraForm Power (Nasdaq: TERP) aligns
SunEdison’s world-class development engine with TerraForm’s large drop down appetite
Incentive Distribution Rights (IDRs) create powerful cash flows to SunEdison as TerraForm grows
TerraForm expects a 24% DPS CAGR pro forma for First Wind from IPO through 2019
Large, highly visible and diverse backlog and pipeline totaling 6.1 GW pro forma for First Wind as of 9/30/14
Recent PTC-qualified turbine asset purchase enables an incremental 1.6 GW of wind development in the U.S.
Enhanced access to capital and flexibility of capital structure to fuel development engine
SunEdison R
5
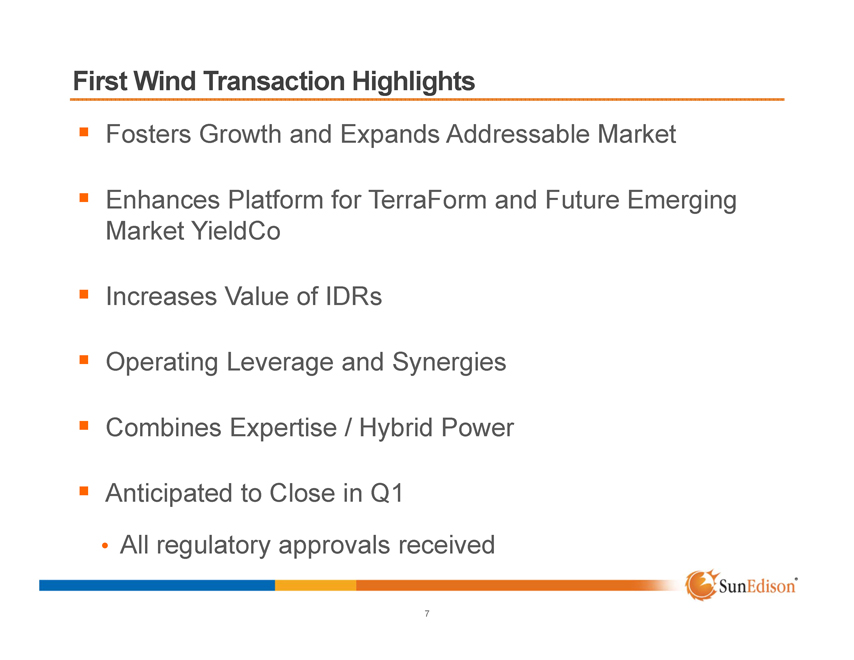
First Wind Transaction Highlights
Fosters Growth and Expands Addressable Market
Enhances Platform for TerraForm and Future Emerging Market YieldCo
Increases Value of IDRs
Operating Leverage and Synergies
Combines Expertise / Hybrid Power
Anticipated to Close in Q1
All regulatory approvals received
SunEdison R
7
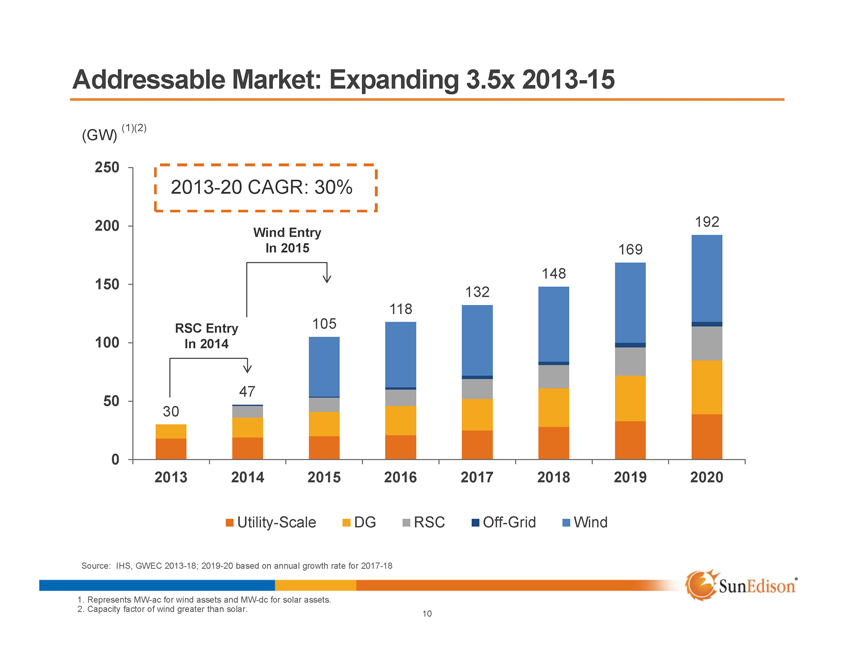
Addressable Market: Expanding 3.5x 2013-15
(GW) (1)(2)
250 200 150 100 50 0
2013-20 CAGR: 30%
RSC Entry In 2014
30
47
Wind Entry In 2015
105
118
132
148
169
192
2013 2014 2015 2016 2017 2018 2019 2020
Utility-Scale DG RSC Off-Grid Wind
Source: IHS, GWEC 2013-18; 2019-20 based on annual growth rate for 2017-18
SunEdison R
1. Represents MW-ac for wind assets and MW-dc for solar assets.
2. Capacity factor of wind greater than solar.
10
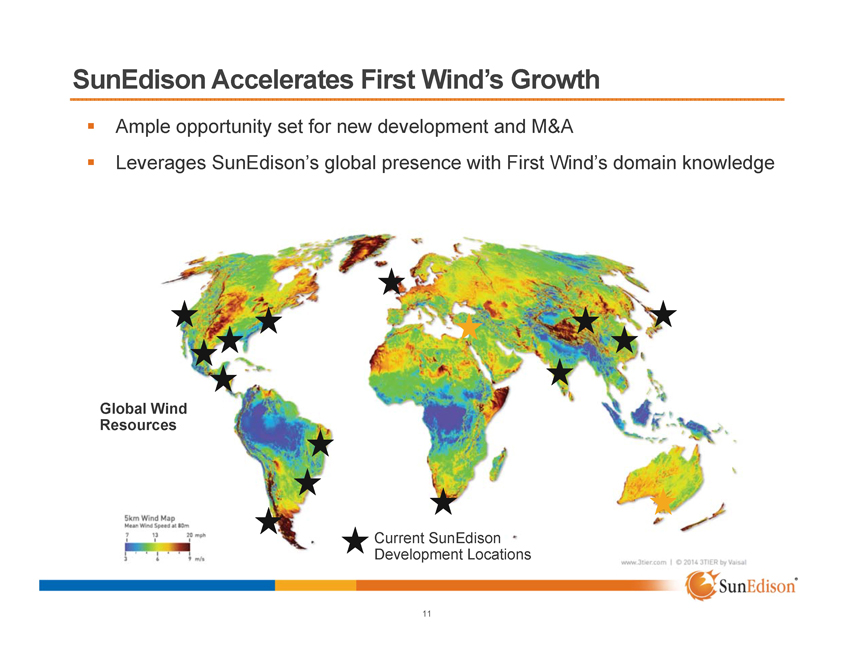
SunEdison Accelerates First Wind’s Growth
Ample opportunity set for new development and M&A
Leverages SunEdison’s global presence with First Wind’s domain knowledge
Global Wind Resources
Current SunEdison Development Locations
5km Wind Map
Mean Wind Speed at 80m
7 13 20 mph
3 6 9 m/s
www.3tier.com | C 2014 3TIER by Vaisal
SunEdison R
11
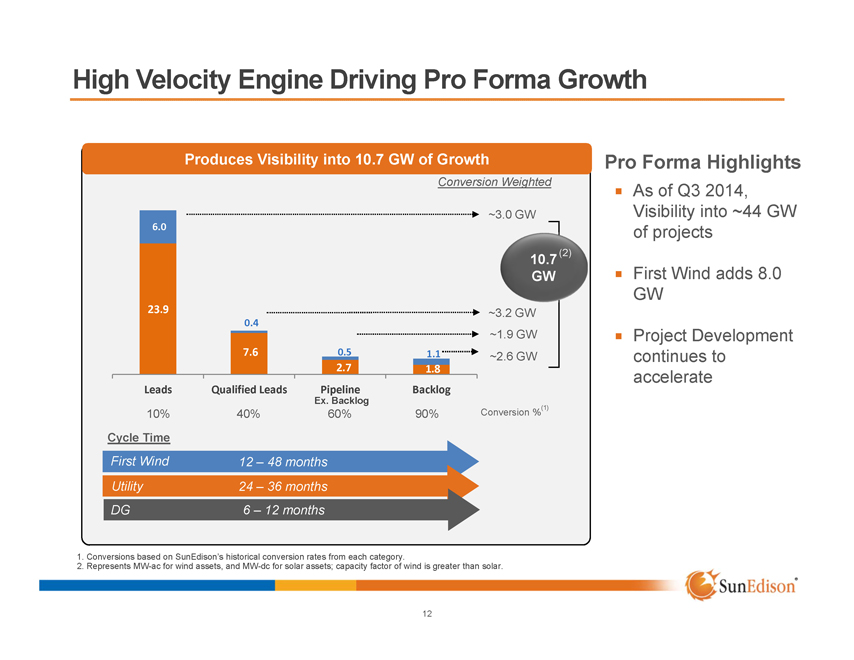
High Velocity Engine Driving Pro Forma Growth
Produces Visibility into 10.7 GW of Growth
Conversion Weighted
6.0
23.9
~3.0 GW
10.7 (2) GW
~3.2 GW
~1.9 GW
~2.6 GW
0.4
7.6
0.5
2.7
1.1
1.8
Leads
10%
Qualified Leads
40%
Pipeline
Ex. Backlog
60%
Backlog
90%
Conversion %(1)
Cycle Time
| First Wind 12 – 48 months |
| Utility 24 – 36 months |
| DG 6 – 12 months |
Pro Forma Highlights
As of Q3 2014, Visibility into ~44 GW of projects
First Wind adds 8.0 GW
Project Development continues to accelerate
1. Conversions based on SunEdison’s historical conversion rates from each category.
2. Represents MW-ac for wind assets, and MW-dc for solar assets; capacity factor of wind is greater than solar.
SunEdison R
12
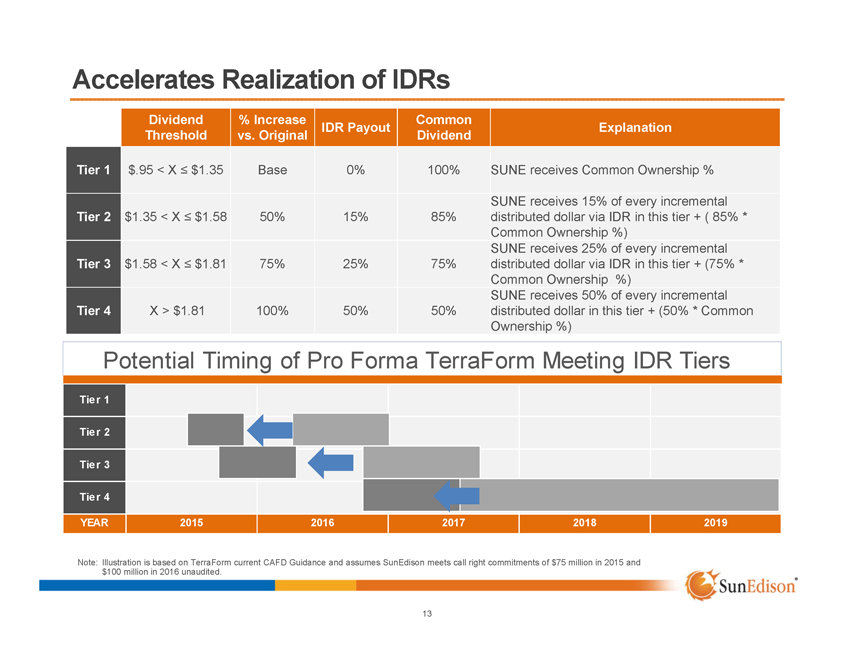
Dividend % Increase Common
IDR Payout Explanation
Threshold vs. Original Dividend
Tier 1 $.95 < X £ $1.35 Base 0% 100% SUNE receives Common Ownership %
SUNE receives 15% of every incremental
Tier 2 $1.35 < X £ $1.58 50% 15% 85% distributed dollar via IDR in this tier + ( 85% *
Common Ownership %)
SUNE receives 25% of every incremental
Tier 3 $1.58 < X £ $1.81 75% 25% 75% distributed dollar via IDR in this tier + (75% *
Common Ownership %)
SUNE receives 50% of every incremental
Tier 4 X > $1.81 100% 50% 50% distributed dollar in this tier + (50% * Common
Ownership %)
Accelerates Realization of IDRs
Potential Timing of Pro Forma TerraForm Meeting IDR Tiers
Tier 1 Tier 2 Tier 3
Tier 4
YEAR
2015 2016 2017 2018 2019
Note: Illustration is based on TerraForm current CAFD Guidance and assumes SunEdison meets call right commitments of $75 million in 2015 and $100 million in 2016 unaudited.
SunEdison R
13
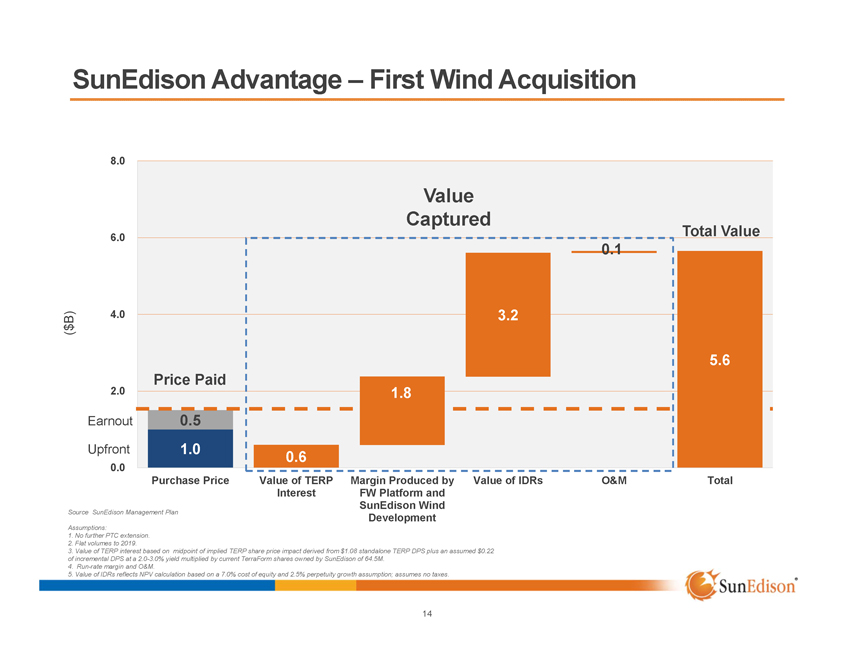
SunEdison Advantage – First Wind Acquisition
($B)
8.0 6.0 4.0
2.0
Earnout
Upfront
0.0
Value Captured
Price Paid
0.5 1.0
0.6
1.8
3.2
0.1
Total Value
5.6
Purchase Price
Value of TERP Interest
Margin Produced by FW Platform and SunEdison Wind Development
Value of IDRs
O&M
Total
Source SunEdison Management Plan
Assumptions:
1. No further PTC extension.
2. Flat volumes to 2019.
3. Value of TERP interest based on midpoint of implied TERP share price impact derived from $1.08 standalone TERP DPS plus an assumed $0.22 of incremental DPS at a 2.0-3.0% yield multiplied by current TerraForm shares owned by SunEdison of 64.5M.
4. Run-rate margin and O&M.
5. Value of IDRs reflects NPV calculation based on a 7.0% cost of equity and 2.5% perpetuity growth assumption; assumes no taxes.
SunEdison R
14
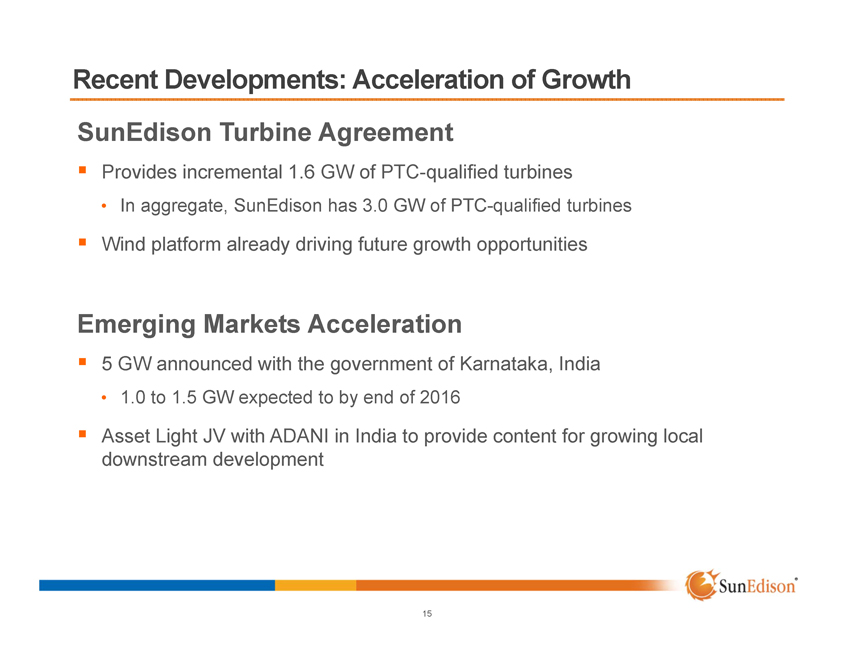
Recent Developments: Acceleration of Growth
SunEdison Turbine Agreement
Provides incremental 1.6 GW of PTC-qualified turbines
In aggregate, SunEdison has 3.0 GW of PTC-qualified turbines
Wind platform already driving future growth opportunities
Emerging Markets Acceleration
5 GW announced with the government of Karnataka, India
1.0 to 1.5 GW expected to by end of 2016
Asset Light JV with ADANI in India to provide content for growing local downstream development
SunEdison R
15
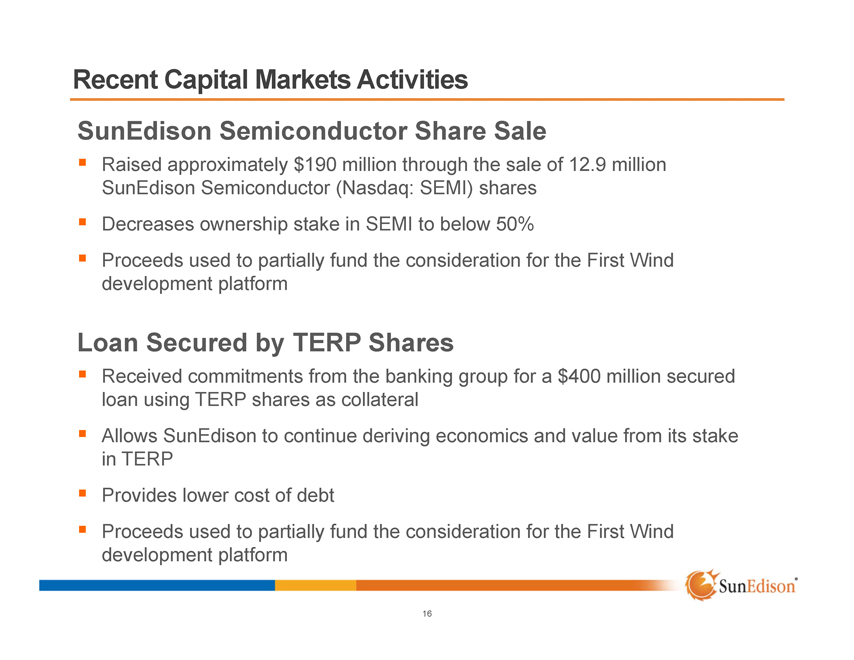
Recent Capital Markets Activities
SunEdison Semiconductor Share Sale
Raised approximately $190 million through the sale of 12.9 million SunEdison Semiconductor (Nasdaq: SEMI) shares
Decreases ownership stake in SEMI to below 50%
Proceeds used to partially fund the consideration for the First Wind development platform
Loan Secured by TERP Shares
Received commitments from the banking group for a $400 million secured loan using TERP shares as collateral
Allows SunEdison to continue deriving economics and value from its stake in TERP
Provides lower cost of debt
Proceeds used to partially fund the consideration for the First Wind development platform
SunEdison R
16

SunEdison R
Business Profile
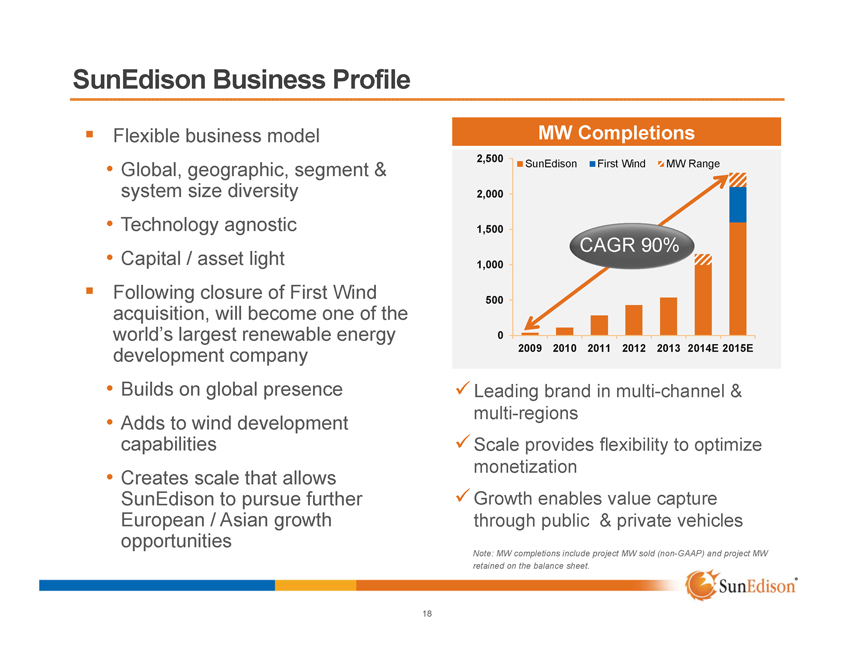
SunEdison Business Profile
Flexible business model
Global, geographic, segment & system size diversity
Technology agnostic
Capital / asset light
Following closure of First Wind acquisition, will become one of the world’s largest renewable energy development company
Builds on global presence
Adds to wind development capabilities
Creates scale that allows SunEdison to pursue further European / Asian growth opportunities
MW Completions
2,500 2,000 1,500 1,000 500 0
SunEdison First Wind MW Range
CAGR 90%
2009 2010 2011 2012 2013 2014E 2015E
Leading brand in multi-channel & multi-regions Scale provides flexibility to optimize monetization Growth enables value capture through public & private vehicles
Note: MW completions include project MW sold (non-GAAP) and project MW retained on the balance sheet.
SunEdison R
18
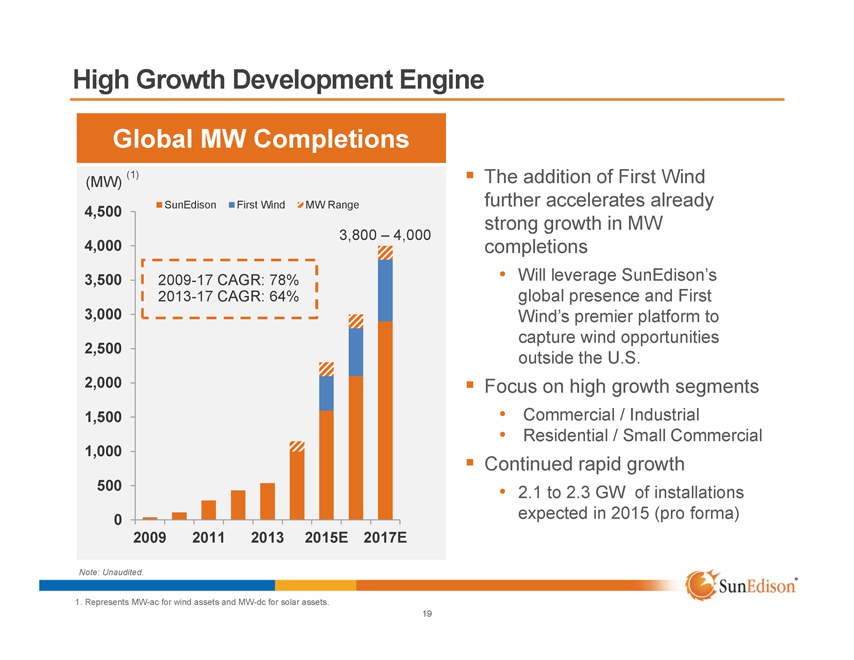
High Growth Development Engine
Global MW Completions
(MW) (1)
4,500 4,000 3,500 3,000 2,500 2,000 1,500 1,000 500 0
SunEdison First Wind MW Range
3,800 – 4,000
2009-17 CAGR: 78% 2013-17 CAGR: 64%
2009 2011 2013 2015E 2017E
The addition of First Wind further accelerates already strong growth in MW completions
Will leverage SunEdison’s global presence and First Wind’s premier platform to capture wind opportunities outside the U.S.
Focus on high growth segments
Commercial / Industrial
Residential / Small Commercial
Continued rapid growth
2.1 to 2.3 GW of installations expected in 2015 (pro forma)
Note: Unaudited.
SunEdison R
1. Represents MW-ac for wind assets and MW-dc for solar assets.
19
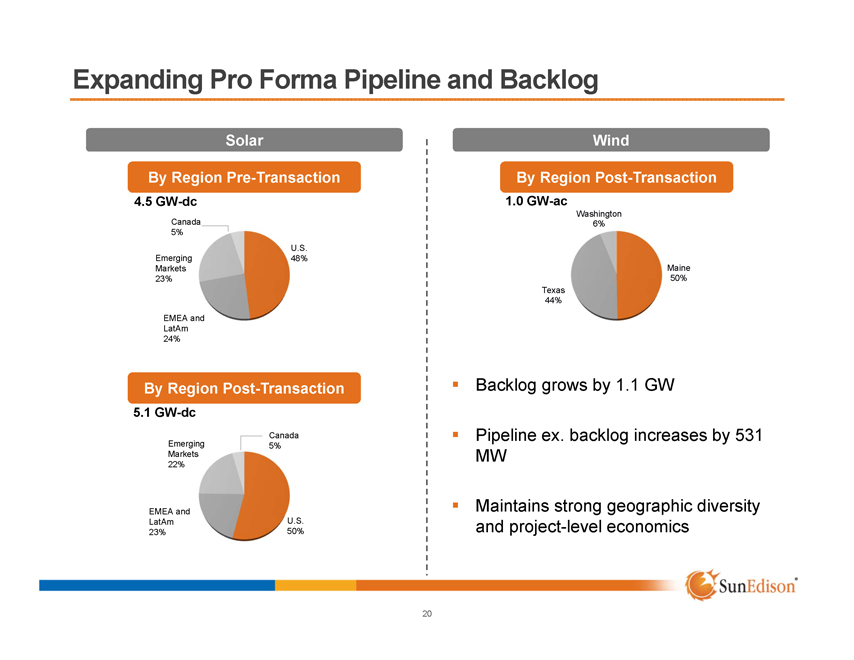
Expanding Pro Forma Pipeline and Backlog
Solar
By Region Pre-Transaction
4.5 GW-dc
Canada 5%
Emerging Markets 23%
EMEA and LatAm 24%
U.S. 48%
By Region Post-Transaction
5.1 GW-dc
Emerging Markets 22%
EMEA and LatAm 23%
Canada 5%
U.S. 50%
Wind
By Region Post-Transaction
1.0 GW-ac
Washington 6%
Texas 44%
Maine 50%
Backlog grows by 1.1 GW
Pipeline ex. backlog increases by 531 MW
Maintains strong geographic diversity and project-level economics
SunEdison R
20

SunEdison R
Financial Highlights
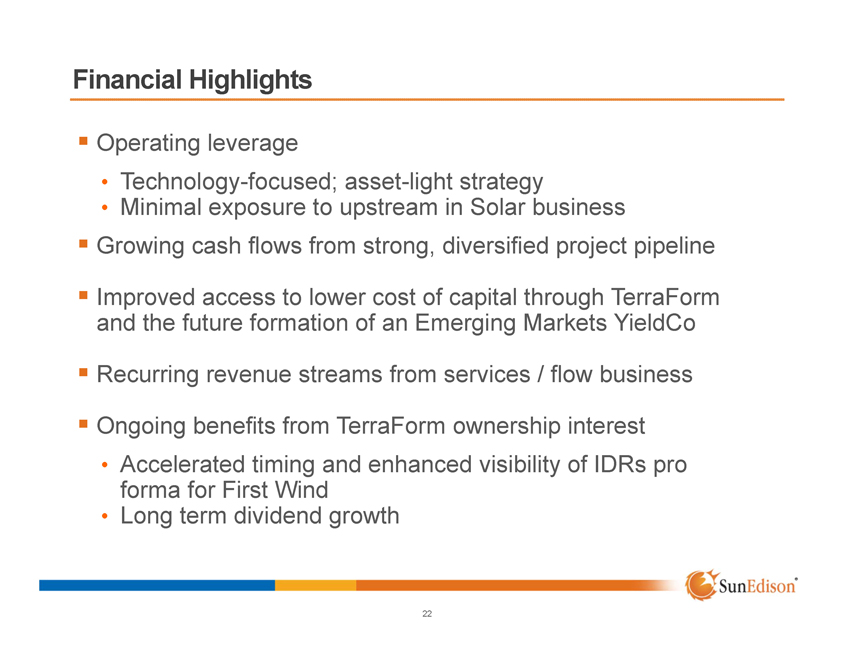
Financial Highlights
Operating leverage
Technology-focused; asset-light strategy
Minimal exposure to upstream in Solar business
Growing cash flows from strong, diversified project pipeline
Improved access to lower cost of capital through TerraForm and the future formation of an Emerging Markets YieldCo
Recurring revenue streams from services / flow business
Ongoing benefits from TerraForm ownership interest
Accelerated timing and enhanced visibility of IDRs pro forma for First Wind
Long term dividend growth
SunEdison R
22
Business Outlook
(1)
(MW)
4,500 3,000 1,500 0
MW Range
1,600 – 1,800
2,100 – 2,300
Previous 2015E
Updated 2015E
Guidance
4,500 3,000 1,500 0
MW Range
2,000
2,100 – 2,300
2,800 – 3,000
3,800 – 4,000
Previous 2016E
Updated 2016E(2)
Pro Forma 2016E
2017E
Future Outlook
Note: Unaudited
SunEdison R
1. Represents MW-ac for wind assets and MW-dc for solar assets.
2. Solar only.
23

SunEdison R
Q&A