Attached files
| file | filename |
|---|---|
| 8-K - FORM 8-K - SLM Corp | d856001d8k.htm |
| Exhibit 99.1
|
Exhibit 99.1
SLM CORPORATION EARNINGS PRESENTATION
FOURTH-QUARTER 2014
JANUARY 22, 2015
|
|
Cautionary Note Regarding Forward -Looking Statements
The following information is current as of January 22, 2015 (unless otherwise noted) and should be read in connection with SLM Corporation’s press release announcing its financial results for the quarter
and year ended December 31, 2014, and the audited carve out financial statements filed on Form 8-K on May 6 , 2014, and subsequent reports filed with the Securities and Exchange Commission (the
“SEC”). Definitions for capitalized terms in this presentation not defined herein c an be found in the 2013 Form 10-K (filed with the SEC on February 19, 2014).
This Presentation contains forward-looking statements and information based on management’s c urrent expectations as of the date of this presentation. Statements that are not historical facts, including
statements about the Company’s beliefs or expectations and statements that assume or are dependent upon future events, are forward-looking statements. Forward-looking statements are subject to
risks, uncertainties , assumptions and other factors that may cause actual results to be materially different from those reflected in such forward-looking statements . These factors include, among others,
the risks and uncertainties set forth in Item 1A “Risk Factors” and elsewhere in the Company’s Annual Report on Form 10-K for the year ended Dec . 31, 2013 (filed with the SEC on Feb. 19 , 2014), the
Company’s Quarterly Report on Form 10-Q for the quarter ended June 30, 2014, and the Company’s Quarterly Report on Form 10-Q for the quarter ended Sept. 30 , 2014; increases in financing costs;
limits on liquidity; increases in costs associated with compliance with laws and regulations; changes in accounting standards and the impact of related changes in significant accounting estimates ; any
adverse outcomes in any significant litigation to which the Company is a party; credit risk associated with the Company’s exposure to third parties , including counterparties to the Company’s derivative
transactions ; and c hanges in the terms of s tudent loans and the educational credit marketplace (including c hanges resulting from new laws and the implementation of existing laws ). The Company could
also be affected by, among other things : changes in its funding costs and availability; failures of its operating systems or infrastructure, including those of third- party vendors; failure to implement the
recently executed separation of the Company into two separate publicly traded companies , including failure to transition its origination and servicing operations as planned, increased costs in connection
with being a stand-alone company, and failure to achieve the expected benefits of the separation; damage to its reputation; changes in the demand for educational financing or in financing preferences of
lenders , educational institutions, students and their families; c hanges in law and regulations with respect to the student lending business and financial institutions generally; c hanges in banking rules and
regulations, including inc reased capital requirements ; increased competition from banks and other consumer lenders ; the c reditworthiness of its customers; c hanges in the general interest rate
environment, including the rate relationships among relevant money- market instruments and those of its earning assets vs . its funding arrangements; and changes in general economic conditions . The
preparation of the Company’s consolidated financial statements also requires management to make certain estimates and assumptions including estimates and assumptions about future events . These
estimates or assumptions may prove to be incorrect. All forward-looking statements contained in this release are qualified by these cautionary statements and are made only as of the date of this release.
T he Company does not undertake any obligation to update or revise these forward-looking s tatements to conform the s tatement to actual results or c hanges in its expectations.
In connection with the spin- off of Navient Corporation, the Company conformed its policy with that of Sallie Mae Bank to charge off loans after 120 days of delinquency. The Company also changed its loss
confirmation period from two years to one year to reflect both the shorter charge- off policy and its related servicing practices . Prior to the spin- off, Sallie Mae Bank sold all loans past 90 days delinquent to
an affiliate of what is now Navient Corporation. Post-spin- off, sales of delinquent loans to Navient Corporation have been significantly curtailed. Consequently, many of the pre-spin-off, historical credit
indicators and period over-period trends are not c omparable and may not be indicative of future performance.
The Company reports financial results on a GAAP basis and also provides certain core earnings performance measures . The difference between the Company’s “Core Earnings “ and GAAP results for the
periods presented were the unrealized, mark-to-market gains /losses on derivative contracts . These are recognized in GAAP but not in “Core Earnings “ results. The Company provides “Core Earnings”
measures because this is what management uses when making management decisions regarding the Company’s performance and the allocation of corporate resources. The Company’s “Core Earnings”
are not defined terms within GAAP and may not be comparable to similarly titled measures reported by other companies.
For additional information, see “Key Financial Measures-Core Earnings” in the Company’s Form 10-Q for the quarter ended September 30, 2014 for a further discussion, and the
Company’s press release announcing its financial results for the quarter and year ended December 31, 2014 for a complete reconciliation between GAAP net income and core
earnings.
2
|
|
Sallie Mae Bank Overview
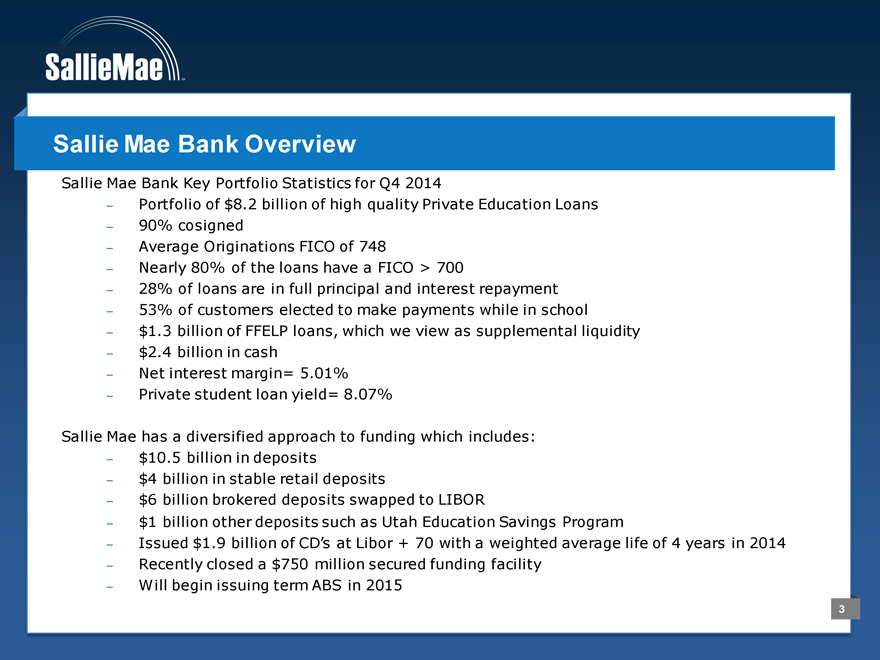
Sallie Mae Bank Key Portfolio Statistics for Q4 2014
- Portfolio of $8.2 billion of high quality Private Education Loans
- 90% cosigned
- Average Originations FICO of 748
- Nearly 80% of the loans have a FICO > 700
- 28% of loans are in full principal and interest repayment
- 53% of customers elected to make payments while in school
- $1.3 billion of FFELP loans, which we view as supplemental liquidity
- $2.4 billion in cash
- Net interest margin= 5.01%
- Private student loan yield= 8.07%
Sallie Mae has a diversified approach to funding which includes:
- $10.5 billion in deposits
- $4 billion in stable retail deposits
- $6 billion brokered deposits swapped to LIBOR
- $1 billion other deposits such as Utah Education Savings Program
- Issued $1.9 billion of CD’s at Libor + 70 with a weighted average life of 4 years in 2014
- Recently closed a $750 million secured funding facility
- Will begin issuing term ABS in 2015
3
|
|
Key Financial Metrics
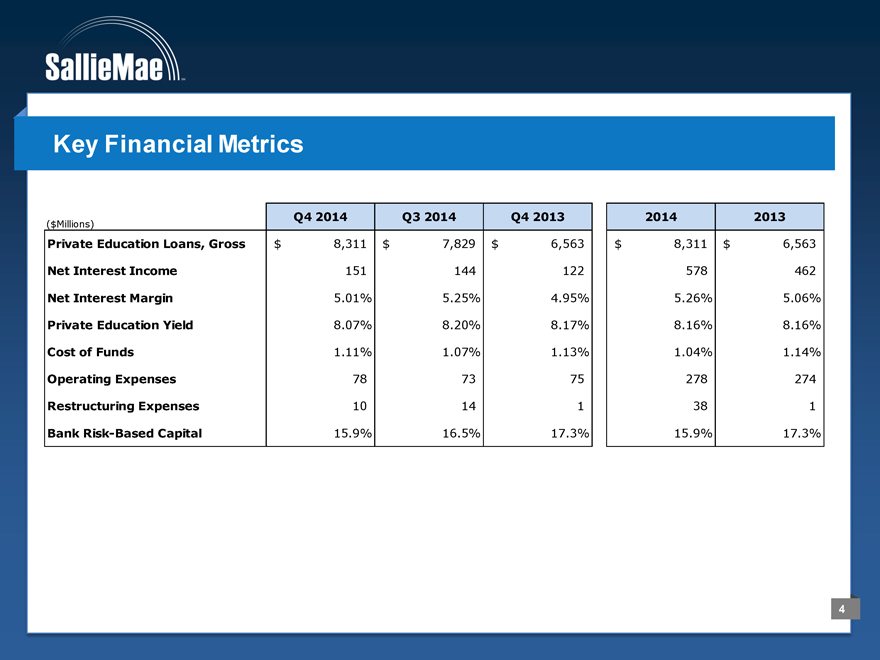
($Millions) Q4 2014 Q3 2014 Q4 2013 2014 2013
Private Education Loans, Gross $ 8,311 $ 7,829 $ 6,563 $ 8,311 $ 6,563
Net Interest Income 151 144 122 578 462
Net Interest Margin 5.01% 5.25% 4.95% 5.26% 5.06%
Private Education Yield 8.07% 8.20% 8.17% 8.16% 8.16%
Cost of Funds 1.11% 1.07% 1.13% 1.04% 1.14%
Operating Expenses 78 73 75 278 274
Restructuring Expenses 10 14 1 38 1
Bank Risk-Based Capital 15.9% 16.5% 17.3% 15.9% 17.3%
4
|
|
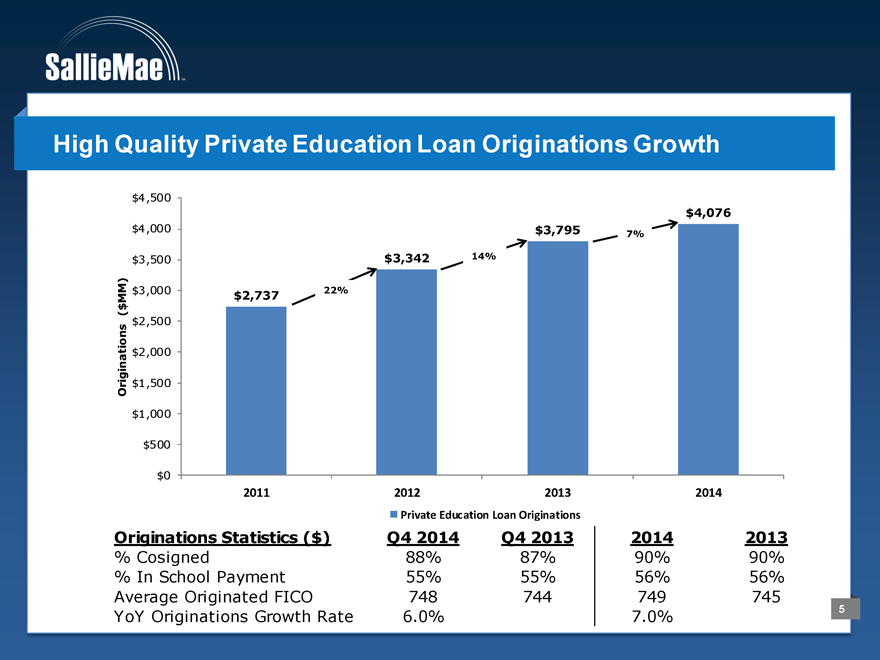
High Quality Private Education Loan Originations Growth
$4,500
$4,076
$4,000 $3,795 7%
$3,500 $3,342 14%
MM) $3,000 $2,737 22%
$
( $2,500
ons
ti $2,000
a
n
igi $1,500
Or
$1,000
$500
$0
2011 2012 2013 2014
Private Education Loan Originations
Originations Statistics ($) Q4 2014 Q4 2013 2014 2013
% Cosigned 88% 87% 90% 90%
% In School Payment 55% 55% 56% 56%
Average Originated FICO 748 744 749 745
YoY Originations Growth Rate 6.0% 7.0% 5
|
|
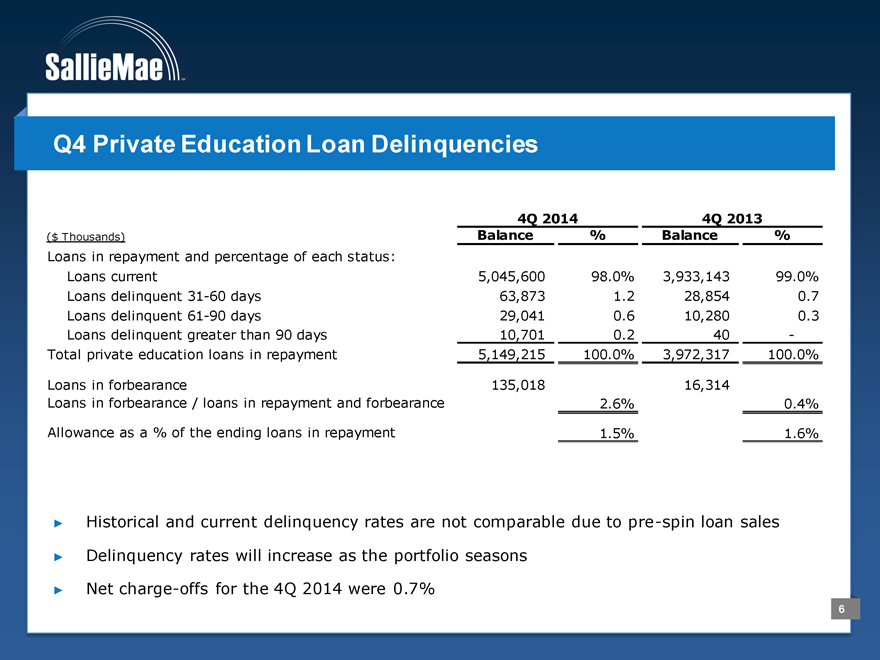
Q4 Private Education Loan Delinquencies
4Q 2014 4Q 2013
($ Thousands) Balance% Balance%
Loans in repayment and percentage of each status:
Loans current 5,045,600 98.0% 3,933,143 99.0%
Loans delinquent 31-60 days 63,873 1.2 28,854 0.7
Loans delinquent 61-90 days 29,041 0.6 10,280 0.3
Loans delinquent greater than 90 days 10,701 0.2 40 -
Total private education loans in repayment 5,149,215 100.0% 3,972,317 100.0%
Loans in forbearance 135,018 16,314
Loans in forbearance / loans in repayment and forbearance 2.6% 0.4%
Allowance as a % of the ending loans in repayment 1.5% 1.6%
Historical and current delinquency rates are not comparable due to pre -spin loan sales
Delinquency rates will increase as the portfolio seasons
Net charge-offs for the 4Q 2014 were 0.7%
6
|
|
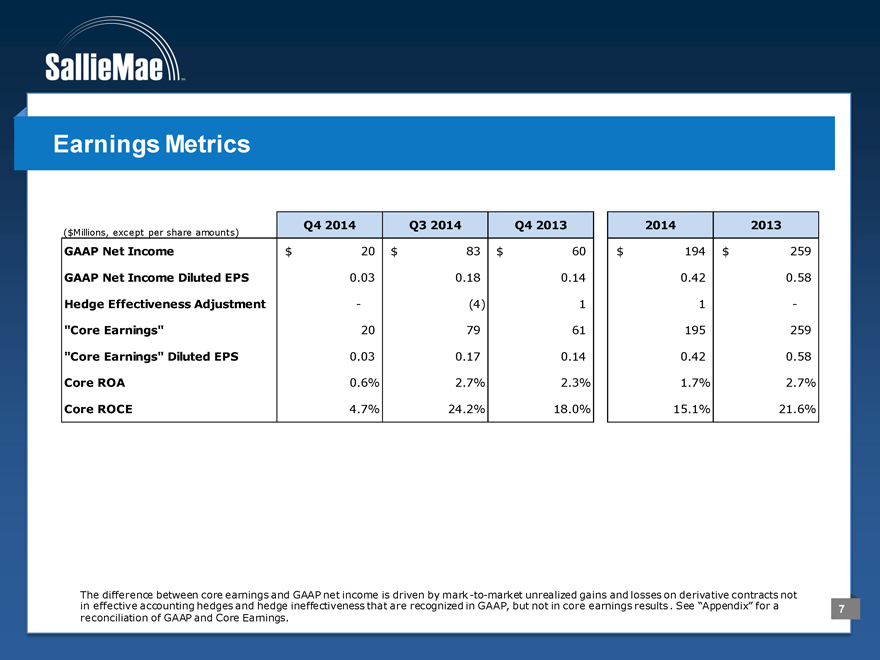
Earnings Metrics
($Millions, except per share amounts) Q4 2014 Q3 2014 Q4 2013 2014 2013
GAAP Net Income $ 20 $ 83 $ 60 $ 194 $ 259
GAAP Net Income Diluted EPS 0.03 0.18 0.14 0.42 0.58
Hedge Effectiveness Adjustment -(4) 1 1 -
“Core Earnings” 20 79 61 195 259
“Core Earnings” Diluted EPS 0.03 0.17 0.14 0.42 0.58
Core ROA 0.6% 2.7% 2.3% 1.7% 2.7%
Core ROCE 4.7% 24.2% 18.0% 15.1% 21.6%
The difference between core earnings and GAAP net income is driven by mark -to-market unrealized gains and losses on derivative contracts not
in effective accounting hedges and hedge ineffectiveness that are recognized in GAAP, but not in core earnings results . See “Appendix” for a
reconciliation of GAAP and Core Earnings.
7
|
|
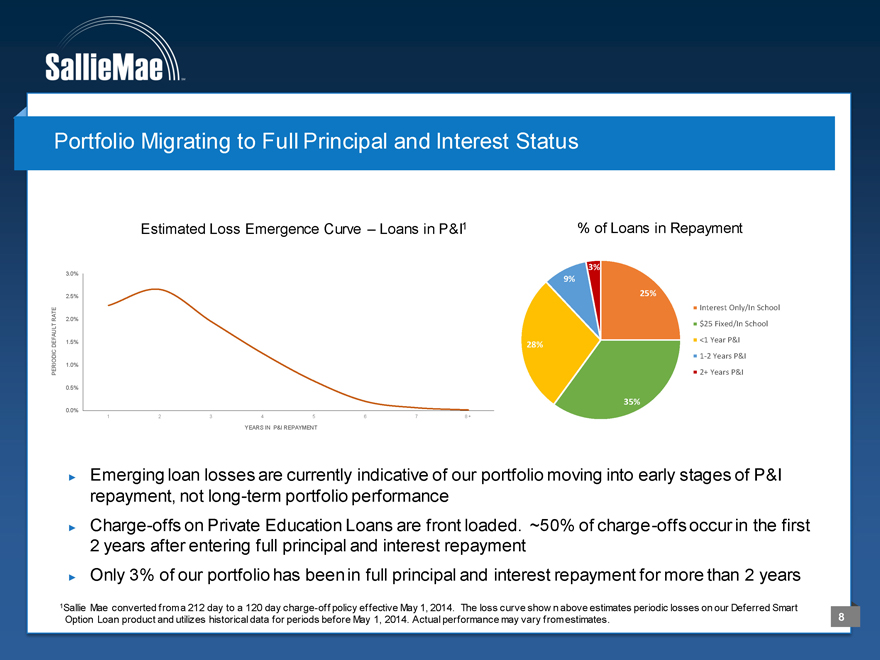
Portfolio Migrating to Full Principal and Interest Status
Estimated Loss Emergence Curve – Loans in P&I1% of Loans in Repayment
% of Loans in Repayment
3%
3.0%
9%
2.5% 25%
Interest Only/In School
RATE 2.0%
$25 Fixed/In School
DEFAULT 1.5% 28% <1 Year P&I
DIC 1-2 Years P&I
1.0%
PERIO 2+ Years P&I
0.5%
35%
0.0%
1 2 3 4 5 6 7 8+
YEARS IN P&I REPAYMENT
Emerging loan losses are currently indicative of our portfolio moving into early stages of P&I repayment, not long-term portfolio performance
Charge-offs on Private Education Loans are front loaded. ~50% of charge-offs occur in the first 2 years after entering full principal and interest repayment
Only 3% of our portfolio has been in full principal and interest repayment for more than 2 years
1Sallie Mae converted from a 212 day to a 120 day charge-off policy effective May 1, 2014. The loss curve show n above estimates periodic losses on our Deferred Smart
Option Loan product and utilizes historical data for periods before May 1, 2014. Actual performance may vary from estimates. 8
|
|
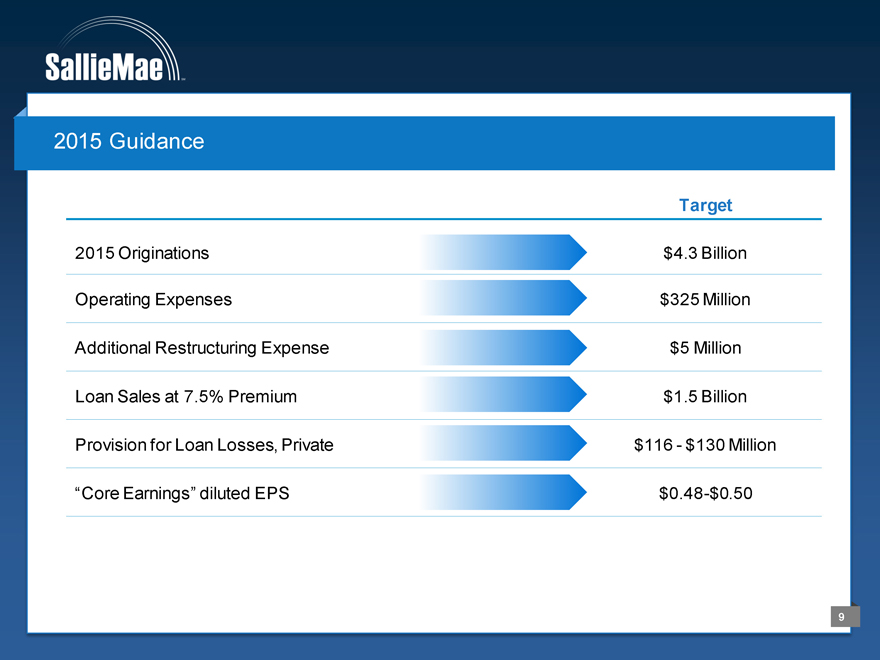
2015 Guidance
Target
2015 Originations $4.3 Billion
Operating Expenses $325 Million
Additional Restructuring Expense $5 Million
Loan Sales at 7.5% Premium $1.5 Billion
Provision for Loan Losses, Private $116—$130 Million
“Core Earnings” diluted EPS $0.48-$0.50
9
|
|
APPENDIX
10
|
|
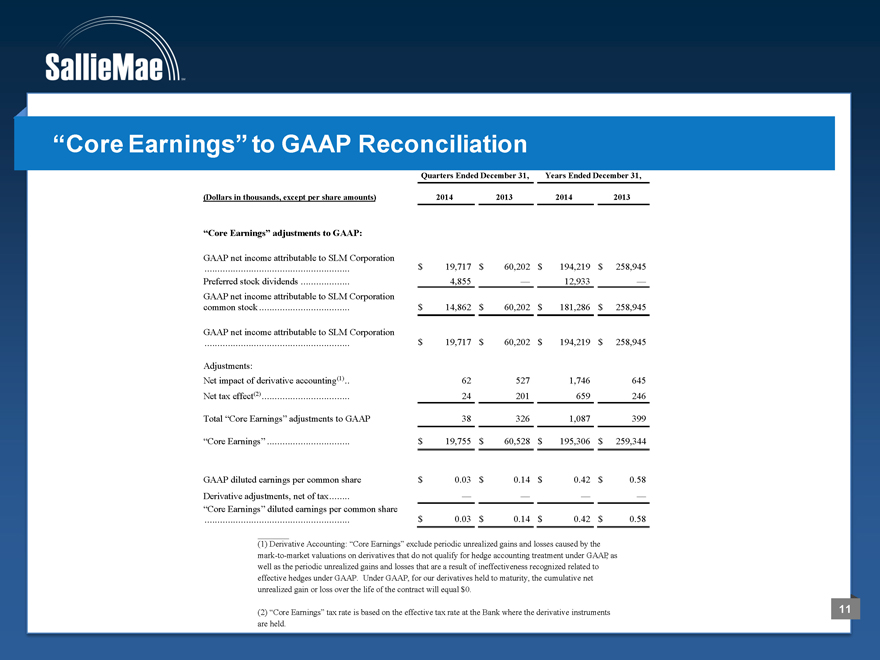
“Core Earnings” to GAAP Reconciliation
Quarters Ended December 31, Years Ended December 31,
(Dollars in thousands, except per share amounts) 2014 2013 2014 2013
“Core Earnings” adjustments to GAAP:
GAAP net income attributable to SLM Corporation
. $ 19,717 $ 60,202 $ 194,219 $ 258,945
Preferred stock dividends . 4,855 — 12,933 —
GAAP net income attributable to SLM Corporation
common stock . $ 14,862 $ 60,202 $ 181,286 $ 258,945
GAAP net income attributable to SLM Corporation
. $ 19,717 $ 60,202 $ 194,219 $ 258,945
Adjustments:
Net impact of derivative accounting(1). 62 527 1,746 645
Net tax effect(2). 24 201 659 246
Total “Core Earnings” adjustments to GAAP 38 326 1,087 399
“Core Earnings” . $ 19,755 $ 60,528 $ 195,306 $ 259,344
GAAP diluted earnings per common share $ 0.03 $ 0.14 $ 0.42 $ 0.58
Derivative adjustments, net of tax. — — — —
“Core Earnings” diluted earnings per common share
. $ 0.03 $ 0.14 $ 0.42 $ 0.58
(1) Derivative Accounting: “Core Earnings” exclude periodic unrealized gains and losses caused by the mark-to-market valuations on derivatives that do not qualify for hedge accounting treatment under GAAP, as well as the periodic unrealized gains and losses that are a result of ineffectiveness recognized related to effective hedges under GAAP. Under GAAP, for our derivatives held to maturity, the cumulative net unrealized gain or loss over the life of the contract will equal $0.
(2) “Core Earnings” tax rate is based on the effective tax rate at the Bank where the derivative instruments are held.
11