Attached files
| file | filename |
|---|---|
| 8-K - 8-K - PUBLIC SERVICE ENTERPRISE GROUP INC | d854764d8k.htm |
 Forward-Looking Statement
Certain of the matters discussed in this report about our and our subsidiaries' future
performance, including, without limitation, future revenues, earnings, strategies, prospects, consequences and all other statements that are
not purely historical constitute “forward-looking statements” within the meaning
of the Private Securities Litigation Reform Act of 1995. Such forward-looking statements are subject to risks and uncertainties, which could
cause actual results to differ materially from those anticipated. Such statements are based on
management's beliefs as well as assumptions made by and information currently available to management. When used herein, the
words “anticipate,” “intend,” “estimate,” “believe,”
“expect,” “plan,” “should,” “hypothetical,” “potential,” “forecast,” “project,” variations of such words and similar expressions are intended to identify forward-looking
statements. Factors that may cause actual results to differ are often presented with
the forward-looking statements themselves. Other factors that could cause actual results to differ materially from those contemplated in any
forward-looking statements made by us herein are discussed in filings we make with the
United States Securities and Exchange Commission (SEC), including our Annual Report on Form 10-K and subsequent reports on Form 10-
Q and Form 8-K and available on our website: http://www.pseg.com. These factors include,
but are not limited to: •
adverse changes in the demand for or the price of the capacity and energy that we sell into
wholesale electricity markets, •
adverse changes in energy industry law, policies and regulation, including market structures
and a potential shift away from competitive markets toward subsidized market
mechanisms, capacity market design, transmission planning and cost allocation rules, including
how transmission projects are planned and who is permitted to build transmission in the
future, and reliability standards, •
any inability of our transmission and distribution businesses to obtain adequate and timely
rate relief and regulatory approvals from federal and state regulators, • changes in federal and state environmental regulations and
enforcement that could increase our costs or limit our operations, • changes in nuclear regulation and/or general developments in the
nuclear power industry, including various impacts from any accidents or incidents experienced at our facilities or by others in the industry, that
could limit operations of our nuclear generating units,
•
actions or activities at one of our nuclear units located on a multi-unit site that might
adversely affect our ability to continue to operate that unit or other units located at the same site,
•
any inability to manage our energy obligations, available supply and risks,
•
adverse outcomes of any legal, regulatory or other proceeding, settlement, investigation or
claim applicable to us and/or the energy industry, •
any deterioration in our credit quality or the credit quality of our
counterparties, •
availability of capital and credit at commercially reasonable terms and conditions and our
ability to meet cash needs, •
changes in the cost of, or interruption in the supply of, fuel and other commodities necessary
to the operation of our generating units, •
delays in receipt of necessary permits and approvals for our construction and development
activities, •
delays or unforeseen cost escalations in our construction and development activities,
•
any inability to achieve, or continue to sustain, our expected levels of operating
performance, •
any equipment failures, accidents, severe weather events or other incidents that impact our
ability to provide safe and reliable service to our customers, and any inability to obtain sufficient insurance coverage or
recover proceeds of insurance with respect to such events,
•
acts of terrorism, cybersecurity attacks or intrusions that could adversely impact our
businesses, •
increases in competition in energy supply markets as well as competition for certain
transmission projects, •
any inability to realize anticipated tax benefits or retain tax credits,
•
challenges associated with recruitment and/or retention of a qualified workforce,
•
adverse performance of our decommissioning and defined benefit plan trust fund investments and
changes in funding requirements, •
changes in technology, such as distributed generation and micro grids, and greater reliance on
these technologies, and •
changes in customer behaviors, including increases in energy efficiency, net-metering and
demand response. All of the forward-looking statements made in this report are
qualified by these cautionary statements and we cannot assure you that the results or developments anticipated by management will be realized or even if realized,
will have the expected consequences to, or effects on, us or our business prospects, financial
condition or results of operations. Readers are cautioned not to place undue reliance on these forward-looking statements in
making any investment decision. Forward-looking statements made in this report apply only
as of the date of this report. While we may elect to update forward-looking statements from time to time, we specifically disclaim
any obligation to do so, even if internal estimates change, unless otherwise required by
applicable securities laws. The forward-looking statements contained in this report
are intended to qualify for the safe harbor provisions of Section 27A of the Securities Act of 1933, as amended, and Section 21E of the Securities Exchange Act of 1934,
as amended.
2
Exhibit 99 |
 3
GAAP Disclaimer
These materials and other financial releases can be found on the
pseg.com
website under the investor tab, or at http://investor.pseg.com/
PSEG presents Operating Earnings in addition to its Net Income reported in
accordance with accounting principles generally accepted in the United
States (GAAP). Operating Earnings is a non-GAAP financial measure
that differs from Net Income because it excludes gains or losses
associated with Nuclear Decommissioning Trust (NDT),
Mark-to-Market (MTM) accounting, and other material one-time
items. PSEG presents Operating Earnings because management believes that
it is appropriate for investors to consider results excluding these
items in addition to the results reported in accordance with GAAP. PSEG
believes that the non-GAAP financial measure of Operating Earnings
provides a consistent and comparable measure of performance of its
businesses to help shareholders understand performance trends. This
information is not
intended to be viewed as an alternative to GAAP information.
The last slides in this presentation include a list of items excluded from Net
Income to reconcile to Operating Earnings, with a reference to those
slides included on each of the slides where the non-GAAP information
appears. |
 8
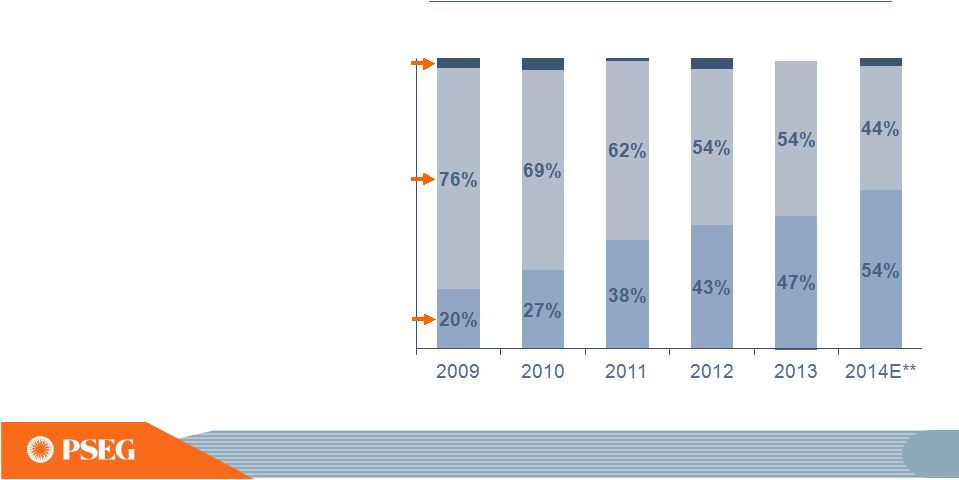
Operating Earnings Mix
Long term investment program has driven increased earnings
contribution from stable, regulated business
*SEE SLIDE A FOR ITEMS EXCLUDED FROM INCOME FROM
CONTINUING OPERATIONS/ NET INCOME TO RECONCILE TO OPERATING EARNINGS;
DISCONTINUED OPERATIONS REFLECT TEXAS.
E=ESTIMATE
**
2014
PERCENTS
USE
MIDPOINT
OF
EARNINGS
GUIDANCE.
Power’s
diverse fuel mix
and dispatch flexibility
continues to generate
earnings and free cash flow
PSE&G’s
investment
in
transmission has
diversified its asset base
and, coupled with other
investments
and cost controls,
supported compound
annual earnings growth of
~18% over 2009 –
2013
Operating Earnings* Contribution by Subsidiary (%)
PSE&G
Power
Other
$2.44
$2.58
$2.60 -
$2.75E
$3.12
$2.74
$3.09 |
 PSEG –
Year to Date 2014 Highlights
Operating Earnings YTD up 9% to $2.27 per share from $2.09 for YTD 2013
PSE&G on track to record double-digit growth in earnings on expanded
capital investment program
PSEG Power expected to earn at upper level of expectations for the full year
Narrowed 2014 full–year, operating earnings guidance to
$2.60-$2.75 per share, from $2.55-$2.75 per share prior
Executing on our capital program
Replacement of PSE&G’s gas cast-iron pipe underway as part of $1.22
billion Energy Strong capital program
Major transmission projects under $6.8 billion capital program are
on-time and on-budget
Market developments
PJM proposed changes to its Reliability Price Model, Demand Curve Adjustment
and pending Demand Response (DR) issues supportive of price formation
13 |
 14
SEE SLIDE A FOR ITEMS EXCLUDED FROM INCOME FROM CONTINUING
OPERATIONS/NET INCOME TO RECONCILE TO OPERATING
EARNINGS. E = ESTIMATE.
$2.44
$2.58
$2.60 -
$2.75E
2014 operating earnings guidance narrowed; forecast full-year at upper
end of range, assuming normal weather and unit operations for rest of
year PSEG –
2014 Another Year of Growth |
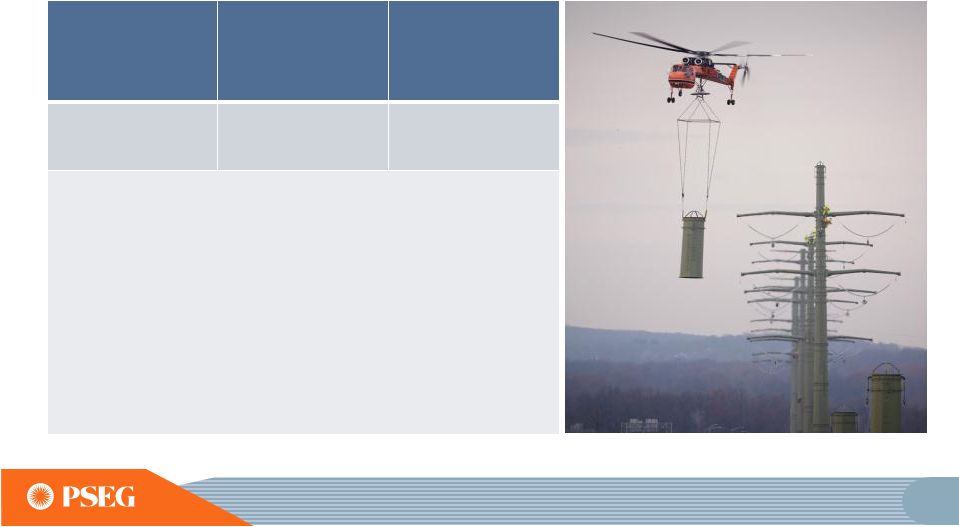 Susquehanna-Roseland consists of constructing
150 miles of 500kV circuit (46 miles in NJ) with two new 500kV
GIS switching stations at Roseland and Hopatcong
Project
Estimate
Up To*
Through
Year-end 2013
Expected
In-service Date
$790M
$661M
Phase 1 –
Completed
Phase 2 –
June 2015
•
PJM RTEP project b0489
•
ROE of 12.93% (including 1.25% incentive)
•
100% CWIP in rate base during development
•
100% recovery of prudently incurred costs due to abandonment
Customer Benefit: Improves reliability and reduces congestion
Project Status: The eastern part of line from Hopatcong to
Roseland, NJ in service April 2014; NJ construction phase completed in
2014. PA portion outside plant construction in progress.
Western portion in NJ
and the PA portion is planned to go in service June 2015.
*PROJECT IS SHARED WITH PPL. PROJECT ESTIMATE REPRESENTS PSE&G’S
CONSTRUCTION RESPONSIBILITY FOR THE NJ PORTION.
33 |
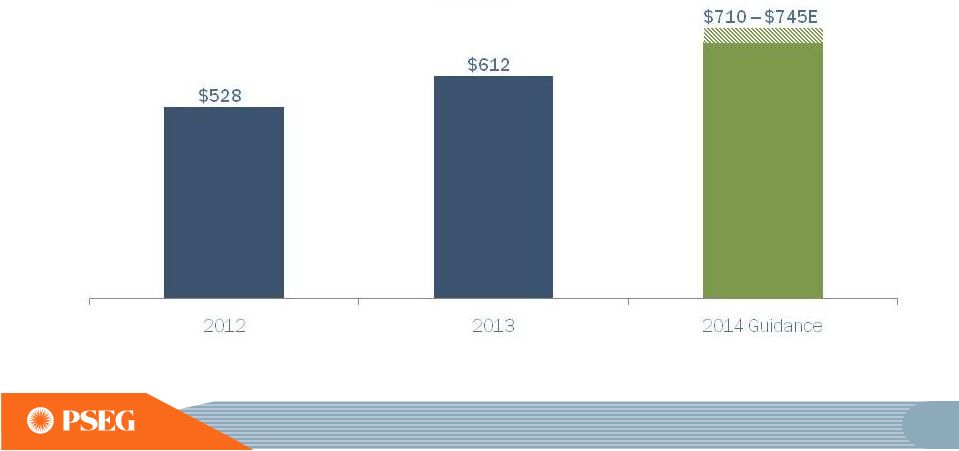 42
PSE&G’s
2014
operating
earnings
to benefit from increased investment in transmission and
on-going cost control
*SEE SLIDE A FOR ITEMS EXCLUDED FROM NET INCOME TO RECONCILE TO
OPERATING EARNINGS. E =ESTIMATE. DATA AS OF MARCH 31, 2014.
PSE&G Operating Earnings*
($ Millions) |
 PSEG was selected to operate Long Island Power
Authority’s (LIPA) electric transmission and distribution system
for 12 years starting in 2014
Pursuant
to
the
Operating
Services
Agreement
(OSA),
all
expenses
and
capital costs to operate the system are pre-funded by LIPA and passed
through to their customers
Compensation consists of a fixed fee and an incentive fee
Fixed compensation fee for 2014 with scheduled increases in 2015
and 2016
PSEG Energy Resources and Trading (ER&T) began managing LIPA’s
fuel/energy contracts on January 1, 2015
PSEG Long Island expected to contribute $0.03 to operating earnings in 2014
increasing to $0.07 per share in 2016 including contribution at
ER&T Potential for an 8-year extension of the OSA
44 |
 Financial
Strength
Disciplined
Investment
Operational
Excellence
•
Maximize value of existing generating
plants through implementation of the
Operational Excellence Model (OEM)
•
Workforce engagement and development
•
Deliver on Business Plan Commitments
•
Maintain competitive markets and improve
constituent
communication on issues
important to Power
•
Successfully complete the Advanced
Gas Path (AGP)
uprates •
Seek new opportunities in target
markets (PJM, ISO-NE,
NYISO) •
Develop our renewables business (solar)
•
Maintain new nuclear option by successfully
managing the Early Site Permit (ESP) process
PSEG Power Delivering on priorities
•
OEM implemented and
achieving measures
•
Resource sharing program
initiated
•
Exceeded earnings guidance
in 2013
•
Ongoing effort in key markets
showing success
•
Successful court outcome
against subsidized generation
•
Accelerated schedule for
AGP to maximize opportunity
•
LIPA contract for fuel and generation
dispatch began January 1, 2015
•
New Rockfish solar project brings
Solar Source’s portfolio to 123 MW
•
Nuclear ESP is expected in 2015
49 |
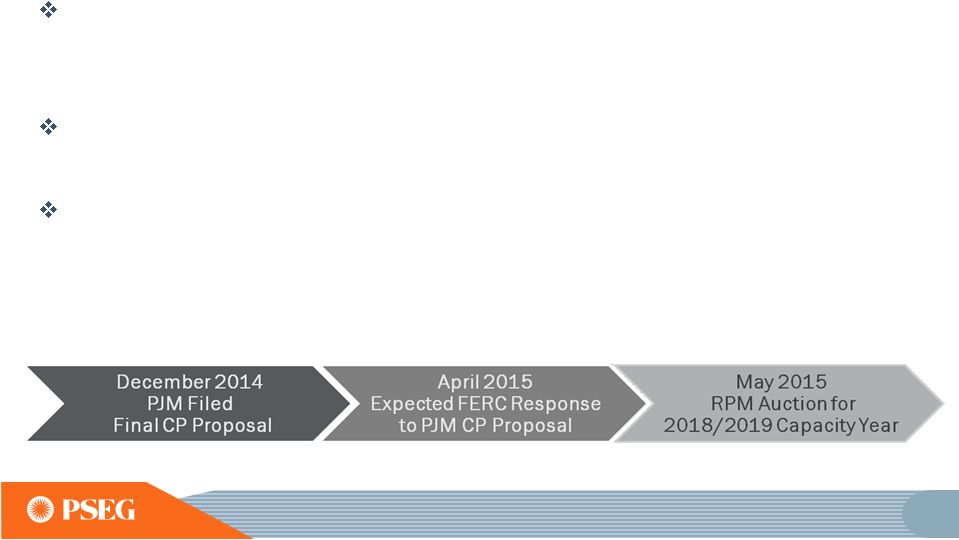 PJM Capacity Performance Proposal:
aims to increase electric supply reliability
Capacity
performance
(CP)
proposal
places
emphasis
on
reliability
given
observed
outages
during
times
of
extreme
weather
stress
and
anticipated
retirements;
Imposition
of
higher
penalty
structure
to
encourage
availability
Elimination
of
2.5%
holdback,
making
all
capacity
resources
annual
products,
net
CONE
bidding
safe
harbor,
and
the
change
in
the
demand
curve
(VRR)
support
price
formation
and
improve
resource
adequacy
80
Generator
availability/flexibility
is
key
objective
for
units
with
secure
fuel
supply
capable
of
meeting
operating
standards |
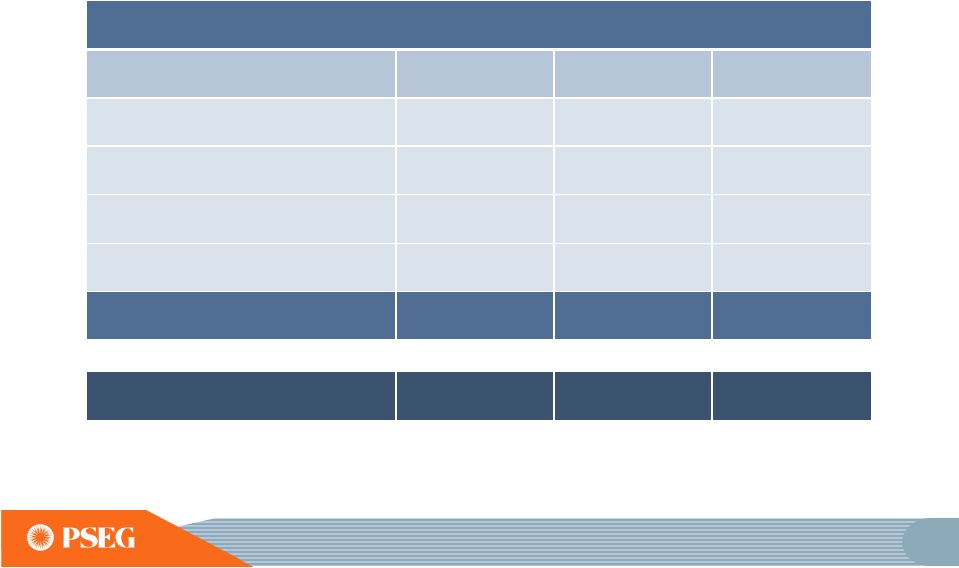 92
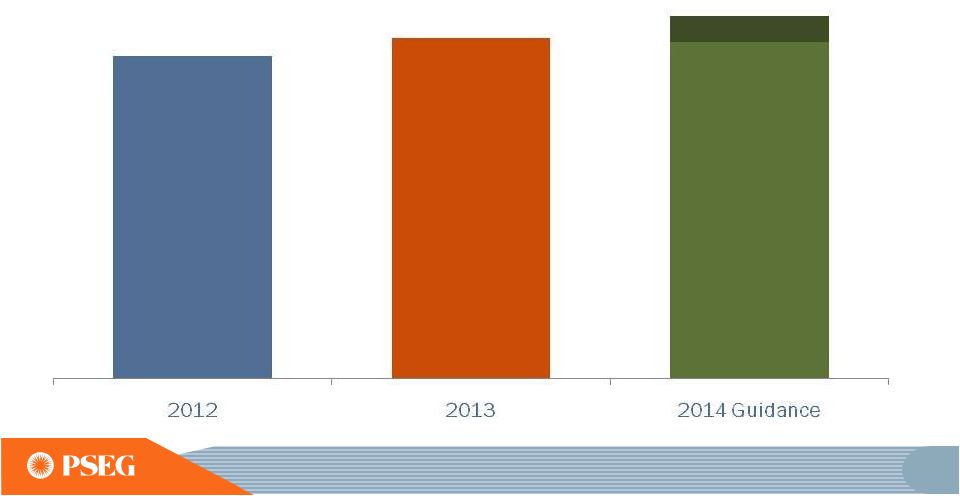
Improving Operating Earnings
and increased contribution from PSE&G
PSEG Operating Earnings
$ Millions (except EPS)
2012
2013
2014E
PSE&G
$528
$612
$710 -
$745
PSEG Power
$663
$710
$575 -
$610
Enterprise/Other
$45
($13)
$35 -
$40
Operating Earnings*
$1,236
$1,309
$1,320 -
$1,395
Operating EPS*
$2.44
$2.58
$2.60 -
$2.75
Regulated % of Earnings
43%
47%
53% -
54%
*SEE SLIDE A FOR ITEMS EXCLUDED FROM INCOME FROM CONTINUING
OPERATIONS/NET INCOME TO RECONCILE TO OPERATING EARNINGS. NOTE:
2012 OPERATING EARNINGS RE-STATED FOR TRANSFER OF ASSETS FROM PSEG HOLDINGS TO PSEG POWER.
E=ESTIMATE. |
 PSEG’s longer-term outlook is influenced by
Power’s hedge position and increased investment at
PSE&G 2015E
2016E
Each $0.75/mcf Change in Natural Gas
Each $2/MWh Change in Spark Spread
Each $5/MWh Change in Dark Spread
Each 1% Change in Nuclear Capacity Factor
Segment EPS Drivers
Each $100 Million of Incremental Investment
Each 1% Change in Sales
Electric
Gas
Each 1% Change in O&M
Each 20 basis point Change in Distribution ROE
Each 20 basis point Change in Transmission ROE
$0.01
$0.01
$0.01
$0.01
$0.01
$0.01
$0.07-$0.10
$0.05
$0.04
$0.01
$0.00-$0.02
$0.05
$0.02
$0.01
$0.01
$0.01
$0.01
$0.01
$0.01
$0.01
Sensitivities derived from typical annual market variability*
*
Estimated
annual
variability
approximating
one
standard
deviation
based
on
2011
–
2013
historical
data
and
forward
curve estimates applied to PSEG Power open positions.
E = ESTIMATE. POWER EARNINGS SENSITIVITIES UPDATED FOR
OCTOBER 31, 2014 PRICE CURVES. 94
|
 A
Items Excluded from Income from Continuing
Operations/Net Income to Reconcile to Operating Earnings
PLEASE
SEE
PAGE
3
FOR
AN
EXPLANATION
OF
PSEG’S
USE
OF
OPERATING
EARNINGS
AS
A
NON-GAAP
FINANCIAL
MEASURE
AND
HOW
IT
DIFFERS
FROM
NET
INCOME.
2013
2012
2011
2010
2009
2008
Earnings Impact ($ Millions)
Operating Earnings
1,309
$
1,236
$
1,389
$
1,584
$
1,567
$
1,478
$
Gain (Loss) on Nuclear Decommissioning Trust (NDT)
Fund Related Activity (PSEG Power)
40
52
50
46
9
(71)
Gain (Loss) on Mark-to-Market (MTM)
(a)
(PSEG Power)
(74)
(10)
107
(1)
(11)
14
Lease Transaction Activity (PSEG Enterprise/Other)
-
36
(173)
-
29
(490)
Storm O&M (PSEG Power)
(32)
(39)
-
-
-
-
Market Transition Charge Refund (PSE&G)
-
-
-
(72)
-
-
Gain (Loss) on Asset Sales and Impairments (PSEG Enterprise/Other)
-
-
34
-
-
(13)
Income from Continuing Operations
1,243
$
1,275
$
1,407
$
1,557
$
1,594
$
918
$
Discontinued Operations
-
-
96
7
(2)
270
Net Income
1,243
$
1,275
$
1,503
$
1,564
$
1,592
$
1,188
$
Fully Diluted Average Shares Outstanding (in Millions)
508
507
507
507
507
508
Per Share Impact (Diluted)
Operating Earnings
2.58
$
2.44
$
2.74
$
3.12
$
3.09
$
2.91
$
Gain (Loss) on NDT Fund Related Activity (PSEG Power)
0.08
0.10
0.10
0.09
0.02
(0.14)
Gain (Loss) on MTM
(a)
(PSEG Power)
(0.14)
(0.02)
0.21
-
(0.02)
0.03
Lease Transaction Activity (PSEG Enterprise/Other)
-
0.07
(0.34)
-
0.05
(0.96)
Storm O&M (PSEG Power)
(0.07)
(0.08)
-
-
-
-
Market Transition Charge Refund (PSE&G)
-
-
-
(0.14)
-
-
Gain (Loss) on Asset Sales and Impairments (PSEG Enterprise/Other)
-
-
0.06
-
-
(0.03)
Income from Continuing Operations
2.45
$
2.51
$
2.77
$
3.07
$
3.14
$
1.81
$
Discontinued Operations
-
-
0.19
0.01
-
0.53
Net Income
2.45
$
2.51
$
2.96
$
3.08
$
3.14
$
2.34
$
For the Year Ended
December 31,
(Unaudited)
Reconciling Items, net of tax
(a)
Includes the financial impact from positions with forward delivery
months. PUBLIC SERVICE ENTERPRISE GROUP INCORPORATED
|