Attached files
| file | filename |
|---|---|
| EX-32.2 - CERTIFICATION - Hydrogen Future Corp | hfco_ex322.htm |
| EX-32.1 - CERTIFICATION - Hydrogen Future Corp | hfco_ex321.htm |
| EX-31.2 - CERTIFICATION - Hydrogen Future Corp | hfco_ex312.htm |
| EX-31.1 - CERTIFICATION - Hydrogen Future Corp | hfco_ex311.htm |
| EXCEL - IDEA: XBRL DOCUMENT - Hydrogen Future Corp | Financial_Report.xls |
UNITED STATES SECURITIES AND EXCHANGE COMMISSION
Washington, D.C. 20549
FORM 10-K
(Mark One)
þ ANNUAL REPORT PURSUANT TO SECTION 13 OR 15(d) OF THE SECURITIES EXCHANGE ACT OF 1934
For the fiscal year ended September 30, 2014
OR
o TRANSITION REPORT PURSUANT TO SECTION 13 OR 15(d) OF THE SECURITIES EXCHANGE ACT OF 1934
For the transition period from __________ to ______________
Commission File Number 000-55153
HYDROGEN FUTURE CORP.
(Exact name of registrant as specified in its charter)
|
Nevada
|
20-5277531
|
|
|
State or other jurisdiction of incorporation or organization
|
( I.R.S. Employer Identification no.)
|
| 2525 Robinhood Street, Suite 1100 | ||
| Houston, TX | 77005 | |
| (Address of principal executive offices) | (zip code) |
(713) 465-1001
(Registrant’s telephone number, including area code)
Securities registered under Section 12(b) of the Exchange Act: None
Securities registered pursuant to Section 12(g) of the Exchange Act:
Common Stock, $0.001 Par Value
(Title of class)
Indicate by check mark if the registrant is a well-known seasoned issuer, as defined in Rule 405 of the Securities Act. Yes o No þ
Indicate by check mark if the registrant is not required to file reports pursuant to Section 13 or 15 (d) of the Exchange Act Yes o No þ
Indicate by check mark if the registrant (1) has filed all reports required to be filed by Section 13 or 15(d) of the Exchange Act during the preceding 12 months (or for such shorter period that the registrant was required to file such reports), and (2) has been subject to such filing requirements for the past 90 days. Yes þ No o
Indicate by check mark whether the registrant has submitted electronically and posted on its corporate Website, if any, every Interactive Date File required to be submitted and posted pursuant to Rule 405 of Regulation S-T (§229.405 of this chapter) during the preceding 12 months (or such shorter period that the registrant was required to submit and post such files). Yes þ No o
Indicate by check mark if there is no disclosure of delinquent filers in response to Item 405 of Regulation S-B is not contained in this form, and will not be contained, to the best of the Registrant's knowledge, in definitive proxy or information statements incorporated by reference in Part III of this Form 10-K or any amendment to this Form 10-K. þ
Indicate by check mark whether the registrant is a large accelerated filer, an accelerated filer, a non-accelerated filer, or a small reporting company. See the definitions of “large accelerated filer” and “smaller reporting company” in Rule 12b-2 of the Exchange Act.
|
Large accelerated filer
|
o |
Accelerated filer
|
o |
|
Non-accelerated filer
|
o |
Smaller reporting company
|
þ |
| (Do not check if a smaller reporting company) | |||
Indicate by check mark whether the registrant is a shell company (as defined in Rule 12b-2 of the Exchange Act). Yes o No þ
The aggregate market value of the voting stock held by non-affiliates of the registrant on January 21, 2015, (computed by reference to the price of such stock on such date) was approximately $145,000.
The number of shares of common stock issued and outstanding as of January 21, 2015: 9,941,744 shares
TABLE OF CONTENTS
|
Page
|
|||
|
PART I
|
|||
|
Item 1.
|
Business.
|
3
|
|
|
Item 1A.
|
Risk Factors.
|
8
|
|
|
Item 1B.
|
Unresolved Staff Comments.
|
18
|
|
|
Item 2.
|
Properties.
|
18
|
|
|
Item 3.
|
Legal Proceedings.
|
18
|
|
|
Item 4.
|
Mine Safety Disclosures.
|
18
|
|
|
PART II
|
|||
|
Item 5.
|
Market for Registrant’s Common Equity, Related Stockholder Matters and Issuer Purchases of Equity Securities.
|
19
|
|
|
Item 6.
|
Selected Financial Data.
|
19
|
|
|
Item 7.
|
Management’s Discussion and Analysis of Financial Condition and Results Of Operations.
|
19
|
|
|
Item 7A.
|
Quantitative And Qualitative Disclosures About Market Risk.
|
24
|
|
|
Item 8.
|
Financial Statements and Supplementary Data.
|
24
|
|
|
Item 9.
|
Changes in and Disagreements With Accountants on Accounting and Financial Disclosure.
|
24
|
|
|
Item 9A.
|
Controls and Procedures.
|
24
|
|
|
Item 9B.
|
Other Information.
|
25
|
|
|
PART III
|
|||
|
Item 10.
|
Directors, Executive Officers and Corporate Governance.
|
26
|
|
|
Item 11.
|
Executive Compensation.
|
27
|
|
|
Item 12.
|
Security Ownership of Certain Beneficial Owners and Management and Related Stockholder Matters.
|
28
|
|
|
Item 13.
|
Certain Relationships and Related Transactions, and Director Independence.
|
29
|
|
|
Item 14.
|
Principal Accounting Fees and Services.
|
29
|
|
|
PART IV
|
|||
|
Item 15.
|
Exhibits, Financial Statement Schedules.
|
30
|
|
2
PART I
ITEM 1. BUSINESS.
Company History
We were incorporated in the State of Nevada on June 21, 2006, as El Palenque Nercery, Inc. On June 30, 2006, we changed our name to El Palenque Vivero, Inc., and on March 23, 2010, we changed our name to A5 Laboratories Inc. On April 8, 2010, we effectuated a forward split of our issued shares of common stock on the basis of 10-for-1. On October 10, 2013, we changed our name to Hydrogen Future Corporation. On December 27, 2013, our stock trading symbol was changed from AFLB.OB to HFCO.OB, and on January 27, 2015, we effectuated a reverse split of our common stock on a 1:500 basis . On April 21, 2014, the Company completed the acquisition of Hydra Fuel Cell Corporation (“Hydra”) from American Security Resources Corporation (Pink Sheets: ARSC). On January 12. 2015, we effectuated a reverse split of our common stock on a 1:250 basis. Hydra has developed advanced hydrogen fuel cell technology which it initially intends to deploy as residential and small commercial grid replacement for electric generation. Our business offices are located at 2525 Robinhood Street, Suite 1100, Houston TX and our telephone number is (713) 465-1001.
Principal Services, Markets and Operations
Hydrogen Future Corporation (the “Company” or HFCO) is a holding company with one wholly owned subsidiary, Hydra Fuel Cell Corporation (“Hydra”), and one division, involved with contract research and laboratory services. The contract research and laboratory services division is currently inactive.
Hydra
Principal Services
Hydra is a state-of-the-art provider of alternative energy solutions using fuel cell technology. Hydra has completed several development stages of its HydraStax® unit and testing for certification is currently underway. Hydra is developing technologies to formulate hydrogen that we hope will change the economics of producing hydrogen sufficiently to enable the hydrogen economy. We believe that the HydraStax® unit's cost per kilowatt hour (kWh) will be significantly below that of its competitors, giving us a competitive edge as a replacement for residential grid power. Thus, upon certification Hydra intends to aggressively market these units and the Company is actively pursuing financing to begin manufacturing and distribution.
On April 21, 2014, Hydrogen Future Corporation (OTCQB: HFCO) completed the acquisition of Hydra Fuel Cell Corporation (“Hydra”) from American Security Resources Corporation (Pink Sheets: ARSC).
Under the agreement to acquire Hydra, HFCO acquired 100% of the common stock of Hydra in exchange for a convertible preferred share issued to ARSC. The preferred share is convertible into an amount equal to 100.2% of the then outstanding common stock of HFCO at the time of conversion, which is at the sole discretion of ARSC. This gives ARSC an effective 50.1% equity interest in HFCO.
The Company continues to review acquisition opportunities that would enhance its fuel cell offerings and expand its offerings in alternative energy production.
Markets
Global power demand is increasing in response to growing populations, greater urban density, and lifestyles that increasingly revolve around power consuming devices. Central generation and its associated transmission and distribution grid is difficult to site, costly, and generally takes many years to build. Some types of power generation that were widely adopted in the past such as nuclear power or coal-fired power plants are no longer welcome in certain regions. The cost and impact to public health and the environment of pollutants and greenhouse gas emissions impacts the siting of new power generation. The attributes of fuel cell power plants address these challenges by providing virtually emission-free power and heat at the point of use in a highly efficient process.
3
Fuel Cell Operations
Hydra Fuel Cell Corporation engages in the design, development, manufacture, and sale of hydrogen fuel cell products, primarily for stationary power, backup power, and distributed generation applications. Hydra delivers fuel cells and fuel cell systems under the HydraStax® brand, which we believe are very price and feature competitive. The Company is in the process of developing its first prototype and is currently looking to market its product.
Contract Research and Laboratory Services
Principal Services
Currently, the Contract Research and Laboratory Servieces division is inactive. If we reinstate operations, we plan to offer a full range of testing services to the pharmaceutical industry in a variety of fields, all in compliance with Good Laboratory Practices (GLP) and current Good Manufacturing Practices regulations (camp) through in-house and outsourcing arrangements. The comprehensive services we provide help to expedite the development process by providing immediate resources and technical expertise to help our clients meet deadlines, pursue projects of varying priority and risk, handle changes in workload, handle multiple projects, and pursue developments without in-house resources. Our Custom Research Organization (CRO) services can be divided into two sections: Analytical and Quality Assurance.
Analytical
We plan to offer a wide range of analytical services to support a client’s quality control, product development, method development, validation and marketed product activities. We are able to provide quantitative and qualitative, as well as consulting and analytical services, in chemistry, microbiology and chromatography to the pharmaceutical, biotechnology and cosmetics industries. At our facility, we are able to perform a wide variety of quality control tests on raw materials as well as finished products. We also offer a full range of ICH stability conditions and provide total stability management. In addition, we can develop and validate new methods, revalidate existing methods to ensure compliance with current regulatory requirements and perform technology transfers.
These services can be broken down as follows:
| Analytical Services | ||||
|
Stability Testing and Storage (I.C.H. and Custom Conditions)
|
Method Developments and Validation
|
Microbiological Testing
|
||
|
Pharmaceutical Synthesis
|
Drug Substance Testing
|
Reverse Engineering
|
||
|
Formulation Development
|
Validated Secondary Standard
|
|||
|
Consulting Services
|
||||
|
Quality Audits
|
Submission Support and Documentation
|
GLP and GMP Audit and Inspection
|
|
Testing Capabilities
|
||||
|
Chromatography
|
H.P.L.C.
|
G.C.
|
||
|
Chiral H.P.L.C.
|
T.L.C.
|
Semi-Prep L.C.
|
||
|
USP and Compendial Testing
|
UV-VIS Spectrophotometry
|
Polarimetry
|
||
|
Atomic Absorption Spectrophotometry (AA)
|
Fourier Transform Infrared Spectrophotometry (FTIR)
|
Dissolution/Disintegration Physical Testing
|
4
|
Microbiological Analysis Services
|
||||
|
Antibiotic Assays
|
Stability Testing
|
Sample Collection
|
||
|
Finished Product and Raw Material Testing
|
Manufacturing Validation Support
|
Method Development and Validation
|
|
Micro Testing Capabilities
|
||||
|
Speciation (MIDI GC, API, Biochemical Tests)
|
BI Verification (Titer and Organism ID)
|
Compendial Testing (USP, CFR, SP, EP, JP, and BP)
|
||
|
Bacterial Endotoxin Testing (LAL: Gel Clot and Kinetic)
|
Container/Closure Testing (Dye, Ingression Microbial Ingression)
|
Antimicrobial Preservative Efficacy
|
||
|
Sterility Testing
|
Bioburden Testing
|
Cleaning Validation
|
||
|
Antibiotic Assay
|
Filter Retention Testing
|
Microbial Limits Testing
|
||
|
Dose Audits of Sterile Fill Areas
|
Environmental Monitoring
|
Quality Assurance and Support Services
We will also provide various support services via which clients receive quality testing data on their products through compliance with Good Laboratory Practices (GLPs) and Good Manufacturing Practices (GMPs). The Quality Assurance department independently audits and tracks every project to assure accurate and reliable results. Every report includes a Quality Assurance Letter verifying and qualifying data and compliance, which completes the audit trail. We can prepare or help our customer to obtain all regulatory authorization to import and distribute their pharmaceutical product via getting D.I.N ( drug identification Number) or nutraceuticals products via getting N.P.N (natural product Number) from Health Canada.
Interferon
The normal function of the immune system is essential for health, and dysfunction of the immune system leads to a wide diversity of diseases. Deficiency of immune cell production or defective immune cell function can lead to a spectrum of immunodeficiency diseases. Over-activity of various components of the immune system leads to the development of allergic or autoimmune diseases. Leukemia and lymphoma are the result of malignant transformation in cells of the immune system. Cytokines are soluble mediators acting as cell-to-cell messengers in the immune system. They are critical for normal immune system function, and their expression may be perturbed in disease states. They are involved in the regulation of the growth, development, and activation of immune system cells and the mediation of the inflammatory response. In general, cytokines are pleotropic in that they are capable of acting on many different cell types. This pleotropism results from the presence of receptors for the same cytokine on multiple cell types, leading to the formation of “cytokine networks.”
Interferons (IFNs) are cytokines that exhibit a broad spectrum of immune-modulating and anti-proliferative properties. Alpha (leukocyte) IFN-a is made by white blood cells; beta (fibroblast) IFN-b is made by skin cells and gamma (immune) IFN-g is made by lymphocytes after stimulation by antigen. IFNs are not species-specific. IFNs are coded by three distinct cell genes; they have important differences in amino acid sequence, stimulus for induction, producer cell and role in the body. The active substance is not IFN itself, but proteins that IFN causes to be produced by other cells of the immune system.
5
Interferon-gamma is produced by stimulated T-lymphocytes (CD4+ and CD8+) and natural killer (NK) cells (both components of the immune system) in response to infection and antigenic challenge. IFN-gamma shows little structural relationship to IFN-alpha and IFN-beta. IFN-gamma has antiviral and antiproliferative properties and several biological actions not shared with the other interferons. It alone is a potent activator of macrophages and neutrophils, enhancing the production of reactive oxygen species and the killing of microbacterial, fungal and protozoan pathogens. Another important difference is its role as a primary mediator of the immune response. Cytokines such as IFN-gamma play an essential role in the mechanisms of immunity. When the host is challenged with a pathogen, cytokines are synthesized in situ and it is the influence of these cytokines on the other cells of the immune system, which contributes towards development of immunity to that pathogen.
We have acquired proprietary technology from Vida Nutra Pharma Inc., for cost effective gamma interferon (IFN-g) production technology. The application of human gamma interferon in immune-based therapy has potential therapeutic applications in cancers, chronic hepatitis B, opportunistic infections in HIV patients, antibiotic resistant bacterial and fungal infections, parasite infections, sepsis, and diabetes. Interferon (IFN)-gamma is a soluble protein produced by immune cells in response to infection and antigenic challenge. IFN-gamma has antiviral and antiproliferative properties and is a potent activator of macrophages and neutrophils, enhancing killing of microbacterial, fungal and protozoan pathogens.
We have not yet created sufficient IFN-gamma to effectively test it across a large enough animal or human population to generate any meaningful data on the efficacy of IFN-gamma as a treatment method.
A large number of experimental and clinical data indicate a wide spectrum of disease states that are potentially amenable to IFN-gamma treatment. In several of the diseases, IFN-gamma immune-based therapy is in phase II or III clinical trials. Recombinant IFN-gamma immune-based therapy has been approved for clinical therapy of three rare diseases. The major hurdle to overcome in IFN-gamma treatment is the cost of dosages that can easily run into tens of thousands of dollars for a single treatment. Cost has been the limiting factor in the expansion of recombinant IFN-gamma to clinical settings treating major diseases, and we believe that our technology may be able to significantly lower this cost, by a factor of 10 to 1 or even 100 to 1 by the application of our interferon production technology. We intend to focus on production of natural human gamma interferon for clinical trials and therapeutics if we are able to prove efficacy and efficiency, we expect to commercialize our product.
Gamma interferons are manufactured commercially in three ways: by genetic engineering, by cell culture, and from human white blood cells. In the United States, only one type of gamma interferon is approved for commercial sale: Actimmune, which is a recombinant form of human IFN-gamma and is produced in E. coli bacteria.
The critical step in the production of natural IFNs involves activation by inducers to stimulate IFNs secretion in spleen cells. In the past, inducers used for stimulating IFN secretion were toxic agents such as bacterial endotoxins, plant lectins (ConA, PHA), as well as viruses and the issue of safety was one of the main factors that limited clinical application of natural IFNs.
Markets, Customers and Distribution
Contract Research and Laboratory Services
The drug development process is a lengthy, expensive activity monitored and regulated by a number of governing bodies. The identification of any new drug candidate involves proving its safety and efficacy through a series of prescribed laboratory experiments and tests including safety and biological activity testing. The drug industry has been under increasing pressure from managed care, industry consolidation and competition, and globalization to increase annual output of new products and conduct the research in a more cost-effective and time-efficient manner. The increasing pressure from managed care and industry competition will continue forcing sponsors to expand their outsourcing to contract research organizations. Stricter regulatory requirements both in the United States and abroad have also made CROs a more attractive alternative to in-house testing and management.
Market situation appraisal for CRO indicates a market size of approximately $190 - 230 million for the United States.
We provide services to a diverse client base consisting of emerging pharmaceutical companies, biotechnology companies, large pharmaceutical companies, specialty pharmaceuticals, drug delivery companies, and generics.
Interferon
Thus far, IFN-gamma has been recognized as clinically effective in the prophylaxis of chronic granulomatous disease, as adjunctive treatment in at least one systemic intracellular infection, visceral leishmaniasis and in treatment of osteopretosis. However, we believe that IFN-gamma treatment can prove to be effective in all types of diseases ranging from cancer, viral infections, sepsis, AIDS and diabetes.
Many of the infectious diseases listed affect large segments of the world population and could benefit from IFN-gamma as both first line therapy or as an adjunct therapy in restoring proper immune system function.
6
Actimmune, a recombinant human IFN-gamma currently approved for IFN-gamma immunotherapy is expensive - ~ 3x10 6 IFN Units or 100 micrograms cost $470 US (Sigma catalogue # I1520). In chronic hepatitis B, for instance, treatment of a single patient requires 150 micrograms per day for 4 weeks and costs $19,740 US. Treating 1000 patients would then cost ~ $20 million US. Cost reductions as function of number of patients to be treated can be envisaged, however even a two-fold reduction would make little difference in the cost of treating large number of chronic hepatitis B sufferers. This same rationale applies to many of the diseases that are potentially susceptible to IFN-gamma immunotherapy and currently limits the use of IFN-gamma - making it at best a second line therapy.
Current production of natural human IFN-gamma from 5 kg of spleen cells obtained from 10-20 human donors will yield 3X10 9 IFN Units of IFN-gamma or 10 6 doses. Based on the site visit, cost of production at laboratory scale can be set at $100,000 US for 10 6 doses, or $0.10 US per dose. However, this cost per dose will probably increase ten-fold when manufactured under GMP (Good Manufacturing Practice) conditions. The cost is then estimated at $1 US per dose when produced under GMP. Production scaled up 100 fold without further increase in cost is challenging but feasible.
We will attempt market penetration at reduced price structures of natural IFN-gamma with respect to Actimmune. Given the current number of infectious diseases as well as cancer, for which IFN-gamma immune-based therapy may be effective, we believe we will be able to find a market for our product if its efficacy is proven.
General Discussion
Intellectual Property
We have filed for a provisory patent with the U.S. patent office in order to preserve our natural gamma interferon technology (U.S. provisional Patent No. US 61-400719).
Research and Development
We did not incur any research and development expenses from our inception to September 30, 2014.
Government Regulations
We are not aware of any government regulations which would have a significant impact on our operations.
Environmental Regulations
We are not aware of any material violations of environmental permits, licenses or approvals that have been issued with respect to our operations. We expect to comply with all applicable laws, rules and regulations relating to our business, and at this time, we do not anticipate incurring any material capital expenditures to comply with any environmental regulations or other requirements.
While our intended projects and business activities do not currently violate any laws, any regulatory changes that impose additional restrictions or requirements on us or on our potential customers could adversely affect us by increasing our operating costs or decreasing demand for our products or services, which could have a material adverse effect on our results of operations.
Employees
As of January 21, 2015, we had 2 employees, both of which are engaged on a full time basis.
WHERE YOU CAN FIND MORE INFORMATION
You are advised to read this Form 10-K in conjunction with other reports and documents that we file from time to time with the SEC. In particular, please read our Quarterly Reports on Form 10-Q and Current Reports on Form 8-K that we file from time to time. You may obtain copies of these reports directly from us or from the SEC at the SEC’s Public Reference Room at 100 F. Street, N.E. Washington, D.C. 20549, and you may obtain information about obtaining access to the Reference Room by calling the SEC at 1-800-SEC-0330. In addition, the SEC maintains information for electronic filers at its website http://www.sec.gov.
7
Item 1A. Risk Factors.
This Annual Report contains forward-looking statements that involve risks and uncertainties. These statements can be identified by the use of forward-looking terminology such as “believes,” “expects,” “intends,” “plans,” “may,” “will,” “should,” or “anticipation” or the negative thereof or other variations thereon or comparable terminology. Actual results could differ materially from those discussed in the forward-looking statements as a result of certain factors, including those set forth below and elsewhere in this Annual Report. The following risk factors should be considered carefully in addition to the other information in this Annual Report.
RISK FACTORS
Risks Associated With Our Stock
Limited History
The Company is a startup with limited operating history and faces challenges typical of new businesses in highly competitive markets with many other providers of the same or essentially the same products and services.
No Revenue and Limited Resources
The Company has no revenues and limited resources to date. There is no assurance that the Company will be able to finance its development, or that the Company will be able profitably to operate such business.
Limited Staff
The Company has two officers charged with the responsibility of executing the Company’s business strategy. Any death, injury or other incapacity of one or more of them could adversely affect the Company’s ability to complete its business strategy.
If we fail to maintain an effective system of internal controls, we may not be able to accurately report our financial results or prevent fraud, which could harm our brand and operating results.
Effective internal controls are necessary for us to provide reliable and accurate financial reports and effectively prevent fraud. We have devoted significant resources and time to comply with the internal control over financial reporting requirements of the Sarbanes-Oxley Act of 2002. In addition, Section 404 under the Sarbanes-Oxley Act of 2002 requires that we assess, and that our auditors attest to, the design and operating effectiveness of our controls over financial reporting. Our compliance with the annual internal control report requirement for each fiscal year will depend on the effectiveness of our financial reporting and data systems and controls. Inferior internal controls could cause investors to lose confidence in our reported financial information, which could have a negative effect on the trading price of our stock and our access to capital.
Our results of operations could vary as a result of methods, estimates and judgments we use in applying our accounting policies.
The methods, estimates and judgments we use in applying our accounting policies have a significant impact on our results of operations. Such methods, estimates and judgments are, by their nature, subject to substantial risks, uncertainties and assumptions, and factors may arise over time that could lead us to reevaluate our methods, estimates and judgments.
As we gain experience in future periods, management will continue to reevaluate its estimates for contract margins, service agreements, loss reserves, warranty, performance guarantees, liquidated damages and inventory reserves. Changes in those estimates and judgments could significantly affect our results of operations and financial condition. We may also adopt changes required by the Financial Accounting Standards Board and the Securities and Exchange Commission.
Our stock price has been and could remain volatile.
The market price for our common stock has been and may continue to be volatile and subject to extreme price and volume fluctuations in response to market and other factors, including the following, some of which are beyond our control:
| ● |
failure to meet commercialization milestones;
|
|
| ● |
variations in our quarterly operating results from the expectations of securities analysts or investors;
|
|
| ● |
downward revisions in securities analysts’ estimates or changes in general market conditions;
|
|
| ● |
changes in the securities analysts' that cover us or failure to regularly publish reports;
|
|
| ● |
announcements of technological innovations or new products or services by us or our competitors;
|
8
| ● |
announcements by us or our competitors of significant acquisitions, strategic partnerships, joint ventures or capital commitments;
|
|
| ● |
additions or departures of key personnel;
|
|
| ● |
investor perception of our industry or our prospects;
|
|
| ● |
insider selling or buying;
|
|
| ● |
demand for our common stock; and
|
|
| ● |
general technological or economic trends.
|
In the past, following periods of volatility in the market price of their stock, many companies have been the subject of securities class action litigation. If we became involved in securities class action litigation in the future, it could result in substantial costs and diversion of management’s attention and resources and could harm our stock price, business prospects, results of operations and financial condition.
Provisions of Nevada law and of our charter and by-laws and our outstanding securities may make a takeover more difficult.
Provisions in our certificate of incorporation and by-laws and in Nevada corporate law may make it difficult and expensive for a third-party to pursue a tender offer, change in control or takeover attempt that is opposed by our management and board of directors. In addition, certain provisions of our Series A Preferred Shares and our Series B preferred stock could make it more difficult or more expensive for a third party to acquire us. Public stockholders who might desire to participate in such a transaction may not have an opportunity to do so. These anti-takeover provisions could substantially impede the ability of public stockholders to benefit from a change in control or change in our management and board of directors.
Future sales of substantial amounts of our common stock could affect the market price of our common stock.
Future sales of substantial amounts of our common stock, or securities convertible or exchangeable into shares of our common stock, into the public market, including shares of our common stock issued upon exercise of options, or perceptions that those sales could occur, could adversely affect the prevailing market price of our common stock and our ability to raise capital in the future.
The rights of the Series A preferred shares and Series B preferred stock could negatively impact our cash flows and could dilute the ownership interest of our stockholders.
The Series A shares are convertible into a combined 8% of the current outstanding shares of the Company.
The terms of the Series B preferred stock also provide rights to their holders that could negatively impact us. Holders of the Series B preferred stock are entitled to 50.1% of the voting rights of the Company.
9
Risks Related to our Hydra Subsidiary
We have incurred losses and anticipate continued losses and negative cash flow.
We have been transitioning from a research and development company to a commercial products manufacturer, and services provider and developer. As such, we have not generated positive cash flow. We expect to continue to incur net losses and generate negative cash flows until we can produce sufficient revenues to cover our costs. We may never become profitable. Even if we do achieve profitability, we may be unable to sustain or increase our profitability in the future. For the reasons discussed in more detail below, there are substantial uncertainties associated with our achieving and sustaining profitability. We have, from time to time, sought financing in the public markets in order to fund operations. Our future ability to obtain such financing, if required, could be impaired by a variety of factors, including, but not limited to, the price of our common stock and general market conditions.
Our products compete with products using other energy sources, and if the prices of the alternative sources are lower than energy sources used by our products, sales of our products will be adversely affected. Volatility of electricity and fuel prices may impact sales of our products and services in the markets in which we compete.
Our products can operate using a variety of fuels, including primarily natural gas and biogas and also methanol, diesel, coal gas, coal mine methane, and propane. If these fuels are not readily available or if their prices increase such that electricity produced by our products costs more than electricity provided by other generation sources, our products would be less economically attractive to potential customers. In addition, we have no control over the prices of several types of competitive energy sources such as oil, gas or coal as well as local utility electricity costs. Significant decreases (or short term increases) in the price of these fuels or grid delivered prices for electricity could also have a material adverse effect on our business because other generation sources could be more economically attractive to consumers than our products.
The reduction or elimination of government subsidies and economic incentives for alternative energy technologies, including our fuel cell power plants, could reduce demand for our products and services, lead to a reduction in our revenues and adversely impact our operating results.
We believe that the near-term growth of alternative energy technologies, including our fuel cells, relies on the availability and size of government and economic incentives The U.S. Federal investment tax credit expires on December 31, 2016. Other government incentives expire, phase out over time, exhaust the allocated funding, or require renewal by the applicable authority. In addition, these incentive programs could be challenged by utility companies, or be found to be unconstitutional, and/or could be reduced or discontinued for other reasons. The reduction, elimination, or expiration of government subsidies and economic incentives may result in the diminished economic competitiveness of our power plants to our customers and could materially and adversely affect the growth of alternative energy technologies, including our fuel cells, as well as our future operating results.
Financial markets worldwide have experienced increased volatility and instability which may have a material adverse impact on our Company, our customers and our suppliers.
Financial market volatility can affect both the debt, equity and project finance markets. This may impact the amount of financing available to all companies, including companies with substantially greater resources, better credit ratings and more successful operating histories than ours. It is impossible to predict future financial market volatility and instability and the impact on our Company and it may have a materially adverse effect on us for a number of reasons, such as:
10
| ● |
The long term nature of our sales cycle can require long lead times between application design, order booking and product fulfillment. For this, we often require substantial cash down payments in advance of delivery. Our growth strategy assumes that financing will be available for the Company to finance working capital or for our customers to provide down payments and to pay for our products. Financial market issues may delay, cancel or restrict the construction budgets and funds available to the Company or our customers for the deployment of our products and services.
|
|
| ● |
Projects using our products are, in part, financed by equity investors interested in tax benefits as well as by the commercial and governmental debt markets. The significant volatility in the U.S. and international stock markets since 2008, has caused significant uncertainty and may result in an increase in the return required by investors in relation to the risk of such projects.
|
|
| ● |
If we, our customers and suppliers cannot obtain financing under favorable terms, our business may be negatively impacted.
|
Our products are complex and could contain defects and may not operate at expected performance levels which could impact sales and market adoption of our products or result in claims against us.
We develop complex and evolving products, which we have limited field operating experience on. This could result in a delay in recognition or loss of revenues, loss of market share or failure to achieve broad market acceptance. The occurrence of defects could also cause us to incur significant warranty, support and repair costs, could divert the attention of our engineering personnel from our product development efforts, and could harm our relationships with our customers. The occurrence of these problems could result in the delay or loss of market acceptance of our products and would likely harm our business. Defects or performance problems with our products could result in financial or other damages to our customers. Although we seek to limit our liability, a product liability claim brought against us, even if unsuccessful, would likely be time consuming and could be costly to defend. Our customers could also seek and obtain damages from us for their losses. We have reserved for potential damages related to performance problems, however actual results may be different than the assumptions used in our reserve calculations.
We currently face and will continue to face significant competition.
We compete on the basis of our products’ reliability, efficiency, environmental considerations and cost. Technological advances in alternative energy products or improvements in the electric grid or other sources of power generation, or other fuel cell technologies may negatively affect the development or sale of some or all of our products or make our products non-competitive or obsolete prior to commercialization or afterwards. Other companies, some of which have substantially greater resources than ours, are currently engaged in the development of products and technologies that are similar to, or may be competitive with, our products and technologies.
Other than fuel cell developers, we must also compete with companies that manufacture more mature combustion-based equipment, including various engines and turbines, and have well-established manufacturing, distribution, and operating and cost features.
We have no experience manufacturing our products on a commercial basis, which may adversely affect our planned increases in production capacity and our ability to satisfy customer requirements.
As we scale up our production capacity, we cannot be sure that unplanned failures or other technical problems relating to the manufacturing process will not occur.
Even if we are successful in achieving our planned increases in production capacity, we cannot be sure that we will do so in time to satisfy the requirements of our customers. Our failure to develop advanced manufacturing capabilities and processes, or meet our cost goals, could have a material adverse effect on our business prospects, results of operations and financial condition.
Unanticipated increases or decreases in business growth may result in adverse financial consequences for us.
If our business grows more quickly than we anticipate, our existing and planned manufacturing facilities may become inadequate and we may need to seek out new or additional space, at considerable cost to us. If our business does not grow as quickly as we expect, our existing and planned manufacturing facilities would, in part, represent excess capacity for which we may not recover the cost; in that circumstance, our revenues may be inadequate to support our committed costs and our planned growth, and our gross margins, and business strategy would be adversely affected.
11
Our plans are dependent on market acceptance of our products.
Our plans are dependent upon market acceptance of, as well as enhancements to, our products. Fuel cell systems represent an emerging market, and we cannot be sure that potential customers will accept fuel cells as a replacement for traditional power sources. As is typical in a rapidly evolving industry, demand and market acceptance for recently introduced products and services are subject to a high level of uncertainty and risk. Since the distributed generation market is still evolving, it is difficult to predict with certainty the size of the market and its growth rate. The development of a market for our products may be affected by many factors that are out of our control, including:
| ● |
the cost competitiveness of our fuel cell products including availability and output expectations and total cost of ownership;
|
|
| ● |
the future costs of natural gas and other fuels used by our fuel cell products;
|
|
| ● |
customer reluctance to try a new product;
|
|
| ● |
the market for distributed generation;
|
|
| ● |
local permitting and environmental requirements; and
|
|
| ● |
the emergence of newer, more competitive technologies and products.
|
If a sufficient market fails to develop or develops more slowly than we anticipate, we may be unable to recover the losses we will have incurred in the development of our products and may never achieve profitability.
As we continue to expand markets for our products, we intend to continue offering power production guarantees and other terms and conditions relating to our products that will be acceptable to the marketplace, and continue to develop a service organization that will aid in servicing our products and obtain self-regulatory certifications, if available, with respect to our products. Failure to achieve any of these objectives may also slow the development of a sufficient market for our products and, therefore, have a material adverse effect on our results of operations and financial condition.
If our goodwill and other intangible assets, inventory or project assets become impaired, we may be required to record a significant charge to earnings.
We may be required to record a significant charge to earnings in our financial statements should we determine that our goodwill is impaired. Such a charge might have a significant impact on our financial position and results of operations.
As required by accounting rules, we review our goodwill for impairment quarterly or more frequently if facts and circumstances indicate that it is more likely than not that the fair value of a reporting unit that has goodwill is less than its carrying value. Factors that may be considered a change in circumstances indicating that the carrying value of our goodwill might not be recoverable include a significant decline in projections of future cash flows and lower future growth rates in our industry.
12
Our future success and growth is dependent on our market strategy.
We cannot assure you that we will enter into partnerships that are consistent with, or sufficient to support, our commercialization plans, and our growth strategy or that these relationships will be on terms favorable to us. Even if we enter into these types of relationships, we cannot assure you that the partners with which we form relationships will focus adequate resources on selling our products or will be successful in selling them. Some of these arrangements have or will require that we grant exclusive rights to companies in defined territories. These exclusive arrangements could result in our being unable to enter into other arrangements at a time when the partner with which we form a relationship is not successful in selling our products or has reduced its commitment to marketing our products. In addition, future arrangements may also include the issuance of equity and warrants to purchase our equity, which may have an adverse effect on our stock price. To the extent we enter into partnerships or relationships, the failure of these partners to assist us with the deployment of our products may adversely affect our results of operations and financial condition.
We depend on our intellectual property, and our failure to protect that intellectual property could adversely affect our future growth and success.
Failure to protect our existing intellectual property rights may result in the loss of our exclusivity or the right to use our technologies. If we do not adequately ensure our freedom to use certain technology, we may have to pay others for rights to use their intellectual property, pay damages for infringement or misappropriation, or be enjoined from using such intellectual property. We rely on patent, trade secret, trademark and copyright law to protect our intellectual property. Some of our intellectual property is not covered by any patent or patent application and includes trade secrets and other know-how that is not able to be patented, particularly as it relates to our manufacturing processes and engineering design. In addition, some of our intellectual property includes technologies and processes that may be similar to the patented technologies and processes of third parties. If we are found to be infringing third-party patents, we do not know whether we will be able to obtain licenses to use such patents on acceptable terms, if at all. Our patent position is subject to complex factual and legal issues that may give rise to uncertainty as to the validity, scope, and enforceability of a particular patent.
We cannot assure you that any of the U.S. or international patents owned by us or other patents that third parties license to us will not be invalidated, circumvented, challenged, rendered unenforceable or licensed to others, or any of our pending or future patent applications will be issued with the breadth of claim coverage sought by us, if issued at all. In addition, effective patent, trademark, copyright and trade secret protection may be unavailable, limited or not applied for in certain foreign countries.
We also seek to protect our proprietary intellectual property, including intellectual property that may not be patented or able to be patented, in part by confidentiality agreements and, if applicable, inventors’ rights agreements with our subcontractors, vendors, suppliers, consultants, strategic partners and employees. We cannot assure you that these agreements will not be breached, that we will have adequate remedies for any breach or that such persons or institutions will not assert rights to intellectual property arising out of these relationships. Certain of our intellectual property have been licensed to us on a non-exclusive basis from third parties that may also license such intellectual property to others, including our competitors. If our licensors are found to be infringing third-party patents, we do not know whether we will be able to obtain licenses to use the intellectual property licensed to us on acceptable terms, if at all.
If necessary or desirable, we may seek extensions of existing licenses or further licenses under the patents or other intellectual property rights of others. However, we can give no assurances that we will obtain such extensions or further licenses or that the terms of any offered licenses will be acceptable to us. The failure to obtain a license from a third party for intellectual property that we use at present could cause us to incur substantial liabilities, and to suspend the manufacture or shipment of products or our use of processes requiring the use of that intellectual property.
While we are not currently engaged in any intellectual property litigation, we could become subject to lawsuits in which it is alleged that we have infringed the intellectual property rights of others or commence lawsuits against others who we believe are infringing upon our rights. Our involvement in intellectual property litigation could result in significant expense to us, adversely affecting the development of sales of the challenged product or intellectual property and diverting the efforts of our technical and management personnel, whether or not that litigation is resolved in our favor.
Our future success will depend on our ability to attract and retain qualified management and technical personnel.
Our future success is substantially dependent on the continued services and on the performance of our executive officers and other key management, engineering, scientific, manufacturing and operating personnel, particularly Frank Neukomm, our Chief Executive Officer and Bob Farr, our Chief Operating Officer. The loss of the services of either executive officer, or other key management, engineering, scientific, manufacturing and operating personnel, could materially adversely affect our business. Our ability to achieve our commercialization plans will also depend on our ability to attract and retain additional qualified management and technical personnel. Recruiting personnel for the fuel cell industry is competitive. We do not know whether we will be able to attract or retain additional qualified management and technical personnel. Our inability to attract and retain additional qualified management and technical personnel, or the departure of key employees, could materially and adversely affect our development and commercialization plans and, therefore, our business prospects, results of operations and financial condition.
Our management may be unable to manage rapid growth effectively.
We may rapidly expand our manufacturing capabilities, accelerate the commercialization of our products and enter a period of rapid growth, which will place a significant strain on our senior management team and our financial and other resources. Any expansion may expose us to increased competition, greater overhead, marketing and support costs and other risks associated with the commercialization of a new product. Our ability to manage rapid growth effectively will require us to continue to improve our operations, to improve our financial and management information systems and to train, motivate and manage our employees. Difficulties in effectively managing issues presented by such a rapid expansion could harm our business prospects, results of operations and financial condition.
We may be affected by environmental and other governmental regulation.
We are subject to various federal, state and local laws and regulations relating to, among other things, land use, safe working conditions, handling and disposal of hazardous and potentially hazardous substances and emissions of pollutants into the atmosphere. In addition, it is possible that industry-specific laws and regulations will be adopted covering matters such as transmission scheduling, distribution, and the characteristics and quality of our products, including installation and servicing. These regulations could limit the growth in the use of carbonate fuel cell products, decrease the acceptance of fuel cells as a commercial product and increase our costs and, therefore, the price of our products. Accordingly, compliance with existing or future laws and regulations could have a material adverse effect on our business prospects, results of operations and financial condition.
13
Our products use inherently dangerous, flammable fuels, operate at high temperatures and use corrosive carbonate material, each of which could subject our business to product liability claims.
Our business exposes us to potential product liability claims that are inherent in products that use hydrogen. Our products utilize fuels such as natural gas and convert these fuels internally to hydrogen that is used by our products to generate electricity. The fuels we use are combustible and may be toxic. Any accidents involving our products or other hydrogen-using products could materially impede widespread market acceptance and demand for our products. In addition, we might be held responsible for damages beyond the scope of our insurance coverage. We also cannot predict whether we will be able to maintain adequate insurance coverage on acceptable terms.
Risks Related to our Contract Research and Laboratory Services division
WE MAY BE REQUIRED TO PERFORM ADDITIONAL CLINICAL TRIALS OR CHANGE THE LABELING OF OUR PRODUCTS IF SIDE EFFECTS OR MANUFACTURING PROBLEMS ARE IDENTIFIED AFTER OUR PRODUCTS ARE ON THE MARKET.
If side effects are identified after any of our products are on the market, or if manufacturing problems occur, regulatory approval may be withdrawn and product recalls, reformulation of products, additional clinical trials, changes in labeling of products, and changes to or re-approvals of our manufacturing facilities may be required, any of which could have a material adverse effect on sales of the affected products and on our business and results of operations.
After products are approved for commercial use, we or regulatory bodies could decide that changes to the product labeling are required. Label changes may be necessary for a number of reasons, including the identification of actual or theoretical safety or efficacy concerns by regulatory agencies or the discovery of significant problems with a similar product that implicates an entire class of products. Any significant concerns raised about the safety or efficacy of our products could also result in the need to recall products, reformulate those products, to conduct additional clinical trials, to make changes to the manufacturing processes, or to seek re-approval of the manufacturing facilities. Significant concerns about the safety and effectiveness of a product could ultimately lead to the revocation of our marketing approval. The revision of product labeling or the regulatory actions described above could be required even if there is no clearly established connection between the product and the safety or efficacy concerns that have been raised. The revision of product labeling or the regulatory actions described above could have a material adverse effect on sales of the affected products and on our business and results of operations.
14
IF WE OR OUR SUPPLIERS ARE UNABLE TO COMPLY WITH ONGOING AND CHANGING REGULATORY STANDARDS, SALES OF OUR PRODUCTS COULD BE DELAYED OR PREVENTED.
Virtually all aspects of our business, including the development, testing, manufacturing, processing, quality, safety, efficacy, packaging, labeling, record-keeping, distribution, storage and advertising and promotion of our products and disposal of waste products arising from these activities, are subject to extensive regulation by federal, state and local governmental authorities in the United States, including the FDA and the Department of Health and Human Services Office of Inspector General (HHS OIG). Our business is also subject to similar and/or additional regulation in other countries. Compliance with these regulations is costly and time-consuming.
Our manufacturing facilities and procedures and those of our suppliers are subject to ongoing regulation, including periodic inspection by the FDA and other regulatory agencies. For example, manufacturers of pharmaceutical products must comply with detailed regulations governing current good manufacturing practices, including requirements relating to quality control and quality assurance. We must spend funds, time and effort in the areas of production, safety, quality control and quality assurance to ensure compliance with these regulations. We cannot assure that our manufacturing facilities or those of our suppliers will not be subject to regulatory action in the future.
Our products generally must receive appropriate regulatory clearance before they can be sold in a particular country, including the United States. We may encounter delays in the introduction of a product as a result of, among other things, insufficient or incomplete submissions to a regulatory agency for approval of a product, objections by another company with respect to our submissions for approval, new patents by other companies, patent challenges by other companies that result in a 180-day exclusivity period, and changes in regulatory policy during the period of product development or during the regulatory approval process. Regulatory agencies have the authority to revoke drug approvals previously granted and remove from the market previously approved products for various reasons, including issues related to current good manufacturing practices for that particular product or in general. We may be subject from time to time to product recalls initiated by us or by regulatory authorities.
Our inability or the inability of our suppliers to comply with applicable regulatory requirements can result in, among other things, warning letters, fines, consent decrees restricting or suspending our manufacturing operations, delay of approvals for new products, injunctions, civil penalties, recall or seizure of products, total or partial suspension of sales and criminal prosecution. Any of these or other regulatory actions could materially adversely affect our business and financial condition.
WE DEPEND ON THIRD PARTIES TO SUPPLY RAW MATERIALS AND OTHER COMPONENTS AND MAY NOT BE ABLE TO OBTAIN SUFFICIENT QUANTITIES OF THESE MATERIALS, WHICH WILL LIMIT OUR ABILITY TO MANUFACTURE OUR PRODUCTS ON A TIMELY BASIS AND HARM OUR OPERATING RESULTS.
The manufacture of Interferon requires, and our product candidates will require, raw materials and other components that must meet stringent regulatory requirements. Some of these raw materials and other components are available only from a limited number of sources. Obtaining approval to change, substitute or add a raw material or component, or the supplier of a raw material or component, can be time consuming and expensive, as testing and regulatory approvals are necessary.
OTHER COMPANIES MAY CLAIM THAT WE INFRINGE ON THEIR INTELLECTUAL PROPERTY OR PROPRIETARY RIGHTS, WHICH COULD CAUSE US TO INCUR SIGNIFICANT EXPENSES OR PREVENT US FROM SELLING OUR PRODUCTS.
Our success depends in part on our ability to operate without infringing the patents and proprietary rights of third parties. The manufacture, use and sale of new products with conflicting patent rights have been subject to substantial litigation in the pharmaceutical industry. These lawsuits relate to the validity and infringement of patents or proprietary rights of third parties. A number of pharmaceutical companies, biotechnology companies, universities and research institutions may have filed patent applications or may have been granted patents that cover aspects of our products or our licensors’ products, product candidates or other technologies.
Future or existing patents issued to third parties may contain claims that conflict with our products. We may be subject to infringement claims from time to time in the ordinary course of our business, and third parties could assert infringement claims against us in the future. Litigation or interference proceedings could force us to:
| ● |
stop or delay selling, manufacturing or using products that incorporate or are made using the challenged intellectual property;
|
|
| ● |
pay damages; or
|
|
| ● |
enter into licensing or royalty agreements that may not be available on acceptable terms, if at all.
|
Any litigation or interference proceedings, regardless of their outcome, would likely delay the regulatory approval process, be costly and require significant time and attention of key management and technical personnel.
We may not be able to prevent third parties from infringing or using our intellectual property. We generally control and limit access to, and the distribution of, our product documentation and other proprietary information. Despite our efforts to protect this proprietary information, however, unauthorized parties may obtain and use information that we regard as proprietary. Other parties may independently develop similar know-how or may even obtain access to these technologies.
15
The laws of some foreign countries do not protect proprietary information to the same extent as the laws of the United States, and many companies have encountered significant problems and costs in protecting their proprietary information in these foreign countries.
The U.S. Patent and Trademark Office and the courts have not established a consistent policy regarding the breadth of claims allowed in pharmaceutical patents. The allowance of broader claims may increase the incidence and cost of patent interference proceedings and the risk of infringement litigation. On the other hand, the allowance of narrower claims may limit the value of our proprietary rights.
THE STRATEGY TO LICENSE RIGHTS TO OR ACQUIRE AND COMMERCIALIZE PROPRIETARY, BIOLOGICAL INJECTABLE OR OTHER SPECIALTY INJECTABLE PRODUCTS MAY NOT BE SUCCESSFUL AND WE MAY NEVER RECEIVE ANY RETURN ON OUR INVESTMENT IN THESE PRODUCTS.
We may license rights to or acquire products or technologies from third parties. Other companies, including those with substantially greater financial and sales and marketing resources, will compete with us to license rights to or acquire these products and technologies. We may not be able to license rights to or acquire these proprietary or other products or technologies on acceptable terms, if at all. Even if we obtain rights to a pharmaceutical product and commit to payment terms, including, in some cases, significant up-front license payments, we may not be able to generate product sales sufficient to create a profit or otherwise avoid a loss.
A product candidate may fail to result in a commercially successful drug for other reasons, including the possibility that the product candidate may:
| ● |
be found during clinical trials to be unsafe or ineffective;
|
|
| ● |
fail to receive necessary regulatory approvals;
|
|
| ● |
be difficult or uneconomical to produce in commercial quantities;
|
|
| ● |
be precluded from commercialization by proprietary rights of third parties; or
|
|
| ● |
fail to achieve market acceptance.
|
WE MAY BECOME SUBJECT TO FEDERAL OR STATE FALSE CLAIMS OR OTHER SIMILAR LITIGATION BROUGHT BY PRIVATE INDIVIDUALS AND THE GOVERNMENT.
The Federal False Claims Act (and equivalent state statutes) allows persons meeting specified requirements to bring suit alleging false or fraudulent Medicare or Medicaid claims and to share in any amounts paid to the government in fines or settlement. These suits, known as qui tam actions, have increased significantly in recent years and have increased the risk that a health care company will have to defend a false claim action, pay fines and/or be excluded from Medicare and Medicaid programs. False claims litigation can lead to civil monetary penalties, criminal fines and imprisonment and/or exclusion from participation in Medicare, Medicaid and other federally funded health programs. Other alternate theories of liability may also be available to private parties seeking redress for such claims. A number of parties have brought claims against numerous pharmaceutical manufacturers, and we cannot be certain that such claims will not be brought against us, or if they are brought, that such claims might not be successful.
WE MAY NEED TO CHANGE OUR BUSINESS PRACTICES TO COMPLY WITH CHANGES TO, OR MAY BE SUBJECT TO CHARGES UNDER, THE FRAUD AND ABUSE LAWS.
We are subject to various federal and state laws pertaining to health care fraud and abuse, including the federal Anti-Kickback Statute and its various state analogues, the federal and state False Claims Act and additional marketing and pricing laws. Violations of these laws are punishable by criminal and/or civil sanctions, including, in some instances, imprisonment and exclusion from participation in federal and state health care programs such as Medicare and Medicaid. We may have to change our advertising and promotional business practices, or our existing business practices could be challenged as unlawful due to changes in laws, regulations or rules or due to administrative or judicial findings, which could materially adversely affect our business.
16
WE FACE UNCERTAINTY RELATED TO PRICING AND REIMBURSEMENT AND HEALTH CARE REFORM.
In both domestic and foreign markets, sales of our products will depend in part on the availability of reimbursement from third-party payers such as government health administration authorities, private health insurers, health maintenance organizations and other health care-related organizations. However, reimbursement by such payers is presently undergoing reform, and there is significant uncertainty at this time how this will affect sales of certain pharmaceutical products. There is possible U.S. legislation or regulatory action affecting, among other things, pharmaceutical pricing and reimbursement, including under Medicaid and Medicare, the importation of prescription drugs that are marketed outside the U.S. and sold at prices that are regulated by governments of various foreign countries.
Medicare, Medicaid and other governmental reimbursement legislation or programs govern drug coverage and reimbursement levels in the United States. Federal law requires all pharmaceutical manufacturers to rebate a percentage of their revenue arising from Medicaid-reimbursed drug sales to individual states.
Both the federal and state governments in the United States and foreign governments continue to propose and pass new legislation, rules and regulations designed to contain or reduce the cost of health care. Existing regulations that affect the price of pharmaceutical and other medical products may also change before any of our products are approved for marketing. Cost control initiatives could decrease the price that we receive for any product we develop in the future. In addition, third-party payers are increasingly challenging the price and cost-effectiveness of medical products and services and litigation has been filed against a number of pharmaceutical companies in relation to these issues. Additionally, significant uncertainty exists as to the reimbursement status of newly approved injectable pharmaceutical products. Our products may not be considered cost effective or adequate third-party reimbursement may not be available to enable us to maintain price levels sufficient to realize an adequate return on our investment.
WE MAY BE REQUIRED TO DEFEND LAWSUITS OR PAY DAMAGES FOR PRODUCT LIABILITY CLAIMS.
Product liability is a major risk in testing and marketing biotechnology and pharmaceutical products. We may face substantial product liability exposure in human clinical trials and for products that we sell after regulatory approval. We maintain insurance coverage for product liability claims in the aggregate amount of $100 million, including primary and excess coverage, which we believe is reasonably adequate coverage. Product liability claims, regardless of their merits, could exceed policy limits, divert management’s attention and adversely affect our reputation and the demand for these products.
WE DEPEND HEAVILY ON THE PRINCIPAL MEMBERS OF OUR MANAGEMENT AND RESEARCH AND DEVELOPMENT TEAMS, THE LOSS OF WHOM COULD HARM OUR BUSINESS.
We depend heavily on the principal members of our management and research and development teams Each of the members of the executive management team is employed “at will.” The loss of the services of any member of the executive management team may significantly delay or prevent the achievement of product development or business objectives.
TO BE SUCCESSFUL, WE MUST ATTRACT, RETAIN AND MOTIVATE KEY EMPLOYEES, AND THE INABILITY TO DO SO COULD SERIOUSLY HARM OUR BUSINESS AND OPERATIONS.
To be successful, we must attract, retain and motivate executives and other key employees. We face competition for qualified scientific, technical and other personnel, which may adversely affect our ability to attract and retain key personnel. We also must continue to attract and motivate employees and keep them focused on our strategies and goals.
17
Risks Related to Our Common Stock
THERE IS NO LIQUID MARKET FOR OUR COMMON STOCK.
Our shares are traded on the OTCBB and the trading volume has historically been very low. An active trading market for our shares may not develop or be sustained. We cannot predict at this time how actively our shares will trade in the public market or whether the price of our shares in the public market will reflect our actual financial performance.
OUR COMMON STOCK MAY BE CONSIDERED “A PENNY STOCK” AND MAY BE DIFFICULT FOR YOU TO SELL.
The SEC has adopted regulations which generally define “penny stock” to be an equity security that has a market price of less than $5.00 per share or an exercise price of less than $5.00 per share, subject to specific exemptions. The market price of our common stock has been for much of its trading history and may continue to be less than $5.00 per share, and therefore may be designated as a “penny stock” according to SEC rules. This designation requires any broker or dealer selling these securities to disclose certain information concerning the transaction, obtain a written agreement from the purchaser and determine that the purchaser is reasonably suitable to purchase the securities. These rules may restrict the ability of brokers or dealers to sell our common stock and may affect the ability of investors to sell their shares.
COMPLIANCE AND CONTINUED MONITORING IN CONNECTION WITH CHANGING REGULATION OF CORPORATE GOVERNANCE AND PUBLIC DISCLOSURE MAY RESULT IN ADDITIONAL EXPENSES.
Changing laws, regulations and standards relating to corporate governance and public disclosure may create uncertainty regarding compliance matters. New or changed laws, regulations and standards are subject to varying interpretations in many cases. As a result, their application in practice may evolve over time. We are committed to maintaining high standards of corporate governance and public disclosure. Complying with evolving interpretations of new or changed legal requirements may cause us to incur higher costs as we revise current practices, policies and procedures, and may divert management time and attention from the achievement of revenue generating activities to compliance activities. If our efforts to comply with new or changed laws, regulations and standards differ from the activities intended by regulatory or governing bodies due to uncertainties related to practice, our reputation might be harmed which would could have a significant impact on our stock price and our business. In addition, the ongoing maintenance of these procedures to be in compliance with these laws, regulations and standards could result in significant increase in costs.
OUR PRINCIPAL STOCKHOLDER HAS SIGNIFICANT VOTING POWER AND MAY TAKE ACTIONS THAT MAY NOT BE IN THE BEST INTEREST OF ALL OTHER STOCKHOLDERS.
The Company’s Chief Executive Officer and Chief Operating Officer each control approximately 4% of its voting stock through their ownership of the Series A Preferred Stock. He may be able to exert significant control over our management and affairs requiring stockholder approval, including approval of significant corporate transactions. This concentration of ownership may expedite approvals of company decisions, or have the effect of delaying or preventing a change in control, adversely affect the market price of our common stock, or be in the best interests of all our stockholders.
YOU COULD BE DILUTED FROM THE ISSUANCE OF ADDITIONAL COMMON STOCK.
As of January 20, 2015, we have the following securities issued and outstanding:
9,941,744 shares of common stock;
100,000,000 shares of preferred stock, Series A
1 shares of preferred stock, Series B
We are authorized to issue up to 10,000,000,000 shares of common stock and 200,000,000 shares of preferred stock. To the extent of such authorization, our board of directors will have the ability, without seeking stockholder approval, to issue additional shares of common stock or preferred stock in the future for such consideration as the board of directors may consider sufficient. The issuance of additional common stock or preferred stock in the future may reduce your proportionate ownership and voting power.
Item 1B. Unresolved Staff Comments.
Item 2. Description of Property.
Our headquarters in Houston Texas in provided rent free. Previously, we rented an office totaling 10,000 square feet in area and were paying $15,000 in rent on a monthly basis. The lease expired in January 2012 and the Company is no longer paying rent.
Item 3. Legal Proceedings.
We are not aware of any legal proceedings to which we are a party or of which our property is the subject. None of our directors, officers, affiliates, any owner of record or beneficially of more than 5% of our voting securities, or any associate of any such director, officer, affiliate or security holder are (i) a party adverse to us in any legal proceedings, or (ii) have a material interest adverse to us in any legal proceedings. We are not aware of any other legal proceedings that have been threatened against us.
Item 4. Mine Safety Disclosures.
Not applicable.
18
Item 5. Market for Registrant’s Common Equity, Related Stockholder Matters and Issuer Purchases of Equity Securities.
(a) Market Information
Our shares of common stock traded on the OTCBB under the symbol “AFLB.OB” until December 26, 2013. Commencing December 27, 2013, we trade under the symbol HFCO.OB. On January 12, 2015, there was a 1:250 stock split. Our stock currently trades under the symbol HFCOD.OB and will for twenty consecutive trading days until it reverts back to HFCO.OB. All prices reflect
The following table sets forth the high and low trade information for our common stock for each quarter for the fiscal years ended September 30, 2014 and September 30, 2013. The prices reflect all stock splits,inter-dealer quotations, do not include retail mark-ups, markdowns or commissions and do not necessarily reflect actual transactions.
|
Quarter ended
|
High
|
Low
|
||||||
|
September 30, 2014
|
$
|
0.85
|
$
|
0.03
|
||||
|
June 30, 2014
|
$
|
2.28
|
$
|
0.58
|
||||
|
March 31,2014
|
$
|
55.00
|
$
|
0.25
|
||||
|
December 31, 2013
|
$
|
1,734.38
|
$
|
15.63
|
||||
|
September 30, 2013
|
$
|
2,500.00
|
$
|
414.08
|
||||
|
June 30, 2013
|
$
|
3,750.00
|
$
|
328.13
|
||||
|
March 31, 2013
|
$
|
6,187.50
|
$
|
375.00
|
||||
|
December 31, 2012
|
$
|
2,500.00
|
$
|
250.00
|
||||
(b) Holders
As of January 20, 2015, a total of 9,941,744 shares of the Company’s common stock are authorized and currently outstanding. They are held by approximately 46 shareholders of record.
(c) Dividends
We have not declared or paid any dividends on our common stock and intend to retain any future earnings to fund the development and growth of our business. Therefore, we do not anticipate paying dividends on our common stock for the foreseeable future. There are no restrictions on our present ability to pay dividends to stockholders of our common stock, other than those prescribed by Nevada law.
(d) Securities Authorized for Issuance under Equity Compensation Plan
Item 6. Selected Financial Data.
Item 7. Management’s Discussion and Analysis of Financial Condition and Results of Operations
Forward Looking Statements
This annual report on Form 10-K and other reports filed by the Company from time to time with the U.S. Securities and Exchange Commission (the “SEC”) contain or may contain forward-looking statements (collectively the “Filings”) and information that are based upon beliefs of, and information currently available to, the Company’s management as well as estimates and assumptions made by Company’s management. Readers are cautioned not to place undue reliance on these forward-looking statements, which are only predictions and speak only as of the date hereof. When used in the filings, the words “anticipate”, “believe”, “estimate”, “expect”, “future”, “intend”, “plan”, or the negative of these terms and similar expressions as they relate to the Company or the Company’s management identify forward-looking statements. Such statements reflect the current view of the Company with respect to future events and are subject to risks, uncertainties, assumptions, and other factors, including the risks contained in the section entitled “Risk Factors”, relating to the Company’s industry, the Company’s operations and results of operations, and any businesses that the Company may acquire. Should one or more of these risks or uncertainties materialize, or should the underlying assumptions prove incorrect, actual results may differ significantly from those anticipated, believed, estimated, expected, intended, or planned.
19
Although the Company believes that the expectations reflected in the forward-looking statements are reasonable, the Company cannot guarantee future results, levels of activity, performance, or achievements. Except as required by applicable law, including the securities laws of the United States, the Company does not intend to update any of the forward-looking statements to conform these statements to actual results.
Plan of Operation
Hydrogen Future Corp. is a development stage company specializing in the commercialization of hydrogen fuel cell technologies and contract research and laboratory services. Currently, our contract research and laboratory services division is inactive, and we plan to concentrate on commercializing our hydrogen fuel cell products.
We are currently in the process of developing a working prototype of our HydraStax © fuel cell product for residential use. We believe that we will require $800,000 of the upcoming fiscal year to meet this objective.
Results of Operations
Our results of operations are summarized below:
|
|
Year Ended
September 30,
2014 ($)
|
Year Ended
September 30,
2013 ($)
|
||||||
|
Revenue
|
-0-
|
-0-
|
||||||
|
Expenses
|
6,047,884
|
761,052
|
||||||
|
Issuance of Common Stock to settle a prior liability
|
117,000
|
-0-
|
||||||
|
Other Income (Expenses)
|
(1,638,756
|
)
|
(1,660,093)
|
|||||
|
Net Income (Loss)
|
(7,803,640
|
)
|
(2,421,145)
|
|||||
|
Gain/(Loss) Per Share-Basic
|
(6.58
|
)
|
(4,172.94
|
) | ||||
|
Gain/(Loss) Per Share-Fully diluted
|
(4.92
|
)
|
(3,026.50
|
) | ||||
Year Ended September 30, 2014 Compared to the Year Ended September 30, 2013
During the years ended September 30, 2014 and 2013, we did not earn any revenues. We have not earned any revenues since our inception and there is no assurance that we will be able to earn any revenues in the future.
Our expenses for the years ended September 30, 2014 and 2013 can be summarized as follows:
|
|
For the Year
Ended September 30,
|
|||||||||||
|
|
2014 ($)
|
2013 ($)
|
Difference ($)
|
|||||||||
|
Compensation Expense to Officers
|
5,255,000
|
471,549
|
4,783,451
|
|||||||||
|
Consulting Fees
|
340,000
|
217,335
|
122,665
|
|||||||||
|
General and administrative expenses-other
|
452,884
|
72,168
|
380,716
|
|||||||||
|
Other income (expense) – net
|
(1,638,756
|
)
|
(1,660,093)
|
21,337
|
||||||||
Our net loss for the year ended September 30, 2014, was ($7,803,640) compared to net income of ($2,421,145) for the year ended September 30, 2013, an increased loss of $5,382,495. During the years ended September 30, 2014 and September 30, 2013, we did not generate any revenues from operations.
During the year ended September 30, 2014, we incurred operating expenses (and respective net operating losses) of $6,164,884, compared to operating expenses of $761,052 incurred during the year ended September 30, 2013, an increase in expenses of $5,403,382. The operating expenses incurred during the year ended September 30, 2014 and 2013, consisted of of(i) $5,255,000 and $471,549, respectively in Compensation Expense to officers; (ii) $340,000 and $217,335, respectively, in fees paid to professionals; (iii) and (iv) $452,884 and $72,168, respectively, in other general and administrative expenses.
20
Changes in expenses were due to the following:
|
a.
|
Compensation expense to Officers- Compensation expense to Officers increased $4,783,451 due to the issuance of 100 million shares of common stock to our Management team on January 27, 2014 and another 720,000 shares which were issued in December 2013 with a value of $45,000. These expenditures were partially offset by similar expenditures made in the prior year
|
|
b.
|
Consulting fees- Consulting fees increased $122,665 principally due to the existence of the consulting arrangement for the entire fiscal year as opposed to only a
|
|
c.
|
General and Administrative other- General and Administrative other increased $21,337 primarily due to the Hydra acquisition.
|
Other Income (Expense) incurred during the year ended September 30, 2014, included: (i) interest expense of ($312,873); (ii) derivative expense of ($2,685,435) (iii) change in fair value of the derivative liability of $3,509,298 and (iv) loss on retirement of debt of ($2,149,746). During the year ended September 30, 2013, the ($1,660,093) in Other Income/(Expense) was comprised primarily of charges of ($994,808) due to mark to market accounting associated with the fair market value of the derivative liability interest expense of ($235,661) , derivative expense on new debt instruments of ($227,264) and loss on Retiremetn of Debt of ($202,360),
Therefore, our net loss and net loss per share during the year ended September 30, 2014 was ($7,803,640) or ($6.58) and ($4.92), per basic and diluted share, respectively compared to net loss and net loss per share of ($4,172.94) or ($3,026.50) per share during the year ended September 30, 2013. The weighted average number of shares outstanding for the year ended September 30, 2014 and 2013 was as follows (adjusted for all stock splits):
|
Year Ended
September 30,
2014
|
Year Ended
September 30,
2013
|
|||||||
|
Basic Shares
|
1,186,813
|
580
|
||||||
|
Fully diluted shares
|
1,586,813
|
800
|
||||||
Liquidity and Capital Resources
As of September 30, 2014, our current assets were $31,744 and our current liabilities were $2,655,267, which resulted in a working capital deficiency of ($2,623,523). As of September 30, 2014, current assets were comprised of: (i) $31,033 in cash; and (ii) $712 in inventory. As of September 30, 2014, current liabilities were comprised of: (i) $165,991 in accounts payable and accrued liabilities; (ii) $415,719 in accounts payable due to a related party; (iii) $379,092 in accrued interest payable; (iv) $27,173 in notes payable due to a related party; (v) 442,609 in convertible debt (net of $295,013 of discount), (vi) a derivative liability of 243,175 resulting from convertible notes payable, and (vii) $981,508 in non-convertible debt from the Hydra acquisition
As of September 30, 2014, our total assets of $3,633,452 were comprised of: (i) $31,744 in current assets; (ii) $20,288 in debt issue costs (net of $68,548 of amortization), (iii) Goodwill associated with the Hydra acquisition of $3,353,156; and (iii) $181,259 in property and equipment (net of $469,297 of depreciation),and $47,005 in a Note Receivable. As of September 30, 2014, our total liabilities of $2,655,267 were comprised of current liabilities of the same amount.
Stockholders’ equity (deficit) increased $3,328,243 from ($2,350,057) as of September 30, 2013 to $978,186 as of September 30, 2014. The change in Stockholder’s Equity was due to issuances of common stock of $9,081,963 ($5,255,000 for management compensation, $3,661,993 for retirement of debt and $164,990 for other), issue of Series A Preferred stock for the Hydra acquisition of $2,049,920 partially offset by of our net loss of ($7,803,640)
Cash Flows from Operating Activities
For the year ended September 30, 2014, net cash flows used by operations was ($718,906). Net cash flows used in operating activities for the year ended September 30, 2014, consisted of a net loss of ($7,803,640) adjusted by: (i) $(3,509,298) in net loss due to a change in the fair value of the derivative liability on convertible notes payable; partially offset by (ii) $5,255,000 in share based payments; (iii) $2,685,435 of derivative expense on new convertible notes issued; (iv) $2,149,746 for loss on retirement of debt; (v) $148,603 in amortization of debt issue cost; and (vi) $33,570 in amortization of debt issue cost. Net cash flows used by operating activities was further changed by a decrease of (i) $319,630 due to working capital acquired in the acquisition partially offset by ii) $304,845 in greater accrued interest.
For the year ended September 30, 2013, net cash flows used by operations was ($244,288). Net cash flows used in operating activities for the year ended September 30, 2013, consisted of a net loss of ($2,421,1454) adjusted by: (i) $994,808 in net loss due to a change in the fair value of the derivative liability on convertible notes payable; partially offset by (ii) $471,549 in share based payments; (iii) $227,264 of derivative expense on new convertible notes issued; (iv) $202,360 for loss on retirement of debt; and (v) $197,977 in amortization of debt issue cost. Net cash flows used by operating activities was further changed by $36,789 in increased accrued interest.
Cash Flows from Investing Activities
For the year ended September 30, 2014, net cash flows used in investing activities was ($62,427.)
This was comprised of a long-term note receivable acquired in the acquisition of Hydra of $47,005, partially offset by cash of $402. In addition, the Company spent $15,824 on the purchase of property and equipment.
There was no cash flow from investing activities for the year ended September 30, 2013.
Cash Flows from Financing Activities
We have financed our operations primarily from debt or the issuance of equity instruments.
For the year ended September 30, 2014, net cash flows provided from financing activities was $812,365, consisting of (i) $504,375 in proceeds from convertible promissory notes; (ii) $300,000 in the issuance of convertible notes payable for consulting services, and (iii) $7,990 for sales of common stock.
For the year ended September 30, 2013, net cash flows provided from financing activities was $243,500, consisting of (i) $28,500 in proceeds from convertible promissory notes and (ii) $215,000 in the issuance of convertible notes payable for consulting services,
21
We anticipate that we will meet our ongoing cash requirements by selling our equity securities or through shareholder loans. Our management has changed our business focus to the acquisition of operating assets and we estimate that our expenses over the next 12 months will be approximately $800,000, as described in the table below. These estimates may change significantly depending on the nature of our future business activities and our ability to raise capital from shareholders or other sources.
|
|
Estimated
|
Estimated Expenses
|
||||
|
Description
|
Completion Date
|
($)
|
||||
|
Legal and accounting fees
|
12 months
|
50,000
|
||||
|
Consulting Expenses
|
12 months
|
300,000
|
||||
|
General and administrative expenses
|
12 months
|
450,000
|
||||
|
Total
|
|
800,000
|
||||
Material Commitments
As of the date of this Annual Report, we do not have any material commitments other than as described below.
Convertible Debt
Off-Balance Sheet Arrangements
We have no off-balance sheet arrangements that have or are reasonably likely to have a current or future effect on our financial condition, revenues or expenses, results of operations, liquidity, capital expenditures or capital resources that are material to stockholders.
Inflation
The amounts presented in the financial statements do not provide for the effect of inflation on our operations or financial position. The net operating losses shown would be greater than reported if the effects of inflation were reflected either by charging operations with amounts that represent replacement costs or by using other inflation adjustments.
Critical Accounting Policies
The preparation of financial statements in conformity with U.S. generally accepted accounting principles requires management to make estimates and assumptions that affect the reported amounts of assets and liabilities and disclosure of contingent assets and liabilities at the date of the financial statements and the reported amounts of revenues and expenses during the reporting period.
Such estimates for the year ended September 30, 2014 and 2013, and assumptions affect, among others, the following:
|
●
|
estimated carrying value, useful lives and related impairment of property and equipment;
|
|
|
●
|
estimated fair value of derivative liabilities;
|
|
|
●
|
estimated valuation allowance for deferred tax assets, due to continuing losses; and
|
|
|
●
|
estimated fair value of share based payments.
|
Making estimates requires management to exercise significant judgment. It is at least reasonably possible that the estimate of the effect of a condition, situation or set of circumstances that existed at the date of the financial statements, which management considered in formulating its estimate could change in the near term due to one or more future confirming events. Accordingly, the actual results could differ significantly from estimates.
Derivative Liabilities
Fair value accounting requires bifurcation of embedded derivative instruments such as conversion features in convertible debt or equity instruments, and measurement of their fair value for accounting purposes. In determining the appropriate fair value, the Company uses the Black-Scholes option-pricing model. In assessing the convertible debt instruments, management determines if the convertible debt host instrument is conventional convertible debt and further if there is a beneficial conversion feature requiring measurement. If the instrument is not considered conventional convertible debt, the Company will continue its evaluation process of these instruments as derivative financial instruments.
22
Once determined, derivative liabilities are adjusted to reflect fair value at each reporting period end, with any increase or decrease in the fair value being recorded in results of operations as an adjustment to fair value of derivatives. In addition, the fair value of freestanding derivative instruments such as warrants, are also valued using the Black-Scholes option-pricing model.
Debt Issue Costs and Debt Discount
The Company may pay debt issue costs, and record debt discounts in connection with raising funds through the issuance of convertible debt. These costs are amortized over the life of the debt to interest expense. If a conversion of the underlying debt occurs, a proportionate share of the unamortized amounts is immediately expensed.
Original Issue Discount
For certain convertible debt issued, the Company provides the debt holder with an original issue discount. The original issue discount is recorded to debt discount, reducing the face amount of the note and is amortized to interest expense over the life of the debt.
Share-based Payments
Generally, all forms of share-based payments, including stock option grants, warrants, restricted stock grants and stock appreciation rights are measured at their fair value on the awards’ grant date, based on estimated number of awards that are ultimately expected to vest. Share-based compensation awards issued to non-employees for services rendered are recorded at either the fair value of the services rendered or the fair value of the share-based payment, whichever is more readily determinable.
In accordance with accounting guidance now codified as FASB ASC Topic 260, “Earnings per Share, ” basic earnings (loss) per share is computed by dividing net income (loss) by weighted average number of shares of common stock outstanding during each period. Diluted earnings (loss) per share is computed by dividing net income (loss) by the weighted average number of shares of common stock, common stock equivalents and potentially dilutive securities outstanding during the period.
Since the Company reflected a net loss in 2012 and 2011, respectively, the effect of considering any common stock equivalents, if exercisable, would have been anti-dilutive. A separate computation of diluted earnings (loss) per share is not presented.
Fair Value of Financial Instruments
ASC 820 defines fair value, provides a consistent framework for measuring fair value under generally accepted accounting principles and expands fair value financial statement disclosure requirements. ASC 820’s valuation techniques are based on observable and unobservable inputs. Observable inputs reflect readily obtainable data from independent sources, while unobservable inputs reflect our market assumptions. ASC 820 classifies these inputs into the following hierarchy:
|
●
|
Level 1 inputs: Quoted prices for identical instruments in active markets.
|
|
|
●
|
Level 2 inputs: Quoted prices for similar instruments in active markets; quoted prices for identical or similar instruments in markets that are not active; and model-derived valuations whose inputs are observable or whose significant value drivers are observable.
|
|
|
●
|
Level 3 inputs: Instruments with primarily unobservable value drivers.
|
23
Foreign Currency Transactions
The Company’s reporting currency is the U.S. Dollar. All transactions initiated in Canadian Dollars are translated to U.S. Dollars in accordance with ASC 830-10-20 “Foreign Currency Translation” as follows:
|
(i)
|
Monetary assets and liabilities at the rate of exchange in effect at the balance sheet date;
|
|
|
(ii)
|
Equity at historical rates; and
|
|
|
(iii)
|
Revenue and expense items at the average exchange rate prevailing during the period.
|
Adjustments arising from such translations are deferred until realization and are included as a separate component of stockholders’ equity (deficit) as a component of comprehensive income (loss). Therefore, translation adjustments are not included in determining net income (loss) but reported as other comprehensive income (loss).
For foreign currency transactions, the Company translates these amounts to the Company’s functional currency at the exchange rate effective on the invoice date. If the exchange rate changes between the time of purchase and the time actual payment is made, a foreign exchange transaction gain or loss results which is included in determining net income for the period.
Item 7A. Quantitative and Qualitative Disclosures About Market Risk.
Item 8. Financial Statements and Supplementary Data.
Our financial statements are contained beginning on Page F-1 which appear at the end of this Annual Report.
Item 9. Changes in and Disagreements With Accountants on Accounting and Financial Disclosure.
There were no changes in or disagreements with accountants on accounting and financial disclosure for the year ended September 30, 2013.
Item 9A. Controls and Procedures.
(a) Evaluation of Disclosure Controls and Procedures
The Company’s management, with the participation of the Company’s principal executive officer (“CEO”) and principal financial officer (“CFO”), evaluated the effectiveness of the Company’s disclosure controls and procedures (as defined in Rules 13a-15(e) and 15d-15(e) promulgated under the Securities Exchange Act of 1934, as amended (the “Exchange Act”)) as of the end of the period covered by this report. Based on this evaluation, the CEO and CFO concluded that, as of the end of such period, the Company’s disclosure controls and procedures were not effective to ensure that information that is required to be disclosed by the Company in the reports it files or submits under the Exchange Act is (i) recorded, processed, summarized and reported, within the time periods specified in the SEC’s rules and forms and (ii) accumulated and communicated to the Company’s management, including the CEO and CFO, as appropriate, to allow timely decisions regarding required disclosure.
(b) Management’s Assessment of Internal Control over Financial Reporting
Management is responsible for establishing and maintaining adequate internal control over financial reporting as defined in Rules 13a − 15(f) and 15d − 15(f) under the Exchange Act. Because of inherent limitations, internal control over financial reporting may not prevent or detect misstatements. Also, projections of any evaluation of effectiveness to future periods are subject to the risk that internal controls may become inadequate because of changes in conditions, or that the degree of compliance with the policies or procedures may deteriorate.
24
Management has assessed the effectiveness of our internal control over financial reporting as of September 30, 2013. In making this assessment, management used the criteria established in Internal Control - Integrated Framework issued by the Committee of Sponsoring Organizations of the Treadway Commission (COSO). The objective of this assessment is to determine whether our internal control over financial reporting was effective as of September 30, 2013. Based on our assessment utilizing the criteria issued by COSO, management has concluded that our internal control over financial reporting was not effective as of September 30, 2014. Management’s assessment identified the following material weaknesses:
|
●
|
As of September 30, 2014, there was a lack of accounting personnel with the requisite knowledge of Generally Accepted Accounting Principles (“GAAP”) in the U.S. and the financial reporting requirements of the SEC.
|
|
|
●
|
As of September 30, 2014, there were insufficient written policies and procedures to insure the correct application of accounting and financial reporting with respect to the current requirements of GAAP and SEC disclosure requirements.
|
|
|
●
|
As of September 30, 2014, there was a lack of segregation of duties, in that we only had one person performing all accounting-related duties.
|
Notwithstanding the existence of these material weaknesses in our internal control over financial reporting, our management believes that the financial statements included in its reports fairly present in all material respects the Company’s financial condition, results of operations and cash flows for the periods presented. We continue to evaluate the effectiveness of internal controls and procedures on an on-going basis. We plan to further address these issues once we commence operations and are able to hire additional personnel in financial reporting.
(c) Changes in Internal Control over Financial Reporting
There were no changes in our internal control over financial reporting, as defined in Rules 13a-15(f) and 15d-15(f) under the Exchange Act, during our most recently completed fiscal quarter that have materially affected, or are reasonably likely to materially affect, our internal control over financial reporting.
Item 9B. Other Information.
None.
25
Item 10. Directors, Executive Officers, and Corporate Governance.
The following table and biographical summaries set forth information, including principal occupation and business experience, about our directors and executive officers as of January 21, 2015.
|
Name
|
Age
|
Position
|
Officer and/or Director Since
|
|||
|
Frank Neukomm
|
65
|
Chief Executive Officer and Chairman
|
January 2013
|
|||
|
Robert Farr
|
69
|
Chief Operating Officer and President
|
January 2013
|
The Company’s directors serve in such capacity until the first annual meeting of the Company’s shareholders and until their successors have been elected and qualified. The Company’s officers serve at the discretion of the Company’s board of directors, until their death, or until they resign or have been removed from office.
There are no agreements or understandings for any director or officer to resign at the request of another person and none of the directors or officers is acting on behalf of or will act at the direction of any other person. The activities of each director and officer are material to the operation of the Company. No other person’s activities are material to the operation of the Company.
Frank Neukomm, age 65, Chief Executive Officer, Chief Financial Officer, Chairman
Frank Neukomm has an extensive background in finance, mergers & acquisitions, and sales & marketing. He served as a senior executive of brokerage and M&A companies, software companies, and telecom companies. He was instrumental in industries as diverse as insurance, consumer retail goods, industrial services and wireless telecommunications. Mr. Neukomm also arranged financing for and served as a director of several public companies.
Robert Farr, age 69, Vice President of Operations and Director
Robert C, Farr brings a 34 year diversified business background in operations leadership replete with examples of improved productivity and increased profits. Broad experience with several Fortune 500 companies includes successes in marketing, customer relations, administration, finance, operations, new products and worldwide vendor selection / purchasing. Mr. Farr’s recent experience includes securing and structuring funding for both public and private companies including debt and equity as well as international funding through the US Ex-Im Bank , Mr. Farr has a BS in finance from Mississippi State University and was a U.S. Naval officer in the Vietnam Conflict .
26
Exchange Act or subject to the requirements of section 15(d) of such Act or any company registered as an investment company under the Investment Company Act of 1940, 15 U.S.C. 80a-1, et seq., as amended.
Family Relationships
None
Subsequent Executive Relationships
No director or executive officer has been a director or executive officer of any business which has filed a bankruptcy petition or had a bankruptcy petition filed against it during the past five years. No director or executive officer has been convicted of a criminal offense or is the subject of a pending criminal proceeding during the past five years. No director or executive officer has been the subject of any order, judgment or decree of any court permanently or temporarily enjoining, barring, suspending or otherwise limiting his involvement in any type of business, securities or banking activities during the past five years. No director or officer has been found by a court to have violated a federal or state securities or commodities law during the past five years. None of our directors or executive officers or their respective immediate family members or affiliates are indebted to us.
Item 11. Executive Compensation.
The following summary compensation table sets forth all compensation awarded to, earned by, or paid to the named executive officers paid by us during the years ended September 30, 2012 and 2011.
|
Principal Position
|
Year
|
Salary
($)
|
Bonus
($)
|
Stock Awards
($)
|
Option Awards
($)
|
Non-Equity Incentive Plan Compensation ($)
|
All Other Compensation ($)*
|
Total ($)
|
||||||||||||||||||||||
|
Frank Neukomm
|
2014
|
$
|
0
|
$
|
0
|
$
|
2,627,500
|
$
|
0
|
$
|
0
|
$
|
36,000
|
$
|
2,663,500
|
|||||||||||||||
|
Chief Executive Officer
|
2013
|
$
|
0
|
$
|
0
|
$
|
155,000
|
$
|
0
|
$
|
0
|
$
|
0
|
$
|
155,000
|
|||||||||||||||
|
Robert Farr
|
2013
|
$
|
0
|
$
|
0
|
$
|
2,627,500
|
$
|
0
|
$
|
0
|
$
|
31,200
|
$
|
2,658,700
|
|||||||||||||||
|
Chief Operating Officer
|
2013
|
$
|
0
|
$
|
0
|
$
|
155,000
|
$
|
0
|
$
|
0
|
$
|
0
|
$
|
155,000
|
|||||||||||||||
*- Other compensation includes amounts paid as contracted services to entities managed by the Mssrs. Neukomm and Farr. See Item 13, Related Party Transactions, to Financial statements for detail
Outstanding Equity Awards
None.
Director Compensation
The table below lists the aggregate amount of payments that were made to directors during the year ended September 30, 2014.
|
Name
|
Fees Earned or Paid in Cash ($)
|
Stock Awards ($)
|
Option Awards ($)
|
Non-Equity Incentive Plan Comp. ($)
|
Nonqualified Deferred Compensation Earnings
|
All Other Compensation ($)(1)
|
Total ($)
|
|||||||||||||||||||||
|
Frank Neukomm
|
-
|
-
|
-
|
-
|
-
|
-
|
-
|
|||||||||||||||||||||
|
Robert Farr
|
-
|
-
|
-
|
-
|
-
|
-
|
-
|
|||||||||||||||||||||
27
Item 12. Security Ownership of Certain Beneficial Owners and Management and Related Stockholder Matters.
As of January 21, 2015, our authorized capitalization was 10,200,000,000 shares of capital stock, consisting of 10,000,000,000 shares of common stock, $0.001 par value per share and 200,000,000 shares of preferred stock, par value $0.001. As of January 21, 2015, there were 9,941,744 shares of our common stock outstanding, all of which were fully paid, non-assessable and entitled to vote. Each share of our common stock entitles its holder to one vote on each matter submitted to the stockholders.
The following table sets forth, as of January 21, 2015, the number of shares of our common stock owned by (i) each person who is known by us to own of record or beneficially five percent (5%) or more of our outstanding shares, (ii) each of our directors, (iii) each of our executive officers and (iv) all of our directors and executive officers as a group. Unless otherwise indicated, each of the persons listed below has sole voting and investment power with respect to the shares of our common stock beneficially owned.
|
Title of Class
|
Name of Beneficial Owner (1)
|
Number of
Shares (2)
|
Percent of
Class
|
|||||||
|
Preferred and Common
|
Frank Neukomm
|
401,440
|
4.0
|
%
|
||||||
|
Robert Farr
|
401,440
|
4.0
|
%
|
|||||||
|
All officers and directors as a group (2 persons)
|
802,880
|
8.0
|
%
|
|||||||
|
(1)
|
Beneficial ownership is determined in accordance with Rule 13d-3 of the Exchange Act and generally includes voting or investment power with respect to securities.
|
|
(2)
|
Each director owns 50,000,000 shares of preferred stock (convertible into common stock on a 1:250 basis) and 201,440 shares of common stock.
|
Changes in Control
We are not aware of any arrangements that may result in a change in control of the Company.
Description of Securities
General
Our authorized capital stock consists of 10,000,000,000 shares of common stock, par value $0.001, and 200,000,000 shares of preferred stock, par value $0.001 (none of which are issued and outstanding).
Common Stock
The shares of our common stock presently outstanding, and any shares of our common stock issues upon exercise of stock options and/or warrants, will be fully paid and non-assessable. Each holder of common stock is entitled to one vote for each share owned on all matters voted upon by shareholders, and a majority vote is required for all actions to be taken by shareholders. In the event we liquidate, dissolve or wind-up our operations, the holders of the common stock are entitled to share equally and ratably in our assets, if any, remaining after the payment of all our debts and liabilities and the liquidation preference of any shares of preferred stock that may then be outstanding. The common stock has no preemptive rights, no cumulative voting rights, and no redemption, sinking fund, or conversion provisions. Since the holders of common stock do not have cumulative voting rights, holders of more than 50% of the outstanding shares can elect all of our Directors, and the holders of the remaining shares by themselves cannot elect any directors. Holders of common stock are entitled to receive dividends, if and when declared by the board of directors, out of funds legally available for such purpose, subject to the dividend and liquidation rights of any preferred stock that may then be outstanding.
Voting Rights
Each holder of common stock is entitled to one vote for each share of common stock held on all matters submitted to a vote of stockholders.
28
Dividends
Subject to preferences that may be applicable to any then-outstanding shares of preferred stock, if any, and any other restrictions, holders of common stock are entitled to receive ratably those dividends, if any, as may be declared from time to time by the Company’s board of directors out of legally available funds. The Company and its predecessors have not declared any dividends in the past. Further, the Company does not presently contemplate that there will be any future payment of any dividends on common stock.
Item 13. Certain Relationships and Related Transactions, and Director Independence.
Related Transactions
During Fiscal Year 2014, payments of $36,000 and $31,200 were made to companies controlled by Mssrs. Neukomm and Farr, respectively, for sources provided.
Director Independence
The common stock of the Company trades on the OTCBB, a quotation system which currently does not have director independence requirements. As of September 30, 2014, none of the Company’s directors were considered to be “independent.”
Item 14. Principal Accounting Fees and Services.
a. Audit Fees: Aggregate fees billed by Bravos and Associates CPAs for professional services rendered for the audit of our annual financial statements for the years ended September 30, 2014 and 2013, were approximately $12,000 and $-0-, respectively.
b. Audit-Related Fees: No fees were billed for assurance and related services reasonably related to the performance of the audit or review of our financial statements and not reported under “Audit Fees” above in the years ended September 30, 2014 and 2013, respectively.
c. Tax Fees: Aggregate fees billed by Bravos & Co.. for tax services for the year ended September 30, 2014 and 2013, were $0 and $0, respectively.
29
Item 15. Exhibits, Financial Statement Schedules.
|
Exhibit No.
|
Description
|
|
|
4.1
|
$2,545,000.00 Secured Convertible Note, dated February 23, 2011 (as filed as Exhibit 4.1 to the Company’s Current Report on Form 8-K, as filed with the SEC on March 2, 2011).
|
|
|
4.2
|
Common Stock Purchase Warrant, dated February 23, 2011 (as filed as Exhibit 4.2 to the Company’s Current Report on Form 8-K, as filed with the SEC on March 2, 2011).
|
|
|
10.1
|
Note and Warrant Purchase Agreement, dated February 23, 2011 (as filed as Exhibit 10.1 to the Company’s Current Report on Form 8-K, as filed with the SEC on March 2, 2011).
|
|
|
10.2
|
Form of Buyer Note (secured by Trust Deed) (as filed as Exhibit 10.2 to the Company’s Current Report on Form 8-K, as filed with the SEC on March 2, 2011).
|
|
|
10.3
|
Form of Buyer Note (not secured by Trust Deed) (as filed as Exhibit 10.3 to the Company’s Current Report on Form 8-K, as filed with the SEC on March 2, 2011).
|
|
|
10.4
|
Form of Deed of Trust (as filed as Exhibit 10.4 to the Company’s Current Report on Form 8-K, as filed with the SEC on March 2, 2011).
|
|
|
10.5
|
Escrow Agreement, dated February 23, 2011 (as filed as Exhibit 10.5 to the Company’s Current Report on Form 8-K, as filed with the SEC on March 2, 2011).
|
|
|
10.6
|
Form of Deed of Reconveyance (as filed as Exhibit 10.6 to the Company’s Current Report on Form 8-K, as filed with the SEC on March 2, 2011).
|
|
|
10.7
|
Form of Reconveyance Request (as filed as Exhibit 10.7 to the Company’s Current Report on Form 8-K, as filed with the SEC on March 2, 2011).
|
|
|
10.8
|
Security Agreement, dated February 23, 2011 (as filed as Exhibit 10.8 to the Company’s Current Report on Form 8-K, as filed with the SEC on March 2, 2011).
|
|
|
31.1
|
Rule 13a-14(a)/15d-14(a) certification of Principal Executive Officer*
|
|
|
31.2
|
Rule 13a-14(a)/15d-14(a) certification of Principal Financial Officer*
|
|
|
32.1
|
Certification pursuant to 18 USC, Section 1350 of Principal Executive Officer*
|
|
|
32.2
|
Certification pursuant to 18 USC, Section 1350 of Principal Financial Officer*
|
* filed herewith
30
SIGNATURES
Pursuant to the requirements of Section 13 or 15(d) of the Securities Exchange Act of 1934, the registrant has caused this report to be signed on its behalf by the undersigned, thereunto duly authorized.
|
HYDROGEN FUTURE CORP.
|
|||
|
Date: January 21, 2015
|
By:
|
/s/ Frank Neukomm
|
|
|
Name:
|
Frank Neukomm
|
||
|
Title:
|
Chief Executive Officer
(Principal Executive Officer)
Chief Financial Officer
(Principal Financial Officer)
(Principal Accounting Officer)
|
||
In accordance with the Exchange Act, this report has been signed below by the following persons on behalf of the registrant and in the capacities and on the dates indicated.
|
Signature
|
Title
|
Date
|
||
|
/s/ Frank Neukomm
|
Chief Executive Officer, (Principal Executive Officer), Chairman of the Board
|
January 21, 2015
|
||
|
Frank Neukomm
|
||||
|
/s/ Robert Farr
|
Chief Operations Officer and President
|
Janaury 21, 2015
|
||
|
Robert Farr
|
31
REPORT OF INDEPENDENT REGISTERED PUBLIC ACCOUNTING FIRM
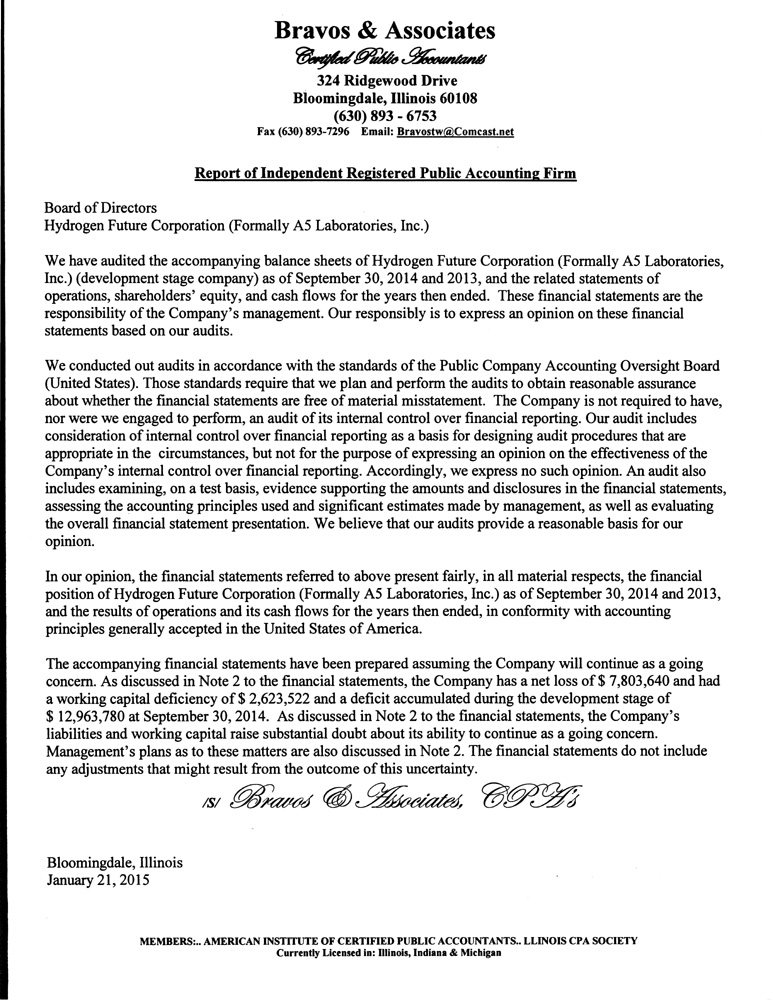
F-1
Hydrogen Future Corp.
(A Development Stage Company)
Balance Sheets
(Audited)
|
September 30,
|
September 30,
|
|||||||
|
2014
|
2013
|
|||||||
|
Assets
|
||||||||
|
Current assets
|
||||||||
|
Cash
|
$ | 31,033 | $ | (0 | ) | |||
|
Other receivables
|
- | 3,194 | ||||||
|
Inventory
|
712 | |||||||
|
Total current assets
|
31,745 | 3,194 | ||||||
|
Non-current assets
|
||||||||
|
Property and equipment - net
|
181,259 | 199,567 | ||||||
|
Note Receivable
|
47,005 | |||||||
|
Debt issue costs - net
|
20,288 | 15,983 | ||||||
|
Goodwill
|
3,353,156 | |||||||
|
Total Non-Current Assets
|
3,601,708 | 215,550 | ||||||
|
Total assets
|
$ | 3,633,453 | $ | 218,744 | ||||
|
Liabilities and Stockholders' (Deficit)
|
||||||||
|
Current Liabilities
|
||||||||
|
Accounts payable and accrued liabilities
|
$ | 165,991 | $ | 122,610 | ||||
|
Accounts payable - related party
|
415,719 | 415,719 | ||||||
|
Accrued interest payable
|
379,092 | 74,247 | ||||||
|
Notes/Advances payable - related party
|
27,173 | 27,173 | ||||||
|
Derivative liability
|
243,175 | 1,337,315 | ||||||
|
Convertible debt - net
|
442,609 | 591,738 | ||||||
|
Non-convertible debt from Hydra Acquistion
|
981,508 | - | ||||||
|
Total current liabilities
|
2,655,267 | 2,568,801 | ||||||
|
Stockholders' Equity /(Deficit)
|
||||||||
|
Preferred stock, Series A, $0.001 par value, 200,000,000 shares authorized; 100,000,000 issued and outstanding at September 30, 2014 and September 30, 2013
|
100,000 | 100,000 | ||||||
|
Preferred stock,Series B, $0.001 par value, 1 share authorized; 1 share and 0 shares issued and outstanding at September 30, 2014 and September 30, 2013, respectively
|
- | - | ||||||
|
Common stock, $0.001 par value, 10,000,000,000 shares authorized; 8,911,263 and 800 issued and outstanding at September 30, 2014 and September 30, 2013, respectively
|
8,912 | 1 | ||||||
|
Additional paid-in capital
|
13,832,548 | 2,709,575 | ||||||
|
Deficit accumulated during the development stage
|
(12,963,780 | ) | (5,160,139 | ) | ||||
|
Accumulated other comprehensive income
|
505 | 505 | ||||||
|
Total stockholders' (deficit)
|
978,185 | (2,350,057 | ) | |||||
|
Total liabilities and stockholders' (deficit)
|
$ | 3,633,453 | $ | 218,744 | ||||
F-2
Hydrogen Future Corp.
(A Development Stage Company)
Statements of Operations
(Audited)
|
Fiscal year Ended September 30
|
June 21, 2006 (inception) through September 30, | |||||||||||
|
2014
|
2013
|
2014
|
||||||||||
|
Expenses
|
||||||||||||
|
General and Administrative Expenses
|
$ | 6,047,884 | $ | 761,052 | $ | 8,651,826 | ||||||
|
Issuance of Common Stock to settle a prior liability
|
117,000 | $ | 117,000 | |||||||||
|
Impairment of software
|
- | - | $ | 1,035,027 | ||||||||
|
Total
|
6,164,884 | 761,052 | 9,803,853 | |||||||||
|
Other Income/(Expense)
|
||||||||||||
|
Interest expense
|
(312,873 | ) | (235,661 | ) | (844,037 | ) | ||||||
|
Derivative expense
|
(2,685,435 | ) | (227,264 | ) | (4,253,325 | ) | ||||||
|
Change in fair value of derivative liability
|
3,509,298 | (994,808 | ) | 4,253,472 | ||||||||
|
Loss on Retirement of Debt
|
(2,149,746 | ) | (202,360 | ) | (2,352,106 | ) | ||||||
|
Tax refunds
|
- | 0 | 36,071 | |||||||||
|
Total Other (Expense) - net
|
(1,638,756 | ) | (1,660,093 | ) | (3,159,926 | ) | ||||||
|
Net Income (Loss)
|
$ | (7,803,640 | ) | $ | (2,421,145 | ) | $ | (12,963,780 | ) | |||
|
Net loss per common share - basic
|
$ | (6.58 | ) | $ | (4,172.94 | ) | ||||||
|
Net loss per common share - diluted
|
$ | (4.92 | ) | $ | (3,026.50 | ) | ||||||
|
Weighted average number of common shares outstanding
|
||||||||||||
|
during the period/year - basic
|
1,186,813 | 580 | ||||||||||
|
Weighted average number of common shares outstanding
|
||||||||||||
|
during the period/year - diluted
|
1,586,813 | 800 | ||||||||||
F-3
Hydrogen Future Corp.
(A Development Stage Company)
Statements of Cash Flows
(Audited)
|
Fiscal Years Ended September 30,
|
June 21, 2006 (Inception) to September 30,
|
|||||||||||
|
2014
|
2013
|
2014 | ||||||||||
|
CASH FLOWS FROM OPERATING ACTIVITIES:
|
||||||||||||
|
Net loss
|
$ | (7,803,640 | ) | $ | (2,421,145 | ) | $ | (12,963,780 | ) | |||
|
Adjustments to reconcile net loss
|
||||||||||||
|
to net cash provided by (used in) operating activities:
|
||||||||||||
|
Share based payments
|
5,255,000 | 471,549 | 5,907,549 | |||||||||
|
Impairment of Software
|
- | 1,035,027 | ||||||||||
|
Derivative expense
|
2,685,435 | 227,264 | 4,253,326 | |||||||||
|
Depreciation
|
34,132 | 34,132 | 469,214 | |||||||||
|
Amortization of debt issue cost
|
33,570 | 13,199 | 68,488 | |||||||||
|
Amortization of debt discount
|
148,603 | 197,977 | 582,905 | |||||||||
|
Amortization of Original Issue Discount
|
36,027 | 116 | 36,143 | |||||||||
|
Change in fair value of derivative liabilities
|
(3,509,298 | ) | 994,808 | (4,253,471 | ) | |||||||
|
Accrued interest on Retired debt
|
35,296 | 779 | 36,075 | |||||||||
|
Legal fees on debt conversions
|
20,145 | 20,145 | ||||||||||
|
Loss on Retirement of Debt
|
2,149,746 | 202,360 | 2,352,106 | |||||||||
|
Loss on Issuance of Common Stock to settle a prior liability
|
117,000 | 117,000 | ||||||||||
|
Issuance of Common stock for consulting agreements
|
48,000 | 48,000 | ||||||||||
|
Changes in operating assets and liabilities:
|
||||||||||||
|
(Increase) decrease in other receivables
|
3,194 | 0 | ||||||||||
|
(Increase) decrease in Inventory
|
(712 | ) | (712 | ) | ||||||||
|
Increase (decrease) in accounts payable and accrued expense
|
43,381 | - | 165,991 | |||||||||
|
Increase in accounts payable - related party
|
- | 415,719 | ||||||||||
|
Increase in working capital from acquisition
|
(319,630 | ) | - | (319,630 | ) | |||||||
|
Increase in accrued interest
|
304,845 | 36,789 | 379,092 | |||||||||
|
Net cash provided by (used in) operating activities
|
(718,906 | ) | (244,288 | ) | (1,650,814 | ) | ||||||
|
CASH FLOWS FROM INVESTING ACTIVITIES:
|
||||||||||||
|
Note receivable Acquired in Acquistion
|
(47,005 | ) | (47,005 | ) | ||||||||
|
Cash acquired in Acquisition
|
402 | 402 | ||||||||||
|
Purchase of property and equipment
|
(15,824 | ) | (304,623 | ) | ||||||||
|
Net cash used in investing activities
|
(62,427 | ) | - | (351,226 | ) | |||||||
|
CASH FLOWS FROM FINANCING ACTIVITIES:
|
||||||||||||
|
Proceeds from related party notes/advances
|
- | 31,586 | ||||||||||
|
Proceeds from convertible notes payable
|
504,375 | 28,500 | 873,178 | |||||||||
|
Notes Issued for Professional services
|
300,000 | 215,000 | 568,727 | |||||||||
|
Repayment of related party notes/advances
|
- | (968 | ) | |||||||||
|
Cash paid as debt offering costs
|
- | (24,000 | ) | |||||||||
|
Proceeds from issuance of common stock
|
7,990 | 587,490 | ||||||||||
|
Net cash provided by financing activities
|
812,365 | 243,500 | 2,036,013 | |||||||||
|
Net (Decrease) in Cash
|
31,032 | (788 | ) | 33,974 | ||||||||
|
Effect of Exchange Rates on Cash
|
(2,941 | ) | ||||||||||
|
Cash - Beginning of Period/Year
|
(0 | ) | 788 | - | ||||||||
|
Cash - End of Period/Year
|
$ | 31,032 | $ | 0 | $ | 31,032 | ||||||
|
SUPPLEMENTARY CASH FLOW INFORMATION:
|
||||||||||||
|
Cash paid during the period/year for:
|
||||||||||||
|
Interest
|
$ | - | $ | - | $ | - | ||||||
|
Income Taxes
|
$ | - | $ | - | $ | - | ||||||
|
SUPPLEMENTARY DISCLOSURE OF NON-CASH INVESTING AND FINANCING ACTIVITIES:
|
||||||||||||
|
Debt converted to common shares
|
$ | 739,093 | $ | - | $ | 850,577 | ||||||
|
Common stock issued to acquire software
|
$ | - | $ | - | $ | 1,380,876 | ||||||
|
Notes payable acquired in acquisition
|
$ | 984,008 | $ | 984,008 | ||||||||
|
Preferred stock issued to officers
|
$ | 310,000 | $ | 310,000 | ||||||||
|
Debt discount recorded on convertible debt accounted for as a derivative liability
|
$ | 804,375 | $ | 243,500 | $ | 1,047,875 | ||||||
|
Debt discount recorded on convertible debt accounted for as a derivative liability - original issue discount
|
$ | 27,122 | $ | 27,122 | ||||||||
|
Debt issue costs - warrants
|
$ | - | $ | 26,901 | $ | 26,901 | ||||||
F-4
Hydrogen Future Corp.
Statement of Stockholder's Equity
From the Period of Inception to September 30, 2013
|
Common Stock, $0.001 Par Value
|
Series A Preferred Stock, $0.001 Par Value
|
Series B Preferred Stock, $0.001 Par Value
|
Additional Paid-In | Deficit Acquired During Development | Accumulated Other Comprehensive Income | Total Stockholders' Equity | ||||||||||||||||||||||||||||||||||
|
Shares
|
Amount
|
Shares
|
Amount
|
Shares
|
Amount
|
Capital
|
Stage
|
(Loss)
|
(Deficit)
|
|||||||||||||||||||||||||||||||
|
Proceeds from the Issuance of founders stock- ($62.50/share)
|
80 | $ | 0 | - | $ | - | - | $ | - | 5,000 | $ | - | $ | - | $ | 5,000 | ||||||||||||||||||||||||
|
Proceeds from the Issuance of founders stock- ($62.50/share)
|
120 | 0 | - | - | - | - | 15,000 | - | 15,000 | |||||||||||||||||||||||||||||||
|
Net loss- Inception (June 21, 2006) to September 30, 2006
|
- | - | - | - | - | - | - | (2,631 | ) | - | (2,631 | ) | ||||||||||||||||||||||||||||
|
Balance- September 30, 2006
|
200 | 0 | - | - | - | - | 20,000 | (2,631 | ) | - | 17,369 | |||||||||||||||||||||||||||||
|
Proceeds from the Issuance of common stock- ($500/share)
|
164 | 0 | - | - | - | - | 82,000 | - | - | 82,000 | ||||||||||||||||||||||||||||||
|
Net loss for the year ended September 30, 2007
|
- | - | - | - | - | - | - | (16,960 | ) | - | (16,960 | ) | ||||||||||||||||||||||||||||
|
Balance- September 30, 2007
|
364 | 0 | - | - | - | - | 102,000 | (19,591 | ) | - | 82,409 | |||||||||||||||||||||||||||||
|
Net loss for the year ended September 30, 2008
|
- | - | - | - | - | - | - | (18,199 | ) | - | (18,199 | ) | ||||||||||||||||||||||||||||
|
Balance- September 30, 2008
|
364 | 0 | - | - | - | - | 102,000 | (37,790 | ) | - | 64,210 | |||||||||||||||||||||||||||||
|
Net loss for the year ended September 30, 2009
|
- | - | - | - | - | - | - | (19,076 | ) | - | (19,076 | ) | ||||||||||||||||||||||||||||
|
Balance- September 30, 2009
|
364 | 0 | - | - | - | - | 102,000 | (56,866 | ) | - | 45,134 | |||||||||||||||||||||||||||||
|
Proceeds from the Issuance of common stock- ($81,250/share)
|
2 | 0 | - | - | - | - | 162,500 | - | - | 162,500 | ||||||||||||||||||||||||||||||
|
Common stock issued to acquire software ($110,000/share)
|
13 | 0 | - | - | - | - | 1,380,876 | - | - | 1,380,876 | ||||||||||||||||||||||||||||||
|
Proceeds from the Issuance of common stock- ($100,000/share)
|
2 | 0 | - | - | - | - | 200,000 | - | - | 200,000 | ||||||||||||||||||||||||||||||
|
Common stock issued for consulting services ($100,000/share)
|
0 | 0 | - | - | - | - | 16,000 | - | - | 16,000 | ||||||||||||||||||||||||||||||
|
Common stock issued for consulting services ($112,500/share)
|
1 | 0 | - | - | - | - | 135,000 | - | - | 135,000 | ||||||||||||||||||||||||||||||
|
Net loss for the year ended September 30, 2010
|
- | - | - | - | - | - | - | (351,790 | ) | - | (351,790 | ) | ||||||||||||||||||||||||||||
|
Foreign Currency translation adjustment
|
- | - | - | - | - | - | - | - | (3,079 | ) | (3,079 | ) | ||||||||||||||||||||||||||||
|
Balance- September 30, 2010
|
382 | 0 | - | - | - | - | 1,996,376 | (408,656 | ) | (3,079 | ) | 1,584,641 | ||||||||||||||||||||||||||||
|
Proceeds from the Issuance of common stock- ($40,000/share)
|
3 | 0 | - | - | - | - | 99,999 | - | - | 100,000 | ||||||||||||||||||||||||||||||
|
Proceeds from the Issuance of common stock- ($25,000/share)
|
1 | 0 | - | - | - | - | 15,000 | - | - | 15,000 | ||||||||||||||||||||||||||||||
|
Debt discount on convertible notes- Original Issue Discount
|
- | - | - | - | - | - | 27,122 | - | - | 27,122 | ||||||||||||||||||||||||||||||
|
Debt issue costs- warrants
|
- | - | - | - | - | - | 26,901 | - | - | 26,901 | ||||||||||||||||||||||||||||||
|
Common stock issued for conversion of Note ($2,789/share)
|
9 | 0 | - | - | - | - | 24,990 | - | - | 24,990 | ||||||||||||||||||||||||||||||
|
Net loss for the year ended September 30, 2011
|
- | - | - | - | - | - | - | (3,024,617 | ) | - | (3,024,617 | ) | ||||||||||||||||||||||||||||
|
Foreign Currency translation adjustment
|
- | - | - | - | - | - | - | - | 9,234 | 9,234 | ||||||||||||||||||||||||||||||
|
Balance- September 30, 2011
|
394 | 1 | - | - | - | - | 2,190,388 | (3,433,273 | ) | 6,155 | (1,236,728 | ) | ||||||||||||||||||||||||||||
|
Share Rescission
|
(22 | ) | (0 | ) | (89,936 | ) | (89,936 | ) | ||||||||||||||||||||||||||||||||
|
Net income for the year ended September 30, 2012
|
- | - | - | - | - | - | - | 694,279 | - | 694,279 | ||||||||||||||||||||||||||||||
|
Foreign Currency translation adjustment
|
- | - | - | - | - | - | - | - | (5,650 | ) | (5,650 | ) | ||||||||||||||||||||||||||||
|
Balance- September 30, 2012
|
372 | 1 | - | - | - | - | 2,100,452 | (2,738,994 | ) | 505 | (638,036 | ) | ||||||||||||||||||||||||||||
|
Share Issuance upon default of debt- ($488/share)
|
120 | 0 | - | - | - | - | 58,500 | - | - | 58,500 | ||||||||||||||||||||||||||||||
|
Issuance of Shares to Officers for Compensation- ($400/share)
|
256 | 0 | - | - | - | - | 102,596 | - | 102,596 | |||||||||||||||||||||||||||||||
|
Shares issuance upon conversion of debt- ($4,988/share)
|
48 | 0 | - | - | - | - | 237,575 | - | - | 237,575 | ||||||||||||||||||||||||||||||
|
Common stock issued upon conversion of insider debt
|
3 | 0 | - | - | - | - | (0 | ) | - | - | 0 | |||||||||||||||||||||||||||||
|
Shares issued for consulting services- ($388/share)
|
1 | 0 | - | - | - | - | 452 | - | - | 452 | ||||||||||||||||||||||||||||||
|
Issuance of 100,000,000 shares of Preferred Stock to Officers- ($.0031/share)
|
- | - | 100,000,000 | 100,000 | - | - | 210,000 | - | - | 310,000 | ||||||||||||||||||||||||||||||
|
Net loss for the year ended September 30, 2013
|
- | - | - | - | - | - | - | (2,421,145 | ) | - | (2,421,145 | ) | ||||||||||||||||||||||||||||
|
Balance- September 30, 2013
|
800 | 1 | 100,000,000 | 100,000 | - | 0 | 2,709,575 | (5,160,139 | ) | 505 | (2,350,057 | ) | ||||||||||||||||||||||||||||
| Shares issuance upon conversion of debt, accrued interest and related legal expense | 7,867,943 | 7,868 | - | - | - | - | 3,616,231 | - | - | 3,624,098 | ||||||||||||||||||||||||||||||
|
Shares issued to Management for Compensation on December 26, 2013 at $.065
|
2,880 | 3 | - | - | - | - | 44,997 | - | - | 45,000 | ||||||||||||||||||||||||||||||
|
Shares issued to Management for Compensation on January 27, 2014 at $.0521
|
400,000 | 400 | - | - | - | - | 5,209,600 | - | - | 5,210,000 | ||||||||||||||||||||||||||||||
|
Shares issued in settlement for prior unrecorded obligation for equipment purchase
|
120,000 | 120 | - | - | - | - | 116,880 | 117,000 | ||||||||||||||||||||||||||||||||
|
Shares issued for consulting services
|
200,000 | 200 | 39,800 | 40,000 | ||||||||||||||||||||||||||||||||||||
|
Debt Issue Costs
|
37,875 | 37,875 | ||||||||||||||||||||||||||||||||||||||
|
Sale of common shares
|
320,000 | 320 | 7,670 | 7,990 | ||||||||||||||||||||||||||||||||||||
| - | - | 1 | - | 2,049,920 | 2,049,920 | |||||||||||||||||||||||||||||||||||
|
Issuance of 1 shares of Preferred Stock, Series B to American Security Research Company
|
||||||||||||||||||||||||||||||||||||||||
|
Net loss for the year ended September 30, 2014
|
- | - | - | - | - | - | - | $ | (7,803,640 | ) | - | (7,803,640 | ) | |||||||||||||||||||||||||||
|
Balance- September 30, 2014
|
8,911,623 | $ | 8,912 | 100,000,000 | $ | 100,000 | 1 | $ | - | $ | 13,832,548 | $ | (12,963,780 | ) | $ | 505 | $ | 978,186 |
F-5
Note 1 – Nature of Operations and Summary of Significant Accounting Policies
Nature of Operations
We were incorporated in the State of Nevada on June 21, 2006, as El Palenque Nercery, Inc. On June 30, 2006, we changed our name to El Palenque Vivero, Inc., and on March 23, 2010, we changed our name to A5 Laboratories Inc. On April 8, 2010, we effectuated a forward split of our issued shares of common stock on the basis of 10-for-1. On October 10, 2013, we changed our name to Hydrogen Future Corporation. On December 27, 2013, our stock trading symbol was changed from AFLB.OB to HFCO.OB, and on January 27, 2015, we effectuated a reverse split of our common stock on a 1:500 basis . On April 21, 2014, the Company completed the acquisition of Hydra Fuel Cell Corporation (“Hydra”) from American Security Resources Corporation (Pink Sheets: ARSC). On January 12. 2015, we effectuated a reverse split of our common stock on a 1:250 basis. Hydra has developed advanced hydrogen fuel cell technology which it initially intends to deploy as residential and small commercial grid replacement for electric generation. Our business offices are located at 2525 Robinhood Street, Suite 1100, Houston TX and our telephone number is (713) 465-1001.
Development Stage
The Company's financial statements are presented as those of a development stage enterprise. Activities during the development stage primarily include equity based financing and further implementation of the business plan.
Risks and Uncertainties
The Company intends to operate in an industry that is subject to rapid change. The Company’s operations will be subject to significant risk and uncertainties including financial, operational, technological, regulatory and other risks, including the potential risk of business failure.
Use of Estimates
The preparation of financial statements in conformity with U.S. generally accepted accounting principles requires management to make estimates and assumptions that affect the reported amounts of assets and liabilities and disclosure of contingent assets and liabilities at the date of the financial statements and the reported amounts of revenues and expenses during the reporting period.
Such estimates for the years ended September 30, 2014 and 2013, and assumptions affect, among others, the following:
|
●
|
estimated carrying value, useful lives and related impairment of property and equipment;
|
|
|
●
|
estimated fair value of derivative liabilities;
|
|
|
●
|
estimated valuation allowance for deferred tax assets; and
|
|
|
●
|
estimated fair value of share based payments
|
Making estimates requires management to exercise significant judgment. It is at least reasonably possible that the estimate of the effect of a condition, situation or set of circumstances that existed at the date of the financial statements, which management considered in formulating its estimate could change in the near term due to one or more future confirming events. Accordingly, the actual results could differ significantly from estimates.
Cash and Cash Equivalents
The Company considers highly liquid financial instruments purchased with a maturity of three months or less to be cash equivalents. At September 30, 2014 and 2013, the Company had no cash equivalents.
The Company minimizes its credit risk associated with cash by periodically evaluating the credit quality of its primary financial institution. The balance at times may exceed federally insured limits. At September 30, 2014 and 2013, there were no balances that exceeded the federally insured limit.
F-6
Property and Equipment
Property and equipment (including related party purchases) is stated at cost, less accumulated depreciation computed on a straight-line basis over the estimated useful lives. Maintenance and repairs are charged to operations when incurred. Betterments and renewals are capitalized when deemed material. When property and equipment are sold or otherwise disposed of, the asset account and related accumulated depreciation account are relieved, and any gain or loss is included in operations.
Property and equipment is reviewed for impairment whenever events or changes in circumstances indicate that the carrying amount of an asset may not be recoverable. The Company recognized an impairment of $1,035,027 during the year ended September 30, 2011. See Note 5.
Beneficial Conversion Feature
For conventional convertible debt where the rate of conversion is below market value, the Company records a “beneficial conversion feature” (“BCF”) and related debt discount.
When the Company records a BCF, the relative fair value of the BCF would be recorded as a debt discount against the face amount of the respective debt instrument. The discount would be amortized to interest expense over the life of the debt.
Derivative Liabilities
Fair value accounting requires bifurcation of embedded derivative instruments such as conversion features in convertible debt or equity instruments, and measurement of their fair value for accounting purposes. In determining the appropriate fair value, the Company uses the Black-Scholes option-pricing model. In assessing the convertible debt instruments, management determines if the convertible debt host instrument is conventional convertible debt and further if there is a beneficial conversion feature requiring measurement. If the instrument is not considered conventional convertible debt, the Company will continue its evaluation process of these instruments as derivative financial instruments.
Once determined, derivative liabilities are adjusted to reflect fair value at each reporting period end, with any increase or decrease in the fair value being recorded in results of operations as an adjustment to fair value of derivatives. In addition, the fair value of freestanding derivative instruments such as warrants, are also valued using the Black-Scholes option-pricing model.
Debt Issue Costs and Debt Discount
The Company paid debt issue costs, and recorded debt discounts in connection with raising funds through the issuance of convertible debt. These costs are amortized over the life of the debt to interest expense. When a conversion of the underlying debt occurs, a proportionate share of the unamortized amounts is immediately expensed.
Original Issue Discount
For certain convertible debt issued, the Company provides the debt holder with an original issue discount. The original issue discount is recorded to debt discount, reducing the face amount of the note and is amortized to interest expense over the life of the debt.
F-7
Share-Based Payments
Generally, all forms of share-based payments, including stock option grants, warrants, restricted stock grants and stock appreciation rights are measured at their fair value on the awards’ grant date, based on estimated number of awards that are ultimately expected to vest. Share-based payment awards issued to non-employees for services rendered are recorded at either the fair value of the services rendered or the fair value of the share-based payment, whichever is more readily determinable. The expense resulting from share-based payments are recorded as a component of general and administrative expense.
Earnings per Share
Basic earnings (loss) per share is computed by dividing net income (loss) by weighted average number of shares of common stock outstanding during each period. Diluted earnings (loss) per share is computed by dividing net income (loss) by the weighted average number of shares of common stock, common stock equivalents and potentially dilutive securities outstanding during the period.
Since the Company reflected a net loss in 2014 the effect of considering any common stock equivalents, if exercisable, would have been anti-dilutive. A separate computation of diluted earnings (loss) per share is not presented.
The Company had the following potential common stock equivalents at September 30, 2014 and 2013, adjusted for all stock splits through the date of this report:
|
September 30,
2014
|
September 30,
2013
|
|||||||
|
Warrants
|
63
|
63
|
||||||
|
Convertible debt
|
56,513,178
|
425,220
|
||||||
|
Total common stock equivalents
|
56,513,241
|
425,283
|
||||||
Income Taxes
Provisions for federal and state income taxes are calculated based on reported pre-tax earnings and current tax law.
Significant judgment is required in determining income tax provisions and evaluating tax positions. The Company periodically assesses its liabilities and contingencies for all periods that are currently open to examination or have not been effectively settled based on the most current available information. When it is not more likely than not that a tax position will be sustained, the Company records its best estimate of the resulting tax liability and any applicable interest and penalties in the financial statements.
Deferred tax assets and liabilities are recorded for temporary differences between the tax basis of assets and liabilities and their reported amounts in the financial statements using statutory rates in effect for the year in which the differences are expected to reverse. The Company presents the tax effects of these deferred tax assets and liabilities separately for each major tax jurisdiction.
The effect on deferred tax assets and liabilities of a change in tax rates is recognized in the results of operations in the period that the changes are enacted. The Company records a valuation allowance to reduce deferred tax assets when it is more likely than not that some portion of the asset may not be realized. The Company evaluates its deferred tax assets and liabilities on a periodic basis.
Operating Segments
The Company operates in two operating segments which are consistent with its internal organization. The major segments are fuel cell technology and contract research and laboratory services. See Note 13 for financial details.
Fair Value of Financial Instruments
The carrying amounts of the Company’s short-term financial instruments, other receivables, accounts payable and accrued liabilities, approximate fair value due to the relatively short period to maturity for these instruments.
F-8
Foreign Currency Transactions
The Company’s reporting currency is the U.S. Dollar. All transactions initiated in Canadian Dollars are translated to U.S. Dollars in accordance with ASC 830-10-20 “Foreign Currency Translation” as follows:
|
(i)
|
Monetary assets and liabilities at the rate of exchange in effect at the balance sheet date;
|
|
|
(ii)
|
Equity at historical rates; and
|
|
|
(iii)
|
Revenue and expense items at the average exchange rate prevailing during the period.
|
Adjustments arising from such translations are deferred until realization and are included as a separate component of stockholders’ equity (deficit) as a component of comprehensive income (loss). Therefore, translation adjustments are not included in determining net income (loss) but reported as other comprehensive income (loss).
For foreign currency transactions, the Company translates these amounts to the Company’s functional currency at the exchange rate effective on the invoice date. If the exchange rate changes between the time of purchase and the time actual payment is made, a foreign exchange transaction gain or loss results which is included in determining net income for the period.
The realized exchange gains (losses) recorded at September 30, 2013 and 2012 were $nil, respectively.
Comprehensive Income (Loss)
ASC Topic No. 220, “Comprehensive Income,” establishes standards for the reporting and display of comprehensive loss and its components in the financial statements. Comprehensive income or loss is comprised of net earnings or loss and other comprehensive income or loss, which includes certain changes in equity, excluded from net earnings, primarily foreign currency translation adjustments.
Foreign Country Risks
The Company may be exposed to certain risks as its operations are being conducted in Canada. The Company’s results may be adversely affected by change in the political and social conditions in Canada due to governmental policies with respect to laws and regulations, anti-inflationary measures, currency conversions and remittances abroad, and rates and methods of taxation, among other things. The Company does not believe these risks to be significant, and no such losses have occurred in the current or prior years because of these factors. However, there can be no assurance those changes in political and other conditions will not result in any adverse impact in future periods.
Recent Accounting Pronouncements
In May 2011, the FASB issued ASU No. 2011-04, Fair Value Measurement (Topic 820): Amendments to Achieve Common Fair Value Measurement and Disclosure Requirements in U.S. GAAP and IFRSs. The guidance in ASU 2011-04 changes the wording used to describe the requirements in U.S. GAAP for measuring fair value and for disclosing information about fair value measurements, including clarification of the FASB's intent about the application of existing fair value and disclosure requirements and changing a particular principle or requirement for measuring fair value or for disclosing information about fair value measurements. The amendments in this ASU should be applied prospectively and are effective for interim and annual periods beginning after December 15, 2011. Early adoption by public entities is not permitted. The adoption of this guidance is not expected to have a material impact on the Company’s financial position or results of operations.
F-9
In June 2011, the FASB issued ASU No. 2011-05, Comprehensive Income (Topic 220): Presentation of Comprehensive Income. The guidance in ASU 2011-05 applies to both annual and interim financial statements and eliminates the option for reporting entities to present the components of other comprehensive income as part of the statement of changes in stockholders' equity. This ASU also requires consecutive presentation of the statement of net income and other comprehensive income. Finally, this ASU requires an entity to present reclassification adjustments on the face of the financial statements from other comprehensive income to net income. The amendments in this ASU should be applied retrospectively and are effective for fiscal year, and interim periods within those years, beginning after December 15, 2011. The Company has adopted this guidance in these financial statements.
Note 2 – Going Concern
As reflected in the accompanying financial statements, the Company has a net loss of $7,803,640 and net cash used in operations of $718,906 for the year ended September 30, 2014. The Company also has a working capital deficit of $2,623,522 and a deficit accumulated during the development stage of $12,963,780 at September 30, 2014. In addition, the Company is in the development stage and has not yet generated any revenues. These factors raise substantial doubt about the Company’s ability to continue as a going concern.
The ability of the Company to continue its operations is dependent on Management's plans, which include potential asset acquisitions, mergers or business combinations with other entities, further implementation of its business plan and continuing to raise funds through debt or equity raises. The Company will likely rely upon equity financing in order to ensure the continuing existence of the business.
The accompanying financial statements have been prepared on a going concern basis, which contemplates the realization of assets and the satisfaction of liabilities in the normal course of business.
These financial statements do not include any adjustments relating to the recovery of the recorded assets or the classification of the liabilities that might be necessary should the Company be unable to continue as a going concern.
Note 3 – Fair Value of Financial Assets and Liabilities
The Company measures assets and liabilities at fair value based on an expected exit price as defined by the authoritative guidance on fair value measurements, which represents the amount that would be received on the sale of an asset or paid to transfer a liability, as the case may be, in an orderly transaction between market participants. As such, fair value may be based on assumptions that market participants would use in pricing an asset or liability. The authoritative guidance on fair value measurements establishes a consistent framework for measuring fair value on either a recurring or nonrecurring basis whereby inputs, used in valuation techniques, are assigned a hierarchical level. The following are the hierarchical levels of inputs to measure fair value:
|
●
|
Level 1: Observable inputs that reflect quoted prices (unadjusted) for identical assets or liabilities in active markets.
|
|
|
●
|
Level 2: Inputs reflect: quoted prices for identical assets or liabilities in markets that are not active; quoted prices for similar assets or liabilities in active markets; inputs other than quoted prices that are observable for the assets or liabilities; or inputs that are derived principally from or corroborated by observable market data by correlation or other means.
|
|
|
●
|
Level 3: Unobservable inputs reflecting the Company’s assumptions incorporated in valuation techniques used to determine fair value. These assumptions are required to be consistent with market participant assumptions that are reasonably available.
|
F-10
At September 30, 2014, the fair value of financial instruments measured on a recurring basis includes derivative liabilities, determined based on level two inputs consisting of quoted prices in active markets for identical assets. The carrying amount reported for accounts payable and accrued liabilities approximates fair value because of the short-term maturity of these financial instruments.
The Company has a derivative liability measured at fair market value on a recurring basis. Consequently, the Company had changes in fair value reported in the statements of operations, which were attributable to the change in market value relating to the liability for the year ended September 30, 2013.
The following is the Company’s derivative liability measured at fair value on a recurring basis at September 30, 2014 and 2013:
|
September 30,
2014
|
September 30,
2013
|
|||||||
|
Level 1
|
$
|
-
|
$
|
-
|
||||
|
Level 2 – Derivative Liability
|
442,609
|
1,337,315
|
||||||
|
Level 3
|
-
|
-
|
||||||
|
Total
|
$
|
442,609
|
$
|
1,337,315
|
||||
Note 4 – Other Receivables
As of September 30, 2014 and 2013, the Company had receivables of $-0- and $3,194. The receivable at September 31, 2013 was for amounts funded to Hydra which were eliminated upon consolidation.
Note 5 – Property and Equipment
Property and equipment consists of the following:
|
As of September 30,
|
2014
|
2013
|
Estimated Useful Lives
|
|||||||||
|
Software
|
$
|
1,380,876
|
1,380,876
|
3
|
||||||||
|
Leasehold improvements (1)
|
144,802
|
144,802
|
10
|
|||||||||
|
Lab equipment (2)
|
106,705
|
106,705
|
10
|
|||||||||
|
Technical equipment (3)
|
15,824
|
-0-
|
5
|
|||||||||
|
Office equipment
|
37,336
|
37,336
|
5
|
|||||||||
|
1,685,543
|
1,669,719
|
|||||||||||
|
Less: Accumulated depreciation
|
(468,695
|
)
|
(435,125
|
)
|
||||||||
|
Less: Impairment
|
(1,035,027
|
)
|
(1,035,027
|
)
|
||||||||
|
Property and equipment – net
|
$
|
181,259
|
199,567
|
|||||||||
(1) See Note 8(B) – related party
(2) See below related to related party purchases
(3) Technical equipment- This represents equipment used to test fuel cell viability
F-11
During the years ended September 30, 2014 and 2013, management evaluated the recoverability of long lived assets by determining whether the carrying value can be recovered through future cash flows. Management determined that it is more likely than not that no future cash flows are to be expected from the use of its software.
The leasehold improvements were completed and placed into service in July 2011.
The Company purchased $24,357 of lab equipment from an entity controlled by the Company’s former Chief Executive Officer during fiscal year ended 2011. See Note 7 for software acquired from a related party.
Note 6- Goodwill
The Company recorded goodwill as a result of its business acquisition of Hydra(“Hydra Acquisition”) . Goodwill is recorded when the purchase price paid for an acquisition exceeds the estimated fair value of the net identified tangible assets acquired. In the Hydra Acquisition , the objective was to expand the Company’s product offerings and customer base by entering into a new line of business. The Company determined the value of the goodwill by analyzing comparable companies with similar product lines. Based upon that analysis, the Company determined that the value of the Goodwill was $3,353,156 as follows:
|
Assets acquired:
|
||||
|
Cash
|
$ | 402 | ||
|
Other receivables
|
3,529 | |||
|
Total
|
$ | 3,931 | ||
|
Liabilities acquired:
|
||||
|
Promissory note payable
|
$ | 984,008 | ||
|
Accrued interest payable
|
235,972 | |||
|
Other current liabilities
|
87,187 | |||
|
Additional paid-in capital
|
2,049,920 | |||
|
Total
|
$ | 3,357,087 | ||
|
Goodwill
|
$ | 3,353,166 | ||
The Company tests goodwill for impairment on a quarterly basis. At September 30, 2014, the company determined that there was no impairment.
Note 7 – Notes Payable
(A) Related Party
The following is a summary of the Company’s related party liabilities:
|
September 30,
2013
|
September 30,
2012
|
|||||||
|
Note Payable (1)
|
$
|
20,915
|
20,915
|
|||||
|
Advances (2)
|
7,226
|
7,226
|
||||||
|
Less: Payments received
|
(968
|
)
|
(968
|
)
|
||||
|
Total related party liabilities
|
$
|
27,173
|
27,173
|
|||||
(1) The note is non-interest bearing, unsecured, and due on demand.
(2) The advances are non-interest bearing, unsecured, and due on demand.
F-12
(B) Convertible Debt – Secured – Derivative Liabilities
The Company has secured convertible debentures from two sources: a) proceeds issued to the Company, and b) consulting services. A summary of these obligations follows:
|
Date of Issuance
|
Original Amount
|
Conversions through
September 30,
2014
|
Accrued Original Issue Discount, if any
|
Gross Amount outstanding at
September 30,
2014
|
Remaining Discount
|
Net Amount
|
Shares to be issued upon full conversion at
September 30,
2014
|
Type of Note
|
||||||||||||||||||||||||
|
2-Apr-13
|
5,000 | 5,000 | 0 | 5,000 | 400,000 | a | ||||||||||||||||||||||||||
|
31-May-13
|
5,500 | 5,500 | 1,831 | 3,669 | 440,000 | a | ||||||||||||||||||||||||||
|
31-May-13
|
5,500 | 5,500 | 0 | 5,500 | 440,000 | a | ||||||||||||||||||||||||||
|
23-Feb-11
|
300,000 | 300,000 | 0 | 0 | 0 | 0 | a | |||||||||||||||||||||||||
|
1-Oct-12
|
165,000 | 165,000 | 0 | 0 | 0 | 0 | b | |||||||||||||||||||||||||
|
1-Aug-13
|
25,000 | 14,400 | 10,600 | 0 | 10,600 | 848,000 | b | |||||||||||||||||||||||||
|
1-Sep-13
|
25,000 | 25,000 | 0 | 0 | 0 | 0 | b | |||||||||||||||||||||||||
|
1-Oct-13
|
25,000 | 25,000 | 0 | 0 | 0 | 0 | b | |||||||||||||||||||||||||
|
1-Nov-13
|
25,000 | 25,000 | 0 | 25,000 | 2,000,000 | b | ||||||||||||||||||||||||||
|
1-Dec-13
|
25,000 | 25,000 | 0 | 25,000 | 2,000,000 | b | ||||||||||||||||||||||||||
|
1-Jan-14
|
25,000 | 25,000 | 0 | 25,000 | 2,000,000 | b | ||||||||||||||||||||||||||
|
1-Feb-14
|
25,000 | 25,000 | 0 | 0 | 0 | 0 | b | |||||||||||||||||||||||||
|
1-Mar-14
|
25,000 | 25,000 | 0 | 25,000 | 2,000,000 | b | ||||||||||||||||||||||||||
|
1-Aug-13
|
12,500 | 40,000 | 27,500 | 0 | 0 | 0 | 0 | a | ||||||||||||||||||||||||
|
27-Aug-13
|
12,500 | 12,500 | 0 | 12,500 | 833,333 | a | ||||||||||||||||||||||||||
|
10-Oct-13
|
15,000 | 15,000 | 411 | 14,589 | 1,000,000 | a | ||||||||||||||||||||||||||
|
19-Nov-13
|
10,000 | 10,000 | 1,370 | 8,630 | 666,667 | a | ||||||||||||||||||||||||||
|
27-Sep-13
|
25,000 | 25,000 | 0 | 25,000 | 2,000,000 | a | ||||||||||||||||||||||||||
|
13-Dec-13
|
20,000 | 17,450 | 2,000 | 4,550 | 0 | 4,550 | 364,000 | a | ||||||||||||||||||||||||
|
27-Feb-14
|
20,000 | 20,000 | 0 | 0 | 0 | 0 | a | |||||||||||||||||||||||||
|
17-Mar-14
|
25,000 | 2,868 | 22,132 | 18,253 | 3,879 | 1,475,467 | a | |||||||||||||||||||||||||
|
2-Apr-14
|
32,500 | 25,660 | 6,840 | 11,491 | (4,651 | ) | 558,367 | a | ||||||||||||||||||||||||
|
21-Mar-14
|
30,000 | 30,000 | 20,316 | 9,684 | 2,400,000 | a | ||||||||||||||||||||||||||
|
14-Apr-14
|
35,000 | 35,000 | 14,743 | 20,257 | 2,800,000 | a | ||||||||||||||||||||||||||
|
5-May-14
|
50,000 | 50,000 | 20,556 | 29,444 | 3,636,364 | a | ||||||||||||||||||||||||||
|
21-May-14
|
35,000 | 35,000 | 15,588 | 19,412 | 2,545,455 | a | ||||||||||||||||||||||||||
|
2-Jun-14
|
27,500 | 27,500 | 12,898 | 14,602 | 2,156,863 | a | ||||||||||||||||||||||||||
|
23-Jun-14
|
27,500 | 27,500 | 14,220 | 13,280 | 1,833,333 | a | ||||||||||||||||||||||||||
|
1-Apr-14
|
25,000 | 25,000 | 0 | 25,000 | 2,000,000 | b | ||||||||||||||||||||||||||
|
1-May-14
|
25,000 | 25,000 | 163 | 24,837 | 2,000,000 | b | ||||||||||||||||||||||||||
|
1-Jun-14
|
25,000 | 25,000 | 5,229 | 19,771 | 2,000,000 | b | ||||||||||||||||||||||||||
|
1-Jul-14
|
25,000 | 25,000 | 17,033 | 7,967 | 2,000,000 | b | ||||||||||||||||||||||||||
|
1-Aug-14
|
25,000 | 25,000 | 15,196 | 9,804 | 2,000,000 | b | ||||||||||||||||||||||||||
|
1-Sep-14
|
25,000 | 25,000 | 4,739 | 20,261 | 2,000,000 | b | ||||||||||||||||||||||||||
|
7-Jul-14
|
37,500 | 37,500 | 20,270 | 17,230 | 2,500,000 | a | ||||||||||||||||||||||||||
|
14-Jul-14
|
25,000 | 25,000 | 14,402 | 10,598 | 1,960,784 | a | ||||||||||||||||||||||||||
|
22-Aug-14
|
27,500 | 27,500 | 21,441 | 6,059 | 2,200,000 | a | ||||||||||||||||||||||||||
|
26-Aug-14
|
10,000 | 10,000 | 9,289 | 711 | 800,000 | a | ||||||||||||||||||||||||||
|
26-Aug-14
|
10,000 | 10,000 | 9,289 | 711 | 800,000 | a | ||||||||||||||||||||||||||
|
8-Sep-14
|
10,000 | 10,000 | 8,281 | 1,719 | 800,000 | a | ||||||||||||||||||||||||||
|
15-Sep-14
|
20,000 | 20,000 | 18,558 | 1,442 | 1,454,545 | a | ||||||||||||||||||||||||||
|
15-Sep-14
|
10,000 | 10,000 | 9,682 | 318 | 800,000 | a | ||||||||||||||||||||||||||
|
19-Sep-14
|
10,000 | 10,000 | 9,765 | 235 | 800,000 | a | ||||||||||||||||||||||||||
|
Totals
|
1,368,500 | 660,378 | 29,500 | 737,622 | 295,013 | 442,609 | 56,513,178 | |||||||||||||||||||||||||
Legend:
a- Note for cash
b- Note for consulting services
F-13
The following is a summary of the notes issued for cash and issued for consulting services:
|
Original Amount
|
Conversions through
September 30,
2014
|
Accrued Original Issue Discount, if any
|
Gross Amount outstanding at
September 30,
2014
|
Remaining Discount
|
Net Amount
|
Shares to be issued upon full conversion at
September 30,
2014
|
||||||||||||||||||||||
|
Notes for Cash
|
853,500 | 405,978 | 29,500 | 477,022 | 252,653 | 224,369 | 35,665,178 | |||||||||||||||||||||
|
Notes for Consulting Services
|
515,000 | 254,400 | 0 | 260,600 | 42,360 | 218,240 | 20,848,000 | |||||||||||||||||||||
|
Totals
|
1,368,500 | 660,378 | 29,500 | 737,622 | 295,013 | 442,609 | 56,513,178 | |||||||||||||||||||||
The Notes for cash are convertible into common stock under at discounts ranging from 40% to 50% of the appropriate pricing mechanism.
The Notes for consulting services are convertible at a 50% discount to the low closing bid for the prior twenty or thirty days prior to the date of conversion
(C) Notes Acquired in Hydra Acquisition
As a result of the Hydra Acquisition, the Company acquired an additional $984,008 in debt as follows
| Investor | Amount | Interest Rate | ||||||
|
Golden State Equity Investors
|
$ | 350,000 | 7.5 | % | ||||
|
St. George Investments, LLC
|
$ | 415,000 | 7.75 | % | ||||
|
Bullivant Houser Bailey LLP
|
$ | 219,008 | -0- | |||||
During the Fiscal fourth quarter, $2,500 of the Bullivant Houser Bailer LLP Note was retired. Therefore, the remaining balance at September 30, 2014 is $981,508
All of the notes are currently past due and are payable on demand
(D) Debt Issue Costs
Deferred Issue costs relate to additional expenses associated with a financing that are amortized into expense over the length of the instrument. As of September 30, 2014, the value of these Deferred issue costs is $20,288 as follows:
|
Original Balance
|
Issue Date
|
Maturity Date
|
Total Days
|
Days Remaining as of
September 30,
2014
|
Percentage of Days as of
September 30,
2014
|
Unamortized Balance
|
|||||||||||||||||
| $ | 2,500 |
2-Apr-14
|
7-Jan-15
|
280 | 99 | 35 | % | $ | 884 | ||||||||||||||
| $ | 7,375 |
5-May-14
|
30-Apr-15
|
360 | 212 | 59 | % | $ | 4,343 | ||||||||||||||
| $ | 5,500 |
21-May-14
|
14-Jan-15
|
238 | 106 | 45 | % | $ | 2,450 | ||||||||||||||
| $ | 2,500 |
2-Jun-14
|
14-Jan-15
|
226 | 106 | 47 | % | $ | 1,173 | ||||||||||||||
| $ | 2,500 |
23-Jun-14
|
14-Jan-15
|
205 | 106 | 52 | % | $ | 1,293 | ||||||||||||||
| $ | 12,500 |
7-Jul-14
|
8-Jan-15
|
185 | 100 | 54 | % | $ | 6,757 | ||||||||||||||
| $ | 2,500 |
14-Jul-14
|
14-Jan-15
|
184 | 106 | 58 | % | $ | 1,440 | ||||||||||||||
| $ | 2,500 |
22-Aug-14
|
15-Feb-15
|
177 | 138 | 78 | % | $ | 1,949 | ||||||||||||||
|
Total
|
$ | 37,875 | $ | 20,288 | |||||||||||||||||||
|
(D)
|
Debt Discount
|
During the years ended 2014 and 2013, the Company recorded debt discounts totaling $804,375 and $243,500, respectively.
During the years ended 2014 and 2013, the Company amortized debt discounts totaling $148,603 and $151,591, respectively.
F-14
Note 8 – Stockholders’ Equity (Deficit)
(A) Common Stock
Stock Issued in 2014
The Company issued 8,910,823 (on a split-adjusted basis) shares of common stock during the year as follows:
|
Shares issued for conversion of debt accrued interest and related expenses associated with conversions
|
7,867,943 | |||
|
Shares issued to Management for compensation
|
402,880 | |||
|
Shares issued for settlement of a previously unrecorded liability for equipment purchase
|
120,000 | |||
|
Shares issued for consulting services
|
200,000 | |||
|
Sales of common shares
|
320,000 |
Stock Issued in 2013
On February 19, 2013, the Company issued 5,954, 252 shares for the conversion of $15,000 of debt plus accrued interest.
On December 31, 2012, the Company issued 15,000,000 shares of common stock to John Fife for the default on his Note. See Footnote 6
The Company issued 32,061,360 shares for compensation to Directors and Officers
The Company issued 400,000 shares to insiders for conversion of insider debt.
The Company issued 145,897 shares for consulting services on January 1, 2013.
Stock Issued in 2012
During 2012, the Company rescinded 2.8 million shares net related to John Fife
Stock issued in 2011
During November and December 2010, the Company issued 312,500 shares of common stock for $100,000 ($0.32/share).
On June 14, 2011, the Company issued 75,000 shares of common stock for $15,000 ($0.20/share).
F-15
On September 2, 2011, a lender converted $24,990 pertaining to a note it held with an original principal of $300,000, for 1,120,000 shares of common stock ($0.0166667/share). The quantity of shares issued is based upon the formula described above pertaining to the effect of the triggering event (see Note 6(B)).
Subsequent to September 30, 2011, a lender converted $50,000 pertaining to a note it held with an original principal of $300,000, for 3,000,000 shares of common stock ($0.0166667/share). The quantity of shares issued is based upon the formula described above pertaining to the effect of the triggering event (see Note 6(B)).
Stock issued in 2010
On March 9, 2010, the Company’s board of directors authorized a 10-for-1 forward split of its common stock effective April 8, 2010. Each stockholder of record on April 7, 2010 received ten new shares of the Company’s $0.001 par value common stock for every one old share outstanding. The effects of the split have been retroactively applied to all periods presented in the accompanying financial statements.
On June 3, 2010, the Company issued 250,000 shares of common stock for $162,500 ($0.65/share).
On July 20, 2010, the Company issued 1,569,177 shares of common stock, having a fair value of $1,380,876 ($0.88/share), based upon the closing trading price, to acquire software from an affiliate of the Company’s Chief Executive Officer.
On July 30, 2010, the Company issued 125,000 shares of common stock for $100,000 ($0.80/share). In addition, the stockholder received a 2-year warrant for 125,000 shares with an exercise price of $1.20.
On August 18, 2010, the Company issued 125,000 shares of common stock for $100,000 ($0.80/share). In addition, the stockholder received a 2-year warrant for 125,000 shares with an exercise price of $1.20.
On August 23, 2010, the Company issued 20,000 shares of common stock to a consultant, having a fair value of $16,000 ($0.80/share), based upon the closing trading price. At September 30, 2010, the Company expensed this stock issuance as a component of general and administrative expense.
On September 17, 2010, the Company issued 150,000 shares of common stock to a consultant, having a fair value of $135,000 ($0.90/share), based upon the closing trading price. At September 30, 2010, the Company expensed this stock issuance as a component of general and administrative expense.
On November 12, 2010, the Company issued 156,250 shares of common stock for $50,000 ($0.32/share).
On December 2, 2010, the Company issued 156,250 shares of common stock for $50,000 ($0.32/share).
Stock issued in 2007
During 2007, the Company issued 20,500,000 shares of common stock for $82,000 ($0.004/share).
Stock Issued in 2006
On June 21, 2006 (Inception), the Company issued 10,000,000 shares of common stock for $5,000 ($0.0005/share) to directors and officers of the Company.
On August 1, 2006, the Company issued 15,000,000 shares of common stock for $15,000 ($0.0001/share) to directors and officers of the Company.
F-16
(B) Stock Warrants
The following is a summary of the Company’s warrants that are outstanding and exercisable at September 30, 2013 and 2012:
|
Warrants
|
Weighted Average Exercise Price
|
Weighted Average Remaining Contractual Life in Years
|
Intrinsic Value
|
|||||||||||||
|
Balance – September 30, 2012
|
1,074,000
|
$
|
0.30
|
.27
|
8,560
|
|||||||||||
|
Granted
|
$
|
|||||||||||||||
|
Forfeited/Cancelled
|
(1,074,000)
|
$
|
.30
|
|||||||||||||
|
Exercised
|
-
|
-
|
||||||||||||||
|
Balance – September 30, 2013 - outstanding
|
-
|
$
|
--
|
-
|
$
|
-
|
||||||||||
|
Balance – September 30, 2013 - exercisable
|
-0-
|
$
|
-
|
-
|
$
|
-
|
||||||||||
There are no warrants outstanding at September 30, 2014.
(C) Preferred Stock
On June 21, 2013 (“Grant Date”), the Company granted One hundred million (100,000,000) shares of Series A Preferred stock (the “Series A”), with a par value of $.001. Fifty million (50,000,000) of the Series A were issued to Frank Neukomm, its Chief Executive Officer, and Robert Farr, its Chief Operating Officer. The shares are convertible into common stock on a 1:250 basis and do not carry any dividend. On the Grant Date, the price of the company’s common stock was $.7775, $.0031, pre-split. As such, the Company recorded $310,000 of compensation expense under General and Administrative Expenses.
On April 26, 2014, the Company issued one share of Series B Preferred Stock for the Hydra Fuel Cell Acquisition. with a par value of $.001 to American Security Research Corporation. The share is convertible into common stock equivalent to 50.1% ownership of the common stock of the Company.
Note 9 – Commitments and Contingencies
(A) Contingencies
From time to time, the Company may become involved in various lawsuits and legal proceedings, which arise in the ordinary course of business. The Company is currently not aware of any such legal proceedings or claims that they believe will have, individually or in the aggregate, a material adverse affect on its business, financial condition or operating results.
(B) Operating Lease – Related Party
The Company had subleased office space from a company controlled by the Company’s former Chief Executive Officer.
Rent expense for the years ended September 30, 2014 and 2013 was $3,283 and $-0-, respectively.
Rent Expense commenced with the Hydra acquistion
F-17
Note 10 – Derivative Liabilities
The Company identified conversion features embedded within all convertible debt issued. The Company has determined that the features associated with the embedded conversion option should be accounted for at fair value as a derivative liability.
As a result of the application of ASC No. 815, the fair value of the conversion feature is summarized as follows:
|
Derivative liability balance at September 30, 2013
|
$
|
1,337,315
|
||
|
Fair value at the commitment date for convertible notes issued
|
2,685,435
|
|||
|
Fair value mark to market adjustment
|
(3,509,298)
|
|||
|
Derivative liability on retirement of debt
|
19,157
|
|||
|
Derivative liability balance at September 30, 2014
|
$
|
442,609
|
The fair value at the commitment and remeasurement dates were based upon the following management assumptions:
|
|
Commitment Date
|
Remeasurement Date
|
||||||
|
Expected dividends
|
0 | % | 0 | % | ||||
|
Expected volatility
|
180 | % | 173 | % | ||||
|
Expected term: conversion feature
|
4 years
|
3.40 years
|
||||||
|
Risk free interest rate
|
1.73 | % | 0.42 | % | ||||
Note 11 – Other Related Party Transactions
The Company incurred contracted service fees to its Chief Executive Officer of $36,000 and $-0- for the years ended September 30, 2014 and 2013, respectively. These expenses are recorded as General and Administrative services.
The Company incurred contracted service fees to its Chief Operating Officer of $31,200 and $-0- for the years ended September 30, 2014 and 2013, respectively. These expenses are recorded as General and Administrative services.
Note 12 – Income Taxes
The Company recognizes deferred tax assets and liabilities for both the expected impact of differences between the financial statements and the tax basis of assets and liabilities, and for the expected future tax benefit to be derived from tax losses and tax credit carryforwards. The Company has established a valuation allowance to reflect the likelihood of the realization of deferred tax assets.
The Company has a net operating loss carryforward for tax purposes totaling approximately $1,089,000 at September 30, 2014, expiring through 2031. U.S. Internal Revenue Code Section 382 places a limitation on the amount of taxable income that can be offset by carryforwards after a change in control (generally greater than a 50% change in ownership). Temporary differences, which give rise to a net deferred tax asset and significant deferred tax assets at September 30, 2011, are approximately as follows:
|
2014
|
2013
|
|||||||
|
Gross deferred tax assets:
|
||||||||
|
Net operating loss carryforward
|
$
|
(2,900,000
|
)
|
$
|
(1,754,000
|
)
|
||
|
Total deferred tax assets
|
2,900,000
|
1,754,000
|
||||||
|
Less: Valuation allowance
|
(2,900,000
|
)
|
(1,754,000
|
)
|
||||
|
Net deferred tax assets recorded
|
$
|
-
|
$
|
-
|
||||
F-18
The valuation allowance at September 30, 2014 was approximately $2,900,000. The net change in valuation allowance during the year ended September 30, 2014 was an increase of approximately $1,146,600. In assessing the reliability of deferred tax assets, management considers whether it is more likely than not that some portion or all of the deferred income tax assets will not be realized. The ultimate realization of deferred income tax assets is dependent upon the generation of future taxable income during the periods in which those temporary differences become deductible. Management considers the scheduled reversal of deferred income tax liabilities, projected future taxable income, and tax planning strategies in making this assessment. Based on consideration of these items, management has determined that enough uncertainty exists relative to the realization of the deferred income tax asset balances to warrant the application of a full valuation allowance as of September 30, 2014.
The actual tax benefit differs from the expected tax benefit for the periods ended September 30, 2014 and 2013 (computed by applying the U.S. Federal Corporate tax rate of 34% to income before taxes), as follows:
|
2014
|
2013
|
|||||||
|
Expected tax expense (benefit) – Federal
|
$
|
(2,653,000
|
)
|
$
|
(1,613,400
|
)
|
||
|
Non-deductible stock compensation
|
1,786,000
|
-
|
||||||
|
Derivative liability
|
913,000
|
673,400
|
||||||
|
Change in valuation allowance
|
(1,193,000)
|
940,000
|
||||||
|
Actual tax expense (benefit)
|
$
|
-
|
$
|
-
|
||||
Below is a chart showing the estimated corporate federal net operating loss (NOL) and the year in which it will expire.
|
Year
|
Amount
|
Expiration
|
||||||
|
2014
|
$
|
1,146,000
|
2034
|
|||||
|
2013
|
$
|
837,000
|
2033
|
|||||
|
2012
|
$
|
113,000
|
2032
|
|||||
|
Prior-2012
|
$
|
804,000
|
2031
|
|||||
|
Total
|
$
|
2,900,000
|
||||||
Note 13. Operating Segments
The Company operates in two operating segments which are consistent with its internal organization. The major segments are fuel cell technology and contract research and laboratory services. Where applicable, “Unallocated” represents items necessary to reconcile to the consolidated financial statements, which generally include corporate activity at the parent level and eliminations.
The Company evaluates performance of individual operating segments based on operating income (loss). On a consolidated basis, this amount represents total net loss as shown in the consolidated statement of operations. Reconciling items represent costs associated with the financings, including interest expense (including amortization of debt discounts), loss on conversion of debt and incursion of derivative liabilities and the resultant mark to mark activity and executive compensation costs. Such costs have not been allocated from the parent to the subsidiaries.
|
Fiscal Year Ended September 30, 2014
|
|||||||||||||||||
|
Fuel Cell Technology
|
Contracted Research and Laboratory Services
|
Corporate
Overhead |
Total
|
||||||||||||||
|
Revenues
|
$ | - | $ | - | $ | - | $ | - | |||||||||
|
Cost of Revenues
|
- | - | - | - | |||||||||||||
|
Gross Profits
|
- | - | - | - | |||||||||||||
|
Operating Expenses
|
- | ||||||||||||||||
|
Selling General and Administrative Expenses
|
33,485 | $ | 34,132 | $ | 5,980,267 | 6,047,884 | |||||||||||
|
Issuance of Common Stock to settle a prior liability
|
$ | 117,000 | 117,000 | ||||||||||||||
|
Total Operating Expenses
|
33,485 | 151,132 | 5,980,267 | 6,164,884 | |||||||||||||
|
Operating Income (Loss)
|
(33,485 | ) | (151,132 | ) | 19,789 | (164,828 | ) | ||||||||||
|
Other Income (Expense)
|
3,439,472 | - | - | 3,439,472 | |||||||||||||
|
Interest expense
|
- | - | (312,873 | ) | (163,263 | ) | |||||||||||
|
Net loss
|
(33,485 | ) | (151,132 | ) | (7,619,023 | ) | (7,803,640 | ) | |||||||||
|
Total Assets
|
3,439,472 | 165,435 | 28,546 | 3,633,453 | |||||||||||||
F-19
| Fiscal Year Ended September 30, 2013 | |||||||||||||||||
|
Fuel Cell Technology
|
Contracted Research and Laboratory Services
|
Corporate
Overhead |
Total
|
||||||||||||||
|
Revenues
|
$ | - | $ | - | $ | - | $ | - | |||||||||
|
Cost of Revenues
|
- | - | - | - | |||||||||||||
|
Gross Profits
|
- | - | - | - | |||||||||||||
|
Operating Expenses
|
- | ||||||||||||||||
|
Selling General and Administrative Expenses
|
$ | 34,132 | $ | 726,920 | 761,052 | ||||||||||||
|
Issuance of Common Stock to settle a prior liability
|
- | - | - | - | |||||||||||||
|
Total Operating Expenses
|
- | 34,132 | 726,920 | 761,052 | |||||||||||||
|
Operating Income (Loss)
|
- | (34,132 | ) | (726,920 | ) | (761,052 | ) | ||||||||||
|
Other Income (Expense)
|
|||||||||||||||||
|
Interest expense
|
- | - | (235,661 | ) | (235,661 | ) | |||||||||||
|
Net loss
|
- | (34,132 | ) | (2,387,013 | ) | (2,421,145 | ) | ||||||||||
|
Total Assets
|
- | 199,567 | 19,177 | 218,744 | |||||||||||||
Note 14 – Subsequent Events
The Company has evaluated for subsequent events between the balance sheet date of September 30, 2013 and January 2, 2014, the date the financial statements were available to be issued, and concluded that the following events or transactions occurring during that period requiring recognition or disclosure are:
|
(A)
|
Issuance of Debt
|
After the Balance sheet date, the company issued the following debt:
On October 1, 2014, the Company issued $25,000 in a convertible promissory note to a consultant.
On November 1, 2014, the Company issued $25,000 in a convertible promissory note to a consultant.
On December 1, 2014, the Company issued $25,000 in a convertible promissory note to a consultant.
On Janaury 1, 2015, the Company issued $25,000 in a convertible promissory note to a consultant.
|
(B)
|
Reverse stock split and change in Ticker Symbol
|
Effective January 12, 2015, there was a reverse stock split of our outstanding common stock on the basis of one for one two hundred fifty (1:250).
The new symbol is be HFCOD. The “D” will be removed in 20 business days and the symbol will revert to HFCO.
|
(C)
|
Issuance of Common Stock
|
Subsequent to the balance sheet date, the Company issued 1,136,920 shares for the conversion of $15,641 in debt and related expenses.
F-20