Attached files
| file | filename |
|---|---|
| EX-99.1 - PRESS RELEASE - Thompson Creek Metals Co Inc. | exhibit991pressreleaseprod.htm |
| 8-K - 8-K - Thompson Creek Metals Co Inc. | a8-kjanuaryupdates.htm |

Investor Conference Call January 20, 2014 NYSE:TC TSX:TCM

2 Webcast Information Webcast: This Webcast can be accessed on the Thompson Creek Metals Company website under the Events Section: www.thompsoncreekmetals.com Q&A Instructions: If you would like to ask a question, please press star 1 on your telephone keypad. If you’re using a speakerphone, please make sure your mute function is turned off to allow your signal to reach the operator.

3 Cautionary Statement This document contains ‘‘forward-looking statements’’ within the meaning of the United States Private Securities Litigation Reform Act of 1995, Section 27A of the Securities Act of 1933, as amended, Section 21E of the Securities Act of 1934, as amended and applicable Canadian securities legislation and are intended to be covered by the safe harbor provided by these regulations. These forward-looking statements can, in some cases, be identified by the use of such terms as "believe," "project," "expect," "anticipate," "estimate," "intend," "future," "opportunity," "plan," "may," "should," "will," "would," "will be," "will continue," "will likely result," and similar expressions. Our forward-looking statements may include, without limitation, statements with respect to: future financial or operating performance of the Company or its subsidiaries and its projects; access to existing or future financing arrangements and availability to refinance or reduce debt on favorable terms or at all; future inventory, production, sales, payments from customers, cash costs, capital expenditures and exploration expenditures; future earnings and operating results; expected concentrate and recovery grades; estimates of mineral reserves and resources, including estimated mine life and annual production; projected ramp-up at Mt. Milligan Mine, including expected achievement of design capacities and the effects of secondary crushing; future concentrate shipment dates and sizes; future operating plans and goals; and future prices and market conditions for molybdenum, copper, gold and silver. Where we express an expectation or belief as to future events or results, such expectation or belief is expressed in good faith and believed to have a reasonable basis. However, our forward-looking statements are based on current expectations and assumptions that are subject to risks and uncertainties which may cause actual results to differ materially from future results expressed, projected or implied by those forward-looking statements. Important factors that could cause actual results and events to differ from those described in such forward-looking statements can be found in the section entitled ‘‘Risk Factors’’ in Thompson Creek’s Annual Report on Form 10-K for the year ended December 31, 2013, Quarterly Reports on Form 10-Q and other documents filed on EDGAR at www.sec.gov and on SEDAR at www.sedar.com. Although we have attempted to identify those material factors that could cause actual results or events to differ from those described in such forward-looking statements, there may be other factors, currently unknown to us or deemed immaterial at the present time, that could cause results or events to differ from those anticipated, estimated or intended. Many of these factors are beyond our ability to control or predict. Given these uncertainties, the reader is cautioned not to place undue reliance on our forward-looking statements. We undertake no obligation to update or revise publicly any forward-looking statements, whether as a result of new information, future events, or otherwise, and investors should not assume that any lack of update to a previously issued forward-looking statement constitutes a reaffirmation of that statement.

4 Management in Attendance Jacques Perron President, Chief Executive Officer and Director Pam Saxton Executive Vice President and Chief Financial Officer Mark Wilson Executive Vice President and Chief Commercial Officer

5 Jacques Perron President, Chief Executive Officer and Director 2014 Production and Sales Results and Operations Update

6 Achievements Improved safety record Company 2014 AIRR was 2.39, compared to 2.48 in 2013 Achieved copper and total molybdenum production guidance Advanced ramp-up at Mount Milligan December 15 – 31, 2014 average daily mill throughput was 48,426 tonnes per day, which represents approximately 80% of design mill throughput Open market bond repurchases $17 million of 12.5% senior unsecured notes; average purchase price 99% of par $15.9 million of 7.375% senior unsecured notes; average purchase price 82.6% of par Total cash used of approximately $30 million Achieved approximately $3 million discount and reduced future interest payments by a total of approximately $13 million Hedging program Copper • Hedged (forward contracts) a total of 8 million pounds of Mount Milligan’s production through May 2015 at an average price of approximately $3.10/lb Gold • Hedged (zero cost collars) approximately 22,000 ounces of gold through 2015 • Hedged additional 3,300 ounces at $1,230 per ounce for January 2015 (forward sales contracts) Updated NI 43-101 Technical Report for Mount Milligan Mine Updated mineral reserve estimates increase ore tonnes by 14%, increase contained copper by 15%, and increase contained gold by 4%

7 Molybdenum Production and Sales Thompson Creek Mine and Endako Mine - Consolidated (millions lbs) 7.2 29.9 9.2 31.5 4.3 26.3 5.8 28.5 Production Sales Q413 Q414 FY13 FY14

8 Payable Copper Production and Sales 1.0 9.4 14.2 16.0 16.3 18.0 0 2.8 10.8 21.9 16.5 15.5 0.0 5.0 10.0 15.0 20.0 25.0 Q313 Q413 Q114 Q214 Q314 Q414 2014 Production = 64.6 2014 Sales = 64.7 67.6% 80.2% 79.2% 80.4% 83.1% 79.0% 0.0% 10.0% 20.0% 30.0% 40.0% 50.0% 60.0% 70.0% 80.0% 90.0% Q313 Q413 Q114 Q214 Q314 Q414 Cu Recovery (millions lbs)

9 48.0% 57.4% 59.0% 65.1% 66.6% 60.8% 0.0% 10.0% 20.0% 30.0% 40.0% 50.0% 60.0% 70.0% Q313 Q413 Q114 Q214 Q314 Q414 Payable Gold Production and Sales 1,997 17,952 39,243 37,030 60,366 40,967 0 5,541 23,874 51,983 57,974 38,910 0 10,000 20,000 30,000 40,000 50,000 60,000 70,000 Q313 Q413 Q114 Q214 Q314 Q414 (ounces) 2014 Production = 177,606 2014 Sales = 172,741 Au Recovery
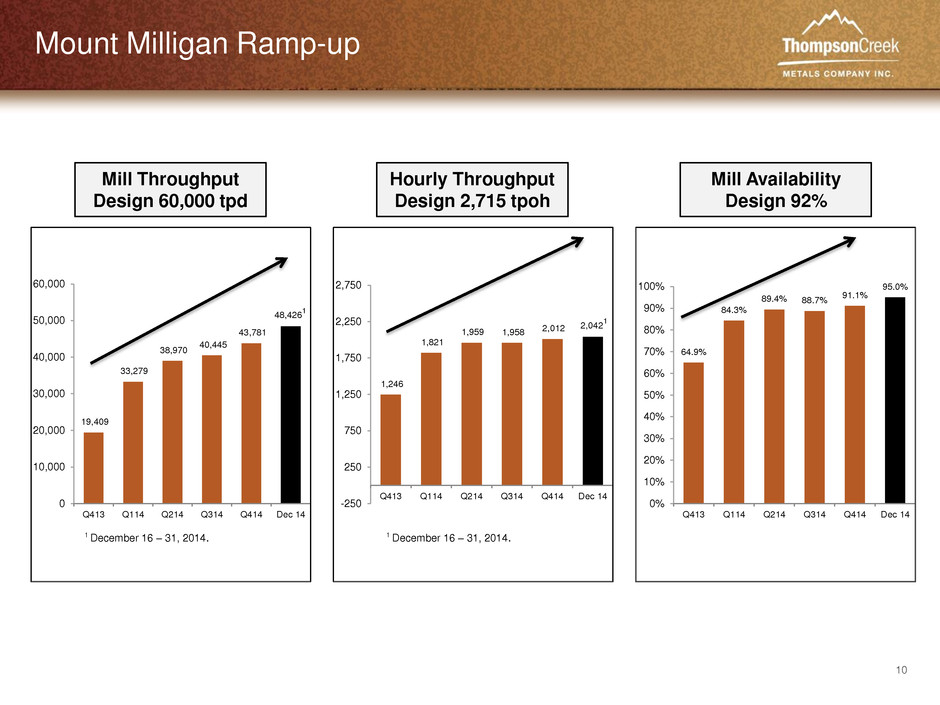
10 Mount Milligan Ramp-up 19,409 33,279 38,970 40,445 43,781 48,426 1 0 10,000 20,000 30,000 40,000 50,000 60,000 Q413 Q114 Q214 Q314 Q414 Dec 14 Mill Throughput Design 60,000 tpd 1,246 1,821 1,959 1,958 2,012 2,042 1 -250 250 750 1,250 1,750 2,250 2,750 Q413 Q114 Q214 Q314 Q414 Dec 14 1 December 16 – 31, 2014. 64.9% 84.3% 89.4% 88.7% 91.1% 95.0% 0% 10% 20% 30% 40% 50% 60% 70% 80% 90% 100% Q413 Q114 Q214 Q314 Q414 Dec 14 Hourly Throughput Design 2,715 tpoh Mill Availability Design 92% 1 December 16 – 31, 2014.
11 Mount Milligan Secondary Crushing Circuit Management has determined that additional crushing capacity is necessary to reach 60,000 tpd on a consistent basis Due to current metal prices, construction of a secondary crushing circuit will not commence until market conditions improve During the first half of 2015, detailed engineering phase is expected to be completed and commitments are expected to be made for the long lead items Temporary crushing will be utilized during 2015 and management expects to reach throughput of approximately 60,000 tpd by year-end 2015 Once the secondary crushing circuit is installed and commissioned, design mill throughput is expected to be at 62,500 tpd
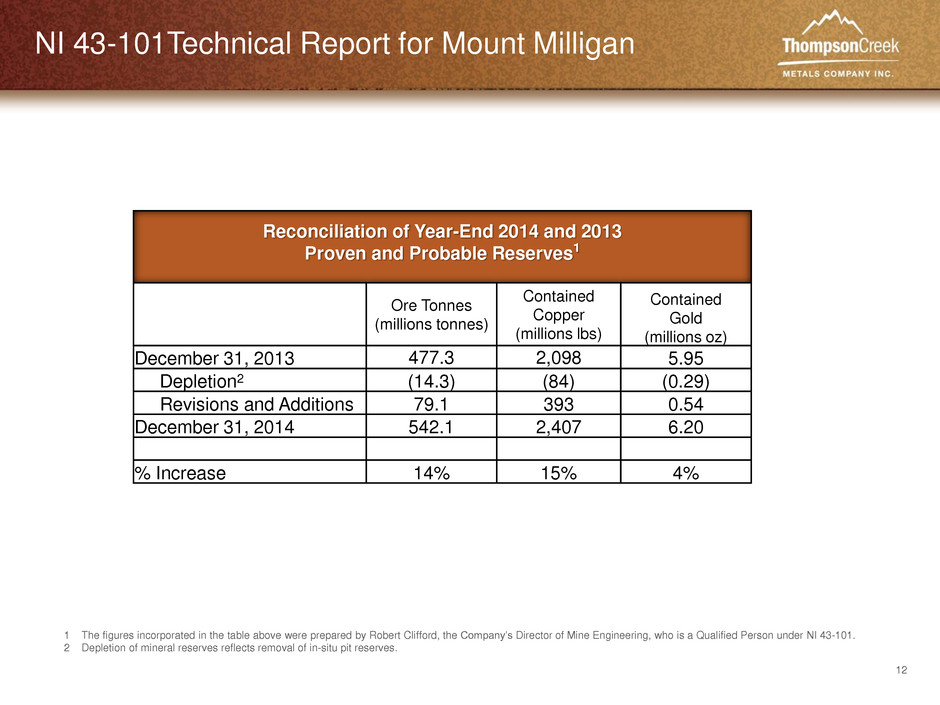
12 NI 43-101Technical Report for Mount Milligan Reconciliation of Year-End 2014 and 2013 Proven and Probable Reserves1 Ore Tonnes (millions tonnes) Contained Copper (millions lbs) Contained Gold (millions oz) December 31, 2013 477.3 2,098 5.95 Depletion2 (14.3) (84) (0.29) Revisions and Additions 79.1 393 0.54 December 31, 2014 542.1 2,407 6.20 % Increase 14% 15% 4% 1 The figures incorporated in the table above were prepared by Robert Clifford, the Company’s Director of Mine Engineering, who is a Qualified Person under NI 43-101. 2 Depletion of mineral reserves reflects removal of in-situ pit reserves.

13 Pam Saxton Executive Vice President and Chief Financial Officer Financial Discussion

14 2015 Production and Unit Cost Guidance 2015 Estimate Mount Milligan Copper and Gold Concentrate production (000’s dry tonnes)1 170 - 190 Copper payable production (000’s lb) 1 90,000 – 100,000 Gold payable production (000’s oz) 1 220 – 240 Unit cash cost – By-product (US$/payable lb copper production)2,4 $0.60 – $0.85 Molybdenum Business – Cash Flow (drain)3,4 US$ Millions Ongoing molybdenum operations – Langeloth (millions) $10 – $15 Suspended molybdenum operations (millions) Thompson Creek Mine Care and maintenance ($6 – $8) Phase 8 stripping ($8 – $10) Sale of inventory ($8/lb – $9/lb oxide price) $25 – $28 Endako Mine (75% share) 5 Temporary suspension ($5 – $8) Sale of inventory ($8/lb – $9/lb oxide price) $9 – $10 Total Cash Flow from Molybdenum Operations $25 – $27 1 Mount Milligan guidance assumes that we will reach throughput of approximately 60,000 tonnes per day by year-end 2015. 2 Copper by-product unit cash cost is calculated using payable copper production and deducts a gold by-product credit, which is determined based on expected revenue from payable gold production assuming a gold price of approximately $800 per ounce, which takes into account the contractual price of $435 per ounce under the Gold Stream Arrangement. 3 Excludes capital expenditures. 4 Estimate for cash costs and molybdenum cash flow (drain) assumes a foreign exchange rate of US$1.00 = C$1.15. 5 If Endako Mine goes on care and maintenance, our share of expected severance costs would be approximately $10 - $12 million.

15 2015 Capital Expenditure Guidance 2015 Estimate Capital Expenditures ($ in millions) 1 Mount Milligan operations 2 $22 Mount Milligan tailings dam 2 $24 Mount Milligan secondary crusher 2 $15 Langeloth and other $7 Total Cash Capital Expenditures $68 1 Plus or minus 10%. 2 Estimates for cash capital expenditures assume a foreign exchange rate of US$1.00 = C$1.15.

16 2015 EBITDA Estimates at Various Copper Prices Average Estimated EBITDA1 (in US$ millions) ($1,200/oz Gold and $9/lb Molybdenum Oxide) $130 $160 $180 $200 $0 $50 $100 $150 $200 $250 Cu $2.50/lb Cu $2.80/lb Cu $3.00/lb Cu $3.20/lb 1 EBITDA estimates were assumed to be at the mid-point of guidance, utilizing foreign exchange rate of US$1.00 = C$1.15, and assumes all production for 2015 is sold. EBITDA estimates include approximately $60 million of 2014 inventory expenses related to molybdenum inventory sold in 2015. EBITDA equals operating income excluding depreciation, depletion and amortization, accretion expense and any asset impairments. Does not include any additional severance costs for Endako Mine.
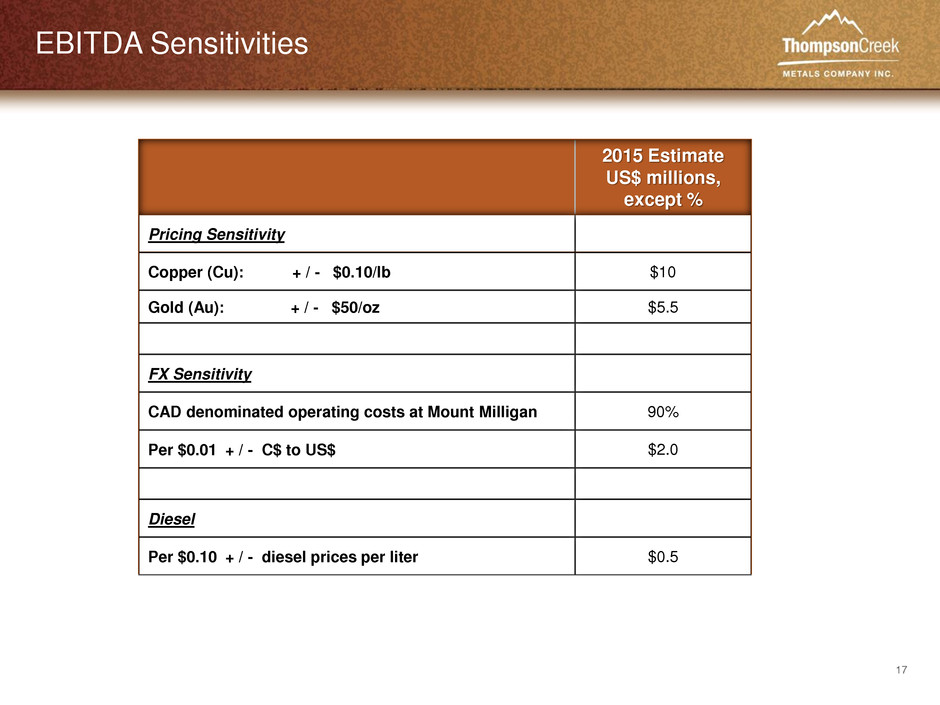
17 EBITDA Sensitivities 2015 Estimate US$ millions, except % Pricing Sensitivity Copper (Cu): + / - $0.10/lb $10 Gold (Au): + / - $50/oz $5.5 FX Sensitivity CAD denominated operating costs at Mount Milligan 90% Per $0.01 + / - C$ to US$ $2.0 Diesel Per $0.10 + / - diesel prices per liter $0.5
18 Jacques Perron President, Chief Executive Officer and Director Conclusion

19 Key Messages 2015 Guidance Payable copper production estimated to increase approximately 40 – 55% from 2014 Payable gold production estimated to increase 25 – 30% from 2014 Unit cash cost on by-product basis is estimated to be $0.60 - $0.85 per pound, making Mount Milligan one of the lowest cost producers on a by-product basis Improving the balance sheet With 2014 tMED exchange and recent bond repurchases, reduced debt by approximately $44 million and extinguished interest payments by approximately $24 million Secondary crushing circuit at Mount Milligan Construction is expected to commence once the copper price environment improves During the first half of 2015, detailed engineering phase is expected to be completed and commitments are expected to be made for the long lead items With utilization of temporary crushing circuit, expect to reach throughput of approximately 60,000 tpd by year-end 2015 Once secondary crusher is installed and commissioned, average daily throughput is expected to be 62,500 tpd c

20 NYSE:TC TSX:TCM Thompson Creek Metals Company www.thompsoncreekmetals.com Pamela Solly Director, Investor Relations and Corporate Responsibility Phone (303) 762-3526 Email psolly@tcrk.com
