Attached files
| file | filename |
|---|---|
| EX-99.1 - EXHIBIT 99.1 - MORGAN STANLEY | a51021611ex99_1.htm |
| EX-99.2 - EXHIBIT 99.2 - MORGAN STANLEY | a51021611ex99_2.htm |
| 8-K - MORGAN STANLEY 8-K - MORGAN STANLEY | a51021611.htm |
Exhibit 99.3

Morgan Stanley Strategic Update James P. Gorman, Chairman and Chief Executive Officer January 20, 2015
Notice The information provided herein may include certain non-GAAP financial measures. The reconciliation of such measures to the comparable GAAP figures are included in this presentation or in the Company’s most recent Annual Report on Form 10-K, Definitive Proxy Statement, Quarterly Reports on Form 10-Q and Current Reports on Form 8-K, as applicable, which are available on www.morganstanley.com. This presentation may contain forward-looking statements. You are cautioned not to place undue reliance on forward-looking statements, which speak only as of the date on which they are made, which reflect management’s current estimates, projections, expectations or beliefs and which are subject to risks and uncertainties that may cause actual results to differ materially. The Company does not undertake to update the forward-looking statements to reflect the impact of circumstances or events that may arise after the date of forward-looking statements. For a discussion of risks and uncertainties that may affect the future results of the Company, please see the Company’s most recent Annual Report on Form 10-K, Quarterly Reports on Form 10-Q and Current Reports on Form 8-K, as applicable, which are available on www.morganstanley.com. This presentation is not an offer to buy or sell any security. Please note this presentation is available at www.morganstanley.com. 2
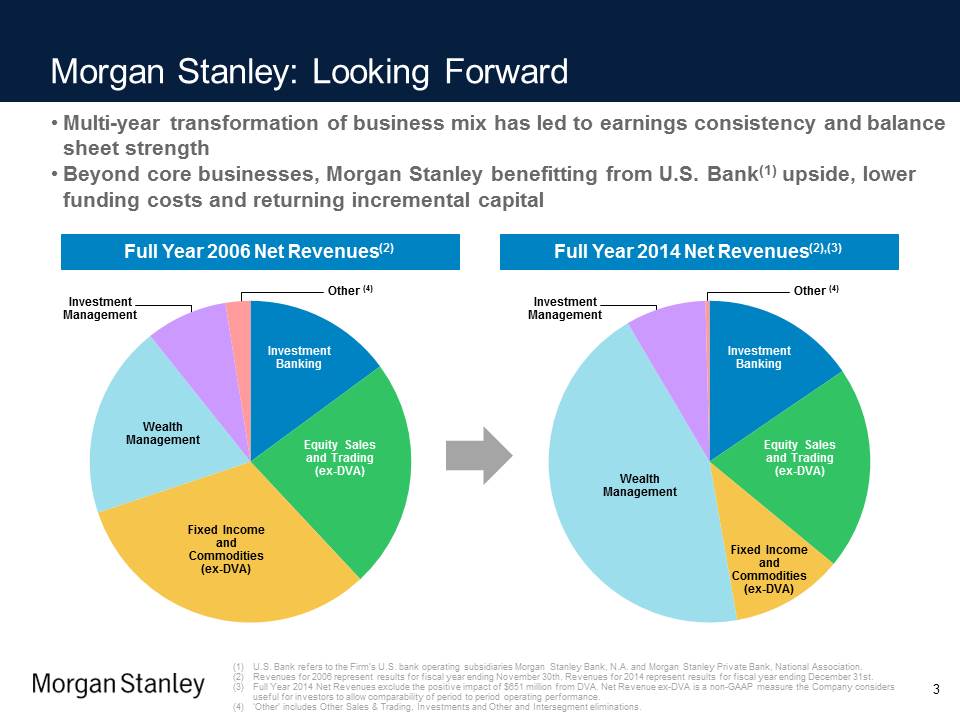
Morgan Stanley: Looking Forward • Multi-year transformation of business mix has led to earnings consistency and balance sheet strength • Beyond core businesses, Morgan Stanley benefitting from U.S. Bank(1) upside, lower funding costs and returning incremental capital Full Year 2006 Net Revenues(2) Full Year 2014 Net Revenues(2),(3) Other (4) Investment Management Wealth Management Fixed Income and Commodities (ex-DVA) Investment Banking Equity Sales and Trading (ex-DVA) Investment Management Other (4) Wealth Management Fixed Income and Commodities (ex-DVA) Investment Banking Equity Sales and Trading (ex-DVA) (1) U.S. Bank refers to the Firm’s U.S. bank operating subsidiaries Morgan Stanley Bank, N.A. and Morgan Stanley Private Bank, National Association. (2) Revenues for 2006 represent results for fiscal year ending November 30th. Revenues for 2014 represent results for fiscal year ending December 31st. (3) Full Year 2014 Net Revenues exclude the positive impact of $651 million from DVA. Net Revenue ex-DVA is a non-GAAP measure the Company considers useful for investors to allow comparability of period to period operating performance. (4) ‘Other’ includes Other Sales & Trading, Investments and Other and Intersegment eliminations. 3
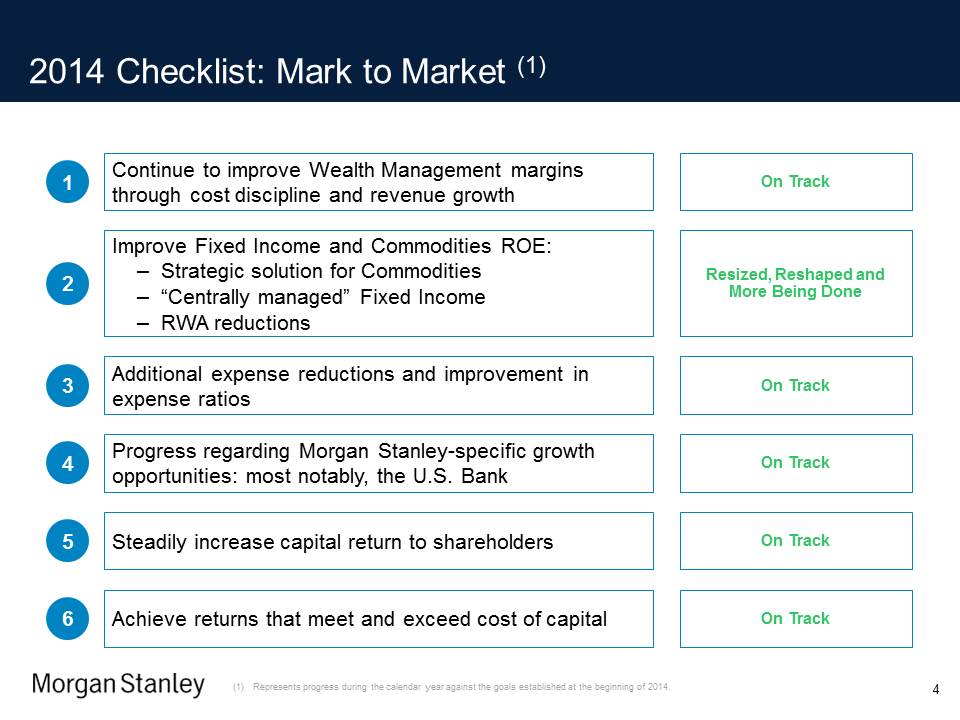
2014 Checklist: Mark to Market (1) 1 Continue to improve Wealth Management margins through cost discipline and revenue growth On Track 2 Improve Fixed Income and Commodities ROE: – Strategic solution for Commodities – “Centrally managed” Fixed Income – RWA reductions Resized, Reshaped and More Being Done 3 Additional expense reductions and improvement in expense ratios On Track 4 Progress regarding Morgan Stanley-specific growth opportunities: most notably, the U.S. Bank On Track 5 Steadily increase capital return to shareholders On Track 6 Achieve returns that meet and exceed cost of capital On Track (1) Represents progress during the calendar year against the goals established at the beginning of 2014. 4
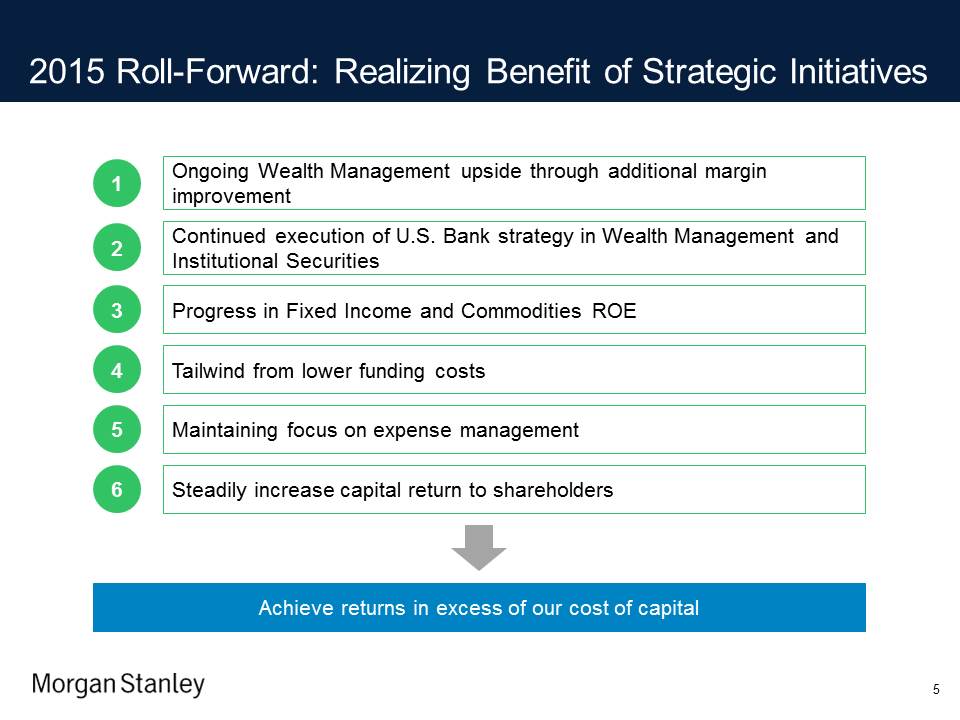
2015 Roll-Forward: Realizing Benefit of Strategic Initiatives 1 Ongoing Wealth Management upside through additional margin improvement 2 Continued execution of U.S. Bank strategy in Wealth Management and Institutional Securities 3 Progress in Fixed Income and Commodities ROE 4 Tailwind from lower funding costs 5 Maintaining focus on expense management 6 Steadily increase capital return to shareholders Achieve returns in excess of our cost of capital 5
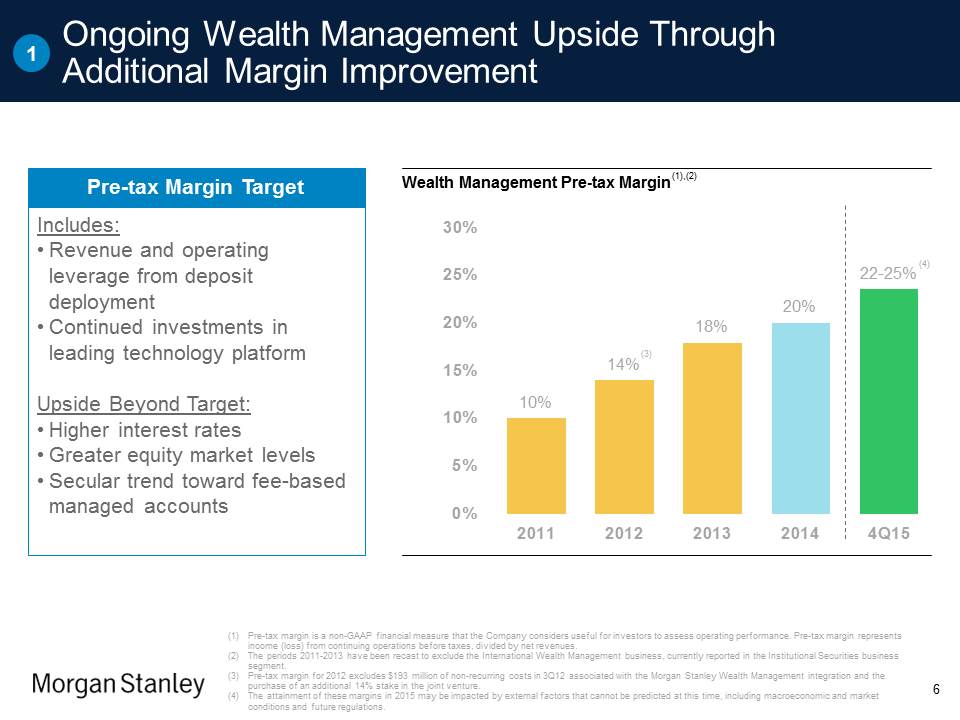
1 Ongoing Wealth Management Upside Through Additional Margin Improvement Wealth Management Pre-tax Margin (1),(2) 10% 14%(3) 18% 20% 22-25%(4) 2011 2012 2013 2014 4Q15 Pre-tax Margin Target Includes: • Revenue and operating leverage from deposit deployment • Continued investments in leading technology platform Upside Beyond Target: • Higher interest rates • Greater equity market levels • Secular trend toward fee-based managed accounts (1) Pre-tax margin is a non-GAAP financial measure that the Company considers useful for investors to assess operating performance. Pre-tax margin represents income (loss) from continuing operations before taxes, divided by net revenues. (2) The periods 2011-2013 have been recast to exclude the International Wealth Management business, currently reported in the Institutional Securities business segment. (3) Pre-tax margin for 2012 excludes $193 million of non-recurring costs in 3Q12 associated with the Morgan Stanley Wealth Management integration and the purchase of an additional 14% stake in the joint venture. (4) The attainment of these margins in 2015 may be impacted by external factors that cannot be predicted at this time, including macroeconomic and market conditions and future regulations. 6
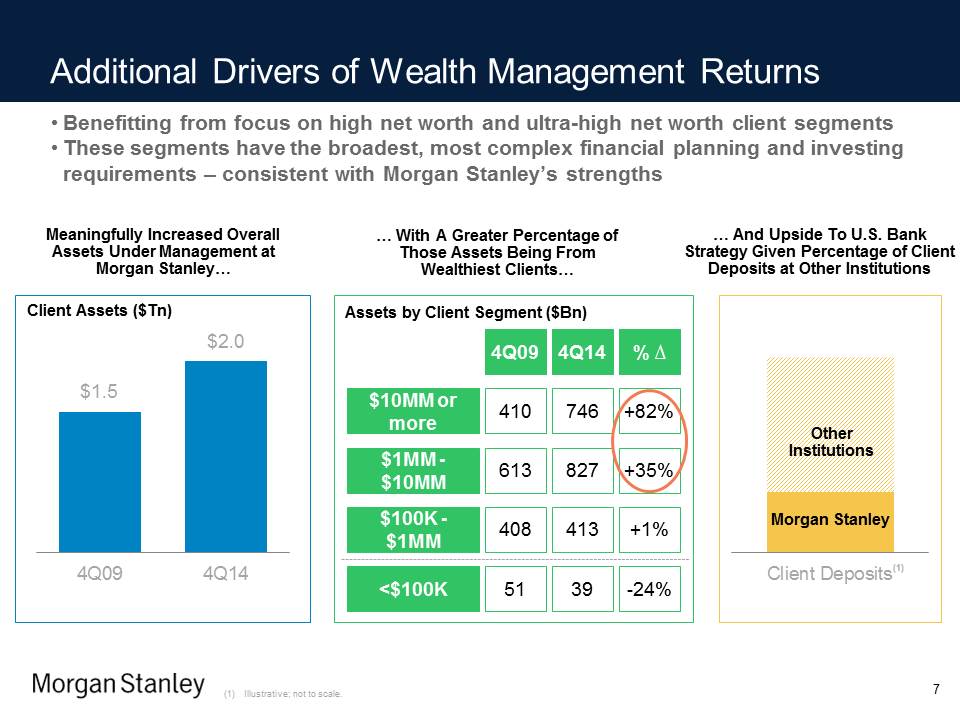
Additional Drivers of Wealth Management Returns • Benefitting from focus on high net worth and ultra-high net worth client segments • These segments have the broadest, most complex financial planning and investing requirements – consistent with Morgan Stanley’s strengths Meaningfully Increased Overall Assets Under Management at Morgan Stanley… … With A Greater Percentage of Those Assets Being From Wealthiest Clients… … And Upside To U.S. Bank Strategy Given Percentage of Client Deposits at Other Institutions Client Assets ($Tn) $1.5 4Q09 $2.0 4Q14 Assets by Client Segment ($Bn) 4Q09 4Q14 % Δ $10MM or more 410 746 +82% $1MM - $10MM 613 827 +35% $100K - $1MM 408 413 +1% <$100K 51 39 -24% Other Institutions Morgan Stanley Client Deposits (1) (1) Illustrative; not to scale. 7
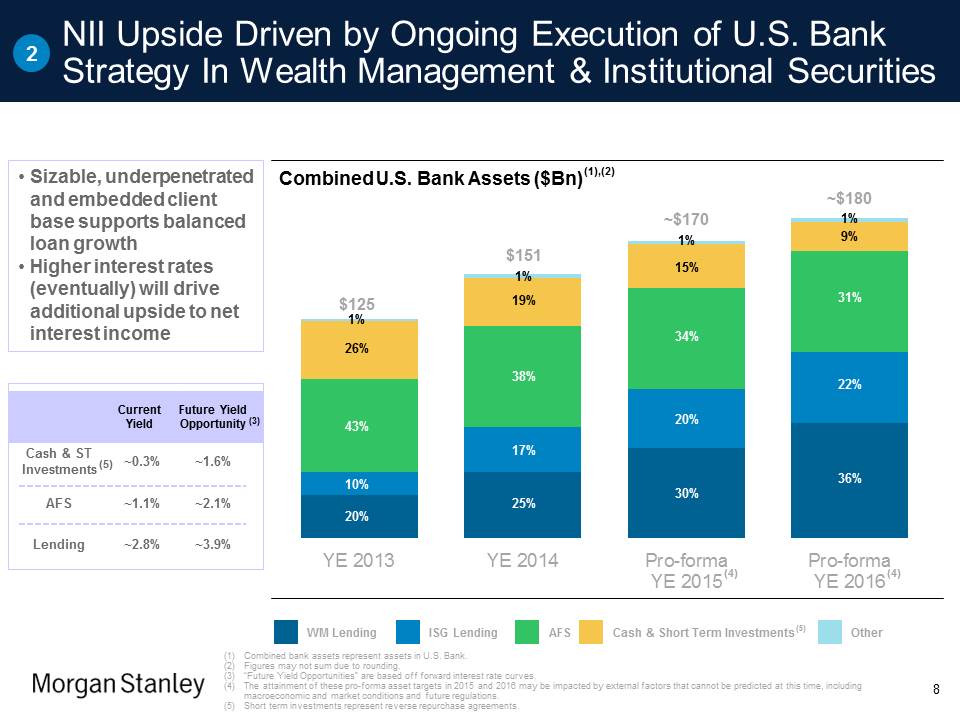
2 NII Upside Driven by Ongoing Execution of U.S. Bank Strategy In Wealth Management & Institutional Securities • Sizable, underpenetrated and embedded client base supports balanced loan growth • Higher interest rates (eventually) will drive additional upside to net interest income Current Yield Future Yield Opportunity Cash & ST Investments (5) ~0.3% ~1.6% AFS ~1.1% ~2.1% Lending ~2.8% ~3.9% Combined U.S. Bank Assets ($Bn) (1),(2) $125 1% 26% 43% 10% 20% $125 1% 19% 38% 17% 25% ~$170 1% 15% 34% 20% 30% ~$180 1% 9% 31% 22% 36% YE 2013 YE 2014 Pro-forma YE 2015 (4) Pro-forma YE 2016 (4) WM Lending ISG Lending AFS Cash & Short Term Investments (5) Other (1) Combined bank assets represent assets in U.S. Bank. (2) Figures may not sum due to rounding. (3) “Future Yield Opportunities” are based off forward interest rate curves. (4) The attainment of these pro-forma asset targets in 2015 and 2016 may be impacted by external factors that cannot be predicted at this time, including macroeconomic and market conditions and future regulations. (5) Short term investments represent reverse repurchase agreements. 8
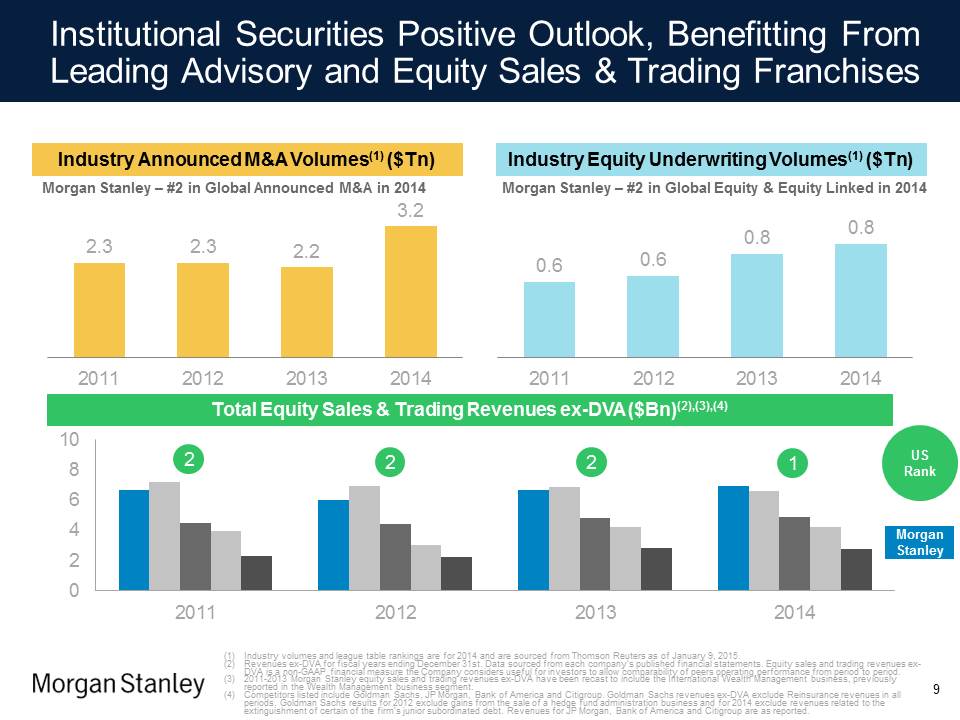
Institutional Securities Positive Outlook, Benefitting From Leading Advisory and Equity Sales & Trading Franchises Industry Announced M&A Volumes(1) ($Tn) Industry Equity Underwriting Volumes(1) ($Tn) Morgan Stanley – #2 in Global Announced M&A in 2014 Morgan Stanley – #2 in Global Equity & Equity Linked in 2014 2.3 2.3 2.2 3.2 0.6 0.6 0.8 0.8 2011 2012 2013 2014 2011 2012 2013 2014 Total Equity Sales & Trading Revenues ex-DVA ($Bn)(2),(3),(4) 2 2 2 1 US Rank Morgan Stanley 2011 2012 2013 2014 (1) Industry volumes and league table rankings are for 2014 and are sourced from Thomson Reuters as of January 9, 2015. (2) Revenues ex-DVA for fiscal years ending December 31st. Data sourced from each company’s published financial statements. Equity sales and trading revenues ex-DVA is a non-GAAP financial measure the Company considers useful for investors to allow comparability of peers operating performance from period to period. (3) 2011-2013 Morgan Stanley equity sales and trading revenues ex-DVA have been recast to include the International Wealth Management business, previously reported in the Wealth Management business segment. (4) Competitors listed include Goldman Sachs, JP Morgan, Bank of America and Citigroup. Goldman Sachs revenues ex-DVA exclude Reinsurance revenues in all periods. Goldman Sachs results for 2012 exclude gains from the sale of a hedge fund administration business and for 2014 exclude revenues related to the extinguishment of certain of the firm’s junior subordinated debt. Revenues for JP Morgan, Bank of America and Citigroup are as reported. 9
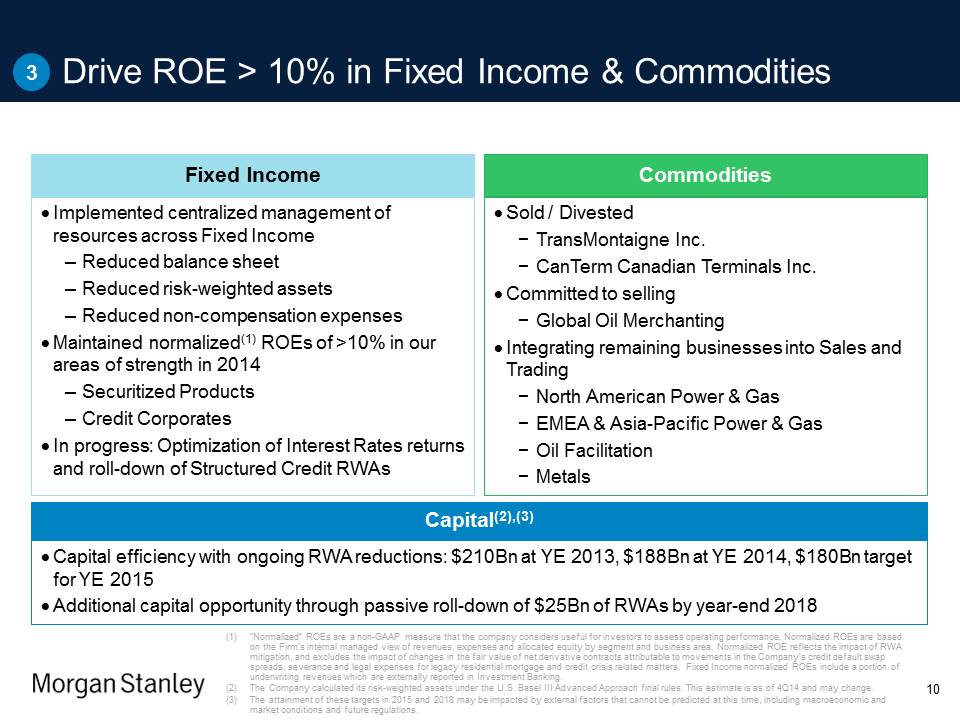
3 Drive ROE > 10% in Fixed Income & Commodities Fixed Income Implemented centralized management of resources across Fixed Income – Reduced balance sheet – Reduced risk-weighted assets – Reduced non-compensation expenses Maintained normalized(1) ROEs of >10% in our areas of strength in 2014 – Securitized Products – Credit Corporates In progress: Optimization of Interest Rates returns and roll-down of Structured Credit RWAs Commodities Sold / Divested − TransMontaigne Inc. − CanTerm Canadian Terminals Inc. Committed to selling − Global Oil Merchanting Integrating remaining businesses into Sales and Trading − North American Power & Gas − EMEA & Asia-Pacific Power & Gas − Oil Facilitation − Metals Capital(2),(3) Capital efficiency with ongoing RWA reductions: $210Bn at YE 2013, $188Bn at YE 2014, $180Bn target for YE 2015 Additional capital opportunity through passive roll-down of $25Bn of RWAs by year-end 2018 (1) “Normalized” ROEs are a non-GAAP measure that the company considers useful for investors to assess operating performance. Normalized ROEs are based on the Firm’s internal managed view of revenues, expenses and allocated equity by segment and business area. Normalized ROE reflects the impact of RWA mitigation, and excludes the impact of changes in the fair value of net derivative contracts attributable to movements in the Company’s credit default swap spreads, severance and legal expenses for legacy residential mortgage and credit crisis related matters. Fixed Income normalized ROEs include a portion of underwriting revenues which are externally reported in Investment Banking. (2) The Company calculated its risk-weighted assets under the U.S. Basel III Advanced Approach final rules. This estimate is as of 4Q14 and may change. (3) The attainment of these targets in 2015 and 2018 may be impacted by external factors that cannot be predicted at this time, including macroeconomic and market conditions and future regulations. 10
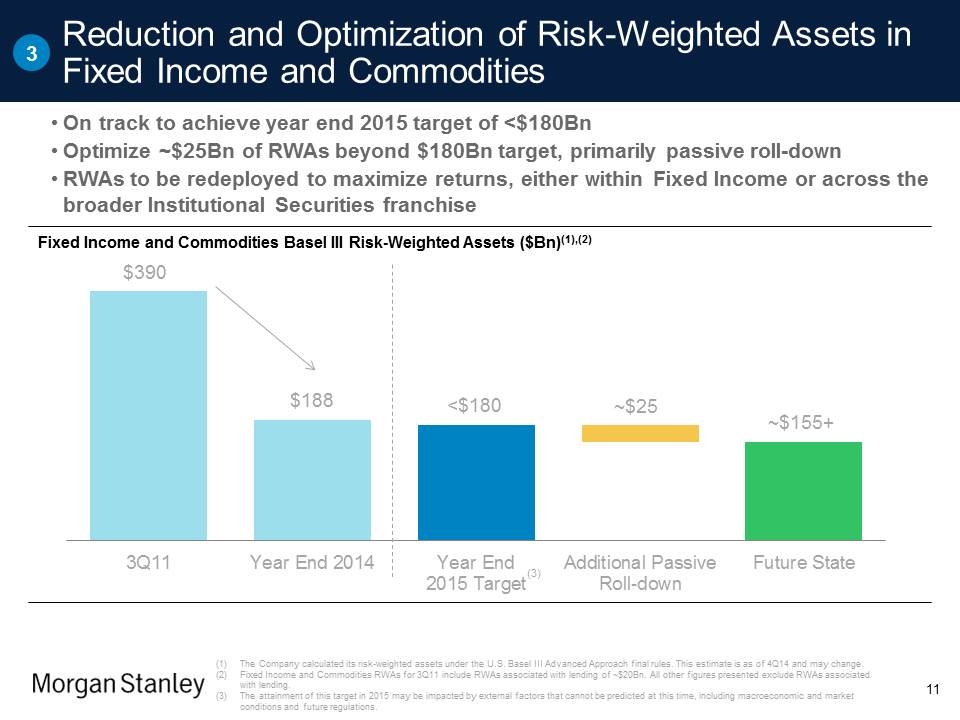
3 Reduction and Optimization of Risk-Weighted Assets in Fixed Income and Commodities • On track to achieve year end 2015 target of <$180Bn • Optimize ~$25Bn of RWAs beyond $180Bn target, primarily passive roll-down • RWAs to be redeployed to maximize returns, either within Fixed Income or across the broader Institutional Securities franchise Fixed Income and Commodities Basel III Risk-Weighted Assets ($Bn)(1),(2) $390 $188 <$180 ~$25 ~$155+ 3Q11 Year End 2014 Year End 2015 Target (3) Additional Passive Roll-down Future State (1) The Company calculated its risk-weighted assets under the U.S. Basel III Advanced Approach final rules. This estimate is as of 4Q14 and may change. (2) Fixed Income and Commodities RWAs for 3Q11 include RWAs associated with lending of ~$20Bn. All other figures presented exclude RWAs associated with lending. (3) The attainment of this target in 2015 may be impacted by external factors that cannot be predicted at this time, including macroeconomic and market conditions and future regulations. 11
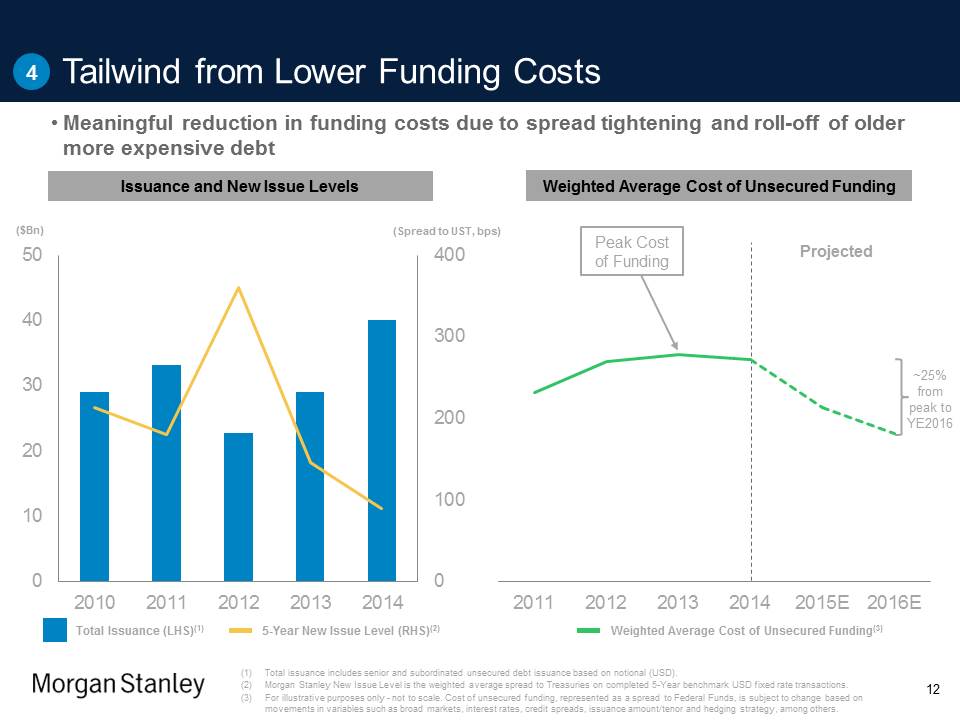
4 Tailwind from Lower Funding Costs • Meaningful reduction in funding costs due to spread tightening and roll-off of older more expensive debt Issuance and New Issue Levels Weighted Average Cost of Unsecured Funding ($Bn) (Spread to UST, bps) 2010 2011 2012 2013 2014 Peak Cost of Funding Projected ~25% from peak to YE2016 2011 2012 2013 2014 2015E 2016E Total Issuance (LHS)(1) 5-Year New Issue Level (RHS)(2) Weighted Average Cost of Unsecured Funding(3) (1) Total issuance includes senior and subordinated unsecured debt issuance based on notional (USD). (2) Morgan Stanley New Issue Level is the weighted average spread to Treasuries on completed 5-Year benchmark USD fixed rate transactions. (3) For illustrative purposes only - not to scale. Cost of unsecured funding, represented as a spread to Federal Funds, is subject to change based on movements in variables such as broad markets, interest rates, credit spreads, issuance amount/tenor and hedging strategy, among others. 12
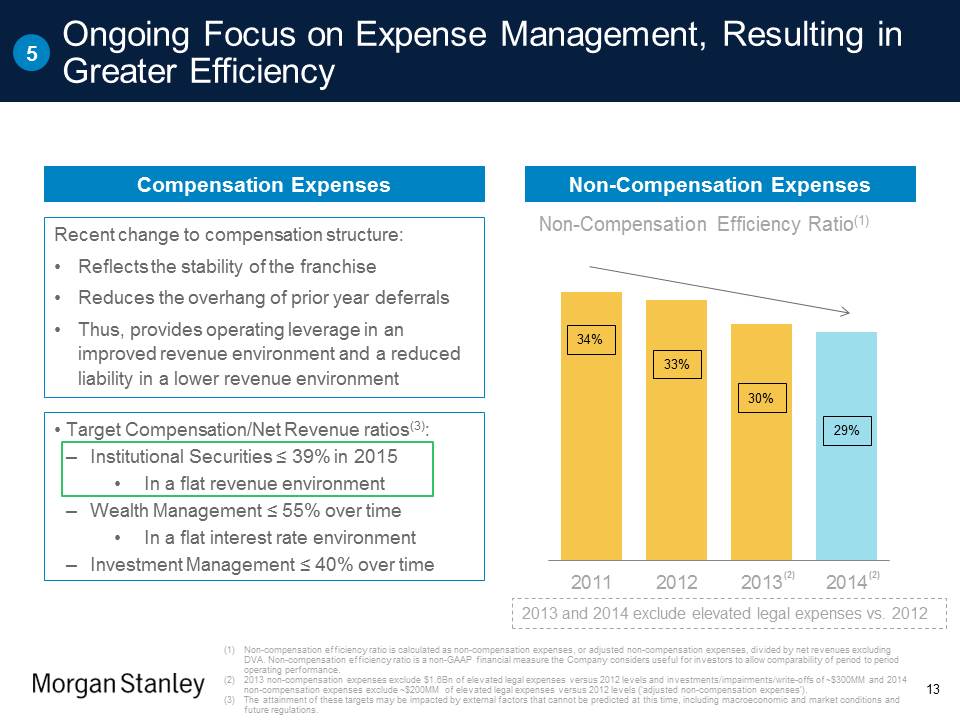
5 Ongoing Focus on Expense Management, Resulting in Greater Efficiency Compensation Expenses Recent change to compensation structure: • Reflects the stability of the franchise • Reduces the overhang of prior year deferrals • Thus, provides operating leverage in an improved revenue environment and a reduced liability in a lower revenue environment • Target Compensation/Net Revenue ratios(3): – Institutional Securities ≤ 39% in 2015 • In a flat revenue environment – Wealth Management ≤ 55% over time • In a flat interest rate environment – Investment Management ≤ 40% over time (2) Non-Compensation Expenses Non-Compensation Efficiency Ratio(1) 34% 33% 30% 29% 2011 2012 2013 (2) 2014 (2) 2013 and 2014 exclude elevated legal expenses vs. 2012 (1) Non-compensation efficiency ratio is calculated as non-compensation expenses, or adjusted non-compensation expenses, divided by net revenues excluding DVA. Non-compensation efficiency ratio is a non-GAAP financial measure the Company considers useful for investors to allow comparability of period to period operating performance. (2) 2013 non-compensation expenses exclude $1.6Bn of elevated legal expenses versus 2012 levels and investments/impairments/write-offs of ~$300MM and 2014 non-compensation expenses exclude ~$200MM of elevated legal expenses versus 2012 levels (‘adjusted non-compensation expenses’). (3) The attainment of these targets may be impacted by external factors that cannot be predicted at this time, including macroeconomic and market conditions and future regulations. 13
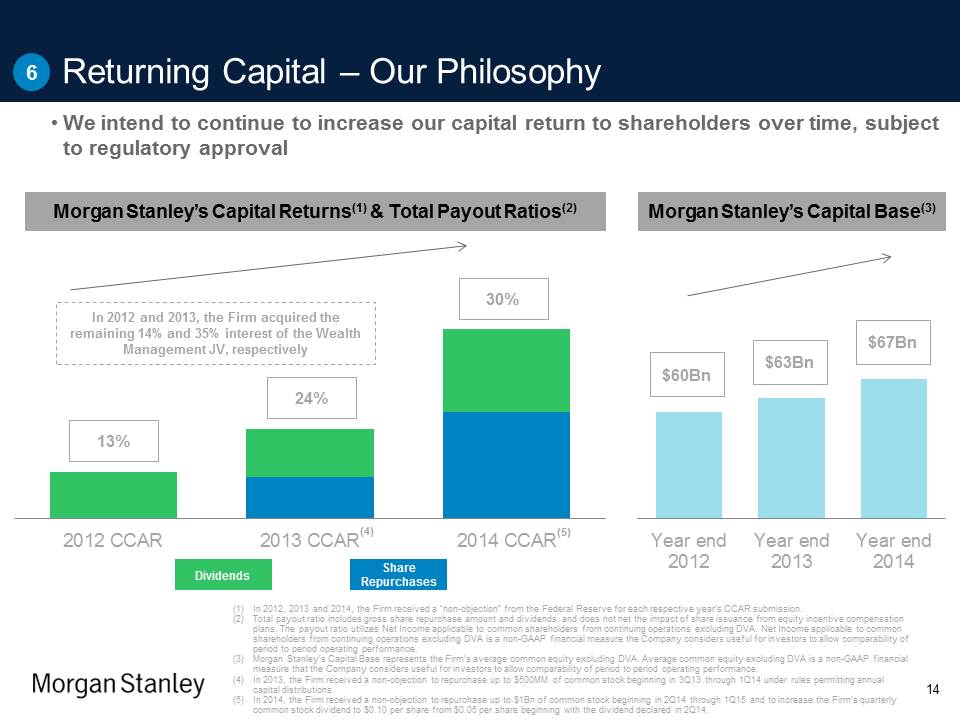
6 Returning Capital – Our Philosophy • We intend to continue to increase our capital return to shareholders over time, subject to regulatory approval Morgan Stanley’s Capital Returns(1) & Total Payout Ratios(2) In 2012 and 2013, the Firm acquired the remaining 14% and 35% interest of the Wealth Management JV, respectively 13% 24% 30% 2012 CCAR 2013 CCAR (4) 2014 CCAR (5) Morgan Stanley’s Capital Base(3) $60Bn $63Bn $67Bn Year end 2012 Year end 2013 Year end 2014 Dividends Share Repurchases (1) In 2012, 2013 and 2014, the Firm received a “non-objection” from the Federal Reserve for each respective year’s CCAR submission. (2) Total payout ratio includes gross share repurchase amount and dividends, and does not net the impact of share issuance from equity incentive compensation plans. The payout ratio utilizes Net Income applicable to common shareholders from continuing operations excluding DVA. Net Income applicable to common shareholders from continuing operations excluding DVA is a non-GAAP financial measure the Company considers useful for investors to allow comparability of period to period operating performance. (3) Morgan Stanley’s Capital Base represents the Firm’s average common equity excluding DVA. Average common equity excluding DVA is a non-GAAP financial measure that the Company considers useful for investors to allow comparability of period to period operating performance. (4) In 2013, the Firm received a non-objection to repurchase up to $500MM of common stock beginning in 3Q13 through 1Q14 under rules permitting annual capital distributions. (5) In 2014, the Firm received a non-objection to repurchase up to $1Bn of common stock beginning in 2Q14 through 1Q15 and to increase the Firm’s quarterly common stock dividend to $0.10 per share from $0.05 per share beginning with the dividend declared in 2Q14. 14
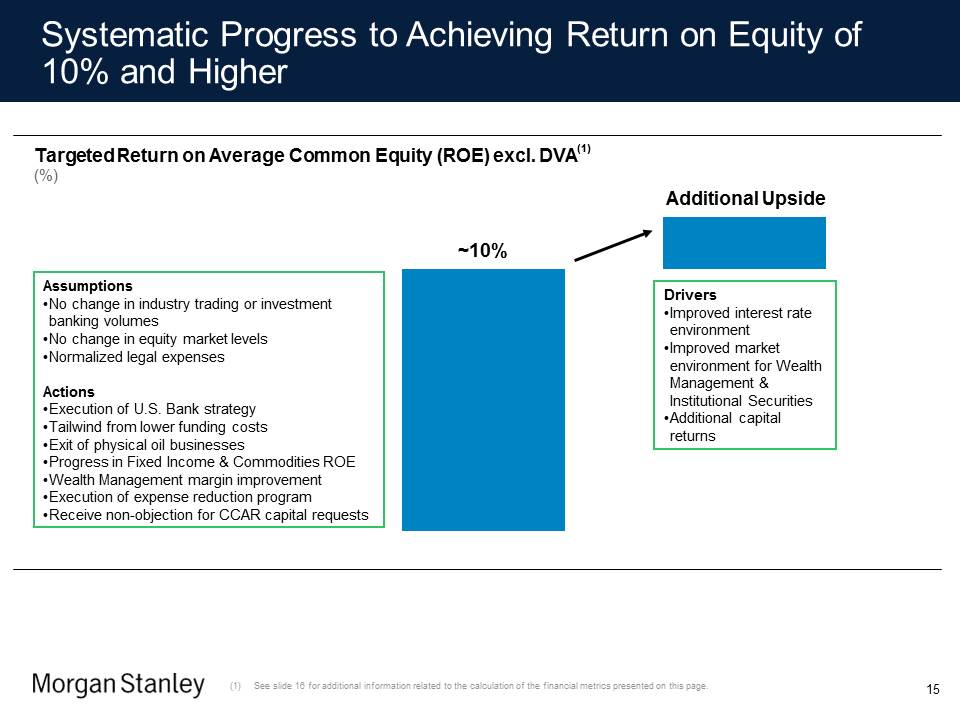
Systematic Progress to Achieving Return on Equity of 10% and Higher Targeted Return on Average Common Equity (ROE) excl. DVA (1) (%) Assumptions •No change in industry trading or investment banking volumes •No change in equity market levels •Normalized legal expenses Actions •Execution of U.S. Bank strategy •Tailwind from lower funding costs •Exit of physical oil businesses •Progress in Fixed Income & Commodities ROE •Wealth Management margin improvement •Execution of expense reduction program •Receive non-objection for CCAR capital requests ~10% Additional Upside Drivers •Improved interest rate environment •Improved market environment for Wealth Management & Institutional Securities •Additional capital returns (1) See slide 16 for additional information related to the calculation of the financial metrics presented on this page. 15
End Notes These notes refer to the financial metrics presented on Slide 15. (1) The attainment of these results may be impacted by external factors that cannot be predicted at this time, including macroeconomic and market conditions and future regulations. (2) Improved interest rate environment refers to a future environment where interest rates are higher than indicated by the forward curve as of year-end 2014. (3) Based on current expectations; changes in legal results or regulation could materially impact expenses. Expense reductions include Office of Re-engineering, Institutional Securities and Wealth Management expense initiatives, and headcount management, partially offset by re-investment in certain areas. (4) Normalized legal expenses are calculated by excluding elevated legal expenses versus 2012 levels from non-compensation expenses. Normalized legal expenses represent a non-GAAP financial measure that the company considers useful for investors to allow comparability of period to period operating performance. (5) To determine the return on consolidated average common equity, excluding the impact of DVA, both the numerator and the denominator are adjusted to exclude the impact of DVA. The return on average common equity, excluding DVA is a non-GAAP measure the Company considers to be a useful measure that the Company and investors use to assess operating performance. The calculation of return on average common equity, excluding DVA uses income from continuing operations applicable to Morgan Stanley less preferred dividends and DVA as a percentage of average common equity excluding DVA. (6) Capital actions are subject to regulatory approval. 16
Morgan Stanley Strategic Update James P. Gorman, Chairman and Chief Executive Officer January 20, 2015