Attached files
| file | filename |
|---|---|
| 8-K - FORM 8-K - People's United Financial, Inc. | d853200d8k.htm |
| EX-99.1 - EX-99.1 - People's United Financial, Inc. | d853200dex991.htm |
 Fourth Quarter and Full Year 2014 Results
January 15, 2015
NASDAQ: PBCT
Exhibit 99.2 |
 1
Forward-Looking Statement
Certain
statements
contained
in
this
release
are
forward-looking
in
nature.
These
include
all
statements
about
People's
United
Financial's
plans,
objectives,
expectations
and
other
statements
that
are
not
historical
facts,
and
usually
use
words
such
as
"expect,"
"anticipate,"
"believe,"
"should"
and
similar
expressions.
Such
statements
represent
management's
current
beliefs,
based
upon
information
available
at
the
time
the
statements
are
made,
with
regard
to
the
matters
addressed.
All
forward-looking
statements
are
subject
to
risks
and
uncertainties
that
could
cause
People's
United
Financial's
actual
results
or
financial
condition
to
differ
materially
from
those
expressed
in
or
implied
by
such
statements.
Factors
of
particular
importance
to
People’s
United
Financial
include,
but
are
not
limited
to:
(1)
changes
in
general,
national
or
regional
economic
conditions;
(2)
changes
in
interest
rates;
(3)
changes
in
loan
default
and
charge-off
rates;
(4)
changes
in
deposit
levels;
(5)
changes
in
levels
of
income
and
expense
in
non-
interest
income
and
expense
related
activities;
(6)
changes
in
accounting
and
regulatory
guidance
applicable
to
banks;
(7)
price
levels
and
conditions
in
the
public
securities
markets
generally;
(8)
competition
and
its
effect
on
pricing,
spending,
third-party
relationships
and
revenues;
and
(9)
changes
in
regulation
resulting
from
or
relating
to
financial
reform
legislation.
People's
United
Financial
does
not
undertake
any
obligation
to
update
or
revise
any
forward-looking
statements,
whether
as
a
result
of
new
information,
future
events
or
otherwise. |
 2
Full Year 2014 Overview
•
Operating earnings of $245 million or $0.82 per share, an increase from $241
million or $0.77 per share
–
Fifth consecutive year of growth in operating earnings per share
•
Net interest income
1
of $912 million, an increase of 3%
•
Net interest margin of 3.09%, a decrease of 22 basis points
•
Loan growth of $2.2 billion, or 9%, to $26.6 billion
•
Deposit growth of $3.6 billion, or 16% to $26.1 billion
–
Excluding brokered deposits, deposit growth of $1.1 billion, or 5%
•
Non-interest income, excluding the $20.6 million gain on the merchant services
joint venture, of $330 million compared to $342 million
•
Efficiency ratio was 62.1%, an improvement from 62.3%
•
Asset quality remained strong with net loan charge-offs at 0.12%, compared to
0.19% (All comparisons versus full year 2013)
1
Net interest income on a fully taxable equivalent basis was $931
million, an increase of 3%.
•
Operating expenses remained flat at $832 million |
 3
Full Year 2014: Goals Versus Actuals
Goals
Actual
Loan Growth
High single digits to mid-teens
9%
Deposit Growth
Mid-teens
(including $2.0 billion in brokered deposits)
16%
(including $2.6 billion in brokered deposits)
Net Interest Margin
3.10% -
3.20%
3.09%
Net Interest Income
$930 million -
$960 million
$912 million¹
Non-Interest Income
Maintain fee income levels
$330 million²
Operating Expenses
$830 million -
$840 million
$832 million
Asset Quality
Excellent credit quality
Excellent credit quality
Capital Levels
Strong capital levels
Strong capital levels
1
Net
interest
income
on
a
fully
taxable
equivalent
basis
was
$931
million.
2
Excludes $20.6 million non-operating gain on merchant services joint
venture. |
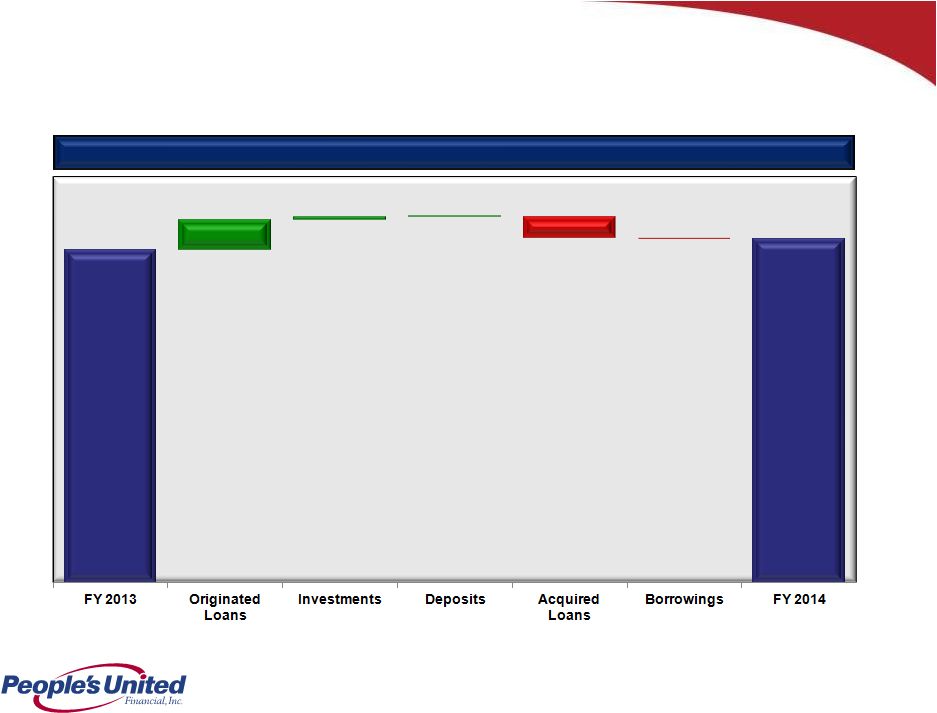 4
Net Interest Income
1
($ in millions)
Annual Change
Annual Change
$65.1
$7.2
($46.1)
($3.1)
$888.6
$911.9
$0.2
1
Net
interest
income
on
a
fully
taxable
equivalent
basis
for
2013
and
2014
was
$905.8
million
and
$931.1
million,
respectively. |
 5
Net Interest Margin
Annual Change
Annual Change
(0.21%)
(0.01%)
3.31%
3.09% |
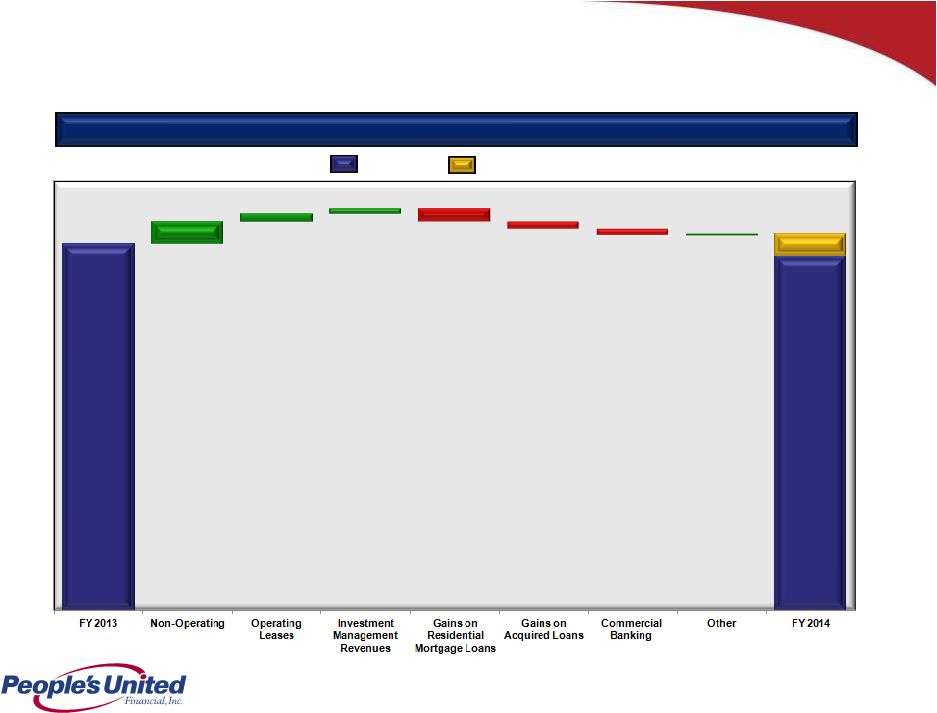 6
Non-Interest Income
($ in millions)
Annual Change
Annual Change
$20.6
$7.1
($5.8)
$341.7
($11.9)
$330.2
($6.6)
Operating
Non-Operating
1
Non-operating income represents the 2Q 2014 gain on the merchant services
joint venture, net of related expenses $4.4
$1.3
$20.6
$20.6
$350.8
$341.7
-
1 |
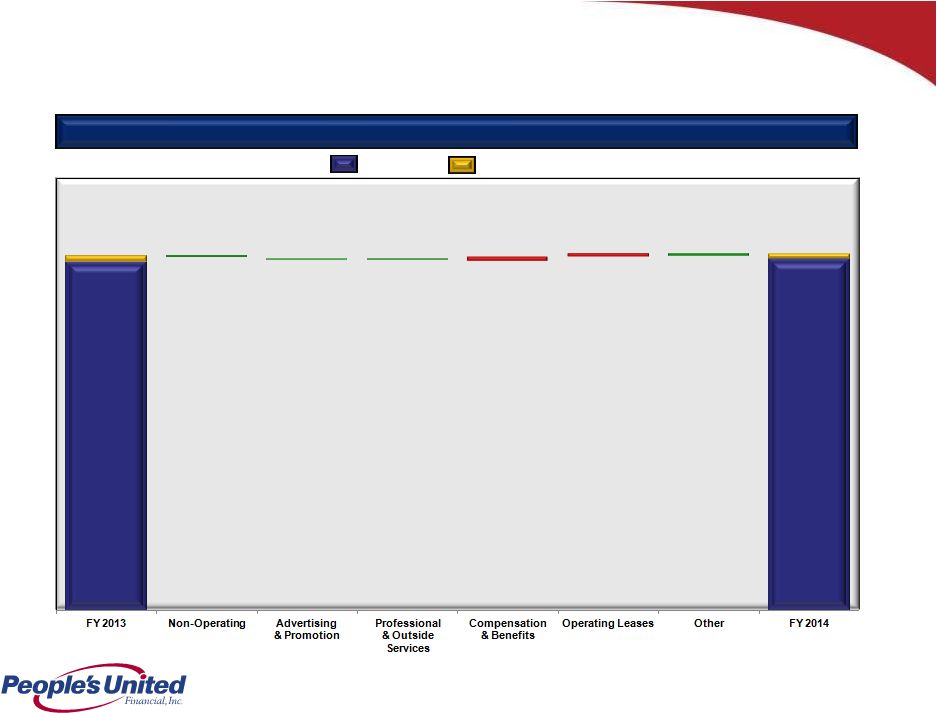 7
Non-Interest Expense
($ in millions)
Annual Change
Annual Change
($3.2)
$826.3
$8.2
$6.1
$832.0
$12.7
$839.0
$841.5
Operating
Non-Operating
$9.5
($2.4)
($1.2)
($5.0) |
 8
2015 Goals
•
Loan growth in the high-single to low-double digits
•
Deposit growth in the mid to high-single digits
•
Net interest income growth in the low to mid-single digits
•
Net interest margin range of 2.85% -
2.95%
•
Non-interest income
1
growth in the low-single digits
•
Full year operating expense range of $835 million to $845 million
•
Maintain excellent credit quality & strong capital levels
1
Adjusted for 2014 non-operating gain on the merchant services joint venture
|
 9
Fourth Quarter 2014 Overview
•
Operating
earnings
of
$65.1
million
or
$0.22
per
share,
compared
to
$63.0
million
or
$0.21
per
share
•
Net interest income
1
of $228 million, consistent with the third quarter of 2014
•
Net interest margin of 3.00%, a decrease of 5 basis points
•
Loan growth of $638 million, 10% annualized growth rate
•
Deposit growth of $877 million, 14% annualized growth rate
–
Excluding brokered deposits, deposit growth of $472 million, 8% annualized growth
rate •
Non-interest income of $86.8 million, increased from $84.0 million
•
Operating expenses remained flat at $207 million
•
Efficiency ratio was 61.3%, improved from 61.4%
•
Net loan charge-offs were 0.13%, consistent with the third quarter 2014
(All comparisons versus third quarter 2014)
1
Net interest income on a fully taxable equivalent basis was $233
million, consistent with the third quarter of 2014. |
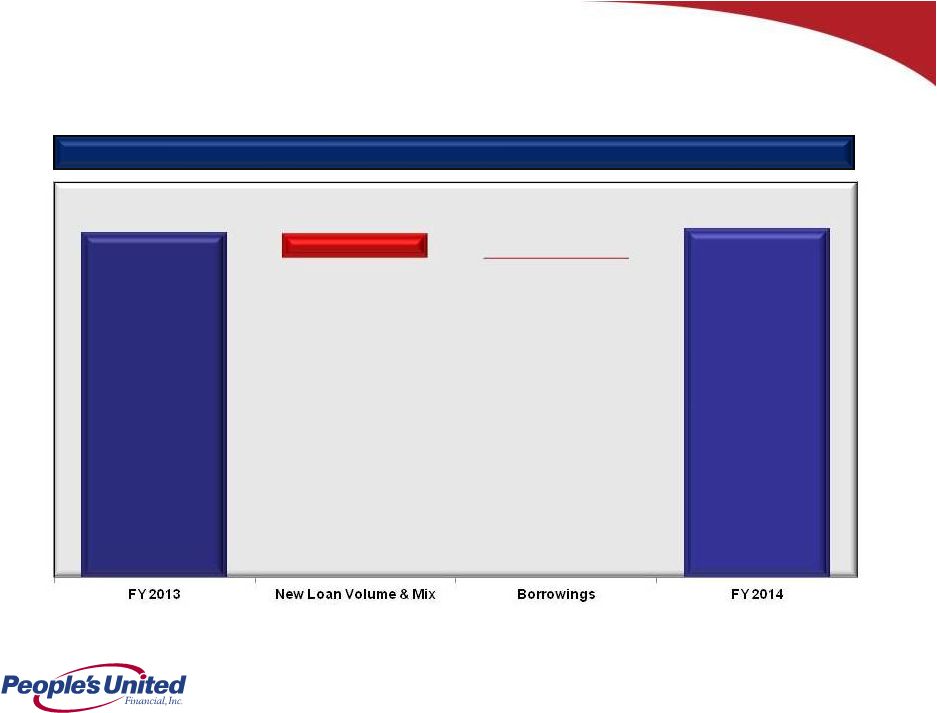
 10
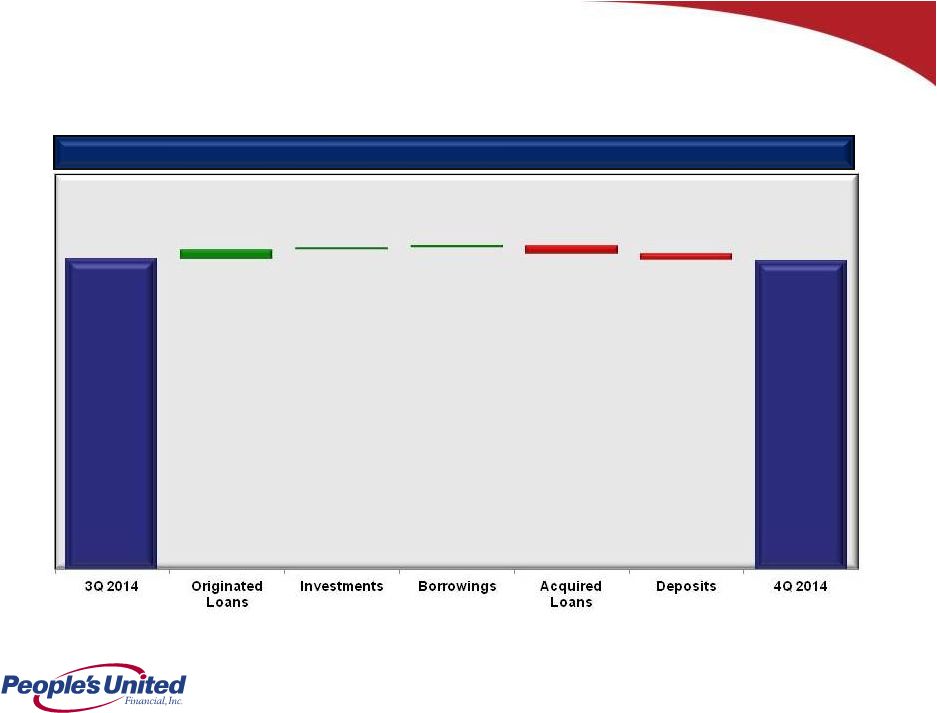
Net Interest Income
1
($ in millions)
Linked Quarter Change
Linked Quarter Change
$2.2
$0.4
($1.9)
($1.5)
$228.5
$228.1
$0.4
1
Net interest income on a fully taxable equivalent basis for 3Q 2014 and 4Q 2014
was $233.3 million and $233.2 million, respectively.
|
 11
Net Interest Margin
Linked Quarter Change
Linked Quarter Change
(0.05%)
(0.02%)
0.01%
0.01%
3.05%
3.00% |
 12
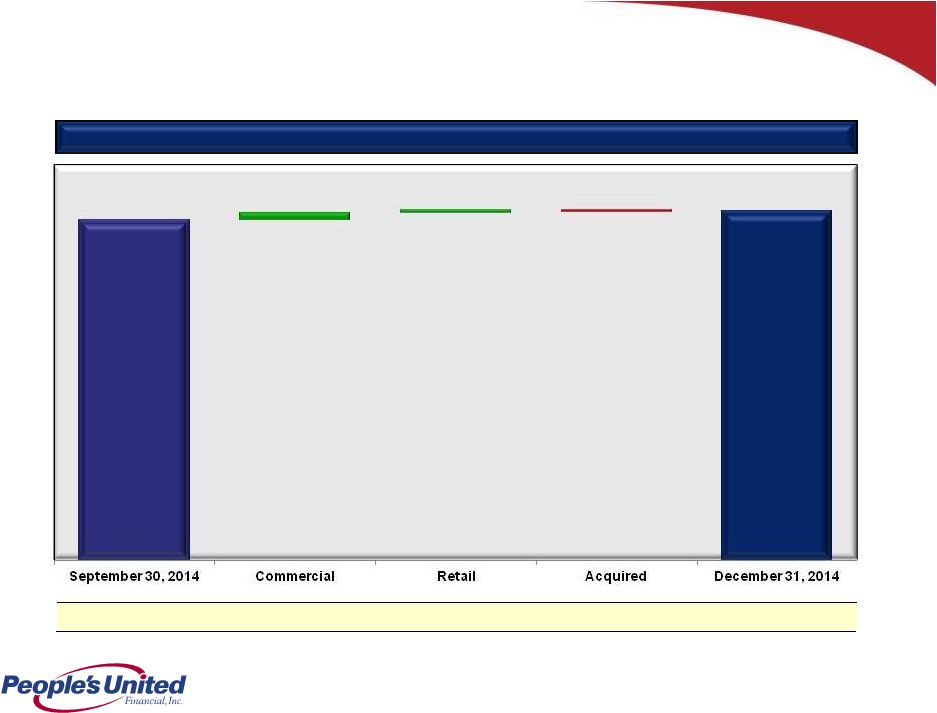
Loans
($ in millions)
Linked Quarter Change
Linked Quarter Change
$554
$213
($129)
$25,954
$26,592
Annualized linked quarter change: +9.8%
|
 13
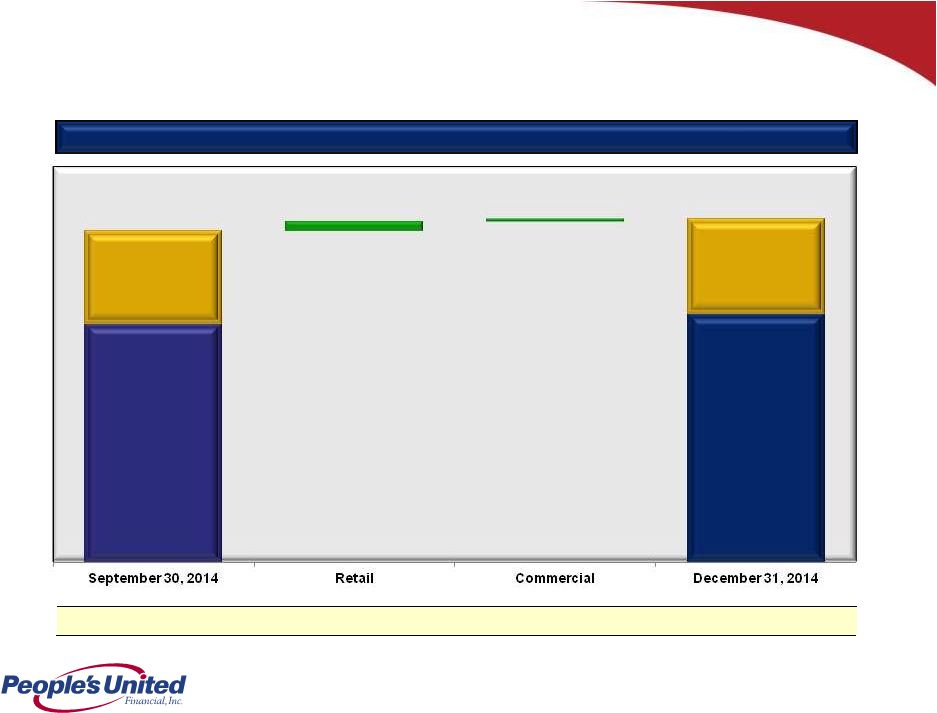
Deposits
Linked Quarter Change
Linked Quarter Change
$709
$168
Retail
2
$18,217
($ in millions)
Annualized linked quarter change: +13.9%
Commercial
1
$7,044
Commercial
1
$7,212
$25,261
$26,138
Retail
2
$18,926
1
Commercial includes Municipal deposits of $1,397 at 09/30/2014 and $1,458 at
12/31/2014 2
Retail includes brokered deposits of $2,228 at 09/30/2014 and $2,633 at
12/31/2014 |
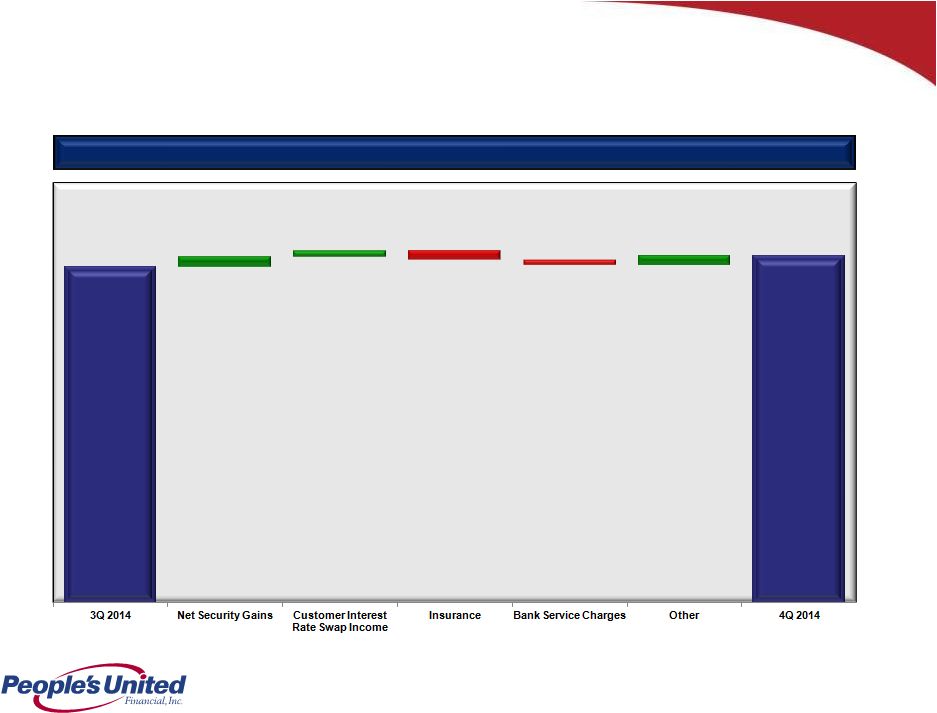 14
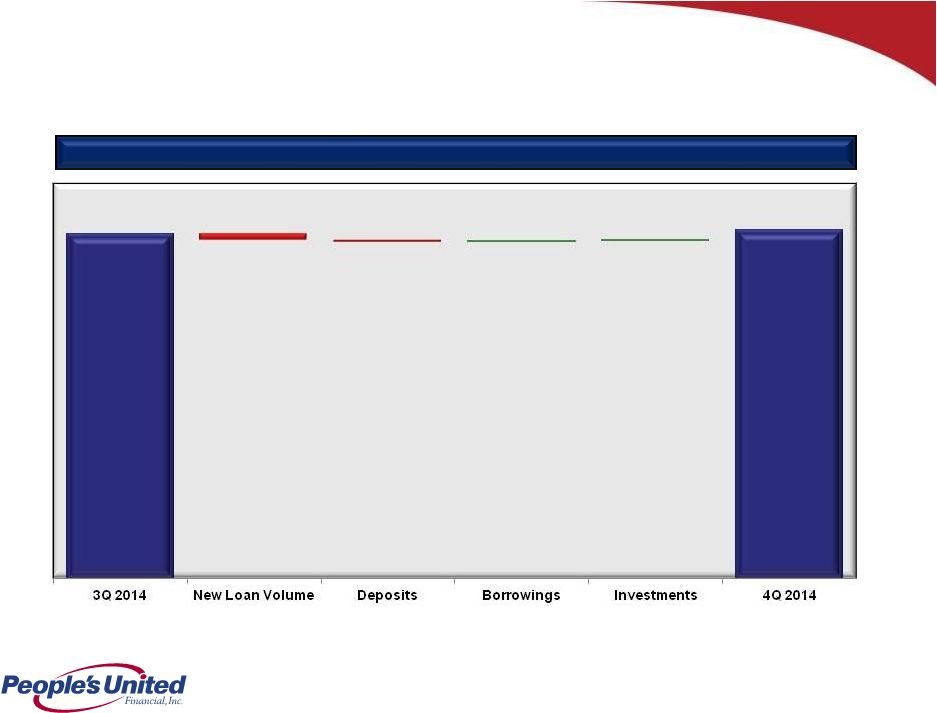
Non-Interest Income
($ in millions)
Linked Quarter Change
Linked Quarter Change
$2.5
$2.4
$84.0
$1.4
$86.8
($2.2)
($1.3) |
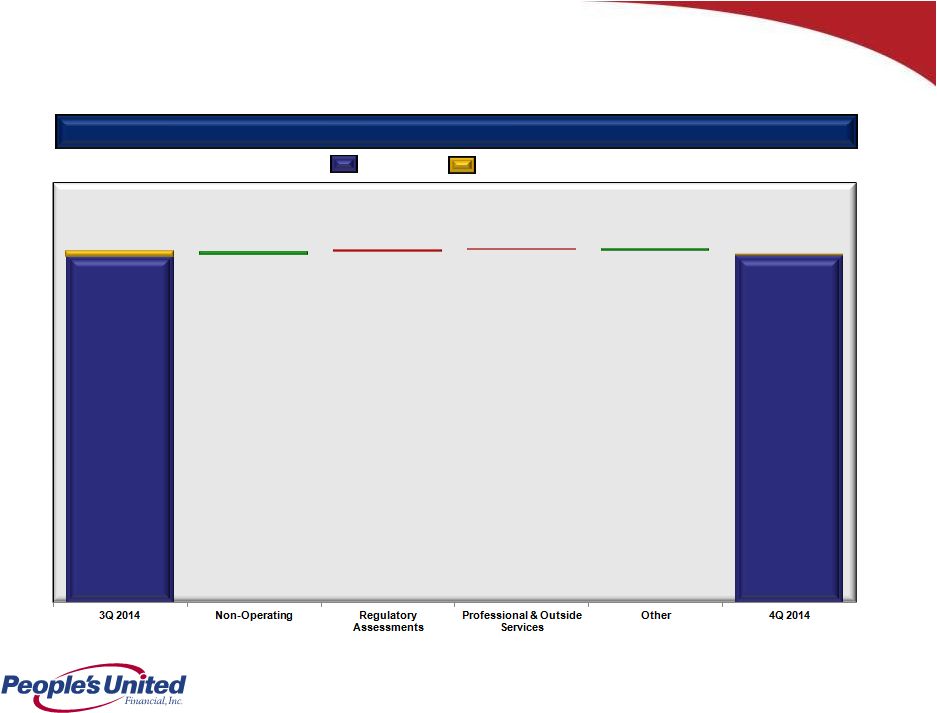 15
Non-Interest Expense
($ in millions)
Linked Quarter Change
Linked Quarter Change
($1.0)
$206.7
$0.9
$0.5
$207.1
$2.1
$208.8
$207.7
Operating
Non-Operating
$0.6
($1.5) |
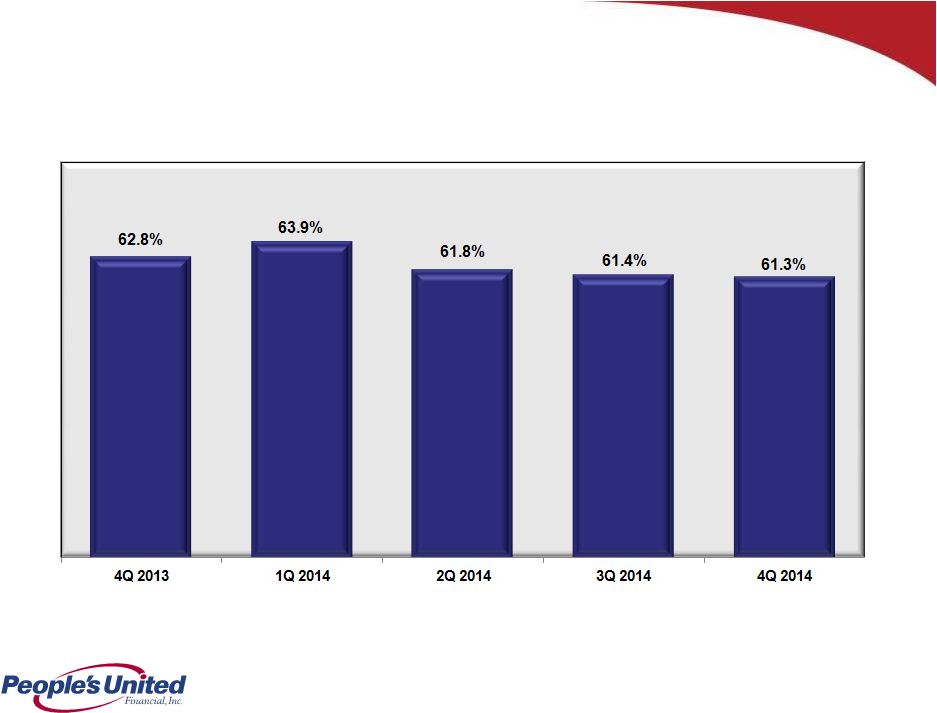 16
Efficiency Ratio |
 17
Asset Quality
NPAs
/
Loans
&
REO
(%)
1
1
Non-performing
assets
(excluding
acquired
non-performing
loans)
as
a
percentage
of
originated
loans
plus
all
REO
and
repossessed
assets;
acquired
non-performing
loans
excluded
as
risk
of
loss
has
been
considered
by
virtue
of
(i)
our
estimate
of
acquisition-date
fair
value,
(ii)
the
existence
of
an
FDIC
loss
sharing
agreement,
and/or
(iii)
allowance
for
loan
losses
established
subsequent
to
acquisition
Source:
SNL
Financial
and
Company
filings
Notes:
Top
50
Banks
represents
the
largest
50
banks
by
total
assets
in
each
respective
quarter
PBCT
Peer Group (Median)
Top 50 Banks (Median) |
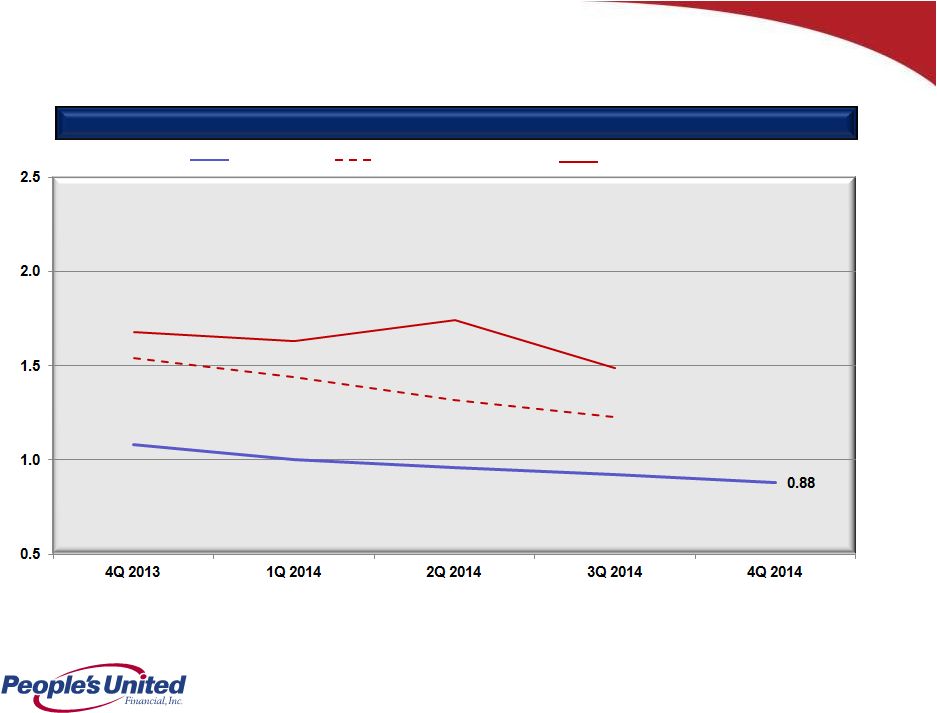
 18
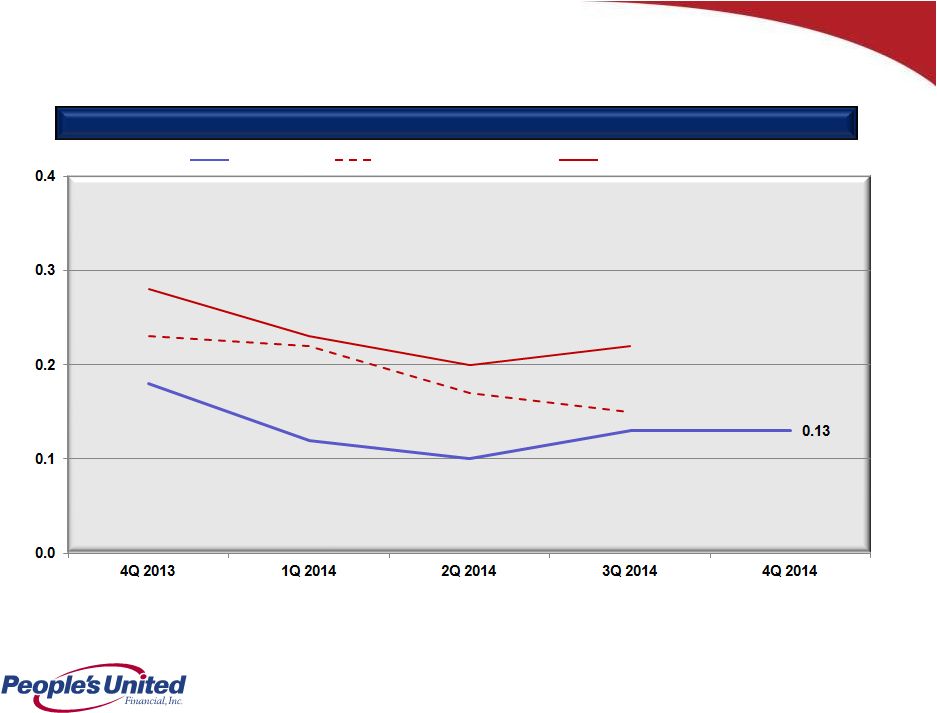
Asset Quality
Net Charge-Offs / Average Loans (%) ¹
1
Excluding
acquired
loan
charge-offs,
PBCT’s
charge-off
ratio
was
0.13%,
0.12%,
0.09%,
0.09%,
and
0.17%
in
4Q
2014,
3Q
2014,
2Q
2014,
1Q
2014,
and
4Q
2013,
respectively
Source:
SNL
Financial
and
Company
filings
Notes:
Top
50
Banks
represents
the
largest
50
banks
by
total
assets
in
each
respective
quarter
PBCT
Peer Group (Median)
Top 50 Banks (Median) |
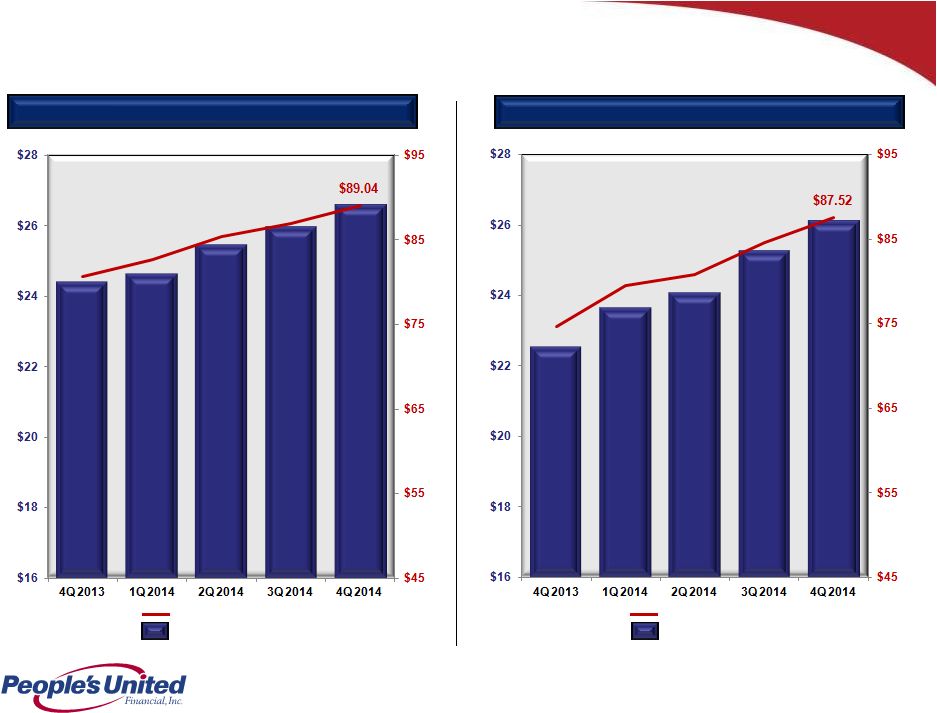 19
Growing Future Earnings Per Share
Loans
Deposits
Deposits per Share
Loans per Share
Loans ($ in billions)
Deposits ($ in billions)
|
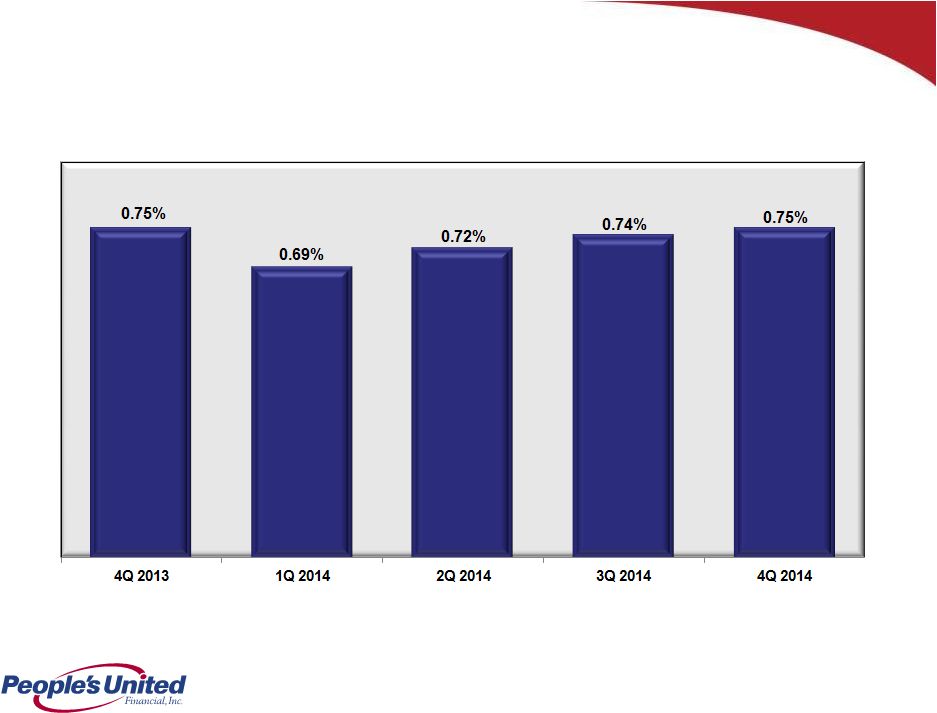 20
Operating Return on Average Assets |
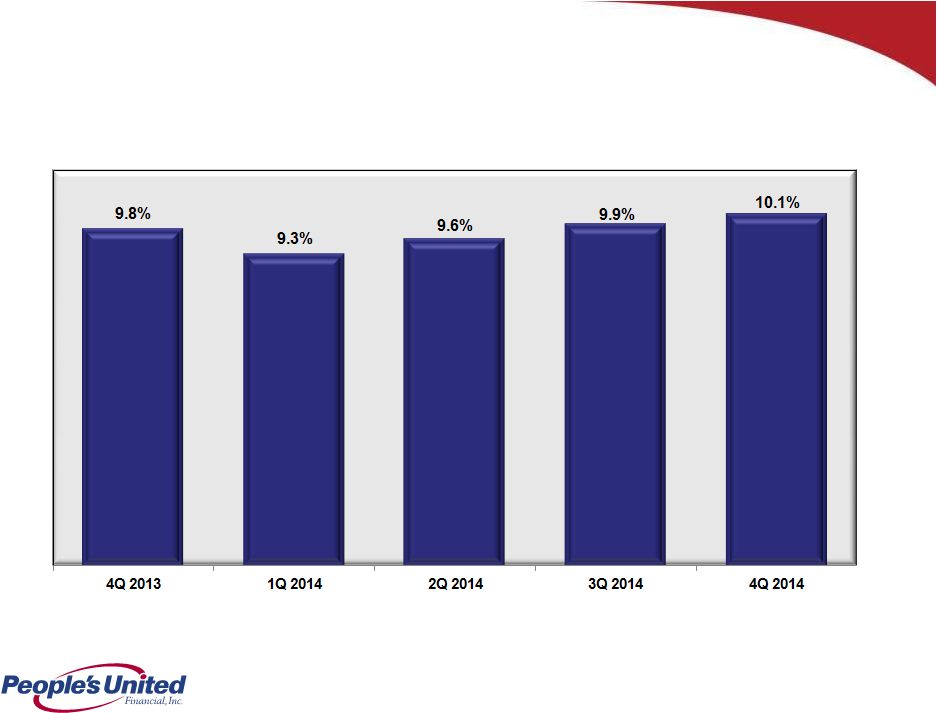 21
Operating Return on Average Tangible Equity |
 22
Capital Ratios
Notes:
1.
Leverage
(core)
Capital
represents
Tier
1
Capital
(total
stockholder’s
equity,
excluding:
(i)
after-tax
net
unrealized
gains
(losses)
on
certain
securities
classified
as
available
for
sale;
(ii)
goodwill
and
other
acquisition-related
intangibles;
and
(iii)
the
amount
recorded
in
accumulated
other
comprehensive
income
(loss)
relating
to
pension
and
other
postretirement
benefits),
divided
by
Adjusted
Total
Assets
(period
end
total
assets
less
goodwill
and
other
acquisition-related
intangibles)
2.
Tier
1
Common
represents
Common
Equity
Tier
1
Capital
(calculated
in
accordance
with
the
Basel
III
Final
Rule
issued
in
July
2013)
divided
by
Total
Risk-Weighted
Assets
3.
Tier
1
Risk-Based
Capital
represents
Tier
1
Capital
divided
by
Total
Risk-Weighted
Assets
4.
Total
Risk-Based
Capital
represents
Tier
1
Capital
plus
subordinated
notes
and
debentures,
up
to
certain
limits,
and
the
allowance
for
loan
losses,
up
to
1.25%
of
total
risk
weighted
assets,
divided
by
Total
Risk-Weighted
Assets
5.
Well
capitalized
limits
under
current
capital
rules
for
the
Bank
are:
Leverage
Ratio,
5%;
Tier
1
Risk-Based
Capital,
6%;
and
Total
Risk-Based
Capital,
10%
4Q 2013
1Q 2014
2Q 2014
3Q 2014
4Q 2014
People’s United Financial
Tang. Com. Equity/Tang. Assets
7.9%
8.0%
7.9%
7.8%
7.5%
Leverage Ratio
1, 5
8.3%
8.4%
8.3%
8.1%
7.9%
Tier 1 Common ²
10.2%
10.1%
10.0%
9.9%
9.8%
Tier 1 Risk-Based Capital
3, 5
10.2%
10.1%
10.0%
9.9%
9.8%
Total Risk-Based Capital
4, 5
11.3%
11.2%
12.5%
12.3%
12.2%
People’s United Bank
Leverage Ratio
1, 5
9.1%
9.1%
9.0%
8.8%
8.5%
Tier 1 Risk-Based Capital
3, 5
11.1%
11.0%
10.8%
10.7%
10.5%
Total Risk-Based Capital
4, 5
12.4%
12.2%
13.5%
13.3%
13.1% |
 23
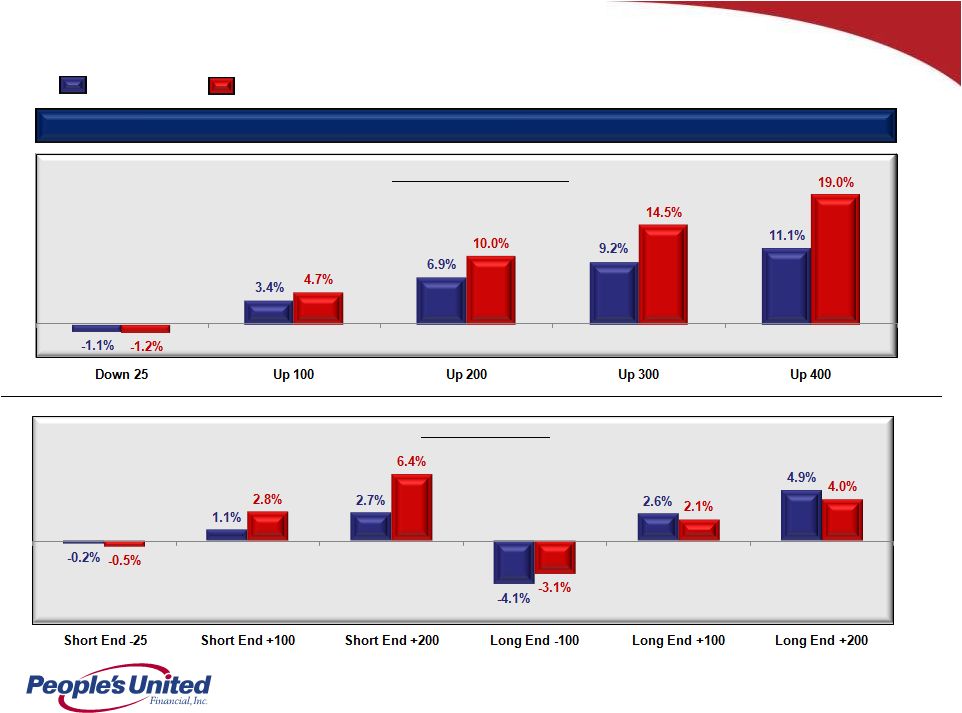
Interest Rate Risk Profile
Net Interest Income (NII) Sensitivity
1
Yield
curve
twist
pivot
point
is
18
month
point
on
yield
curve.
Short
End
defined
as
overnight
to
18
months.
Long
End
defined
as
terms
greater
than
18
months.
Immediate Parallel Shock
Est. Change in NII
Yield Curve Twist
1
Est. Change in NII
Dec. 31, 2014
Sept. 30, 2014 |
 24
Summary
Sustainable Competitive Advantages
•
Premium brand built over 170 years
•
High quality Northeast footprint characterized by wealth, density and
commercial activity
•
Strong leadership team
•
Superior asset quality
•
Focus on relationship-based banking
•
Growing
loans
and
deposits
within
footprint
–
in
two
of
the
largest
MSAs
in
the
country
(New
York
City,
#1
and
Boston,
#10)
•
Improving profitability
•
Strong capital base |
 Appendix
********
******** |
 26
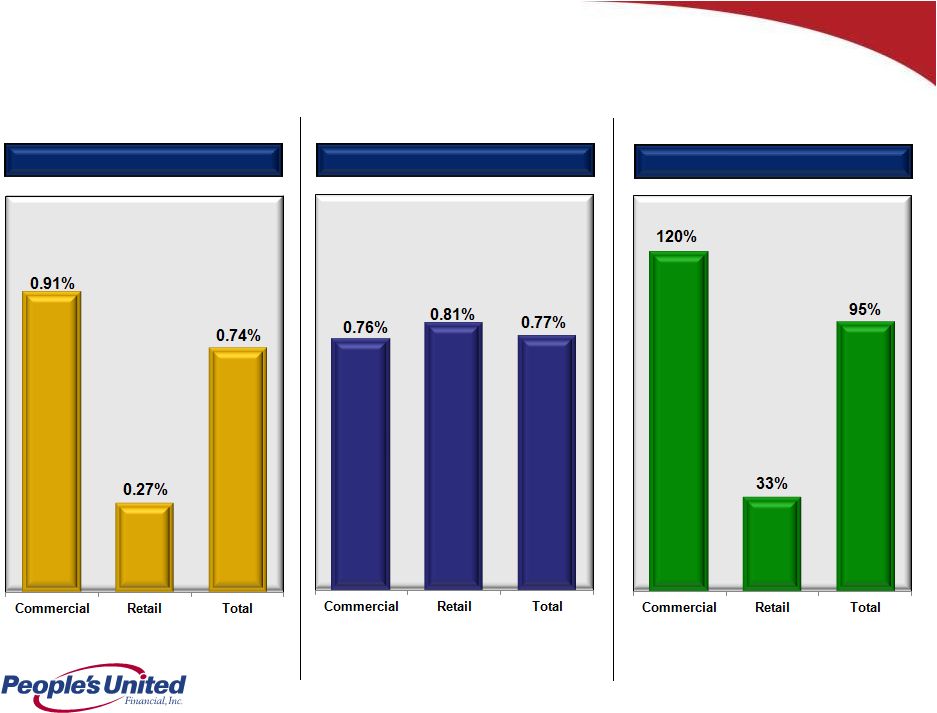
Asset Quality
Originated Portfolio Coverage Detail as of December 31, 2014
ALLLs / Loans
ALLLs / Loans
NPLs / Loans
NPLs / Loans
ALLLs / NPLs
ALLLs / NPLs
Note
–
ALLLs:
Commercial:
$169
million,
Retail:
$19
million,
Total:
$188
million |
 27
Acquired Loan Portfolio
•
Acquired loans initially recorded at fair value (inclusive of related credit mark)
without carryover of historical ALLL •
Accounting model is cash-flow based:
–
Contractual
cash
flows
(principal
&
interest)
less
expected
cash
flows
(principal
&
interest)
=
non-accretable
difference
(effectively
utilized
to
absorb
actual
portfolio
losses)
–
Expected
cash
flows
(principal
&
interest)
less
fair
value
=
accretable
yield
–
Expected
cash
flows
are
regularly
reassessed
and
compared
to
actual
cash
collections
As of 12/31/14
(in $ millions)
Carrying
Amount
a, b
Carrying Amount Component
b
NPLs
c
Non-Accretable
Difference/NPLs
Charge-offs
Incurred Since
Acquisition
d
Accretable
Yield
Non-Accretable
Difference
Danvers (7/1/11)
$554.6
$169.2
$9.4
$35.7
26%
$27.5
Smithtown (11/30/10)
313.2
181.1
89.7
54.9
163%
130.2
Others (various dates)
183.1
46.0
15.9
13.0
122%
33.6
Total
$1,050.9
$396.3
$115.0
$103.6
(a)
Initial carrying amounts of acquired portfolios are as follows: FinFed, $1.2BN;
Butler, $141MM; RiverBank, $518MM; Smithtown, $1.6BN; and Danvers, $1.9BN.
(b)
Carrying amount and related components reflect loan sale, settlement and payoff
activity which have occurred since acquisition. (c)
Represent contractual amounts; loans meet People’s United Financial’s
definition of a non-performing loan but are not subject to classification as non-accrual in
the same manner as originated loans. Rather, these loans are considered to be
accruing loans because their interest income relates to the accretable yield
recognized at the pool level and not to contractual interest payments at the loan
level. (d)
Includes approximately $9.5MM of charge-offs applied against reserves
established subsequent to acquisition. |
 28
Acquired Loan Portfolio
($ in millions)
Amortization of Original Discount on Acquired Loan Portfolio
1
Adjusted
to
include
the
discount
on
acquired
loans
(the
difference
between
the
outstanding
balance
of
the
acquired
loan
portfolio
and
the
carrying
amount
of
the
acquired
loan
portfolio)
Impact on Net Interest Margin
Impact on Earnings Per Share
4Q14 Total Accretion (All interest income on acquired loans)
17
Interest Income from Amortization of Original Discount on Acq. Loan
Portfolio 4.8
4Q14 Average Acquired Loan Portfolio
1,121
4Q14 Effective Tax Rate
33.5%
Effective Yield on Acquired Loan Portfolio
6.07%
4Q14 Earnings from Amortiz. of Original Discount on Acq. Loan Portfolio
3.2
Weighted Average Coupon on Acquired Loan Portfolio
4.35%
4Q14 Weighted Average Shares Outstanding
298.6
Incremental Yield Attributable to Amortiz. of Discount on Acq. Loan Portfolio
1.72%
4Q14 EPS Impact from Amortiz. of Discount on Acq. Loan Portfolio
$0.01
Incremental Interest Income from Amortiz. of Discount on Acq. Loan Portfolio
4.8
4Q14 Average Earning Assets
31,130
Add: Average unamortized loan discount
1
139
Adjusted 4Q14 Average Earning Assets
1
31,269
Impact on Overall Net Interest Margin (bps)
6
Net Interest Margin
3.00%
Adjusted Net Interest Margin
2.94%
Amortization of Original Discount on Acquired Loan Portfolio
Amortization of Original Discount on Acquired Loan Portfolio
|
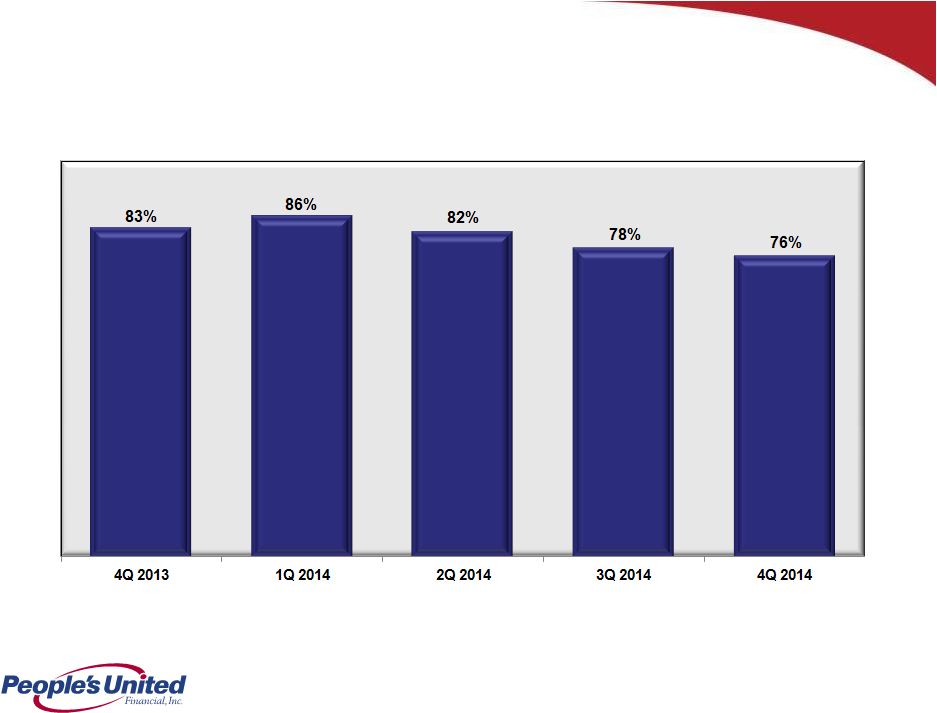 29
Operating Dividend Payout Ratio |
 30
Peer Group
Firm
Ticker
City
State
1
Associated
ASB
Green Bay
WI
2
BancorpSouth
BXS
Tupelo
MS
3
City National
CYN
Los Angeles
CA
4
Comerica
CMA
Dallas
TX
5
Commerce
CBSH
Kansas City
MO
6
Cullen/Frost
CFR
San Antonio
TX
7
East West
EWBC
Pasadena
CA
8
First Niagara
FNFG
Buffalo
NY
9
FirstMerit
FMER
Akron
OH
10
Fulton
FULT
Lancaster
PA
11
Huntington
HBAN
Columbus
OH
12
M&T
MTB
Buffalo
NY
13
New York Community
NYCB
Westbury
NY
14
Signature
SBNY
New York
NY
15
Susquehanna
SUSQ
Lititz
PA
16
Synovus
SNV
Columbus
GA
17
Valley National
VLY
Wayne
NJ
18
Webster
WBS
Waterbury
CT
19
Wintrust
WTFC
Lake Forest
IL
20
Zions
ZION
Salt Lake City
UT |
 For more information, investors may contact:
Andrew S. Hersom
(203) 338-4581
andrew.hersom@ peoples.com
NASDAQ: PBCT |