Attached files
| file | filename |
|---|---|
| 8-K - 8-K - Altisource Portfolio Solutions S.A. | a15-2620_18k.htm |
Exhibit 99.1
|
|
January 16, 2015 Investor Presentation PROPRIETARY AND CONFIDENTIAL. This document contains copyrighted, proprietary and confidential information of Altisource Solutions S.à r.l. and/or its affiliates (collectively, “Altisource”) that may constitute trade secret and/or legally privileged information. Any disclosure, copying, distribution or use of any of the information contained herein that is not expressly permitted by Altisource in writing is STRICTLY PROHIBITED. Altisource, the Altisource logo, the “REAL” family of trademarks and service marks, and certain other marks identified herein are trademarks or service marks of Altisource. |
|
|
Forward-Looking Statements, Estimates and Non-GAAP Measures This presentation contains forward-looking statements. These statements may be identified by words such as “anticipate,” “intend,” “expect,” “may,” “could,” “should,” “would,” “plan,” “estimate,” “seek,” “believe” and similar expressions. We caution that forward-looking statements are qualified to certain risks and uncertainties that could cause actual results and events to differ materially from what is contemplated by the forward-looking statements. These statements include those regarding future events, our Company performance, or estimates or projections relating to the future. Factors which could cause actual results to differ materially from these forward-looking statements may include, without limitation, general economic conditions, conditions in the markets in which Altisource is engaged, behavior of, stability of and events that may have a material impact on our customers, suppliers and/or competitors, technological developments and regulatory rules. In addition, financial risks such as currency movements, liquidity and credit risks could influence future results. The foregoing list of factors should not be construed as exhaustive. Altisource disclaims any intention or obligation to publicly update or revise any forward-looking statements, whether as a result of new information, future events or otherwise. This presentation includes estimates related to our fourth quarter 2014 and full year 2014 results. These estimates are unaudited and represent the most current information available to management. Since we have not yet completed our closing procedures for the quarter ended December 31, 2014, these estimates are preliminary, are based on management’s internal estimates and are subject to further internal review by management and approval by our Audit Committee. There can be no assurance that final fourth quarter or full year results will not differ materially from these estimated results. Accordingly, you should not place undue reliance on these estimates. During the course of closing our financial statements for the quarter ended and year ended December 31, 2014, we may identify items that would require us to make adjustments that may be material to the results described in this presentation and, as a result, these estimates are subject to the risks and uncertainties inherent in forward-looking statements described above. Altisource management utilizes certain non-GAAP measures such as Adjusted Pretax Income Attributable to Altisource, Adjusted Net Income Attributable to Altisource and Adjusted Earnings Per Share – Diluted as key metrics in evaluating its financial performance. These measures should be considered in addition to, rather than as a substitute for, income before income taxes, net income attributable to Altisource and diluted earnings per share. These non-GAAP measures are presented as supplemental information and reconciled to income attributable to Altisource or earnings per share - diluted in the Appendix. |
|
|
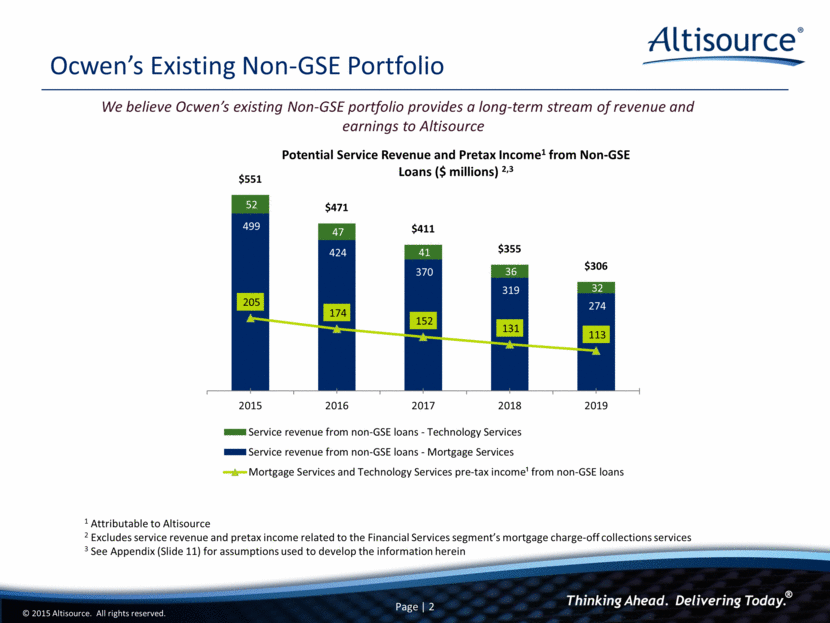
We believe Ocwen’s existing Non-GSE portfolio provides a long-term stream of revenue and earnings to Altisource Ocwen’s Existing Non-GSE Portfolio 1 Attributable to Altisource 2 Excludes service revenue and pretax income related to the Financial Services segment’s mortgage charge-off collections services 3 See Appendix (Slide 11) for assumptions used to develop the information herein 499 424 370 319 274 52 47 41 36 32 205 174 152 131 113 $551 $471 $411 $355 $306 2015 2016 2017 2018 2019 Potential Service Revenue and Pretax Income 1 from Non - GSE Loans ($ millions) 2,3 Service revenue from non-GSE loans - Technology Services Service revenue from non-GSE loans - Mortgage Services Mortgage Services and Technology Services pre-tax income¹ from non-GSE loans |
|
|
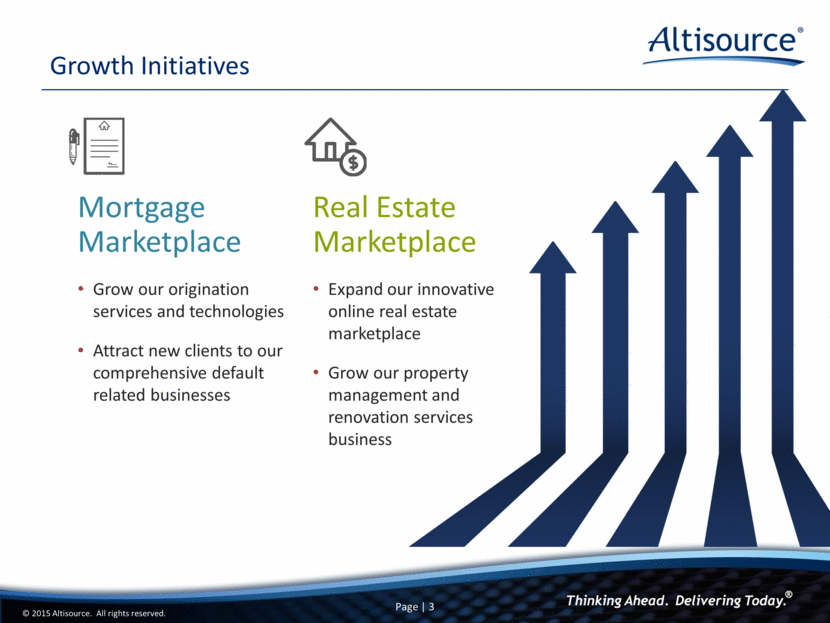
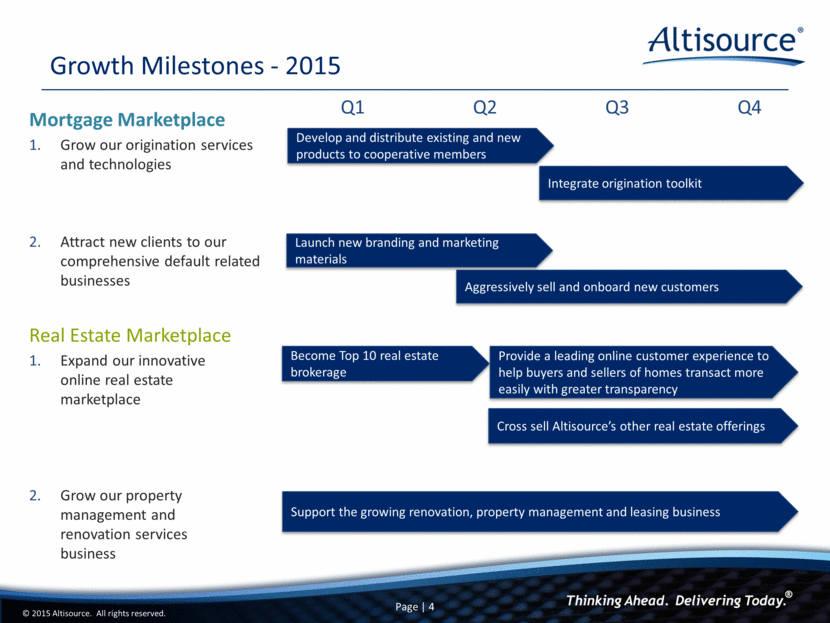
Growth Initiatives Real Estate Marketplace Expand our innovative online real estate marketplace Grow our property management and renovation services business Mortgage Marketplace Grow our origination services and technologies Attract new clients to our comprehensive default related businesses |
|
|
Growth Milestones - 2015 Real Estate Marketplace Expand our innovative online real estate marketplace Grow our property management and renovation services business Mortgage Marketplace Grow our origination services and technologies Attract new clients to our comprehensive default related businesses Q1 Q2 Q3 Q4 Aggressively sell and onboard new customers Integrate origination toolkit Develop and distribute existing and new products to cooperative members Cross sell Altisource’s other real estate offerings Provide a leading online customer experience to help buyers and sellers of homes transact more easily with greater transparency Support the growing renovation, property management and leasing business Launch new branding and marketing materials Become Top 10 real estate brokerage1. 2. 1. 2. |
|
|
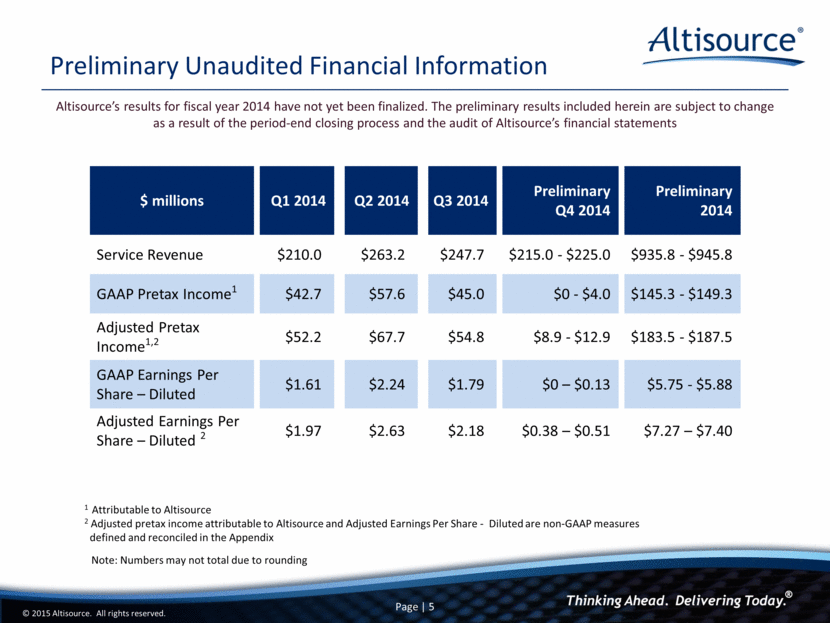
Altisource’s results for fiscal year 2014 have not yet been finalized. The preliminary results included herein are subject to change as a result of the period-end closing process and the audit of Altisource’s financial statements Preliminary Unaudited Financial Information 1 Attributable to Altisource 2 Adjusted pretax income attributable to Altisource and Adjusted Earnings Per Share - Diluted are non-GAAP measures defined and reconciled in the Appendix $ millions Q1 2014 Q2 2014 Q3 2014 Preliminary Q4 2014 Preliminary 2014 Service Revenue $210.0 $263.2 $247.7 $215.0 - $225.0 $935.8 - $945.8 GAAP Pretax Income1 $42.7 $57.6 $45.0 $0 - $4.0 $145.3 - $149.3 Adjusted Pretax Income1,2 $52.2 $67.7 $54.8 $8.9 - $12.9 $183.5 - $187.5 GAAP Earnings Per Share – Diluted $1.61 $2.24 $1.79 $0 – $0.13 $5.75 - $5.88 Adjusted Earnings Per Share – Diluted 2 $1.97 $2.63 $2.18 $0.38 – $0.51 $7.27 – $7.40 Note: Numbers may not total due to rounding |
|
|
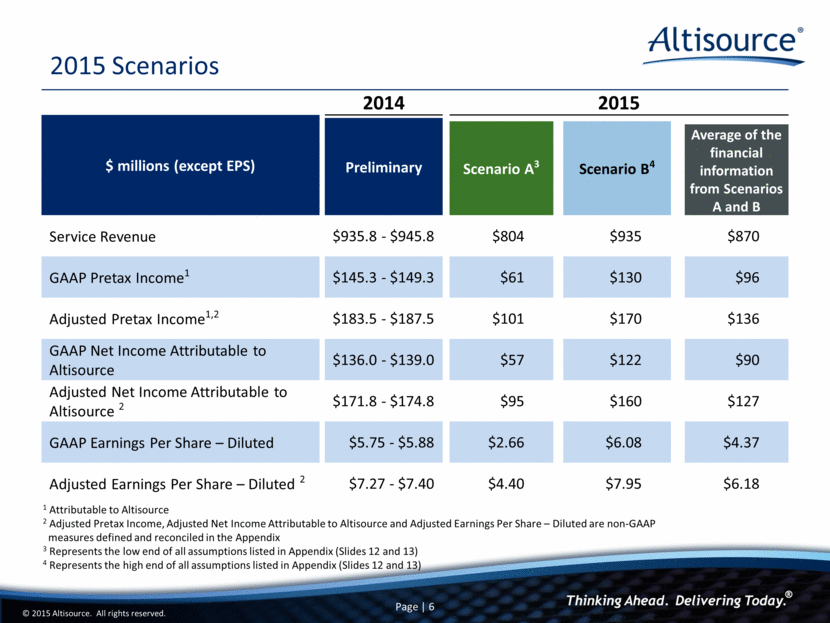
2015 Scenarios 2014 2015 $ millions (except EPS) Preliminary Scenario A3 Scenario B4 Average of the financial information from Scenarios A and B Service Revenue $935.8 - $945.8 $804 $935 $870 GAAP Pretax Income1 $145.3 - $149.3 $61 $130 $96 Adjusted Pretax Income1,2 $183.5 - $187.5 $101 $170 $136 GAAP Net Income Attributable to Altisource $136.0 - $139.0 $57 $122 $90 Adjusted Net Income Attributable to Altisource 2 $171.8 - $174.8 $95 $160 $127 GAAP Earnings Per Share – Diluted $5.75 - $5.88 $2.66 $6.08 $4.37 Adjusted Earnings Per Share – Diluted 2 $7.27 - $7.40 $4.40 $7.95 $6.18 1 Attributable to Altisource 2 Adjusted Pretax Income, Adjusted Net Income Attributable to Altisource and Adjusted Earnings Per Share – Diluted are non-GAAP measures defined and reconciled in the Appendix 3 Represents the low end of all assumptions listed in Appendix (Slides 12 and 13) 4 Represents the high end of all assumptions listed in Appendix (Slides 12 and 13) |
|
|
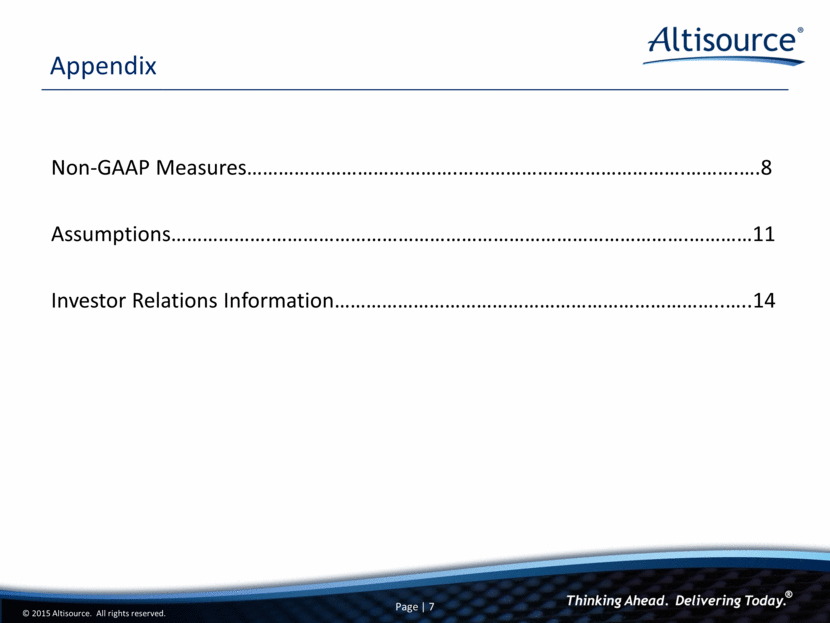
Appendix Non-GAAP Measures . . . .8 Assumptions . . 11 Investor Relations Information .. ..14 |
|
|
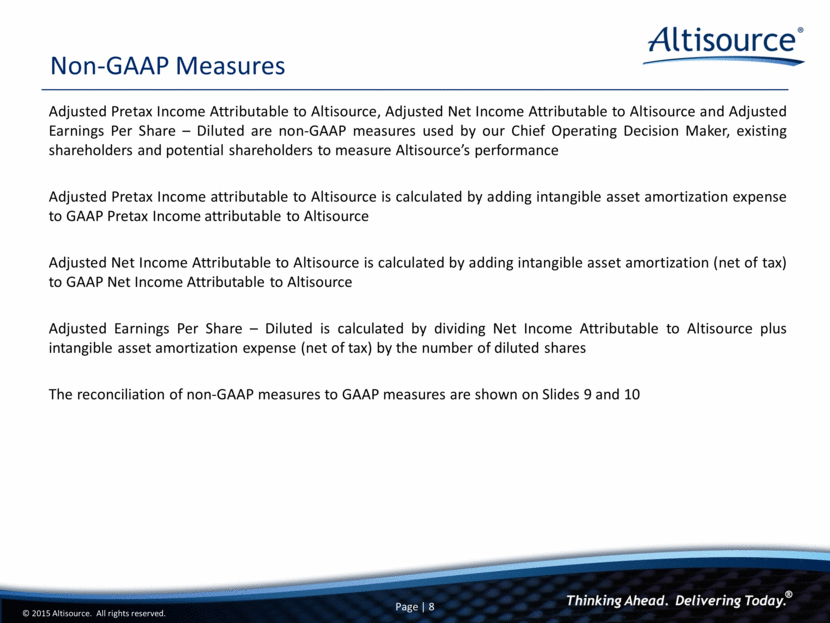
Non-GAAP Measures Adjusted Pretax Income Attributable to Altisource, Adjusted Net Income Attributable to Altisource and Adjusted Earnings Per Share – Diluted are non-GAAP measures used by our Chief Operating Decision Maker, existing shareholders and potential shareholders to measure Altisource’s performance Adjusted Pretax Income attributable to Altisource is calculated by adding intangible asset amortization expense to GAAP Pretax Income attributable to Altisource Adjusted Net Income Attributable to Altisource is calculated by adding intangible asset amortization (net of tax) to GAAP Net Income Attributable to Altisource Adjusted Earnings Per Share – Diluted is calculated by dividing Net Income Attributable to Altisource plus intangible asset amortization expense (net of tax) by the number of diluted shares The reconciliation of non-GAAP measures to GAAP measures are shown on Slides 9 and 10 |
|
|
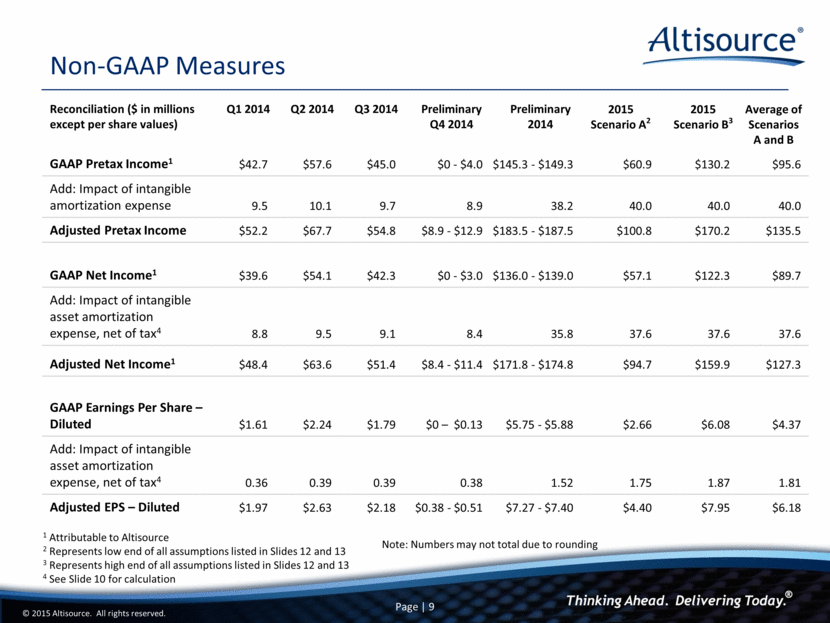
Non-GAAP Measures Reconciliation ($ in millions except per share values) Q1 2014 Q2 2014 Q3 2014 Preliminary Q4 2014 Preliminary 2014 2015 Scenario A2 2015 Scenario B3 Average of Scenarios A and B GAAP Pretax Income1 $42.7 $57.6 $45.0 $0 - $4.0 $145.3 - $149.3 $60.9 $130.2 $95.6 Add: Impact of intangible amortization expense 9.5 10.1 9.7 8.9 38.2 40.0 40.0 40.0 Adjusted Pretax Income $52.2 $67.7 $54.8 $8.9 - $12.9 $183.5 - $187.5 $100.8 $170.2 $135.5 GAAP Net Income1 $39.6 $54.1 $42.3 $0 - $3.0 $136.0 - $139.0 $57.1 $122.3 $89.7 Add: Impact of intangible asset amortization expense, net of tax4 8.8 9.5 9.1 8.4 35.8 37.6 37.6 37.6 Adjusted Net Income1 $48.4 $63.6 $51.4 $8.4 - $11.4 $171.8 - $174.8 $94.7 $159.9 $127.3 GAAP Earnings Per Share – Diluted $1.61 $2.24 $1.79 $0 – $0.13 $5.75 - $5.88 $2.66 $6.08 $4.37 Add: Impact of intangible asset amortization expense, net of tax4 0.36 0.39 0.39 0.38 1.52 1.75 1.87 1.81 Adjusted EPS – Diluted $1.97 $2.63 $2.18 $0.38 - $0.51 $7.27 - $7.40 $4.40 $7.95 $6.18 1 Attributable to Altisource 2 Represents low end of all assumptions listed in Slides 12 and 13 3 Represents high end of all assumptions listed in Slides 12 and 13 4 See Slide 10 for calculation Note: Numbers may not total due to rounding |
|
|
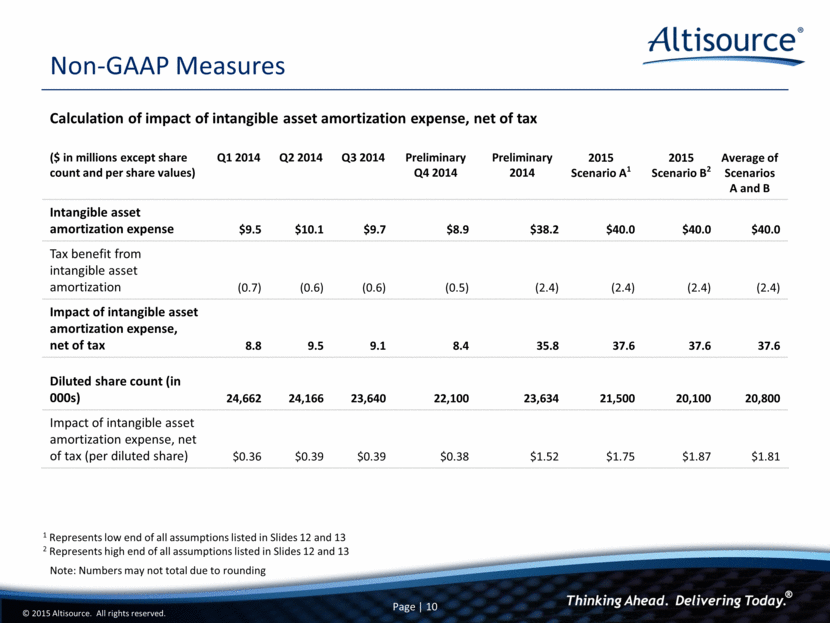
Non-GAAP Measures ($ in millions except share count and per share values) Q1 2014 Q2 2014 Q3 2014 Preliminary Q4 2014 Preliminary 2014 2015 Scenario A1 2015 Scenario B2 Average of Scenarios A and B Intangible asset amortization expense $9.5 $10.1 $9.7 $8.9 $38.2 $40.0 $40.0 $40.0 Tax benefit from intangible asset amortization (0.7) (0.6) (0.6) (0.5) (2.4) (2.4) (2.4) (2.4) Impact of intangible asset amortization expense, net of tax 8.8 9.5 9.1 8.4 35.8 37.6 37.6 37.6 Diluted share count (in 000s) 24,662 24,166 23,640 22,100 23,634 21,500 20,100 20,800 Impact of intangible asset amortization expense, net of tax (per diluted share) $0.36 $0.39 $0.39 $0.38 $1.52 $1.75 $1.87 $1.81 Calculation of impact of intangible asset amortization expense, net of tax 1 Represents low end of all assumptions listed in Slides 12 and 13 2 Represents high end of all assumptions listed in Slides 12 and 13 Note: Numbers may not total due to rounding |
|
|
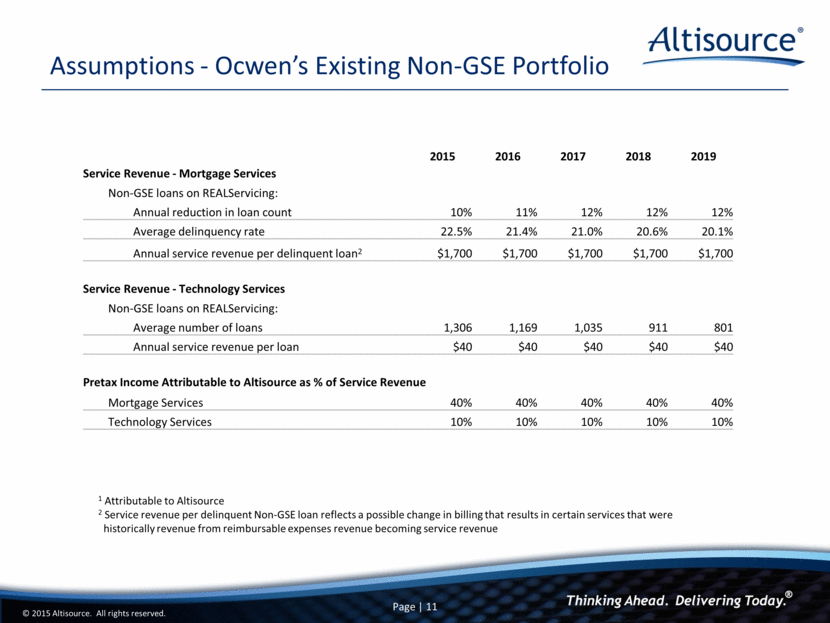
Assumptions - Ocwen’s Existing Non-GSE Portfolio 1 Attributable to Altisource 2 Service revenue per delinquent Non-GSE loan reflects a possible change in billing that results in certain services that were historically revenue from reimbursable expenses revenue becoming service revenue 2015 2016 2017 2018 2019 Service Revenue - Mortgage Services Non-GSE loans on REALServicing: Annual reduction in loan count 10% 11% 12% 12% 12% Average delinquency rate 22.5% 21.4% 21.0% 20.6% 20.1% Annual service revenue per delinquent loan2 $1,700 $1,700 $1,700 $1,700 $1,700 Service Revenue - Technology Services Non-GSE loans on REALServicing: Average number of loans 1,306 1,169 1,035 911 801 Annual service revenue per loan $40 $40 $40 $40 $40 Pretax Income Attributable to Altisource as % of Service Revenue Mortgage Services 40% 40% 40% 40% 40% Technology Services 10% 10% 10% 10% 10% |
|
|
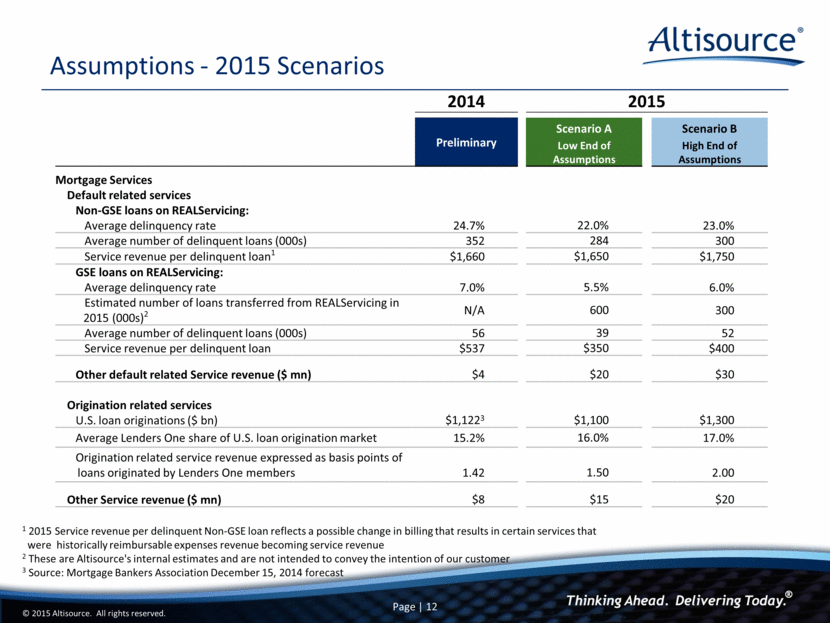
Assumptions - 2015 Scenarios 1 2015 Service revenue per delinquent Non-GSE loan reflects a possible change in billing that results in certain services that were historically reimbursable expenses revenue becoming service revenue 2 These are Altisource's internal estimates and are not intended to convey the intention of our customer 3 Source: Mortgage Bankers Association December 15, 2014 forecast 2014 2015 Preliminary Scenario A Scenario B Low End of Assumptions High End of Assumptions Mortgage Services Default related services Non-GSE loans on REALServicing: Average delinquency rate 24.7% 22.0% 23.0% Average number of delinquent loans (000s) 352 284 300 Service revenue per delinquent loan1 $1,660 $1,650 $1,750 GSE loans on REALServicing: Average delinquency rate 7.0% 5.5% 6.0% Estimated number of loans transferred from REALServicing in 2015 (000s)2 N/A 600 300 Average number of delinquent loans (000s) 56 39 52 Service revenue per delinquent loan $537 $350 $400 Other default related Service revenue ($ mn) $4 $20 $30 Origination related services U.S. loan originations ($ bn) $1,1223 $1,100 $1,300 Average Lenders One share of U.S. loan origination market 15.2% 16.0% 17.0% Origination related service revenue expressed as basis points of loans originated by Lenders One members 1.42 1.50 2.00 Other Service revenue ($ mn) $8 $15 $20 |
|
|
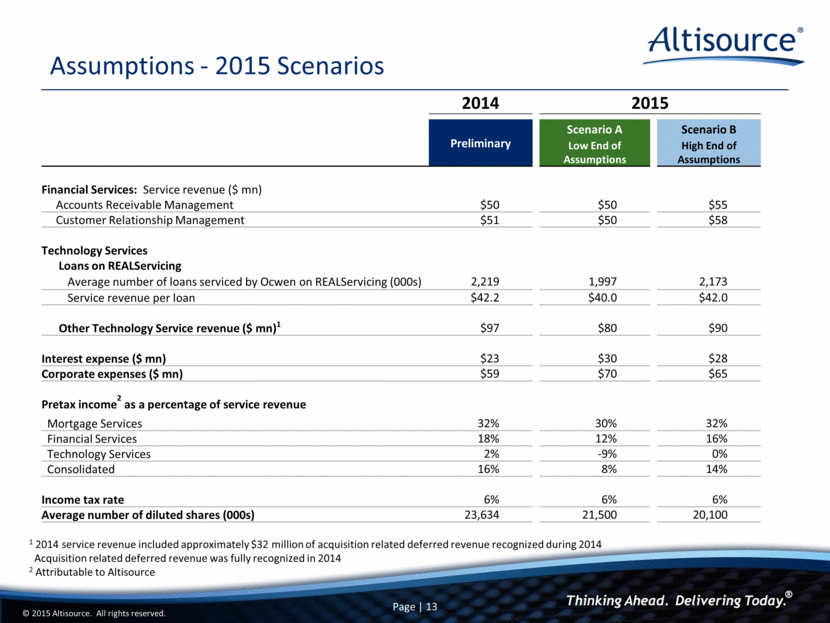
Assumptions - 2015 Scenarios 1 2014 service revenue included approximately $32 million of acquisition related deferred revenue recognized during 2014 Acquisition related deferred revenue was fully recognized in 2014 2 Attributable to Altisource 2014 2015 Preliminary Scenario A Scenario B Low End of Assumptions High End of Assumptions Financial Services: Service revenue ($ mn) Accounts Receivable Management $50 $50 $55 Customer Relationship Management $51 $50 $58 Technology Services Loans on REALServicing Average number of loans serviced by Ocwen on REALServicing (000s) 2,219 1,997 2,173 Service revenue per loan $42.2 $40.0 $42.0 Other Technology Service revenue ($ mn)1 $97 $80 $90 Interest expense ($ mn) $23 $30 $28 Corporate expenses ($ mn) $59 $70 $65 Pretax income2 as a percentage of service revenue Mortgage Services 32% 30% 32% Financial Services 18% 12% 16% Technology Services 2% -9% 0% Consolidated 16% 8% 14% Income tax rate 6% 6% 6% Average number of diluted shares (000s) 23,634 21,500 20,100 |
|
|
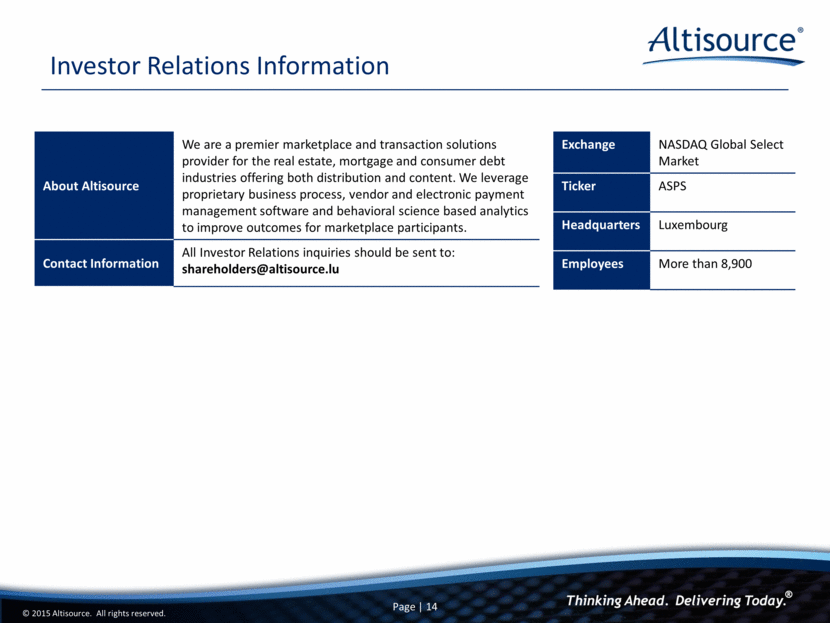
About Altisource We are a premier marketplace and transaction solutions provider for the real estate, mortgage and consumer debt industries offering both distribution and content. We leverage proprietary business process, vendor and electronic payment management software and behavioral science based analytics to improve outcomes for marketplace participants. Contact Information All Investor Relations inquiries should be sent to: shareholders@altisource.lu Exchange NASDAQ Global Select Market Ticker ASPS Headquarters Luxembourg Employees More than 8,900 Investor Relations Information |

