Attached files
| file | filename |
|---|---|
| EX-23.1 - EX-23.1 - Northern Power Systems Corp. | d826615dex231.htm |
Table of Contents
As filed with the Securities and Exchange Commission on January 14, 2015.
Registration No. 333-201372
UNITED STATES
SECURITIES AND EXCHANGE COMMISSION
Washington, D.C. 20549
Amendment No. 1
to
FORM S-1
REGISTRATION STATEMENT
Under
The Securities Act of 1933
NORTHERN POWER SYSTEMS CORP.
(Exact name of registrant as specified in its charter)
| British Columbia, Canada | 3511 | 98-1181717 | ||
| (State or other jurisdiction of incorporation or organization) |
(Primary Standard Industrial Classification Code Number) |
(I.R.S. Employer Identification Number) |
Northern Power Systems Corp.
29 Pitman Road
Barre, Vermont 05641
(802) 461-2955
(Address, including zip code, and telephone number, including area code, of registrant’s principal executive offices)
Troy C. Patton
President and Chief Executive Officer
Northern Power Systems Corp.
29 Pitman Road
Barre, Vermont 05641
(802) 461-2955
(Name, address, including zip code, and telephone number, including area code, of agent for service)
Copies to:
| Kenneth J. Gordon, Esq. | Elliot J. Mark, Esq. | Theodore J. Ghorra, Esq. | ||
| Goodwin Procter LLP | Vice President and General Counsel | Nixon Peabody LLP | ||
| Exchange Place | Northern Power Systems Corp. | 437 Madison Avenue | ||
| 53 State Street | 29 Pitman Road | New York, New York 10022 | ||
| Boston, Massachusetts 02109 | Barre, Vermont 05641 | (212) 940-3072 | ||
| (617) 570-1000 | (802) 461-2955 |
Approximate date of commencement of proposed sale to public: as soon as practicable after this Registration Statement is declared effective.
If any of the securities being registered on this form are to be offered on a delayed or continuous basis pursuant to Rule 415 under the Securities Act of 1933, check the following box. ¨
If this Form is filed to register additional securities for an offering pursuant to Rule 462(b) under the Securities Act, check the following box and list the Securities Act registration statement number of the earlier effective registration statement for the same offering. ¨
If this Form is a post-effective amendment filed pursuant to Rule 462(c) under the Securities Act, check the following box and list the Securities Act registration statement number of the earlier registration statement for the same offering. ¨
If this Form is a post-effective amendment filed pursuant to Rule 462(d) under the Securities Act, check the following box and list the Securities Act registration statement number of the earlier registration statement for the same offering. ¨
Indicate by check mark whether the registrant is a large accelerated filer, an accelerated filer, a non-accelerated filer, or a smaller reporting company. See the definitions of “large accelerated filer,” “accelerated filer” and “smaller reporting company” in Rule 12b-2 of the Exchange Act. (Check one):
| Large Accelerated Filer | ¨ | Accelerated Filer | ¨ | |||||
| Non-Accelerated Filer | ¨ | (Do not check if a smaller reporting company) | Smaller Reporting Company | x |
The registrant hereby amends this registration statement on such date or dates as may be necessary to delay its effective date until the registrant shall file a further amendment, which specifically states that this registration statement shall thereafter become effective in accordance with Section 8(a) of the Securities Act of 1933, as amended, or until the registration statement shall become effective on such date as the Securities and Exchange Commission, acting pursuant to said Section 8(a), may determine.
Table of Contents
The information in this preliminary prospectus is not complete and may be changed. These securities may not be sold until the registration statement filed with the Securities and Exchange Commission is effective. This preliminary prospectus is not an offer to sell nor does it seek an offer to buy these securities in any jurisdiction where the offer or sale is not permitted.
Subject to Completion, dated January 14, 2015
PROSPECTUS
Shares
NORTHERN POWER SYSTEMS CORP.
Common Shares
This is our initial U.S. public offering. We are offering of our common shares to be sold in this offering.
Our common shares are listed on the Toronto Stock Exchange, or TSX, under the symbol “NPS.” The last reported sale price of our common shares on TSX on , 2015 was CDN$ per share (or $ per share, based on an exchange rate of CDN$ per $1.00). We have applied to list our common shares on the NASDAQ Capital Market under the symbol “NPS.”
We are an “emerging growth company” as defined in Section 2(a)(19) of the U.S. Securities Act of 1933, as amended, and, as such, are allowed to provide in this prospectus more limited disclosures than an issuer that would not so qualify. In addition, for as long as we remain an emerging growth company, we will qualify for certain limited exceptions from investor protection laws such as the Sarbanes-Oxley Act of 2002 and the Investor Protection and Securities Reform Act of 2010. Please read “Risk Factors” and “Prospectus Summary — Emerging Growth Company under the JOBS Act.”
Investing in our common shares involves significant risks. See “Risk Factors” beginning on page 12 to read about factors you should carefully consider before buying our common shares.
| Per Share | Total | |||||||
| Offering Price |
$ | $ | ||||||
| Underwriting Discounts and Commissions(1) |
$ | $ | ||||||
| Proceeds before expenses |
$ | $ | ||||||
| (1) | We refer you to “Underwriting” beginning on page 125 of this prospectus for additional information regarding total underwriter compensation. |
We have granted the underwriters an option for a period of 30 days to purchase up to additional common shares, on the same terms and conditions set forth above.
Neither the Securities and Exchange Commission nor any other regulatory body has approved or disapproved of these securities or passed upon the accuracy or adequacy of this prospectus. Any representation to the contrary is a criminal offense.
Delivery of the shares against payment is expected to be made on or about , 2015. We anticipate delivery of our common shares will be made through the facilities of the Depository Trust Company, subject to customary closing conditions.
Needham & Company
| Craig-Hallum Capital Group | Northland Capital Markets | |
Prospectus dated , 2015
Table of Contents
| Page | ||||
| 1 | ||||
| 12 | ||||
| 34 | ||||
| 35 | ||||
| 35 | ||||
| 36 | ||||
| 37 | ||||
| 39 | ||||
| Management’s Discussion and Analysis of Financial Condition and Results of Operations |
41 | |||
| 70 | ||||
| 80 | ||||
| 92 | ||||
| 98 | ||||
| 104 | ||||
| 107 | ||||
| 109 | ||||
| 112 | ||||
| 116 | ||||
| 118 | ||||
| 120 | ||||
| 125 | ||||
| 130 | ||||
| 130 | ||||
| 130 | ||||
| F-1 | ||||
Table of Contents
This summary highlights selected information contained in greater detail elsewhere in this prospectus. This summary does not contain all of the information you should consider before investing in our common shares. You should read this entire prospectus carefully, especially the information set forth under “Risk Factors” and “Management’s Discussion and Analysis of Financial Condition and Results of Operations” and our consolidated financial statements and the related notes appearing at the end of this prospectus, before making an investment decision. Unless the context otherwise requires, we use the terms “we,” “us,” “the company” and “our” in this prospectus to refer to Northern Power Systems Corp. and its subsidiaries.
Company Overview
We are a growing provider of advanced renewable power creation and power conversion technology for the energy sector. We design, manufacture and service next-generation Permanent Magnet Direct-Drive, or PMDD, wind turbines for the distributed wind market, and we currently license our utility-class wind turbine platform, which uses the same PMDD technology as our distributed turbines, to large manufacturers on a global basis. We also provide technology development services for a wide variety of energy applications. With our predecessor companies dating back to 1974 and our new turbine development since 1977, we have decades of experience in developing advanced, innovative wind turbines, as well as technology for power conversion and integration with other energy applications. Since 2008, we have invested more than $130 million in developing and commercializing our wind turbine platforms.
Our PMDD wind turbine technology is based on a simplified architecture that utilizes a unique combination of a permanent magnet generator and direct-drive design. The permanent magnet generator provides higher efficiency and higher energy capture than units that utilize a traditional gearbox design. Importantly, the direct-drive design of our turbine utilizes significantly fewer moving parts than traditional geared turbines, which increases reliability due to reduced maintenance and downtime costs.
The substantial majority of our current sales are in the small wind subset of the distributed wind market, which commonly consists of turbines with rated capacities of 500 kW output or smaller. Based on the number of turbines that we have sold and installed to date, we consider ourselves a leader in the U.S., U.K. and Italy in the larger energy output sub-segment of this market, which comprises turbines ranging in size from 50 kW to 100 kW. Since the introduction of our second generation 60 kW and 100 kW PMDD wind turbines in late 2008, we have shipped over 400 of these turbines and as of September 30, 2014, we have orders approximating $33 million in backlog for our second and third generation turbines. To date, these shipped units have run for over six million hours in the aggregate. Our distributed wind customers include financial investors and project developers which deploy our turbines to provide power for farms, remote villages, schools, small businesses, and U.S. military installations.
We are advancing our efforts to sell our utility-class wind turbines. We have developed a 2 MW turbine platform with three wind-speed regime variants based upon our PMDD technology, of which the 2.3 MW variant is certified to International Electrotechnical Commission standard 61400-1 by Det Norske Veritas, a globally recognized certification firm. In 2013, we launched a strategy of partnering with large-scale manufacturers in developing regions, starting with a multi-billion dollar (in revenue) industrial equipment manufacturer based in Brazil (WEG Equipamentos Elétricos S.A., or WEG). We have licensed our technology to WEG exclusively for Brazil, but retain our right to sell Northern Power-branded utility-class turbines produced by WEG on a rest-of-world basis. WEG has executed a backlog of orders comprising over 300 MW of turbine installations for the sale of turbines built using our design, eleven of which have been installed to date in Brazil. We are also seeking a limited number of similar partnership structures in other regional geographies, through which we intend that other large-scale manufacturers will produce and sell turbines for their domestic market and make available to us
1
Table of Contents
the supply of turbines to expand our regional ability to sell such turbines. We believe this approach will allow us to participate in the utility-class wind turbine market without a significant investment in capital equipment that would otherwise be required.
Our direct sales strategy for utility-class wind turbines is directed primarily towards North America and focuses on underserved, smaller scale wind projects such as those generating 50 MW or less. As part of our market entry plan, we intend to be a minority investor in the development of a limited number of these wind power projects to ensure initial sales of our utility-class turbines. After a number of these installations, we plan to participate in the same utility wind marketplace solely by selling the turbines without providing any investment. We also intend to expand our sales and marketing capabilities to execute this strategy.
In addition to wind turbine development, we provide technology development services to customers to develop products and technology for a variety of complex energy applications, including energy storage, microgrids, and grid stabilization. While the customer owns the developed technology for a limited field of use, we typically maintain a license for all other applications and all other markets. While we do not expect material revenue from our development services, these services fund the expansion of our intellectual property portfolio. Through providing certain of such services, we have identified a series of non-wind market applications for our FlexPhase power converters. As a result, we intend to invest in expanding our sales of this product offering.
For the nine months ended September 30, 2014 and 2013 and the year ended December 31, 2013, we generated $42.6 million, $11.6 million, and $20.6 million in revenue, respectively. For the nine months ended September 30, 2014 and 2013 and the year ended December 31, 2013 we incurred net losses of $5.5 million, $9.3 million and $14.1 million, respectively.
Industry Overview and Market Opportunity
Wind power has been one of the fastest growing sources of electricity generation globally over the past decade. According to the International Energy Agency, in its 2013 Annual Report, wind power currently provides nearly 4% of global electricity demand with installations in over 100 countries. In the same report, the IEA observed that wind power deployment currently exceeds 318 gigawatts, or GW, of installed capacity globally, which the Global Wind Energy Council, or GWEC, in its Global Wind Statistics 2013 report notes has increased more than 250% since 2008. GWEC further reports in its Global Wind Report-Annual Market Update 2013 that the new installations added approximately 12.5% to the installed wind base in 2013 and have averaged approximately 21% per year over the last ten years. In its latest Technology Roadmap: Wind Energy (2013 edition), the IEA set targets for wind power to satisfy 15-18% of worldwide electrical power demand by 2050, up previously from 12%.
The top ten wind power producing countries accounted for approximately 85% of year-end global capacity as of December 31, 2013, but at least 85 countries had commercial wind activity that year, with at least 71 having more than 10 MW of reported capacity, and 24 had more than 1 GW in operation. The Renewable Energy Policy Network reports that annual growth rates of cumulative wind power capacity have averaged 21.4% since the end of 2008, and global capacity has increased eightfold over the past decade. The annual worldwide small wind market is forecast to grow from 144.2 MW in 2014 to 668.1 MW in 2023, representing projected cumulative revenue from installations of $647.7 million and $2.6 billion, respectively, according to Navigant Research’s Global Distributed Generation Deployment Forecast (3Q 2014). Our key target wind power markets include the E.U., the U.S., and Brazil.
The growth in the industry is largely attributable to increasing cost competitiveness with other power generation technologies and growing public and governmental support for renewable energy driven by concerns regarding the security of conventional fossil fuel energy supply, as well as the environmental benefits of wind power.
2
Table of Contents
National targets for wind and other renewables are also driven by each individual country’s efforts to produce energy domestically, increase employment, build domestic industries, and replace other forms of power generation, such as coal and nuclear.
The majority of this wind power expansion is currently installations of utility-class wind turbine farms. These farms generate electricity to feed into the electrical grid, supplying a utility company with energy that can be sold to customer. The utilities that purchase such power still have additional costs to deliver the electricity to the source of use. As such, utility-class power costs are measured as only costs to generate power. Based on our current strategy of pursuing direct sales of utility-class turbines into underserved, smaller scale wind projects and pursuing other sales of these turbines through strategic partners such as WEG, we estimate that our current target addressable market in utility wind is approximately 30% of the global onshore utility wind market.
Wind power also is expanding in the distributed wind market. This market is made up of turbines connected on the customer side of the power meter, designed to meet onsite electrical loads as well as to feed into distribution or microgrids, thereby reducing energy costs at the site of use. The comparable cost of distributed wind energy is the cost for landed power, which is the cost for other forms of energy generation to be produced as well as delivered to the location of consumption.
In the distributed wind markets in which we currently sell our products, a variety of incentives have promoted the introduction of wind power while greatly reducing the payback period for investments in wind turbines for property owners and businesses. Such incentives take the form of feed-in-tariffs, tax breaks or cash incentives to purchasers of wind power systems. As a result, the effective price or cost to the user is greatly reduced making the return on investment much more attractive and lowering the time period it takes to generate enough energy to recover the total cost of the system. While many customers are attracted to renewable energy for its positive environmental attributes, the ultimate decision often centers on a cost/benefit and investment return analysis. Governmental and private (utility-sponsored) incentives play an important role by lowering the effective cost to the end user of a wind power system, thereby making a purchase more attractive.
Our Products and Services
We have three operating business lines, which include product sales and service, technology licensing, and technology development, in addition to a shared services segment. In our product sales and service line, we offer wind turbines serving global distributed wind and utility wind markets featuring our next generation Permanent Magnet Direct-Drive technology coupled with full power conversion and 24/7 fleet monitoring. We also sell power converters based on our proprietary FlexPhase technology for complex energy applications ranging from 500 kW to over 5 MW. Our technology licensing line is focused on licensing certain of our wind turbine and power converter technology to global manufacturers for specific geographies and applications. We have licensed certain elements of our wind turbine technology to two large global manufacturers. Our technology development business line utilizes our experienced team of 39 engineers to provide technology development services that are targeted to the global wind power market as well as other advanced energy markets. Applications of our technology development services have included energy storage, microgrids, and grid stabilization and have been delivered to a wide range of industries.
Our Strategy
We are focused on being a leader in the commercialization of distributed-class wind turbines, expanding our presence in the utility wind markets, and strategically leveraging our proprietary technology by expanding our product offerings in power creation and power conversion. Key elements of our strategy include:
| • | Continuing to drive sales growth in distributed wind, by improving the economics of our product offerings for our customers and deepening our relationships with our existing customers as well as adding new customers. |
3
Table of Contents
| • | In addition to selling utility-class turbines through our strategic partners based on our licensed technology and designs, directly selling utility-class turbines in underserved, smaller scale wind projects where we can take advantage of our industry relationships. |
| • | Continuing to build upon our intellectual property portfolio as we pursue further wind turbine enhancements and create new designs. |
| • | Continuing to customize our proprietary power conversion technology for developing applications and market our products to pursue revenue opportunities outside of use in wind turbines. |
Our Competitive Strengths
We believe that the following competitive strengths enable us to compete effectively in the wind power technology and renewable energy industries and to capitalize on the growth of those industries:
| • | A broad portfolio of intellectual property including our highly efficient, but low cost, permanent magnet generator, our modular turbine design, our full power converter, and our voltage stabilization capabilities as well as our experienced team comprised of 39 engineers. |
| • | Wind turbines designed for high availability, high energy output and low energy production cost per kWh in a wide range of wind conditions throughout the world. |
| • | Since the introduction of our second generation 60 kW and 100 kW PMDD wind turbines in late 2008, shipment of over 400 of these turbines, which have run for over six million hours in the aggregate and have averaged 98-99% availability for grid-connected turbines. |
| • | Deep customer relationships with a number of our customers, each of which has extensive experience developing wind and other renewable energy projects in Europe. |
| • | A validated strategy of entering into geographic partnerships that expand our participation in the global utility-class wind turbine market. |
| • | An integrated development and manufacturing capability at our facility in Barre, Vermont, which has approximately $100 million in annual revenue capacity at current prices, has strong production capabilities and rigorous system-driven manufacturing processes and quality control. |
| • | An experienced management team that has successfully expanded our operations and increased our capacity and business through organic growth. |
Emerging Growth Company under the JOBS Act
As a company with less than $1.0 billion in revenues during our last fiscal year, we qualify as an “emerging growth company” under the Jumpstart Our Business Startups Act of 2012, or the JOBS Act. An emerging growth company may take advantage of reduced reporting requirements and is relieved of certain other significant requirements that are otherwise generally applicable to public companies. As an emerging growth company:
| • | we may present only two years of audited financial statements and only two years of related Management’s Discussion and Analysis of Financial Condition and Results of Operations; |
| • | we are exempt from the requirement to obtain an attestation and report from our auditors on whether we maintained effective internal control over financial reporting under the Sarbanes-Oxley Act of 2002; |
| • | we are permitted to provide less extensive disclosure about our executive compensation arrangements; and |
| • | we are not required to give our shareholders non-binding advisory votes on executive compensation or golden parachute arrangements. |
4
Table of Contents
We may take advantage of these provisions for up to five years if we continue to be an emerging growth company. We would cease to be an emerging growth company if we have more than $1.0 billion in annual revenues, have more than $700 million in market value of our shares held by non-affiliates or issue more than $1.0 billion of non-convertible debt over a three-year period. We may choose to take advantage of some but not all of these reduced burdens. We have elected to provide two years of audited financial statements and two years of related Management’s Discussion and Analysis of Financial Condition and Results of Operations. We have also availed ourselves of the exemption from disclosing certain executive compensation information in this prospectus pursuant to Title 1, Section 102 of the JOBS Act. Additionally, we have elected to take advantage of the extended transition period provided in Section 7(a)(2)(B) of the U.S. Securities Act, as amended, or the Securities Act, for complying with new or revised accounting standards that have different effective dates for public and private companies until the earlier of the date we (i) are no longer an emerging growth company or (ii) affirmatively and irrevocably opt out of the extended transition period provided in Section 7(a)(2)(B) of the Securities Act. See “Management’s Discussion and Analysis of Financial Condition and Results of Operations — Summary of Critical Accounting Policies” for a further discussion of this exemption.
Risks Affecting Our Business
Our business, financial condition, results of operations and prospects are subject to numerous risks and uncertainties. These risks include, but are not limited to, the following:
| • | We have incurred significant operating losses since inception and may not be able to achieve, or subsequently maintain, profitability. |
| • | The distributed wind market is in the early stages of development and its future is uncertain. If the market is not as large as we expect or we are unable to compete effectively in the distributed wind market, our business and operating results could be harmed. |
| • | We are in the early stages of product and service commercialization, and as such, our products and services may not generate sufficient revenue or profitability. |
| • | Our sales cycles are complex and lengthy and the timing of our distributed wind installations are subject to seasonal variations, each of which may impact operating results from quarter to quarter and make results difficult to predict. |
| • | We maintain a sizable backlog and the timing of our conversion of revenue out of backlog is uncertain. |
| • | Because we depend on a limited number of single source suppliers for certain components, third-party business and relationship interruptions could harm our operations. |
| • | If we do not successfully execute on our utility-class sales commercialization strategy, we may be unable to effectively grow this business. |
| • | Strategic partnerships are essential to our business growth, particularly in the utility wind market, and the inability to secure these relationships could adversely impact revenue and operations. |
| • | If we fail to expand effectively in international markets, our revenue and business could be harmed. |
| • | Problems with quality or performance in our products or products manufactured by our licensees could have a negative impact on our relationships with customers and our reputation and cause reduced market demand for our products. |
| • | Our customers’ inability to obtain financing to make purchases from us or maintain their businesses could harm our business, and negatively impact revenue, results of operations, and cash flow. |
| • | We may not be able to secure additional financing in a timely manner, on favorable terms, or at all, to meet our future capital needs, which could impair our ability to execute on our business plan. |
| • | We are an “emerging growth company,” and the reduced reporting requirements applicable to emerging growth companies may make our common shares less attractive to investors. |
5
Table of Contents
| • | We face intense competition and, if we are unable to compete effectively, our business, financial condition and results of operations could be harmed. |
| • | New or existing technologies could gain wide adoption and supplant our services and features and harm our revenue and financial results. |
For a complete description of the risks and uncertainties affecting us, please carefully review the Risk Factors set forth in in this registration statement under the heading “Risk Factors” beginning on page 12.
Company Information
We were originally incorporated in Delaware on August 12, 2008 as Wind Power Holdings, Inc., or WPHI.
On August 15, 2008, WPHI’s wholly-owned subsidiary CB Wind Acquisition, Inc., or CBWA, acquired the wind turbine business of Distributed Energy Systems Corp., which was operating under the name Northern Power Systems. Northern Power Systems had commenced business in 1974 as North Wind Power Company in Warren, Vermont, but entered into bankruptcy proceedings along with its parent company Distributed Energy Systems in 2008. Following the acquisition, CBWA changed its name to Northern Power Systems, Inc. Northern Power Systems, Inc. also has two wholly-owned subsidiaries, Northern Power Systems AG, a Switzerland corporation, and Northern Power Systems S.r.l., an Italy limited liability company.
In February 2014, WPHI filed a Registration Statement on Form 10 (File No. 001-36317) with the Securities and Exchange Commission to register the shares of common stock of WPHI, which became effective on June 3, 2014.
On April 16, 2014, we completed a reverse takeover transaction, or RTO, with Mira III Acquisition Corp., a Canadian capital pool company incorporated in British Columbia, Canada, or Mira III, whereby all of the equity securities of WPHI were exchanged (as described below) for common shares and restricted voting shares of Mira III, which became the holding company of our corporate group. In connection with the RTO, Mira III changed its name to Northern Power Systems Corp. and the historical consolidated financial statements of WPHI included in this prospectus became the historical consolidated financial statements of Northern Power Systems Corp. Also in connection with the RTO, we completed a CDN$24.5 million private placement whereby we issued 6,125,000 subscription receipts.
Immediately prior to the RTO, the shares of common stock of WPHI, or WPHI Shares, were consolidated on a 1.557612-to-1 basis and then all of WPHI’s outstanding senior secured convertible notes automatically converted into an aggregate of 3,384,755 WPHI Shares. Additionally, each subscription receipt issued in the private placement converted into one WPHI Share.
In connection with the RTO, each WPHI Share held by U.S. residents who are accredited investors were exchanged for 0.72742473 of our restricted voting shares and 0.27257527 of our common shares. All other issued and outstanding WPHI Shares were exchanged for our common shares on a 1-to-1 basis. Additionally, all outstanding options to purchase WPHI Shares were exchanged and cancelled for options to purchase our common shares on a 1-to-1 basis with terms substantially the same to the options being exchanged.
Upon completion of the RTO, Northern Power Systems Corp. succeeded to WPHI’s status as a reporting company under the U.S. Securities Exchange Act of 1934, as amended, which permits us to continue to prepare our financial statements in accordance with U.S. generally accepted accounting principles. In connection with the RTO, our common shares were listed on the Toronto Stock Exchange, or TSX, under the symbol “NPS.”
Our principal executive office is located at 29 Pitman Road, Barre, Vermont, 05641. Our telephone number at our principal executive office is (802) 461-2955. Our website address is www.northernpower.com. You may
6
Table of Contents
access our periodic reports and other SEC filings on EDGAR or on our website, which also provides links to our Canadian securities filings on SEDAR and the SEC filings of our predecessor reporting company Wind Power Holdings, Inc. on EDGAR. This is a textual reference only. We do not incorporate the information on, or accessible through, our website into this prospectus, and you should not consider any information on, or that can be accessed through, our website as part of this prospectus.
We use various trademarks and trade names in our business, including Northern Power Systems, Northern Power, NPS, FlexPhase and SmartView, some of which we have registered in the U.S. and in various other countries. This prospectus also contains trademarks and trade names of other businesses that are the property of their respective holders. We have omitted the ® and ™ designations, as applicable, for the trademarks we name in this prospectus.
7
Table of Contents
THE OFFERING
| Common shares offered by us |
shares |
| Common shares to be outstanding immediately after this offering |
shares |
| Option to purchase additional shares |
We have granted the underwriters an option, exercisable for 30 days after the date of this prospectus, to purchase up to an additional common shares from us. |
| Use of Proceeds |
We expect our net proceeds from this offering will be $ million (or $ million if the underwriters exercise their option to purchase additional shares in full), based on an assumed offering price of $ per share and after deducting estimated underwriting discounts and commissions and estimated offering expenses. We currently intend to use the net proceeds from this offering primarily for the commercialization of our sales of utility-class wind turbines, including potential minority investment into the development of a limited number of wind farms, and also for general corporate purposes, including working capital. For a more complete description of our intended use of proceeds from this offering, see “Use of Proceeds on page 35.” |
| Toronto Stock Exchange symbol |
“NPS” |
| Proposed NASDAQ Capital Market trading symbol |
“NPS” |
| Risk Factors |
You should read “Risk Factors” beginning on page 12 for a discussion of factors to consider carefully before deciding to invest in our common shares. |
The number of our common shares to be outstanding after this offering is based on 22,764,353 common shares outstanding as of November 30, 2014 and excludes:
| • | 2,047,020 common shares issuable upon exercise of share options outstanding as of November 30, 2014 at a weighted average exercise price of $2.06 per share; and |
| • | 1,905,131 common shares reserved for future issuance under our 2014 Stock Option and Incentive Plan, and any future increase in shares reserved for issuance under such plan. |
Unless otherwise indicated, all information in this prospectus assumes:
| • | an offering price of $ per share of our common shares, which is the last reported sale price of our common shares on the TSX on , 2015 (based on an average exchange rate of CDN$ per $1.00); |
| • | no exercise of the underwriters’ over-allotment option to purchase additional common shares; and |
| • | no issuance or exercise of shares options on or after November 30, 2014. |
8
Table of Contents
SUMMARY CONSOLIDATED FINANCIAL AND OTHER DATA
The following table summarizes our consolidated financial data. We have derived the summary consolidated statements of operations data for the years ended December 31, 2013 and 2012 and the consolidated balance sheet data as of December 31, 2013 and 2012 from our audited consolidated financial statements included elsewhere in this prospectus. The summary consolidated statements of operations data for the nine months ended September 30, 2014 and 2013 and the consolidated balance sheet data as of September 30, 2014 have been derived from our unaudited interim consolidated financial statements included elsewhere in this prospectus. The unaudited interim consolidated financial data have been prepared on the same basis as the audited consolidated financial statements and, in the opinion of management, reflect all adjustments, which consist only of normal recurring adjustments, necessary to fairly reflect our consolidated results of operations data for the nine months ended September 30, 2014 and 2013 and our consolidated financial position as of September 30, 2014. Our historical results are not necessarily indicative of the results that may be expected in the future, and the results for the nine months ended September 30, 2014 are not necessarily indicative of operating results to be expected for the full year ending December 31, 2014 or any other period. The following summary consolidated financial data should be read in conjunction with “Capitalization,” “Selected Historical Consolidated Financial and Other Data,” “Management’s Discussion and Analysis of Financial Condition and Results of Operations” and our consolidated financial statements and related notes included elsewhere in this prospectus.
| Year Ended December 31, |
Nine Months Ended September 30, |
|||||||||||||||
| 2013 | 2012 | 2014 | 2013 | |||||||||||||
| (In thousands, except share and per share data) | (unaudited) | |||||||||||||||
| Consolidated Statement of Operations Data: |
||||||||||||||||
| REVENUES: |
||||||||||||||||
| Product |
$ | 19,142 | $ | 16,509 | $ | 37,484 | $ | 9,858 | ||||||||
| License |
— | 10,000 | 2,541 | — | ||||||||||||
| Design service |
522 | — | 1,063 | 522 | ||||||||||||
| Service |
934 | 891 | 1,470 | 1,220 | ||||||||||||
|
|
|
|
|
|
|
|
|
|||||||||
| Total revenues |
20,598 | 27,400 | 42,558 | 11,600 | ||||||||||||
|
|
|
|
|
|
|
|
|
|||||||||
| COSTS OF REVENUE AND OPERATING EXPENSES: |
||||||||||||||||
| Cost of product revenues |
16,346 | 15,968 | 31,154 | 8,905 | ||||||||||||
| Cost of service and design service revenue |
3,012 | 3,205 | 3,171 | 2,207 | ||||||||||||
| Sales and marketing |
2,977 | 2,902 | 2,668 | 2,044 | ||||||||||||
| Research and development |
4,238 | 4,260 | 3,537 | 2,845 | ||||||||||||
| General and administrative |
6,938 | 7,126 | 6,793 | 4,729 | ||||||||||||
| Assets held for sale loss |
768 | — | — | — | ||||||||||||
| Restructuring charges |
70 | 2,145 | — | 23 | ||||||||||||
| Impairment of certain long-lived assets |
— | 1,451 | — | — | ||||||||||||
|
|
|
|
|
|
|
|
|
|||||||||
| Total costs of revenue and operating expense |
34,349 | 37,057 | 47,323 | 20,753 | ||||||||||||
|
|
|
|
|
|
|
|
|
|||||||||
| Loss from operations |
(13,751 | ) | (9,657 | ) | (4,765 | ) | (9,153 | ) | ||||||||
| Change in fair value of warrants |
172 | 4,545 | — | 173 | ||||||||||||
| Interest income |
— | — | 5 | — | ||||||||||||
| Interest expense |
(514 | ) | (88 | ) | (317 | ) | (230 | ) | ||||||||
| Other income (expense) — net |
— | — | 41 | (36 | ) | |||||||||||
|
|
|
|
|
|
|
|
|
|||||||||
| Loss before provision for income taxes |
(14,093 | ) | (5,200 | ) | (5,036 | ) | (9,246 | ) | ||||||||
| Provision for income taxes |
35 | 1,014 | 441 | 13 | ||||||||||||
|
|
|
|
|
|
|
|
|
|||||||||
| Net Loss |
(14,128 | ) | (6,214 | ) | (5,477 | ) | (9,259 | ) | ||||||||
| Other comprehensive income (loss) |
||||||||||||||||
| Foreign currency translation adjustment |
— | (2 | ) | — | — | |||||||||||
|
|
|
|
|
|
|
|
|
|||||||||
| Comprehensive Loss |
$ | (14,128 | ) | $ | (6,216 | ) | $ | (5,477 | ) | $ | (9,259 | ) | ||||
|
|
|
|
|
|
|
|
|
|||||||||
| Net loss applicable to common shareholders |
$ | (17,815 | ) | $ | (12,388 | ) | $ | (5,477 | ) | $ | (12,946 | ) | ||||
| Net loss per share |
||||||||||||||||
| Basic and diluted |
$ | (4.60 | ) | $ | (821.92 | ) | $ | (0.29 | ) | $ | (15.21 | ) | ||||
| Weighted average number of common shares outstanding |
||||||||||||||||
| Basic and diluted |
3,872,895 | 15,072 | 18,919,146 | 850,950 | ||||||||||||
| Pro forma net loss per share |
||||||||||||||||
| Basic and diluted(1) |
$ | (0.29 | ) | |||||||||||||
| Pro forma weighted-average number of common shares outstanding |
||||||||||||||||
| Basic and diluted(1) |
18,919,146 | |||||||||||||||
| (1) | Pro forma basic and diluted net loss per share has been computed to give effect to the conversion of all outstanding shares of our Class B restricted voting common shares into 7,840,582 shares of our voting common shares, effected on November 30, 2014. |
9
Table of Contents
Share-based compensation included in the accompanying statements of operations data above was as follows:
| Year Ended December 31, |
Nine Months Ended September 30, |
|||||||||||||||
| 2013 | 2012 | 2014 | 2013 | |||||||||||||
| (In thousands) | (unaudited) | |||||||||||||||
| Share-based compensation expense: |
||||||||||||||||
| Cost of revenue |
$ | 71 | $ | 143 | $ | 72 | $ | 29 | ||||||||
| Sales and Marketing |
43 | 87 | 68 | 12 | ||||||||||||
| Research and development |
68 | 18 | — | 37 | ||||||||||||
| General and administrative |
519 | 723 | 606 | 186 | ||||||||||||
|
|
|
|
|
|
|
|
|
|||||||||
| Total share-based compensation |
701 | 971 | 746 | 264 | ||||||||||||
| Restructuring charges |
75 | 522 | — | 23 | ||||||||||||
|
|
|
|
|
|
|
|
|
|||||||||
| Total share-based compensation |
$ | 776 | $ | 1,493 | $ | 746 | $ | 287 | ||||||||
|
|
|
|
|
|
|
|
|
|||||||||
The following table presents our key operating and financial metric for the years and interim periods presented:
| Year Ended December 31, |
Nine Months Ended September 30, |
|||||||||||||||
| 2013 | 2012 | 2014 | 2013 | |||||||||||||
| (In thousands) | (unaudited) | |||||||||||||||
| Other financial and operational data: |
||||||||||||||||
| Non-GAAP Adjusted EBITDA |
$ | (11,227 | ) | $ | (3,953 | ) | $ | (3,210 | ) | $ | (8,131 | ) | ||||
Consolidated balance sheet data are presented below:
| As of December 31, | As of September 30, 2014 | |||||||||||||||||
| 2013 | 2012 | Actual | Pro forma(1) | Pro forma, as adjusted(2) | ||||||||||||||
| (In thousands) | (unaudited) | |||||||||||||||||
| Consolidated Balance Sheets: |
||||||||||||||||||
| Cash |
$ | 4,534 | $ | 4,456 | $ | 16,318 | $ | 16,318 | ||||||||||
| Accounts receivable |
1,961 | 1,161 | 5,850 | 5,850 | ||||||||||||||
| Property, plant and equipment — net |
1,414 | 1,900 | 1,624 | 1,624 | ||||||||||||||
| Asset held for sale |
1,300 | 2,077 | — | — | ||||||||||||||
| Working capital (deficiency) |
(4,134 | ) | 3,592 | 14,922 | 14,922 | |||||||||||||
| Total assets |
27,545 | 20,026 | 43,030 | 43,030 | ||||||||||||||
| Convertible preferred stock |
— | 135,073 | — | — | ||||||||||||||
| Total shareholders’ equity (deficiency) |
$ | (11,402 | ) | $ | 4,246 | $ | 16,359 | $ | 16,359 | |||||||||
| (1) | Reflects the conversion of all outstanding shares of our Class B restricted voting common shares into 7,840,582 shares of our voting common shares, effected on November 30, 2014. |
| (2) | Reflects the pro forma adjustments described above and gives further effect to the sale of common shares in this offering at an assumed initial public offering price of $ per share, after deducting estimated underwriting discounts and commissions and estimated offering expenses. |
10
Table of Contents
Non-GAAP Financial Measures
Non-GAAP Adjusted EBITDA
To provide investors with additional information regarding our financial results, we have disclosed in the table below and within this prospectus non-GAAP adjusted EBITDA, a non-GAAP financial measure. We have provided a reconciliation below between non-GAAP adjusted EBITDA and net loss, the most directly comparable GAAP financial measure.
We have included non-GAAP adjusted EBITDA in this prospectus because it is a key measure used by our management to evaluate our operating performance, generate future operating plans and make strategic decisions. Accordingly, we believe that non-GAAP adjusted EBITDA provides useful information to investors and others in understanding and evaluating our operating results in the same manner as our management and board of directors.
While we believe that this non-GAAP financial measure is useful in evaluating our business, this information should be considered as supplemental in nature and is not meant as a substitute for the related financial information prepared in accordance with GAAP. Some of these limitations are:
| • | although depreciation and amortization are non-cash charges, the assets being depreciated and amortized may have to be replaced in the future; |
| • | non-GAAP adjusted EBITDA does not reflect changes in, or cash requirements for, our working capital needs; |
| • | non-GAAP adjusted EBITDA does not include the impact of share-based compensation; |
| • | non-GAAP adjusted EBITDA does not reflect the impact of income taxes that may represent a reduction in cash available to us; and |
| • | other companies, including companies in our industry, may calculate non-GAAP adjusted EBITDA differently or not at all, which reduces its usefulness as a comparative measure. |
We believe it is useful to exclude non-cash charges, such as depreciation and amortization and share-based compensation, from our non-GAAP adjusted EBITDA because the amount of such expenses in any specific period may not directly correlate to the underlying performance of our business operations.
Because of the aforementioned limitations, you should consider non-GAAP adjusted EBITDA alongside other financial performance measures, including net loss, cash flow metrics and our financial results presented in accordance with GAAP. The following table presents a reconciliation of net loss to non-GAAP adjusted EBITDA for each of the years and interim periods indicated:
| Year Ended December 31, |
Nine Months Ended September 30, |
|||||||||||||||
| 2013 | 2012 | 2014 | 2013 | |||||||||||||
| (In thousands) | (unaudited) | |||||||||||||||
| Reconciliation of non-GAAP adjusted EBITDA |
||||||||||||||||
| Net loss |
$ | (14,128 | ) | $ | (6,214 | ) | $ | (5,477 | ) | $ | (9,259 | ) | ||||
| Provisions for income taxes |
35 | 1,014 | 441 | 13 | ||||||||||||
| Interest expense |
514 | 88 | 317 | 230 | ||||||||||||
| Depreciation and amortization |
985 | 1,726 | 763 | 771 | ||||||||||||
| Stock-based compensation |
701 | 971 | 746 | 264 | ||||||||||||
| Change in fair value of warrant |
(172 | ) | (4,545 | ) | — | (173 | ) | |||||||||
| Non cash restructuring charge |
70 | 1,512 | — | 23 | ||||||||||||
| Impairment charge and loss on disposal property & equipment |
— | 1,495 | — | — | ||||||||||||
| Loss on asset held for sale |
768 | — | — | — | ||||||||||||
|
|
|
|
|
|
|
|
|
|||||||||
| Non-GAAP Adjusted EBITDA |
$ | (11,227 | ) | $ | (3,953 | ) | $ | (3,210 | ) | $ | (8,131 | ) | ||||
|
|
|
|
|
|
|
|
|
|||||||||
11
Table of Contents
You should carefully consider all of the information in this prospectus, including the risks and uncertainties described below, before making an investment in our common shares. Any of the following risks and uncertainties could have a material and adverse effect on our business, financial condition, results of operations and prospects. Additionally, the market price of our common shares could decline due to any of these risks and uncertainties, and you may lose all or part of your investment.
Risk Factors Related to Our Business
We have incurred significant operating losses since inception and may not be able to achieve, or subsequently maintain profitability.
With the exception of the quarter ended September 30, 2014, we have incurred operating losses since our inception, including a net loss of $5.5 million for the nine months ended September 30, 2014 and an accumulated deficit of $156.8 million as of September 30, 2014. We may not be able to continue to generate operating income and we expect to continue to incur net losses for the foreseeable future.
Our ability to be profitable in the future depends upon continued demand for our distributed-class wind and power technology products and services and for our utility-class wind turbine platform. In addition, our profitability will be affected by, among other things, our ability to develop and commercialize next generation product offerings, enhance existing products and expand licenses of our technology into new markets. We expect to incur significant operating costs relating to our research and development initiatives for our new and existing products, and for the expansion of our sales and marketing operations as we add additional sales and business development personnel and increase our marketing efforts. Furthermore, we may incur significant losses in the future for a number of reasons, including the other risks described in this prospectus, and we may encounter unforeseen expenses, difficulties, complications, delays and other unknown events. We may fail to generate revenues in the future. If we cannot attract a significant number of purchasers, we will not be able to generate any significant revenues or income. If we continue to incur significant operating losses and fail to generate significant revenues, we may go out of business because we will not have the money to pay our ongoing expenses. As a result, we cannot assure you that we will be able achieve or sustain profitability in the future.
The distributed wind market is in the early stages of development and its future is uncertain. If the market is not as large as we expect or we are unable to compete effectively in the distributed wind market, our business and operating results could be harmed.
A substantial portion of our revenues have been and continues to be derived from sales of our distributed-class wind turbines. We anticipate that sales of these distributed-class wind turbines will continue to account for a significant portion of our revenue for the foreseeable future. The distributed wind market is in the early stages of development. Any catastrophic product failure, significant damage, or injury that could arise in this market, whether or not related to our products, may have a disproportionately negative impact on public perception of the efficiency, safety or general merits of distributed-class wind turbines, which could have an adverse effect on our revenues and our business.
We may suffer reputational harm or other damages as a result of unreliable wind resource data. In the distributed wind market, there is at present insufficient reliable data for the wind resource available by geographic location at the tower heights of our turbines. In siting these turbines, purchasers may make decisions based upon insufficiently precise data, which could result in turbines being sited in geographic locations that do not provide optimal wind conditions for the production of electric power. As a result, purchasers may not receive the expected economic benefits of ownership of wind turbines that we produce and our reputation could suffer. We also may be liable for liquidated damages, warranty claims or other costs if our turbines do not perform to contractual requirements or to customer expectations.
We experience significant competition in the distributed wind market, particularly in Italy and the U.K. Our primary competitor in the distributed wind market is Endurance Wind Power but we also compete with several
12
Table of Contents
smaller providers of distributed-class wind products. The wind turbines being offered by competitors are offered with lower upfront pricing. In early 2014, we introduced a lower cost but higher energy output product in the market to compete more effectively on price while still maintaining high durability and reliability. We may experience lower gross margins than forecast if we cannot maintain a price premium for our products and may be unable to successfully compete against lower-cost competitors. We may also face increased competition in the future, including from large, multinational companies with significant resources who may also be able to scale production and provide similar products at lower costs.
In addition, if our competitors market products that are more effective, safer or less expensive than our current or other future products, if any, or that reach the market sooner we may not achieve commercial success or substantial market penetration. Products developed by our competitors may render our existing technology or any future product candidates obsolete. Any decrease in a sales of our distributed-class wind turbines would have an adverse effect on our business, financial condition and results of operations.
We are in the early stages of product and service commercialization, and as such, our products and services may not generate sufficient revenue or profitability.
We may not be able to replicate the positive results and high performance demonstrated in prototypes or in small scale pilot production as we scale up for commercial production. Even as we continue to develop and commercialize our products, they may not be adopted in the market or perform as expected. No assurance can be given that our expenditures on research and development will achieve the desired results in our target markets.
We are also planning to re-enter the market for utility-class wind turbine sales by selling turbines that have been built by our strategic partner WEG Equipamentos Elétricos S.A., or WEG, or future partners based on our turbine platform that we have licensed to them. There can be no assurance that our efforts to re-enter this market will be successful. We have not commenced any significant sales efforts to date and therefore cannot judge whether our efforts to re-enter this market will be successful or that we will be able to compete in this market against larger and more established companies. There can be no assurance that we will in the future achieve significant revenues or profitable operations from sales of our utility-class wind turbines.
The market for licensing wind turbine technology is relatively nascent and our experience in this market is limited. The size and timing of our revenue from consummating and delivering licensing arrangements is difficult to predict and substantial efforts may be invested into a licensing arrangement, which may never be realized. Given our limited experience in obtaining and delivering successful license agreements, our estimates of future revenues may be incorrect. In addition, companies interested in licensing our wind turbine technology could require different variations of that technology, which would require additional investment to develop and could further delay our ability to reach profitability.
Our sales cycles are complex and lengthy and the timing of our distributed wind installations are subject to seasonal variations, each of which may impact operating results from quarter to quarter and make results difficult to predict.
The size and timing of our revenue from sales of products to our customers is difficult to predict and is dependent on many factors, including market conditions, customer financing, permitting and weather conditions, all of which may combine to result in high variability in revenue trends and projections. Our sales efforts in distributed wind markets often require us to educate our customers about the use and benefits of our products, including their technical and performance characteristics. Customers typically undertake a significant evaluation process that has generally resulted in a lengthy sales cycles for us, typically many months. Furthermore, installation of our turbines is generally under the direction and control of end users or third-party contractors. The regulatory approval, permitting, construction, startup and operation of turbine sites may involve unanticipated changes or delays that could negatively impact our business and our results of operations and cash flows. The long sales cycles require us to delay revenue recognition until certain milestones or technical or implementation requirements have been met. Although we saw significant expansion in orders for our distributed-class wind turbines in 2013 and 2014, we could continue to experience challenges in obtaining distributed-class wind turbine orders and converting them into revenue.
13
Table of Contents
Wind turbine sales in the regions in which we currently sell our turbines are affected by seasonal variations and the timing of government incentive structures. To satisfy the delivery schedules, we manufacture and sell most of our wind turbines during the second and third quarters of each year for delivery and installation in the third and fourth quarters. This schedule is due primarily to variations in the weather conditions in the northern areas where we supply most of our wind turbines.
We maintain a sizable backlog and the timing of our conversion of revenue out of backlog is uncertain.
Our backlog is subject to unexpected adjustments and cancellations and thus may not be timely converted to revenue in any particular fiscal period or be indicative of our actual operating results for any future period. Orders in 2010, 2011, and 2012 were lower than our original operating plan. In addition, in both 2011 and 2012, we experienced significant order cancellation rates driven by our customers’ inabilities to obtain planning consent, grid interconnect or financing for proposed projects. Although we have not experienced cancellations in 2013 and 2014, there can be no assurances that customers will not face similar challenges in the future and cancel some or all of their orders. We have managed past order cancellations by curtailing production at our Barre, Vermont facility and closely monitoring inventory levels to conserve cash, but this left underutilized manufacturing overhead in product cost, which lowered our gross margins. Our inability to convert backlog into revenue, whether or not due to factors within our control, could adversely affect our revenue and profitability.
Because we depend on a limited number of single source suppliers for certain components, third-party business and relationship interruptions could harm our operations.
We currently depend on single source suppliers for certain precisely manufactured components in our turbines. These components may not be readily available on a cost-effective basis from other sources or on short notice, as some are custom-designed for our turbines. As a result, there can be no assurance that a continuing source of supply of these components will be available on a timely basis or on commercially viable terms in the future. In addition, our supply chain could be negatively impacted in the event one of our key single source suppliers has a business interruption due to credit issues or other factors. Any interruptions in our third-party manufacturing suppliers or supply chain, or the refusal or inability by such parties to produce necessary product components, could have an adverse impact on our business or financial results of operations.
In late November 2014, the primary supplier of blades for our distributed-class turbines briefly ceased operations. Although we have worked with this supplier to restart operations and believe that we have secured a near-term supply of blades that will be adequate for current orders, there can be no assurance that this supplier will be able to manufacture blades on a timely basis to satisfy customer requirements until we can complete qualification of new, dependable sources of blades that meet our performance specifications and quality requirements. Failure to deliver blades on a timely basis will have an adverse effect on our revenues for the quarters ending December 31, 2014 and March 31, 2015, and could cause us to incur contractual damages if the delay causes us to be in breach of our agreements with customers.
Our ability to fully realize license revenues from our wind technology licensing business is also tied to our ability to facilitate access to suppliers for our licensees that will support their economically viable production of wind turbines. Failure of our suppliers to deliver components at required costs or significant fluctuations in commodity pricing could delay or reduce license payments on which we are critically dependent.
If we do not successfully execute on our utility-class sales commercialization strategy, we may be unable to effectively grow this business.
A central part of our strategy is to be a direct seller of utility-class wind turbines. This strategy is complex and requires that we successfully complete many tasks, including obtaining a stable supply of turbine components, adequate working capital finance for our supplier production and shipment of turbines, and additional strategic manufacturing partners in the utility wind space; building our competencies to source, logistically deliver, and
14
Table of Contents
service turbines; and managing our existing relationship with WEG. A number of these tasks we must complete simultaneously, along with the continued operation of our core distributed wind business. In addition, in order to effectively execute this strategy we need to be able to successfully influence wind farm owners to select our turbines for installation and ensure that adequate financing is available to them to support the installation of our turbines. Furthermore, we are at risk to be able to deliver turbines at a cost at which we can create a profitable business based upon our dependence on our suppliers’ costs to us. If we are unable to effectively implement or coordinate the implementation of these multiple tasks or we are unable to source turbine components economically, we may be unable to compete effectively in this market and our financial results may suffer.
Strategic partnerships are essential to our business growth, particularly in the utility wind market, and the inability to secure these relationships could adversely impact revenue and operations.
The technology licensing and design services portions of our business are structured to provide value to potential customers by offering technology licenses and engineering consulting services. This business model derives its highest value by obtaining multiple globally diversified strategic technology partnerships, which include licensing our technology and product designs, providing design and development services, and offering service support for turbines manufactured and deployed by the strategic partner. We have entered into a strategic partnership with WEG under which WEG can sell utility-class turbines built based on our design, however, there can be no assurance that any similar transactions will be consummated in the future or that an adequate volume of business can be closed to achieve our forecasts. If these transactions are not consummated in a timely and adequate manner, we may be required to reduce personnel and could ultimately be forced to cease operations of this part of our business. Expansion of product sales is dependent on our ability to effectively create global partnerships to help sell our products in developing markets as well as gain access to lower cost manufacturing of products. If these partnerships cannot be identified and effectively developed and executed, our ability to expand the utility-class wind turbine market and reduce the cost of turbines will be impacted. Additionally, WEG and other large companies we may partner with in the future will compete with Enercon GmbH, Siemens Wind Power, and Xinjiang Goldwind Science & Technology Co., Ltd., or Goldwind Corporation. If our existing or prospective partners are, or believe they are, unable to achieve adequate revenues to merit entering into a license with us, our ability to achieve profitability will likely be delayed. Additionally, we compete against a number of companies including American Superconductor Corporation, Vensys Energy AG, which is division of Goldwind Corporation, and aerodyn Energiesysteme GmbH in licensing technology to these equipment manufacturers. If we are unable to differentiate our technology for licensing, our revenue and operations may be materially harmed.
If we fail to expand effectively in international markets, our revenue and business will be harmed.
Successful continued advancement and implementation of our plan to sell our products in Europe is a strategic priority. European markets, particularly Italy and the U.K., are currently leading growth in the purchase and installation of distributed-class wind turbines. We expect the regulatory policies, which have driven the growth of these two markets, to diminish over time and we therefore will need to expand into new markets to supplement our sales in Italy and the U.K. Developing the European market and expanding into new markets for our turbines are expected to entail a number of risks, including the need for appropriate management of our efforts, successful negotiation on terms advantageous to us of agreements facilitating our profitable expansion of this business, including logistics, installation and commissioning, and post-sales support service efforts. Sophisticated engineering, procurement and construction providers are moving into the distributed wind market and demanding that wind turbine manufacturers such as us provide a turnkey offering that includes supply, installation and long-term support of the turbines. While we have experience in turbine supply, we have limited experience in installation and long-term, international support. While we have experienced some success in winning orders, we may not be able to provide the services required to fulfill them. Failure to obtain or effectively execute a large volume of orders in Italy and the U.K. and failure to expand into new markets would have an adverse effect on our ability to reach profitability.
We also are seeking to enter into international strategic partnerships, including in countries such as Turkey, Poland, South Korea, and India. These strategic partnerships, if successful, will include licensing our technology,
15
Table of Contents
providing design, development and support services both remotely and locally within the region, and facilitating of global supply chain development. There can be no assurance that we will be able to establish these strategic partnerships, or that they will be profitable if consummated. International business development efforts generally include risks relating to management of currency exchange rate exposure, international enforceability of contracts, potential exposure of intellectual property to misuse or misappropriation, compliance and operational challenges that may delay or add complexity to sales and support efforts, and the potential of local taxation above that which is currently forecast. If we are unsuccessful in managing these challenges or performing under these partnerships if we are able to secure them, our efforts to sell our turbines and technology licensing and services on a global basis may expend our resources without significant contribution to the results of our operations and may not contribute to the value of our business.
Problems with quality or performance in our products or products based on our technology that are manufactured by our licensees could have a negative impact on our relationships with customers and our reputation and cause reduced market demand for our products.
Customers for our products regularly expect vendors to have a history of reliable production or creditworthy warranty coverage of meaningful duration. From commencement of our current operations in August 2008, we have received over 550 orders for distributed-class wind turbines to date with more than 400 shipped through September 2014. Of the units shipped, over 300 have been commissioned and are producing power at customer sites. This short history of operating in the field means that it will be some time before we will be able to determine the durability and reliability of our products after sale. In 2009 and 2010, we incurred substantial warranty expense with respect to our 100 kW turbines. We cannot assure you that similar issues or new issues will not occur in the future in our distributed-class wind turbines or in our other products. If our products are not sufficiently durable and reliable or otherwise perform below expectations, we could incur additional substantial warranty expenses, we could be required to pay liquidated or other contractual damages, our reputation could be harmed and our revenues could decline.
Problems with the quality or performance of the wind turbines manufactured by WEG or future partners could likewise adversely affect us due to warranty claims or other contractual damages, and could negatively impact our ability to re-enter the market for utility-class wind turbine sales. Issues with turbines manufactured by our partners could result in significant negative publicity and materially and adversely affect the marketability of our products and our reputation.
Any defect, underperformance or problem with our wind turbines or any perception that our products may contain errors or defects, or claims related to errors or defects, may adversely impact our customer relationships and harm our reputation and credibility, resulting in a decrease in market demand for our wind turbines, decrease in our revenue, increase in our expenses and loss of market share.
Our customers’ inability to obtain financing to make purchases from us or maintain their businesses could harm our business, and negatively impact revenue, results of operations, and cash flow.
Some of our customers require substantial financing to finance their business operations, including capital expenditures on new equipment and equipment upgrades, and to make purchases from us. The potential inability of these customers to access the capital needed to finance purchases of our products and to meet their payment obligations to us could adversely impact our financial condition and results of operations. If our customers become insolvent due to market and economic conditions or otherwise, it could have an adverse impact on our business, financial condition and results of operations.
If we fail to successfully develop and introduce new products and technologies, our business, financial condition and results of operations could be adversely affected.
Our success depends, in part, upon our ability to anticipate industry evolution and introduce or acquire new products technologies to keep pace with technological developments. However, we may not be able to develop,
16
Table of Contents
introduce, acquire and integrate new products and technologies in response to our customers’ changing requirements in a timely manner or on a cost-effective basis, or that sufficiently differentiate us from competing solutions such that customers choose to purchase our solutions. If any of our competitors implements new technologies before we are able to implement them or better anticipates the innovation opportunities in related industries, those competitors may be able to provide more effective or more cost-effective solutions than ours. In addition, we may experience technical problems and additional costs as we introduce new products and technologies. If any of these problems were to arise, our business, financial condition and results of operations could be adversely affected.
If we fail to effectively expand our manufacturing, production and service capacity, our business and operating results could be harmed.
In connection with our planned expansion in Europe, we have scaled and expanded manufacturing and production in our Barre, Vermont facility, as well as implemented a European service deployment model. There is risk in our ability to continue to effectively scale production processes and effectively manage our supply chain requirements. If we are unable to maintain our internal manufacturing and production capacity for our turbines in a timely, cost-effective and efficient manner, we may be unable to further expand our business, decrease costs or become profitable. Our ability to further expand production capacity efficiently and on schedule is subject to significant challenges, risks and uncertainties, any one of which could substantially increase costs and delay or reduce production. If we are unable to achieve expected production yields and decrease costs, we could experience considerable operating losses.
Our current service structure is primarily supported by our Barre, Vermont headquarters, although we have added and are continuing to expand our European service offerings. If we are unable to expand our European service offerings in a timely and cost effective manner, we may be unable to expand our business, be subject to increased warranty obligations and risk our ability to become profitable.
There are a number of risks associated with our international operations that could harm our business.
We sell products and provide services on a global basis and plan to expand into additional countries. Our ability to grow in international markets could be harmed by a number of factors, including:
| • | changes in political and economic conditions and potential instability in certain regions; |
| • | currency control and repatriation issues; |
| • | changes in regulatory requirements or in foreign policy, including the adoption of domestic or foreign laws, regulations and interpretations detrimental to our business; |
| • | changes to regulatory incentives to purchase wind turbines or produce or utilize wind energy; |
| • | possible increased costs and additional regulatory burdens imposed on our business; |
| • | burdens of complying with a wide variety of laws and regulations; |
| • | difficulties in managing the staffing of international operations; |
| • | increased financial accounting and reporting burdens and complexities; |
| • | laws and business practices favoring local competitors; |
| • | terrorist attacks and security concerns in general; |
| • | changes to tax laws, compliance costs and challenges to our tax positions that may have adverse tax consequences to us; |
| • | changes, disruptions or delays in shipping or import/export services; |
17
Table of Contents
| • | reduced protection of our intellectual property rights; and |
| • | unfavorable tax rules or trade barriers, including import duties or other import/export restrictions. |
In addition, we conduct certain functions, including customer sales and service operations, in regions outside of the U.S. We are subject to both U.S. and local laws and regulations applicable to our offshore activities, and any factors which reduce the anticipated benefits associated with providing these functions outside of the U.S., including cost efficiencies and productivity improvements, could harm our business.
Our international expansion efforts are impacted by foreign currency fluctuations, which could harm our profitability.
As part of our international expansion, we currently expect that a substantial amount of our business in 2015 could be non-U.S. dollar denominated sales transactions, all of which we currently expect to be euro-denominated transactions, while the majority of our costs will continue in U.S. dollars. This can result in a significant proportion of our receivables being denominated in foreign currencies. In addition, we expect to be entering into extended duration operations and maintenance contracts, which would obligate us to perform services in the future based upon currently negotiated non-U.S. dollar denominated pricing terms. Although we plan to pursue economic hedging strategies, including increasing our euro-denominated costs and consideration of effective financial hedging strategies, there can be no assurance that we can execute these strategies to effectively control the economic exposure of currency movements. Negative movements in the exchange rate between foreign currencies and the U.S. dollar could have an adverse effect on our revenues and delay our achieving profitability.
Due to our large customer concentration, a loss of one or more of our significant customers could harm our business, and negatively impact revenue, results of operations, and cash flow.
We are dependent on a relatively small number of customers for our sales, and a small number of customers have historically accounted for a material portion of our revenue. Our two largest customers accounted for approximately 25% of revenue in 2013, and our three largest customers accounted for approximately 35% of revenue for the nine months ended September 30, 2014. For the near future, we may continue to derive a significant portion of our net sales from a small number of customers. Accordingly, loss of a significant customer or a significant reduction in pricing or order volume from a significant customer, could materially reduce net sales and operating results in any reporting period.
Failure to comply with the requirements of certain grant programs may result in a significant financial penalty.
The Defense Contract Audit Agency and an independent auditing firm, each on behalf of the Department of Energy and the National Renewable Energy Laboratory, respectively, are auditing various renewable energy development grant programs previously awarded to us, or which we agreed to assume in our acquisition of certain assets and liabilities from Distributed Energy Systems Corporation. These audits are in various stages of completion and will eventually cover all years from 2003 until the grant project was completed or closed. We do not have adequate information to determine if the outcome of these audits will result in a cost to us. If we are found to have not complied with required standards or cannot support an audit to such standard, our financial liability to the U.S. Department of Energy or the National Renewable Energy Laboratory could be material.
Performance obligations necessary to support our prototype 2.3 MW turbines could be significantly higher than currently anticipated and could be higher than income we receive.
We produced and sold two prototypes of our 2.3 MW turbine, which are installed and operating in a wind farm in Michigan. These turbines are owned and operated by a third party but we are currently contractually obligated to
18
Table of Contents
provide operation and maintenance and warranty services for such turbines, potentially for up to ten additional years, with certain liquidated damages for turbine non-performance. Although the performance of these turbines to date has met or exceeded all contractual performance requirements, the turbines are based on a prototype design and our experience with them is limited. Accordingly, there can be no assurance that these performance requirements can continue to be delivered, or can be delivered without high financial cost to the business.
Our intellectual property rights are valuable, and any inability to protect them could reduce the value of our products, services, and brand.
If we are unable to protect our intellectual property, our competitors could use our intellectual property to market similar products, which could reduce the demand for our products. Our success depends substantially upon the internally developed technology that is incorporated in our products. We rely on a combination of patent, trademark and copyright laws, trade secret protection and confidentiality or license agreements with our employees, customers, strategic partners, suppliers, and others to protect our intellectual property rights. The steps we take to protect our intellectual property rights may, however, be inadequate. Any breach or violation of our intellectual property rights by any of our licensees could adversely affect our competitive position and the value of our assets.
Intellectual property right claims are expensive and time consuming to defend, and if resolved adversely, could have a significant impact on our business, financial condition, and operating results. In the event of a conflict between our patents or future patent applications and the activities of other parties, infringement proceedings may be pursued by or against us. The legal proceedings necessary to defend the validity of patents and to prevent infringement by others can be complex and costly, and the outcomes of these legal proceedings is often uncertain. These legal proceedings might adversely affect our competitive position and the value of our assets, and there can be no assurance that the outcomes of the proceedings would be successful.
Assertions by third parties of infringement or other violations by us of their intellectual property rights could result in significant costs and substantially harm our business and operating results.
Some companies in the wind power technology and power conversion industries, including some of our competitors, own large numbers of patents, which they may use to assert claims against us. Additionally, we may be subject to patent litigation and may be required to defend our patents against claims of holders of competitive patents. Third parties may assert claims of infringement, misappropriation or other violations of intellectual property rights against us. As the number of our product offerings in our markets increase and as we expand into additional markets, claims of infringement, misappropriation and other violations of intellectual property rights may increase. Any claim of infringement, misappropriation or other violation of intellectual property rights by a third party–even those without merit–could cause us to incur substantial costs defending against the claim and could distract our management.
The patent portfolios of our most significant competitors in the utility wind manufacturing market are larger than ours and this disparity may increase the risk that they may sue us for patent infringement and may limit our ability to counterclaim for patent infringement or settle through patent cross-licenses. In addition, future assertions of patent rights by third parties, and any resulting litigation, may involve patent holding companies or other adverse patent owners who have no relevant product revenue and against whom our own patents may therefore provide little or no deterrence or protection. We cannot assure you that we are not infringing or otherwise violating any third-party intellectual property rights.
An adverse outcome of a dispute may require us to:
| • | pay substantial damages, including treble damages, if we are found to have willfully infringed a third party’s patents or copyrights; |
| • | cease making, licensing or using solutions that are alleged to infringe or misappropriate the intellectual property of others; |
19
Table of Contents
| • | expend additional development resources to attempt to redesign our services or otherwise to develop non-infringing technology, which may not be successful; |
| • | enter into potentially unfavorable royalty or license agreements to obtain the right to use necessary technologies or intellectual property rights; or |
| • | indemnify our disbursement partners and other third parties. |
An adverse determination may also result in the invalidation of patents that may be valuable to us. Royalty or licensing agreements, if required or desirable, may be unavailable on terms acceptable to us, or at all, and may require significant royalty payments and other expenditures. In addition, some licenses may be non-exclusive, and therefore our competitors may have access to the same technology licensed to us. Any of these events could harm our business, financial condition and results of operations.
We may not be able to receive patents on all of our pending patent applications.
Patent applications in the U.S. are maintained in secrecy until the patents are published or are issued. Since publication of discoveries in the scientific or patent literature tends to lag behind actual discoveries by several months, we cannot be certain that we are the first creator of inventions covered by pending patent applications or the first to file patent applications on these inventions. Accordingly, we cannot be certain that the patent applications that we file will result in patents being issued.
Third-party license agreements for important software and hardware components may not be available on acceptable terms, which could have an impact of our business.
We believe that we either have the intellectual property rights needed to operate our business in accordance with our business plan or that we will be able to successfully license any patents required to develop and commercialize future products. However, there is no assurance products that are developed and marketed by us in the future will not require access to or utilize other technology that has been patented or otherwise protected by others. If valid patents that contain competitive or conflicting claims now exist or are subsequently issued to others, we may be required to obtain licenses to patents or other proprietary rights of others. No assurance can be given that any required licenses would be made available on terms acceptable to us, if at all. If we were unable to obtain such licenses, it could encounter delays or be unable to develop and produce products requiring the use of such technology. Moreover, there can be no assurance that others will not independently develop similar products, duplicate any of our products or infringe on any patents held by, or licensed to us. There also can be no assurance that our competitors will not independently develop or license from third parties technologies that are equivalent or superior to our technologies.
Our business is subject to the risks of earthquakes, fires, floods and other natural catastrophic events and to interruption by man-made problems such as computer viruses or terrorism, any of which could result in system failures and interruptions that could harm our business.
Although our systems have been designed to reduce downtime in the event of outages or catastrophic occurrences, they remain vulnerable to damage or interruption from earthquakes, floods, fires, power loss, rolling blackouts, telecommunication failures, terrorist attacks, cyber-attacks, computer viruses, computer denial-of-service attacks, human error, hardware or software defects or malfunctions (including defects or malfunctions of components of our systems that are supplied by third-party service providers) and similar events or disruptions. Despite any precautions we may take, system interruptions and delays could occur if there is a natural disaster, if a third-party provider closes a facility we use without adequate notice for financial or other reasons, or if there are other unanticipated problems at our facilities. We do not carry business interruption insurance sufficient to compensate us for losses that may result from interruptions in our service as a result of system failures. A system outage or data loss could harm our business, financial condition and results of operations.
20
Table of Contents
Our insurance policies and financial resources may not be sufficient to cover the costs associated with personal injury, property damage, product liability and other types of claims brought against us.
We are exposed to potentially significant risks associated with product liability or other claims if our products or manufacturing activities cause personal injury or property damage, whether by product malfunctions, defects or other causes. If product liability claims are brought against us in the future, any resulting adverse publicity could hurt our competitive standing and reduce revenues from sales of our products. The assertion of product liability, personal injury or property damage claims against us could result in significant legal fees and monetary damages and require us to make large payments. Any business disruption or natural disaster could result in substantial costs, lost revenues and diversion of resources. Our insurance coverage is limited for product liability and other claims against us, as well as for business disruption and natural disasters. Therefore, we may not have adequate insurance and financial resources to pay for our liabilities or losses from any such claim or cause.
If our working capital is insufficient to meet customer demand, we may have difficulty arranging for financing.
Wind power companies, and manufacturing companies generally, are capital intensive businesses. To fulfill the product delivery requirements of our customers, we plan for working capital needs in advance of customer orders. If we experience sales in excess of our estimates, our working capital needs may be higher than those currently anticipated. Our ability to meet this excess customer demand depends on our ability to arrange for additional financing for any ongoing working capital shortages, since it is likely that cash flow from sales will lag behind these investment requirements. And while the net proceeds from this offering will add considerable capital to the company, we will likely in the future require additional institutional financing, including equity or debt offerings, to fund our operations, or to continue expansion of our operations. Funding from these sources may be limited, unavailable, or not available on favorable terms. There is no assurance that we will in fact be successful in the wind turbine distribution or utility-class or other business lines, or that we will succeed in obtaining funds in sufficient amounts to proceed with our strategy when capital is needed.
Covenants under our credit facility agreements impose significant operating and financial restrictions, and failure to comply with these covenants could have an adverse effect on our business, financial condition, results of operations or cash flows.
Our credit facility with Comerica Bank, or Comerica, contains various covenants that limit or prohibit our ability, among other things, to:
| • | incur or guarantee additional indebtedness; |
| • | pay dividends on our capital shares or redeem, repurchase, retire or make distributions in respect of our capital shares or subordinated indebtedness or make certain other restricted payments; |
| • | make certain loans, acquisitions, capital expenditures or investments; |
| • | sell certain assets; |
| • | create or incur certain liens; |
| • | consolidate, merge, sell, transfer or otherwise dispose of all or substantially all of our assets; and |
| • | enter into certain transactions with our affiliates. |
The Comerica loan agreement contains a financial covenant that requires us to maintain unencumbered liquid assets having a value of at least $1.5 million at all times. For more information regarding these covenants, please see “Management’s Discussion and Analysis of Financial Condition and Results of Operations — Liquidity and Capital Resources — Comerica Credit Facility.”
As of September 30, 2014, we were in compliance with all of the covenants contained in our loan agreement. However, a violation of covenants may result in default or an event of default under the loan agreement. Upon
21
Table of Contents
the occurrence of an event of default under the loan agreement, Comerica could elect to declare all indebtedness outstanding under that agreement to be immediately due and payable and terminate any commitments to extend further credit. If we are unable to repay those amounts, Comerica may proceed against the collateral granted to them to secure the indebtedness. Substantially all of our assets are pledged as collateral under the Comerica credit facility. If Comerica were to accelerate the repayment of borrowings, such acceleration would have an adverse effect on our business, financial condition, results of operations, liquidity or cash flows.
Our business is dependent on rare earth metals and other commodities, and volatility in these markets could be harmful to our business and operations.
Our products utilize magnets formulated with rare earth metals. These magnets are supplied by a limited number of producers and have, in the past, been subject to significant price volatility. These components are procured from non-U.S. producers, and as such their pricing is subject to the variability in currency exchange rates. Our products also are comprised of copper, steel and iron components, the prices of which are also subject to market fluctuation. We do not presently hedge either our costs of production or product sales, and as such we may be adversely affected by significant swings in the prices of necessary components between the time of pricing our products for sale and the delivery of completed products. Furthermore, if we implement a hedging strategy in the future, there can be no assurance that these arrangements would be effective. Our failure to obtain in a timely manner sufficient quantities of components that meet our quality, quantity and cost requirements could delay or impair our ability to manufacture products and could increase our manufacturing costs.
We depend on highly skilled personnel to grow and operate our business, and if we are not able to hire, retain and motivate our personnel, we may not be able to grow effectively.
Competition for talented senior management, as well as middle management and engineers, is intense, and our future success will to some extent depend upon the contribution of a small number of key executives and personnel. Moreover, our ability to successfully develop and maintain a competitive market position will depend in part on our ability to attract and retain highly qualified and experienced management. The failure to attract and retain necessary personnel could have an adverse impact on our business, development, financial condition, results of operations and prospects.
The requirements of being a U.S. public company may strain our resources, divert management’s attention and affect our ability to attract and retain executive management and qualified board members.
As a U.S. public company, we are subject to the reporting requirements of the U.S. Securities Exchange Act of 1934, as amended, or the Exchange Act, as well as the Sarbanes-Oxley Act of 2002, or the Sarbanes-Oxley Act, the Dodd-Frank Wall Street Reform and Consumer Protection Act, or the Dodd-Frank Act, and other applicable securities rules and regulations. We will also continue to be subject to the reporting requirements of applicable Canadian securities laws and the rules and regulations of the Toronto Stock Exchange, or TSX. Furthermore, upon our listing on NASDAQ Capital Market, we will become subject to the listing requirements of The NASDAQ Stock Market. Compliance with these rules and regulations will increase our legal and financial compliance costs, make some activities more difficult, time consuming or costly and increase demand on our systems and resources, particularly after we are no longer considered an “emerging growth company,” as defined in the Jumpstart Our Business Startup Acts of 2012, or the JOBS Act. The Exchange Act requires, among other things, that we file annual, quarterly and current reports with respect to our business and results of operations. The Sarbanes-Oxley Act requires, among other things, that we maintain effective disclosure controls and procedures and internal control over financial reporting. To maintain and, if required, improve our disclosure controls and procedures and internal control over financial reporting to meet this standard, significant resources and management oversight may be required. As a result, management’s attention may be diverted from other business concerns, which could harm our business and results of operations. Although we have already hired additional employees to comply with these requirements, we may need to hire more employees in the future or engage outside consultants, which will increase our costs and expenses.
22
Table of Contents
In addition, changing laws, regulations and standards relating to corporate governance and public disclosure are creating uncertainty for public companies, increasing legal and financial compliance costs and making some activities more time consuming. These laws, regulations and standards are subject to varying interpretations, in many cases due to their lack of specificity, and, as a result, their application in practice may evolve over time as new guidance is provided by regulatory and governing bodies. This could result in continuing uncertainty regarding compliance matters and higher costs necessitated by ongoing revisions to disclosure and governance practices. We intend to continue to invest resources to comply with evolving laws, regulations and standards, and this investment may result in increased general and administrative expenses and a diversion of management’s time and attention from revenue-generating activities to compliance activities. If our efforts to comply with new laws, regulations and standards differ from the activities intended by regulatory or governing bodies due to ambiguities related to their application and practice, regulatory authorities may initiate legal proceedings against us and our business may be adversely affected.
As a U.S. public company subject to these rules and regulations, we may find it more expensive for us to obtain director and officer liability insurance, and we may be required to accept reduced coverage or incur substantially higher costs to obtain coverage. These factors could also make it more difficult for us to attract and retain qualified members of our board of directors, particularly to serve on our audit committee and compensation and corporate governance committee, and qualified executive officers.
Our management team has limited experience managing a U.S. public company. Our management team may not successfully or efficiently manage a public company that is subject to significant regulatory oversight and reporting obligations under the federal securities laws. In particular, these new obligations will require substantial attention from our senior management and could divert their attention away from the day-to-day management of our business.
As a result of becoming a U.S. public company, we are obligated to develop and maintain proper and effective internal control over financial reporting, but we may not complete our analysis of our internal control over financial reporting in a timely manner, or these internal controls may not be determined to be effective, either of which may harm investor confidence in us and the value of our common shares.
We will be required, pursuant to Section 404 of the Sarbanes-Oxley Act, or Section 404, to furnish a report by management on, among other things, the effectiveness of our internal control over financial reporting for the year ending December 31, 2015. Our internal control over financial reporting is a process designed to provide reasonable assurance regarding the reliability of financial reporting and the preparation of financial statements in accordance with generally accepted accounting principles in the U.S., or GAAP. We have begun the process of documenting, reviewing and improving our internal controls and procedures for compliance with Section 404, which will require that we evaluate, test and document our internal controls and, as a part of that evaluation, testing and documentation, identify areas for further attention and improvement. As a Canadian public company, we also are required to provide quarterly certification pursuant to Canadian Securities Administrators’ National Instrument 52-109, Certification of Disclosure in Issuers’ Annual and Interim Filings, with respect to, among other things, the design and operation of our internal controls.
In connection with the preparation of our financial statements for the period ended September 30, 2013, our management identified a material weakness in our internal control over financial reporting. A material weakness is defined as a deficiency, or a combination of deficiencies, in internal control over financial reporting such that there is a reasonable possibility that a material misstatement of our annual or interim financial statements will not be prevented or detected on a timely basis. The material weakness pertained to ineffective controls in the financial statement close process. Specifically, we did not have sufficient accounting resources with relevant technical accounting skills to address issues related to various non-routine transactions and to effectively review financial statements prior to finalization. As a result, the financial statement drafts we prepared contained inaccurate material disclosures. We believe that we have remediated the material weakness by steps we took in our fourth quarter of 2013 to address the underlying causes of the material weakness, primarily through the continued development and
23
Table of Contents
implementation of formal policies, improved processes and documented procedures, as well as the continued hiring of additional finance resources. In addition, we hired a new corporate controller with public company experience in November 2013. The actions that we took and are continuing to maintain are subject to ongoing senior management review, as well as oversight by the audit committee of our board of directors.
We are in the early stages of the costly and challenging process of compiling the system and processing documentation necessary to perform the evaluation needed to comply with Section 404. We will need to continue to dedicate internal resources, and we have engaged outside consultants, to adopt a detailed work plan to assess and document the adequacy of internal control over financial reporting, continue steps to improve control processes as appropriate, validate through testing that controls are functioning as documented and implement a continuous reporting and improvement process for internal control over financial reporting. Implementing any appropriate changes to our internal controls may distract our officers and employees, entail substantial costs to modify our existing processes and take significant time to complete. These changes may not, however, be effective in maintaining the adequacy of our internal controls. Thus, despite our efforts, there is a risk that we will not be able to conclude, within the prescribed timeframe or at all, that our internal control over financial reporting is effective as required by Section 404. Any failure to maintain the adequacy of our internal controls, consequent inability to produce accurate financial statements on a timely basis, or identification of one or more material weaknesses could result in an adverse reaction in the financial markets due to a loss of confidence in the reliability of our financial statements.
We will be required to disclose changes made in our internal control over financial reporting on a quarterly basis. However, as an “emerging growth company”, our independent registered public accounting firm will not be required to attest to the effectiveness of our internal control over financial reporting pursuant to Section 404 as long as we are an “emerging growth company.” We will remain an “emerging growth company” for up to five years, although if the market value of our common shares that are held by non-affiliates exceeds $700 million as of any June 30 before that time, we would cease to be an “emerging growth company” as of the following December 31. After this five-year period, our independent registered public accounting firm will be required to report on our internal controls over financial reporting if the market value of our common shares held by non-affiliates exceeds $75 million. To comply with the requirements of being a public company, we may need to undertake various actions, such as implementing new internal controls and procedures and hiring accounting or internal audit staff.
Financial reporting and applicable regulations are complex, and failure to correctly interpret and abide by these standards could result in inaccurate financial information or reporting delays, which would have a significant impact on our reputation and value.
Our consolidated financial statements are prepared in accordance with GAAP. We adopted multi-element revenue recognition for product sales entered into or materially changed on or after January 1, 2011. Our current contracts are composed of two or three units of accounting: (i) the turbine product; (ii) commissioning services; and (iii) frequently, but not always, extended warranty services. Turbine revenue is recognized when title and risk of loss transfer to the customer, commissioning service revenue is recognized when performed, and extended warranty revenue is recognized over the extended warranty period when that period begins. With our expansion into licensing and development contracts, complex revenue recognition accounting issues must be considered, which can result in us collecting significant cash milestone payments prior to being able to recognize revenue in accordance with GAAP. This could impact our ability to show demonstrated revenue expansion relative to our expected plans.
In addition, GAAP-based revenue recognition rules require a business to be able to reasonably estimate its warranty experience prior to recognizing revenues. The performance of all commissioned units experienced during the year will impact our estimates for our warranty obligations. In the event that we conclude we cannot reasonably estimate our warranty experience, we may not recognize revenues for GAAP purposes in the financial statements for a given period and all revenues and costs associated with units shipped through year end would be deferred on the balance sheet until we determine that we can reasonably estimate warranty costs.
24
Table of Contents
The application of certain elements of GAAP can result in significant non-cash charges. Employee share option plans can require fair-value accounting under GAAP, which can result in such charges.
Changes or modifications in financial accounting standards, including those related to revenue recognition, may harm our results of operations.
From time to time, the Financial Accounting Standards Board, or FASB, either alone or jointly with the International Accounting Standards Board, or IASB, promulgates new accounting principles that could have an adverse impact on our results of operations. For example, the FASB is currently working together with the IASB to converge certain accounting principles and facilitate more comparable financial reporting between companies who are required to follow GAAP, and those who are required to follow International Financial Reporting Standards, or IFRS. These efforts may result in different accounting principles under GAAP, which may have a material impact on the way in which we report financial results in areas including, among others, revenue recognition and financial statement presentation.
For example, in connection with this initiative, the FASB issued a new accounting standard for revenue recognition in May 2014 — Accounting Standards Update (ASU) 2014-09, “Revenue from Contracts with Customers (Topic 606)” — that supersedes nearly all existing GAAP revenue recognition guidance. Although we are currently in the process of evaluating the impact of ASU 2014-09 on our consolidated financial statements, it could change the way we account for certain of our sales transactions.
We expect the Securities and Exchange Commission, or the SEC, to make a determination in the future regarding the incorporation of IFRS into the financial reporting system for U.S. companies. A change in accounting principles from GAAP to IFRS would be costly to implement and may have a material impact on our financial statements and may retroactively impact previously reported transactions. Implementation of accounting regulations and related interpretations and policies, particularly those related to revenue recognition, could cause us to defer recognition of revenue or recognize lower revenue, which may affect our results of operations.
Our treatment as a U.S. corporation for U.S. federal income tax purposes may result in us being subject to income taxes in both the U.S. and Canada.
On April 16, 2014, we, as Wind Power Holdings, Inc., or WPHI, completed a reverse takeover transaction, or RTO, as described in “Certain U.S. Federal Income Tax Considerations — The Company as a U.S. Corporation for U.S. Federal Income Tax Purposes.” We believe Section 7874(b) of the Internal Revenue Code of 1986, as amended, or the Code, applied to the RTO to treat our company as a U.S. domestic corporation for all U.S. federal income tax purposes. Accordingly, we are subject to U.S. federal income tax as a U.S. domestic corporation on our worldwide income and any dividends paid by us to non-U.S. holders may be subject to U.S. federal income tax withholding at a 30% rate or such lower rate as provided in an applicable treaty. We currently do not intend to pay any dividends on our securities in the foreseeable future, however. As a Canadian corporation, we are also generally subject to Canadian income taxes on our worldwide income and dividends paid to non-Canadian holders may be subject to Canadian withholding taxes. Our currently anticipated activities and operations as a holding company generally are not expected to result in significant taxable income for Canadian tax purposes. Distributions made to us by our U.S. subsidiaries out of active business income previously taxed in the U.S. generally would not be expected to subject us to additional taxation in Canada. However, in the event that a U.S. subsidiary is sold, or we otherwise earn income from other sources, or if our U.S. subsidiaries earn certain types of passive income, such proceeds or other income could be subject to Canadian income tax. Though we do not expect Northern Power Systems Corp. to have significant taxable income for Canadian tax purposes in the foreseeable future, if it did, the combined taxes we may be required to pay in the U.S. and Canada could be significant and could adversely affect our ability to attain or sustain profitable operations going forward.
25
Table of Contents
Our ability to use net operating loss carryforwards and other tax assets to reduce future tax payments may be limited by provisions of the Code.
As of December 31, 2013, we had net operating loss carryforwards for federal and state income tax purposes of approximately $110.5 million and $71.0 million, respectively. We also had federal research tax credit carryforwards of approximately $1.2 million, which if not utilized expire from 2014 to 2028. These net operating loss and research tax credit carryforwards could expire unused and be unavailable to offset future income tax liabilities, which could adversely affect our profitability.
The annual use of our net operating losses may be limited following certain ownership changes under provisions of the Code and applicable state tax laws. In general, a corporation that undergoes an “ownership change” is subject to limitations on its ability to utilize its pre-change net operating losses, or NOLs, to offset future taxable income. In general, an ownership change occurs if the aggregate share ownership of certain shareholders (generally 5% shareholders, applying certain look-through and aggregation rules) increases by more than 50% over such shareholders’ lowest percentage ownership during the testing period (generally three years). Purchases of our equity securities in amounts greater than specified levels, which will be beyond our control, could create a limitation on our ability to utilize our NOLs for tax purposes in the future. Further, we have not completed a study to assess whether an ownership change will occur as a result of this offering or whether one or more ownership changes has occurred at any point since our inception due to the costs and complexities associated with such study. Accordingly, our ability to use our net operating loss carryforwards to reduce future tax payments may be currently limited or may be limited as a result of the offering or any future issuance of shares of our common shares. Limitations imposed on our ability to utilize NOLs could cause U.S. federal and state income taxes to be paid earlier than would be paid if such limitations were not in effect and could cause such NOLs to expire unused, in each case reducing or eliminating the benefit of such NOLs. Furthermore, we may not be able to generate sufficient taxable income to utilize our NOLs before they expire. If any of these events occur, we may not derive some or all of the expected benefits from our NOLs. It is possible that any future ownership change could have a material effect on the use of our net operating loss carryforwards or other tax attributes, which could adversely affect our profitability. In addition, at the state level there may be periods during which the use of NOLs is suspended or otherwise limited, which would accelerate or may permanently increase state taxes owed.
Risk Factors Related to Our Industry and its Regulation
We operate in a volatile industry and government-regulated market, which makes it difficult to evaluate our future prospects and may increase the risk that we will not be successful.
The growth and development of the wind power industry in the U.S., as in much of the world, has been supported through a variety of financial incentives and subsidies offered by governmental and regulatory bodies. The reduction or removal of the availability of these incentives would likely have an adverse effect on our business and prospects. The expiration and curtailment of these incentives in the U.S. resulted in significant contraction of our distributed-class wind turbine sales in the last four years, and this market is expected to provide only a modest portion of our sales for the foreseeable future.
Since we commenced operations in August 2008, we have experienced unpredictability in our operating environment, which poses significant risk to our ability to forecast financial results and have a significant impact on our ability to sell products and services.
In the distributed wind markets, the reduced U.S. incentives contributed to a decline in our North American orders by more than 90% from 2010 to 2012. In Europe, clarification of energy feed-in-tariff regulations in the U.K. and Italy was delayed from 2011 until the middle of 2012, which resulted in delayed or lost orders. Incentives across multiple European countries, particularly Italy and the U.K., are currently stimulating demand in the European marketplace. These incentives are each subject to actions of legislative bodies in the respective jurisdictions, and there can be no assurance that incentives effectively enhancing the demand for wind power equipment will remain in place, or that any changes in policy may not serve to clarify the economic return anticipated for new wind power equipment in various jurisdictions. If governmental authorities do not continue to
26
Table of Contents
support, or reduce or eliminate their support for, the development of wind energy projects, our revenues may be adversely affected, our financing costs may increase, it may become more difficult to obtain financing, and our business and prospects may otherwise be adversely affected.
Our utility-class turbine business was also adversely affected by significantly changing governmental policies. In 2011, the U.S. Department of Energy put our application for support under its 1703 loan guarantee program on indefinite hold, curtailing our efforts to achieve federal loan support for a proposed wind farm in Michigan that was to utilize our pilot 2.3 MW turbines. This action effectively caused the cancellation of the planned $40 million sale of 13 units for this project, and contributed in part to our decision to restructure our management team and recast the strategic direction of this business in April 2012.
The unpredictable changes to government subsidies and financing sources in both the U.S. and global markets requires us to adjust our strategy to keep up with the changing landscape of favorable geographic markets. Because we have to tailor our product features to effectively suit individual target markets, the developing market requirements necessitate a significant and continued investment in design and product offerings and may require us to enter into new markets that we may not have previously considered.
Due to the volatility of the markets, we have a diversified set of products and services, including a full suite of wind products, technology licensing and power technology products, as well as renewable energy development services. This requires that a minimum level of engineering personnel be maintained, even if all personnel are not fully leveraged at points in time. The cost of maintaining this engineering team is expensive and if we are not able to achieve an adequate amount of business revenues, cash consumption could be significant and profitability delayed.
We are subject to various laws and regulations governing protection of the environment and the use of real property, and the failure to comply with, or a change to, such laws and regulations could adversely affect our business, financial condition, future results and cash flow.
We are subject to numerous federal, regional, state and local statutory and regulatory standards relating to the use, storage and disposal of hazardous substances, and protection of the environment. If we fail to comply with those statutory or regulatory standards (or any changes thereto), we could be subject to civil or criminal liability, the imposition of liens or fines, and large expenditures to bring us into compliance. We use certain substances at our Barre, Vermont facility that are or could become classified as hazardous substances. If any hazardous substances are found to have been released into the environment by us or our predecessors, or if such substances are found at our current facilities, we could become liable for the investigation and removal of those substances, regardless of their source and time of release. Furthermore, we can be held liable for the cleanup of releases of hazardous substances at other locations where we arranged for disposal of those substances, even if we did not cause the release at that location. The cost of any remediation activities in connection with a spill or other release of such substances could be significant.
In addition, private lawsuits or enforcement actions by federal, state, or foreign regulatory agencies may materially increase our costs. Certain environmental laws could make us potentially liable on a joint and several basis for the remediation of contamination at or emanating from properties or facilities that we may acquire. Although we will seek to obtain indemnities against liabilities relating to historical contamination at the facilities we own or operate, we cannot provide any assurance that we will not incur liability relating to the remediation of contamination, including contamination we did not cause.
We are also required to obtain and maintain governmental permits and approvals under environmental and other laws for the operation of our Barre, Vermont facility. Some of the governmental permits and approvals contain conditions and restrictions or may have limited terms. We may not at all times comply with all conditions established by existing permits and approvals, and we may not be able to renew, maintain, or obtain all permits and approvals required to operate our facilities. Although we believe we have obtained and are in compliance with all permits and approvals necessary for the operation of our facilities, our failure to renew, maintain, or obtain any required permits or approvals, our inability to satisfy any requirement of any permits, or a change in
27
Table of Contents
law requiring new permits or approvals, may result in increased compliance costs (including potential fines or penalties), the need for additional capital expenditures or a suspension of operations.
Our anticipated future generation assets and construction projects will be required to comply with numerous federal, regional, state, provincial and local statutory and regulatory standards and to maintain numerous licenses, permits and governmental approvals required for operation. Some of the licenses, permits and governmental approvals will contain conditions and restrictions, or may have limited terms. If these assets and projects fail to satisfy the conditions or comply with the restrictions imposed by the licenses, permits and governmental approvals, or the restrictions imposed by any statutory or regulatory requirements, they may become subject to regulatory enforcement action and the operation of the assets and projects could be adversely affected or be subject to fines, penalties or additional costs or revocation of regulatory approvals, permits or licenses. In addition, we may not be able to renew, maintain or obtain all necessary licenses, permits and governmental approvals required for the continued operation or further development of our projects, as a result of which the operation or development of our assets may be limited or suspended. Our failure to renew, maintain or obtain all necessary licenses, permits or governmental approvals may have an adverse effect on our assets, liabilities, business, financial condition, results of operations and cash flow.
We and our customers operate in a highly regulated industry.
The market for electricity generating products is heavily affected by government regulations and policies concerning the electric utility industry, as well as policies promulgated by electric utilities. These regulations and policies often relate to electricity pricing and technical interconnection of customer-owned electricity generation with the electric utility power grid, which could result in additional costs to our end-users. These regulations and policies could deter end-user purchases of wind energy products.
As legal requirements frequently change and are subject to interpretation and discretion, we may be unable to predict the demand for our products.
Additionally, we could be subject to new laws or, in certain markets, be subject to certification requirements. Any new law, rule or regulation could require additional expenditure to achieve or maintain compliance or could adversely impact our ability to generate and deliver energy. Also, operations that are not currently regulated may become subject to regulation that could result in additional cost to our business. Further, changes in wholesale market structures or rules, such as generation curtailment requirements or limitations to access the power grid, could have an adverse effect on our ability to generate revenues from our facilities.
Future demand for wind energy may be limited. Renewable energy must compete with other renewable energy sources.
While wind has been a leading source of new electrical generation capacity installed in the U.S. and Europe in recent years, the market for products that generate wind energy is still at a relatively early stage of development in the U.S. when compared to conventional sources of energy. Wind energy technology may not be suitable for widespread adoption and the reduction or termination of incentive programs in the U.S. has already had an adverse impact on our future growth in this market. If market demand for wind energy products in general, and for our products in particular, fails to develop sufficiently or in the time frame that we expect, or if an oversupply of turbines available to the market from various competitors causes a prolonged decrease in the prevailing prices for turbines, we may be unable to generate sufficient revenues to achieve and maintain profitability.
In addition to competition from other industry participants and to traditional fossil fuel sources, we face competition from other renewable energy sources such as hydro and geothermal. The competition depends on the resources available within the specific markets. Although the cost to produce clean, reliable, wind energy is becoming more competitive, we must also compete with the production of solar power, hydroelectric, geothermal, and other forms of renewable energy. However, deregulation, legislative mandates for renewable energy, and consumer preference for environmentally more benign energy sources are becoming important factors in increasing the development of wind energy projects.
28
Table of Contents
Worldwide economic conditions, and economic conditions in our primary marketplaces, could have a significant impact on our operating results and cash flows.
The U.S. and certain foreign economies primarily in Europe continue to experience a period of slow economic growth and conditions could deteriorate further. In particular, the recent credit and housing crises, the anomalous functioning of the credit markets generally in the wake of U.S. mortgage defaults, the difficulty of obtaining mortgages and construction loans, and conflicts in general could contribute to a large reduction in demand for products that require sizeable initial capital expenditures, such as our products. Other market uncertainties that may also affect our ability to generate and increase sales include the future of deregulation of the domestic electricity market, prevailing and future prices of oil and natural gas, and domestic and international policy responses to environmental issues. If current economic conditions do not improve, we may experience decreases in the demand for our products, which would harm our operating results, liquidity and cash flows.
Changes in weather patterns may affect our ability to operate our proposed projects.
Changes in weather patterns may affect our ability to operate our proposed projects. Meteorological data we collect during the development phase of a project may differ from actual results achieved after wind turbines are erected. While long-term wind patterns have not varied significantly, short-term patterns, either on a seasonal or on a year-to-year basis, may vary substantially. These variations may result in lower revenues and higher operating losses.
Risks Related to Ownership of our Common Shares
Existing executive officers, directors and holders of 5% or more of our common shares will continue to have substantial control over us, which will limit your ability to influence the outcome of important transactions, including a change in control.
Immediately following the completion of this offering, our directors, executive officers and holders of more than 5% of our common shares prior to this offering, together with their affiliates, will beneficially own, in the aggregate, approximately % of our outstanding common shares, assuming that we sell all the offered shares and also assuming no exercise of the underwriters’ option to acquire additional common shares in this offering. A limited number of these significant shareholders may have the ability to control or substantially influence all aspects of our business, including decisions regarding mergers, consolidations, the sale of all or substantially all of our assets and other significant corporate actions. This concentration of ownership may discourage, delay or prevent a change in control of our company, which could deprive our shareholders of an opportunity to receive a premium for their shares as part of a sale of our company. These actions may be taken even if they are opposed by our other shareholders.
The price of our common shares may fluctuate significantly, which may make it difficult for investors to sell such shares at a time or price they find attractive.
Our share price may fluctuate significantly as a result of a variety of factors, many of which are beyond our control. In addition to those described in “Special Note Regarding Forward-Looking Statements,” these factors include:
| • | Actual or anticipated quarterly fluctuations in our operating results and financial condition; |
| • | Changes in financial estimates or publication of research reports and recommendations by financial analysts with respect to us or other financial institutions; |
| • | Reports in the press or investment community generally or relating to our reputation or the reputation of the renewable energy industry; |
| • | Strategic actions by us or our competitors, such as acquisitions, restructurings, dispositions, or financings; |
| • | Fluctuations in the share price and operating results of our competitors; |
29
Table of Contents
| • | Future sales of our equity or equity-related securities; |
| • | Proposed or adopted regulatory changes or developments; |
| • | Domestic and international economic factors unrelated to our performance; and |
| • | General market conditions and, in particular, developments related to market conditions for the renewable energy industry. |
In addition, in recent years, the stock market in general has experienced extreme price and volume fluctuations. This volatility has had a significant effect on the market price of securities issued by many companies, including for reasons unrelated to their operating performance. These broad market fluctuations may adversely affect our share price, notwithstanding our operating results. We expect that the market price of our common shares will continue to fluctuate and there can be no assurances about the levels of the market prices for our common shares.
We do not know whether an active, liquid and orderly trading market will develop for our common shares or what the market price of our common shares will be and as a result it may be difficult for you to sell your shares.
Prior to this offering, there has been no U.S. public market for our common shares, and our common shares are not actively traded on the TSX. Although we have applied for listing on the NASDAQ Capital Market, an active trading market in the United States for our shares may never develop or be sustained. The lack of an active or liquid market may impair your ability to sell your shares at the time you wish to sell them or at a price that you consider reasonable. The lack of an active market may also reduce the fair market value of your shares. Further, an inactive market may also impair our ability to raise capital by selling our common shares and may impair our ability to enter into collaborations or acquire companies or products by using our common shares as consideration. The market price of our common shares may be volatile, and you could lose all or part of your investment.
Our common shares may become listed for trade on more than one stock exchange, and this may result in price variations.
Our common shares currently trade on the TSX. Listing our common shares on the NASDAQ Capital Market in addition to the TSX may increase share price volatility on the TSX and also result in volatility of the trading price on the NASDAQ Capital Market because trading will be split between the two markets, resulting in less liquidity on both exchanges. In addition, different liquidity levels, volume of trading, currencies and market conditions on the two exchanges may result in different prevailing trading prices. Since listing on the TSX, our common shares ranged from a low of CDN$ , or $ , based on an exchange rate of CDN$ per $1.00 as of , to a high of CDN$ , or $ , based on an exchange rate of CDN$ per $1.00 as of . There is no guarantee that the market price of the common shares will not be subject to any such fluctuations in the future.
The offering price for our common shares may bear no relationship to the price at which our common shares will trade upon the completion of this offering. The price at which our common shares will trade may be lower than the price at which they are sold in this offering. In addition, because the liquidity and trading patterns of securities listed on the TSX may be substantially different from those of securities quoted on the NASDAQ Capital Market, historical trading prices may not be indicative of the prices at which our common shares will trade in the future on the NASDAQ Capital Market. Further, there can be no assurance regarding the trading prices that will prevail on the TSX following our additional listing on the NASDAQ Capital Market.
If research analysts do not publish research about our business or if they issue unfavorable commentary or downgrade our common shares, our shares price and trading volume could decline.
The trading market for our common shares may depend in part on the research and reports that research analysts publish about us and our business. If we do not maintain adequate research coverage, or if one or more analysts who covers us downgrades our common shares, or publishes inaccurate or unfavorable research about our
30
Table of Contents
business, the price of our common shares could decline. If one or more of the research analysts ceases to cover us or fails to publish reports on us regularly, demand for our common shares could decrease, which could cause our share price or trading volume to decline.
We are an “emerging growth company,” and the reduced reporting requirements applicable to emerging growth companies may make our common shares less attractive to investors.
We are an emerging growth company. For as long as we are an emerging growth company, we may take advantage of exemptions from various reporting requirements that are applicable to other public companies that are not emerging growth companies, including not being required to comply with the auditor attestation requirements of Section 404, certain reduced disclosure obligations regarding executive compensation in our periodic reports and proxy statements and exemptions from the requirements of holding a non-binding advisory vote on executive compensation and shareholder approval of any golden parachute payments not previously approved. We could be an emerging growth company for up to five years, although circumstances could cause us to lose that status earlier, including if the market value of our shares held by non-affiliates exceeds $700 million as of any June 30 before that time, in which case we would no longer be an emerging growth company as of the following December 31. See “Prospectus Summary — Emerging Growth Company under the JOBS Act.” We cannot predict if investors will find our common shares less attractive because we may rely on these exemptions. If some investors find our common shares less attractive as a result, there may be a less active trading market for our common shares and our share price may be more volatile.
Under the JOBS Act, emerging growth companies can also delay adopting new or revised accounting standards until such standards apply to private companies. In addition, Section 107 of the JOBS Act also provides that an emerging growth company can take advantage of the extended transition period provided in Section 7(a)(2)(B) of the Securities Act for complying with new or revised accounting standards that have different effective dates for public and private companies. In other words, an emerging growth company can delay the adoption of such accounting standards until those standards would otherwise apply to private companies until the first to occur of the date the subject company (i) is no longer an emerging growth company, or (ii) affirmatively and irrevocably opt outs of the extended transition period provided in Section 7(a)(2)(B) of the Securities Act. We have elected to take advantage of the extended transition period provided in Section 7(a)(2)(B) of the Securities Act for complying with new or revised accounting standards that have different effective dates for public and private companies and, as a result, our financial statements may not be comparable to the financial statements of other public companies. In addition, we have availed ourselves of the exemption from disclosing certain executive compensation information in this prospectus pursuant to Title 1, Section 102 of the JOBS Act. We cannot predict if investors will find our common shares less attractive because we will rely on these exemptions. If some investors find our common shares less attractive as a result, there may be a less active trading market for our common shares and our share price may be more volatile.
The market price of our common shares may decline due to the large number of our authorized common shares eligible for future sale.
Sales of substantial amounts of our common shares in the public market, including the sale of the shares in this offering, or the perception that such other future sales could occur, could cause the market price of our common shares to decline. These sales could also make it more difficult for us to sell equity or equity-related securities in the future at a time and price that we deem appropriate.
As of November 30, 2014, we had an aggregate of 22,764,353 common shares outstanding. All of these shares are tradable on the TSX without restriction, subject in some cases to the expiration of lock-up agreements, as described below, and, to volume and other restrictions under the escrow requirements of the TSX.
In connection with this offering, all of our directors and executive officers, and four of our principal shareholders, Allen & Company LLC, Baker Investments, Inc., CWE LLC, and RockPort Capital Partners III, LP, will execute lock-up agreements that will prohibit sales of our common shares held by them during the 120-day period immediately following this offering, or the IPO lock-ups. Additionally, in connection with the
31
Table of Contents
RTO, each of Allen & Company LLC, Baker Investments, Inc., CWE LLC, and RockPort Capital Partners III, LP executed lock-up agreements that expire on April 21, 2015, or the RTO lock-ups. Accordingly, our directors, executive officers, and the four principal shareholders may only sell their common shares, prior to the expiration of the IPO lock-ups, with the consent of the representative of the underwriters for this offering, and these principal shareholders may not sell greater than 10% of their common shares prior to April 21, 2015, without the consent of Beacon Securities Limited pursuant to RTO lock-ups.
We may also issue common shares or securities convertible into our common shares from time to time in connection with a financing, acquisition or otherwise. Any such issuance could result in substantial dilution to our existing shareholders and cause the trading price of our common shares to decline.
You will experience immediate dilution in the book value per share of the common shares you purchase.
Since the price per share of our common shares being offered is substantially higher than the book value per share of our common shares, you will suffer dilution in the net tangible book value of the common shares you purchase in this offering. Based on a public offering of our common shares at the assumed offering price to the public of $ per share, if you purchase common shares in this offering, you will suffer immediate dilution of $ per share in the net tangible book value of the common shares. See the section entitled “Dilution” below for a more detailed discussion of the dilution you will incur if you purchase common shares in this offering.
We may issue additional equity securities, or engage in other transactions that could dilute our book value or affect the priority of the common shares, which may adversely affect the market price of our common shares.
Our board of directors may determine from time to time that we need to raise additional capital by issuing additional common shares or other securities. Except as otherwise described in this prospectus, we are not restricted from issuing additional common shares, including securities that are convertible into or exchangeable for, or that represent the right to receive, common shares. Because our decision to issue securities in any future offering will depend on market conditions and other factors beyond our control, we cannot predict or estimate the amount, timing or nature of any future offerings, or the prices at which such offerings may be affected. Additional equity offerings may dilute the holdings of our existing shareholders or reduce the market price of our common shares, or both. Holders of our common shares are not entitled to preemptive rights or other protections against dilution. New investors also may have rights, preferences and privileges that are senior to, and that adversely affect, our then-current common shareholders. Additionally, if we raise additional capital by making additional offerings of debt or preferred equity securities, upon liquidation of our company, holders of our debt or preferred equity securities, and lenders with respect to other borrowings, will receive distributions of our available assets before the holders of our common shares. Furthermore, sales of a substantial number of our common shares or other equity-related securities, or the perception that we may sell a substantial number of our common shares, could depress the market price of our common shares and impair our future ability to raise capital through the sale of additional equity securities.
We currently do not intend to pay dividends on our common shares for the foreseeable future.
We currently do not plan to declare dividends on our common shares in the foreseeable future. See “Dividend Policy” for more information. Any determination to pay dividends in the future will be at the discretion of our board of directors. Consequently, an investor’s only opportunity to achieve a return on the investment in us will be if the market price of our common shares appreciates and the investor sells our common shares at a profit. There is no guarantee that the price of our common shares that will prevail in the market will ever exceed the price that an investor pays.
We may invest or spend the proceeds of this offering in ways with which you may not agree or in ways which may not yield a return.
Our management will have broad discretion in using the net proceeds from this offering. Such proceeds are expected to be allocated between our businesses in line with management’s determinations and consistent with
32
Table of Contents
our 2015 operating plan. Investors will not have the opportunity, as part of their investment decision, to assess whether the proceeds will be used appropriately and investors may disagree with how they are used. Investors will be relying on the judgment of our management who may fail to apply such proceeds in ways that benefit the business or increase our value. If the proceeds are not applied effectively, the ability to maintain and grow the business could be impaired.
Canadian laws differ from the laws in effect in the U.S. and may afford less protection to holders of our securities.
We are a company that exists under the laws of the Province of British Columbia, Canada and are subject to the provisions of the Business Corporations Act (British Columbia), S.B.C. 2002, c.57, or the BCBCA, and applicable Canadian securities laws, which laws may differ from those governing a company formed under the laws of a U.S. jurisdiction. The provisions under the BCBCA and applicable Canadian securities laws may affect the rights of shareholders differently than those of a company governed by the laws of a U.S. jurisdiction, and may, together with our articles of association, have the effect of delaying, deferring or discouraging another party from acquiring control of our company by means of a tender offer, a proxy contest or otherwise, or may affect the price an acquiring party would be willing to offer in such an instance. See “Material Differences between the BCBCA and the DGCL.”
We may be subject to penny stock rules, the application of which may adversely affect shareholder liquidity and the marketability of our shares.
Though we do not anticipate our common shares being classified as a penny stock, it is possible that in the future our common shares may be treated as a penny stock under applicable SEC Rules. A stock is considered a “penny stock” if it fails to meets one or more of the exclusions from that definition in Rule 3a51-1 promulgated under the Exchange Act. For instance, our common shares could be treated as a penny stock if we fail to obtain a listing on, or are delisted from, The NASDAQ Stock Market and the price of our common shares drops below $5.00 per share.
The Exchange Act and such penny stock rules generally impose additional sales practice and disclosure requirements on broker dealers who sell our securities to persons other than accredited investors, who are, generally, institutions with assets in excess of $5,000,000, or individuals with net worth in excess of $1,000,000 or annual income exceeding $200,000 or $300,000 jointly with spouse, or in transactions not recommended by the broker-dealer.
The principal result or effect of being designated a “penny stock” is that securities broker-dealers cannot recommend the shares but must trade it on an unsolicited basis. Penny stock rules require a broker-dealer, prior to a transaction in a penny stock not otherwise exempt from those rules, to deliver a standardized risk disclosure document prepared by the SEC, which specifies information about penny stocks and the nature and significance of risks of the penny stock market. A broker-dealer must also provide the customer with bid and offer quotations for the penny stock, the compensation of the broker-dealer and sales person in the transaction, and monthly account statements indicating the market value of each penny stock held in the customer’s account. In addition, the penny stock rules require that, prior to a transaction in a penny stock not otherwise exempt from those rules, the broker-dealer must make a special written determination that the penny stock is a suitable investment for the purchaser and receive the purchaser’s written agreement to the transaction. These disclosure requirements may have the effect of reducing the trading activity in the secondary market for shares that become subject to those penny stock rules. If a trading market for our common shares develops, our common shares may become subject to the penny stock rules, and shareholders may have difficulty in selling their shares.
33
Table of Contents
SPECIAL NOTE REGARDING FORWARD-LOOKING STATEMENTS
This prospectus contains forward-looking statements within the meaning of the federal securities laws, which statements involve substantial risks and uncertainties. Forward-looking statements generally relate to future events or our future financial or operating performance. You can generally identify forward-looking statements because they contain words such as “may,” “will,” “should,” “expects,” “plans,” “anticipates,” “could,” “intends,” “target,” “projects,” “contemplates,” “believes,” “estimates,” “predicts,” “potential” or “continue” or the negative of these terms or other similar expressions that concern our expectations, strategy, plans or intentions. We have based these forward-looking statements largely on our current expectations and projections about future events and trends that we believe may affect our business, financial condition or results of operations. The outcome of the events described in these forward-looking statements is subject to risks, uncertainties and other factors described in “Risk Factors” and elsewhere in this prospectus. Accordingly, you should not rely upon forward-looking statements as predictions of future events. We cannot assure you that the results, events and circumstances reflected in the forward-looking statements will be achieved or occur, and actual results, events or circumstances could differ materially from those projected in the forward-looking statements. Forward-looking statements contained in this prospectus include statements about:
| • | our expectations related to the use of proceeds from this offering; |
| • | our ability to compete with other companies that are developing or selling products and services that are competitive with ours; |
| • | our ability to grow our active customer base; |
| • | our expectations on growth in our target markets; |
| • | our plans to continue to invest in and develop technology and services for our markets; |
| • | our ability to establish new partnerships; |
| • | our ability to expand into new markets; |
| • | our ability to maintain or source third-party manufacturing and supply chains; |
| • | the timing of expected introductions of new or enhanced services; |
| • | our ability to attract and retain key personnel; and |
| • | other factors discussed elsewhere in this prospectus. |
We caution you that the foregoing list may not contain all of the forward-looking statements made in this prospectus. In addition, in light of these risks and uncertainties, the matters referred to in the forward-looking statements contained in this prospectus may not occur.
The forward-looking statements made in this prospectus relate only to events as of the date on which the statements are made. We undertake no obligation to update any forward-looking statement to reflect events or circumstances after the date on which the statement is made or to reflect the occurrence of unanticipated events. We may not actually achieve the plans, intentions or expectations disclosed in our forward-looking statements and you should not place undue reliance on our forward-looking statements. Our forward-looking statements do not reflect the potential impact of any future acquisitions, mergers, dispositions, joint ventures or investments we may make. We do not assume any obligation to update any forward-looking statements, whether as a result of new information, future events or otherwise, except as required by law.
This prospectus also contains statistical data, estimates and forecasts that are based on independent industry publications or other publicly available information, while other information is based on our internal sources. Although we believe that these third-party sources referred to in this prospectus are reliable, neither we nor the underwriters have independently verified the information provided by these third parties. While we are not aware of any misstatements regarding any third-party information presented in this prospectus, their estimates, in particular, as they relate to projections, involve numerous assumptions, are subject to risks and uncertainties, and are subject to change based on various factors, including those discussed under “Risk Factors.”
34
Table of Contents
We estimate that the net proceeds from the sale of common shares in this offering will be approximately $ , based on an assumed offering price of $ per share, and after deducting estimated underwriting discounts and commissions and estimated offering expenses. If the underwriters’ option to purchase additional shares from us is exercised in full, we estimate that we will receive additional net proceeds of $ .
The principal purposes of this offering are to raise additional capital, to create a U.S. public market for our common shares and to facilitate our future access to the U.S. public equity markets.
We currently intend to use the net proceeds from the securities sold by us in the offering to advance the commercialization of our sales of utility-class wind turbines into underserved smaller scale wind farms, including potential minority investment into the development of a limited number of wind farms where we expect to deploy our utility class turbines, as well as for general corporate purposes, including working capital.
The amounts and timing of our actual expenditures may vary significantly from our expectations depending upon numerous factors, including the progress of our sales efforts, our operating costs and capital expenditures and the other factors described under “Risk Factors” in this prospectus. Accordingly, we will retain broad discretion to allocate the net proceeds of this offering among the identified uses described above, and we reserve the right to change the use of the net proceeds or the allocation of the net proceeds among the uses described above. Pending application of the net proceeds, the net proceeds of this offering will be deposited in interest bearing accounts or invested in certificates of deposit, U.S. government obligations or other short-term debt instruments selected at our discretion.
We have never declared or paid cash dividends on our common shares. We currently intend to retain any future earnings and do not expect to pay any dividends in the foreseeable future. Any determination to pay dividends in the future will be at the discretion of our board of directors and will be dependent on a number of factors, including our earnings, capital requirements and overall financial condition. Currently, our line of credit prohibits the payment of any dividends without obtaining our lender’s prior written consent, other than dividends payable solely in our common shares.
35
Table of Contents
The following table sets forth our capitalization as of September 30, 2014, on:
| • | an actual basis; |
| • | on a pro forma basis to reflect the conversion of all outstanding shares of our Class B restricted voting common shares into 7,840,582 shares of our voting common shares effected on November 30, 2014; and |
| • | on a pro forma, as adjusted basis to reflect the pro forma adjustments described above and to give further effect to the sale of shares of common shares in this offering at an assumed initial public offering price of $ per share, after deducting estimated underwriting discounts and commissions and estimated offering expenses. |
You should read this table in conjunction with “Selected Consolidated Financial Data” and “Management’s Discussion and Analysis of Financial Condition and Results of Operations” and our consolidated financial statements and related notes included elsewhere in this prospectus.
| As of September 30, 2014 | ||||||||||||
| Actual | Pro forma | Pro forma, as adjusted |
||||||||||
| (In thousands) | ||||||||||||
| Voting common shares, no par value — Unlimited shares authorized, and 14,893,981 shares issued and outstanding as of September 30, 2014. |
$ | 87,205 | $ | 165,339 | ||||||||
| Class B restricted voting common shares, no par value — Unlimited shares authorized, and 7,840,582 shares issued and outstanding as of September 30, 2014. |
78,134 | — | ||||||||||
| Additional paid-in capital |
7,831 | 7,831 | ||||||||||
| Accumulated deficit |
(156,811 | ) | (156,811 | ) | ||||||||
|
|
|
|
|
|
|
|||||||
| Total Shareholders’ Equity |
16,359 | 16,359 | ||||||||||
|
|
|
|
|
|
|
|||||||
| Total Capitalization |
$ | 16,359 | $ | 16,359 | $ | |||||||
|
|
|
|
|
|
|
|||||||
The number of common shares issued and outstanding actual and as adjusted in the table above excludes the following shares:
| • | 2,057,810 common shares issuable upon exercise of share options outstanding as of September 30, 2014 at a weighted average exercise price of $2.05 per share; and |
| • | 1,924,131 common shares reserved for future issuance under our 2014 Stock Option and Incentive Plan, and any future increase in shares reserved for issuance under such plan. |
36
Table of Contents
If you invest in our common shares in this offering, your interest will be diluted immediately to the extent of the difference between the offering price per share of our common shares and the pro forma, as adjusted net tangible book value per share of our common shares after this offering. Our pro forma net tangible book value as of September 30, 2014 was $ million, or $ per share of our common shares. Pro forma net tangible book value per share of our common shares represents the amount of our total tangible assets less our total liabilities, divided by the number of common shares outstanding as of September 30, 2014.
After giving effect to the sale of common shares by us at the assumed public offering price of $ per share, after deducting estimated underwriting discounts and commissions and estimated offering expenses, our pro forma net tangible book value at September 30, 2014 would have been approximately $ , or $ per share. This would represent an immediate increase in the net tangible book value of $ per share to existing shareholders and an immediate dilution of $ per share to investors in this offering. The following table illustrates this per share dilution:
| Assumed public offering price per share |
$ | |||
| Pro forma net tangible book value per share as of September 30, 2014 |
||||
| Increase per share attributable to this offering |
||||
| As adjusted net tangible book value per share after giving effect to this offering |
||||
| Dilution per share to new investors |
Each $0.50 increase or decrease in an assumed public offering price of $ per share would increase or decrease, as applicable, our pro forma net tangible book value per share to new investors by $ , and would increase or decrease, as applicable, dilution per share to new investors in this offering by $ , assuming that the number of shares offered by us, as set forth on the cover page of this prospectus, remains the same and after deducting estimated underwriting discounts and commissions and estimated offering expenses. In addition, to the extent any outstanding options to purchase common shares are exercised, new investors would experience further dilution. If the underwriters exercise their option to purchase additional shares from us in full, the pro forma net tangible book value per share of our common shares immediately after this offering would be $ per share, and the dilution in pro forma net tangible book value per share of our common shares to new investors in this offering would be $ per share.
The following table presents, on a pro forma basis as of September 30, 2014, the differences between the existing shareholders and the new investors purchasing our common shares in this offering with respect to the number of shares purchased from us, the total consideration paid or to be paid to us, which includes net proceeds received from the issuance of common shares, cash received from the exercise of share options and the average price per share paid or to be paid to us at the public offering price of $ per share, before deducting estimated underwriting discounts and commissions and estimated offering expenses:
| Shares Purchased | Total Consideration | Average Price Per Share |
||||||||||||||||||
| Number | Percent | Amount | Percent | |||||||||||||||||
| Existing shareholders |
22,734,563 | % | $ | 165,338,965 | % | $ | 7.27 | |||||||||||||
| New investors |
% | $ | % | $ | ||||||||||||||||
Each $0.50 increase or decrease in the assumed public offering price of $ per share, would increase or decrease, as applicable, the total consideration paid by new investors and total consideration paid by all shareholders by approximately $ , assuming that the number of shares offered, as set forth on the cover page of this prospectus, remains the same and after deducting estimated underwriting discounts and commissions and estimated offering expenses. In addition, to the extent any outstanding options to purchase common shares are exercised, new investors will experience further dilution.
37
Table of Contents
Assuming the underwriters’ option to purchase additional shares is exercised in full, sales in this offering will reduce the percentage of shares held by existing shareholders to % and will increase the number of shares held by our new investors to shares, or %, assuming no purchases of our common shares by existing shareholders in this offering. If the underwriters exercise in full their option to purchase an additional common shares at the public offering price of $ per share, the as adjusted net tangible book value after this offering would be approximately $ per share, representing an increase in net tangible book value of approximately $ per share to existing shareholders and immediate dilution in net tangible book value of approximately $ per share to new investors purchasing our common shares in this offering at the public offering price.
The number of common shares issued and outstanding actual and as adjusted in the table above excludes the following shares:
| • | 2,057,810 common shares issuable upon exercise of share options outstanding as of September 30, 2014 at a weighted average exercise price of $2.05 per share; and |
| • | 1,924,131 common shares reserved for future issuance under our 2014 Stock Option and Incentive Plan, and any future increase in shares reserved for issuance under such plan. |
38
Table of Contents
SELECTED CONSOLIDATED FINANCIAL AND OTHER DATA
The following selected consolidated financial and other data regarding our business should be read in conjunction with, and are qualified by reference to, “Management’s Discussion and Analysis of Financial Condition and Results of Operations” and our consolidated financial statements and related notes included elsewhere in this prospectus. We derived the consolidated statement of operations data for 2013 and 2012 and the consolidated balance sheet data as of December 31, 2013 and 2012 from our audited consolidated financial statements included elsewhere in this prospectus. We derived the unaudited consolidated statement of operations data for the nine months ended September 30, 2014 and 2013, as well as the unaudited consolidated balance sheet data at September 30, 2014, from our unaudited interim condensed consolidated financial statements included elsewhere in this prospectus. The unaudited interim consolidated financial statements have been prepared on the same basis as the audited condensed consolidated financial statements and reflect all adjustments, consisting only of normal recurring adjustments, necessary for a fair presentation of the financial information set forth in those statements. Our historical results are not necessarily indicative of results to be expected in any future period, and results for the nine months ended September 30, 2014 are not necessarily indicative of results to be expected for the full year ending December 31, 2014 or any other period.
| Year Ended December 31, |
Nine Months Ended September 30, |
|||||||||||||||
| 2013 | 2012 | 2014 | 2013 | |||||||||||||
| (In thousands, except share and per share amounts) | (unaudited) | |||||||||||||||
| Consolidated Statement of Operations Data: |
||||||||||||||||
| REVENUES: |
||||||||||||||||
| Product |
$ | 19,142 | $ | 16,509 | $ | 37,484 | $ | 9,858 | ||||||||
| License |
— | 10,000 | 2,541 | — | ||||||||||||
| Design service |
522 | — | 1,063 | 522 | ||||||||||||
| Service |
934 | 891 | 1,470 | 1,220 | ||||||||||||
|
|
|
|
|
|
|
|
|
|||||||||
| Total revenues |
20,598 | 27,400 | 42,558 | 11,600 | ||||||||||||
|
|
|
|
|
|
|
|
|
|||||||||
| COSTS OF REVENUE AND OPERATING EXPENSES: |
||||||||||||||||
| Cost of product revenues |
16,346 | 15,968 | 31,154 | 8,905 | ||||||||||||
| Cost of service and design service revenues |
3,012 | 3,205 | 3,171 | 2,207 | ||||||||||||
| Sales and marketing |
2,977 | 2,902 | 2,668 | 2,044 | ||||||||||||
| Research and development |
4,238 | 4,260 | 3,537 | 2,845 | ||||||||||||
| General and administrative |
6,938 | 7,126 | 6,793 | 4,729 | ||||||||||||
| Assets held for sale loss |
768 | — | — | — | ||||||||||||
| Restructuring charges |
70 | 2,145 | — | 23 | ||||||||||||
| Impairment of certain long-lived assets |
— | 1,451 | — | — | ||||||||||||
|
|
|
|
|
|
|
|
|
|||||||||
| Total costs of revenue and operating expense |
34,349 | 37,057 | 47,323 | 20,753 | ||||||||||||
|
|
|
|
|
|
|
|
|
|||||||||
| Loss from operations |
(13,751 | ) | (9,657 | ) | (4,765 | ) | (9,153 | ) | ||||||||
| Change in fair value of warrants |
172 | 4,545 | — | 173 | ||||||||||||
| Interest income |
— | — | 5 | — | ||||||||||||
| Interest expense |
(514 | ) | (88 | ) | (317 | ) | (230 | ) | ||||||||
| Other income (expense) — net |
— | — | 41 | (36 | ) | |||||||||||
|
|
|
|
|
|
|
|
|
|||||||||
| Loss before provision for income taxes |
(14,093 | ) | (5,200 | ) | (5,036 | ) | (9,246 | ) | ||||||||
| Provision for income taxes |
35 | 1,014 | 441 | 13 | ||||||||||||
|
|
|
|
|
|
|
|
|
|||||||||
| Net Loss |
(14,128 | ) | (6,214 | ) | (5,477 | ) | (9,259 | ) | ||||||||
| Other comprehensive income (loss) |
||||||||||||||||
| Foreign currency translation adjustment |
— | (2 | ) | — | — | |||||||||||
|
|
|
|
|
|
|
|
|
|||||||||
| Comprehensive Loss |
$ | (14,128 | ) | $ | (6,216 | ) | $ | (5,477 | ) | $ | (9,259 | ) | ||||
|
|
|
|
|
|
|
|
|
|||||||||
| Net loss applicable to common shareholders |
$ | (17,815 | ) | $ | (12,388 | ) | $ | (5,477 | ) | $ | (12,946 | ) | ||||
| Net loss per share |
||||||||||||||||
| Basic and diluted |
$ | (4.60 | ) | $ | (821.92 | ) | $ | (0.29 | ) | $ | (15.21 | ) | ||||
| Weighted average number of common shares outstanding |
||||||||||||||||
| Basic and diluted |
3,872,895 | 15,072 | 18,919,146 | 850,950 | ||||||||||||
| Pro forma net loss per share |
||||||||||||||||
| Basic and diluted(1) |
$ | (0.29 | ) | |||||||||||||
| Pro forma weighted-average number of common shares outstanding |
||||||||||||||||
| Basic and diluted(1) |
18,919,146 | |||||||||||||||
| (1) | Pro forma basic and diluted net loss per share has been computed to give effect to the conversion of all outstanding shares of our Class B restricted voting common shares into 7,840,582 shares of our voting common shares, effected on November 30, 2014. |
39
Table of Contents
| Year Ended December 31, | Nine Months Ended September 30, |
|||||||||||||||
| 2013 | 2012 | 2014 | 2013 | |||||||||||||
| (In thousands) | (unaudited) | |||||||||||||||
| Share-based compensation expense: |
||||||||||||||||
| Cost of revenue |
$ | 71 | $ | 143 | $ | 72 | $ | 29 | ||||||||
| Sales and marketing |
43 | 87 | 68 | 12 | ||||||||||||
| Research and development |
68 | 18 | — | 37 | ||||||||||||
| General and administrative |
519 | 723 | 606 | 186 | ||||||||||||
|
|
|
|
|
|
|
|
|
|||||||||
| Total share-based compensation |
701 | 971 | 746 | 264 | ||||||||||||
| Restructuring charges |
75 | 522 | — | 23 | ||||||||||||
|
|
|
|
|
|
|
|
|
|||||||||
| Total share-based compensation |
$ | 776 | $ | 1,493 | $ | 746 | $ | 287 | ||||||||
|
|
|
|
|
|
|
|
|
|||||||||
| As of December 31, | As of September 30, |
|||||||||||
| 2013 | 2012 | 2014 | ||||||||||
| (In thousands) | (unaudited) | |||||||||||
| Consolidated Balance Sheets: |
||||||||||||
| Cash |
$ | 4,534 | $ | 4,456 | $ | 16,318 | ||||||
| Accounts receivable |
1,961 | 1,161 | 5,850 | |||||||||
| Property, plant and equipment — net |
1,414 | 1,900 | 1,624 | |||||||||
| Asset held for sale |
1,300 | 2,077 | — | |||||||||
| Working capital (deficiency) |
(4,134 | ) | 3,592 | 14,922 | ||||||||
| Total assets |
27,545 | 20,026 | 43,030 | |||||||||
| Convertible preferred stock |
— | 135,073 | — | |||||||||
| Total shareholders’ equity (deficiency) |
$ | (11,402 | ) | $ | 4,246 | $ | 16,359 | |||||
40
Table of Contents
MANAGEMENT’S DISCUSSION AND ANALYSIS OF
FINANCIAL CONDITION AND RESULTS OF OPERATIONS
You should read the following discussion and analysis of our financial condition and results of operations in conjunction with our unaudited interim financial statements and audited consolidated financial statements and the related notes included. This discussion contains forward-looking statements that involve risks and uncertainties. Our actual results and the timing of selected events could differ materially from those anticipated in these forward-looking statements as a result of various factors, including those set forth under “Risk Factors” and elsewhere.
Overview
We are a growing provider of advanced renewable power creation and power conversion technology for the energy sector. We design, manufacture and service next-generation Permanent Magnet Direct-Drive, or PMDD, wind turbines for the distributed wind market, and we currently license our utility-class wind turbine platform, which uses the same PMDD technology as our distributed turbines, to large manufacturers on a global basis. We also provide technology development services for a wide variety of energy applications. With our predecessor companies dating back to 1974 and our new turbine development since 1977, we have decades of experience in developing advanced, innovative wind turbines, as well as technology for power conversion and integration with other energy applications. Since 2008, we have invested more than $130 million in developing and commercializing our wind turbine platforms.
Our PMDD wind turbine technology is based on a simplified architecture that utilizes a unique combination of a permanent magnet generator and direct-drive design. The permanent magnet generator provides higher efficiency and higher energy capture than units that utilize a traditional gearbox design. Importantly, the direct-drive design of our turbine utilizes significantly fewer moving parts than traditional geared turbines, which increases reliability due to reduced maintenance and downtime costs.
The substantial majority of our current sales are in the small wind subset of the distributed wind market, which commonly consists of turbines with rated capacities of 500 kW output or smaller. Since the introduction of our second generation 60 kW and 100 kW PMDD wind turbines in late 2008, we have shipped over 400 of these turbines and as of September 30, 2014, we have orders approximating $33 million in backlog for our second and third generation turbines. To date, these shipped units have run for over six million hours in the aggregate.
We have developed a 2 MW turbine platform based upon our PMDD technology and launched in 2013 a strategy of partnering with large-scale manufacturers in developing regions, starting with a multi-billion dollar (in revenue) industrial equipment manufacturer based in Brazil (WEG Equipamentos Elétricos S.A., or WEG). We have licensed our technology to WEG exclusively for Brazil, but retain our right to sell Northern Power-branded utility-class turbines produced by WEG on a rest-of-world basis. WEG has executed a backlog of orders comprising over 300 MW of turbine installations for the sale of turbines built using our design, eleven of which have been installed to date in Brazil. We are also seeking a limited number of similar partnership structures in other regional geographies, through which we intend that other large-scale manufacturers will produce and sell turbines for their domestic market and make available to us the supply of turbines to expand our regional ability to sell such turbines. We believe this approach will allow us to participate in the utility-class wind turbine market without a significant investment in capital equipment that would otherwise be required. Our direct sales strategy for utility-class wind turbines is directed primarily towards North America and focuses on underserved, smaller scale wind projects such as those generating 50 MW or less. As part of our market entry plan, we intend to be a minority investor in the development of a limited number of these wind power projects to ensure initial sales of our utility-class turbines. After a number of these installations, we plan to participate in the same utility wind marketplace solely by selling the turbines without providing any investment. We also intend to expand our sales and marketing capabilities to execute this strategy.
In addition to wind turbine development, we provide technology development services to customers to develop products and technology for a variety of complex energy applications, including energy storage, microgrids, and
41
Table of Contents
grid stabilization. While the customer owns the developed technology for a limited field of use, we typically maintain a license for all other applications and all other markets. As of November 30, 2014, we have deployed over 100 MW of products based on this technology and intend to commercialize sales of these products outside of the wind industry. While we do not expect material revenue from these services, they fund the expansion of our intellectual property portfolio.
For the nine months ended September 30, 2014 and 2013 and the year ended December 31, 2013, we generated $42.6 million, $11.6 million, and $20.6 million in revenue, respectively. For the nine months ended September 30, 2014 and 2013 and the year ended December 31, 2013 we incurred net losses of $5.5 million, $9.3 million and $14.1 million, respectively. We have an accumulated deficit of $156.8 million as of September 30, 2014.
We are headquartered in Barre, Vermont and lease additional office space in Waltham, Massachusetts, Zurich, Switzerland, and Bari, Italy.
We were originally incorporated in Delaware on August 12, 2008 as Wind Power Holdings, Inc., or WPHI. In February 2014, WPHI filed a Registration Statement on Form 10 (File No. 001-36317) with the Securities and Exchange Commission to register the shares of common stock of WPHI, which became effective on June 3, 2014. On April 16, 2014, we (as WPHI) completed a reverse takeover transaction, or RTO, with Mira III Acquisition Corp., a Canadian capital pool company incorporated in British Columbia, Canada, or Mira III, whereby all of the equity securities of WPHI were exchanged (as described below) for common shares and restricted voting shares of Mira III, which became the holding company of our corporate group. In connection with the RTO, Mira III changed its name to Northern Power Systems Corp., the WPHI business became Mira III’s operating business, the WPHI directors and officers became Mira III’s directors and officers, and the WPHI historical consolidated financial statements included in this prospectus became the historical consolidated financial statements of Northern Power Systems Corp. Also in connection with the RTO, we completed a CDN$24.5 million private placement whereby we issued 6,125,000 subscription receipts.
Immediately prior to the RTO, the shares of common stock of WPHI, or WPHI Shares, were consolidated on a 1.557612-to-1 basis and then all of WPHI’s outstanding senior secured convertible notes automatically converted into an aggregate of 3,384,755 WPHI Shares. Additionally, each subscription receipt issued in the private placement converted into one WPHI Share.
In connection with the RTO, each WPHI Share held by U.S. residents who are accredited investors were exchanged for 0.72742473 of our restricted voting shares and 0.27257527 of our common shares. All other issued and outstanding WPHI Shares were exchanged for our common shares on a 1-to-1 basis. Additionally, all outstanding options to purchase WPHI Shares were exchanged and cancelled for options to purchase our common shares on a 1-to-1 basis with terms substantially the same to the options being exchanged.
Upon completion of the RTO, Northern Power Systems Corp. succeeded to WPHI’s status as a reporting company under the U.S. Securities Exchange Act of 1934, as amended, or the Exchange Act, which permits us to continue to prepare our financial statements in accordance with generally accepted accounting principles in the U.S., or GAAP. In connection with the RTO, our common shares were listed on the Toronto Stock Exchange under the symbol “NPS.” You may access our periodic reports and other SEC filings on EDGAR or on our website www.northernpower.com, which also provides links to our Canadian securities filings on SEDAR and the SEC filings of our predecessor reporting company Wind Power Holdings, Inc. on EDGAR. This is a textual reference only. We do not incorporate the information on, or accessible through, our website into this prospectus, and you should not consider any information on, or that can be access through, our website as part of this prospectus.
42
Table of Contents
How We Conduct Our Business
We manage our business under four business segments:
| • | Product Sales and Service — Included in this business line are our sales of distributed-class turbines along with related services, other products produced and sold to customers, as well as in the future our direct sales of utility-class turbines. This business line reflects 92% and 97% of our revenues for the nine months ended September 30, 2014 and the year ended December 31, 2013, respectively. |
| • | Technology Licensing — Included in this business line is the licensing of packages of our developed technology. This business line reflects 6% and 0% of our revenues for the nine months ended September 30, 2014 and the year ended December 31, 2013, respectively. |
| • | Technology Development — Included in this business line is our development of technology for specific customer needs. This business line reflects 2% and 3% of our revenues for the nine months ended September 30, 2014 and the year ended December 31, 2013, respectively. |
| • | Shared Services — These costs and expenses are comprised mainly of the general and administrative departments including executive, finance and accounting, legal, human resources, and information technology support, as well as certain shared engineering, and in certain circumstances, sales and marketing activities. |
We have certain customer segments that are specific to each of our business offerings but we also have customers that see significant value in our ability to bring full suite licensing, development and prototype production of projects and could therefore leverage offerings across all of these capabilities.
Our international revenue was $37.5 million, $16.1 million and $23.7 million for the nine months ended September 30, 2014 and the years ended December 31, 2013 and 2012, respectively, representing 88%, 78% and 87% of our revenues for those periods, respectively. We expect the majority of our revenue to continue to be outside of the U.S. for the foreseeable future. A significant portion of our revenues continue to be denominated in a currency other than our reporting currency, the U.S. dollar, which decreased to 33% of total revenues for nine months ended September 30, 2014 as compared to 45% of total revenues for the year ended December 31, 2013. We expect to see an increasing proportion of our revenues denominated in euro and other non-U.S. dollar currencies over time as we continue to expand our international sales. We do not currently use any instruments to hedge our currency risk, which could therefore subject our results to variation in performance from the fluctuation of such currencies. In the future, we may consider employing hedging strategies to reduce currency fluctuation risk.
How We Evaluate Our Operations
In managing our business we use a variety of financial and operational metrics to assess our performance, including:
| • | Backlog value of our offerings; |
| • | Deferred revenues; |
| • | Segment revenue, gross profits and income (loss) from operations; and |
| • | Non-GAAP adjusted EBITDA. |
Backlog Value of Our Offerings
We track the value of turbine product orders executed with our customers during a period, as well as the cumulative balance of backlog for all of our offerings as leading indicators of our revenue performance. We consider an order executed when a contract has been duly signed and a deposit for such contract has been received.
| • | Turbine Sales — We determine order value for our turbine backlog as the turbine sale price along with our best estimate of other services expected to be rendered, such as shipping, installation and other |
43
Table of Contents
| services to ensure the effective initial operation of the turbine. Our backlog of orders for distributed turbines generally, but not always, converts to revenue within a one year period. The timing of such revenue recognition is impacted by customer specific installation conditions such as site preparation and readiness by local utilities for grid connection. In our backlog, we do not include the value of subsequent services such as operations and maintenance support that we might provide for such turbines. |
| • | Other Product Sales — We track order value of other products that we sell based upon our proprietary technologies in aggregate. Other products include non-turbine products such as maintenance kits, generators and converters we assemble and sell to customers. |
Deferred Revenues
We believe that deferred revenue is a leading indicator of our revenue performance. We present values on our balance sheet as deferred revenue at such time as cash has been collected from our customer and certain aspects of the earnings process have been completed but recognition as revenue has not been achieved in conformity with GAAP. Each of our three customer facing lines typically has deferred revenue balances, including:
| • | Product Sales and Services — When sales of our products involve transferring title of the equipment at delivery, which we have determined to be the correct point for recognition of revenue, we present products which have been produced and shipped but not delivered as deferred revenue. We also defer the recognition of revenue for our operations and maintenance services that are performed over a period of time; revenue from such contracts is recognized ratably over the contract period. We present cash values collected from customers of such contracts, net of the related recognized revenue, as deferred revenue. |
| • | Technology Licensing and Technology Development — Our license and technology development agreements frequently result in our collection of cash for our delivery of certain milestones; however, such milestones do not always reflect the culmination of the earnings process and we therefore present the related cash collections as deferred revenue. |
Segment Revenues, Gross Profits and Income (Loss) from Operations
We define segment gross profit as segment revenues less certain direct cost of sales and services. We define segment income (loss) from operations as segment gross profit less operating expenses excluding non-cash items such as depreciation, amortization, impairments, share-based compensation or restructuring charges. We use these profitability measures internally to track our business performance.
Non-GAAP adjusted EBITDA
We define non-GAAP adjusted EBITDA as earnings before interest expense, income taxes, depreciation, amortization, non-cash compensation expense, changes in the fair valuation of certain liability classified instruments, and certain other one-time non-cash charges.
Non-GAAP adjusted EBITDA is a key financial measure used by our management and by external users of our financial statements, such as investors, commercial banks and others, to:
| • | assess our operating performance as compared to that of other companies in our industry, without regard to financing methods, capital structure or historical cost basis; |
| • | assess our ability to incur and service debt and fund capital expenditures; and |
| • | generate future operating plans and make strategic decisions. |
Non-GAAP adjusted EBITDA should not be considered an alternative to net income, operating income, net cash provided by operating activities or any other measure of financial performance or liquidity presented in
44
Table of Contents
accordance with GAAP. Our non-GAAP adjusted EBITDA may not be comparable to similarly titled measures of another company because all companies may not calculate non-GAAP adjusted EBITDA in the same manner. Some of the limitations in non-GAAP adjusted EBITDA are:
| • | although depreciation and amortization are non-cash charges, the assets being depreciated and amortized may have to be replaced in the future; |
| • | non-GAAP adjusted EBITDA does not reflect changes in, or cash requirements for, our working capital needs; |
| • | non-GAAP adjusted EBITDA does not include the impact of share-based compensation; |
| • | non-GAAP adjusted EBITDA does not reflect income tax payments that may represent a reduction in cash available to us; and |
| • | other companies, including companies in our industry, may calculate non-GAAP adjusted EBITDA differently or not at all, which reduces its usefulness as a comparative measure. |
We believe it is useful to exclude non-cash charges, such as depreciation and amortization and share-based compensation, from our non-GAAP adjusted EBITDA because the amount of such expenses in any specific period may not directly correlate to the underlying performance of our business operations.
Because of the aforementioned limitations, you should consider non-GAAP adjusted EBITDA alongside other financial performance measures, including net income (loss), cash flow metrics and our financial results presented in accordance with GAAP.
Factors Affecting Our Results of Operations
We believe that the most significant factors that affect our financial performance and results of operations are as follows:
Demand for Renewable Energy and Specifically for Wind Power Energy
Changes in prices of oil, coal, natural gas and other conventional energy sources influence the demand for electricity and for renewable energy sources. Our business expansion and revenue growth has depended, and will continue to depend, on demand for renewable energy, specifically wind power energy products and future growth of the wind turbine market which will be affected by the growth of the global and regional economies, the stability of financial markets and the ability of wind turbine manufacturers to further expand production capacity and reduce manufacturing costs.
Wind Turbine Sales to Customers
We began commercial delivery of our platform of distributed-class wind turbines in 2008. We recognize revenue based on the value of the turbine product when title is transferred assuming all other criteria for revenue recognition have been met.
Consequently, our results of operations have been and will continue to be significantly affected by the number of units of wind turbines we sell and the timing of revenue recognition on such sales at any given period. In addition, since certain of our wind turbine products are sold at different prices and we are developing other models of wind turbines, we expect changes to our product mix will also affect our results of operations and margins.
Government Policies Including Incentives, Tariffs, Taxes and Duties Affecting the Wind Power Sector
Government incentives continue to be one of the main drivers for developing wind energy technology and increasing capacity. Although government support programs differ from country to country, a number of
45
Table of Contents
countries have implemented incentive schemes, thus providing various types of subsidies to wind power developers and long-term tariffs. Historically, we and our customers have benefited from fiscal benefits applicable to investments in the wind power industry by federal, state and local governments in the U.S. and Europe. Changes in these policies have affected, and will continue to affect, the investment plans of our customers and us, as well as our business, financial condition and results of operations.
Currently there are certain feed-in-tariff regimes in Italy and the U.K. supporting the installation and operation of distributed-class wind turbines. Since these regimes were clarified recently relative to the sales cycles of our turbines and our distributed-class turbines are well suited for these installations, our orders for distributed-class turbines have increased in 2013 and 2014 as compared to prior periods. Published information from the U.K. indicates that the feed-in-tariff rates have declined by 10% as of October 2014 and may decline further in April 2015. Italian feed-in-tariff rates are not expected to change through 2015. Recent indications provided by the Italian authorities indicate the feed-in-tariff may be extended until 2020. Our third generation distributed turbine offers customers meaningfully improved economics that make the turbines more relevant for regions that do not have economic incentives. As we continue sales in our core markets we expect to continue to expand our product offering and sales force to increase our sales in other regions.
Development of the Distributed Wind Market
Applications for distributed energy, and as a subset distributed wind, continue to evolve globally. Many regions of the world have notable proportions of their population with either no access to electrical power or with unstable power access. It is important to the growth of our business to have offerings that are well suited to support such distributed energy needs. We expect to continue to invest in both research and development to refine our distributed-class turbine offerings as well as in our sales force to develop opportunities globally for the sales of our turbines.
International Expansion
We intend to invest in the expansion of our international sales and marketing efforts as we see opportunities for us to expand direct turbine sales, and technology licensing and development offerings. Certain regions are expanding wind power as a source of energy driven either by the natural cost of energy in such regions or by certain incentive regimes. We currently derive a significant proportion of our revenues outside of the U.S., and we expect this to continue. We currently intend to increase our sales and marketing investment on targeted regions with strong wind resource within any of Asia, Europe, and North America.
Pricing of Wind Turbines
Pricing of our wind turbines is principally affected by the overall demand and supply in the wind power equipment industry and by the average wind turbine manufacturing cost. We price our wind turbines with reference to the prevailing market prices when we enter into sales contracts with our customers, taking into consideration our estimated costs and an appropriate expected gross profit margin.
Prices of Raw Materials and Components and Their Availability
Raw materials and components used in the production of our wind turbines are sourced from domestic suppliers as well as international suppliers, and their prices are dependent on various factors in addition to supply and demand. The fluctuations in prices of such raw materials and components and their availability will affect our operating results.
We generally engage two suppliers for each of our major components to minimize the dependency on any single supplier. We currently have certain critical components for which we only have a single source supplier. In late November 2014, the primary supplier of blades for our distributed-class turbines briefly ceased operations.
46
Table of Contents
Although we have worked with this supplier to restart operations, we expect that some blades will not be delivered in the near term on a timely basis, which will have an adverse effect on our revenues for the quarters ending December 31, 2014 and March 31, 2015 and could cause us to incur contractual damages if the delay causes us to be in breach of our agreements with customers.
In addition, the primary raw materials used in some of our components include steel and copper. Consequently, the prices we pay to our suppliers for such components may be affected by movements in prices for these raw materials.
Ability to Design and Market Technologically Advanced and Cost-Competitive Turbine Models
Although we have successfully launched three generations of our distributed-class wind turbines, our operating results and future growth depend on our ability to continue to develop and license technologies, and market technologically advanced and cost competitive wind turbines. We expect to continue to optimize the performance of our products under diverse operating conditions such as in low and high temperatures, low wind velocity and coastal areas, as well as reduce the cost of our offerings. Our ability to design and develop new products that meet these changing requirements has been and will continue to be critical to our ability to maintain and increase our installed capacity sold and profitability. As a result, we expect to continue to make significant investments in research and development, particularly with respect to designing and developing more technologically advanced and cost-competitive products and core components.
Our Ability to Source and Manage Working Capital Requirements
Our business operations require significant working capital. Our operating results and future growth depend on our ability to optimize the working capital cycle time and to source adequate working capital commensurate with the size of our business. Some of our suppliers require us to make prepayments in advance of shipment. We have currently started providing our customers with alternative payment options, such as letters of guarantee. Historically, we have managed to optimize our working capital cycle time and to source the required working capital from banks and capital financings.
Seasonality in Our Operations
Wind turbine sales in the regions in which we currently sell our turbines are affected by seasonal variations and the timing of government incentive structures. To satisfy the delivery schedules, we manufacture most of our wind turbines during the second and third quarters of each year for delivery and installation in the third and fourth quarters. This schedule is due primarily to the weather conditions, which are more favorable in these quarters for installation in northern areas to which we supply most of our wind turbines. We expect that the seasonality will gradually lessen as we obtain more purchase orders for sale of wind turbines in additional geographies.
Investment in People
We intend to invest in hiring and retaining talented employees to grow our business and increase our revenue. As of September 30, 2014, we had 116 full-time employees, an increase of 14 full-time employees, or approximately 14%, from September 30, 2013. We expect to grow headcount for the foreseeable future as we continue to invest in our business. In addition, we must retain our high-performing personnel to continue to develop, sell and market our products and services and manage our business.
Basis of Presentation
Our consolidated financial statements have been prepared in accordance with GAAP.
Under GAAP, the RTO, as described above, is considered to be a capital transaction in substance, rather than a business combination. That is, the RTO is equivalent to the issuance of common shares by Mira III Acquisition
47
Table of Contents
Corp., a Canadian capital pool company incorporated in British Columbia, Canada, or Mira III, for the net monetary assets of Wind Power Holdings, Inc., or WPHI, accompanied by a recapitalization, and is accounted for as a change in capital structure. Accordingly, the accounting for the RTO was identical to that resulting from a reverse acquisition, except no goodwill was recorded. Under share reverse takeover accounting, the post reverse acquisition comparative historical financial statements are those of the legal acquiree, WPHI, which is considered to be the accounting acquirer.
Share-based Compensation
In 2011, we had completed an options exchange in which employees accepted new, at the money, options to purchase common stock in either or both of the two then-existing subsidiaries of WPHI in exchange for certain options that had previously been issued to purchase WPHI common stock, along with additional fair value grants at the subsidiary level. We determined that these options should be accounted for as liability awards, which results in such options, when outstanding, being recorded on our balance sheet at their fair value as of each reporting date.
In November 2013, we adopted the Wind Power Holdings, Inc. 2013 Stock Option and Grant Plan, or the 2013 WPHI Plan. This plan provided for the grant of incentive stock options, non-statutory stock options, and other types of stock awards to our employees, consultants and directors. 2,568,034 shares of WPHI common stock were authorized for issuance under the 2013 WPHI Plan and no options were outstanding as of September 30, 2014 due to the conversion described below.
In December 2013, we commenced an offer to holders of options in our subsidiary option plans to exchange them for options to purchase shares of WPHI common stock to be issued under the 2013 WPHI Plan. The exercise price for the newly-issued stock options for holders accepting the exchange offer was equal to the fair market value of WPHI common stock at the date of the closing of the exchange offer. The newly-issued options were vested to the extent that the exchanged options were vested and will terminate on the same date as the exchanged options. This exchange offer closed in January 2014, and was accepted by virtually all option holders. Holders not accepting such exchange had their awards converted at a value-for-value basis to options in the 2013 WPHI plan and, therefore, at such time the Northern Power Systems, Inc. and Northern Power Systems Utility Scale, Inc., 2011 Stock Option Grant Plans were terminated. Effective with these transactions in January 2014, we no longer had any liability awards and we reclassified any values presented as liabilities for stock-based compensation to additional paid-in capital.
In March 2014, the Toronto Stock Exchange, or the TSX, informed us that we would be required to reprice the options issued in January 2014 under the 2013 WPHI Plan upon completion of the option exchange described above, so that the exercise price for such options would be equal to the price per equity security sold in our March 2014 private placement, as described below under “Liquidity and Capital Resources — Financing Activities.” Our board of directors determined effective the end of March 2014 that they would reprice these options as required by the TSX and as permitted by the option exchange documents, but would not modify the number of shares issued to employees.
As a result of the completion of the exchange offer and the repricing of such offer, we have not incurred any share compensation modification charges because the comparison of the fair value of the awards immediately before and after the modification resulted in the determination that no such charge existed.
The fair value of new options granted under the 2013 WPHI Plan increased from $1.59 per share at December 31, 2013, to $1.78 per share at March 31, 2014, at which time the plan was terminated. As described below, in April 2014 all outstanding options in the 2013 WPHI Plan were converted to options in the 2014 Plan. Total share-based compensation expense, not including restructuring charges, for these plans is $746, $701 and $971 for the nine months ended September 30, 2014 and the years ended December 31, 2013 and 2012, respectively.
48
Table of Contents
In April 2014, we adopted the Northern Power Systems Corp. 2014 Stock Option and Incentive Plan (the “2014 Plan”). The 2014 Plan provides for the grant of incentive stock options, non-statutory share options, and other types of share awards to our officers, employees, non-employee directors and consultants. 4,000,000 common shares are reserved for issuance upon the grant or exercise of awards under this plan. All shares underlying the 2013 WPHI Plan and the WPHI 2008 Equity Incentive Plan were converted to options in the 2014 Plan on a value-for-value basis.
Significant Accounting Estimates
We review all significant estimates affecting our consolidated financial statements on a recurring basis and record the effects of any necessary adjustments prior to their publication. Uncertainties with respect to such estimates and assumptions are inherent in the preparation of consolidated financial statements; accordingly, it is possible that actual results could differ from those estimates and changes to estimates could occur in the near term. The preparation of our consolidated financial statements requires management to make estimates and assumptions that affect the reported amounts of assets and liabilities and disclosure of the contingent assets and liabilities at the date of the consolidated financial statements and the reported amounts of revenue and expenses during the reporting period. We use estimates and assumptions in accounting for the following significant matters, among others: revenue recorded from licensing and development agreements; realizability of accounts receivable; and valuation of inventory, warranty reserves, deferred income tax assets, share-based compensation and warrants and contingencies.
Results of Operations for the nine months ended September 30, 2014 compared to the nine months ended September 30, 2013
Overview
Our general activity during the first nine months of 2014 was primarily focused on the following: concluding our capital raise and public listing on the TSX; expanding our order backlog of distributed turbines in key European markets; continuing to expand our technology licensing and development business, including closing a 3.3 MW development agreement with WEG; building our first prototypes of our next generation platform of our distributed-class turbine which is projected to reduce our cost of the turbine while increasing energy capture; and expanding our key leadership resources to expand our sales efforts into new geographies.
Our general activity during the first nine months of 2013 was primarily focused on the following: transitioning our distributed turbine sales from the U.S. to Europe; reducing the cost and increasing the dependability of our distributed-class turbines; and executing certain significant licensing and development contracts.
Revenue, Orders and Deferred Revenue (dollars in millions)
Total revenues from Product Sales and Services, Technology Licensing and Technology Development increased by $31.0 million, or 267%, to $42.6 million for the nine months ended September 30, 2014 from $11.6 million for the nine months ended September 30, 2013. Our overall backlog increased by approximately $11 million or 31% to approximately $47 million at September 30, 2014 as compared to approximately $36 million at September 30, 2013. Our backlog of orders generally, but not always, converts to revenue for us within a one year period. The timing of such revenue recognition is impacted by customer specific installation conditions such as site preparation and readiness by local utilities for grid connection.
49
Table of Contents
A comparison of our revenues for the nine months ended September 30, 2014 and 2013 is as follows:
| Nine Months Ended September 30, |
||||||||||||||||
| 2014 | 2013 | Change | % Change | |||||||||||||
| Product Sales and Service |
$ | 39.0 | $ | 11.1 | $ | 27.9 | 251 | % | ||||||||
| Technology Licensing |
2.5 | — | 2.5 | — | ||||||||||||
| Technology Development |
1.1 | 0.5 | 0.6 | 120 | ||||||||||||
|
|
|
|
|
|
|
|||||||||||
| Total |
$ | 42.6 | $ | 11.6 | $ | 31.0 | 267 | % | ||||||||
|
|
|
|
|
|
|
|||||||||||
Product Sales and Service
Product sales and service revenue increased by $27.9 million to $39.0 million for the nine month period ended September 30, 2014, from $11.1 million for the same period in 2013. The increase in our Product Sales and Service revenue was primarily attributed to recognizing revenue on higher sales of our distributed-class turbines which totaled $32.8 million and an increase in sales of our non-turbine products which totaled $4.7 million for the nine months ended September 30, 2014 as compared to $10.4 million and $0 million for turbines and non-turbine products, respectively, for the nine months ended September 30, 2013. In addition, related service revenue totaled $1.5 million for the nine month period ended September 30, 2014 and $0.7 million for the same period in 2013. The increase in turbine sales period over period is reflective of growth in the business as well as the recognition of revenue for certain distributed-class turbines which were delivered just after the end of our 2013 year-end.
During the nine months ended September 30, 2014, we executed more new distributed-class turbine sales orders in comparison to the same period in 2013. Our deferred revenue balance associated with Product Sales and Service at September 30, 2014 was $3.8 million which is included in the backlog value disclosed above. At December 31, 2013, such balance was $3.6 million.
Technology Licensing Revenue
Technology licensing revenue increased by $2.5 million to $2.5 million for the nine month period ended September 30, 2014 from $0 million for the same period in 2013. This increase is attributed to recognizing $1.5 million in revenues related to our licensing agreement with WEG along with $0.3 million of associated royalty revenue, the license fees related to a $0.6 million generator development agreement entered into in 2013, as well as $0.1 million in license fees from other smaller license agreements. As of September 30, 2014, we recorded $0.5 million in deferred revenue for cash collected for certain milestones associated with our WEG license, which will be recognized as revenue when the milestones are complete. Our contract with WEG allows for us to ultimately earn $3.4 million in license fees and in excess of $10 million in royalty revenues over time, for the license of our 2.X MW platform exclusively in Brazil and non-exclusively in the rest of South America. Our deferred revenue balance associated with Technology Licensing was $0.9 million as of September 30, 2014 which is included in the backlog value as disclosed above. At December 31, 2013, such balance was $1.7 million.
Technology Development Revenue
Technology development revenue increased by $0.6 million to $1.1 million for the nine month periods ended September 30, 2014 from $0.5 million for the same period in 2013. This increase is attributed to recognizing various contract technology development revenue as well as a proportion of revenue related to a contract with WEG, to develop a 3.3 MW turbine in 2014. We determined that the contract milestones were non-substantive because they did not correlate with the level of effort expended. Therefore, we are recognizing revenue on the contract using the percentage of completion method. The degree of completion is determined based on costs incurred, excluding costs that are not representative of progress to completion, as a percentage of total costs anticipated for the contract. As of September 30, 2014, $1.5 million of cash collected for certain milestones were
50
Table of Contents
recorded as deferred revenue. Our deferred revenue balance associated with Technology Development was $1.9 million as of September 30, 2014 which is included in the backlog value as disclosed above. At December 31, 2013, such balance was $0 million.
Cost of Goods Sold and Cost of Service Revenues (dollars in millions)
Cost of goods sold and cost of services revenues collectively increased by $23.2 million or 209% in the nine months ended September 30, 2014 to $34.3 million as compared to $11.1 million in the nine months ended September 30, 2013.
A comparison of our costs of goods sold and cost of services for the nine months ended September 30, 2014 and 2013 is as follows:
| Nine Months Ended September 30, |
||||||||||||||||
| 2014 | 2013 | Change | % Change | |||||||||||||
| Product Sales and Service |
$ | 32.6 | $ | 9.9 | $ | 22.7 | 229 | % | ||||||||
| Technology Licensing |
0.6 | 0.3 | 0.3 | 100 | ||||||||||||
| Technology Development |
0.3 | 0.1 | 0.2 | 200 | ||||||||||||
| Shared Services |
0.1 | 0.2 | (0.1 | ) | (50 | ) | ||||||||||
| Unallocated |
0.7 | 0.6 | 0.1 | 17 | ||||||||||||
|
|
|
|
|
|
|
|||||||||||
| Total |
$ | 34.3 | $ | 11.1 | $ | 23.2 | 209 | % | ||||||||
|
|
|
|
|
|
|
|||||||||||
Product Sales and Service Cost of Goods and Costs of Service Sold
Product sales and service cost for the nine month period ended September 30, 2014 increased by $22.7 million to $32.6 million from $9.9 million for the same period in 2013. The increase in product sales and service cost is primarily attributed to the recognition of a higher volume related to our distributed-class turbine sales and increase sales of non-turbine products for the nine months ended September 30, 2014 as compared to the same period in 2013. Our cost of goods sold was $30.6 million for product sales along with $2.0 million of related service costs for the nine months ended September 30, 2014 and $8.5 million for product sales and $1.4 million for related service costs for the same period in 2013.
Technology Licensing Cost of Service
Technology licensing cost of services for the nine month period ended September 30, 2014 increased by $0.3 million to $0.6 million from $0.3 million for the same period in 2013. The increase reflects higher costs associated with increased license technology activity in the nine months ended September 30, 2014.
Technology Development Cost of Service
Technology development cost of services for the nine month period ended September 30, 2014 increased by $0.2 million to $0.3 million from $0.1 million for the same period in 2013. This increase is related to beginning work on development of a 3.3 MW turbine for WEG and an increase in other development activity.
Shared Services
Shared services for the nine month period ended September 30, 2014 decreased by $0.1 million to $0.1 million from $0.2 million for the same period in 2013, principally driven by slightly lower information technology expense allocation in 2014.
51
Table of Contents
Unallocated
The costs from unallocated expenses increased by $0.1 million to $0.7 million compared to $0.6 million for the nine months ended September 30, 2014 and 2013, respectively principally driven by slightly higher depreciation expense related to the abandonment of an asset used as service equipment.
Segment Gross Profit (Loss) (dollars in millions)
| Nine Months Ended September 30, |
||||||||||||||||
| 2014 | 2013 | Change | % Change | |||||||||||||
| Product Sales and Service |
$ | 6.4 | $ | 1.2 | $ | 5.2 | 433 | % | ||||||||
| Technology Licensing |
1.9 | (0.3 | ) | 2.2 | 733 | |||||||||||
| Technology Development |
0.8 | 0.4 | 0.4 | 100 | ||||||||||||
| Shared Services |
(0.1 | ) | (0.2 | ) | 0.1 | 50 | ||||||||||
| Unallocated |
(0.7 | ) | (0.6 | ) | (0.1 | ) | (17 | ) | ||||||||
|
|
|
|
|
|
|
|||||||||||
| Total |
$ | 8.3 | $ | 0.5 | $ | 7.8 | 1,560 | % | ||||||||
|
|
|
|
|
|
|
|||||||||||
Product Sales and Service
Gross profit from product sales and service for the nine months ended September 30, 2014 increased by $5.2 million to $6.4 million compared to $1.2 million for the same period in 2013 principally due to an increase in sales of distributed-class turbines and non-turbine products of $27.9 million offset by higher cost of goods sold of $22.7 million in the nine months ended September 30, 2014.
Technology Licensing
Gross profit from technology licensing for the nine month period ended September 30, 2014 increased by $2.2 million to $1.9 million from a loss of ($0.3) million for the same period in 2013. The improvement is principally due to higher revenue recognition in 2014.
Technology Development
Gross profit from technology development for the nine months ended September 30, 2014 increased by $0.4 million to $0.8 million compared to $0.4 million for the same period in 2013, principally due to higher revenues from contract technology development services in 2014.
Shared Services
Gross loss from shared services for the nine month period ended September 30, 2014 decreased by $0.1 million to ($0.1) million from ($0.2) million for the same period in 2013 principally driven by slightly lower information technology expense allocation in 2014.
Unallocated
Gross loss from unallocated expenses increased by $0.1 million to ($0.7) million compared to ($0.6) million for the nine months ended September 30, 2014 and 2013, respectively principally driven by slightly higher depreciation expense related to the abandonment of an asset used as service equipment.
Operating Expenses
Research and Development Expenses
Research and development expenses increased by $0.7 million or 25% to $3.5 million for the nine months ended September 30, 2014 from $2.8 million for the same period in 2013. The increase in research and development
52
Table of Contents
expenses is due in part to a higher proportion of our engineering workforce providing research and development support to manufacturing for our next generation distributed-class turbine as compared to the prior period.
Sales and Marketing
Sales and marketing expenses increased by $0.7 million or 35% to $2.7 million for the nine months ended September 30, 2014 from $2.0 million for the same period in 2013. The increase in sales and marketing expenses was driven by a net expansion in global sales and marketing resources.
General and Administrative Expenses
General and administrative expenses increased by $2.1 million or 45% to $6.8 million for the nine months ended September 30, 2014 from $4.7 million for the same period in 2013. The increase in our general and administrative expenses is primarily explained by an increase of $1.0 million increase in professional fees and consultant expenses, as well as a $0.5 million in compensation and benefits along with a $0.6 million increase in travel expenses and other expenses.
Loss from Operations
Our loss from operations decreased by $4.4 million to ($4.8) million for the nine months ended September 30, 2014 compared to ($9.1) million for the same period in 2013. The decrease in loss is principally due to the increase in gross profit of $7.8 million partially offset by a $1.6 million increase in professional fees and consulting expense, a $1.0 million increase in R&D expense, a $0.4 million increase in compensation and benefits, and a $0.4 million increase in other operating expenses.
Segment Income (Loss) from Operations (dollars in millions)
| Nine Months Ended September 30, |
||||||||||||||||
| 2014 | 2013 | Change | % Change | |||||||||||||
| Product Sales and Service |
$ | 0.8 | $ | (2.4 | ) | $ | 3.2 | 133 | % | |||||||
| Technology Licensing |
1.4 | (1.4 | ) | 2.8 | 200 | |||||||||||
| Technology Development |
0.8 | 0.3 | 0.5 | 167 | ||||||||||||
| Shared Services |
(6.1 | ) | (4.6 | ) | (1.5 | ) | (33 | ) | ||||||||
| Unallocated |
(1.7 | ) | (1.0 | ) | (0.7 | ) | (70 | ) | ||||||||
|
|
|
|
|
|
|
|||||||||||
| Loss from operations |
$ | (4.8 | ) | $ | (9.1 | ) | $ | 4.3 | 47 | % | ||||||
|
|
|
|
|
|
|
|||||||||||
Product Sales and Service
Income from operations from product sales and service for the nine months ended September 30, 2014 increased by $3.2 million to income of $0.8 million compared to a ($2.4) million loss for the same period in 2013 principally due to the increase in gross profit of $5.2 million from increased sales partially offset by increased operating expenses of $2.2 million attributable to product sales and service, to support the increase in business activity in 2014.
Technology Licensing
Income from operations from technology licensing for the nine months ended September 30, 2014 increased by $2.8 million to income of $1.4 million compared to a ($1.4) million loss for the same period in 2013, due to higher gross profit and lower operating expenses for research and development expenses attributable to technology licensing in the nine months ended September 30, 2014.
53
Table of Contents
Technology Development
Income from operations from technology development for the nine months ended September 30, 2014 increased by $0.5 million to $0.8 million compared to $0.3 million for the same period in 2013, principally due to higher gross profit in 2014.
Shared Services
Corporate shared general and administrative loss for the nine months ended September 30, 2014 increased by $1.5 million to ($6.1) million compared to ($4.6) million for the same period in 2013 principally due to increased consulting and professional fee expenses of $1.0 million, and other corporate and shared services expenses of $0.5 million.
Unallocated
The loss from unallocated expenses for the nine months ended September 30, 2014 increased by $0.7 million to ($1.7) million compared to ($1.0) million in the same period in 2013 due to an increase of $0.4 million in share compensation expense related to option grants to our board of directors and depreciation expense and an increase of $0.3 million in other unallocated expense.
The table below breaks out the unallocated expenses by category for the periods reported.
| Nine Months Ended September 30, |
||||||||||||||||
| 2014 | 2013 | Change | % Change | |||||||||||||
| Depreciation and amortization |
$ | 0.8 | $ | 0.8 | $ | — | — | % | ||||||||
| Share-based compensation |
0.7 | 0.3 | 0.4 | 133 | ||||||||||||
| Other |
0.2 | (0.1 | ) | 0.3 | 300 | |||||||||||
|
|
|
|
|
|
|
|||||||||||
| Total charges |
$ | 1.7 | $ | 1.0 | $ | 0.7 | 70 | % | ||||||||
|
|
|
|
|
|
|
|||||||||||
Other Expense and Income Tax Expense
Other expense increased by $0.2 million or 200% to $0.3 million for the nine months ended September 30, 2014 as compared to $0.1 million for the nine months ended September 30, 2013. This increase is primarily the result of a $0.2 million reduction in the benefit related to change in the fair value of our Series C-2 warrant liability.
Income tax expense was $0.4 million for the nine months ended September 30, 2014 and $0 million for the same period in 2013. The increase is the result of Brazilian tax expense incurred on certain types of revenue earned within Brazil.
Net Loss
Net loss decreased by $3.8 million or 40%, to ($5.5) million for the nine months ended September 30, 2014 from a net loss of ($9.3) million for the same period in 2013.
The decrease in our net loss for the nine months ended September 30, 2014, is primarily due to the decrease in loss from operations of $4.3 million partially offset by an increase in other expense and income tax expense of $0.7 million.
Non-GAAP Measures
Generally, a non-GAAP financial measure is a numerical measure of a company’s performance, financial position or cash flow that either excludes or includes amounts that are not normally excluded or included in the
54
Table of Contents
most directly comparable measure calculated and presented in accordance with GAAP. The non-GAAP measures included in this prospectus, however, should be considered in addition to, and not as a substitute for or superior to the comparable measure prepared in accordance with GAAP. We utilize the non-GAAP measure of non-GAAP adjusted EBITDA which we define as earnings before interest expense, income taxes, depreciation, amortization, non-cash compensation expense, changes in the fair valuation of certain liability classified instruments, and certain other one-time non-cash charges.
Non-GAAP adjusted EBITDA (Loss) (dollars in millions)
| Nine Months Ended September 30, |
||||||||
| 2014 | 2013 | |||||||
| Net loss |
$ | (5.5 | ) | $ | (9.3 | ) | ||
| Provision for income tax |
0.4 | — | ||||||
| Interest expense |
0.4 | 0.2 | ||||||
| Depreciation and amortization |
0.8 | 0.8 | ||||||
| Share-based compensation |
0.7 | 0.3 | ||||||
| Change in fair value of warrants |
— | (0.2 | ) | |||||
|
|
|
|
|
|||||
| Total noncash addbacks |
2.3 | 1.1 | ||||||
|
|
|
|
|
|||||
| Non-GAAP Adjusted EBITDA Loss |
$ | (3.2 | ) | $ | (8.2 | ) | ||
|
|
|
|
|
|||||
Non-GAAP adjusted EBITDA was a loss of ($3.2) million for the nine months ended September 30, 2014 and ($8.2) million for the same period in 2013. The change in non-GAAP adjusted EBITDA loss is primarily attributable to a decrease in net loss resulting from higher sales in 2014.
Results of Operations of the Year Ended December 31, 2013 and the Year Ended December 31, 2012
Overview
Our general activity during the year ended December 31, 2013 was primarily focused on: expanding our order backlog of distributed turbines in key European markets; continuing to expand our technology licensing and development business; designing a next generation platform of our distributed-class turbine which is projected to reduce our cost of the turbine while increasing energy capture; and increasing the production of our distributed-class turbines.
Our general activity during the year ended December 31, 2012 was primarily focused on: transitioning our distributed turbine sales from the U.S. to Europe; reducing the cost and increasing the dependability of our distributed-class turbines; and restructuring our utility-class product offering and our business leadership. Our restructuring efforts were aimed at reducing our operating expenses and re-aligning our business to a less capital intensive model while realizing the value of our developed utility-class turbine technology. During this period we began to focus our distributed-class turbine sales efforts on Europe in response to changing global incentive structures.
Revenue, Orders and Deferred Revenue (dollars in millions)
Total revenues from product sales, license arrangements, and services decreased by $6.8 million, or 24.8%, to $20.6 million for the year ended December 31, 2013 from $27.4 million for the year ended December 31, 2012.
55
Table of Contents
A comparison of our revenues for the years ended December 31, 2013 and 2012 is as follows:
| Year Ended December 31, |
||||||||||||||||
| 2013 | 2012 | Change | % Change | |||||||||||||
| Product Sales and Service |
$ | 20.1 | $ | 17.4 | $ | 2.7 | 15.5 | % | ||||||||
| Technology Licensing |
— | 10.0 | (10.0 | ) | (100.0 | ) | ||||||||||
| Technology Development |
0.5 | — | 0.5 | N.M. | ||||||||||||
|
|
|
|
|
|
|
|||||||||||
| Total |
$ | 20.6 | $ | 27.4 | $ | (6.8 | ) | (24.8 | )% | |||||||
|
|
|
|
|
|
|
|||||||||||
Product Sales and Service
The increase in our product sales and service revenue was primarily attributable to the recognition of the sale of 63 units of our distributed-class turbine sales in the year ended December 31, 2013 resulting in revenue of $18.9 million along with $0.9 million of related service revenue. During the year ended December 31, 2012, we recognized revenue on the sale of 44 units of our distributed-class turbines resulting in revenue of $14.3 million along with $0.7 million of related service revenue. Utility-class product revenue declined by $2.0 million as one partial unit, consisting of a nacelle only, was sold during the year ended December 31, 2012 as part of a technology licensing transaction, compared to no sales of utility-class turbines in 2013.
During the year ended December 31, 2013, we executed 148 new distributed-class turbine sales orders and, as of December 31, 2013, we had 147 orders in our backlog with an associated sales value of approximately $40 million. During the year ended December 31, 2012, we executed 44 new distributed-class turbine sales orders, and as of December 31, 2012 we had 73 orders in our backlog with an associated sales value of approximately $21 million. Our deferred revenue balance associated with turbine sales and related service at December 31, 2013 was $3.6 million and at December 31, 2012 it was $2.4 million. Our backlog of orders for distributed turbines generally, but not always, converts to revenue for us within a one year period. The timing of such revenue recognition is impacted by customer specific installation conditions such as site preparation and readiness by local utilities for grid connection.
Technology Licensing Revenue
The decrease in our licensing revenue to $0 million in the year ended December 31, 2013 from $10.0 million in the year ended December 31, 2012 reflects the nature and structure of the license contracts that we have consummated in such periods. In 2012, we consummated a license of our first generation utility-class technology to a customer in China, China First Heavy Industries, or CFHI, on a non-exclusive basis along with the sale of certain equipment in exchange for a one-time license fee and equipment purchase fee. The license revenue element of this agreement was recognized in the year ended December 31, 2012 since the execution of such license agreement was complete and cash was collected. In connection with this license agreement, $1.0 million of proceeds was withheld and remitted by China First Heavy Industries, or CFHI for our Chinese income taxes due. Such taxes are presented as income tax expense in our financial statements. Revenue for the entire arrangement of $12 million was allocated between the sale of the licensed intellectual property and sale of the equipment. We determined the allocation of this arrangement by an analysis of the best estimate of sale price for each element.
In the year ended December 31, 2013 we executed a contract forming a strategic partnership with a partner in Brazil, WEG Equipamentos Elétricos S.A., or WEG, for among other things, the license of our 2.1 MW utility-class wind turbine design and related technology. We did not recognize any revenue associated with this contract in the year ended December 31, 2013. As of December 31, 2013, $1.3 million of cash collected for the completion of certain milestones associated with our WEG and other license agreements was recorded on our balance sheet as deferred revenue. Our contract with WEG allows for us to ultimately earn $3.4 million in license fees and in excess of $10 million in royalty revenues over time, for the license of our 2.1 MW platform exclusively in Brazil and non-exclusively in the rest of South America. Our deferred revenue balance associated with Technology Licensing was $1.7 million and $0 million as of December 31, 2013 and 2012, respectively.
56
Table of Contents
Technology Development Revenue
The increase in our development revenue for the year ended December 31, 2013 increased to $0.5 million compared to $0 million for the same period 2012. This increase is principally due to the completion of the development of generator technology related to development and licensing contracts.
Cost of Goods Sold and Cost of Services (dollars in millions)
Cost of goods sold and cost of services collectively increased by $0.2 million or 1.0% in the year ended December 31, 2013 to $19.4 million as compared to $19.2 million in the year ended December 31, 2012.
| Year Ended December 31, |
||||||||||||||||
| 2013 | 2012 | Change | % Change | |||||||||||||
| Product Sales and Service |
$ | 18.1 | $ | 17.4 | $ | 0.7 | 4.0 | % | ||||||||
| Technology Licensing |
0.1 | 0.2 | (0.1 | ) | (50.0 | ) | ||||||||||
| Technology Development |
0.2 | — | 0.2 | N.M. | ||||||||||||
| Shared Services |
0.2 | 0.2 | — | — | ||||||||||||
| Unallocated |
0.8 | 1.4 | (0.6 | ) | (42.9 | ) | ||||||||||
|
|
|
|
|
|
|
|||||||||||
| Total |
$ | 19.4 | $ | 19.2 | $ | 0.2 | 1.0 | % | ||||||||
|
|
|
|
|
|
|
|||||||||||
Product Sales and Service Cost of Goods and Costs of Service Sold
The increase in product sales and service cost is primarily attributable to recognition of 63 units of our distributed-class turbine sales in the year ended December 31, 2013 as compared to 44 units in the same period in 2012. Our cost of goods sold was $15.8 million for product sales along with $2.3 million of related service costs for the year ended December 31, 2013 and $14.8 million for product sales along with $2.6 million of related service costs for the same period in 2012. The increase is attributable to a $3.5 million increase in distributed-class cost of goods sold partially offset by $2.8 million lower utility-class cost of goods sold for the year ended December 31, 2013 as compared to the same period in 2012. This reduction in utility-class cost of goods sold is primarily attributable to the absence of costs of sales associated with the sale of one partial turbine as part of our technology licensing sale in 2012 to CFHI.
Technology Licensing Cost of Service
When we are developing technology licensing packages that we can license to multiple potential customers we treat the cost of such activities as research and development expense. When we refine developed packages to meet the specific needs of customers licensing our technology, whether such license agreement is ultimately executed or not, we record such costs as cost of services. In the year ended December 31, 2013, such costs of services were $0.1 million and in the same period of 2012 they were $0.2 million.
Technology Development Cost of Service
When we are developing technology for customers the cost of creating such technologies are classified in the cost of sales. The cost of such technology development for the year ended December 31, 2013 increased by $0.2 million compared to $0 million for the same period of 2012.
Shared Services
Shared services cost of sales consists of the allocation of information technology expenses.
57
Table of Contents
Unallocated
The costs from unallocated expenses for the year ended December 31, 2013 decreased by $0.6 million to $0.8 million compared to $1.4 million for the same period in 2012. The decrease is primarily related to lower share compensation expense explained by our 2012 restructuring activities and amortization expense explained by long-lived asset write downs through impairment in 2012.
Segment Gross Profit (dollars in millions)
| Year Ended December 31, |
||||||||||||||||
| 2013 | 2012 | Change | % Change | |||||||||||||
| Product Sales and Service |
$ | 2.0 | $ | — | $ | 2.0 | N.M. | % | ||||||||
| Technology Licensing |
(0.1 | ) | 9.8 | (9.9 | ) | N.M. | ||||||||||
| Technology Development |
0.3 | — | 0.3 | N.M. | ||||||||||||
| Shared Services |
(0.2 | ) | (0.2 | ) | — | — | ||||||||||
| Unallocated |
(0.8 | ) | (1.4 | ) | 0.6 | 42.9 | ||||||||||
|
|
|
|
|
|
|
|||||||||||
| Total |
$ | 1.2 | $ | 8.2 | $ | (7.0 | ) | (85.4 | )% | |||||||
|
|
|
|
|
|
|
|||||||||||
Product Sales and Service
Gross profit from product sales and service for the year ended December 31, 2013 increased by $2.0 million to $2.0 compared to $0 million for the same period in 2012 principally due to an increase in sales distributed-class turbines of $4.6 million partially offset by lower utility-class turbine sales of $2.0 million and higher cost of goods sold $0.3 million in 2013.
Technology Licensing
Gross profit from technology licensing for the year ended December 31, 2013 decreased by $9.9 million to $(0.1) million compared to $9.8 for the same period in 2012 principally due to the absence of recognizing the revenue for a technology license in 2013.
Technology Development
Gross profit from technology development for the year ended December 31, 2013 increased by $0.3 million to $0.3 million compared to $0 million for the same period in 2012 principally due to recognizing revenues for developed technology in 2013.
Unallocated
Unallocated expenses for the year ended December 31, 2013 decreased by $0.6 million to $(0.8) million compared to $(1.4) million for the same period in 2012 principally due to decreases in share compensation expense, depreciation and amortization expenses related to certain long-lived asset write downs and restructuring charges.
We do not present gross profit as a GAAP financial measure on our condensed consolidated statement of operations. We do review a calculation of segment gross profit internally as we review our financial performance, and in such review we exclude certain charges because we believe such charges are not indicative of future performance, including specifically restructuring and impairment charges. Such charges are presented on our GAAP Statement of Operations as separately disclosed charges.
58
Table of Contents
Operating Expenses
Research and Development Expenses
Research and development expenses decreased by $0.1 million or 2% to $4.2 million for the year ended December 31, 2013 from $4.3 million for the year ended December 31, 2012. The decrease in research and development expenses is due in part to a higher proportion of our engineering workforce providing technology development services, which is presented as Cost of Services, as well as continued expense containment.
Sales and Marketing
Sales and marketing expenses increased by $0.1 million or 3% to $3.0 million for the year ended December 31, 2013 from $2.9 million for year ended December 31, 2012. The increase in sales and marketing expenses is driven by a net expansion in sales and marketing resources, with our expansion of European investment more than offsetting declined investment in North America.
General and Administrative Expenses
General and administrative expenses decreased by $0.2 million or 3% to $6.9 million for the year ended December 31, 2013 from $7.1 million for the year ended December 31, 2012. The decrease in our general and administrative costs is primarily explained by continued cost control after our restructuring in the year ended December 31, 2012 which included reductions in our leadership team. Compensation and benefit expenses are $0.7 million lower in 2013 partially offset by an increase of $0.4 million in consulting expenses and an increase of $0.3 million in legal expense.
Asset Held for Sale
On December 12, 2013 the board of directors approved a plan to sell our corporate headquarters and production facility located at 23 Pitman Road, Barre, Vermont. We had intended to relocate to other more suitable production and technology space within the state of Vermont. We marketed the facility through a real estate broker which initially found three potential purchasers. We believe that effective December 12, 2013, the facility became an asset held for sale based upon the decision by our board of directors at such time, as well as meeting the other criteria in ASC 360-10-45-8, Impairment and Disposal of Long-Lived Assets — Other Presentation Matters, Long-Lived Assets Classified as Held for Sale. Therefore, we reclassified the land, building, and building improvements as well as associated accumulated depreciation from property, plant and equipment to assets held for sale as of December 31, 2013 and 2012. As of the date of December 31, 2013, one interested unaffiliated party had progressed in seeking to purchase the facility. Based upon the marketing of the facility as well as the indication of value from the currently interested potential buyer, we believe that the then current fair value of the facility was $1,300 as of December 31, 2013. This value was lower than the carrying value at December 12, 2013 of $1,973 and, therefore, we calculated an asset held for sale loss by taking the difference between the sale price and the carrying value of the building along with the estimated direct costs of a sale transaction which resulted in a loss of $768. The sale of the Barre, Vermont facility was completed in June 2014 for $1,300.
Impairment
Impairment expense decreased to $0 million for the year ended December 31, 2013 from an impairment expense of $1.5 for the year ended December 31, 2012.
We review our long-lived assets for impairment when an impairment indicator suggests that such assets might be impaired. The factors considered by us in performing this impairment assessment include current operating results, trends and prospects, as well as the effects of obsolescence, demand, competition, and other economic factors. In the year ended December 31, 2012 we performed such testing and concluded that developed
59
Table of Contents
technology and certain of our distributed-class turbine IP intangible assets were impaired and such impairment was concluded to be $1.5 million. We considered certain qualitative factors in 2013 concluding that no impairments of long-lived assets existed.
Restructuring
Restructuring expense decreased to $0.1 million for the year ended December 31, 2013 from $2.1 million for the year ended December 31, 2012.
In April 2012, we committed to a restructuring plan for re-aligning our utility-class offering, changing the nature of our operations from being primarily a designer and developer of utility-class wind turbines to a licensor of technology and a provider of development services, as well as restructuring our leadership structure. These actions resulted in the reduction of 40% of our total headcount and the closure of a manufacturing facility. Associated with this restructuring, we recorded a charge of $2.1 million for the reduction in the realizable value of certain assets, the costs of severance, and the modifications of share-based compensation programs. No such plans were initiated in the year ending December 31, 2013, however, accounting for the fair-value change of certain 2012 restructured share-based compensation awards resulted in a $0.1 million charge in 2013.
Loss from Operations
Our loss from operations increased by $4.1 million to $13.8 million for the year ended December 31, 2013 compared to $9.7 million for 2012. The increase in our loss from operations for the year ended December 31, 2013 is principally due to the decrease in gross profit of $7.0 million and an increase in losses for asset held for sale of $0.8 million, these were partially offset by reductions in impairment and restructuring charges of $1.5 million and $2.0 million, respectively.
Segment Loss from Operations (dollars in millions)
| Year Ended December 31, |
||||||||||||||||
| 2013 | 2012 | Change | % Change | |||||||||||||
| Product Sales and Service |
$ | (3.5 | ) | $ | (7.0 | ) | $ | 3.5 | 50.0 | % | ||||||
| Technology Licensing |
(1.6 | ) | 9.2 | (10.8 | ) | N.M. | ||||||||||
| Technology Development |
0.3 | — | 0.3 | N.M. | ||||||||||||
| Shared Services |
(6.5 | ) | (6.2 | ) | (0.3 | ) | (4.8 | ) | ||||||||
| Unallocated |
(2.5 | ) | (5.7 | ) | 3.2 | 56.1 | ||||||||||
|
|
|
|
|
|
|
|||||||||||
| Loss from operations |
$ | (13.8 | ) | $ | (9.7 | ) | $ | (4.1 | ) | (42.3 | )% | |||||
|
|
|
|
|
|
|
|||||||||||
Product Sales and Service
Loss from operations from product sales and service for the year ended December 31, 2013 decreased by $3.5 million to $3.5 million compared to $7.0 million for the same period in 2012 principally due to the improved gross profits for increased sales as well as contained operating expenses.
Technology Licensing
Loss from operations from technology licensing for the year ended December 31, 2013 decreased by $10.8 million to a $1.6 million loss compared to $9.2 million income for the same period in 2012 principally due to the absence of recognizing revenue on a technology license in the year ended December 31, 2013.
60
Table of Contents
Technology Development
Income from operations from technology development for the year ended December 31, 2013 increased by $0.3 million compared to $0 million for the same period in 2012 principally due to recognizing revenues for developed technology in 2013.
Shared Services
Corporate shared general and administrative costs expenses for the year ended December 31, 2013 increased $0.3 million to $6.5 million compared to $6.2 million for the same period in 2012 principally due to an increase in expenses in preparation of us potentially becoming a publically traded company of $0.4 million partially offset by a reduction in compensation and benefits of $0.1 million.
Unallocated
The costs from unallocated expenses for the year ended December 31, 2013 decreased by $3.2 million to $2.5 million compared to $5.7 million for the same period in 2012, principally due to a reduction in restructuring and impairment charges as well as amortization expense, partially offset by an increase in asset held for sale loss of $0.8 million. The below table details our unallocated charges by year:
| Year Ended December 31, |
||||||||||||||||
| 2013 | 2012 | Change | % Change | |||||||||||||
| Depreciation and amortization |
$ | (1.0 | ) | $ | (1.7 | ) | $ | 0.7 | 41.2 | % | ||||||
| Share-based compensation |
(0.7 | ) | (1.0 | ) | 0.3 | 30.0 | ||||||||||
| Non cash portion of restructuring charge |
(0.1 | ) | (1.5 | ) | 1.4 | 93.3 | ||||||||||
| Impairment charge |
— | (1.5 | ) | 1.5 | 100.0 | |||||||||||
| Loss on disposal of asset |
— | (0.1 | ) | 0.1 | 100.0 | |||||||||||
| Asset held for sale loss |
(0.8 | ) | — | (0.8 | ) | N.M. | ||||||||||
| Other |
0.1 | 0.1 | — | — | ||||||||||||
|
|
|
|
|
|
|
|||||||||||
| Total charges |
$ | (2.5 | ) | $ | (5.7 | ) | $ | 3.2 | 56.1 | % | ||||||
|
|
|
|
|
|
|
|||||||||||
Other Income (Expense) and Income Tax Expense
Other income decreased by $4.8 million to ($0.3) million of other expense for the year ended December 31, 2013 as compared to $4.5 million of other income for the year ended December 31, 2012. This decrease is primarily the result of a $4.4 million decrease in the benefit from the reduction in the fair value of our warrant liability in the year ended December 31, 2013 as compared to the same period in 2012 as well as a $0.4 million increase in interest expense as a result of interest accrued on our convertible notes.
Income taxes decreased by $1.0 million or 100% to $0 million for the year ended December 31, 2013 from $1.0 million for the year ended December 31, 2012. The decrease is due to the absence of a Chinese income tax expense in 2013 as compared to 2012 which had been associated with our technology license sale to CFHI.
Net Loss
Net loss increased by $7.9 million or 127%, to $14.1 million for the year ended December 31, 2013 from a net loss of $6.2 million for 2012.
The increase in our net loss for the year ended December 31, 2013 is primarily due to the increase in loss from operations of $3.8 million as well as a decrease in change in fair value of warrants of $4.4 million and a $1 million increase in interest expense. This was partially offset by a reduction in income tax expense of $1.0 million.
61
Table of Contents
Non-GAAP Adjusted EBITDA (dollars in millions)
| Year Ended December 31, |
||||||||
| 2013 | 2012 | |||||||
| Net loss |
$ | (14.1 | ) | $ | (6.2 | ) | ||
| Provision for income tax |
— | 1.0 | ||||||
| Interest expense |
0.5 | 0.1 | ||||||
| Depreciation and amortization |
1.0 | 1.7 | ||||||
| Share-based compensation |
0.7 | 1.0 | ||||||
| Change in fair value of warrants |
(0.2 | ) | (4.5 | ) | ||||
| Non cash portion of restructuring charge |
0.1 | 1.5 | ||||||
| Asset impairment and loss on disposal |
— | 1.5 | ||||||
| Loss on asset held for sale |
0.8 | — | ||||||
|
|
|
|
|
|||||
| Total noncash addbacks |
2.9 | 2.3 | ||||||
|
|
|
|
|
|||||
| Non-GAAP Adjusted EBITDA |
$ | (11.2 | ) | $ | (3.9 | ) | ||
|
|
|
|
|
|||||
Non-GAAP adjusted EBITDA was a loss of ($11.2) million for the year ended December 31, 2013 and ($3.9) million for the same period in 2012. The decrease in Non-GAAP adjusted EBITDA is primarily attributed to an increase in net loss attributable to the absence of Technology License revenue in 2013 partially offset by higher Product Sales and Service and Technology Development revenues in 2013.
Liquidity and Capital Resources
Consolidated Statements of Cash Flows Data (dollars in millions)
| Nine months Ended September 30, Unaudited |
Year Ended December 31, |
|||||||||||||||
| 2014 | 2013 | 2013 | 2012 | |||||||||||||
| Net loss |
$ | (5.5 | ) | $ | (9.3 | ) | $ | (14.1 | ) | $ | (6.2 | ) | ||||
| Net cash used in operating activities |
(12.0 | ) | (5.9 | ) | (6.1 | ) | (6.4 | ) | ||||||||
| Net cash provided by (used in) investing activities |
0.5 | (0.2 | ) | (0.4 | ) | (0.4 | ) | |||||||||
| Net cash provided by financing activities |
23.2 | 6.6 | 6.5 | 0.0 | ||||||||||||
Cash and Cash Equivalents
Effective September 30, 2014, we had cash and cash equivalents of $16.3 million of which $0.3 million was held by a foreign holding company and subsidiary. We had cash but no cash equivalents for the same period in 2013.
Prior to April 16, 2014, our principal source of liquidity had been private sales of convertible preferred stock. From inception to December 31, 2013, we completed four rounds of equity financing through issuance of our convertible preferred stock with total cash proceeds to us of $123.0 million. We also issued convertible notes totaling $6.5 million in two offerings during the year ended December 31, 2013. During the nine months ended September 30, 2014, we closed on a $19.6 million private placement in connection with a reverse takeover transaction. Proceeds from our financing transactions have been used primarily to fund working capital needs and our operations. With the closure of our capital raise transaction as described below in Financing Activities and the receipt of the net proceeds of $19.6 million on April 16, 2014, along with the availability of a $6 million working capital line of credit as of September 30, 2014, we believe that our available cash and availability under our line of credit will be sufficient to satisfy our working capital and planned investments to support our long-term growth strategy, for at least one year from the date of this prospectus.
62
Table of Contents
Operating Activities
Cash used in operating activities consists of net loss adjusted for certain non-cash items including depreciation and amortization, impairment losses, share-based compensation, and changes in working capital and other activities.
For the nine months ended September 30, 2014, net cash used in operating activities increased by $6.1 million to $12.0 million from $5.9 million for the nine months ended September 30, 2013. The increase in cash used in operating activities for 2014 is primarily due to the effect of changes in operating assets and liabilities resulting in a cash outflow of $8.4 million. Included in these changes were a $3.6 million increase in inventory driven by higher order volume, a $2.8 million increase in accounts receivable and an increase in unbilled revenues of $1.3 million which is partially offset by an increase in related rebates of $1.1 million, and a decrease of $4.1 million in customer deposits resulting from higher revenue recognition and the reclassification of some deposits to deferred revenue due to achieving shipment milestones. This increase of working capital was offset by an increase in deferred revenue and accrued expenses.
For the year ended December 31, 2013 net cash used in operating activities decreased by $0.3 million to $6.1 million from $6.4 million for year ended December 31, 2012. The decrease of cash used in operating activities in 2013 is primarily due to an increase in a net loss of $7.9 million offset by an increase of non-cash income items totaling $1.1 million and the effect of changes in working capital resulting in a change of cash inflow of $7.0 million.
Investing Activities
Net cash provided by (used in) investing activities was $0.5 million and ($0.2) million for the nine months ended September 30, 2014 and 2013, respectively. Cash provided by investing activities in 2014 consisted of gross proceeds of $1.3 million from the sale of our manufacturing facility in June 2014. A portion of such proceeds were used to payoff of the VEDA mortgage balance as described below. The increase in cash provided by investing activities for the first nine months of 2014 was partially offset by a $0.7 million increase in fixed asset purchases. Cash used in investing activities consisted of purchasing certain equipment required to maintain operations.
Net cash used in investing activities was $0.4 million for the years ended December 31, 2013 and 2012. Investing activities for each period consisted of purchasing certain equipment.
Financing Activities
Our primary financing activities through December 31, 2013 consisted of private sales of convertible preferred stock and convertible notes. All of the WPHI convertible preferred stock was converted to WPHI common stock and additional convertible notes in a recapitalization completed in September 2013.
In connection with the RTO, WPHI completed a private placement, the Private Placement, of 6,125,000 subscription receipts, the Subscription Receipts, on March 17, 2014 for aggregate gross proceeds of CDN$24.5 million ($22.3 million) at a price of CDN$4.00 per Subscription Receipt. Immediately prior to the completion of the RTO, (i) each Subscription Receipt converted into one share of WPHI common stock, a WPHI Share, after the consolidation of WPHI Shares on the basis of one-post consolidated WPHI Share for every 1.557612 pre-consolidated WPHI Shares, the WPHI Consolidation, (and ultimately entitling the holder thereof to acquire one common share of Northern Power Systems Corp.) and (ii) all of WPHI’s outstanding senior secured convertible notes automatically converted into an aggregate of 3,384,755 WPHI Shares. As a result of the closing of these transactions and the payoff of the VEDA mortgage referenced below, as of the date hereof, our outstanding debt has been reduced to zero.
For the nine months ended September 30, 2014, net cash provided by financing activities was $23.2 million compared to net cash provided of $6.6 million for the nine months ended September 30, 2013. The change was
63
Table of Contents
due to the proceeds from our equity transaction as described above partially offset by payoff of the VEDA mortgage balance. As of September 30, 2014, we had $4 million outstanding on our working capital revolving line of credit compared to $0 outstanding as of December 31, 2013.
For the year ended December 31, 2013 net cash provided by financing activities increased by $6.5 million to $6.5 million from $0 million for the year ended December 31, 2012. The increase inflow was due to the issuance of $6.5 million in senior secured convertible notes in 2013.
Off Balance Sheet Arrangements
We do not have any off-balance sheet arrangements and did not have any such arrangements at September 30, 2014 or December 31, 2013.
Contractual Obligations
As described below our long-term debt obligations were zero as of September 30, 2014. We have $4.0 million outstanding on our working capital revolving line of credit and a $1.0 million outstanding performance letter of credit guarantee which is described below in the Comerica Credit Facility section.
On April 16, 2014, at the closing of our reverse takeover transaction, our convertible note obligations met the automatic conversion criteria contained within the note agreement of an equity financing resulting in aggregate gross proceeds of at least $10.0 million. As a result, these notes converted to capital shares upon such closing. The convertible notes were collateralized by a pledge of our capital shares and certain of our intellectual property.
Our mortgage on our production facility is with the Vermont Economic Development Authority, or VEDA. The VEDA mortgage was a variable interest rate loan bearing interest of 3.75%, maturing on October 6, 2015. During June 2014 we sold the facility and paid off the mortgage obligation. There were no early payment penalties on the mortgage. Contemporaneously, we leased the facility back from the buyer for a five year term. We have the right to terminate the lease without penalty upon at least six months’ prior notice effective at the end of the second, third or fourth year of the lease term.
Comerica Credit Facility
In December 2011, we entered into a $2.5 million working capital revolving line of credit with Comerica Bank, or Comerica, for our domestic activities. In February 2013, this line of credit was increased to $4.0 million.
During the fourth quarter of 2013, we had increased our foreign working capital revolving line with Comerica Bank to $6.0 million. This line is guaranteed by the U.S. Export-Import Bank, as well as by us. At September 30, 2014, we had a net maximum supported borrowing base of $5.0 million. As of September 30, 2014 and December 31, 2013 we had $4.0 million and $0 outstanding on the working capital revolving line of credit, respectively. The foreign working capital revolving line of credit with Comerica was scheduled to mature on June 30, 2014. We negotiated a revised credit facility prior to such maturity date with Comerica for the amount of $6.0 million. The renewed facility matures on June 30, 2015. To facilitate certain financing arrangements that our Italian customers have with third parties, we have agreed to provide performance and warranty letters of credit to such customers. The performance letters of credit are payable if we fail to meet contractual terms such as delivery schedules. Such letters of credit decreased the borrowing base by 25% of the face value. The warranty letter of credit guarantees uptime and power curve performance over a one year period starting at commissioning date. Such letters of credit decreased the borrowing base by 100% less the amount of cash collateral held by the bank to secure warranty letters of credit. At September 30, 2014, we had $1.0 million of such performance guarantees outstanding with one customer.
The loan agreement with Comerica contains a financial covenant which requires us to maintain unencumbered liquid assets having a value of at least $1.5 million at all times. At September 30, 2014, we had unencumbered liquid assets having a value of $15.6 million.
64
Table of Contents
The loan agreement also contains various covenants that limit or prohibit our ability, among other things, to:
| • | incur or guarantee additional indebtedness; |
| • | pay dividends on our capital shares or redeem, repurchase, retire or make distributions in respect of our capital shares or subordinated indebtedness or make certain other restricted payments; |
| • | make certain loans, acquisitions, capital expenditures or investments; |
| • | create or incur certain liens; |
| • | consolidate, merge, sell, transfer or otherwise dispose of all or substantially all of our assets; and |
| • | enter into certain transactions with our affiliates. |
For the nine months ended September 30, 2014, we were in compliance with all covenants under this credit facility. Our Mira III reverse takeover did not change our bank covenants.
Summary of Critical Accounting Policies
In our financial statements, as included in this filing, we discuss various significant accounting policies. In this Management’s Discussion and Analysis of Financial Condition and Results of Operations, we highlight certain of our most critical policies along with certain other critical disclosure as it relates to these policies, including:
Use of Estimates — The preparation of financial statements in conformity with GAAP requires us to make estimates and assumptions that affect the amounts reported in the consolidated financial statements and accompanying notes. Actual results could differ from those estimates. Periodically, we evaluate our estimates, including those related to our accounts receivable, valuation allowance for inventories, useful lives of property and equipment and intangible assets, accruals for product warranty, estimates of fair value for share-based compensation and the recording of warrant liabilities, income taxes and contingencies, among others. We base our estimates on historical experience and on various other assumptions that we believe to be reasonable at the time they are made, the results of which form the basis for making judgments about the carrying values of our assets and liabilities. There were no significant changes in our critical accounting policies during the nine months ended September 30, 2014 from the prior year end.
Revenue Recognition — We generate revenue from three principal sources: product sales and services, technology licensing and technology development. Related accounts receivable are stated at their estimated net realizable value. Accounts receivable are charged to the allowance for doubtful accounts when deemed uncollectible.
We recognize revenues from product sales when delivery has occurred under completely executed sales agreements with selling prices fixed or determinable, and for which collectability is reasonably assured.
Revenues from service, design activities, and repair time are recognized as our work is performed and collectability is reasonably assured. Our service revenues were related primarily to commissioning activities as well as revenue generated from extended warranties and maintenance and service contracts.
Virtually all of our turbine sales contracts include multiple elements that are delivered at different points of time. A deliverable in an arrangement qualifies as a separate unit of accounting if the delivered item has value to our customer on a stand-alone basis. Our contracts are composed of two or three units of accounting: the turbine product, commissioning services, and frequently, but not always, extended warranty services.
For these arrangements, our revenue is allocated to each of the deliverables based upon their relative selling prices as determined by a selling-price hierarchy. We have determined that vendor-specific objective evidence, or VSOE, and third-party evidence, or TPE, are not currently available for our elements and therefore management’s best
65
Table of Contents
estimate of selling price, or BESP, is currently used. VSOE is the price at which we independently sell each unit of accounting to our customers. TPE is the price of any competitor’s largely interchangeable products or services in stand-alone sales to similarly situated customers. BESP is the price at which we would sell the deliverable if it were sold regularly on a stand-alone basis, considering market conditions and entity-specific factors. We re-evaluate the existence of VSOE and TPE in each reporting period and utilize the highest-level available pricing method in the hierarchy at any time.
Revenue related to our licensing intellectual property is recognized per ASC Topic 605-25-3, “Revenue Recognition, Multiple Element Arrangements, Units of Accounting” which refers to SAB 100 Subtopic 13.A.3(d), “License Fee Revenue”, which states that delivery for revenue recognition purposes does not occur until the license term begins. Therefore, we do not recognize revenue from the licensed intellectual property until the customer has the right to use the intellectual property per the terms of the contract, physical delivery of the intellectual property has occurred and all other revenue recognition criteria have been met. There may be instances in which the intellectual property has been delivered but other services such as training, installation support, or supply chain certification are necessary for the customer to fully benefit from the intellectual property. In those cases, revenue recognition may be deferred until such services are delivered. For contracts to perform development services we record revenues using either the percentage-of-completion method, or the milestone method, in which case revenue is recognized by the achievement of design milestones agreed to in the contract depending upon specific facts and circumstances.
For all product sales that have not yet been delivered by us, the related revenue and product costs are deferred until our delivery occurs. Customers may also elect to purchase extended warranty agreements that are deferred and recognized over the covering years, generally year’s three through five of the turbine’s life.
Accounts Receivable — Our customers operate primarily in the distributed energy market place and include wind developers and end users that cover multiple industries and geographic locations. Our products and services are sold under contracts with varying terms including contracts denominated in foreign currencies. A portion of our accounts receivable are denominated in foreign currencies, primarily in euro, decreased from 60% of accounts receivable at the year ended December 31, 2013 to 37% as of September 30, 2014. We expect the proportion of foreign denominated account receivable to continue to increase as we expand sales internationally. We record all accounts receivable in U.S. dollars and adjust the U.S. dollar amount monthly to account for changes in exchange rates. As the percentage of contracts denominated in foreign currencies increases, losses or gains due to fluctuations in currency exchange rates could be material. We do not currently engage in any hedging strategies, but we may consider hedging strategies in the future.
Warranty Costs — Our warranty contract with customers of our distributed-class wind turbine products is sometimes limited to repair or replacement of parts and typically expires two years from the date of shipment or commissioning. In such cases, we have typically provided non-warranty obligated services at no charge during the initial two-year period. Customers may elect to purchase from us extended warranty coverage for repair or replacement of parts for a period covering year’s three to five of the product life.
We record estimated warranty obligations in the earlier period of: (i) the period in which the related revenue is recognized or, (ii) the period in which the obligation is established. Warranty liabilities are based on estimated future repair costs incurred during the warranty period using historical labor, travel, shipping, and material costs, as well as estimated costs for performance warranty failures, when applicable, based upon historical performance experience. The accounting for warranties requires us to make assumptions and apply judgments when estimating product failure rates and expected costs. Adjustments are made to warranty accruals based on claim data and experience. If actual results are not consistent with the assumptions and judgments used to estimate warranty obligations, because either failure rates or repair costs differ from our assumptions, our resulting change in estimate could be material.
Warrants Classified as Liabilities — In certain reported periods we have warrants that represent a free-standing financial instrument that did not qualify for equity classification pursuant to ASC Topic 815-40,
66
Table of Contents
“Derivatives and Hedging: Contracts in Entity’s Own Equity”, and were therefore presented by us as a liability which was revalued periodically, as of the reporting dates of these financial statements. We account for liability classified warrants by recording them initially at fair market value estimated using the Black-Scholes option or other appropriate pricing model. We then revalue the warrants periodically and any resulting change in the fair value of the warrants is recorded within our condensed consolidated statements of operations, presented as a separately disclosed item. We also revalue warrants immediately prior to any exercises of warrants, and as of each reporting date. All outstanding warrants were exercised or cancelled as of December 31, 2013.
Share-based Compensation — Prior to September 29, 2011, we had only equity classification option awards. On September 29, 2011, we completed a share option exchange program which resulted in the majority of our options being classified as liability-based awards. For equity awards, share-based compensation expense is recognized based on the fair value of the awards on the grant date and amortized on a straight-line basis over their vesting terms. For modified liability awards, we revalue the awards at each reporting period until settlement of the award. Share-based compensation expense is recognized as the greater of the fair value of the awards on the grant date or reporting date, amortized on the straight-line basis over their vesting terms. For awards initially issued as liability-based awards, we revalue the awards at each reporting period until settlement of the awards, with share-based compensation expense recognized based upon the fair value of the awards as of the reporting date, amortized on the straight-line basis over their vesting terms. Awards that have vested but are not settled are revalued at each reporting date and any excess of the current fair value over the grant-date fair value is recognized as share compensation expense in such period. We present our liability for applicable option awards based upon reporting-date fair market value for such awards.
Share-based compensation expense is recorded net of anticipated forfeiture rates for unvested equity, and liability awards. We consider many factors when estimating the share-based compensation forfeiture rate including employee class, economic environment, historical data, and anticipated future employee turnover. We review our forfeiture rate when changes in business circumstances warrant a review, and perform a full analysis annually as of December 31.
We account for share-based compensation issued to nonemployees at the fair value of equity instruments given as consideration for services rendered as a noncash expense to operations. The equity instruments are revalued on each subsequent reporting date, until the measurement date is determined. We follow modification accounting guidance under ASC Topic No. 718, “Stock Compensation”, when changes in the terms of granted options occur.
Valuation of our Company — The historical valuations of our company were determined in accordance with the guidelines outlined in the American Institute of Certified Public Accountants Practice Aid, Valuation of Privately-Held-Company Equity Securities Issued as Compensation. In the absence of a public trading market, we considered all relevant facts and circumstances known at the time of valuation, made certain assumptions based on future expectations and exercised significant judgment to determine the fair value of our company, including the following:
| • | Our historical financial results as well as our most recent projections of our future operating and financial performance; |
| • | Recent private capital transactions; |
| • | The rights and privileges of our various classes of equity and debt instruments; |
| • | Overall economic and industry outlooks; and, |
| • | The market performance of comparable publicly traded companies. |
We perform valuations to appropriately present the values for:
| • | The WPHI warrants which, when outstanding, are required to be presented at fair value on reporting dates and at such times as transactions occur; |
67
Table of Contents
| • | Our subsidiary level options which, when outstanding, are required to be presented at fair value on reporting dates and at such times as transactions occur; |
| • | The granting of new options in our subsidiary and consolidated level option plans; and, |
| • | Other equity or debt instruments issued for which fair-value considerations are relevant. |
Such valuations are performed whenever financial reporting or transactional activity warrants us updating our valuation considerations. Significant judgment is exercised in determining the fair value of our company including management’s assumptions on future expectations of cash flows, growth rates, and liquidity needs among others.
To determine the fair valuation of various financial instruments in our capital structure we start by first determining the Business Enterprise Value, or BEV, of our company. We then allocate to each element of our capital structure (our common shares; the WPHI preferred stock, common stock, warrants and convertible notes; and our subsidiary common stock) using the Black-Scholes option-pricing model to determine fair value of the various offerings when applicable.
Estimates of volatility are based on observations similar publicly traded companies and estimates of expected terms are based on estimated time to exercise of the option or warrant. We also utilized the Probability Weighted Expected Return Method, or PWERM, to ascribe a value to the WPHI senior secured convertible notes, when outstanding, and the WPHI common stock. The PWERM applied a range of probabilities to a set of possible outcomes to determine a value for each outcome.
Emerging Growth Company
Accounting Standards Applicable to Emerging Growth Companies: We qualify as an “emerging growth company” pursuant to the provisions of the JOBS Act, enacted on April 5, 2012. Section 102(b)(1) of the JOBS Act also provides that an “emerging growth company” can take advantage of the extended transition period provided in Section 7(a)(2)(B) of the Securities Act for complying with new or revised accounting standards. An “emerging growth company” can delay the adoption of new or revised accounting standards that have different effective dates for public and private companies until those standards would otherwise apply to private companies. We have elected to take advantage of the benefits of this extended transition period, and as a result of this election, our financial statements may not be comparable to those of companies that comply with public company effective dates for new or revised accounting standards for U.S. public companies.
Changes in and Disagreements with Accountants on Accounting and Financial Disclosure
On September 11, 2014, we dismissed CohnReznick LLP, as our U.S. independent registered public accounting firm. On September 16, 2014, at our request and upon mutual agreement, Zeifmans LLP resigned as our Canadian independent registered public accounting firm. Zeifmans LLP had served as our Canadian registered public accounting firm since April 2014. The audit committee of our board of directors approved the dismissal of CohnReznick LLP and accepted the resignation of Zeifmans LLP. From the date that CohnReznick LLP was engaged, to the cessation of the relationship, there were no: (i) disagreements with CohnReznick LLP, whether or not resolved, on any matter of accounting principles or practices, financial statement disclosure or auditing scope and procedures which, if not resolved to the satisfaction of CohnReznick LLP, would have caused CohnReznick LLP to make reference to the matter in its report; or (ii) reportable events (as that term is described in Item 304(a)(1)(v) of Regulation S-K). From the date that Zeifmans LLP was engaged, to the cessation of the relationship, there were no: (i) disagreements with Zeifmans LLP, whether or not resolved, on any matter of accounting principles or practices, financial statement disclosure or auditing scope and procedures which, if not resolved to the satisfaction of Zeifmans LLP, would have caused Zeifmans LLP to make reference to the matter in its report; or (ii) reportable events (as that term is described in Item 304(a)(1)(v) of Regulation S-K). We have provided each of CohnReznick LLP and Zeifmans LLP with a copy of this disclosure and have requested in
68
Table of Contents
writing that they provide a letter addressed to the Securities and Exchange Commission stating whether or not they agree with such disclosures. We have received a copy of CohnReznick LLP’s letter and Zeifmans LLP’s letter and filed them as exhibits to this report.
On September 17, 2014, we engaged McGladrey LLP as our independent registered public accounting firm to perform our December 31, 2014 audit. During the two most recent fiscal years and the interim periods preceding the engagement, we have not consulted McGladrey LLP regarding any of the matters set forth in Item 304(a)(2)(i) or (ii) of Regulation S-K.
Internal Control over Financial Reporting
In connection with the preparation of our financial statements for the period ended September 30, 2013, our management identified a material weakness in our internal control over financial reporting. A material weakness is defined as a deficiency or a combination of deficiencies, in internal control over financial reporting such that there is a reasonable possibility that a material misstatement of our annual or interim financial statements will not be prevented or detected on a timely basis. The material weakness pertained to ineffective controls in the financial statement close process. Specifically, we did not have sufficient accounting resources with relevant technical accounting skills to address issues related to various non-routine transactions and to effectively review financial statements prior to finalization. As a result, the financial statement drafts we prepared contained inaccurate material disclosures.
We believe that we have remediated the material weakness by steps we took in our fourth quarter of 2013 to address the underlying causes of the material weakness, primarily through the continued development and implementation of formal policies, improved processes and documented procedures, as well as the continued sourcing of additional finance resources. In addition to these efforts, we are in the process of documenting and testing our internal control over financial reporting to report on the effectiveness of our internal controls as of December 31, 2015, as required following this offering. We also hired a new corporate controller with public company experience in November 2013. The actions that we took and are continuing to maintain are subject to ongoing senior management review, as well as oversight by the audit committee of our board of directors.
69
Table of Contents
Wind Industry Overview
Wind power has been one of the fastest growing sources of electricity generation globally over the past decade. According to the International Energy Agency, or IEA, in its 2013 Annual Report, wind power currently provides nearly 4% of global electricity with installations in over 100 countries. In the same report, the IEA observed that wind power deployment currently exceeds 318 gigawatts, or GW, of installed capacity globally, which the Global Wind Energy Council, or GWEC, in its Global Wind Statistics 2013 report notes has increased more than 250% since 2008. GWEC further reports in its Global Wind Report-Annual Market Update 2013, or the 2013 GWEC Annual Update, that the new installations added approximately 12.5% to the installed wind base in 2013 and have averaged approximately 21% per year over the last ten years. In its latest Technology Roadmap: Wind Energy (2013 edition), or the 2013 IEA Roadmap, the IEA set targets for wind power to satisfy 15-18% of worldwide electrical power demand by 2050, up previously from 12%.
The growth in the industry is largely attributable to increasing cost competitiveness with other power generation technologies and growing public and governmental support for renewable energy driven by concerns regarding the security of conventional fossil fuel energy supply, as well as the environmental benefits of wind power. National targets for wind and other renewables are also driven by individual countries’ efforts to produce energy domestically, increase employment, build domestic industries, and replace other forms of power generation, such as coal and nuclear.
As global demand for electricity generation from wind power has increased, technology enhancements–supported by government incentives–have yielded increased power output while the cost of wind power has dropped by more than 90% since the 1980s, according to the Revolution Now (September 2013) report, or the Revolution Now report, by the U.S. Department of Energy, or the DOE. According to the Renewables 2014 Global Status Report, or the 2014 Renewables Report, published by the Renewable Energy Policy Network, or REN21, onshore wind-generated power is now cost competitive or nearly so on a kilowatt-hour, or kWh, basis with new coal and gas-fired plants, even without compensatory support schemes, in a wide variety of developed and developing countries including Australia, Brazil, Chile, Mexico, New Zealand, South Africa, Turkey, much of the European Union, or E.U., and some locations in India and the U.S.
The majority of this wind power expansion is currently being driven by installations of utility-class wind turbine farms. These farms generate electricity to feed into the electrical grid, supplying a utility company with energy that can be sold to customer. The utilities that purchase such power still have additional costs to deliver the electricity to the source of use. As such, utility-class power costs are measured as only costs to generate power. Based on our current strategy of pursuing direct sales of utility-class turbines into underserved, smaller scale wind projects and pursuing other sales of these turbines through strategic partners such as WEG, we estimate that our current target addressable market in utility wind is approximately 30% of the global onshore utility wind market.
Wind power also is expanding in the distributed wind market. This market is made up of turbines connected on the customer side of the power meter, designed to meet onsite electrical loads as well as to feed into distribution or microgrids, thereby reducing energy costs at the site of use. The comparable cost of distributed wind energy is the cost for landed power, which is the cost for other forms of energy generation to be produced as well as delivered to the location of consumption.
A subset of the distributed wind market is the small wind market, with small wind turbines commonly defined as those with rated capacities between 1 kW and 500 kW. According to the DOE’s 2013 Distributed Wind Market Report (August 2014), or the DOE Distributed Wind Report, distributed wind applications of all sizes accounted for 69% of the nearly 104,000 total wind turbines deployed in the U.S. since 2003, with small wind turbines representing 99% of the distributed wind market in number of actual units deployed. We currently sell distributed wind turbines with rated capacities of 60 kW and 100 kW. We estimate that our current target addressable market in distributed wind is approximately 50% of the markets in the U.K. and Italy, and 20% of the market in the U.S. We believe there are addressable geographic markets for our distributed wind products outside of these three
70
Table of Contents
geographic markets, and to date have sold products in certain of these other geographies such as the Caribbean, South Korea and the Middle East, but we are not able to estimate the size of these markets.
Both utility and distributed wind energy generation have seen comparable improvements in technology driving their cost effectiveness and expanding adoption.
Cost of New Energy Generation
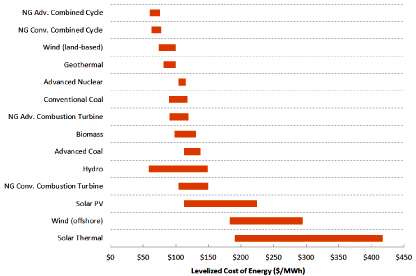
Source: U.S. Energy Information Administration Annual Energy Outlook 2013
Wind Power Markets
The top ten wind power producing countries accounted for approximately 85% of year-end global capacity as of December 31, 2013, but at least 85 countries had commercial wind activity that year, with at least 71 having more than 10 MW of reported capacity, and 24 had more than 1 GW in operation. REN21 reports that annual growth rates of cumulative wind power capacity have averaged 21.4% since the end of 2008, and global capacity has increased eightfold over the past decade. The annual worldwide small wind market is forecast to grow from 144.2 MW in 2014 to 668.1 MW in 2023, representing projected cumulative revenue from installations of $647.7 million and $2.6 billion, respectively, according to Navigant Research’s Global Distributed Generation Deployment Forecast (3Q 2014), or the Navigant report. Our key target wind power markets include the E.U., the U.S., and Brazil.
European Union and United Kingdom
REN21 reports in its 2014 Renewables Report that Europe is the world’s largest market for wind power by electricity generating capacity, accounting for 37% of the world’s total. According to the European Wind Energy Association, or EWEA, Wind in Power: 2013 European Statistics (February 2014) report, or the 2013 EWEA report, wind power accounted for the largest share (32%) of new E.U. power capacity in 2013, with member nations adding more than 11 GW of wind capacity for a total capacity exceeding 117 GW, of which all but approximately 7 GW are onshore turbines. The IEA 2013 Annual Report further states that the total installed power capacity of the E.U. increased by 35 GW from 2012, 28.4% of which was from wind power. Wind power accounted for 32% (11.2 GW) of these new E.U. installations in 2013, followed by solar photovoltaic (31%, 11 GW) and gas (22%, 7.5 GW). In terms of annual European installations, EWEA reports that Germany was the largest market in 2013, installing 3,238 MW of new capacity in 2013, and the U.K. was the second largest, with 1,883 MW. Italy deployed 444 MW of new capacity in 2013.
71
Table of Contents
In 2009, the E.U. set a binding target that 20% of its energy supply should come from wind and other renewable sources by 2020. To achieve this target, more than one-third of new European electrical generating capacity will need to come from renewables in the coming years, with wind power expected to deliver 12% to 14% of the total energy demand, according to the European Renewable Energy Council.
In the distributed wind sector according to Navigant Research, the U.K. is one of the leading markets for small wind turbines (which Navigant Research defines as turbines with rated capacities of 500 kW output or smaller). Navigant Research forecasts the annual installed capacity of small wind turbines to grow from 38.0 MW in 2014 to 73.5 MW in 2023. Based on our view that we target 50% of the small wind market, we expect our target market to grow as much as 36.25 MW in the U.K. in 2023 based on the Navigant Report).
In Italy, Navigant Research forecasts annual installed capacity of small wind turbines to grow from 12.1 MW in 2014 to 59 MW in 2023, representing $74.2 million and $317.4 million, respectively. Based on our view that we target approximately 50% of the small wind market, we expect our target market to grow to as much as 29.5 MW in Italy in 2023, representing revenue of up to $158.7 million in 2023, in each case based on the Navigant report.
United States
Total U.S. onshore wind capacity at the close of 2013 was more than 61 GW compared to 2.5 GW in 1999, with wind energy currently accounting for nearly 4.1% of national electricity generation. In 17 states, wind generation meets more than 5% of electricity demand. The U.S. distributed wind market saw a strong decade of growth with the U.S. adding more than 72,000 turbines since 2003, according to the DOE’s Distributed Wind Report. Navigant Research forecasts annual installed capacity of small wind turbines to grow from 17.5 MW in 2014 to 43.5 MW in 2023 representing $107.5 million and $233.8 million in revenue, respectively. Based on our view that we target approximately 20% of the small wind market, we expect our target market to grow as much as 8.7 MW in the U.S. in 2023, representing revenue of up to $116.5 million in 2023, in each one based on the Navigant Report.
According to the IEA 2013 Annual Report, the U.S. installed 1,087 MW of new wind power capacity in 2013, representing 10% of new U.S. electricity generation capacity as of December 31, 2013, down from 43% in 2012. In the same report, the IEA largely attributed the reduction of installed capacity between 2012 and 2013 to the late extension of the federal government’s production tax credit. However, according to the DOE’s 2013 Distributed Market Report (August 2014), U.S. small-wind turbine manufacturers were able to compensate for the decline by shifting to export markets, which saw a 70% increase in 2013, from 8 MW in 2012 to an estimated total of 13.6 MW in 2013, with Italy, the U.K. China, Germany and Greece as the top export markets. The market showed signs of strengthening by the fourth quarter of 2013, with 10,900 MW of new generating capacity starting construction by the end of the year.
Renewables collectively represent the fastest-growing source of electricity generation capacity in the U.S. with annual growth rates that exceed the growth rate for natural-gas-fired generation and are projected by the Annual Energy Outlook 2014, published by the U.S. Energy Information Administration, or the USEIA, to make up 16% of total U.S. electricity generation in 2040. Total renewable electricity generation is expected to grow by 69% between 2012 and 2040, driven by an increase of more than 140% in generation from non-hydropower renewable energy sources. Of this growth, wind power is projected to provide the largest absolute increase in renewable energy generation, and it is predicted that wind power will surpass hydropower in production capacity by 2036.
72
Table of Contents
Renewable Electricity Generating Capacity by Energy Source 2012-40 (GW)
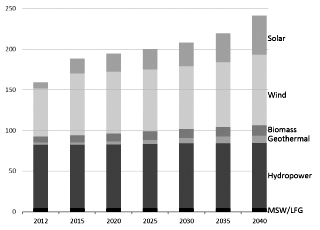
Source: U.S. Energy Information Administration Annual Energy Outlook 2014
According to the IEA 2013 Annual Report, the U.S. wind fleet generated almost 168 GW-hours, or GWh, of electricity in 2013. The IEA 2013 Annual Report also states that the U.S. avoided nearly 96 million tons of CO2 emissions as compared to conventional energy supply alternatives, the equivalent to reducing national power system emissions by 4.4% or to eliminating the emissions from almost 17 million cars.
Brazil
The Brazilian government has set a goal of 17 GW of installed wind capacity to be reached by 2022, accounting for 9.5% of national electricity consumption. According to the 2013 GWEC Annual Update, Brazil is one of the most promising onshore markets for wind energy, for at least the next five years. The same report notes that at the end of 2012, Brazil had 3.5 GW of installed wind capacity, enough to power four million households and accounting for 3% of national electricity consumption. Through the first six months of 2014, Brazil’s wind capacity grew by 1.3 GW, an approximately threefold increase from the previous year, and is projected to approach 7 GW by the end of 2014. Recently, power agreements totaling 4.7 GW were granted to developers in three auctions, all of which power capacity is required to be built by 2018. Over the next five years, Brazil is expecting to install an additional 10 GW of utility-class wind power generation capacity, which represents a near quadrupling of capacity as of the end of December 31, 2013. Brazil is a less promising market for distributed wind for the time being, however, as a weak electrical infrastructure and high retail electricity rates make Brazil, and all of Latin America, attractive for distributed generation technologies in general, according to the Navigant report).
Wind Power Fundamentals
Wind power harnesses the kinetic energy of moving air as wind flows exert a force on the wind turbine blades, which are connected to a rotating shaft. This rotating shaft is connected to an electrical generator that produces alternating current, or AC, power. Wind turbines are equipped with a control and converter system that optimizes electricity generation output for the power grid. In addition, wind power projects are monitored and operated remotely to respond to changing weather conditions and rotating to adjust to shifts in wind direction.
The amount of energy that the wind transfers to the turbine depends primarily on the rotor swept area and the wind speed. The amount of energy captured by a wind turbine increases as a square-function of an increase in the rotor diameter. For example, doubling the swept area of the rotor quadruples the wind energy captured. The
73
Table of Contents
speed of the wind has an even greater effect. As wind speed doubles, the available energy increases by a factor of eight. To maximize the efficiency of the transfer of kinetic energy from wind to electricity, it is vital to choose the blade size that captures the greatest proportion of wind.
As a result of these factors, manufacturers have developed wind turbines with increased blade size to increase the swept rotor area of a turbine, thereby increasing the electricity generation of the turbine and simultaneously decreasing the cost of generated electricity. In addition, manufacturers have successfully increased the hub height of towers to benefit from the greater wind speeds that occur at higher elevations. A typical 2 MW wind turbine today powers approximately 400 homes (based on assumption of 11,500 kWh per home), generating approximately 15 times more electricity than a typical turbine in 1990.
Not only has technological evolution increased a wind turbine’s ability to generate electricity, it has also increased the accuracy with which wind is forecast. New meteorological technology dispatched to a potential project site can measure wind at a higher hub height and rotor swept area with greater accuracy than previous methods. Additionally, improvements and new analytical methods have been incorporated into the prediction models. This improvement in forecasting has increased the predictability of the electricity generation of wind power projects, which, in turn, has increased their ability to attract long-term debt financing.
Wind Power Project Electricity Generation
Wind is a source of energy that is naturally variable; it generally does not blow at a constant speed throughout a given day nor month-to-month. As a result, the amount of electricity generated on a daily or monthly basis is also variable or intermittent. However, long-term historical site-specific measurements for wind power allow for an annual average or “mean” wind speed, enabling the use of statistical analyses to estimate electricity generation.
There are a number of factors that preclude a wind turbine from operating at its maximum theoretical electricity generation, but the primary factor is wind speed. As a result of the variance in wind speed at any given project, a turbine will be operating for significant periods of time at levels less than its maximum electricity generating capacity. Other factors also affect the capacity factor but are generally much less significant, including scheduled annual maintenance of electricity-generating equipment and unscheduled non-operation resulting from equipment failure. In general, wind power projects have capacity factors, defined as the percentage of electricity that an electricity-generating source is expected to generate relative to the maximum theoretical electricity generation in a given period of time, ranging from 20% to 60%, depending on various site and equipment-specific conditions.
Permanent Magnet Generators in the Wind Industry
The permanent magnet generator is a relatively new technology used for both distributed wind and utility wind markets and has attracted strong interest from new and experienced turbine manufacturers alike. A permanent magnet generator uses rotating magnetic fields produced by permanent magnets rather than electromagnetic windings found in traditional generators. The permanent magnet generator is typically interfaced to the utility grid through an AC-DC-AC electronic power converter, enabling variable speed operation which can improve overall operating efficiency and energy capture of the wind turbine.
The permanent magnet generator offers a number of benefits. The use of permanent magnets for excitation purposes avoids the need of external energy for excitation and therefore has the potential to increase the overall efficiency of the generator. One of the permanent magnet generator’s key advantages is its high partial-load efficiency; this is especially significant for wind turbines, which spend much of their life operating below rated power. In some turbine designs, the multi-pole generator rotates so slowly that the need for a speed increasing gearbox is eliminated — a distinctive feature of direct-drive permanent magnet turbines. The main disadvantage of permanent magnet generators compared to traditional generators is that there are few standard products commercially available, making it necessary to undertake the expense and risk of creating a custom design that is specific to a particular project need.
74
Table of Contents
Gearless Direct-Drive Wind Turbines
Gearless direct-drive wind turbines operate without the need for a gearbox. Instead, the turbine’s rotor shaft is attached directly to the generator, which spins at the same speed as the blades. Gearless direct-drive turbines have a simplified drivetrain design and fewer moving parts. While geared turbines typically operate at high speeds of 1,000 to 1,800 revolutions per minute, or RPM, gearless direct-drive turbines operate at slow speeds of approximately 10 to 20 RPM for utility wind applications and 50 to 60 RPM for distributed wind applications. According to the 2013 IEA Roadmap, the market share of gearless direct-drive turbines has increased from 12% to 20% since 2008.
Advantages of Wind Power
Reduced Costs and Improved Power Efficiency
Wind energy already is largely cost competitive with conventional generational technologies, as reported in Lazard’s Levelized Cost of Energy Analysis (September 2014), and it is expected to become even more so. Improvements in wind turbine technology continue to increase the efficiency and reliability of wind power projects. Wind power installations typically use remote monitoring systems, which enable off-site operation and supervision. As a result, operating expenses for wind power projects are generally lower than those of comparably-sized fossil fuel-fired power projects, such as natural gas or coal plants. In addition, fluctuating and potentially volatile fossil fuel prices have little effect on wind power, as wind projects require no additional fuel for their operations. Utilities acquiring wind power historically have been able to lock in a stable price for electricity generated by wind projects for 20 years or more. Accordingly, wind power has driven down the price of electricity nationwide, according to a recent white paper report by the American Wind Energy Association.
Simple Construction
Wind power projects are relatively simple to construct as compared to conventional power projects. Installation of a 60 kW or 100 kW distributed-class wind turbine requires only a few days, and onshore utility-class wind power projects are typically constructed in six to twelve months. Conversely, constructing large-scale hydro power, natural gas, nuclear power, or coal projects generally requires a longer timeframe. As a result, wind power projects are susceptible to far fewer risks associated with construction delays and cost over-runs.
Environmentally Responsible
Wind power projects do not emit any greenhouse gases or contribute to acid rain, both of which have significant negative impacts on the environment. Electricity generation from wind power does not result in externalities including thermal, chemical, radioactive, water, or air pollution that is typically associated with traditional sources of power generation. According to the GWEC Global Wind Report-Annual Market Update 2012, U.S. wind power projects avoid the emission of approximately 100 million tons of carbon dioxide annually, and conserve an estimated 35 billion gallons of water annually, which would otherwise be used for steam or cooling by conventional power projects. According to the EWEA, 140 million tons of carbon dioxide emissions were avoided in the E.U. through the use of wind energy in 2011. While wind power projects can periodically harm birds and bats, we believe that a well-designed and operated wind power project can minimize these impacts and have a significantly lower environmental impact relative to most environmentally-responsible conventional power projects. No other power plants being built today in the U.S. generate zero-emissions electricity as affordably (on a per kilowatt-hour basis) as wind power plants do. Using wind power lowers the cost of complying with emissions reduction goals, laws, and regulations.
Installation Flexibility
Onshore wind turbines can range in output and can be configured in various sizes from small, local installations to wind power turbines in excess of 2 MW that can provide power to approximately 400 homes in the U.S.
75
Table of Contents
(based on assumption of 11,500 kWh per home). The capacity to generate wind power can be tailored and installations can be deployed to match the requirements of the end user, such as a farm, village, municipality, or island.
Limited Use of Land
Wind power projects require only a small percentage of the land reserved for road access and foundations for wind turbines. The remainder of a wind power project site is available for other uses such as agriculture, industry and recreation. We believe a typical wind power project uses only 1% to 5% of the land area leased to or owned by the project.
Key Drivers of Demand for Wind Power
We believe the following factors have driven, and will continue to drive, the growth of wind power globally:
Requirement for New Electricity Generating Capacity
The IEA in its World Energy Outlook 2013 Factsheet expects demand for global net electricity generation to increase by one-third from 2011 to 2035. In the U.S. and Canada, in addition to the required new electricity generating capacity associated with this growth, we believe that further capacity additions will be required to replace aging fossil fuel-fired and nuclear power projects. With the current low natural gas price environment, and increased sensitivity regarding environmental concerns, it is expected that natural gas and renewable energy, including wind power, will be the future choice for new electricity generating capacity.
Governmental Policies and Incentives
As a result of growing concerns within the international community regarding the supply and price of fossil-fuels and growing demand for renewable energy sources, governmental policies continue to support the addition of renewable energy sources including wind power. We believe that the most important governmental policies supporting wind power have been and continue to be the following: feed-in-tariff programs such as those in U.K. and Italy; the renewable energy standards such as the National Renewable Energy Plans in the E.U.; and the state renewable portfolio standards in the U.S.
In the distributed wind markets in which we currently sell our products, a variety of incentives have promoted the introduction of wind power while greatly reducing the payback period for investments in wind turbines for property owners and businesses. Such incentives take the form of feed-in-tariffs, tax breaks or cash incentives to purchasers of wind power systems. As a result, the effective price or cost to the user is greatly reduced making the return on investment much more attractive and lowering the time period it takes to generate enough energy to recover the total cost of the system. While many customers are attracted to renewable energy for its positive environmental attributes, the ultimate decision often centers on a cost/benefit and investment return analysis. Governmental and private (utility-sponsored) incentives play an important role by lowering the effective cost to the end user of a wind power system and thereby making a purchase more attractive.
Italy
The Italian market benefits from a support scheme introduced in 2012 that incentivizes distributed wind with a fixed payment for wind power produced and also streamlines the permitting process in many regions. This scheme has resulted in massive deployment of wind power since 2012 and appears likely to continue in the present political environment, where it is generating healthy job growth in depressed areas of the country that have reasonable wind resources such as southern Italy and the islands. Italian feed-in-tariff rates were expected to decline by 2% per year in 2014 and 2015, but the decrease was not implemented in 2014. The Italian government will reassess the program after 2015.
76
Table of Contents
United Kingdom
Since 2010, the U.K. government has operated a feed-in-tariff scheme for renewable energy production. The distributed wind market has seen steady growth under the scheme, despite a forced reduction in the feed-in-tariff built into the annual renewal cycle. The market fundamentals remain strong in the U.K. with excellent wind resources and a need to stabilize power prices. Published information from the U.K. indicates that the feed-in-tariff rates have declined by 10% as of October 2014 and may decline further in April 2015.
Brazil
Brazil is one of the most promising growth countries for utility wind, having run recent auctions with large onshore wind allocations at competitive prices and strong participation from global players in the utility wind industry. Windy regions in Brazil compete well against other sources of generation in Brazil and the government, banks and industry has been ramping activity to support this growth in recent years. Also, to promote employment in the manufacturing sector, countries such as Brazil are implementing domestic content requirements for renewable energy projects as well as providing local project finance.
United States
U.S.-state-level renewable portfolio standards and renewable energy targets have been key drivers of the expansion of wind power and are expected to continue to drive wind power installations in many areas of the U.S. According to the IEA 2013 Annual Report, 29 states and the District of Columbia have renewable portfolio standards in place, and eight other states have non-binding goals supporting renewable energy. California, one of our target markets for replacing existing energy sources, has been a leader in renewable portfolio standards with one of the highest state targets. In 2011, the governor of California signed into law legislation that increased the state’s renewable portfolio standard from 20% to 33% by 2020.
In addition, the U.S. federal government has encouraged domestic investment in the wind energy industry and other renewable energy technologies by establishing a tax credit called the production tax credit, or PTC, as part of the Energy Policy Act of 1992. This provision has been extended five times since 1992 and has been allowed to expire on five occasions. For the latest extension in 2013, projects that were under construction before January 1, 2014 qualify for the incentive. Today, the PTC may be earned for produced and sold renewable electricity during the taxable year for a ten year period and currently stands at 2.3 cents per kilowatt hour. Furthermore, the U.S. Congress established the federal business energy investment tax credit, or ITC, as part of the Energy Policy Act of 2005 and extended it under the Energy Improvement and Extension Act of 2008. For new wind-energy system installations of any size, the ITC can be taken instead of the PTC and is equal to 30% of expenditures for projects under construction before January 1, 2014. For new small wind turbine installations (under 100 kW), the ITC is equal to 30% of expenditures for projects placed in service by December 31, 2016. As of December 2014, the U.S. Congress is debating an extension of the PTC and it is currently unknown whether it will be renewed.
Continued Improvements in Wind Power Technologies
Wind turbine technology has evolved significantly over the last 20 years and technological advances are expected to continue in the future. According to the Revolution Now report, the cost of electricity generation from wind projects has dropped over 90% due to the technological advances, which we believe include:
| • | advances in wind power generation technology, particularly the introduction and advancement of permanent magnet direct-drive wind turbines, which have increased power production and efficiency per turbine; |
| • | advances in wind turbine blade aerodynamics and development of variable speed generators to improve conversion of wind energy to electricity over a range of wind speeds, resulting in higher capacity factors and increased capacity per turbine; |
| • | advances in turbine height resulting in the ability to benefit from greater wind speeds at higher elevations; |
77
Table of Contents
| • | advances in remote operation and monitoring systems; |
| • | improvements in wind monitoring and forecasting tools, allowing for more accurate prediction of electricity generation and availability and for better system management and reliability; and |
| • | advances in turbine maintenance, resulting in longer turbine lives. |
Outlook for Energy Prices
We expect that increased demand for electricity coupled with a finite supply of fossil fuels, and capacity and distribution constraints, including volatility in fossil-fuel prices, will result in volatility, but generally continued increases, in electricity prices. The recent shale gas boom has kept current natural gas prices in the U.S. relatively low, while the rest of the world continues to see significantly higher prices. Increasing demand from Asia and a future export market for liquefied natural gas from the U.S. is expected to drive gas price increases throughout the world in coming years. The IEA estimates a reversal of excess gas in the U.S. beginning in 2017 as exports pick up, combined with more gas use in transportation, to drive prices steadily higher into the 2020s. Additionally, electricity generation from natural gas is either exposed to volatility in natural gas prices or is priced at a premium for medium-term, fixed-price gas supply contracts. Wind power projects, in contrast, typically contract for long periods (e.g., 20 years) at fixed prices. As a result, and given the lack of fuel costs associated with wind power projects, we believe that utility-class wind power has become cost competitive with conventional power projects, and that this cost competitiveness will contribute to further growth in wind power.
In the distributed generation market for smaller turbines, we expect that the opportunity for land owners to generate electricity both for personal and business use, as well as to sell net energy produced back to the local utility, will continue to drive demand for wind power. In remote, off-grid locations where a connection to the utility grid is not available, we believe that hybrid systems that combine a wind turbine with an energy source such as a diesel generator, battery, or photovoltaic system, will continue to proliferate to provide an alternative to higher energy prices.
Increasing Obstacles for Conventional Power Projects
Coal and nuclear power projects have faced significantly increasing capital costs due to steep environmental hurdles and regulatory uncertainty according to the USEIA’s Annual Energy Outlook 2013. These hurdles range from complications relating to the disposal of spent fuel to concerns over operational safety and the need to fulfill carbon control requirements. Wind power, in contrast, does not create solid waste by-products, emit greenhouse gases or deplete non-renewable resources during operation, and, as a result, is an attractive alternative to fossil fuel-fired power projects. The USEIA in its Annual Energy Outlook 2013 predicts that by 2040, wind capacity in the U.S. will increase by 27 GW and will continue to be the leading source of non-hydro renewable energy.
Dependence on Foreign Energy Sources
According to the USEIA, in its Annual Energy Outlook 2014-Early Release Overview, the net import share of total U.S. energy consumption was 16% in 2012. In addition, many regions of the world that are rich in energy supply, such as the Middle East and Russia, are politically unstable, raising public concerns regarding the dependence of the U.S. on foreign energy imports and related threats to U.S. national security. The potential for future growth in U.S. wind power generating capacity is supported by the large amount of land available for turbine installations and the availability of significant wind resources. According to the DOE, wind power industry experts estimate that the U.S. has more than 10,500 GW of available land-based wind resources that can be captured economically, assuming 80-meter turbine heights and a capacity factor of at least 30%. Increased public awareness of the dependence of the U.S. on foreign energy sources has generated momentum to diversify the energy supply within the U.S. We believe that wind power, which supplied less than 4.1% of the total net electricity generation in the U.S. in 2013, according to the IEA 2013 Annual Report, is a viable domestic alternative to decrease U.S. dependence on foreign energy sources and satisfy a portion of the expected increased U.S. demand for electricity.
78
Table of Contents
Growing Environmental Concerns
The growing concern over the environmental consequences of greenhouse gas emissions has contributed to the growth of wind power generation. According to the World Meteorological Organization, 2013 ranked as the sixth warmest year on record, and thirteen of the fourteen warmest years have all occurred in the 21st Century. As one of the largest emitters of greenhouse gases in the world, the U.S. and the E.U. have experienced growing awareness of climate change and other effects of greenhouse gas emissions, which has resulted in increased demand for emissions-free electricity generation. As an emissions-free electricity source, wind power is an attractive alternative that is capable of addressing these growing environmental concerns. Globally, GWEC, in its Global Wind Energy Outlook 2014, estimates that annual reductions in CO2 from existing wind power plants were about 372 million tons in 2013.
79
Table of Contents
Company Overview
We are a growing provider of advanced renewable power creation and power conversion technology for the energy sector. We design, manufacture and service next-generation Permanent Magnet Direct-Drive, or PMDD, wind turbines for the distributed wind market, and we currently license our utility-class wind turbine platform, which uses the same PMDD technology as our distributed turbines, to large manufacturers on a global basis. We also provide technology development services for a wide variety of energy applications. With our predecessor companies dating back to 1974 and our new turbine development since 1977, we have decades of experience in developing advanced, innovative wind turbines, as well as technology for power conversion and integration with other energy applications. Since 2008, we have invested more than $130 million in developing and commercializing our wind turbine platforms.
Our PMDD wind turbine technology is based on a simplified architecture that utilizes a unique combination of a permanent magnet generator and direct-drive design. The permanent magnet generator provides higher efficiency and higher energy capture than units that utilize a traditional gearbox design. Importantly, the direct-drive design of our turbine utilizes significantly fewer moving parts than traditional geared turbines, which increases reliability due to reduced maintenance and downtime costs.
The substantial majority of our current sales are in the small wind subset of the distributed wind market, which commonly consists of turbines with rated capacities of 500 kW output or smaller. Based on the number of turbines that we have sold and installed to date, we consider ourselves a leader in the U.S., U.K., and Italy in the larger energy output sub-segment of this market, which comprises turbines ranging in size from 50 kW to 100 kW. Since the introduction of our second generation 60 kW and 100 kW PMDD wind turbines in late 2008, we have shipped over 400 of these turbines and as of September 30, 2014, we have orders approximating $33 million in backlog for our second and third generation turbines. To date, these shipped units have run for over six million hours in the aggregate. Our distributed wind customers include financial investors and project developers which deploy our turbines to provide power for farms, remote villages, schools, small businesses, and U.S. military installations.
We are advancing our efforts to sell our utility-class wind turbines. We have developed a 2 MW turbine platform with three wind-speed regime variants based upon our PMDD technology, of which the 2.3 MW variant is certified to International Electrotechnical Commission, or IEC, standard 61400-1 by Det Norske Veritas, or DNV, a globally recognized certification firm. In 2013, we launched a strategy of partnering with large-scale manufacturers in developing regions, starting with a multi-billion dollar (in revenue) industrial equipment manufacturer based in Brazil (WEG Equipamentos Elétricos S.A., or WEG). We have licensed our technology to WEG exclusively for Brazil, but retain our right to sell Northern Power-branded utility-class turbines produced by WEG on a rest-of-world basis. WEG has executed a backlog of orders comprising over 300 MW of turbine installations for the sale of turbines built using our design, eleven of which have been installed to date in Brazil. We are also seeking a limited number of similar partnership structures in other regional geographies, through which we intend that other large-scale manufacturers will produce and sell turbines for their domestic market and make available to us the supply of turbines to expand our regional ability to sell such turbines. We believe this approach will allow us to participate in the utility-class wind turbine market without a significant investment in capital equipment that would otherwise be required. Our direct sales strategy for utility-class wind turbines is directed primarily towards North America and focuses on underserved, smaller scale wind projects such as those generating 50 MW or less. As part of our market entry plan, we intend to be a minority investor in the development of a limited number of these wind power projects to ensure initial sales of our utility-class turbines. After a number of these installations, we plan to participate in the same utility wind marketplace solely by selling the turbines without providing any investment. We also intend to expand our sales and marketing capabilities to execute this strategy.
In addition to wind turbine development, we provide technology development services to customers to develop products and technology for a variety of complex energy applications, including energy storage, microgrids, and
80
Table of Contents
grid stabilization. While the customer owns the developed technology for a limited field of use, we typically maintain a license for all other applications and all other markets. While we do not expect material revenue from our development services, these services fund the expansion of our intellectual property portfolio. We have been developing our power converter technology since the early 2000s and currently sell our MW power converters under the branded name of FlexPhase. We have offerings that range in size from 110 kVA to 1.3 MVA, and that can be readily paralleled for applications of 5 MW and above. Our power converters are modular in nature allowing for a common platform to service multiple applications. As of November 30, 2014, we have deployed over 100 MW of products based on this technology and intend to commercialize sales of these products outside of the wind industry.
For the nine months ended September 30, 2014 and 2013 and the year ended December 31, 2013, we generated $42.6 million, $11.6 million, and $20.6 million in revenue, respectively. For the nine months ended September 30, 2014 and 2013 and the year ended December 31, 2013 we incurred net losses of $5.5 million, $9.3 million and $14.1 million, respectively.
We were originally incorporated in Delaware on August 12, 2008 as Wind Power Holdings, Inc., or WPHI. On April 16, 2014, we (as WPHI) completed a reverse takeover transaction, or RTO, with Mira III Acquisition Corp., a Canadian capital pool company incorporated in British Columbia, Canada, or Mira III, whereby all of the equity securities of WPHI were exchanged (as described below) for common shares and restricted voting shares of Mira III, which became the holding company of our corporate group. In connection with the RTO, Mira III changed its name to Northern Power Systems Corp., the WPHI business became Mira III’s operating business, the WPHI directors and officers became Mira III’s directors and officers, and the WPHI historical consolidated financial statements included in this prospectus became the historical consolidated financial statements of Northern Power Systems Corp. Also in connection with the RTO, we completed a CDN$24.5 million private placement whereby we issued 6,125,000 subscription receipts.
Immediately prior to the RTO, the shares of common stock of WPHI, or WPHI Shares, were consolidated on a 1.557612-to-1 basis and then all of WPHI’s outstanding senior secured convertible notes automatically converted into an aggregate of 3,384,755 WPHI Shares. Additionally, each subscription receipt issued in the private placement converted into one WPHI Share. In connection with the RTO, each WPHI Share held by U.S. residents who are accredited investors were exchanged for 0.72742473 of our restricted voting shares and 0.27257527 of our common shares. All other issued and outstanding WPHI Shares were exchanged for our common shares on a 1-to-1 basis. Additionally, all outstanding options to purchase WPHI Shares were exchanged and cancelled for options to purchase our common shares on a 1-to-1 basis with terms substantially the same to the options being exchanged.
Our Products and Services
We have three operating business lines, which include product sales and service, technology licensing, and technology development, in addition to a shared services segment.
Product Sales and Service
Distributed Wind
We have developed two wind turbine platforms for the distributed wind market which we manufacture and sell on a global basis. Our 100 kW and 60 kW turbines, which we market under the names NPS 100 and NPS 60, generate electricity for use by farms, remote villages, schools, small businesses and U.S. military installations. These wind turbines are currently generating electricity in U.S., U.K., Italy, certain Caribbean nations, including the Bahamas and the U.S. Virgin Islands, Canada, and South Korea. The NPS 100-21 is designed for high wind sites and is also available in an Arctic configuration for use in extreme temperatures. The NPS 100-24 is designed to deliver optimal power generation in low to moderate wind speeds. For the European market, we offer the NPS 60 turbine, which is designed to capture optimal power generation at lower wind speeds and targeted at
81
Table of Contents
markets where grid connection capacity is a constraint. All of our distributed-class wind turbines are available with three different tower heights to maximize the benefits from siting conditions and comply with permitting requirements.
In September 2014, we launched our third generation turbines in both 60 kW and 100 kW configurations. Our third generation has a larger swept area and superior aerodynamic blade technology, which, based on our engineering modeling, yields improvements in energy capture of approximately 15% over our second generation turbine. It also reduces our customers’ total cost of ownership as the cost of installation has reduced. In addition, we designed the turbine nacelle to be smaller and require fewer components, and as such it is reducing our cost to produce the turbines.
Our customers are typically responsible for installing turbines they purchase from us, and we generally perform commissioning services to ensure that the turbine has been properly installed and is ready to begin generating power upon installation. In some instances, particularly in Italy, we also provide installation services. In those cases, we contract with third-party professional companies to perform the turbine installation. We typically provide a two-year warranty for our wind turbines that commences after commissioning, and offer three more years of extended warranty for an additional charge. In certain markets such as the U.K., our standard warranty is five years. During the warranty period, we monitor the turbines 24 hours a day and 7 days a week and cover parts and labor for unscheduled repairs and replacement.
We also enter into operations and maintenance, or O&M, agreements with customers under which we provide scheduled and unscheduled maintenance. These O&M agreements typically range from one to three years, and the customer pays us a fixed fee for scheduled maintenance and receives a 20% discount from our commercial rates for unscheduled maintenance. In certain markets, we have begun offering a ten-year O&M agreement under which we provide scheduled and unscheduled maintenance and guarantee the performance of the turbine to particular specifications during the term, and we receive a variable fee based on the electricity generated by the turbines subject to the agreement. We utilize both our employees and certified third-party contractors to provide warranty, maintenance and support services. Our use of a network of certified service partners who are located in geographic proximity to our customers reduces our costs of providing these services and also enables us to quickly dispatch components and technicians to the particular site.
For customers who purchase more than a certain number of turbines and enter into an O&M agreement with us, we guarantee that the availability of the customer’s fleet of our wind turbines will exceed a specified percentage on an annual basis. The availability is typically defined as a percentage equal to the total number of hours that a wind turbine is or would be ready and available for operation and the production of energy but for scheduled maintenance, grid unavailability and wind speed and weather conditions falling outside of operation range, divided by the total hours in a year. Furthermore, during the warranty period and the term of the O&M agreement, we typically also guarantee for these customers that at any wind speed, the annual average power output of our wind turbines will be a specified percentage of their designed power output at the same wind speed. We are generally obligated to pay a monetary damage of up to 10% of the purchase price of the wind turbine in case of non-performance or underperformance. To date, we have not had to pay any such monetary damages.
Utility Wind
To serve the utility wind market, we have developed a platform of turbines with different power ratings in the 2 MW range and different rotor sizes designed to meet customer requirements in a range of wind classes, which we currently market under the name NPS 2.X. Two prototypes of our 2.3 MW turbine, which has received type certification to IEC standard 61400-1 from DNV, were sold and installed to operators of a Michigan wind farm in 2011 and have continued to operate at commercial availability in excess of 95%.
Based on the success of our prototypes, in 2013, we entered into a strategic partnership with WEG where we licensed our 2.1 MW, 2.2 MW and 2.3 MW turbine designs to WEG in Brazil on an exclusive basis and in the
82
Table of Contents
rest of South America on a non-exclusive basis. We plan to sell Northern Power–branded turbines manufactured by WEG, which are based on our design and technology, outside of South America. In North America, we plan to focus on the underserved, smaller scale wind projects such as those generating 50 MW or less. As part of our plan to enter into this market, we intend to be a minority investor in the development of a limited number of these wind power projects to ensure initial sales of our utility-class turbines. After a number of such installations, we plan to participate in the same utility wind marketplace solely by selling the turbines without providing any investment.
Power Converters
In addition to wind turbines, we have recently started marketing power converters based on our proprietary FlexPhase technology for complex energy applications ranging from 500 kW to over 5 MW. These energy applications include both grid-connected and off-grid energy storage markets as well as microgrid applications, grid stabilization and power quality enhancement. FlexPhase is our modular power converter platform and uses a proprietary architecture to reduce stress on critical power components.
Services
We provide technical support for our SmartView supervisory control and data acquisition system. SmartView is a remote monitoring and control system which we developed to allow users to monitor and manage system operation, issue control commands, respond to faults and alarms, and capture energy system data.
Technology Licensing
We have licensed certain elements of our wind turbine technology to two large, global manufacturers.
WEG Equipamentos Elétricos S.A. (WEG)
Under our 2013 license agreement with WEG, we have provided WEG with the designs for our 2.1 MW, 2.2 MW and 2.3 MW wind turbines. We are being paid a milestone-based license fee and royalties on turbines shipped by WEG during the five-year term of the agreement. We have completed a number of technology transfer milestones under this agreement, and WEG has executed a backlog of orders comprising over 300 MW of turbine installations for the sale of turbines built using our design, eleven of which have been installed to date in Brazil. The agreement will automatically extend for an additional five years at the completion of the initial five-year term, but WEG’s continuing exclusivity in Brazil is dependent on WEG selling a minimum number of turbines during the initial term. In addition to our strategic partnership which is focused on the producing utility-class wind turbines, we are also negotiating the terms under which WEG would be permitted to manufacture and sell the NPS 100 kW turbine in the South American market. We expect that agreement to have similar provisions regarding royalty payments on a per unit basis.
China First Heavy Industries (CFHI)
We granted CFHI a non-exclusive license to develop 3 MW or greater turbine platforms solely in China based on our PMDD technology. We received a substantial one-time license fee in April 2012. CFHI also purchased a partial prototype 2.3 MW turbine that we manufactured, and has installed it as a test bed. The agreement permits us to license technology to other companies in the growing Chinese wind market and develop and sell turbines directly or through channel partners into that market.
Technology Development Services
Our engineering team provides technology development services that are targeted to the global wind power market as well as other advanced energy markets. Our team of 39 engineers has cultivated deep expertise in the
83
Table of Contents
power sector by leveraging decades of power systems and wind turbine design, manufacturing and deployment experience with core competencies in power electronics, testing, and diagnostics. Applications of our technology development services have included energy storage, microgrids, and grid stabilization and have been delivered to a wide range of industries. Our customers own the developed technology for a limited field of use, but we typically maintain a license for all other applications and all other markets. While we do not expect material revenue from these services, these services fund the expansion of our intellectual property portfolio.
This business line has comprehensive in-house design and development capabilities, including rapid prototype production, validation testing, systems level engineering, grid modeling, and remote monitoring systems. The ability to rapidly design, test and produce both prototypes and initial production units for customers differentiates us from large multinationals which have long product cycles and generally target very large market opportunities. Additionally, our team can optimize products for specific applications that may be poorly served by standard, off-the-shelf components.
In February 2014, we entered into a Development Agreement with WEG to design and develop a 3.3 MW wind turbine. WEG will have the right to manufacture and sell turbines built based on this design on an exclusive basis in South America, Central America (excluding the Caribbean) and sub-Saharan Africa. WEG is paying us milestone-based development fees under this agreement. We expect that at the conclusion of this development that both WEG and we will further improve our positions in the global utility wind marketplace by expanding our respective portfolio of product offerings.
Shared Services
Our shared services segment represents our general and administrative departments. See “Management’s Discussion and Analysis of Financial Condition and Results of Operations — How We Conduct Our Business — Shared Services.”
Our Strategy
We are focused on being a leader in the commercialization of distributed-class wind turbines, expanding our presence in the utility wind markets, and strategically leveraging our proprietary technology by expanding our product offerings in power creation and power conversion.
Key elements of our strategy include:
Continuing to drive sales growth in distributed wind
We intend to continue to increase sales in the growing distributed wind power market, by improving the economics of our product offerings for our customers and deepening our relationships with our existing customers as well as adding new customers. In addition, we plan to capitalize on the growth opportunities for distributed wind power by furthering our technology leadership, assisting in third-party financing solutions, and customizing our offerings to efficiently reach a broad array of geographies.
Expanding into the utility wind market
In addition to sales of utility-class turbines by our strategic partners based on our licensed technology and designs, we intend to directly sell utility-class turbines into underserved, smaller scale wind projects where we can take advantage of our industry relationships. We believe that there is demand globally for utility-class turbines to be deployed in wind farms of 50 MW or less, and do not believe that large, global utility-class turbine manufacturers will pursue these opportunities, which are of substantially smaller scale than their typical deployments. We intend to execute this strategy without significant deployment of our capital by leveraging the manufacturing capabilities of our strategic partners and expanding our direct sales and marketing capabilities.
84
Table of Contents
We also plan to enter into additional strategic partnerships for which we expect to receive additional licensing and other revenue and benefit from additional manufacturing capacity. In addition, we believe this strategy will allow us to expand our direct sales into the European and Asian markets.
Maintain our technology leadership and expand our intellectual property position
We believe that we have established technology leadership through decades of experience in designing, manufacturing, and deploying wind turbines ranging in size from 60 kW to 2.3 MW, all of which utilize our PMDD technology. Our strong intellectual property portfolio has been developed over the course of decades and includes more than 85 global patents and applications, know-how, and trade secrets covering power electronics, generator and turbine design, turbine servicing, and manufacturing methods. We intend to continue to build upon our intellectual property portfolio through both our own research and development as well as opportunistically considering acquisitions of complementary technologies. In addition to our own research and development efforts, we currently plan to co-develop both onshore and offshore turbine platforms and sell these turbines both directly and through our strategic partners in markets across the globe.
Pursue growth opportunities for power conversion product line
We have developed and qualified our FlexPhase modular power converters to meet varying energy management and storage system needs by engineering a highly flexible, modular system architecture and integrating scalable controls. Since these power converters were developed under constrained spatial specifications, they have greater power density and represent more advanced technology than most utility-scale power converters currently in the market. As a result, we believe that our power converters can be adapted to a wide variety of applications. Going forward, we intend to continue to customize our proprietary power conversion technology for developing applications and market our products to pursue revenue opportunities outside of use in wind turbines.
Optimize supply chain management
As we continue to expand our business and launch new products, we intend to continue to build our supplier network by identifying new suppliers, directly or through relationships established by our strategic partners, and working with our existing suppliers to develop relevant technological advancements. In addition, we intend to continue to target an optimal balance between in-house production and sourcing from external suppliers. We expect that these supply chain initiatives, in combination with our engineering efforts, will reduce the cost to manufacture our products, lower our customers’ overall cost, and permit us to gain access to new markets that are not dependent on incentive programs or other government policies.
Our Competitive Strengths
We believe that the following strengths enable us to compete effectively in the wind power technology and renewable energy industries and to capitalize on the growth of those industries.
Extensive Research and Development Expertise
Over the past several decades, we have developed a broad portfolio of intellectual property. Notable technologies we have developed include our highly efficient, but low cost, permanent magnet generator, our modular turbine design, our full power converter, and our voltage stabilization capabilities. In addition, we have expanded our capabilities by offering development services in the renewable energy sector for a variety of complex energy applications, including energy storage, microgrids, and grid stabilization. Our experienced team of 39 engineers has been working together for decades with advanced design and testing capabilities and can quickly develop and incorporate new intellectual property into commercial products. Our engineering team has designed and built turbines ranging in size from 60 kW to 2.3 MW, and has the capability to design much larger turbines for onshore and offshore applications. We believe that we are the only company in the distributed wind business that
85
Table of Contents
has this multi-market experience. Going forward, we expect to leverage our core research and development capabilities to pursue continued advances in our current products as well as the development and refinement of new products and applications.
Advanced Product Offerings
Our wind turbines are designed for high availability, high energy output and low energy production cost per kWh in a wide range of wind conditions throughout the world. In both our distributed-class wind and utility-class wind platforms, we offer a range of power ratings, rotor sizes and tower heights to meet customer and siting requirements in a range of a wind classes. For example, our NPS 100-24 and NPS 60-23 turbines are designed with a larger rotor diameter and longer blades to capture more energy at lower wind speeds, while their lower RPM and tip speed make for quieter operation to comply with permitting restrictions. The longer blades provide our wind turbines a larger swept area and a lower cut-in wind speed, the minimum speed at which the turbine can start rotating and generating power. This feature increases the overall output of our wind turbine, particularly under low wind conditions.
Robust Products
Since the introduction of our second generation 60 kW and 100 kW PMDD wind turbines in late 2008, we have shipped over 400 of these turbines, which have run for over six million hours in the aggregate and have averaged 98-99% availability for grid-connected turbines. Key to the high level of reliability of our products is the fact that our wind turbines are engineered to be extremely robust.
We engineer our wind turbines to withstand a variety of harsh conditions in severe environments such as those in Alaska, the Caribbean and Scotland by designing in features such as reinforced blades and a triple braking system. Therefore, we believe that our products are robust and well-suited for reliable operation in nearly all environments. For example, our distributed wind fleet has achieved over one million run time hours in hurricane-speed winds, all without incident, including two of our turbines installed on an island in the Bahamas, which withstood winds of over 107 miles per hour during Hurricane Irene in 2011 and again in 2012 during Hurricane Sandy, and then returned to normal operation, as designed. In addition, our Arctic models of our turbines operate safely in temperatures as low as -40°F during the winter months and have special design and safety features to assure high levels of uptime.
Established Customer Relationships with Large Developers
We serve a global customer base for our distributed-class wind turbines that includes project developers and financial investors, primarily located in the U.K. and Italy. We have developed deep customer relationships with a number of our customers, each of which has extensive experience developing wind and other renewable energy projects in Europe, and we expect these customers will continue to have strong demand for our products in near- and medium-term to take advantage of the feed-in-tariff programs in the U.K. and Italy. We believe that our track record of on-time delivery and our turbines’ successful operating history, which is a direct contributor to the financeability of our turbines, will continue to generate large orders from existing and future customers.
Validated Strategic Partnership Capability
We have developed a strategy for entering into geographic partnerships beginning with WEG. We believe that WEG selected our design due to the suitability of our PMDD wind turbine platform as well as our deep engineering expertise. Seeking to capitalize on the value of our technology, WEG was willing to license our design for sale into the Brazilian domestic market and produce turbines available for us to sell such in any other geography. Based upon our technology, WEG has built a backlog of over 300 MW orders, and is now at scale for production to support their sale of units in Brazil, as well as ours in the rest of the world. We believe that our partnership with WEG provides validation of our strategy, which we intend to replicate in other geographies in order to expand our participation in the global utility-class wind turbine market.
86
Table of Contents
Integrated Development and Manufacturing Capability
We design, assemble and test all components of our distributed-class wind turbines and directly manufacture certain key components such as power converters at our facility in Barre, Vermont. The integration of these functions allows us to rapidly advance our new product introduction while ensuring high quality offering. This factory, which has approximately $100 million in annual revenue capacity at current prices, has strong production capabilities and rigorous system-driven manufacturing processes and quality control.
Experienced Management Team with a Proven Track Record
We have an experienced management team that has successfully expanded our operations and increased our capacity and business through organic growth. Our management team consists of a diverse group of experienced engineers and professional managers, who have deep industry experience or substantial business management experience. Collectively, they have decades of experience in the power generation and power conversion industries and have helped build and grow successful, global businesses in a wide variety of industries.
Our Technology
We believe that our proprietary Permanent Magnet Direct-Drive and full power converter technology differentiates us from other wind turbine companies and provides us with a competitive advantage. In addition, we believe that our systems engineering approach to advanced power system architectures combined with real world experience with hybrid energy applications gives us a competitive advantage in an emerging field.
Gearless Direct-Drive Technology
Our turbine’s generator and rotor are directly coupled and move together at the same speed, without the need for a gearbox. By eliminating the gearbox, we have simplified the drivetrain design and reduced the number of moving parts and wear items. We believe that this gearless design benefits our customers with high-reliability turbines that have lower operating costs and greater efficiency. Geared turbines typically operate at high speeds of 1,000 to 1,800 RPM and involve a complex drivetrain with many gears, bearings and ancillary lubrication and cooling systems. By comparison, our direct-drive turbines are simple in design and operate at slow speeds of approximately 10 to 20 RPM for utility wind applications and 50 to 60 RPM for distributed wind applications. The simplicity of the design is demonstrated by the fact that our turbines only have two drive bearings, as opposed to the more than 50 drive bearings that most geared turbines require.
Our turbines outperform traditional gearbox competitor technology in three critical areas:
| • | Improved reliability: Due to the slower speed of rotating hardware, all critical rotating components and their associated electronics experience much lower physical stress and fewer cycles than those in traditional gearbox turbines. Additionally, the inherently simpler direct-drive construction requires far fewer parts than a traditional turbine design. The substantially lower part count, reduced stress and lower cycle count in the direct-drive platform eliminate many opportunities for part failure while also reducing the complexity of procurement, construction and operation. These elements contribute to our turbines achieving availability of 98-99%, as compared to 95% or lower for traditional turbines. |
| • | Lower operating and maintenance costs: Due to of the simplicity of our drivetrain and the overall lower part count of our turbines, maintenance costs are greatly reduced. Geared turbines typically require gearbox replacement every seven to nine years, which results in both high costs and significant downtime. These costs are avoided with our gearless turbines, the drive trains of which are designed to operate over their full design life without major component replacements. |
| • | Higher efficiency: Directly coupling the generator and rotor increases mechanical efficiency versus traditional geared turbines. Further, there is no friction lost in the meshing of gear teeth. Electrical efficiency is maximized in the generator because the magnetic field is supplied by permanent magnets, |
87
Table of Contents
| which means there is no need to recirculate power from the generator to excite the field. Additionally, the presence of cabling, power conversion and the main transformer inside the nacelle rather than down in the tower reduces copper losses from the long, low voltage cable running down the tower and permits ventilation allowing the wind to help cool electronics. These increased mechanical and electrical efficiencies allow our turbines to yield a higher net energy capture than traditional turbines. |
Permanent Magnet Generator
Our proprietary permanent magnet generator is central to our innovative drivetrain design. In addition, our power converters enable our wind turbines to operate at variable speeds for higher energy capture, and we believe this also provides greater stability to the electrical transmission system than other wind turbines. Our proprietary low speed permanent magnet generator is optimized for efficient energy capture.
Our permanent magnet generator was designed at a systems level in conjunction with our power converter to create an optimized solution tailored for high energy capture and low operating costs. The generator in the NPS 60 and NPS 100 turbine models is cooled directly by the wind. The NPS 2.X utility-class wind turbines use liquid cooling, which reduces mass as compared with other utility-class wind turbine designs.
We are currently the only permanent magnet direct-drive offering in the distributed wind market. Furthermore, we believe that our utility-class permanent magnet generators have three primary advantages over other utility-class permanent magnet technology:
| • | Advanced cooling systems which improve thermal conditions, thus increasing robustness and extending turbine life; |
| • | Improved electrical efficiency due to our patented power converter as well as a unique turbine architecture with all electronics up-tower; and |
| • | Proprietary modular generator and power converter design, which combined with an on-board crane, greatly reduces operating risk and lowers the cost of service. |
Full Power Converter
Another key element of our innovative direct-drive wind turbine design is the power converter used to connect the permanent magnet generator output to the local power system. We design and manufacture the power converters for our wind turbines at our Barre, Vermont facility, with complete hardware, control design and software capabilities. Our full power conversion provides high quality power while also isolating the generator turbine from grid disturbances that could cause damage and downtime, as well as removing the requirement for any external energy for excitation in the energy generation process. Our proprietary FlexPhase power converter combines a unique circuit design with a high bandwidth control system to provide generator management, power quality, and grid support features. Our power converter has controls that can be tuned to optimize operation in multiple non-wind applications and has a liquid-cooled design that can be adapted to any environment. Our FlexPhase circuit architecture also lowers ripple current at the DC side of the converter, minimizing battery heat generation in energy storage applications. Our liquid-cooled design allows the converters to be environmentally sealed and offer high power density and a smaller footprint. The FlexPhase converter also provides improved efficiency over a wide range of power levels and high power quality to support multiple applications. The FlexPhase converter platform offers a modular approach with a small footprint and 20-year design life.
The NPS 60 and NPS 100 wind turbine power converters use the same advanced control systems platform found in the FlexPhase platform, providing reliable and high efficiency operation even on the weak grid systems found in remote village applications.
The features and benefits of our FlexPhase power converter platform make it well suited for other non-wind energy applications, including utility-scale energy storage, advanced grid support, and critical load support applications.
88
Table of Contents
Advanced Power Systems Architectures
We believe through our use of advanced modeling, the incorporation of modern power electronics and rapid prototyping, we meet the varied demands of emerging applications for products and services such as energy storage, voltage and frequency regulation, renewable generation integration and other advanced demand response and grid stabilization applications. In addition, our power conversion and controls technologies are well suited to balancing supply with demand, increasing power quality and reliability for the end-use customer, and reducing distribution losses to create a more efficient system. We have applied the same system-level approach that we have mastered in the design of our wind turbines and considered both the generation and the demand side together to engineer a cost-effective, robust system for cost effective stable power generation throughout the grid.
Customers
Our distributed wind customers include financial investors and project developers, which deploy our turbines to provide power in farms, remote villages, schools, small businesses and U.S. military installations.
Financial investors provide equity capital and raise debt capital, typically from a commercial bank, to build and deploy wind turbines. Financial investors typically look to generate a leveraged return by selling the electricity back to the grid in the form of a feed-in-tariff where the regulatory jurisdiction permits, or sell power to end users who can reduce the cost of electricity by switching away from higher priced power sources.
Owners and operators of projects invest in wind power to reduce the cost that they pay for electricity by switching away from higher priced power sources. These project developers tend to finance through commercial banks and hope to generate a payback over the first few years of operation of the asset.
We expect our customers for our utility-class wind turbines to be large wind farm operators, who in turn sell the generated power to local utilities.
For the nine months ending September 30, 2014, three customers, WEG, CWE Northwind, and Capture Energy Ltd. accounted for approximately 15%, 10%, and 10%, respectively, of our total revenues. In the fiscal year ended December 31, 2013, two customers, IVPC Service S.r.L. and ARG Wind S.r.L., accounted for approximately 14% and 11%, respectively, of our total revenues. In the fiscal year ended December 31, 2012, two customers, CFHI and 3R Energy Solutions Limited, accounted for approximately 44% and 13%, respectively, of our total revenues.
Competition
In domestic and international markets for renewable energy sources served by wind energy, we face competition from companies offering various types of wind turbines.
Our primary competitor in the distributed wind market is Endurance Wind Power. We also compete with several smaller providers of distributed-class wind products. We may face increased competition in the future, including from large, multinational companies with significant resources.
Companies selling direct-drive turbines include Enercon GmbH, Siemens Wind Power, and Xinjiang Goldwind Science & Technology Co., Ltd. While we do not currently compete directly with these companies, we may face indirect competition through our strategic partners who market and sell utility-class direct-drive turbines for large-scale wind farm installations. Once we begin selling directly into this market, we expect to compete against suppliers such as Gamesa Corporación Tecnológica S.A., Suzlon Group, and Nordex, Inc., none of which currently offer direct-drive technology.
Our primary competitors in developing strategic partnerships are companies that regularly seek to license utility-class wind turbine technology, including American Superconductor Corporation, Vensys, a division of Xinjiang Goldwind Science & Technology Co., Ltd., and aerodyn Energiesysteme GmbH.
89
Table of Contents
Although the power conversion market is still developing, we may face future competition from specialty suppliers or large suppliers, such as Siemens Energy, GE Power Systems, and ABB.
We also face competition from other sources of renewable energy, such as solar, hydro, biomass, wave and geothermal, and from conventional energy sources, including coal, natural gas, oil, and nuclear.
Intellectual Property
An important part of our strategy is to continue to develop a strong worldwide intellectual property position in all areas of our proprietary technology. Our intellectual property portfolio includes over 85 patents and patent applications worldwide, know-how and trade secrets, covering many aspects of our products including power electronics, generator and turbine design, turbine servicing, and manufacturing methods. We have invested significant resources in building our intellectual property portfolio, and we believe we have significantly strengthened our position in recent years. As of the date of filing, we owned 34 U.S. patents and had 9 U.S. patent applications pending. Our currently issued patents expire on dates ranging from July 2022 to October 2032. We believe our current patent position, together with our expected ability to obtain licenses from other parties to the extent necessary and our other intellectual property protections noted below, will provide us with sufficient proprietary rights to develop and sell our products.
We control access to our proprietary technology by entering into confidentiality and invention assignment agreements with employees, consultants, partners, vendors and customers. However, policing unauthorized use of our technologies, services and intellectual property is difficult, expensive and time-consuming, particularly in foreign countries where the laws may not be as protective of intellectual property rights as those in the U.S. and where mechanisms for enforcement of intellectual property rights may be weak. We may be unable to determine the extent of any unauthorized use or infringement of our services, technologies or intellectual property rights.
From time to time, legal action by us may be necessary to enforce our patents and other intellectual property rights, to protect our trade secrets, to determine the validity and scope of the intellectual property rights of others or to defend against claims of infringement or invalidity. We may also be subject to claims by third parties alleging that we infringe their intellectual property rights or have misappropriated other proprietary rights. Such litigation could result in substantial costs and diversion of resources and could negatively affect our business, operating results and financial condition. If we are unable to protect our intellectual property rights, we may find ourselves at a competitive disadvantage to others who need not incur the additional expense, time and effort required to create the innovative services that have enabled us to be successful to date.
We use various trademarks and trade names in our business, including Northern Power Systems, Northern Power, NPS, FlexPhase and SmartView, some of which we have registered in the U.S. and in various other countries. This Registration Statement also contains trademarks and trade names of other businesses that are the property of their respective holders. We have omitted the ® and ™ designations, as applicable, for the trademarks we name in this Registration Statement.
Employees
As of January 5, 2015, we had 129 full-time employees, including 39 in engineering, 21 in service and operations, 22 in manufacturing, and 15 in sales and marketing. We also rely on temporary hourly employees to staff our manufacturing operations at a level targeted to meet our production needs. None of our employees are represented by a labor union or covered by a collective bargaining agreement. We have not experienced any work stoppages and we consider our relations with our employees to be good.
Legal Proceedings
We are not a party to any material pending legal proceedings. We may be involved from time to time in various legal proceedings in the normal course of business.
90
Table of Contents
Facilities
We lease our principal manufacturing and headquarters facility in Barre, Vermont, and lease additional office space for use by certain of our engineering, finance and legal teams in Waltham, Massachusetts, and sales offices in Zurich, Switzerland and Bari, Italy.
Our Barre, Vermont facility comprises approximately 115,000 square feet, including a manufacturing floor serviced by a 50-ton crane and multiple shipping bays. This facility includes executive offices and provides the base of operations for our engineers, manufacturing of certain key components, supply chain and customer service functions. We currently assemble all of our NPS 60 and NPS 100 turbines in our Barre, Vermont facility which includes equipment and tooling to assemble and test these turbines, including permanent magnet insertion. In addition, this facility allows us to manufacture generators and power converters both for incorporation into our turbines and on a contract basis. We believe that the current capacity of our Barre, Vermont facility is approximately $100 million in revenue at current prices and assuming one shift of production.
Following our sale of the facility for $1.3 million in June 2014, we entered into a five-year leaseback at $3.00 per square foot plus the cost of certain maintenance expenses, insurance and property taxes. We have the right to extend the lease term for three years, and also have the right to terminate the lease at the end of years two, three and four with six months’ prior notice.
We believe our facilities are adequate for our foreseeable needs, although we are considering relocating to another suitable production and technology space within the state of Vermont.
91
Table of Contents
Executive Officers and Directors
The following table sets forth information regarding our directors and executive officers, including their ages, as of January 5, 2015.
| Name |
Age |
Position | ||||
| Troy C. Patton |
45 | President, Chief Executive Officer and Director | ||||
| Ciel R. Caldwell |
42 | Chief Financial Officer | ||||
| Jonathan A. Lynch |
58 | Chief Technology Officer | ||||
| Elliot J. Mark |
49 | Vice President, Secretary and General Counsel | ||||
| Lawrence D. Willey |
57 | Chief Operating Officer | ||||
| Marcus D. Baker |
56 | Director | ||||
| Alexander Ellis III |
65 | Director | ||||
| Richard Hokin |
74 | Director | ||||
| William F. Leimkuhler |
63 | Chairman and Director | ||||
| Robert L. Lentz |
64 | Director | ||||
| John Simon |
73 | Lead Director | ||||
Troy C. Patton was named our Chief Executive Officer in April 2012. He joined us in April 2009 as President of the Utility Wind business. During that time, he led our successful development of the NPS 2.3 MW permanent magnet direct-drive wind turbine. Mr. Patton has more than 20 years of experience in the power generation industry. From October 2006 to April 2009, he was Senior Vice President of Engineering and Products at Vestas Wind Systems A/S (CPSE:VWS). Before that role, Mr. Patton served in numerous technical and leadership roles at General Electric Company’s (NYSE:GE) Gas Turbine and Wind Turbine businesses, and helped facilitate GE’s integration of Enron’s wind energy business in 2003. Earlier in his career, he served as a load dispatcher and engineer on a U.S. aircraft carrier and U.S. nuclear submarine, respectively. Mr. Patton holds a B.S. in Aerospace and Ocean Engineering from Virginia Polytechnic and State University and an M.B.A. from Clemson University. Our board of directors believes Mr. Patton’s perspective and experience as a senior executive in our industry, as well as his depth of operating experience in the energy industry, provide him with the qualifications and skills to serve as a director.
Ciel R. Caldwell was named our Chief Financial Officer in February 2013. Ms. Caldwell joined us in February of 2011 as Vice President and Corporate Controller. From October 2008 to May 2010, she was the Vice President, Corporate Finance of Vistaprint, N.V. (NASDAQ:VPRT), now known as Cimpress, N.V. (NASDAQ:CMPR), an online marketing solutions retailer. Prior to that, Ms. Caldwell served in various senior financial leadership positions at 3Com Corporation, a global provider of enterprise networking and security solutions, from 2003 to October 2008, including Vice President and Assistant Controller, Senior Director Corporate Accounting, and Director of Investor Relations. Prior to 3Com Corporation, she held senior financial positions at Level 3 Communications, Inc. (NYSE:LVLT), and began her career at PricewaterhouseCoopers. Ms. Caldwell holds a B.S. in Accounting from Babson College.
Jonathan A. Lynch was named our Chief Technology Officer in August 2008. He joined us in September 1980 and has taken an active role in all aspects of power system design including mechanical, electrical, and control subsystems and has a strong knowledge of high reliability, hybrid power systems, distributed generation technology, and wind turbine design. Mr. Lynch has led the development of all aspects of our current technology portfolio. He has directed numerous research and development programs funded by agencies such as the National Renewable Energy Laboratory, National Science Foundation, and the National Aeronautics and the Space Administration. Prior to joining us, Mr. Lynch was employed as a design engineer at Carrier Corporation, modeling and designing high-performance refrigeration systems for transportation applications. Mr. Lynch holds a B.S. in Mechanical Engineering from Stevens Institute of Technology.
92
Table of Contents
Elliot J. Mark joined us in September 2010 as Vice President and General Counsel. Mr. Mark was also named Secretary in August 2011. From May 2009 to February 2010, Mr. Mark served as General Counsel to Gomez, Inc., a website monitoring company. Prior to Gomez, Inc., Mr. Mark was Senior Vice President, General Counsel and Secretary at Salary.com, Inc. (NASDAQ:SLRY), now known as Kenexa Corp., a human capital management company, from October 2006 to January 2009. From September 2003 to September 2006, Mr. Mark was Senior Vice President and General Counsel of Viisage Technology, Inc. (NASDAQ:VISG), an identity technology company, which became L-1 Identity Solutions, Inc. (NASDAQ:ID) in 2006. Mr. Mark previously was General Counsel of eRoom Technology, Inc., and was Associate General Counsel of Arthur D. Little, Inc. and Molten Metal Technology, Inc. (NASDAQ:MLTN). Mr. Mark holds a B.A. in Government from Wesleyan University and a J.D. from the Georgetown University Law Center.
Lawrence D. Willey joined us in May 2014 as the Chief Operating Officer. Mr. Willey is responsible for the creation and execution of our operating plan and accountable for all operational matters including direct responsibility for the Engineering, Supply Chain, Production, Product Management, and Services organizations. From April 2013 to March 2014, Mr. Willey was the Vice President, Energy Business/Services for Energy Northwest, where he was responsible for its non-nuclear power generation and business services assets including hydro, solar, wind and thermal. From 2009–2012, Mr. Willey held a number of Vice President positions for Clipper Windpower Ltd., a former Pratt & Whitney Power Systems company. Prior to that, Mr. Willey worked for 32 years for General Electric Company (NYSE:GE) and for United Technologies Corporation (NYSE:UTX). Mr. Willey holds a M.S. in Mechanical Engineering from Rensselaer Polytechnic Institute, a B.S. in Mechanical Engineering from the University of Hartford, and an A.A.A in Mechanical Engineering from Hudson Valley Community College, Troy, New York.
Marcus D. Baker has been a member of our board of directors since August 2008. He is also President of The Baker Companies, Inc. and a limited partner or member of its related operating businesses including Baker Properties Limited Partnership, Baker Residential Limited Partnership and Baker Investments, LLC. The Baker Companies is a privately owned real estate development and investment organization specializing in industrial and multi-family properties, homebuilding, and certain non-real estate investments including both public and private investments in the energy and healthcare industries. Mr. Baker has been with The Baker Companies in various roles since 1984. Previously, he was an Assistant Banking Officer at Mellon Bank, NA. Mr. Baker holds a B.S. in Economics and a B.S. in Mathematics from Middlebury College. The board of directors believes that Mr. Baker’s extensive managerial and investment experience, and his performance as a member of our board of directors, provide him with the qualifications and skills to continue to serve as a director.
Alexander “Hap” Ellis III has been a member of our board of directors since September 2008. Mr. Ellis has extensive operating experience in electric power and renewable energy. He is a General Partner of RockPort Capital Partners, a leading multi-stage venture capital firm that invests in the areas of renewable and conventional energy, mobility and sustainability. He has been a general partner in RockPort Capital Partners since its inception in 2000 and has primarily focused on renewables, electric grid technologies, advanced materials and transportation and emission control technologies. Prior to the formation of RockPort’s first fund, he joined RockPort Partners, a merchant bank specializing in energy and environmental projects in 1998. Mr. Ellis also serves on the boards of Clean Diesel Technologies, Inc. (NASDAQ CM:CDTI) (Chairman), Gazelle, Inc., and Old Westbury Funds, Inc., as well as the George H.W. Bush Foundation and Cornell Laboratory of Ornithology. In addition, he represented RockPort on the board of Comverge, Inc. (NASDAQ:COMV) from October 2004 to August 2007 and Eka Systems Inc., now a part of Eaton Corporation (NYSE:ETN), from May 2007 to April 2010. Mr. Ellis holds a B.A. in Political Science from Colorado College and an M.B.A. from Yale School of Management. Mr. Ellis’s experience as a director of public companies, combined with his broad experience as a general partner of RockPort Capital Partners in investing in clean tech companies, as well as his ability to assist us with fundraising and other strategic initiatives, and his performance as a member of our board of directors, provide him with the qualifications and skills to continue to serve as a director.
Richard Hokin has been a member of our board of directors since August 2008. He has served as a director of Intermountain Industries, Inc., an oil and gas exploration company, since 1982, and has served as Chairman of
93
Table of Contents
Intermountain’s board and of each of its subsidiaries since 1984. He has been a director of Gorda Estates Limited since 1988 and its Managing Director since 2014. Gorda Estates Limited is engaged in hospitality services and real estate development. Mr. Hokin is Managing Director of Century America, LLC, a privately owned holding company. He has served as a director of the Pacific Coast Gas Association, now known as Western Energy Institute. Mr. Hokin holds a B.A. in English from Princeton University. The board of directors believes that Mr. Hokin’s extensive managerial and investment experience, and his performance as a member of our board of directors, provide him with the qualifications and skills to continue to serve as a director.
William F. Leimkuhler joined our board of directors in November 2013, and was appointed Chairman in December 2013. He has been General Counsel and Director of Business Development of Paice LLC, a privately held developer of hybrid electric powertrains, since 1999. Mr. Leimkuhler also advises a number of technology based companies on business, financial and legal matters. From 1994 through 1999, he held various positions with Allen & Company LLC, a New York investment banking firm, initially serving as the firm’s General Counsel. Prior to that, Mr. Leimkuhler was a corporate partner with the New York law firm of Werbel & Carnelutti. Mr. Leimkuhler has been a director of Argan, Inc. (NYSE MKT:AGX) since 2007 and U.S. Neurosurgical, Inc. (OTCBB:USNU) since 1999. He served as a director of Integral Systems, Inc. (NASDAQ:ISYS) from 2006 to 2011 and Speedus Corp. (OTCPK:SPDE) from 2002 to 2011. Mr. Leimkuhler holds a B.S.E. in Civil Engineering and a M.Eng. in Civil Engineering from the Massachusetts Institute of Technology and a J.D. from New York University. The experience that Mr. Leimkuhler has developed as a legal executive with an investment banking firm, a securities law firm partner and a board member for other public companies makes him a valuable member of our board of directors, particularly with respect to matters relating to financial reporting and corporate governance requirements.
Robert L. Lentz joined our Board in March 2014. Since July 2012, Mr. Lentz has been employed by Northeastern University as an Professor and the Entrepreneur in Residence for the Center for Entrepreneurship Education. Mr. Lentz served as an independent consultant from March 2009 to June 2012; and as the interim Chief Executive Officer of Digital Reef, Inc., a provider of data management platforms, from July 2009 until March 2011; and as the interim Chief Executive Officer of the Managed Analytics Business of Deloitte Consulting LLP from January 2012 to June 2012. Prior to that, he served as President and Chief Executive Officer of Permission TV, Inc., an online video platform provider from September 2006 to March 2010. From September 2003 to September 2006, he was the Senior Vice President of Operations and Chief Financial Officer of OATSystems, Inc., now known as VisibleGains, Inc., a provider of radio-frequency identification (RFID) software for supply chain management systems, which was acquired by Checkpoint Software Technologies Ltd (NASDAQ GS:CHKP). Prior to that, he was Senior Vice President, Operations and Chief Financial Officer of eRoom Technology, a supplier of web-based collaborative workspace solutions, which was acquired by Documentum, Inc. Mr. Lentz has served as a member of the board of directors of Monotype Imaging Holdings, Inc. (NASDAQ:TYPE), a provider of typefaces and technology for creative applications and consumer devices, since August 2008 and currently serves as Chairman. Mr. Lentz was a certified public accountant and holds a B.A. in business administration from Northeastern University and an M.B.A. from Babson College. The board of directors believes that Mr. Lentz’s extensive managerial and operational experience, and his experience as public company director, provide him with the qualifications and skills to serve as a director.
John Simon, Ph.D. has been a director since August 2008, and served as Chairman of our board of directors from that date until December 2013 at which time he became lead director. Dr. Simon is a Managing Director of the investment banking firm, Allen & Company LLC, where he has been employed for over 25 years. He has been a member of the board of directors of Cardica, Inc. (NASDAQ:CRDC), a cardiac surgical device manufacturer, since 2001, and continues to serve on the boards of several privately held companies. He was a member of the board of directors for Neurogen Corporation (NASDAQ:NRGN), a biopharmaceutical company, from 1993 to December 2009. Dr. Simon holds a B.S. in Chemistry from The College of William & Mary, a Ph.D. in Chemical Engineering from Rice University, and both an M.B.A. in finance and a J.D. from Columbia University. The board of directors believes that Dr. Simon is appropriate to serve on the board of directors due to his broad experience in capital markets, corporate and financial strategy, and his having been instrumental in advising us and our board of directors on business development, strategy and capital raising efforts.
94
Table of Contents
Board Composition
Our board of directors consists of seven directors, four of whom qualify as “independent” directors according to the rules and regulations of the Toronto Stock Exchange, or the TSX, and six of whom qualify as “independent” directors according to the rules and regulations of the NASDAQ Capital Market. Our articles of association, as amended, or our Articles, provide for an unclassified board of directors, with each director standing for election annually. The term of each director expires at our annual meeting of shareholders or until their successors are duly elected and qualified.
Our Articles also provide that the number of authorized directors will be determined from time to time by resolution of the shareholders and any vacancies in our board of directors and newly created directorships may be filled only by our shareholders, provided that casual vacancies on the board of directors may be filled by resolution of the other directors. Our compensation and corporate governance committee and our board of directors consider a broad range of factors relating to the qualifications and background of nominees, which may include diversity, which is not only limited to race, gender or national origin. We have no formal policy regarding board diversity.
There are no family relationships among any of our directors or executive officers.
Our board of directors has considered the relationships of all directors and, where applicable, the transactions involving them described below under “Certain Relationships and Related Person Transactions,” and determined that Messrs. Baker, Hokin, Leimkuhler and Lentz do not have any relationship which would interfere with the exercise of independent judgment in carrying out their respective responsibilities as a director and that each non-employee director qualifies as an independent director under the applicable rules of the TSX and, together with Messrs. Ellis and Simon, the applicable rules of the NASDAQ Capital Market.
Committees of the Board of Directors
Our board of directors has a standing executive committee, an audit committee and a compensation and corporate governance committee. The composition and responsibilities of each committee are described below. Members serve on these committees until their resignation or until otherwise determined by our board of directors.
The composition and functioning of our board of directors and all of our committees comply with all applicable requirements of the Sarbanes-Oxley Act, applicable Canadian Securities laws, and NASDAQ Capital Market, TSX, and Securities and Exchange Commission, or SEC, rules and regulations. Each of the committees operate under a written charter that is approved by the board of directors. Each committee reviews and reassesses the adequacy of its charter at least annually. The charters of all three committees are available in the Investor Relations section of our website, www.ir.northernpower.com. Except to the extent expressly stated herein, our website is not incorporated herein by reference.
Executive Committee
The executive committee of the board of directors, or the Executive Committee, is comprised of Marcus Baker, Alexander Ellis III, John Simon and Troy Patton, with Dr. Simon chairing this committee.
The Executive Committee oversees our operations and reviews and approves expenditures in excess of $150,000 and considers other matters that are delegated to such committee by the board or that, in the opinion of the chairman of the board of directors, should not be postponed until the next scheduled meeting of the board. The Executive Committee makes regular reports of its activities to the board of directors.
Audit Committee
Our audit committee of the board of directors, or the Audit Committee, consists of Messrs. Robert Lentz, William Leimkuhler and Marcus Baker, with Mr. Lentz chairing this committee. All members of our Audit
95
Table of Contents
Committee meet the requirements for financial literacy under the applicable rules and regulations of the NASDAQ Capital Market, the SEC, applicable Canadian securities laws and the TSX. Our board of directors has determined that Messrs. Lentz and Leimkuhler are “audit committee financial experts” as defined under the applicable rules of the SEC and have the requisite financial sophistication as defined under the applicable rules and regulations of the TSX and applicable Canadian securities laws. Each member of the Audit Committee is an independent director as defined under the applicable rules and regulations of the NASDAQ Capital Market, the SEC, applicable Canadian securities laws, and the TSX. The Audit Committee operates under a written charter that satisfies the applicable standards of the NASDAQ Capital Market, the SEC, applicable Canadian securities laws, and the TSX.
The Audit Committee’s responsibilities include:
| • | appointing, approving the compensation of, and assessing the independence of our independent registered public accounting firm; |
| • | pre-approving auditing and permissible non-audit services, and the terms of such services, to be provided by our independent registered public accounting firm; |
| • | reviewing and discussing with management and the independent registered public accounting firm our annual and quarterly financial statements and related disclosures; |
| • | coordinating the oversight and reviewing the adequacy of our internal control over financial reporting; |
| • | establishing policies and procedures for the receipt and retention of accounting-related complaints and concerns; and |
| • | preparing the audit committee report required by SEC rules to be included in our annual proxy statement. |
Compensation and Corporate Governance Committee
Our compensation and corporate governance committee, or the Compensation Committee, consists of Messrs. William Leimkuhler, Alexander Ellis, and John Simon, with Mr. Ellis chairing this committee. All members of our Compensation Committee meet the requirements for independence under the applicable rules and regulations of the SEC and the Internal Revenue Code of 1986, as amended, or the Code. The functions of a nominating committee are performed by the Compensation Committee.
The Compensation Committee’s responsibilities include:
| • | reviewing and approving corporate goals and objectives relevant to compensation of our chief executive officer; |
| • | evaluating the performance of our chief executive officer in light of such corporate goals and objectives and determining the compensation of our chief executive officer; |
| • | determining the compensation of all our other officers and reviewing periodically the aggregate amount of compensation payable to such officers; |
| • | overseeing and making recommendations to the board of directors with respect to our incentive-based compensation and equity plans; |
| • | reviewing and making recommendations to the board of directors with respect to director compensation; |
| • | developing and recommending to the board of directors the criteria for selecting board and committee membership; |
| • | establishing procedures for identifying and evaluating director candidates including nominees recommended by shareholders; |
96
Table of Contents
| • | identifying individuals qualified to become board members; |
| • | recommending to the board of directors the persons to be nominated for election as directors and to each of the board’s committees; |
| • | overseeing the evaluation of the board of directors, its committees and management; and |
| • | annually determining the independence of each director for the purpose of his or her membership on the board and each committee, and reviewing any material changes in a director’s circumstances that could adversely impact the director’s ability to carry out his or her duties on the board of directors or any committees thereof. |
Compensation Committee Interlocks and Insider Participation
None of the members of the Compensation Committee is or has at any time been an officer or employee. None of our executive officers serve or in the past fiscal year has served as a member of the board of directors or Compensation Committee of any other entity that has one or more executive officers serving as a member of our board of directors or Compensation Committee.
97
Table of Contents
The following section provides compensation information pursuant to the scaled disclosure rules applicable to “emerging growth companies” under the rules of the Securities and Exchange Commission.
Summary Compensation Table
The following table sets forth the total compensation paid to our chief executive officer and each of our two other most highly compensated executive officers for the year ended December 31, 2013. These individuals are our Named Executive Officers.
| Name and Principal Position |
Year | Salary | Non-Equity Incentive Plan Compensation(1) |
All Other Compensation |
Total | |||||||||||||||
| Troy C. Patton |
2013 | $ | 375,000 | $ | — | (2) | $ | 7,999 | (3) | $ | 384,412 | |||||||||
| President and Chief Executive Officer |
||||||||||||||||||||
| Jonathan A. Lynch |
2013 | 246,000 | 39,562 | 9,431 | (4) | 294,993 | ||||||||||||||
| Chief Technology Officer |
||||||||||||||||||||
| Elliot J. Mark |
2013 | 250,000 | 44,888 | 8,303 | (5) | 303,191 | ||||||||||||||
| Vice President, General Counsel and Secretary |
||||||||||||||||||||
| (1) | Represents annual bonus amounts paid pursuant to the named executive officers’ employment agreements. |
| (2) | Mr. Patton’s bonus for 2013 of $187,500 was paid at the end of 2012. |
| (3) | Consists of: (i) $900 for fuel subsidy, (ii) $512 which we pay towards Mr. Patton’s life insurance coverage, and (iii) $6,586 in matching funds under our 401(k) plan. |
| (4) | Consists of: (i) $900 for fuel subsidy, (ii) $2,171 which we pay towards Mr. Lynch’s life insurance coverage, and (iii) $6,360 in matching funds under our 401(k) plan. |
| (5) | Consists of: (i) $900 for fuel subsidy, (ii) $768 which we pay towards Mr. Mark’s life insurance coverage, and (iii) $6,635 in matching funds under our 401(k) plan. |
98
Table of Contents
Outstanding Equity Awards at Fiscal Year-End Table — 2013
The following table summarizes, for each of the Named Executive Officers, the number of our common shares underlying outstanding share options held as of December 31, 2013.
| Name |
Number of Securities Underlying Unexercised Options (#) Exercisable |
Number of Securities Underlying Unexercised Options (#) Unexercisable |
Vesting Commencement Date(1) |
Option Exercise Price ($) |
Option Expiration Date (3) |
|||||||||||||||
| Troy C. Patton |
125,178 | 500,713 | 11/25/2013 | (2) | $ | 1.59 | 11/25/2020 | |||||||||||||
| 371 | 34 | 2/10/2011 | 3.63 | 2/10/2018 | ||||||||||||||||
| 4,454 | 1,486 | 9/29/2011 | 3.63 | 9/29/2018 | ||||||||||||||||
| 8,125 | 0 | 4/20/2009 | 3.63 | 4/20/2016 | ||||||||||||||||
| 1,234 | 412 | 9/29/2011 | 3.63 | 9/29/2018 | ||||||||||||||||
| Jonathan A. Lynch |
41,859 | 167,438 | 11/25/2013 | (2) | $ | 1.59 | 11/25/2020 | |||||||||||||
| 847 | 0 | 2/10/2011 | 3.63 | 2/10/2018 | ||||||||||||||||
| 1,406 | 470 | 9/29/2011 | 3.63 | 9/29/2018 | ||||||||||||||||
| 5,507 | 0 | 9/29/2011 | 3.63 | 9/29/2018 | ||||||||||||||||
| 931 | 85 | 2/10/2011 | 3.63 | 2/10/2018 | ||||||||||||||||
| 1,172 | 392 | 9/29/2011 | 3.63 | 9/29/2018 | ||||||||||||||||
| 4,594 | 0 | 9/29/2011 | 3.63 | 9/29/2018 | ||||||||||||||||
| Elliot J. Mark |
48,962 | 195,848 | 11/25/2013 | (2) | $ | 1.59 | 11/25/2020 | |||||||||||||
| 5,078 | 0 | 9/7/2010 | 3.63 | 9/7/2017 | ||||||||||||||||
| 913 | 305 | 9/29/2011 | 3.63 | 9/29/2018 | ||||||||||||||||
| 4,237 | 0 | 9/7/2010 | 3.63 | 9/7/2017 | ||||||||||||||||
| 1,094 | 366 | 9/29/2011 | 3.63 | 9/29/2018 | ||||||||||||||||
| (1) | Unless otherwise indicated, the options vest according to the following schedule: one-third of the shares granted vest and become exercisable on the first anniversary of the grant date, with the remaining two-thirds of the shares vesting and becoming exercisable in equal quarterly installments over the subsequent two years. |
| (2) | 20% of shares vested and became exercisable upon grant date, with the remaining shares vesting and becoming exercisable in equal quarterly installments over the subsequent three years. |
| (3) | The options expire on the seventh anniversary of the grant date. |
Employment Agreements and Termination of Employment Arrangements
Each of our executive officers serves at the pleasure of our board of directors. With the exception of his own arrangement, which was negotiated by the board of directors, each of these employment agreements was negotiated on our behalf by our Chief Executive Officer, or by our former Chief Executive Officer, with the oversight and approval of our board of directors.
These agreements provide for “at will” employment and set forth the terms and conditions of employment of each Named Executive Officer, including base salary, target annual bonus opportunity and standard employee benefit plan participation. Each Named Executive Officer has also entered into our standard confidential information and invention assignment agreement.
These agreements also contain provisions that provide for certain payments and benefits in the event of a termination of employment, including an involuntary termination of employment following a “change in control.” In addition, the Named Executive Officers may be entitled to accelerated vesting of certain of their outstanding and unvested awards in certain circumstances.
99
Table of Contents
Involuntary Termination of Employment
Pursuant to their employment agreements, each Named Executive Officer is eligible to receive certain payments and benefits in the event his employment is terminated (i) in the case of Mr. Patton by the company without “cause” or by Mr. Patton with “good reason”, (ii) in the case of Mr. Lynch, by the company without “cause” and (iii) in the case of Mr. Mark, by the company without “cause” or on account of Mr. Mark’s death or disability. In addition to accrued benefits (consisting of unpaid expense reimbursements, accrued but unused vacation to the extent such payment is required by law or company policy, any vested benefits that he or she may have under any of our employee benefit plans and any earned but unpaid base salary payable through the date of termination) and any bonus awarded but not yet paid on the date of termination, upon the timely execution of a fully effective general release of claims in favor of the company, each Named Executive Officer is eligible to receive the following payments and benefits:
| • | base salary continuation for up to 12 months in the case of Mr. Patton, nine months in the case of Mr. Lynch, and six months in the case of Mr. Mark (in each case, subject to earlier termination if subsequent employment is obtained prior to the expiration of the relevant severance period; |
| • | the cost of all health and dental benefits during the severance period; and |
| • | if the Named Executive Officer was participating in a cash bonus plan at the time of such termination, a pro rata portion of the cash bonus payable under such cash bonus plan for the year in which the termination of employment occurs, as determined in good faith by the Compensation Committee. |
Change in Control
Pursuant to his employment agreement, in the event his employment is terminated without “cause” or for “good reason” within 12 months of a “change in control” (as defined in his employment agreement), all of our common shares subject to outstanding and unvested share options granted to Mr. Patton will immediately accelerate, vest, and become fully exercisable as of the date of termination. In addition, pursuant to our 2014 Plan, all share options will automatically become fully exercisable and the restrictions and conditions on all other awards with time-based conditions will automatically be deemed waived upon a “sale event” (as defined in the 2014 Plan).
Definitions
For purpose of the employment agreements, “cause” means:
| • | willful failure substantially to perform an executive officer’s duties and responsibilities to the company or deliberate violation of a material company policy; |
| • | the commission by an executive officer of any act of fraud, embezzlement, dishonesty or any other willful misconduct that has caused or is reasonably expected to result in material injury to the company; |
| • | unauthorized use or disclosure by an executive officer of any proprietary information or trade secrets of the company or any other party to whom such executive officer owes an obligation of nondisclosure as a result of his or her relationship with the company; or |
| • | a willful and material breach by an executive officer of his or her obligations under our assignment of inventions, non-disclosure and noncompetition agreement. |
For purposes of the employment agreements, “good reason” means:
| • | any material breach of an executive officer’s employment agreement by the company or any successor to the company which is not cured within 15 days after written notice by the executive officer to the breaching party; |
| • | failure of any successor to the company to assume and agree to perform the company’s obligations pursuant to the terms and conditions of the executive officer’s employment agreement; or |
100
Table of Contents
| • | to the extent the termination occurs within 12 months following a change in control, an adverse change by the company or any successor to the company to an executive officer’s title, reporting relationship, work location, position, authority, duties or responsibilities which is not cured within 15 days after written notice by an executive officer, it being understood that a sale or spin-off of a portion of the company’s business operations shall not, by itself, constitute an “adverse change.” |
For purposes of the employment agreements, a “change in control” of the company means the consummation of any of the following:
| • | any merger or consolidation in which the company shall not be the surviving entity (or survives only as a subsidiary of another entity whose shareholders did not own all or substantially all of the capital shares of the company in substantially the same proportions as immediately prior to such transaction); |
| • | the sale of all or substantially all of the assets of the company to any other person or entity (other than a wholly-owned subsidiary); |
| • | the acquisition of beneficial ownership of 75% or more of the outstanding shares of capital shares of the company by any person or entity (including a group as defined by or under Section 13(d)(3) of the Exchange Act); |
| • | a contested election of directors of the company, as a result of which or in connection with which the persons who were directors before such election or their nominees cease to constitute a majority of the board of directors of the company; provided however that if the election, or nomination for election by the shareholders of the company of any new director was approved by a vote of at least 50% of the incumbent directors of the company, such new director shall be considered as an incumbent director; |
| • | a company sale event; or |
| • | any other event specified by compensation and governance committee of our board of directors. |
Employee Benefit Plans
2014 Stock Option and Incentive Plan
In April 2014, we adopted and our shareholders approved the Northern Power Systems Corp. 2014 Stock Option and Incentive Plan, or the 2014 Plan. The 2014 Plan provides for the grant of incentive stock options, non-statutory share options, and other types of share awards to our employees, consultants, and directors. 4,000,000 common shares are reserved for issuance upon grant or exercise of awards under the 2014 Plan. This number is subject to adjustment in the event of a share split, share dividend or other changes in our capitalization.
The shares we issue under the 2014 Plan will be authorized but unissued shares or shares that we reacquire. The common shares underlying any awards that are forfeited, cancelled, held back upon exercise or settlement of an award to satisfy the exercise price or tax withholding, reacquired by us prior to vesting, satisfied without any issuance of shares, expire or are otherwise terminated (other than by exercise) under the 2014 Plan will be added back to the shares available for issuance under the 2014 Plan.
Share options and share appreciation rights with respect to no more than 1,000,000 shares may be granted to any one individual in any one calendar year and the maximum “performance-based award” (as such term is used under Section 162(m) of the Code) payable to any one individual under the 2014 Plan is 1,000,000 shares or $4,000,000 in the case of cash-based awards. The maximum aggregate number of shares that may be issued in the form of incentive stock options shall not exceed 1,000,000 shares.
The 2014 Plan is administered by the compensation and governance committee of our board of directors, or the Compensation Committee. The Compensation Committee has full power to select, from among the individuals eligible for awards, the individuals to whom awards will be granted, to make any combination of awards to participants and to determine the specific terms and conditions of each award, subject to the provisions of the
101
Table of Contents
2014 Plan. Persons eligible to participate in the 2014 Plan will be those full or part-time officers, employees, non-employee directors and consultants as selected from time to time by the Compensation Committee in its discretion. All employee share option awards are covered by a share option agreement and vest in accordance with the vesting schedule set forth in such share option agreement. The Compensation Committee may choose to accelerate the vesting schedule, and some employees are entitled to acceleration upon a change of control.
The 2014 Plan permits the granting of both options to purchase common shares intended to qualify as incentive stock options under Section 422 of the Code and among options that do not so qualify. The option exercise price of each option will be determined by the Compensation Committee but may not be less than 100% of the fair market value of our common shares on the date of the grant. The term of each option will be fixed by our Compensation Committee and may not exceed ten years from the date of grant. The Compensation Committee will determine at what time or times each option may be exercised.
The Compensation Committee may award share appreciation rights subject to such conditions and restrictions as we may determine. Share appreciation rights entitle the recipient to common shares, or cash, equal to the value of the appreciation in our share price over the exercise price. The exercise price of each share appreciation right may not be less than 100% of the fair market value of the common share on the date of grant.
The Compensation Committee may award restricted shares and restricted share units to participants subject to such conditions and restrictions as it may determine. These conditions and restrictions may include the achievement of certain performance goals or continued employment with us through a specified vesting period. The Compensation Committee may also grant common shares that are free from any restrictions under the 2014 Plan. Unrestricted shares may be granted to participants in recognition of past services or other valid consideration and may be issued in lieu of cash compensation due to such participant.
The Compensation Committee may grant performance share awards to participants that entitle the recipient to receive common shares upon the achievement of certain performance goals and such other conditions as the Compensation Committee shall determine. The Compensation Committee may grant cash bonuses under the 2014 Plan to participants, subject to the achievement of certain performance goals.
The Compensation Committee may grant awards of restricted shares, restricted share units, performance shares or cash-based awards under the 2014 Plan that are intended to qualify as “performance-based compensation” under Section 162(m) of the Code. Those awards would only vest or become payable upon the attainment of performance goals that are established by the Compensation Committee and related to one or more performance criteria. The performance criteria that would be used with respect to any such awards include: earnings before interest, taxes, depreciation and amortization, net income (loss) (either before or after interest, taxes, depreciation or amortization), changes in the market price of our common shares, economic value-added, funds from operations or similar measure, sales or revenue, acquisitions or strategic transactions, operating income (loss), cash flow (including, but not limited to, operating cash flow and free cash flow), return on capital, assets, equity, or investment, shareholder returns, return on sales, gross or net profit levels, productivity, expense, margins, operating efficiency, customer satisfaction, working capital, earnings (loss) per share, sales or market shares and number of customers, any of which may be measured either in absolute terms or as compared to any incremental increase or as compared to results of a peer group.
The 2014 Plan provides that in the case of, and subject to, the consummation of a “sale event” as defined in the 2014 Plan, all outstanding awards may be assumed, substituted or otherwise continued by the successor entity. To the extent that the successor entity does not assume, substitute or otherwise continue such awards, then upon the effectiveness of the sale event, the 2014 Plan and all outstanding will automatically terminate. In the event of such termination, individuals holding options and share appreciation rights will be permitted to exercise such options and share appreciation rights prior to the sale event. In addition, in connection with a sale event, we may make or provide for a cash payment to participants holding options and share appreciation rights equal to the difference between the per share cash consideration payable to shareholders in the sale event and the exercise
102
Table of Contents
price of the options or share appreciation rights. In addition, except as may otherwise be provided in the relevant award certificate, all share options and share appreciation rights will automatically become fully exercisable and the restrictions and conditions on all other awards with time-based conditions will automatically be deemed waived, and awards with conditions and restrictions relating to the attainment of performance goals may become vested and non-forfeitable in connection with a sale event in the Compensation Committee’s discretion.
The board of directors may amend or discontinue the 2014 Plan and our Compensation Committee may amend or cancel outstanding awards for purposes of satisfying changes in law or for any other lawful purpose, but no such action may adversely affect rights under an award without the holder’s consent. Certain amendments to the 2014 Plan require the approval of our shareholders.
No awards may be granted under the 2014 Plan after the date that is ten years from the date of shareholder approval.
In connection with the adoption of the 2014 Plan and our reorganization in 2014, outstanding options under the Wind Power Holdings, Inc. 2008 Equity Incentive Plan and the Wind Power Holdings, Inc. 2013 Stock Option and Grant Plan were converted on a value-for-value basis to options under our 2014 Plan.
As of November 30, 2014, there are 2,047,020 options to purchase our common shares outstanding under the 2014 Plan, at a weighted average exercise price of $2.06.
Section 401(k) Plan
We maintain a tax-qualified retirement plan that provides eligible employees with an opportunity to save for retirement on a tax-advantaged basis. All participants’ interests in their contributions are 100% vested when contributed. We contribute 50% of the amount contributed by a participating employee, up to a maximum of 6% of the participant’s pre-tax compensation. Pre-tax contributions are allocated to each participant’s individual account and are then invested in selected investment alternatives according to the participants’ directions. The retirement plan is intended to qualify under Sections 401(a) and 501(a) of the Code.
Director Compensation
As of the end of fiscal year 2013, we did not pay any compensation to our directors. Beginning in April 2014, we began to pay cash compensation to our non-employee directors consisting of (i) $20,000 to each non-employee director, (ii) $8,000 to the chairman of the executive committee and the chairman of the audit committee, (iii) $5,000 to the chairman of the board of directors, the chairman of the compensation and governance committee, and the lead outside director, (iv) $5,000 to each member of the executive committee and the audit committee, and (v) $3,000 to each member of the compensation and governance committee. Such fees are paid on a quarterly basis. In May 2014, we issued options to purchase 20,000 of our common shares to each non-employee director. These options were vested on grant.
103
Table of Contents
CERTAIN RELATIONSHIPS AND RELATED PERSON TRANSACTIONS
In addition to the director and executive officer compensation arrangements discussed above under “Executive Compensation,” the following is a description of transactions, or series of related transactions, since January 1, 2013, to which we were a party in which the amount involved exceeded $120,000 and in which the other parties included our directors, executive officers, holders of more than 5% of our voting securities, each Beneficial Owner, or any member of the immediate family of any of the foregoing persons.
Private Placements of Securities
In March and April 2013, we (as Wind Power Holdings, Inc., or WPHI) sold an aggregate of $4.5 million of convertible secured notes to existing investors at a price equal to the principal amount of such notes. In this offering, each holder of more than 5% of our voting securities purchased WPHI convertible notes in the following amounts:
| Purchaser |
WPHI Notes Purchased |
|||
| Allen & Company LLC(1) |
$ | 1,218,149 | ||
| Baker Investments, LLC(2) |
$ | 371,440 | ||
| CWE LLC(3) |
$ | 521,747 | ||
| RockPort Capital Partners III, LP(4) |
$ | 1,322,844 | ||
| (1) | John Simon, one of our directors, is employed by Allen & Company LLC and is the beneficial owner of $314,649 principal amount of such securities. Certain employees, affiliates and related parties of Allen & Company LLC hold a beneficial interest in the shares held of record by Allen & Company LLC. Allen & Company LLC disclaims beneficial ownership of the shares beneficially owned by such employees, affiliates and related parties. |
| (2) | Marcus D. Baker, one of our directors, is the President of Baker Investments, LLC and may be deemed to be the beneficial owner of such securities. |
| (3) | Richard Hokin, one of our directors, is the President of CWE LLC and may be deemed to be the beneficial owner of such securities. |
| (4) | Alexander Ellis III, one of our directors, is a general partner of RockPort Capital Partners and may be deemed to be the beneficial owner of such securities. |
In September 2013, we (as WPHI) sold an aggregate of $2 million of convertible secured notes and ten million common shares to existing investors at a price equal to the principal amount of such notes. In this offering, each holder of more than 5% of our voting securities purchased WPHI convertible notes and WPHI common stock in the following amounts:
| Purchaser |
WPHI Notes Purchased |
WPHI Shares of Common Stock |
||||||
| Allen & Company LLC(1) |
$ | 564,520 | 2,822,601 | |||||
| Baker Investments, LLC(2) |
$ | 172,135 | 860,673 | |||||
| CWE LLC(3) |
$ | 241,791 | 1,208,953 | |||||
| RockPort Capital Partners III, LP(4) |
$ | 648,412 | 3,242,059 | |||||
| (1) | John Simon, one of our directors, is employed by Allen & Company LLC and is the beneficial owner of $144,540 principal amount of convertible notes and 722,700 shares of common stock of WPHI purchased in this offering. Certain employees, affiliates and related parties of Allen & Company LLC hold a beneficial interest in the shares held of record by Allen & Company LLC. Allen & Company LLC disclaims beneficial ownership of the shares beneficially owned by such employees, affiliates and related parties. |
| (2) | Marcus D. Baker, one of our directors, is the President of Baker Investments, LLC and may be deemed to be the beneficial owner of such securities. |
104
Table of Contents
| (3) | Richard Hokin, one of our directors, is the President of CWE LLC and may be deemed to be the beneficial owner of such securities. |
| (4) | Alexander Ellis III, one of our directors, is a general partner of RockPort Capital Partners and may be deemed to be the beneficial owner of such securities. |
Reverse Takeover Transaction
On April 16, 2014, we, as Wind Power Holdings, Inc., or WPHI, completed a reverse takeover transaction, or RTO, with Mira III Acquisition Corp., a Canadian capital pool company incorporated in British Columbia, Canada, or Mira III, whereby all of the equity securities of WPHI were exchanged for common shares and restricted voting shares of Mira III, which became the holding company of our corporate group. Immediately prior to the RTO, the shares of common stock of WPHI, or WPHI Shares, were consolidated on a 1.557612-to-1 basis and then all of WPHI’s outstanding senior secured convertible notes automatically converted into an aggregate of 3,384,755 WPHI Shares. In connection with the RTO, each WPHI Share held by U.S. residents who are accredited investors were exchanged for 0.72742473 of our restricted voting shares and 0.27257527 of our common shares. All other issued and outstanding WPHI Shares were exchanged for our common shares on a 1-to-1 basis. Additionally, all outstanding options to purchase WPHI Shares were exchanged and cancelled for options to purchase our common shares on a 1-to-1 basis with terms substantially the same to the options being exchanged.
Investors’ Rights Agreement
The holders of an aggregate of 16,224,494 common shares or their permitted transferees, are entitled to rights with respect to the registration of these shares under the U.S. Securities Act of 1933, as amended, or the Securities Act. These rights are provided under the terms of the Fifth Amended and Restated Investors’ Rights Agreement, dated April 14, 2014, by and among us and the shareholders named therein, or the Investors’ Rights Agreement, and include demand registration rights, short-form registration rights and piggyback registration rights. See “Description of Capital Stock — Registration Rights.”
Transactions with Our Executive Officers, Directors and Beneficial Owners
Employment Agreements
We have entered into employment agreements with our executive officers. These agreements provide for severance benefits and acceleration of the vesting of share options. See “Compensation — Employment Agreements and Termination of Employment Arrangements” for more information regarding these agreements.
Stock Option Awards
For information regarding share option awards granted to our Named Executive Officers and directors, see “Compensation — Outstanding Equity Awards at Fiscal Year-End Table — 2013,” “Compensation — Summary Compensation Table,” and “Compensation — Employment Agreements and Termination of Employment Arrangements” and “Compensation — Director Compensation.”
Limitation of Liability and Indemnification of Officers and Directors
Our articles of association, as amended, or our Articles, provide that, subject to the BCBCA, we must indemnify and advance expenses of our directors or former directors and their heirs and legal personal representatives against all eligible penalties to which they may be liable, and that we must, after the final disposition of an eligible proceeding, pay the expenses actually and reasonably incurred by such person in respect of that proceeding. The failure of any of our directors or former directors to comply with the BCBCA or our Articles does not invalidate any indemnity to which they are entitled under the provisions of our Articles. The limitation of liability and indemnification provisions that are included in our Articles may discourage shareholders from bringing a lawsuit against our directors and executive officers for breach of their fiduciary duties. They may also
105
Table of Contents
reduce the likelihood of derivative litigation against our directors and executive officers, even though an action, if successful, might benefit us and other shareholders. Further, a shareholder’s investment may be adversely affected to the extent that we pay the costs of settlement and damage awards against directors and executive officers as required by these indemnification provisions. At present, we are not aware of any pending litigation or proceeding involving any person who is or was one of our directors, officers, employees or other agents or is or was serving at our request as a director, officer, employee or agent of another corporation, partnership, joint venture, trust or other enterprise, for which indemnification is sought, and we are not aware of any threatened litigation that may result in claims for indemnification. We have obtained insurance policies under which, subject to the limitations of the policies, coverage is provided to our directors and executive officers against loss arising from claims made by reason of breach of fiduciary duty or other wrongful acts as a director or executive officer, including claims relating to public securities matters, and coverage is provided to us with respect to payments that may be made by us to these directors and executive officers pursuant to our indemnification obligations or otherwise as a matter of law.
Certain of our non-employee directors may, through their relationships with their employers, be insured or indemnified against certain liabilities incurred in their capacity as members of our board of directors. We expect that any underwriting agreement we enter into will provide for indemnification by the underwriters of us and our officers, directors and employees for certain liabilities arising under the Securities Act, or otherwise.
Insofar as indemnification for liabilities arising under the Securities Act may be permitted to directors, officers or persons controlling the company pursuant to the foregoing provisions, we have been informed that, in the opinion of the Securities and Exchange Commission, such indemnification is against public policy as expressed in the Securities Act and is therefore unenforceable.
Review, Approval, and Ratification of Transactions with Related Parties
Our board of directors reviews and approves transactions with directors, officers and Beneficial Owners, each of whom is a related party. Prior to our board of directors’ consideration of a transaction with a related party, the material facts as to the related party’s relationship or interest in the transaction are disclosed to our board of directors, and the transaction will not be approved by our board of directors unless a majority of the directors who are not interested in the transaction approve the transaction. We intend to put into place a related party transactions policy which will require, among other items, that such transactions must be approved by our audit committee or another independent body of our board of directors.
106
Table of Contents
The following table sets forth information with respect to the beneficial ownership of our common shares, as of January 5, 2015, the most recent practicable date, for:
| • | each beneficial owner of more than 5% of our outstanding common shares; |
| • | each of our Named Executive Officers and directors; and |
| • | all of our executive officers and directors as a group. |
Beneficial ownership is determined in accordance with the rules of the Securities and Exchange Commission. These rules generally attribute beneficial ownership of securities to persons who possess sole or shared voting power or investment power with respect to those securities and include common shares issuable upon the exercise of share options that are immediately exercisable or exercisable within 60 days. Except as otherwise indicated, all of the shares reflected in the table are common shares and all persons listed below have sole voting and investment power with respect to the shares beneficially owned by them, subject to applicable community property laws. The information is not necessarily indicative of beneficial ownership for any other purpose.
Percentage ownership calculations for beneficial ownership are based on 22,764,353 common shares outstanding as of January 5, 2015. Addresses of named beneficial owners are in care of Northern Power Systems, Inc., 29 Pitman Road, Barre, Vermont, 05641.
In computing the number of common shares beneficially owned by a person and the percentage ownership of that person, we deemed outstanding common shares subject to options held by that person that are currently exercisable or exercisable as of March 6, 2015. We did not deem these shares outstanding, however, for the purpose of computing the percentage ownership of any other person.
| Shares Beneficially Owned | ||||||||
| Name of Beneficial Owner |
Shares | Percentage | ||||||
| Named Executive Officers and Directors: |
||||||||
| Troy C. Patton(1) |
349,924 | 1.52 | % | |||||
| Jonathan A. Lynch(2) |
127,029 | * | ||||||
| Elliot J. Mark(3) |
165,712 | * | ||||||
| Marcus D. Baker(4) |
1,359,098 | 5.97 | % | |||||
| Alexander Ellis III(5) |
4,912,665 | 21.56 | % | |||||
| Richard Hokin(6) |
1,890,260 | 8.30 | % | |||||
| William F. Leimkuhler(2) |
20,000 | * | ||||||
| John Simon(7) |
1,159,533 | 5.09 | % | |||||
| Robert L. Lentz(2) |
20,000 | * | ||||||
| All executive officers and directors as a group (11 persons)(8) |
10,125,404 | 42.91 | % | |||||
| 5% or Greater Shareholders: |
||||||||
| Allen & Company LLC(9) |
4,399,376 | 19.33 | % | |||||
| Baker Investments, LLC(4) |
1,339,098 | 5.88 | % | |||||
| CWE LLC(6) |
1,870,260 | 8.22 | % | |||||
| RockPort Capital Partners III, L.P.(10) |
4,892,665 | 21.49 | % | |||||
| * | Less than 1%. |
| (1) | Consists of 25,000 common shares and 324,924 common shares issuable upon the exercise of options exercisable as of March 6, 2015. |
| (2) | Consists of common shares issuable upon the exercise of options exercisable as of March 6, 2015. |
| (3) | Consists of 23,154 common shares and 142,558 common shares issuable upon the exercise of options exercisable as of March 6, 2015. |
107
Table of Contents
| (4) | Consists of 20,000 common shares issuable upon the exercise of options exercisable as of March 6, 2015, and 1,339,098 common shares held directly by Baker Investments, LLC. Mr. Baker serves as the President of Baker Companies, Inc. and is a limited partner or member of its operating businesses including Baker Investments, LLC, and therefore may be deemed to hold voting and dispositive power over the shares held by Baker Investments, LLC. |
| (5) | Consists of 20,000 common shares issuable upon the exercise of options exercisable as of March 6, 2015, and 4,892,665 common shares held directly by RockPort Capital Partners III, L.P. Mr. Ellis is a General Partner of RockPort Capital Partners, and therefore, may be deemed to hold voting and dispositive power over the shares held by RockPort Capital Partners. Mr. Ellis disclaims beneficial ownership of our shares held by RockPort Capital Partners III, L.P. |
| (6) | Consists of 20,000 common shares issuable upon the exercise of options exercisable as of March 6, 2015, and 1,870,260 common shares held directly by CWE LLC, which is controlled by Century America LLC. Mr. Hokin is the Managing Director of Century America, LLC a private holding company, and therefore, may be deemed to hold voting and dispositive power over the shares held by CWE LLC. |
| (7) | Consists of 20,000 common shares issuable upon the exercise of options exercisable as of March 6, 2015, and 1,139,533 common shares held by Allen & Company LLC for the account of Dr. Simon. Dr. Simon is a Managing Director of Allen & Company LLC, but does not hold voting and dispositive power over the shares held by Allen & Company LLC other than 1,139,533 shares held by Allen & Company LLC for the account of Dr. Simon. |
| (8) | Consists of 9,294,500 common shares and 830,904 common shares issuable upon the exercise of options exercisable as of March 6, 2015. |
| (9) | See note 7 above. Certain employees, affiliates and related parties of Allen & Company LLC hold a beneficial interest in the shares held of record by Allen & Company LLC. Allen & Company LLC disclaims beneficial ownership of the shares beneficially owned by such employees, affiliates and related parties. |
| (10) | See note 5 above. |
108
Table of Contents
The following description summarizes certain important terms of our share capital. Because it is only a summary, it does not contain all the information that may be important to you. For a complete description of the matters set forth in this “Description of Capital Stock,” you should refer to our articles of association, as amended, or our Articles, and the Fifth Amended and Restated Investors’ Rights Agreement, dated April 14, 2014, by and among us and the shareholders, or the Investors’ Rights Agreement, which are included as exhibits to the registration statement of which this prospectus forms a part, and to the applicable provisions of the Business Corporations Act (British Columbia), S.B.C. 2002, c.57.
General
Our authorized capital consists of an unlimited number of common shares and an unlimited number of Class B restricted voting common shares, or Class B shares.
As of November 30, 2014, 22,764,353 common shares were outstanding, held by 59 shareholders of record, and no Class B restricted voting shares were outstanding. In addition, as of November 30, 2014, we had outstanding options to purchase 2,047,020 common shares under the 2014 Stock Option and Incentive Plan, at a weighted average exercise price of $2.06 per share, of which 1,026,509 options were vested and exercisable.
Common Shares
The holders of common shares are entitled to receive notice of and to attend all meetings of our shareholders and to one vote per share at meetings of our shareholders. Except as otherwise set out below or as required by law, holders of common shares and Class B shares shall vote as one class at all meetings of our shareholders. The holders of common shares also will be entitled to receive dividends as and when declared by our board of directors on the common shares as a class, provided that no dividend may be declared or paid in respect of common shares unless concurrently therewith the same dividend is declared or paid on the Class B shares. The holders of the common shares shall be entitled, in the event of any liquidation, dissolution or winding up, whether voluntary or involuntary, or any other distribution of assets among our shareholders for the purpose of winding up our affairs, to share ratably, together with the holders of Class B shares in such of our assets as are available for distribution. All common shares outstanding are fully paid and non-assessable and not subject to any pre-emptive rights, conversion or exchange rights, redemption, retraction or surrender provisions, sinking or purchase fund provisions, provisions permitting or restricting the issuance of additional securities or provisions requiring a shareholder to contribute additional capital. The common shares shall not be subdivided, consolidated, reclassified or otherwise changed unless contemporaneously therewith the Class B shares are adjusted proportionately and in the same manner.
Class B Restricted Voting Common Shares
The holders of the Class B shares are entitled to receive notice of and to attend all meetings of our shareholders and to one vote per share at any meeting of our shareholders, provided that the holders of the Class B shares are not entitled to vote for the election or removal of members of our board of directors. Except as otherwise described herein or as required by law, holders of common shares and Class B shares shall vote as one class at all meetings of our shareholders. The holders of Class B shares also will be entitled to receive dividends as and when declared by the board of directors on the common shares as a class, provided that no dividend may be declared or paid in respect of Class B shares unless concurrently therewith the same dividend is declared or paid on the common shares. The holders of Class B shares shall be entitled, in the event of any liquidation, dissolution or winding up, whether voluntary or involuntary, or any other distribution of assets among our shareholders for the purpose of winding up our affairs, to share ratably, together with the holders of the common shares in such of our assets as are available for distribution. No Class B share shall be transferred by any holder thereof pursuant to
109
Table of Contents
an Exclusionary Offer unless concurrently with such an offer, an offer to acquire the common shares is made that is identical to the Exclusionary Offer in terms of price per share, percentage of outstanding shares to be taken up (excluding those held by the offeror) and in all other material respects. For these purposes, an “Exclusionary Offer” means an offer to purchase Class B shares which must be made by reason of applicable securities legislation or the rules or policies of a stock exchange to all or substantially all of the holders of the Class B shares.
Each Class B share is convertible into one common share, without payment of additional consideration, at the option of the holder thereof as follows:
| (a) | on and after July 15, 2014; |
| (b) | prior to July 15, 2014, at any time that is not a restricted period (as such term is defined in our Articles); |
| (c) | if we determine that we have ceased to be a foreign issuer and have notified the holders of the Class B shares of such determination; and |
| (d) | if there is an offer to purchase our common shares which must be made, by reason of applicable securities legislation or the rules or policies of a stock exchange, to all or substantially all of the holders of common shares any of whom are in, or whose last address as shown on the books of the corporation is in, a province or territory of Canada to which the relevant requirement applies, and we have notified the holders of the Class B shares of such offer until completion or termination of such offer. |
In addition, each Class B share may be converted into one common share at any time and from time to time at our option upon notice to the holder thereof. On November 20, 2014, we exercised our option to convert all outstanding Class B shares to common shares effective November 30, 2014.
Registration Rights
The holders of an aggregate of 16,224,494 common shares or their permitted transferees, are entitled to rights with respect to the registration of these shares under the U.S. Securities Act of 1933, as amended, or the Securities Act. These rights are provided under the terms of the Investors’ Rights Agreement, and include demand registration rights, short-form registration rights and piggyback registration rights. All fees, costs and expenses of underwritten registrations will be borne by us and all selling expenses, including underwriting discounts and selling commissions, will be borne by the holders of the shares being registered. The demand rights under the Investors’ Rights Agreement only will be triggered if we list our common shares on a U.S. securities exchange or if a specified percentage of holders require such listing after a certain period of time. If we successfully complete the offering contemplated by the registration statement of which this prospectus is a part, our common shares will be listed on the NASDAQ Capital Market and the rights under the Investors’ Rights Agreement will be triggered.
Demand Registration Rights. Starting six months from the date of this prospectus, the holders of an aggregate of 16,224,494 common shares or their permitted transferees, will be entitled to demand registration rights. Under the terms of the Investors’ Rights Agreement, we will be required, upon the written request of any of these holders to sell registrable securities at an aggregate price of at least $15,000,000, to use our best efforts to file a registration statement and use reasonable, diligent efforts to effect the registration of all or a portion of these shares for public resale. We are required to effect only three registrations pursuant to this provision of the Investors’ Rights Agreement.
Short Form Registration Rights. Upon the completion of this offering, the holders of an aggregate of 16,224,494 common shares or their permitted transferees, also will be entitled to short form registration rights. If we are eligible to file a registration statement on Form S-3, upon the written request of any of these holders to sell registrable securities at an aggregate price of at least $5,000,000, we will be required to use our best efforts to affect a registration of such shares. We are required to effect only two registrations in any twelve-month period pursuant to this provision of the Investors’ Rights Agreement.
110
Table of Contents
Piggyback Registration Rights. Upon the completion of this offering, the holders of an aggregate of 16,224,494 common shares or their permitted transferees, will be entitled to piggyback registration rights. If we register any of our securities either for our own account or for the account of other security holders, the holders of these shares are entitled to include their shares in the registration. Subject to certain exceptions, we and the underwriters may limit the number of shares included in the underwritten offering if the underwriters believe that including these shares would adversely affect the offering.
Indemnification. Our Investors’ Rights Agreement contains customary cross-indemnification provisions, under which we are obligated to indemnify holders of registrable securities in the event of material misstatements or omissions in the registration statement attributable to us, and they are obligated to indemnify us for material misstatements or omissions attributable to them.
Expiration of Registration Rights. The registration rights granted under the Investors’ Rights Agreement will terminate upon our liquidation or dissolution or, with respect to any holder, upon such holder being entitled to sell its common shares without restriction pursuant to Rule 144 under the Securities Act.
Exchange Listing
We have applied to list our common shares on the NASDAQ Capital Market under the symbol “NPS” upon completion of this offering. Our common shares are listed for trading on the Toronto Stock Exchange under the symbol “NPS.”
Transfer Agent and Registrar
The transfer agent and registrar for our common shares in the U.S. will be . The U.S. transfer agent and registrar’s address is . The transfer agent and registrar for our common shares in Canada is TMX Equity Transfer Services, Inc. The Canadian transfer agent and registrar’s address is TMX Equity Transfer Services, Inc., 200 University Avenue, Suite 300, Toronto, Ontario M5H 4H1.
111
Table of Contents
MATERIAL DIFFERENCES BETWEEN THE BCBCA AND THE DGCL
Our corporate affairs are governed by our articles of association, as amended, or our Articles, and the provisions of applicable laws of British Columbia, including the Business Corporations Act, S.B.C. 2002, c.27, or the BCBCA. The BCBCA differs from the various state laws applicable to U.S. corporations and their stockholders. The following table provides a summary of the material differences between the provisions of the BCBCA and the Delaware General Corporation Law, or the DGCL.
| Authorized Share Capital | ||
| As permitted by the BCBCA and our Articles, our authorized share capital consists of (i) an unlimited number of common shares without par value, with special rights and restrictions attached and (ii) an unlimited number of Class B shares without par value, with special rights and restrictions attached. |
Under the DGCL, a corporation’s certificate of incorporation must specify the number of shares of each class of stock and their par value, or include a statement that such shares are without par value. The certificate of incorporation must also set forth the designations, powers, preferences, rights, qualifications, limitations and restrictions of each class of shares, if any. Under the DGCL, a corporation’s certificate of incorporation give the board of directors the authority to issue preferred stock in one or more series, with such designations and special rights and restrictions as determined by the board of directors. | |
|
Dividends |
||
| Under the BCBCA and our Articles, dividends may be declared at the discretion of the board of directors. Any dividends declared shall be subject to the rights, if any, of shareholders holding shares with special rights as to dividends. Our directors may declare dividends unless there are reasonable grounds for believing that the company is insolvent or the payment of such dividends would render the company insolvent. | The DGCL generally provides that, subject to certain restrictions, the directors of a corporation may declare and pay dividends upon the shares of its capital stock either out of the corporation’s surplus or, if there is no such surplus, out of its net profits for the fiscal year in which the dividend is declared or the preceding fiscal year. Further, the holders of preferred or special stock of any class or series may be entitled to receive dividends at such rates, on such conditions and at such times as stated in the certificate of incorporation. | |
|
Shareholder Action by Written Consent |
||
| Under the BCBCA and our Articles, shareholder action without a meeting may be taken by written resolution signed by all of the shareholders who would be entitled to vote on the relevant issue at a general meeting. | Under the DGCL, any action required or permitted to be taken at a stockholder meeting may be taken without a meeting if consents in writing are signed by the holders of outstanding stock having at least the minimum number of votes necessary to authorize or take such action at a meeting at which all shares entitled to vote thereon were present and voted, unless otherwise provided in the certificate of incorporation. Typically, public company certificates of incorporation prohibit actions by written consent of the stockholders. | |
|
Election of Directors |
||
| Neither our Articles nor the BCBCA provide for cumulative voting. | Under the DGCL, stockholders are not entitled to cumulative voting in the election of directors unless provided for in the corporation’s certificate of incorporation. |
112
Table of Contents
| Removal of Directors | ||
| As permitted under the BCBCA, our Articles provide that a director may be removed before the expiration of their term by a special resolution of shareholders. Our Articles also provide that the directors may remove any director before the expiration of their term if the director is convicted of an indictable offence or if the director ceases to be qualified to act as a director. | Under the DGCL any director may be removed, with or without cause, by the affirmative vote of a majority of the shares then entitled to vote at an election of directors, unless the board is classified, cumulative voting is permitted by the certificate of incorporation or the certificate of incorporation provides otherwise. | |
|
Required Vote for Certain Transactions |
||
| Under the BCBCA, certain extraordinary corporate actions, such as continuances, certain amalgamations, sales, leases or other dispositions of all, or substantially all of, the property of a corporation (other than in the ordinary course of business), liquidations and certain arrangements, are required to be approved by special resolution of shareholders. | Under the DGCL, certain mergers, consolidation, sale, lease, exchange or other disposition of all, or substantially all, the property and assets of a corporation or dissolution of the corporation requires the approval of a majority of the outstanding voting stock of the corporation entitled to vote thereon. | |
|
Amendment of Organizing Documents |
||
| As permitted by the BCBCA, under our Articles, any amendment to the Notice of Articles or Articles generally requires approval by an ordinary or special resolution of the shareholders. In the event that an amendment to the articles would prejudice or interfere with a right or special right attached to issued shares of a class or series of shares, such amendment must be approved separately by the holders of the class or series of shares being affected. | The DGCL provides that a corporation may amend its certificate of incorporation if its board of directors has adopted such amendment, followed by the affirmative vote of a majority of the outstanding voting stock and a majority of the outstanding shares of each class entitled to vote on the amendment as a class. In the event the amendment would alter the aggregate number of authorized shares of a class of stock, their par value, or the powers, preferences or special rights of the shares of a class so as to affect them adversely, the holders of the outstanding shares of the class are entitled to vote as a class upon a proposed amendment, whether or not entitled to vote thereon by the certificate of incorporation. | |
|
Quorum of Shareholders |
||
| As permitted under the BCBCA, our Articles provide that a quorum for general meetings of shareholders is two persons present and being, or representing by proxy, shareholders holding at least 5% of the issued shares entitled to be voted at the meeting. | Under the DGCL, unless otherwise provided in the certificate of incorporation, with respect to any matter, a quorum for a meeting of stockholders requires the holders of a majority of the shares entitled to vote are represented at the meeting in person or by proxy. | |
|
Shareholder Access to Corporate Records |
||
| Under the BCBCA, specified books and records of the corporation must be available for inspection by any of our shareholders at the registered and records office. | Under the DGCL, a stockholder of record has the right to inspect the books and records of the corporation, provided that such inspection is for a proper purpose which is reasonably related to such stockholder’s interest as a stockholder. | |
|
Annual Meetings of Shareholders |
||
| Our Articles provide that an annual general meeting must be held at least once in each calendar year, and not more than 15 months after the last annual reference date, | Under the DGCL, a corporation must hold an annual meeting of stockholders in a place designated by the certificate of incorporation or bylaws, whether inside |
113
Table of Contents
| at such time and place as may be determined by the directors. An annual meeting of shareholders may be held at a location outside British Columbia if the location for the meeting is approved by a directors’ resolution. The company must provide notice of the annual general meeting to each shareholder entitled to attend the meeting, to each director and to the auditor of the company at least 21 days before the meeting date. | or outside of Delaware, or, if not so designated, as determined by the board of directors and on a date and at a time designated in the bylaws, except as otherwise provided by law. Written notice of every meeting of stockholders must be given to each stockholder of record not less than ten or more than 60 days before the date of the meeting. | |
|
Special Meetings of Shareholders |
||
| Under our Articles, the directors have the power at any time to call a meeting of the shareholders. Under the BCBCA, the holders of not less than 5% of the issued shares of a corporation that carry the right to vote at a general meeting may requisition the directors to call a meeting of shareholders. | Under the DGCL, special meetings of stockholders may be called by the board of directors or by such person or persons as may be authorized by the certificate of incorporation or the bylaws. Typically public company certificates of incorporation do not authorize stockholders to call special meetings. | |
|
Anti-takeover Provisions and Interested Shareholder Transactions |
||
| Neither the BCBCA nor our Articles restrict us from adopting a shareholder rights plan. The BCBCA does not restrict related party transactions. However, in Canada takeovers and other related party transactions are addressed in provincial securities legislation and policies which may apply to us. | Under the DGCL, a certificate of incorporation may provide the board of directors with the ability to designate the terms of and issue a new class or series of preferred stock, and to issue a stockholder rights plan. Delaware corporations are subject to Delaware’s “business combination” statute. In general, such statute prohibits a corporation from engaging in any business combination transactions with an interested stockholder for a period of three years after the time that the stockholder became an interested stockholder, unless approved by the board of directors beforehand or upon satisfaction of other criteria. | |
|
Interested Director Transactions |
||
| Under the BCBCA and our Articles, a director who has a conflict of interest in any transaction must promptly disclose the nature and extent of the conflict and may not vote on any board resolutions to approve such transaction unless all directors of the corporation are interested, in which case any or all of them may vote. Excluded directors will, however, count for purposes of quorum. A director is liable to account to the corporation for any profit that accrues to the director under or as a result of the interested transaction. | Under the DGCL, a transaction in which a director of the corporation has a conflict of interest is not void or voidable solely because of the director’s conflict, solely because the director is present at or participates in the meeting of the board of directors or committee which authorizes the transaction or solely because any such director’s vote is counted for such purpose, if (a) the material facts of the conflict of interest are known to or disclosed to the board of directors or the committee and the board of directors or committee in good faith authorizes the transaction by a majority of the votes of the disinterested directors, (b) the material facts of the conflict of interest are known or disclosed to the stockholders of the corporation and the transaction is approved in good faith by the stockholders, or (c) the board of directors can demonstrate that the transaction is fair as to the corporation as of the time it is approved by the board of directors, committee or stockholders. |
114
Table of Contents
| Directors’ and Officers’ Liability and Indemnification | ||
| Our Articles provide that we must indemnify a director, former director or alternative director and his or her heirs and legal personal representatives, as set out in the BCBCA, against all eligible penalties to which such person is or may be liable, and we must, after the final disposition of an eligible proceeding, pay the expenses actually and reasonably incurred by such person in respect of that proceeding. Each director and alternate director is deemed to have contracted with us on the terms of the indemnity contained in our Articles. In addition, we may indemnify any other person in accordance with the BCBCA. | Under the DGCL, a corporation has the power to indemnify any person who was, is or is threatened to be made a party to any threatened, pending or completed action, suit or proceeding, whether civil, criminal, administrative or investigative, or any person who was, is or is threatened to be made a party to any threatened, pending or completed action or suit by or in the right of the corporation to procure a judgment in its favor, in each case by reason of the fact that the person is or was a director, office, employee or agent of the corporation, against expenses, judgments, fines and amounts paid in settlement actually and reasonably incurred by the person in connection with such action, suit or proceeding if the person acted in good faith and in a manner the person reasonably believed to be in or not opposed to the best interest of the corporation, and subject to certain other limitations. | |
|
Oppression Remedy |
||
| The BCBCA provides an oppression remedy that enables a court to make any order, whether interim or final, to rectify matters that are oppressive or unfairly prejudicial to any shareholder, which includes a beneficial shareholder or any other person who, in the court’s discretion, is a proper person to make such an application. The oppression remedy provides the court with very broad and flexible powers to intervene in corporate affairs to protect shareholders and other applicants. | The DGCL does not expressly provide for a similar remedy. |
115
Table of Contents
SHARES ELIGIBLE FOR FUTURE SALE
Immediately prior to this offering, there has been no U.S. public market for our common shares. Future sales of substantial amounts of our common shares, including shares issued upon the exercise of outstanding options, in the public market after this offering, or the perception that such sales may occur, could adversely affect the market price of our common shares.
Upon completion of this offering, we will have outstanding an aggregate of common shares, assuming no exercise of the underwriters’ option to purchase additional shares and no exercise of outstanding share options. Of these shares, all common shares sold in this offering will be freely tradable without restriction or further registration under the U.S. Securities Act of 1933, as amended, or the Securities Act, except for any shares held by our “affiliates,” as that term is defined in Rule 144 under the Securities Act, whose sales would be subject to certain limitations and restrictions described below. The remaining common shares held by existing shareholders will be restricted securities as that term is defined in Rule 144 under the Securities Act. Restricted securities may be sold in the public market only if registered or if they qualify for exemption under Rules 144 or 701 under the Securities Act, which rules are summarized below, or another exemption.
As a result of the lock-up agreements described below and the provisions of Rule 144 and Rule 701 under the Securities Act, our common shares (excluding the shares sold in this offering) that will be available for sale in the public market are as follows:
| Dates of Availability of Sale |
Approximate Number of Shares | |
| As of the date of this prospectus |
||
| At various times beginning more than 60 days after the date of this prospectus, although a portion of such shares held by our affiliates will be subject to volume limitations pursuant to Rule 144 |
Share Plans
We have filed a registration statement on Form S-8 under the Securities Act to register shares that have been or may be issued pursuant to our 2014 Stock Option and Incentive Plan, and shares covered by the registration statement are now eligible for sale in the open market, subject to the Rule 144 limitations applicable to affiliates, vesting restrictions and any applicable lock-up agreements and escrow agreements.
Lock-Up Agreements
We and our executive officers and directors and our four principal shareholders have agreed with the underwriters, subject to certain exceptions, not to sell, pledge, grant options to purchase, hedge or otherwise dispose of any of their common shares or securities convertible into or exchangeable for common shares during the period from the date of this prospectus continuing through the date which is 120 days after the date of this prospectus, except with the prior written consent of the representative of the underwriters for this offering and the company. This consent may be given at any time. However, in the event that either (1) during the last 17 days of the “lock-up” period, we release earnings results or material news or a material event relating to us occurs or (2) prior to the expiration of the “lock-up” period, we announce that we will release earnings results during the 16-day period beginning on the last day of the “lock-up” period, then in either case the expiration of the “lock-up” will be extended until the expiration of the 18-day period beginning on the date of the release of the earnings results or the occurrence of the material news or event, as applicable, unless waives, in writing, such an extension. There are no agreements between the representative of the underwriters for this offering, the company and any of our security holders or affiliates releasing them from these lock-up agreements prior to the expiration of the 120-day period. Additionally, the four principal shareholders may not sell greater than 10% of their common shares prior to April 21, 2015, without the consent of, waiver from or release by Beacon Securities Limited, or Beacon, pursuant to lock ups they signed with Beacon as part of the RTO.
116
Table of Contents
Rule 701
Rule 701 under the Securities Act, as in effect on the date of this prospectus, permits resales of shares in reliance upon Rule 144 but without compliance with certain restrictions of Rule 144, including the holding period requirement. Most of our employees, executive officers or directors who purchased shares under a written compensatory plan or contract may be entitled to rely on the resale provisions of Rule 701. However, most Rule 701 shares are subject to lock-up agreements as described above and under “Underwriting” included elsewhere in this prospectus and will become eligible for sale upon the expiration of the restrictions set forth in those agreements.
Rule 144
Common shares that are restricted securities will be eligible for resale in compliance with Rule 144 of the Securities Act, subject to the requirements described below. “Restricted securities,” as defined under Rule 144, were issued and sold by us in reliance on exemptions from the registration requirements of the Securities Act. These shares may be sold in the public market only if registered or if they qualify for an exemption from registration, such as Rule 144 or Rule 701. Below is a summary of the requirements for sales of our common shares pursuant to Rule 144, after the effectiveness of this Registration Statement.
Beginning 90 days after the effectiveness of this Registration Statement, but further subject to the lock-up agreements described above, a person who is our affiliate or who was our affiliate at any time during the preceding three months and who has beneficially owned restricted securities for at least six months, will generally be entitled to sell within any three-month period a number of shares that does not exceed one percent of the number of common shares then outstanding. Sales under Rule 144 by our affiliates are also subject to manner of sale provisions and notice requirements and to the availability of current public information about us.
Persons who may be deemed to be our affiliates generally include individuals or entities that control, or are controlled by, or are under common control with, us and may include our directors and officers, as well as our significant shareholders.
For a person who has not been deemed to have been one of our affiliates at any time during the 90 days preceding a sale, sales of our common shares held longer than six months, but less than one year, will be subject only to the current public information requirement and can be sold under Rule 144 beginning 90 days after the effectiveness of this Registration Statement without restriction. A person who is not deemed to have been one of our affiliates at any time during the 90 days preceding a sale, and who has beneficially owned the shares proposed to be sold for at least one year, is entitled to sell his or her shares without complying with the manner of sale, public information, volume limitation or notice provisions of Rule 144.
We expect approximately 12,554,343 common shares will be eligible for sale under Rule 144 upon expiration of the lock-up period applicable to common shares held by our executive officers, directors and four principal shareholders, which expires on , 2015. We cannot estimate the number of common shares that our existing shareholders will elect to sell under Rule 144.
Registration Rights
The holders of 16,224,494 common shares are entitled to rights with respect to the registration of such shares under the Securities Act. These rights are provided under the terms of the Fifth Amended and Restated Investors’ Rights Agreement, dated April 14, 2014, by and among us and the shareholders named therein, or the Investors’ Rights Agreement, and include demand registration rights, short-form registration rights and piggyback registration rights. See “Description of Capital Stock — Registration Rights.”
117
Table of Contents
CERTAIN CANADIAN FEDERAL INCOME TAX CONSIDERATIONS
The following is a summary, as of today’s date, of the principal Canadian federal income tax considerations under the Income Tax Act (Canada), or the Tax Act, that generally apply to an investor who acquires our common shares pursuant to this offering and who, for the purposes of the Tax Act and at all relevant times, deals at arm’s length with us, is not affiliated with us and who acquires and holds our common shares, as capital property or a Holder. Generally, our common shares will be considered to be capital property to a Holder provided that the Holder does not use our common shares in the course of carrying on a business of trading or dealing in securities and such Holder has not acquired them or been deemed to have acquired them in one or more transactions considered to be an adventure or concern in the nature of trade.
This summary is based upon the current provisions of the Canada-U.S. Income Tax Convention, or the Treaty, the Tax Act and its regulations and the current published administrative policies and assessing practices of the Canada Revenue Agency, or the CRA. This summary takes into account all specific proposals to amend the Tax Act and its regulations publicly announced by or on behalf of the Minister of Finance (Canada) prior to the date hereof, or the Tax Proposals, and assumes that the Tax Proposals will be enacted in the form proposed, although no assurance can be given that the Tax Proposals will be enacted in their current form or at all. This summary does not otherwise take into account any changes in law or in the administrative policies or assessing practices of the CRA, whether by legislative, governmental or judicial decision or action, nor does it take into account or consider any provincial, territorial or foreign income tax considerations, which considerations may differ significantly from the Canadian federal income tax considerations discussed in this summary.
This summary only applies to Holders who (i) for the purposes of the Tax Act, have not been and will not be resident in Canada at any time, (ii) do not use or hold the common shares in carrying on a business in Canada, and (iii) are resident in the U.S. for income tax purposes and entitled to benefits under the Treaty. Special rules, which are not discussed in this summary, may apply to a U.S. holder that is an insurer that carries on business in Canada and elsewhere.
This summary is of a general nature only, is not exhaustive of all possible Canadian federal income tax considerations and is not intended to be, nor should it be construed to be, legal or tax advice to any particular Holder. Holders should consult their own tax advisors with respect to their particular circumstances.
Currency
For purposes of the Tax Act, all amounts relating to the acquisition, holding or disposition of our common shares must be expressed in Canadian dollars using the rate of exchange quoted by the Bank of Canada at noon on the day the amount first arose, or such other rate of exchange as is acceptable to the CRA.
Dividends
Dividends paid or credited or deemed to be paid or credited by us to a Holder on our common shares are subject to Canadian withholding tax at the rate of 25% on the gross amount of the dividend unless such rate is reduced by the terms of the Treaty. The rate of withholding tax on dividends paid or credited to a Holder who is resident in the U.S. for purposes of the Treaty entitled to benefits under the Treaty and is the beneficial owner of the dividend is generally limited to 15% of the gross amount of the dividend (or 5% in the case of such a Holder that is a company beneficially owning at least 10% of our voting shares). Holders should consult their own tax advisors regarding the application of the Treaty to dividends based on their particular circumstances.
Dispositions of Common Shares
A Holder generally will not be subject to tax under the Tax Act in respect of a capital gain realized on the disposition or deemed disposition of our common shares, nor will capital losses arising therefrom be recognized under the Tax Act, unless our common shares constitutes “taxable Canadian property” to the Holder for purposes of the Tax Act, and the gain is not exempt from tax pursuant to the terms of the Treaty.
118
Table of Contents
Provided our common shares are listed on a “designated stock exchange”, as defined in the Tax Act (which currently includes the TSX), at the time of disposition, our common shares generally will not constitute taxable Canadian property of a Holder at that time, unless at any time during the 60 month period immediately preceding the disposition the following two conditions are met concurrently:
(i) the Holder, persons with whom the Holder did not deal at arm’s length, and partnerships in which the Holder or such non-arm’s length person holds a membership interest (either directly or indirectly through one or more partnerships), or the Holder together with all such persons, owned 25% or more of the issued shares of any class or series of our shares; and
(ii) more than 50% of the fair market value of the our common shares was derived directly or indirectly from one or any combination of real or immovable property situated in Canada, “Canadian resource properties” (as defined in the Tax Act), “timber resource properties” (as defined in the Tax Act) or an option, an interest or right in such property, whether or not such property exists.
Notwithstanding the foregoing, a common share may otherwise be deemed to be taxable Canadian property to a Holder for purposes of the Tax Act in particular circumstances.
Holders whose common shares are taxable Canadian property should consult their own tax advisors.
119
Table of Contents
CERTAIN U.S. FEDERAL INCOME TAX CONSIDERATIONS
The following is a summary of certain U.S. federal income tax considerations relating to the acquisition, ownership and disposition of our common shares issued pursuant to this offering. This summary deals only with common shares held as a capital asset by a shareholder, and does not discuss the U.S. federal income tax considerations applicable to a shareholder that is subject to special treatment under U.S. federal income tax laws, including: a dealer in securities or currencies; a financial institution; a regulated investment company; a real estate investment trust; a tax-exempt organization; an insurance company; a person holding common shares as part of a hedging, integrated, conversion or straddle transaction or a person deemed to sell common shares under the constructive sale provisions of the Internal Revenue Code of 1986, as amended, or the Code; a trader in securities that has elected the mark-to-market method of accounting; an entity that is treated as a partnership for U.S. federal income tax purposes; a person that received such common shares in connection with the performance of services; a U.S. person whose “functional currency” is not the U.S. dollar; a “controlled foreign corporation”; a “passive foreign investment company”; or a U.S. expatriate.
This summary is based upon provisions of the Code and applicable regulations, rulings and judicial decisions, all in effect as of the date hereof. Those authorities may be changed, perhaps retroactively, or may be subject to differing interpretations, so as to result in U.S. federal income tax consequences different from those discussed below. No assurance can be given that the Internal Revenue Service, or IRS, would not assert, or that a court would not sustain a position contrary to any of the tax consequences described below. We have not sought and will not seek an advance ruling from the IRS regarding any matter discussed herein. This summary does not address all aspects of U.S. federal income tax, does not deal with all tax considerations that may be relevant to shareholders in light of their personal circumstances and does not address any state, local, foreign, gift, estate or alternative minimum tax considerations or considerations related to Medicare surtaxes on certain net investment income.
For purposes of this discussion, a “U.S. holder” is a beneficial holder of common shares that is: an individual citizen or resident of the U.S. for U.S. federal income tax purposes; a corporation (or any other entity treated as a corporation for U.S. federal income tax purposes) created or organized in or under the laws of the U.S., any state thereof or the District of Columbia; an estate the income of which is subject to U.S. federal income taxation regardless of its source; a trust if it (1) is subject to the primary supervision of a court within the U.S. and one or more U.S. persons have the authority to control all substantial decisions of the trust or (2) has a valid election in effect under applicable U.S. Treasury regulations to be treated as a U.S. person.
For purposes of this discussion, a “non-U.S. holder” is a beneficial holder of common shares (other than a partnership or any other entity or arrangement that is treated as a partnership for U.S. federal income tax purposes) that is not a U.S. holder.
If a partnership (or an entity or arrangement that is treated as a partnership for U.S. federal income tax purposes) holds common shares, the tax treatment of a partner will generally depend upon the status of the partner and the activities of the partnership. A partner of a partnership holding common shares is urged to consult its own tax advisors.
Holders of common shares are urged to consult their own tax advisors concerning their particular U.S. federal income tax consequences in light of their specific situations, as well as the tax consequences arising under the laws of any other taxing jurisdiction, including any state, local and foreign income and other tax laws.
The Company as a U.S. Corporation for U.S. Federal Income Tax Purposes
On April 16, 2014, we, as Wind Power Holdings, Inc., or WPHI, completed a reverse takeover transaction, or RTO, with Mira III Acquisition Corp., a Canadian capital pool company incorporated in British Columbia, Canada, or Mira III, whereby Mira Subco Inc., a wholly-owned subsidiary of Mira III, merged with and into
120
Table of Contents
WPHI, with WPHI as the surviving corporation, and then WPHI merged with and into Mira Subco LLC, a wholly-owned subsidiary of Mira III, with Mira Subco LLC as the surviving entity, as part of an integrated transaction. In connection with the RTO, all of the equity securities of WPHI were exchanged for common shares and restricted voting shares of Mira III. Following the completion of the RTO, Mira III changed its name to Northern Power Systems Corp. and WPHI’s business became Mira III’s operating business and WPHI’s directors and officers became Mira III’s directors and officers. As a result of such transaction, we believe we are currently treated as a U.S. corporation for all purposes of the Code pursuant to the “inversion rules” of Section 7874(b) of the Code. The following discussion assumes that Section 7874(b) of the Code will continue to apply to treat the company as a U.S. corporation for U.S. federal income tax purposes. If, pursuant to a change in law or otherwise, Section 7874(b) no longer applied to treat the company as a U.S. corporation, the U.S. federal income tax consequences to holders of our common shares would be materially different than as described below, and such differences could be adverse to certain holders of our common shares. Because we will be treated as a U.S. corporation for all purposes of the Code, we will not be treated as a “passive foreign investment company,” as such rules apply only to non-U.S. corporations for U.S. federal income tax purposes. Moreover, because our shares will be treated as shares of a U.S. domestic corporation, the U.S. gift, estate and generation-skipping transfer tax rules generally apply to a non-U.S. holder of our common shares.
U.S. Holders
The following discussion is a summary of certain U.S. federal income tax considerations relevant to a U.S. holder of common shares.
Distributions. We do not currently intend to pay distributions on its common shares in the foreseeable future. However, distributions (including any amounts withheld for Canadian tax purposes) with respect to common shares, if any, will be includible in the gross income of a U.S. holder as ordinary dividend income to the extent paid out of current or accumulated earnings and profits, as determined for U.S. federal income tax purposes. Any portion of a distribution in excess of current or accumulated earnings and profits would be treated as a return of the holder’s adjusted tax basis in its common shares (to the extent thereof) and as such would not be taxable to a U.S. holder. To the extent that such distribution exceeds the adjusted tax basis of a U.S. holder’s common shares, such excess will be taxable as capital gain from the sale or exchange of the common shares. If certain requirements are met (including certain holding period requirements), any dividends paid to a holder of common shares who is a U.S. individual will generally be subject to U.S. federal income tax at favorable capital gain rates applicable to the individual.
Distributions constituting dividends for U.S. federal income tax purposes that are paid to U.S. holders that are corporate shareholders may qualify for the 70% dividends received deduction, or DRD, which is generally available to corporate shareholders that own less than 20% of the voting power or value of the outstanding shares of the distributing corporation. A U.S. holder that is a corporate shareholder holding 20% or more of the distributing corporation (by vote and value) may be eligible for an 80% DRD with respect to any such dividends. No assurance can be given that we will have sufficient earnings and profits (as determined for U.S. federal income tax purposes) to cause any distributions to be treated as dividends eligible for a DRD. In addition, a DRD is available only if certain other requirements are satisfied, and a DRD may be subject to limitations in certain circumstances, which are not discussed here.
Dividends on our common shares generally will not constitute foreign source income for U.S. foreign tax credit purposes because we, even though organized as a Canadian corporation, are treated as a U.S. corporation for all purposes of the Code under the inversion rules, as described above. Accordingly, it is possible that U.S. holders may not be able to claim a U.S. foreign tax credit for any Canadian withholding or other tax on such dividends unless such U.S. holders have sufficient other foreign source income. However, the foreign tax credit rules are extremely complex, and their application in connection with section 7874 of the Code, as well as the income tax treaty between the U.S. and Canada, is not entirely clear at this time. U.S. holders of our common shares are urged to consult their tax advisors regarding all aspects of claiming foreign tax credits in respect of Canadian income or withholding taxes on dividends paid on our common shares.
121
Table of Contents
Sale, Exchange, Redemption or Certain Other Taxable Dispositions of our Common Shares. A U.S. holder of common shares will generally recognize gain or loss on the taxable sale, exchange, redemption (provided the redemption is treated as a sale or exchange), or other taxable disposition of such shares in an amount equal to the difference between such U.S. holder’s amount realized on the sale and its tax basis in the common shares sold. A U.S. holder’s amount realized should equal the amount of cash and the fair market value of any property received in consideration of its shares. The gain or loss will be capital gain or loss, and will be long-term capital gain or loss if the common shares are held for more than one year at the time of disposition. The deductibility of capital losses is subject to limitations. For example, capital loss can generally only be used to offset capital gain (though individuals may also offset excess capital losses against up to $3,000 of ordinary income per tax year). In general, long-term capital gain recognized by an individual U.S. holder is subject to U.S. federal income tax at favorable capital gain rates applicable to the individual. Any gain recognized by a U.S. holder of common shares will be short-term capital gain and will be taxed at ordinary income rates if the shares are held for one year or less at the time of disposition. A U.S. holder may not be eligible to claim a foreign tax credit with respect to any Canadian taxes imposed on gain from the sale or other disposition of our common shares. However, the foreign tax credit rules are extremely complex, and their application in connection with section 7874 of the Code and the income tax treaty between the U.S. and Canada, is not entirely clear at this time. U.S. holders of our common shares are urged to consult their tax advisors regarding all aspects of claiming foreign tax credits in respect of Canadian income or withholding taxes on dividends paid on our common shares.
If a shareholder recognizes a loss upon a disposition of common shares in an amount that exceeds a prescribed threshold, it is possible that the provisions of Treasury Regulations involving “reportable transactions” could apply, with a resulting requirement to separately disclose the loss-generating transaction to the IRS. These regulations, though directed towards “tax shelters,” are broadly written, and apply to transactions that would not typically be considered tax shelters. The Code imposes significant penalties for failure to comply with these requirements. Shareholders should consult their own tax advisors concerning any possible disclosure obligation with respect to the receipt or disposition of the common shares.
Information Reporting and Backup Withholding Tax. When required, we or our paying agent will report to our U.S. holders and the IRS the amounts paid on or with respect to our common shares during each calendar year, and the amount of any tax withheld from such payments. Under U.S. federal income tax law, dividends and proceeds from the sale of our common shares may, under certain circumstances, be subject to “backup” withholding at the then applicable rate. Backup withholding generally applies to a U.S. holder if the holder (i) fails to furnish to us or our paying agent a correct social security number or other taxpayer identification number, or TIN, or fails to furnish a certification of exempt status, (ii) has been notified by the IRS that it is subject to backup withholding as a result of the failure to properly report payments of interest or dividends or (iii) under certain circumstances, fails to provide a certified statement, signed under penalty of perjury, that the TIN provided is its correct number and that it is a U.S. person that is not subject to backup withholding. A U.S. holder may be eligible for an exemption from backup withholding by providing a properly completed IRS Form W-9 to us or our paying agent. Backup withholding is not an additional tax but merely an advance payment, which may be refunded to the extent it results in an overpayment of tax and the appropriate information is supplied to the IRS.
Non-U.S. Holders
The following is a summary of certain U.S. federal tax considerations applicable to a non-U.S. holder of common shares.
Distributions. Distributions treated as dividends for U.S. federal income tax purposes that are paid to a non-U.S. holder, if any, with respect to shares of common shares will be subject to U.S. federal withholding tax at a 30% rate (or lower applicable income tax treaty rate) unless the dividends are effectively connected with the non-U.S. holder’s conduct of a trade or business in the U.S. If a non-U.S. holder is engaged in a trade or business in the U.S. and dividends with respect to the common shares are effectively connected with the conduct of that trade
122
Table of Contents
or business and, if required by an applicable income tax treaty, are attributable to a U.S. permanent establishment or fixed base, then the non-U.S. holder will be subject to U.S. federal income tax on those dividends on a net income basis in the same manner as if received by a U.S. person as defined under the Code (although the dividends will be exempt from the 30% U.S. federal withholding tax, provided certain certification requirements are satisfied). Any such effectively connected income received by a foreign corporation may, under certain circumstances, be subject to an additional branch profits tax at a 30% rate (or lower applicable income tax treaty rate). To claim the exemption from withholding with respect to any such effectively connected income, the non-U.S. holder must generally furnish to us or our transfer agent a properly executed IRS Form W-8ECI (or applicable successor form).
A non-U.S. holder who wishes to claim the benefit of an exemption or reduced rate of U.S. federal withholding tax under the Code or an applicable treaty must furnish to us or our transfer agent a valid IRS Form W-8BEN, W-8BEN-E, W-8EXP, or other relevant form (or applicable successor form) certifying such holder’s qualification for the exemption or reduced rate. If a non-U.S. holder is eligible for a reduced rate of U.S. federal withholding tax pursuant to an income tax treaty, it may obtain a refund of any excess amounts withheld by filing an appropriate claim for refund with the IRS.
A non-U.S. holder will not incur tax on a distribution in excess of our current and accumulated earnings and profits if the excess portion of the distribution does not exceed the adjusted basis of the non-U.S. holder’s common shares. Instead, the excess portion of the distribution will reduce the adjusted basis of those shares. A non-U.S. holder will be subject to tax on a distribution that exceeds both our current and accumulated earnings and profits and the adjusted basis of its shares, if the non-U.S. shareholder otherwise would be subject to tax on gain from the sale or disposition of its shares, as described below. If we are not able to determine whether or not a distribution will exceed current and accumulated earnings and profits at the time the distribution is made, we may withhold tax on the entire amount of any distribution at the same rate as we would withhold on a dividend. However, a non-U.S. holder may obtain a refund of amounts that we withhold to the extent that the distribution in fact exceeded our current and accumulated earnings and profits.
Sale, Exchange, Redemption or Certain Other Taxable Dispositions of Our Common Shares. Non-U.S. holders may recognize gain upon the sale, exchange, redemption (provided the redemption is treated as a sale or exchange) or other taxable disposition of common shares. Such gain generally will not be subject to U.S. federal income tax unless: (i) the gain is effectively connected with the conduct of a trade or business in the U.S. (and, if required by an applicable income tax treaty, is attributable to a U.S. permanent establishment or a fixed base), by a non-U.S. holder; (ii) the non-U.S. holder is a non-resident alien individual who is present in the U.S. for 183 days or more in the taxable year of that disposition, and certain other conditions are met; or (iii) we are or have been a “U.S. real property holding corporation” for U.S. federal income tax purposes. We believe that we are not and we do not anticipate becoming a “U.S. real property holding corporation” for U.S. federal income tax purposes.
If a non-U.S. holder is an individual described in clause (i) of the preceding paragraph, the non-U.S. holder will generally be subject to tax on the net gain at regular graduated U.S. federal income tax rates. If the non-U.S. holder is an individual described in clause (ii) of the preceding paragraph, the non-U.S. holder will generally be subject to a flat 30% tax on the gain, which may be offset by U.S. source capital losses even though the non-U.S. holder is not considered a resident of the U.S. If a non-U.S. holder is a foreign corporation that falls under clause (i) of the preceding paragraph, it will be subject to tax on its net gain in the same manner as if it were a U.S. person as defined under the Code and, in addition, the non-U.S. holder may be subject to the branch profits tax at a rate equal to 30% of its effectively connected earnings and profits or at such lower rate as may be specified by an applicable income tax treaty. If a non-U.S. holder is eligible for the benefits of a tax treaty between the U.S. and its country of residence, any gain will be subject to U.S. federal income tax in the manner specified by the treaty. To claim the benefit of a treaty, a non-U.S. holder must properly submit an IRS Form W-8BEN or W-8BEN-E (or suitable successor or substitute form).
123
Table of Contents
Information Reporting and Backup Withholding Tax. When required, we or our paying agent will report to our non-U.S. holders of common shares and the IRS the amounts paid on or with respect to our common shares during each calendar year, and the amount of any tax withheld. These information reporting requirements apply even if no withholding was required if the distributions were effectively connected with the non-U.S. holder’s conduct of a U.S. trade or business or withholding was reduced or eliminated by an applicable income tax treaty. This information also may be made available under a specific treaty or agreement with the tax authorities in the country in which the non-U.S. holder resides or is established. Backup withholding, however, generally will not apply to distributions to a non-U.S. holder of our common shares provided the non-U.S. holder furnishes to us or our transfer agent the required certification as to its non-U.S. status, such as by providing a valid IRS Form W-8BEN, W-8BEN-E, W-8EXP, IRS Form W-8ECI or other relevant form (or applicable successor form), or certain other requirements are met. Notwithstanding the foregoing, backup withholding may apply if either we or our transfer agent has actual knowledge, or reason to know, that the holder is a U.S. person that is not an exempt recipient. Any amounts withheld under the backup withholding rules will be allowed as a refund or a credit against a holder’s U.S. federal income tax liability provided the required information is provided to the IRS.
Foreign Account Tax Compliance Act. Under the Foreign Account Tax Compliance Act, or FATCA, a 30% withholding tax will generally apply to dividends on, or gross proceeds from the sale or other disposition of, common shares paid to a foreign financial institution and certain other non-U.S. entities unless certain reporting and other requirements are satisfied. FATCA currently applies with respect to payments of dividends on our common shares, and FATCA will apply with respect to payments of gross proceeds from the disposition of our common shares made on or after January 1, 2017.
Investors should consult their tax advisors regarding the possible impact of the FATCA rules on their investment in our common shares, including, without limitation, the process and deadlines for meeting the applicable requirements to prevent the imposition of the 30% withholding tax under FATCA.
124
Table of Contents
We are offering the common shares described in this prospectus in an underwritten offering in which we and Needham & Company, LLC, as representative of the underwriters for the offering, will enter into an underwriting agreement with respect to the common shares being offered. Subject to the terms and conditions contained in the underwriting agreement, the underwriters named below have agreed to purchase, and we have agreed to sell, severally and not jointly, the respective number of common shares set forth opposite their respective names below:
| Underwriter |
Number of Shares | |
| Needham & Company, LLC |
||
| Craig-Hallum Capital Group LLC |
||
| Northland Securities, Inc. |
||
| Total |
The underwriting agreement provides that the underwriters’ obligation to pay for and accept delivery of the common shares offered by this prospectus are subject to approval of certain legal matters by their counsel and to the satisfaction of the conditions contained in the underwriting agreement.
Subject to these conditions, the underwriters are committed to purchase and pay for all of the common shares offered by this prospectus, if any such shares are purchased. However, the underwriters are not obligated to take or pay for the common shares covered by the underwriters’ over-allotment option described below, unless and until that option is exercised. The underwriting agreement also provides that if an underwriter defaults, the purchase commitments of non-defaulting underwriters may be increased or the offering may be terminated.
Over-Allotment Option
We have granted the underwriters an option, exercisable no later than 30 days after the date of the underwriting agreement, to purchase up to an aggregate of additional common shares at the public offering price, less the underwriting discounts and commissions set forth on the cover page of this prospectus. The underwriters may exercise this option only to cover over-allotments made in connection with this offering. If this option is exercised, each of the underwriters will purchase approximately the same percentage of the additional shares as the number of common shares to be purchased by that underwriter, as shown in the table above, bears to the total shown. If any additional common shares are purchased, the underwriters will offer the additional shares on the same terms as those on which the shares are being offered. We will be obligated to sell these common shares to the underwriters to the extent the over-allotment option is exercised.
Commission and Discounts
The underwriters propose to offer our common shares directly to the public at the offering price set forth on the cover page of this prospectus and to dealers, who may include the underwriters, at the public offering price less a concession not in excess of per share. After the public offering of our common shares, the underwriters may change the offering price, concessions and other selling terms. The underwriters reserve the right to reject an order for the purchase of shares, in whole or in part.
The following table shows the per share and total underwriting discounts and commissions that we will pay to the underwriters and the proceeds we will receive before expenses. These amounts are shown assuming both no exercise and full exercise of the underwriters’ over-allotment option.
| Per Share | No Exercise | Full Exercise | ||||||
| Public Offering Price |
$ | |||||||
| Underwriting discount |
$ | |||||||
| Proceeds before expenses |
$ | |||||||
125
Table of Contents
In addition to the underwriting discount, we will reimburse the underwriters for their reasonable out-of-pocket expenses up to $150,000 incurred in connection with their engagement as underwriters, regardless of whether this offering is consummated, including, without limitation, legal fees and expenses, marketing, syndication and travel expenses. We estimate that the total expenses of this offering, exclusive of the underwriting discounts and commissions, will be approximately $ .
Offering Price Determination
Prior to this public offering, there has been no public market in the U.S. for our common shares. The initial public offering price will be determined by negotiations among us and the representative of the underwriters. Among the factors considered in determining the initial public offering price are our future prospects and those of our industry in general, our sales, earnings and certain other financial and operating information in recent periods, and the price-earnings ratios, price-sales ratios, market prices of securities, and certain financial and operating information of companies engaged in activities similar to ours. The estimated initial public offering price set forth on the cover page of this preliminary prospectus is subject to change as a result of market conditions and other factors. Neither we nor the underwriters can assure investors that an active trading market for the shares will develop, or that after the offering the shares will trade in the public market at or above the initial public offering price.
Indemnification
We have agreed to indemnify the underwriters, and persons who control the underwriters, against certain liabilities, including liabilities under the U.S. Securities Act of 1933, as amended, or the Securities Act, and to contribute to payments that the underwriters may be required to make in respect of these liabilities.
Lock-Up Agreement
We, our directors and executive officers, and four of our principal shareholders have entered into lock-up agreements with the underwriters. Under these agreements, for a period of 120 days after the date of the underwriting agreement, we and each of these persons may not, without the prior written approval of the representative, subject to limited exceptions,
| • | offer, pledge, sell, contract to sell, sell any option or contract to purchase, purchase any option or contract to sell, grant any option, right or warrant for the sale of, or otherwise dispose of or transfer any of our common shares or any securities convertible into or exchangeable or exercisable for our common shares, whether now owned or hereafter acquired or with respect to which such person has or hereafter acquires the power of disposition, or file any registration statement under the Securities Act, with respect to any of the foregoing; or |
| • | enter into any swap or any other agreement or any transaction that transfers, in whole or in part, directly or indirectly, the economic consequence of ownership of our common shares, whether any such swap or transaction is to be settled by delivery of our common shares or other securities, in cash or otherwise. |
Listing on the NASDAQ Capital Market
We have applied to have our common shares approved for listing on the NASDAQ Capital Market under the symbol “NPS.”
126
Table of Contents
Price Stabilization, Short Positions
In connection with this offering, the underwriters may, but are not obligated to, engage in stabilizing transactions, overallotment transactions, syndicate covering transactions and penalty bids.
| • | Stabilizing transactions permit bids to purchase common shares so long as the stabilizing bids do not exceed a specified maximum, and are engaged in for the purpose of preventing or mitigating a decline in the market price of the common shares while the offering is in progress. |
| • | Over-allotment transactions involve sales by the underwriters of common shares in excess of the number of shares the underwriters are obligated to purchase. This creates a syndicate short position that may be either a covered short position or a naked short position. In a covered short position, the number of common shares over-allotted by the underwriters is not greater than the number of shares that they may purchase in the overallotment option. In a naked short position, the number of shares involved is greater than the number of shares in the over-allotment option. The underwriters may close out any short position by exercising their over-allotment option or purchasing shares in the open market. |
| • | Syndicate covering transactions involve purchases of common shares in the open market after the distribution has been completed to cover syndicate short positions. In determining the source of shares to close out the short position, the underwriters will consider, among other things, the price of shares available for purchase in the open market as compared with the price at which they may purchase shares through exercise of the over-allotment option. If the underwriters sell more shares than could be covered by exercise of the over-allotment option and, therefore, have a naked short position, the position can be closed out only by buying shares in the open market. A naked short position is more likely to be created if the underwriters are concerned that after pricing there could be downward pressure on the price of the shares in the open market that could adversely affect investors who purchase in the offering. |
| • | Penalty bids permit the underwriters to reclaim a selling concession from a syndicate member when the common shares originally sold by that syndicate member is purchased in stabilizing or syndicate covering transactions to cover syndicate short positions. |
These stabilizing transactions, syndicate covering transactions and penalty bids may have the effect of raising or maintaining the market price of our common shares or preventing or mitigating a decline in the market price of our common shares. As a result, the price of our common shares in the open market may be higher than it would otherwise be in the absence of these transactions. The underwriters are not required to engage in these activities, and may discontinue any of these activities at any time without notice. Neither we nor the underwriters make any representation or prediction as to the effect that the transactions described above may have on the price of our common shares. These transactions may be effected on the NASDAQ Capital Market, in the over-the-counter market or otherwise and, if commenced, may be discontinued at any time.
Electronic Distribution
This prospectus may be made available in electronic format on websites or through other online services maintained by one or more of the underwriters, or by their affiliates.
Other than this prospectus in electronic format, information on such websites and any information contained in any other website maintained by the underwriters or any of their affiliates is not part of this prospectus or registration statement of which the prospectus forms a part, has not been approved or endorsed by us or the underwriters in their capacities as underwriters and should not be relied on by investors.
Our Relationship with the Underwriters
The underwriters and their respective affiliates are full service financial institutions engaged in various activities, which may include securities trading, commercial and investment banking, financial advisory, investment
127
Table of Contents
management, investment research, principal investment, hedging, financing, valuation and brokerage activities. From time to time, the underwriters and/or their respective affiliates may engage in various financial advisory and investment banking services for us and our affiliates for which they may receive customary compensation or fees; however, no such arrangements have been entered into as of the date of this prospectus. In the ordinary course of their various business activities, the underwriters and their respective affiliates may make or hold a broad array of investments and actively trade debt and equity securities (or related derivative securities) and financial instruments (including bank loans) for their own account and for the accounts of their customers, and those investment and securities activities may involve securities and/or instruments of ours. The underwriters and their respective affiliates may also make investment recommendations and/or publish or express independent research views in respect of those securities or instruments and may at any time hold, or recommend to clients that they acquire, long and/or short positions in those securities and instruments.
Notice to Prospective Investors in the U.K.
In addition, in the U.K., this document is being distributed only to, and is directed only at, and any offer subsequently made may only be directed at persons who are “qualified investors” (as defined in the Prospectus Directive) (i) who have professional experience in matters relating to investments falling within Article 19 (5) of the Financial Services and Markets Act 2000 (Financial Promotion) Order 2005, as amended, or the Order, and/or (ii) who are high net worth companies (or persons to whom it may otherwise be lawfully communicated) falling within Article 49(2)(a) to (d) of the Order (all such persons together being referred to as “relevant persons”). This document must not be acted on or relied on in the U.K. by persons who are not relevant persons. In the U.K., any investment or investment activity to which this document relates is only available to, and will be engaged in with, relevant persons.
European Economic Area
To the extent that the offer of the common shares is made in any Member State of the European Economic Area that has implemented the Prospectus Directive before the date of publication of a prospectus in relation to the common shares which has been approved by the competent authority in the Member State in accordance with the Prospectus Directive (or, where appropriate, published in accordance with the Prospectus Directive and notified to the competent authority in the Member State in accordance with the Prospectus Directive), the offer (including any offer pursuant to this document) is only addressed to qualified investors in that Member State within the meaning of the Prospectus Directive or has been or will be made otherwise in circumstances that do not require us to publish a prospectus pursuant to the Prospectus Directive.
In relation to each Member State of the European Economic Area which has implemented the Prospectus Directive (each, a “Relevant Member State”), each underwriter has represented and agreed that with effect from and including the date on which the Prospectus Directive is implemented in that Relevant Member State (the “Relevant Implementation Date”) it has not made and will not make an offer of shares to the public in that Relevant Member State prior to the publication of a prospectus in relation to the shares which has been approved by the competent authority in that Relevant Member State or, where appropriate, approved in another Relevant Member State and notified to the competent authority in that Relevant Member State, all in accordance with the Prospectus Directive, except that it may, with effect from and including the Relevant Implementation Date, make an offer of shares to the public in that Relevant Member State at any time:
(a) to legal entities which are authorized or regulated to operate in the financial markets or, if not so authorized or regulated, whose corporate purpose is solely to invest in securities,
(b) to any legal entity which has two or more of (1) an average of at least 250 employees during the last financial year; (2) a total balance sheet of more than €43,000,000 and (3) an annual net turnover of more than €50,000,000, as shown in its last annual or consolidated accounts, or
(c) in any other circumstances which do not require the publication by us of a prospectus pursuant to Article 3 of the Prospectus Directive. For the purposes of this provision, the expression an “offer of shares to the public” in
128
Table of Contents
relation to any shares in any Relevant Member State means the communication in any form and by any means of sufficient information on the terms of the offer and the shares to be offered so as to enable an investor to decide to purchase or subscribe the shares, as the same may be varied in that Relevant Member State by any measure implementing the Prospectus Directive in that Relevant Member State and the expression “Prospectus Directive” means Directive 2003/71/EC and includes any relevant implementing measure in each Relevant Member State.
The EEA selling restriction is in addition to any other selling restrictions set out below. In relation to each Relevant Member State, each purchaser of common shares (other than the underwriters) will be deemed to have represented, acknowledged and agreed that it will not make an offer of common shares to the public in any Relevant Member State, except that it may, with effect from and including the date on which the Prospectus Directive is implemented in the Relevant Member State, make an offer of common shares to the public in that Relevant Member State at any time in any circumstances which do not require the publication by us of a prospectus pursuant to Article 3 of the Prospectus Directive, provided that such purchaser agrees that it has not and will not make an offer of any common shares in reliance or purported reliance on Article 3(2)(b) of the Prospectus Directive. For the purposes of this provision, the expression an “offer of shares to the public” in relation to any common shares in any Relevant Member State has the same meaning as in the preceding paragraph.
Switzerland
This document does not constitute a prospectus within the meaning of Art. 652a of the Swiss Code of Obligations. The common shares may not be sold directly or indirectly in or into Switzerland except in a manner which will not result in a public offering within the meaning of the Swiss Code of Obligations. Neither this document nor any other offering materials relating to the common shares may be distributed, published or otherwise made available in Switzerland except in a manner which will not constitute a public offer of the common shares in Switzerland.
129
Table of Contents
We are being represented by Goodwin Procter LLP. The validity of the common shares offered by this prospectus and legal matters relating to Canadian laws will be passed upon for us by Fasken Martineau DuMoulin LLP. Certain legal matters will be passed upon for the underwriters by Nixon Peabody LLP. Certain Canadian legal matters will be passed upon for the underwriters by Blake, Cassels & Graydon LLP.
The consolidated financial statements of Northern Power Systems Corp. (formerly known as Wind Power Holdings, Inc.) and subsidiaries as of December 31, 2013 and 2012, and for the years then ended and the related financial statement schedule for the years ended December 31, 2013 and 2012 included in this prospectus have been audited by CohnReznick LLP, an independent registered public accounting firm, as stated in their report appearing elsewhere herein. Such consolidated financial statements and financial statement schedule have been so included in reliance upon the report of such firm given upon their authority as experts in accounting and auditing.
WHERE YOU CAN FIND MORE INFORMATION
We filed a registration statement on Form S-1 with the Securities and Exchange Commission, or SEC, with respect to the registration of the common shares offered for sale with this prospectus. This prospectus does not contain all of the information set forth in the registration statement and the exhibits to the registration statement. For further information about us, the common shares we are offering by this prospectus and related matters, you should review the registration statement, including the exhibits filed as a part of the registration statement. Statements contained in this prospectus about the contents of any contract or any other document that is filed as an exhibit to the registration statement are not necessarily complete, and we refer you to the full text of the contract or other document filed as an exhibit to the registration statement. A copy of the registration statement and the exhibits that were filed with the registration statement may be inspected without charge at the public reference facilities maintained by the SEC at 100 F Street, N.E., Washington, D.C. 20549, and copies of all or any part of the registration statement may be obtained from the Securities and Exchange Commission upon payment of the prescribed fee. Information on the operation of the public reference facilities may be obtained by calling the SEC at 1-800-SEC-0330. The SEC maintains a website that contains reports, proxy and information statements, and other information regarding registrants that file electronically with the SEC. The address of the site is http://www.sec.gov.
We are, and our predecessor Wind Power Holdings, Inc. was, subject to the information and periodic reporting requirements of the U.S. Securities Exchange Act of 1934, as amended, or the Exchange Act, and, in accordance with such requirements, file periodic reports, proxy statements, and other information with the SEC. These periodic reports, proxy statements, and other information are available for inspection and copying at the regional offices, public reference facilities, and web site of the SEC referred to above. We also maintain a website at www.northernpower.com. You may access our annual reports on Form 10-K, quarterly reports on Form 10-Q, current reports on Form 8-K and amendments to those reports filed or furnished pursuant to Section 13(a) or 15(d) of the Exchange Act with the SEC free of charge at our website as soon as reasonably practicable after such material is electronically filed with, or furnished to, the SEC. Our website also provides links to our Canadian securities filings on SEDAR and the SEC filings of our predecessor reporting company Wind Power Holdings, Inc. on EDGAR. The information contained in, or that can be accessed through, our website is not part of this prospectus.
130
Table of Contents
Formerly Known as Wind Power Holdings, Inc.
Index to the Consolidated Financial Statements
F-1
Table of Contents
Report of Independent Registered Public Accounting Firm
The Shareholders and board of directors
Northern Power Systems Corp.
We have audited the accompanying consolidated balance sheets of Northern Power Systems Corp. (formerly known as Wind Power Holdings, Inc.) and subsidiaries (the “Company”) as of December 31, 2013 and 2012, and the related consolidated statements of operations and comprehensive loss, changes in shareholders’ equity (deficiency) and cash flows for the years then ended. Our audit also included the financial statement schedule listed in the Index at F-1. The Company’s management is responsible for these consolidated financial statements and financial statement schedule. Our responsibility is to express an opinion on these consolidated financial statements and financial statement schedule based on our audits.
We conducted our audits in accordance with the standards of the Public Company Accounting Oversight Board (United States). Those standards require that we plan and perform the audit to obtain reasonable assurance about whether the financial statements are free of material misstatement. The Company is not required to have, nor were we engaged to perform, an audit of the Company’s internal control over financial reporting. Our audit included consideration of internal control over financial reporting as a basis for designing audit procedures that are appropriate in the circumstances, but not for the purpose of expressing an opinion on the effectiveness of the Company’s internal controls over financial reporting. Accordingly, we express no such opinion. An audit also includes examining, on a test basis, evidence supporting the amounts and disclosures in the financial statements, assessing the accounting principles used and significant estimates made by management, as well as evaluating the overall financial statement presentation. We believe that our audits provide a reasonable basis for our opinion.
In our opinion, the consolidated financial statements referred to above present fairly, in all material respects, the financial position of Northern Power Systems Corp. and subsidiaries as of December 31, 2013 and 2012, and the results of their operations and their cash flows for the years then ended, in conformity with accounting principles generally accepted in the United States of America. Also, in our opinion, such financial statement schedule, when considered in relation to the basic consolidated financial statements taken as a whole, presents fairly in all material respects the information set forth therein.
/s/ CohnReznick LLP
Glastonbury, Connecticut
April 14, 2014, except for the caption “Liquidity” in Note 1 and the fourth paragraph of Note 18, which are as of September 3, 2014
F-2
Table of Contents
FORMERLY KNOWN AS WIND POWER HOLDINGS, INC.
CONSOLIDATED BALANCE SHEETS
AS OF DECEMBER 31, 2013 AND 2012
(In thousands, except share and per share amounts)
| 2013 | 2012 | |||||||
| ASSETS |
||||||||
| CURRENT ASSETS: |
||||||||
| Cash |
$ | 4,534 | $ | 4,456 | ||||
| Accounts receivable — net of allowance for doubtful accounts of $103 and $22 at December 31, 2013 and 2012, respectively |
1,961 | 1,161 | ||||||
| Inventories — net (Note 4) |
11,682 | 6,258 | ||||||
| Deferred costs |
1,443 | 1,285 | ||||||
| Prepaid expenses and other current assets |
1,365 | 681 | ||||||
|
|
|
|
|
|||||
| Total current assets |
20,985 | 13,841 | ||||||
| Property, plant and equipment — net (Note 7) |
1,414 | 1,900 | ||||||
| Intangible assets — net (Note 8) |
509 | 696 | ||||||
| Goodwill |
722 | 722 | ||||||
| Deferred income taxes (Note 15) |
2,384 | 409 | ||||||
| Asset held for sale |
1,300 | 2,077 | ||||||
| Other assets |
231 | 381 | ||||||
|
|
|
|
|
|||||
| Total Assets |
$ | 27,545 | $ | 20,026 | ||||
|
|
|
|
|
|||||
The accompanying notes are an integral part of these consolidated financial statements. (Continued)
F-3
Table of Contents
NORTHERN POWER SYSTEMS CORP.
FORMERLY KNOWN AS WIND POWER HOLDINGS, INC.
CONSOLIDATED BALANCE SHEETS
AS OF DECEMBER 31, 2013 AND 2012
(In thousands, except share and per share amounts)
| 2013 | 2012 | |||||||
| LIABILITIES AND SHAREHOLDERS’ EQUITY (DEFICIENCY) |
||||||||
| CURRENT LIABILITIES: |
||||||||
| Current portion of long-term debt (Note 9) |
$ | 141 | $ | 100 | ||||
| Accounts payable |
2,148 | 601 | ||||||
| Accrued expenses (Note 10) |
2,158 | 1,480 | ||||||
| Accrued compensation |
2,207 | 1,199 | ||||||
| Deferred revenue |
4,221 | 1,340 | ||||||
| Deferred income taxes (Note 15) |
2,532 | 549 | ||||||
| Customer deposits |
10,917 | 4,227 | ||||||
| Liability for stock compensation (Note 13) |
598 | — | ||||||
| Other current liabilities |
197 | 753 | ||||||
|
|
|
|
|
|||||
| Total current liabilities |
25,119 | 10,249 | ||||||
| Deferred revenue, less current portion |
1,163 | 1,112 | ||||||
| Senior secured convertible notes (Note 9) |
12,107 | — | ||||||
| Long-term debt, less current portion (Note 9) |
300 | 346 | ||||||
| Liability for stock compensation (Note 13) |
— | 456 | ||||||
| Warrant liability (Note 11) |
— | 3,268 | ||||||
| Other long-term liability (Note 19) |
258 | 349 | ||||||
|
|
|
|
|
|||||
| Total Liabilities |
38,947 | 15,780 | ||||||
|
|
|
|
|
|||||
| Commitments and Contingencies (Note 19) |
||||||||
| SHAREHOLDERS’ EQUITY (DEFICIENCY): |
||||||||
| Series A convertible preferred stock, $5.00 face amount — 0 and 11,290,200 shares authorized, issued, and outstanding as of December 31, 2013 and 2012, respectively (liquidation value $0 and $68,670, respectively). |
— | 56,451 | ||||||
| Series B convertible preferred stock, $6.00 face amount — 0 and 9,407,939 shares authorized, issued and outstanding as of December 31, 2013 and 2012, respectively (liquidation value $0 and $64,656, respectively). |
— | 56,447 | ||||||
| Series C-1 convertible preferred stock, $6.30 face amount — 0 and 1,619,048 shares authorized; 0 and 1,608,322 shares issued and outstanding as of December 31, 2013 and 2012, respectively (liquidation value $0 and $10,829, respectively). |
— | 21,994 | ||||||
| Series C-2 convertible preferred stock, $6.30 face amount — 0 and 6,476,192 shares authorized; 0 and 69,685 shares issued and outstanding as of December 31, 2013 and 2012, respectively (liquidation value $0 and $468, respectively). |
— | 181 | ||||||
| Series X convertible preferred stock, 6,000,000 authorized and no shares issued and outstanding as of December 31, 2013 and 2012. |
— | — | ||||||
| Common stock, $0.01 par value — 44,000,000 and 33,000,000 shares authorized; 12,840,187 and 15,072 shares issued and outstanding as of December 31, 2013 and 2012, respectively. |
128 | — | ||||||
| Additional paid-in capital |
139,804 | 6,379 | ||||||
| Accumulated deficit |
(151,334 | ) | (137,206 | ) | ||||
|
|
|
|
|
|||||
| Total Shareholders’ Equity (Deficiency) |
(11,402 | ) | 4,246 | |||||
|
|
|
|
|
|||||
| Total Liabilities and Shareholders’ Equity (Deficiency) |
$ | 27,545 | $ | 20,026 | ||||
|
|
|
|
|
|||||
The accompanying notes are an integral part of these consolidated financial statements.
(Concluded)
F-4
Table of Contents
FORMERLY KNOWN AS WIND POWER HOLDINGS, INC.
CONSOLIDATED STATEMENTS OF OPERATIONS AND COMPREHENSIVE LOSS
FOR THE YEARS ENDED DECEMBER 31, 2013 AND 2012
(In thousands, except share and per share amounts)
| 2013 | 2012 | |||||||
| REVENUES: |
||||||||
| Product |
$ | 19,142 | $ | 16,509 | ||||
| License |
— | 10,000 | ||||||
| Design service |
522 | — | ||||||
| Service |
934 | 891 | ||||||
|
|
|
|
|
|||||
| Total revenues |
20,598 | 27,400 | ||||||
|
|
|
|
|
|||||
| COSTS OF REVENUE AND OPERATING EXPENSES: |
||||||||
| Cost of product revenues |
16,346 | 15,968 | ||||||
| Cost of service revenues |
3,012 | 3,205 | ||||||
| Sales and marketing |
2,977 | 2,902 | ||||||
| Research and development |
4,238 | 4,260 | ||||||
| General and administrative |
6,938 | 7,126 | ||||||
| Assets held for sale loss |
768 | — | ||||||
| Restructuring charges |
70 | 2,145 | ||||||
| Impairment of certain long-lived assets |
— | 1,451 | ||||||
|
|
|
|
|
|||||
| Total costs of revenue and operating expenses |
34,349 | 37,057 | ||||||
|
|
|
|
|
|||||
| Loss from operations |
(13,751 | ) | (9,657 | ) | ||||
| Change in fair value of warrants |
172 | 4,545 | ||||||
| Interest expense |
(514 | ) | (88 | ) | ||||
|
|
|
|
|
|||||
| Loss before provision for income taxes |
(14,093 | ) | (5,200 | ) | ||||
| Provision for income taxes |
35 | 1,014 | ||||||
|
|
|
|
|
|||||
| NET LOSS |
(14,128 | ) | (6,214 | ) | ||||
| Other comprehensive loss |
||||||||
| Foreign currency translation adjustment |
— | (2 | ) | |||||
|
|
|
|
|
|||||
| COMPREHENSIVE LOSS |
$ | (14,128 | ) | $ | (6,216 | ) | ||
|
|
|
|
|
|||||
| Net loss applicable to common shareholders (Note 2) |
$ | (17,815 | ) | $ | (12,388 | ) | ||
| Net loss per common share |
||||||||
| Basic and diluted |
$ | (4.60 | ) | $ | (821.92 | ) | ||
| Weighted average number of common shares outstanding |
||||||||
| Basic and diluted |
3,872,895 | 15,072 | ||||||
The accompanying notes are an integral part of these consolidated financial statements.
F-5
Table of Contents
FORMERLY KNOWN AS WIND POWER HOLDINGS, INC.
CONSOLIDATED STATEMENTS OF CHANGES IN SHAREHOLDERS’ EQUITY (DEFICIENCY)
FOR THE YEARS ENDED DECEMBER 31, 2013 AND 2012
(In thousands except share amounts)
| Series A Convertible Preferred Stock |
Series B Convertible Preferred Stock |
Series C-1 Convertible Preferred Stock |
Series C-2 Convertible Preferred Stock |
Common Stock | Additional Paid-In Capital |
Accumulated Other Comprehensive Income (Loss) |
Accumulated Deficit |
Total Shareholders’ Equity (Deficiency) |
||||||||||||||||||||||||||||||||||||||||||||||||
| Shares | Amount | Shares | Amount | Shares | Amount | Shares | Amount | Shares | Amount | |||||||||||||||||||||||||||||||||||||||||||||||
| BALANCE — January 1, 2012 |
11,290,200 | $ | 56,451 | 9,407,939 | $ | 56,447 | 1,608,322 | $ | 21,994 | 69,685 | $ | 181 | 15,072 | $ | — | $ | 4,605 | $ | 2 | $ | (130,992 | ) | $ | 8,688 | ||||||||||||||||||||||||||||||||
| Change in the liability classification of stock-based compensation |
— | — | — | — | — | — | — | — | — | — | 1,774 | — | — | 1,774 | ||||||||||||||||||||||||||||||||||||||||||
| Net loss |
— | — | — | — | — | — | — | — | — | — | — | — | (6,214 | ) | (6,214 | ) | ||||||||||||||||||||||||||||||||||||||||
| Currency translation adjustment |
— | — | — | — | — | — | — | — | — | — | — | (2 | ) | — | (2 | ) | ||||||||||||||||||||||||||||||||||||||||
|
|
|
|
|
|
|
|
|
|
|
|
|
|
|
|
|
|
|
|
|
|
|
|
|
|
|
|
|
|||||||||||||||||||||||||||||
| BALANCE — December 31, 2012 |
11,290,200 | 56,451 | 9,407,939 | 56,447 | 1,608,322 | 21,994 | 69,685 | 181 | 15,072 | — | 6,379 | — | (137,206 | ) | 4,246 | |||||||||||||||||||||||||||||||||||||||||
| Stock based compensation expense |
— | — | — | — | — | — | — | — | — | — | 369 | — | — | 369 | ||||||||||||||||||||||||||||||||||||||||||
| Change in the liability classification of stock-based compensation |
— | — | — | — | — | — | — | — | — | — | 266 | — | — | 266 | ||||||||||||||||||||||||||||||||||||||||||
| April conversion |
(1,773,800 | ) | (8,869 | ) | (3,399,195 | ) | (20,398 | ) | (358,245 | ) | (4,899 | ) | — | — | 305,931 | 3 | 34,163 | — | — | — | ||||||||||||||||||||||||||||||||||||
| Warrant conversion |
— | — | — | — | — | — | 2,734,390 | 3,095 | — | — | — | — | — | 3,095 | ||||||||||||||||||||||||||||||||||||||||||
| September automatic conversion |
(9,516,400 | ) | (47,582 | ) | (6,008,744 | ) | (36,049 | ) | — | — | (2,804,075 | ) | (3,276 | ) | 6,099,066 | 61 | 86,846 | — | — | — | ||||||||||||||||||||||||||||||||||||
| Series C-1 conversion to senior secured convertible notes |
— | — | — | — | (1,250,077 | ) | (17,095 | ) | — | — | 6,420,118 | 64 | 11,781 | — | — | (5,250 | ) | |||||||||||||||||||||||||||||||||||||||
| Net loss |
— | — | — | — | — | — | — | — | — | — | — | — | (14,128 | ) | (14,128 | ) | ||||||||||||||||||||||||||||||||||||||||
|
|
|
|
|
|
|
|
|
|
|
|
|
|
|
|
|
|
|
|
|
|
|
|
|
|
|
|
|
|||||||||||||||||||||||||||||
| BALANCE — December 31, 2013 |
— | $ | — | — | $ | — | — | $ | — | — | $ | — | 12,840,187 | $ | 128 | $ | 139,804 | $ | — | $ | (151,334 | ) | $ | (11,402 | ) | |||||||||||||||||||||||||||||||
|
|
|
|
|
|
|
|
|
|
|
|
|
|
|
|
|
|
|
|
|
|
|
|
|
|
|
|
|
|||||||||||||||||||||||||||||
The accompanying notes are an integral part of these consolidated financial statements.
F-6
Table of Contents
FORMERLY KNOWN AS WIND POWER HOLDINGS, INC.
CONSOLIDATED STATEMENTS OF CASH FLOWS
FOR THE YEARS ENDED DECEMBER 31, 2013 AND 2012
(In thousands)
| 2013 | 2012 | |||||||
| OPERATING ACTIVITIES: |
||||||||
| Net loss |
$ | (14,128 | ) | $ | (6,214 | ) | ||
| Adjustments to reconcile net loss to net cash used in operating activities: |
||||||||
| Change in fair value of warrants |
(172 | ) | (4,545 | ) | ||||
| Provision for inventory obsolescence |
22 | 430 | ||||||
| Provision for doubtful accounts |
152 | (196 | ) | |||||
| Stock-based compensation expense |
701 | 971 | ||||||
| Depreciation and amortization |
985 | 1,726 | ||||||
| Noncash restructure charges |
70 | 1,512 | ||||||
| Loss from disposals of property and equipment |
— | 44 | ||||||
| Deferred income taxes |
8 | 19 | ||||||
| Assets held for sale loss |
768 | — | ||||||
| Impairment of long-lived assets |
— | 1,451 | ||||||
| Changes in operating assets and liabilities: |
||||||||
| Accounts receivable |
(952 | ) | 156 | |||||
| Other current and noncurrent assets |
(534 | ) | 111 | |||||
| Inventories |
(5,269 | ) | (1,150 | ) | ||||
| Deferred costs |
(158 | ) | 1,138 | |||||
| Accounts payable |
1,549 | (311 | ) | |||||
| Accrued expenses |
1,598 | (2,083 | ) | |||||
| Customer deposits |
6,689 | (538 | ) | |||||
| Deferred revenue and other short term liabilities |
2,707 | 693 | ||||||
| Other liabilities |
(91 | ) | 349 | |||||
|
|
|
|
|
|||||
| Net cash used in operating activities |
(6,055 | ) | (6,437 | ) | ||||
|
|
|
|
|
|||||
| INVESTING ACTIVITIES: |
||||||||
| Purchases of property and equipment |
(387 | ) | (390 | ) | ||||
|
|
|
|
|
|||||
| Net cash used in investing activities |
(387 | ) | (390 | ) | ||||
|
|
|
|
|
|||||
| FINANCING ACTIVITIES: |
||||||||
| Proceeds from debt issuance |
179 | 51 | ||||||
| Debt principal payments |
(184 | ) | (50 | ) | ||||
| Proceeds from issuance of convertible notes |
6,525 | — | ||||||
|
|
|
|
|
|||||
| Net cash provided by financing activities |
6,520 | 1 | ||||||
|
|
|
|
|
|||||
| Effect of exchange rate change on cash |
— | (2 | ) | |||||
|
|
|
|
|
|||||
| Change in cash |
78 | (6,828 | ) | |||||
| Cash — Beginning of Year |
4,456 | 11,284 | ||||||
|
|
|
|
|
|||||
| Cash — End of Year |
$ | 4,534 | $ | 4,456 | ||||
|
|
|
|
|
|||||
| SUPPLEMENTAL DISCLOSURES OF CASH FLOW INFORMATION: |
||||||||
| Cash paid for interest |
$ | 50 | $ | 24 | ||||
|
|
|
|
|
|||||
| Cash paid for income taxes |
$ | 24 | $ | 1,043 | ||||
|
|
|
|
|
|||||
The accompanying notes are an integral part of these consolidated financial statements.
F-7
Table of Contents
FORMERLY KNOWN AS WIND POWER HOLDINGS, INC.
NOTES TO CONSOLIDATED FINANCIAL STATEMENTS
AS OF AND FOR THE YEARS ENDED DECEMBER 31, 2013 AND 2012
(In thousands except share and per share amounts)
| 1. | DESCRIPTION OF BUSINESS |
The Company, as defined below, is a provider of advanced technology for the renewable energy sector. The Company designs, manufactures and services next-generation Permanent Magnet Direct-Drive (PM/DD) wind turbines for the distributed wind market, and licenses existing and evolving utility-class wind turbine platforms to large manufacturers on a global basis. The Company also provides engineering and development services for a wide variety of renewable energy applications.
The Company’s headquarters are in Barre, Vermont, and it has a sales office in Zurich, Switzerland. The Company employs approximately 102 employees.
As of December 31, 2013, the parent holding company of the group was Wind Power Holdings, Inc. (“WPHI”), which had a wholly owned subsidiary, Northern Power Systems, Inc. (“Northern”). Northern had two wholly-owned subsidiaries, Northern Power Systems AG and Northern Power Systems S.r.l. WPHI was formed on August 12, 2008, and Northern was formed on July 14, 2008. WPHI previously had another wholly owned subsidiary, Northern Power Systems Utility Scale, Inc. (“Utility Scale”), which was formed on November 13, 2009. Utility Scale was merged into Northern effective December 31, 2013.
Liquidity
The Company’s initially issued financial statements disclosed a going concern uncertainty and management’s plans to address that uncertainty. Subsequent to the issuance of those financial statements, such going concern uncertainty was mitigated as follows:
Reverse Takeover Transaction and Private Placement — On April 16, 2014, a reverse takeover transaction (the “Merger”) contemplated by a Merger Agreement and Plan of Reorganization, dated as of March 31, 2014, by and among Mira III Acquisition Corp. (“Mira III”), WPHI, Mira Subco Inc., and Mira Subco LLC was consummated.
Upon the filing of Certificates of Merger with the Secretary of State of the State of Delaware on April 16, 2014, (i) Mira Subco Inc., a wholly-owned subsidiary of Mira III, merged with and into WPHI, with WPHI as the surviving corporation, and (ii) WPHI merged with and into Mira Subco LLC, a wholly-owned subsidiary of Mira III, with Mira Subco LLC as the surviving entity, as part of an integrated transaction. In connection with the Merger, all of the equity securities of WPHI were exchanged for common shares and restricted voting shares of Mira III. Following the completion of the transaction, Mira III changed its name to Northern Power Systems Corp. (“NPS”). NPS Corp. and its subsidiaries or WPHI and its subsidiaries as applicable are referred to herein as the “Company.” Also in connection with the Merger, the Company completed a private placement of 6,125,000 subscription receipts on March 17, 2014 for aggregate gross proceeds of CDN$24,500 (USD$22,273) at a price of CDN$4.00 per Subscription Receipt, which was received by NPS Corp. out of escrow on April 16, 2014. Finally, WPHI’s Senior Secured Convertible Notes were converted into Mira III common shares.
Liquidity — Management believes that, with the completion of its equity capital raise on April 16, 2014 and the conversion of the Senior Secured Convertible Notes due on June 30, 2014, as described above, the previously reported going concern uncertainty has been mitigated.
F-8
Table of Contents
| 2. | SUMMARY OF SIGNIFICANT ACCOUNTING POLICIES |
Significant accounting policies followed in the preparation of these consolidated financial statements are as follows:
Principles of Consolidation — The consolidated financial statements include the accounts of Northern Power Systems Corp. (formerly known as Wind Power Holdings, Inc.) and its wholly owned subsidiaries after elimination of all intercompany transactions and balances.
Use of Estimates — The preparation of financial statements in conformity with accounting principles generally accepted in United States (“U.S. GAAP”) requires management to make estimates and assumptions that affect the amounts reported in the consolidated financial statements and accompanying notes. Actual results could differ from those estimates. Periodically, the Company evaluates its estimates, including those related to the accounts receivable, valuation allowance for inventories, useful lives of property and equipment and intangible assets, accruals for product warranty, estimates of fair value for stock-based compensation and the recording of warrant liabilities, income taxes and contingencies, among others. The Company bases its estimates on historical experience and on various other assumptions that are believed to be reasonable at the time they are made, the results of which form the basis for making judgments about the carrying values of assets and liabilities.
Cash and Cash Equivalents — The Company considers all highly liquid investments that are readily convertible to cash with original maturity dates of three months or less as of the purchase date to be cash equivalents. There are no cash equivalents as of December 31, 2013 and 2012.
Accounts Receivable — Accounts receivable are stated at their estimated net realizable value. Accounts receivable are charged to the allowance for doubtful accounts when deemed uncollectible. The Company evaluates the collectability of accounts receivable based on the following factors:
| • | Age of past due receivables and specific customer circumstances; |
| • | Probability of recoverability based on historical collection and write-off experience; and, |
| • | Current economic trends |
If the financial condition of the Company’s customers were to deteriorate, resulting in an impairment of their ability to make payment, additional allowances may be required.
Revenue Recognition — The Company generates revenue from three principal sources: product sales, licensing of Intellectual Property (“IP”), and services. Revenues from product sales are recognized when delivery has occurred under completely executed sales agreements with selling prices fixed or determinable, and for which collectability is reasonably assured. Revenues from service, design activities, and repair time are recognized as work is performed and collectability is reasonably assured. During 2013 and 2012, service revenues were related primarily to commissioning activities as well as revenue generated from extended warranties and maintenance and service contracts.
Virtually all of the Company’s turbine sales contracts include multiple elements that are delivered at different points of time. A deliverable in an arrangement qualifies as a separate unit of accounting if the delivered item has value to the customer on a stand-alone basis. The Company’s contracts are composed of two or three units of accounting: the turbine product, commissioning services, and sometimes installation and/or extended warranty services.
For these arrangements, the revenue is allocated to each of the deliverables based upon their relative selling prices as determined by a selling-price hierarchy. The Company has determined that vendor-specific objective evidence (“VSOE”) and third-party evidence (“TPE”) are not available for its elements and therefore management’s best estimate of selling price (“BESP”) is currently used. VSOE is the price at which the Company independently sells each unit of accounting to its customers. TPE is the price of any competitor’s largely interchangeable products or services in stand-alone sales to similarly situated customers. BESP is the price at which the Company would sell the deliverable if it were sold regularly on a
F-9
Table of Contents
stand-alone basis, considering market conditions and entity-specific factors. The Company will re-evaluate the existence of VSOE and TPE in each reporting period and utilize the highest-level available pricing method in the hierarchy at any time.
Revenue recognition for product sales is deferred until all revenue recognition criteria been met. The Company seeks to make the timing for which the criteria are met consistent across sales agreements; however, the timing may differ as a result of contract negotiations. Customers may also elect to purchase extended warranty agreements that are deferred and recognized over the covering years, generally years three through five of the turbine’s life. As of December 31, 2013 and 2012, total short and long-term deferred revenue was $5,384 and $2,452, respectively. Costs deferred as of December 31, 2013 and 2012, were $1,443 and $1,285, respectively. Amounts received from customers in advance of shipment of $10,917 and $4,227 as of December 31, 2013 and 2012, respectively, are recorded as customer deposits. Accounts receivable for product sales are recognized upon the transfer of title under the related sales contract terms.
The Company follows Accounting Standards Codification (“ASC”) 605-25, Revenue Recognition Multiple Element Arrangements, for recognizing revenue on the value of prototype and pilot products when title is transferred. Payments received prior to title transfer are recorded as customer deposits or deferred revenue until recognition is achieved. The Company follows ACS 330 for classifying costs related to producing the products as inventory until the sale is recognized at which point they are expensed as cost of goods sold.
Revenue related to the licensing of IP is recognized per ASC 605-25-3, Revenue Recognition, Multiple Element Arrangements, Units of Accounting which refers to SAB 100 Subtopic 13.A.3(d) License Fee Revenue, which states that delivery for revenue recognition purposes does not occur until the license term begins. Therefore, the Company does not recognize revenue from the licensed IP until the customer has the right to use the IP per the terms of the contract, physical delivery of the IP has occurred and all other revenue recognition criteria have been met. There may be instances in which the IP has been delivered but other services such as training, installation support and/or supply chain certification are necessary for the customer to fully benefit from the IP. In those cases, revenue recognition may be deferred until such services are delivered. For contracts to perform development services the Company records revenues using either the percentage-of-completion method, or the milestone method, in which case revenue is recognized by the achievement of design milestones agreed to in the contract depending upon specific facts and circumstances.
Inventories — Inventories include material, direct labor and related manufacturing overhead, and are accounted for at the lower of cost, determined by the weighted average method, or market value. Excess inventory is carried at its estimated net realizable value. Excess inventory is estimated using assumptions regarding forecasted customer demand, market conditions, the age of the inventory items, and likely technological obsolescence. If any of the current estimates are significantly inaccurate, losses may result, which could be material.
Property, Plant and Equipment — Property, plant, and equipment are accounted for at cost or, upon acquisition, at fair value. Depreciation is computed using the straight-line method over the estimated useful lives of the assets. When assets are retired or otherwise disposed of, the related costs and accumulated depreciation are removed from their respective accounts and any resulting gain or loss is included in operations. Expenditures for repairs and maintenance not considered to substantially lengthen useful lives are charged to expense as incurred.
F-10
Table of Contents
Estimated useful lives of the assets are as follows:
| Asset Classification | Estimated Useful Life | |
| Machinery and equipment |
5 to 10 years | |
| Patterns and tooling |
5 to 7 years | |
| Field service spare parts |
3 to 10 years | |
| Office furniture and equipment |
3 to 7 years | |
| IT equipment and software |
3 to 5 years | |
| Leasehold improvements |
Shorter of the estimated useful life or remaining lease term |
Goodwill and Other Intangible Assets — Intangible assets consist of (1) goodwill, which is not subject to amortization; and (2) amortizing intangibles, consisting of developed technology, core technology, trade name and intellectual property which are being amortized over the estimated life of each item. Goodwill and intangible assets are allocated to the Company’s reporting units when testing for impairment.
Goodwill represents the excess of the fair value of the consideration exchanged in a business combination over the fair value of the net assets acquired, and is tested for impairment at least annually. The Company’s $722 of goodwill reported on the December 31, 2013 and 2012 balance sheets is a result of the purchase of the assets and the assumption of certain specified liabilities as part of the acquisition on August 15, 2008. The Company completed its annual goodwill impairment testing effective September 30, 2013. The Company performed a qualitative analysis on the goodwill balance as of September 30, 2013. Based on this evaluation, the Company determined that there have been no events or changes in circumstances that would indicate that it was more likely than not that goodwill was impaired. The Company performed step-one of the annual impairment test required on the goodwill balance as of September 30, 2012 and concluded that there was no goodwill impairment for 2012.
Recoverability of amortizing intangibles assets is assessed when events have occurred that may give rise to impairment. When a potential impairment risk has been identified, forecasted undiscounted net cash flows of the asset group to which the asset relates are compared to the current carrying value of the long-lived assets present in that group. If such cash flows are less than such carrying amounts, and the fair value of the asset group is determined to be less than the carrying value, long-lived assets including such intangibles, are written down to their respective fair values.
The Company reviews its long-lived assets for impairment when changes in business circumstances warrant a review. In accordance with applicable guidance, the Company reviews the carrying value of asset groups that represent the lowest level for which identifiable cash flows are largely independent of the cash flows of other groups of assets and liabilities. The Company believes that there were no events for the year ended December 31, 2013, which would necessitate an impairment review of long-lived assets. The Company concluded that there was no impairment of long-lived assets as of December 31, 2013. The Company determined that effective December 31, 2012, that circumstances warranted an impairment analysis of long-lived assets. It was determined that the fair value of certain long-lived assets was less than the carrying value in 2012. As such the Company recorded an impairment charge in 2012 as detailed in Note 6.
Warranty Costs — The Company’s warranty contract with customers of the NPS 100 or 60 products is sometimes limited to repair or replacement of parts and typically expires two years from the date of shipment or commissioning. In such cases, the Company has typically provided non-warranty obligated services at no charge during the initial two-year period. The obligation to provide warranty services is deemed a contingency because it meets the probable and estimate criteria of ASC 460-10-25-2 and as such required accrual at the inception of the warranty period per ASC 460-10-25-5. The Company estimates the accrual on a per turbine basis based on historical warranty experience of the installed turbine base as a group consistent with ASC 460-10-25-6 and 7. The history is evaluated annually and the per turbine accrual is adjusted as appropriate to reflect changes in actual warranty experience.
F-11
Table of Contents
Estimated warranty obligations are recorded in the earlier period of: (i) the period in which the related revenue is recognized or, (ii) the period in which the obligation is established. Warranty liabilities are based on estimated future repair costs incurred during the warranty period using historical labor, travel, shipping, and material costs, as well as estimated costs for performance warranty failures, when applicable, based upon historical performance experience. The accounting for warranties requires management to make assumptions and apply judgments when estimating product failure rates and expected costs. Adjustments are made to warranty accruals based on claim data and experience. Such adjustments have typically resulted in reductions to the Company’s estimated warranty obligation as the products have matured and improved in quality. These adjustments have been disclosed as reversals in the Company’s roll-forward of such obligations. Further, if actual results are not consistent with the assumptions and judgments used to estimate warranty obligations, because either failure rates or repair costs differ from management’s assumptions, the resulting change in estimate could be material.
Customers may elect to purchase extended warranty coverage for repair or replacement of parts for a period covering year’s three through five of the product life. These extended warranties are considered services and are accounted for under the guidance of ASC 605-20-25. Revenues are deferred and recognized ratably over the service term consistent with ASC 605-20-25-3. Costs associated with these extended warranty contracts are expensed to cost of sales as incurred.
The Company’s warranty contract with customers of the NPS 2.3 MW product includes all costs associated with repairing or replacing parts within the turbine, as well as certain performance warranties that require cash payment to the customer if the performance level is not achieved. These performance warranties expired in 2013. The product warranty accrual for the prototype units were determined based on projected costs, the remaining term of the warranty, and the historic warranty services performed on the units. The Company accrued a reserve for the risk of the performance based on warranties in 2011. Both turbines exceeded the performance requirements throughout 2012 and no payments were made under this warranty. The Company no longer has a reserve recorded for nonperformance related to this contractual obligation because it expired in 2013.
Research and Development — Research and development costs are expensed as incurred. Research and development expenses consist primarily of salaries, benefits and related overhead, as well as consulting costs related to design and development of new products.
Income Taxes — The Company uses the liability method of accounting for income taxes. Under this method, income taxes are provided for amounts currently payable and for deferred tax assets and liabilities, which are determined based on the differences between the financial statement carrying amounts and the tax basis of existing assets and liabilities. Deferred income taxes are measured using enacted tax rates in effect for the year in which the differences are expected to reverse. A valuation allowance is established for any deferred tax asset for which realization is not more likely than not.
The Company accounts for uncertain tax positions by determining a minimum probability threshold that a tax position must meet before a financial statement benefit is recognized. The minimum threshold is defined as a tax position that is more likely than not to be sustained upon examination by the applicable taxing authority, including resolution of any related appeals or litigation processes, based on the technical merits of the position. The tax benefit to be recognized is measured as the largest amount of benefit that is greater than 50% likely of being realized upon ultimate settlement. The Company does not believe material uncertain tax positions have arisen to date, and as a result, no reserves for these matters have been recorded and no interest or penalties have been recognized. Assessment of uncertain tax positions requires significant judgments relating to the amounts, timing, and likelihood of ultimate resolution. The Company’s actual results could differ materially from these estimates.
Warrants Classified as Liabilities — The Company’s Warrants, when outstanding, represented a free-standing financial instrument that did not qualify for equity classification pursuant to ASC 815-40 and were therefore presented as a liability which was revalued periodically, and as of the reporting dates of these financial statements. The Company accounted for these liability classified warrants by recording them
F-12
Table of Contents
initially at fair market value estimated using the Black-Scholes option pricing model. The Company revalued the warrants periodically and any resulting change in the fair value of the warrants was recorded within the statements of operations and comprehensive loss, presented as a separately disclosed item. Warrants were also revalued immediately prior to any exercises of warrants, and as of each reporting date. There were no outstanding warrants as of December 31, 2013.
Restructuring Costs — The Company follows the guidance of ASC 420, Exit or Disposal Cost Obligations, which addresses the treatment of costs incurred for terminating employees, canceling contracts, consolidating facilities, as well as ASC 360-10-35-15, Impairment or Disposal of Long-lived Assets, to account for any disposal of fixed assets. The Company provides for costs of a restructuring when the restructuring plan is finalized and a liability has been incurred. Note 5 details the Company’s 2012 restructuring.
Stock-Based Compensation — Prior to September 29, 2011, the Company had only equity classification option awards. On September 29, 2011, the Company completed a stock option exchange program which resulted in the majority of the Company’s options at that time being classified as liability-based awards. For equity awards, stock-based compensation expense is recognized based on the fair value of the awards on the grant date and amortized on a straight-line basis over their vesting terms. For modified liability awards, the Company revalues the awards at each reporting period until settlement of the award. Stock-based compensation expense is recognized as the greater of the fair value of the awards on the grant date or reporting date, amortized on the straight-line basis over their vesting terms. For awards initially issued as liability-based awards, the Company revalues the awards at each reporting period until settlement of the awards, with stock-based compensation expense recognized based upon the fair value of the awards as of the reporting date, amortized on the straight-line basis over their vesting terms. Awards that have vested but are not settled are revalued at each reporting date and any excess of the current fair value over the grant-date fair value is recognized as stock compensation expense in such period. The Company presents the liability for applicable option awards based upon reporting-date fair market value for such awards.
Stock-based compensation expense is recorded net of anticipated forfeiture rates for unvested equity, and liability awards. The Company considers many factors when estimating the stock-based compensation forfeiture rate including employee class, economic environment, historical data, and anticipated future employee turnover. The Company reviews its forfeiture rate when changes in business circumstances warrant a review, and performs a full analysis annually as of December 31.
The Company accounts for stock-based compensation issued to nonemployees at the fair value of equity instruments given as consideration for services rendered as a noncash expense to operations. The equity instruments are revalued on each subsequent reporting date, until the measurement date is determined.
Concentration of Credit Risk — The Company’s customers operate primarily in the distributed energy market and include wind developers and end users that cover multiple industries and geographic locations. The Company’s products and services are sold under contracts with varying terms including contracts denominated in foreign currencies. As of December 31, 2013, 45% of the Company’s revenues were denominated in foreign currencies, mostly in Euro. The value of revenues denominated in a currency other than the U.S. dollar was limited in the year ended December 31, 2012. If the Company continues to increase the percentage of contracts denominated in foreign currencies, gains or losses due to fluctuations in currency exchange rates could become increasingly material.
Financial instruments which are potentially subject the Company to concentrations of credit risk are cash, time deposits when held, and accounts receivable. At times, cash balances in financial institutions may exceed federally insured deposit limits, however, management periodically evaluates the creditworthiness of those institutions, and the Company has not experienced any losses on such deposits.
One customer accounted for 14% of total revenue and a second customer representing 11% for year ended December 31, 2013. No other customers account for more than 10% of revenue. During the year ended December 31, 2012, the Company had one customer representing 44% of revenue. This customer fully paid for a license from the Company of certain technology. In addition, the Company had one customer representing 13% of its 2012 revenue.
F-13
Table of Contents
As of December 31, 2013, the Company had one customer representing 54% of accounts receivable and a second customer representing 17% of accounts receivable. No other customer accounted for more than 10% of accounts receivable. As of December 31, 2012, the Company had one customer representing 23% of accounts receivable, a second customer representing 20% of accounts receivable, and three other customers representing more than 10% of accounts receivable each.
Shipping and Handling — Shipping and handling costs for wind turbine products are included in cost of product revenues.
Net Loss per Share — The Company determines basic loss per share by dividing net loss attributable to common shareholders by the weighted average common shares outstanding during the period.
Diluted loss per share is determined by dividing loss attributable to common shareholders by diluted weighted average shares outstanding during the period. Diluted weighted average shares reflect the dilutive effect, if any, of potential common shares. To the extent their effect is dilutive, employee equity awards and warrants, based on the treasury stock method, are included in the calculation of diluted earnings per share. For the years ended December 31, 2013 and 2012, all potential common shares were anti-dilutive due to the net loss and were excluded from the diluted net loss per share calculations.
The calculations of basic and diluted net loss per share are as follows:
| 2013 | 2012 | |||||||
| Basic earnings per share calculation |
||||||||
| Numerator |
||||||||
| Net loss |
$ | (14,128 | ) | $ | (6,214 | ) | ||
| Series A preferred stock dividends |
(1,810 | ) | (2,823 | ) | ||||
| Series B preferred stock dividends |
(1,556 | ) | (2,822 | ) | ||||
| Series C preferred stock dividends |
(321 | ) | (529 | ) | ||||
|
|
|
|
|
|||||
| Net loss attributable to common shareholders |
$ | (17,815 | ) | $ | (12,388 | ) | ||
|
|
|
|
|
|||||
| Denominator |
||||||||
| Weighted average common shares outstanding — Basic and diluted |
3,872,895 | 15,072 | ||||||
| Net loss per share — Basic and diluted |
$ | (4.60 | ) | $ | (821.92 | ) | ||
|
|
|
|
|
|||||
The following potentially dilutive securities were excluded from the calculation of dilutive weighted average shares outstanding because they were considered anti-dilutive. Preferred shares converted to common stock in the ratio of 1 share of common stock for every 11.609 shares of preferred stock (in thousands):
| 2013 | 2012 | |||||||
| Convertible preferred stock — Series A |
— | 624 | ||||||
| Convertible preferred stock — Series B |
— | 520 | ||||||
| Convertible preferred stock — Series C |
— | 93 | ||||||
| Series C warrants |
— | 351 | ||||||
| Common stock options outstanding |
1,668 | 7 | ||||||
|
|
|
|
|
|||||
| Total potentially dilutive securities |
1,668 | 1,595 | ||||||
|
|
|
|
|
|||||
Recent Accounting Pronouncements — The Company has reviewed all recent accounting pronouncements and does not expect the adoption of these standards to have a material impact on the consolidated financial statements. In February 2013, the Financial Accounting Standards Board (“FASB”) issued Accounting Standards Update (“ASU”) No. 2013-02 “Reporting of Amounts Reclassified Out of Accumulated Other Comprehensive Income.” ASU No. 2013-02 requires an entity to disaggregate the total change of each component of other comprehensive income either on the face of the income statement or as a separate disclosure in the notes. The new guidance became effective for reporting periods beginning after
F-14
Table of Contents
December 15, 2012 and is applied prospectively. The Company adopted this guidance as of December 31, 2013, and the adoption did not have any impact on its financial position, results of operations or cash flows.
In July 2013, the FASB issued a new accounting standard update on the financial statement presentation of unrecognized tax benefits. The new guidance provides that a liability related to an unrecognized tax benefit would be presented as a reduction of a deferred tax asset for a net operating loss carryforward, a similar tax loss or a tax credit carryforward if such settlement is required or expected in the event the uncertain tax position is disallowed. The new guidance becomes effective for the Company on January 1, 2014 and it will be applied prospectively to unrecognized tax benefits that exist at the effective date with retrospective application permitted. The Company believes the adoption of this new guidance will not have a material impact on it is consolidated financial statements.
| 3. | FAIR VALUE MEASUREMENT |
Financial Instruments — The Company’s financial instruments consist primarily of cash, accounts receivable, accounts payable and debt. The carrying amounts of cash, accounts receivable, accounts payable, and accruals as of December 31, 2013 and 2012, approximate fair value due to their short-term nature and is classified within Level 1 of the valuation hierarchy.
Debt and Senior Secured Convertible Notes — The carrying values of the Company’s non-convertible debt approximate fair value. This is explained by: the market value interest rates on such debt; the relatively low outstanding debt balances; and the fact that the total debt is due and payable at various times but in no situation later than October 2015. The fair value of the Company’s Senior Secured Convertible Notes was calculated via a Probability Weighted Expected Return Method (PWERM) which utilized the Company’s current overall valuation. The PWERM (level 3) applied a range of probabilities to a set of possible outcomes and attributed a value applicable to the Senior Secured Convertible Notes and to the common stock (the only other material equity interest in the Company at that time) in the event of each outcome. The Company determined that the PWERM was the most reliable approach given the complexity of the terms of the Senior Secured Convertible Notes, which could participate in any distribution as a holder of a liquidation preference or an equity participant, depending on the circumstances. The probabilities and weightings used in the analysis were based on management’s views of the opportunities available to the Company at that time for raising capital required to meet its plans, as well as a review of the outcomes to the Senior Secured Convertible Notes and common stock that would result from the selected scenarios. The PWERM was readily applicable to scenarios that resulted in immediate returns to the equity owners, so for those scenarios that would result in a continuing illiquid interest in the common stock, the option price method (or OPM) was employed. This combination of the OPM with the PWERM is sometimes referred to as a hybrid valuation method. The OPM treated the common stock interest as a “call option” on the Company’s overall enterprise value, determining the residual value to the common stock in the event that the Company was successful enough to satisfy the obligations due on the senior securities — in this case the holders of the Company’s Senior Secured Convertible Notes.
| Fair Value | Carrying Value | |||||||
| At December 31, 2013 |
||||||||
| Senior Secured Convertible Notes — Mature in less than 1 Year |
$ | 17,712 | $ | 12,107 | ||||
| Current maturities of long-term debt |
141 | 141 | ||||||
| Long-term debt |
300 | 300 | ||||||
|
|
|
|
|
|||||
| Total |
$ | 18,153 | $ | 12,548 | ||||
|
|
|
|
|
|||||
| At December 31, 2012 |
||||||||
| Current maturities of long-term debt |
$ | 100 | $ | 100 | ||||
| Long-term debt |
346 | 346 | ||||||
|
|
|
|
|
|||||
| Total |
$ | 446 | $ | 446 | ||||
|
|
|
|
|
|||||
F-15
Table of Contents
The Company measures fair value using the framework specified in U.S. GAAP. This framework emphasizes that fair value is a market-based measurement, not an equity-specific measurement, and establishes a fair value hierarchy that distinguishes between assumptions based on market data obtained from independent sources and those based on an entity’s own assumptions. The hierarchy prioritizes the inputs fair value measurement into three levels:
Level 1 — Measurements utilizing unadjusted quoted prices in active markets that the entity has the ability to access for identical assets or liabilities.
Level 2 — Measurements that include quoted prices for similar assets and liabilities in active markets, quoted prices for identical or similar assets or liabilities in markets that are not active, and other observable inputs, such as interest rates and yield curves that are observable at commonly quoted intervals.
Level 3 — Measurements using unobservable inputs for assets or liabilities for which little or no market information exists, and are based on the best information available and might include the entity’s own data.
In some valuations, the inputs used may fall into different levels of the hierarchy. In these cases, the financial instrument’s level within the fair value hierarchy is based on the lowest level of input that is significant to the fair value measurement.
The Company measures its cash equivalents and short-term investments, when held, at fair value and they are classified within Level 1 of the fair value hierarchy. The classification has been determined based on the manner in which the Company values its cash equivalents and short-term investments, primarily using quoted market prices.
The Company measures the value of its liability-classified warrants based upon the Black-Scholes option pricing model, and as such they are classified within Level 3 of the fair value hierarchy. Assets and liabilities measured at fair value on a recurring basis as of December 31, 2013 and 2012, consisted of the following types of instruments:
| Fair Value Measurements Using | ||||||||||||||||
| Total Carrying Value |
Quoted Prices in Active Markets for Identical Assets (Level 1) |
Significant Other Observable Inputs (Level 2) |
Significant Unobservable Inputs (Level 3) |
|||||||||||||
| At December 31, 2013 |
||||||||||||||||
| Liability classified warrants |
$ | — | $ | — | $ | — | $ | — | ||||||||
|
|
|
|
|
|
|
|
|
|||||||||
| $ | — | $ | — | $ | — | $ | — | |||||||||
|
|
|
|
|
|
|
|
|
|||||||||
| At December 31, 2012 |
||||||||||||||||
| Liability classified warrants |
$ | 3,268 | $ | — | $ | — | $ | 3,268 | ||||||||
|
|
|
|
|
|
|
|
|
|||||||||
| $ | 3,268 | $ | — | $ | — | $ | 3,268 | |||||||||
|
|
|
|
|
|
|
|
|
|||||||||
A reconciliation of changes in fair value for the Company’s liability-classified warrants measured at fair value using inputs classified as Level 3 in the fair value hierarchy for the years ended December 31, 2013 and 2012 is as follows:
| Balance as of January 1, 2012 |
$ | 7,813 | ||
| Decrease in fair value |
(4,545 | ) | ||
|
|
|
|||
| Balance as of December 31, 2012 |
3,268 | |||
| Expired warrants |
(775 | ) | ||
| Increase in fair value |
602 | |||
| Warrants exercised |
(3,095 | ) | ||
|
|
|
|||
| Balance as of December 31, 2013 |
$ | — | ||
|
|
|
F-16
Table of Contents
Nonrecurring Fair Value Measurements — The Company holds certain assets and liabilities that are measured at fair value on a nonrecurring basis in periods subsequent to initial recognition.
During 2012, the Company recorded $1,451 of impairment charges (see Note 6) to adjust certain long-lived assets to their estimated fair values. This adjustment falls within Level 3 of the fair value hierarchy, due to the use of significant unobservable inputs to determine fair value. The fair value measurements were calculated using unobservable inputs, primarily using the income approach, specifically the discounted cash flow method. The amount and timing of future cash flows within the Company’s analysis was based on its most recent operational budgets, long range strategic plans, and other estimates. These future cash flows are discounted using a weighted average cost of capital derived from adding company specific premiums for risk, volatility, and size to the risk free rate (yield on 10-year Treasury bond as of the measurement date). The cost of capital is weighted according to a target capital structure.
Effective December 12, 2013, the Barre, VT facility became an asset held for sale. Based upon the marketing of the facility as well as the indication of value from the currently interested potential buyer, the Company believes that the current fair value of the facility is $1,300. This value was lower than the carrying value at December 12, 2013 of $1,973 and, therefore, the Company calculated an asset held for sale loss by taking the difference between the sale price and the carrying value of the building along with the estimated direct costs of a sale transaction which resulted in a loss of $768. This adjustment falls within Level 3 of the fair value hierarchy, due to the use of significant unobservable inputs to determine fair value.
| 4. | INVENTORIES |
Inventories as of December 31, 2013 and 2012 consist of:
| December 31, 2013 |
December 31, 2012 |
|||||||
| Raw materials |
$ | 2,511 | $ | 2,662 | ||||
| Work in process |
1,124 | 1,228 | ||||||
| Finished goods |
8,610 | 3,822 | ||||||
| Allowance for obsolescence |
(563 | ) | (1,454 | ) | ||||
|
|
|
|
|
|||||
| Total inventory — net |
$ | 11,682 | $ | 6,258 | ||||
|
|
|
|
|
|||||
For the year ended December 31, 2013 and 2012, the Company recorded an inventory write-down of approximately $22 and $215 respectively, based on evaluating its ending inventory on hand for excess quantities and obsolescence.
The decrease in allowance for obsolescence for the year ended December 31, 2013 was primarily attributable to the sale of inventory that was fully reserved for in 2012.
| 5. | RESTRUCTURING |
In April 2012, the Company committed to a restructuring plan for its utility-class wind turbine business, changing the nature of its operations from being primarily a designer and developer of utility-class wind turbines to a provider of licensing and co-development for wind applications and engineering services for other applications. These actions resulted in the reduction of approximately 40% of the Company’s total headcount and the closure of a manufacturing facility. The restructured business continued to operate in the Utility Scale legal entity through December 31, 2013, after such date it will operate within Northern with the merger of those two subsidiaries effective on such date. In association with this restructuring, for the year ended December 31, 2013 and 2012 the Company recorded restructuring charges and fixed asset write-offs in the aggregate amount of $70 and $2,145 respectively, as detailed in the table below. Workforce-related activity includes stock compensation charges for certain modifications made to executive option grants as part of the restructuring. These options are accounted for as liability awards and marked to market though
F-17
Table of Contents
the income statement for subsequent changes in fair value. The Company will revalue the awards at each reporting period until such time as the awards expire or are no longer liability awards in nature.
| Activity for the year ended | ||||||||||||||||
| Balance December 31, 2012 |
Expense | Utilization | Balance December 31, 2013 |
|||||||||||||
| Workforce — related |
$ | 198 | $ | 70 | $ | (22 | ) | $ | 246 | |||||||
|
|
|
|
|
|
|
|
|
|||||||||
| $ | 198 | $ | 70 | $ | (22 | ) | $ | 246 | ||||||||
|
|
|
|
|
|
|
|
|
|||||||||
| Balance December 31, 2011 |
Expense | Utilization | Balance December 31, 2012 |
|||||||||||||
| Facilities and other |
$ | — | $ | 1,051 | $ | (1,051 | ) | $ | — | |||||||
| Workforce — related |
— | 1,094 | (896 | ) | 198 | |||||||||||
|
|
|
|
|
|
|
|
|
|||||||||
| $ | — | $ | 2,145 | $ | (1,947 | ) | $ | 198 | ||||||||
|
|
|
|
|
|
|
|
|
|||||||||
| 6. | IMPAIRMENT OF CERTAIN LONG-LIVED ASSETS |
For the years ended December 31, 2013 and 2012, the Company reviewed its long-lived assets for impairment. In accordance with applicable guidance the Company reviews the carrying value of asset groups that represent the lowest level for which identifiable cash flows are largely independent of the cash flows of other groups of assets and liabilities. The Company determined that its Product Sales and Services, Technology Licensing and Technology Development operating segments are the lowest level for which independent cash flows are available in management’s planning and long-range forecasting.
The factors considered by management in performing this impairment assessment included current operating results, trends and prospects, as well as the effects of obsolescence, demand, competition, and other economic factors. The Company determined that no impairment indicators of intangible assets for the year ended December 31, 2013. After considering the impact of delays establishing feed-in-tariff rates in overseas distributed-scale markets on order growth, future cash flow trends and cost of capital in the latter part of 2012, the Company concluded that developed technology and NW 100B intellectual property intangible assets were impaired and a resulting $1,451 charge to the statements of operations and comprehensive loss was recorded. The impairment analysis supports current carrying values for fixed assets committed to the all units as they have a longer economic life than the intangible assets. Certain intangible assets and other long-lived assets which are shared between the reporting units were reviewed for impairment in 2012 and the Company concluded that no impairment existed (see Note 8).
| 7. | PROPERTY, PLANT AND EQUIPMENT |
Property, plant and equipment at December 31, 2013 and 2012 consist of:
| 2013 | 2012 | |||||||
| Lease improvements |
$ | 30 | $ | 30 | ||||
| Machinery and equipment |
1,710 | 1,701 | ||||||
| Patterns and tooling |
880 | 814 | ||||||
| Office furniture and equipment |
424 | 424 | ||||||
| Information technology equipment and software |
1,149 | 1,117 | ||||||
| Field service spare parts |
121 | 102 | ||||||
|
|
|
|
|
|||||
| 4,314 | 4,188 | |||||||
| Less accumulated depreciation |
(2,900 | ) | (2,288 | ) | ||||
|
|
|
|
|
|||||
| Total property, plant and equipment |
$ | 1,414 | $ | 1,900 | ||||
|
|
|
|
|
|||||
F-18
Table of Contents
Depreciation expense was $798 and $1,263 for 2013 and 2012, respectively.
In 2013 the Company removed an installation of a prototype unit of its distributed-class turbine, refurbished such unit and sold it resulting in a reduction to property, plant and equipment net of accumulated depreciation of $179. In 2012, the Company disposed of $44 of fixed assets, net of accumulated depreciation. The disposal was primarily in Information Technology hardware and software and machinery and equipment. As described in Note 5, the Company’s restructuring of its utility-class wind business in 2012 resulted in a $983 reduction of patterns and tooling, as well as reductions of $4 and $3 in machinery and equipment and leasehold improvements, respectively, all net of accumulated depreciation.
On December 12, 2013 the board of directors of the Company approved a plan to sell its corporate headquarters and production facility located at 23 Pitman Road, Barre, Vermont. The Company intends to relocate to other more suitable production and technology space within the state of Vermont. The Company marketed such facility through a real estate broker which initially found three potential purchasers. As of the date of the issuance of these financial statements one interested unaffiliated party has progressed in seeking to purchase the facility (see Note 18). The Company believes that effective December 12, 2013, the facility became an asset held for sale based upon the decision of the Company’s board of directors at such time, as well as meeting the other criteria in ASC 360-10-45-8, Impairment and Disposal of Long-Lived Assets — Other Presentation Matters — Long-Lived Assets Classified as Held for Sale. Therefore the Company
reclassified the land, building, and building improvements as well as associated accumulated depreciation from property, plant and equipment to assets held for sale as of December 31, 2013 and 2012. Based upon the marketing of the facility as well as the indication of value from the currently interested potential buyer, the Company believes that the current fair value of the facility is $1,300. This value was lower than the carrying value at December 12, 2013 of $1,982 and, therefore, the Company calculated an asset held for sale loss by taking the difference between the sale price and the carrying value of the building along with the estimated direct costs of a sale transaction which resulted in a loss of $768.
| 8. | INTANGIBLE ASSETS |
Intangible assets consist of:
| December 31, 2013 | ||||||||||||||||||||
| Weighted Average Remaining Amortization Period |
Net Carrying Amount Beginning of Year |
Amortization Expenses |
Impairment Charge |
Net Carrying Amount End of Year |
||||||||||||||||
| Core technology |
2.7 years | $ | 634 | $ | (174 | ) | $ | — | $ | 460 | ||||||||||
| Trade name |
3.7 years | 62 | (13 | ) | — | 49 | ||||||||||||||
|
|
|
|
|
|
|
|
|
|||||||||||||
| $ | 696 | $ | (187 | ) | $ | — | $ | 509 | ||||||||||||
|
|
|
|
|
|
|
|
|
|||||||||||||
| December 31, 2012 | ||||||||||||||||||||
| Weighted Average Remaining Amortization Period |
Net Carrying Amount Beginning of Year |
Amortization Expenses |
Impairment Charge |
Net Carrying Amount End of Year |
||||||||||||||||
| Developed technology |
3.7 years | $ | 1,710 | $ | (274 | ) | $ | (1,436 | ) | $ | — | |||||||||
| Core technology |
3.7 years | 808 | (174 | ) | — | 634 | ||||||||||||||
| Trade name |
4.7 years | 75 | (13 | ) | — | 62 | ||||||||||||||
| NW 100B intellectual property |
3.7 years | 17 | (2 | ) | (15 | ) | — | |||||||||||||
|
|
|
|
|
|
|
|
|
|||||||||||||
| $ | 2,610 | $ | (463 | ) | $ | (1,451 | ) | $ | 696 | |||||||||||
|
|
|
|
|
|
|
|
|
|||||||||||||
All of the Company’s intangible assets, with the exception of the NW100B intellectual property, originated from the Acquisition.
F-19
Table of Contents
The Company recorded a $1,451 impairment charge in 2012 to reflect the fair value of the intangible assets (see Note 6).
Accumulated amortization as of December 31, 2013 and 2012 totaled $558 and $372, respectively.
The expected aggregate future amortization expense is as follows.
| Years | Amortization | |||
| 2014 |
$ | 186 | ||
| 2015 |
186 | |||
| 2016 |
128 | |||
| 2017 |
9 | |||
|
|
|
|||
| $ | 509 | |||
|
|
|
|||
| 9. | DEBT AND SENIOR SECURED CONVERTIBLE NOTES |
Debt at December 31, 2013 and 2012 consists of:
| 2013 | 2012 | |||||||
| VEDA Barre, Vermont facility mortgage |
$ | 346 | $ | 390 | ||||
| ICC insurance premium loan |
95 | 50 | ||||||
| Capital lease obligations |
— | 6 | ||||||
|
|
|
|
|
|||||
| Total debt |
441 | 446 | ||||||
| Less current portion |
(141 | ) | (100 | ) | ||||
|
|
|
|
|
|||||
| Long-term debt |
$ | 300 | $ | 346 | ||||
|
|
|
|
|
|||||
| Senior secured convertible notes, due June 30, 2014 |
$ | 12,107 | $ | — | ||||
|
|
|
|
|
|||||
The future principal maturities in the aggregate under these debt obligations, as noted in the table above and excluding the senior secured convertible notes, as of December 31, 2013 is as follows:
| Years | Maturities | |||
| 2014 |
$ | 141 | ||
| 2015 |
300 | |||
| Thereafter |
— | |||
|
|
|
|||
| $ | 441 | |||
|
|
|
|||
In connection with the acquisition of the wind turbine business, Northern assumed mortgage debt with the Vermont Economic Development Authority (VEDA), related to a manufacturing facility in Barre, Vermont. The terms of this mortgage, as amended, are described below.
The VEDA mortgage is a variable interest rate loan bearing interest of 3.75% as of December 31, 2013 and 2012 and matures October 6, 2015. As of December 31, 2013, the VEDA obligation required monthly payments of $5 and a final balloon payment in October 2015. The loan is collateralized by the Barre, Vermont property and if the Company successfully completes a sale of the facility as planned within the next twelve months, a portion of such proceeds will be used to pay off the mortgage. There are no early payment penalties on the mortgage.
During 2009, the Company acquired IT equipment through two capital lease obligations. The first agreement commenced in February 2009 and requires monthly payments of $2 through February 2012. The second agreement commenced in March 2009 and requires monthly payments of less than $1 through the end of February 2014. The outstanding balance as of December 31, 2013 was less than $1.
F-20
Table of Contents
In December 2011, Northern entered into a $2,500 foreign working capital revolving line of credit with Comerica Bank (“Comerica”) for its domestic activities, which is guaranteed by WPHI. The available borrowing base is limited to the amount of collateral available at the time the line is drawn. The line is secured by various assets of Northern, including physical assets and IP. The supported domestic borrowing base on December 31, 2012, was approximately $808. The line was not drawn upon in 2012, and it was renewed for 90 days upon expiration on November 30, 2012. Effective February 2013, the line was not renewed at the end of the 90-day extension.
Northern also entered into a $2,500 foreign working capital revolving line of credit with Comerica for its foreign activities, guaranteed by WPHI. The available borrowing base is limited to the amount of collateral available at the time the line is drawn. This line is secured by various assets of Northern, including physical assets and IP. The supported borrowing base for this facility on December 31, 2012, was approximately $2,500. This line was drawn upon in 2012 but fully repaid by December 31, 2012, and it was renewed for 90 days upon expiration on November 30, 2012.
In February 2013, Northern entered into a one year renewal agreement for its foreign working capital revolving line of credit with Comerica. The renewal permitted Northern to borrow up to $4,000, with the available borrowing base being limited to the amount of collateral available at the time the line is drawn.
As of October 23, 2013 the Company increased its foreign working capital revolving line of credit with Comerica by $2,000, and as such currently has access to a $6,000 to support exports of its distributed-class turbines. Effective with the merger of Utility Scale into Northern at December 31, 2013 the Company’s foreign working capital line of credit was renegotiated with Comerica to allow for the combined business operations to be included. The loan agreement with Comerica contains Adjusted EBITDA covenants based solely on Northern’s performance for the quarter ended December 31, 2013 and based upon the combined performance of the merged entities thereafter. At December 31, 2013, the Company had a net maximum supported borrowing base of $2,900. The foreign working capital revolving line of credit with Comerica matures on June 30, 2014.
The following summarizes the maximum Adjusted EBITDA loss which the Northern or the consolidated company can incur on a quarterly basis as applicable, under the amended loan agreement and be in compliance with this covenant:
| Fiscal Quarter | Maximum EBITDA Loss |
|||
| December 31, 2013 (Northern only) |
$ | (3,500 | ) | |
| March 31, 2014 (Consolidated Subsidiaries) |
(5,200 | ) | ||
The Company was in compliance with all covenants under this credit facility as of December 31, 2013.
The Company closed a $4,525 convertible note offering in April 2013, and then closed a further $2,000 offering in September 2013. The convertible notes bear interest at a rate of 6% per annum payable upon maturity or conversion to equity securities. The outstanding principal and accrued interest on these notes will automatically convert into equity securities issued by the Company in a subsequent “Qualified Financing” (defined as a future equity financing resulting in aggregate gross proceeds of at least $10,000 or any other future equity financing that is approved by the Company and holders of at least 60% of the aggregate principal amount of the convertible notes) at the same price at which the shares issued in the qualified financing are sold. In the event the notes are not converted, as outlined above, the principal balance along with any accrued interest becomes due and payable on June 30, 2014. The convertible notes are collateralized by a pledge of the capital stock of Northern and certain intellectual property of Northern. In the event of any dissolution, liquidation or winding up, as defined, of the Company, which includes a Deemed Liquidation Event (defined as any transaction in which the outstanding capital stock of the Company ceases to be a majority of the outstanding capital stock after the completion of the transaction or any sale, transfer, or other disposition of all or substantially all of the assets of the Company and its subsidiaries), the Company will pay each holder of convertible notes three times the principal amount outstanding under such holder’s convertible note and any accrued interest on such note shall be forgiven,
F-21
Table of Contents
unless holders of at least 60% of the aggregate principal amount of the convertible notes elect otherwise. The Company determined that the embedded equity-linked component does not contain a net settlement provision as defined by ASC 815-10-15-00 and therefore, does not meet the definition of a derivative under ASC 815-10-15-83. As a result, under the guidance from ASC 815-15-25-1, the Company is not required to separate the equity-linked component from the debt host. These convertible notes have the characteristics of conventional debt described in ASC 470-20 as follows: (1) the conversion feature is settled in shares; (2) there is an absence of a cash conversion feature; (3) the note holders cannot obtain shares at below market price; and (4) the issuer must deliver shares upon conversion. Therefore, the Company accounted for these notes as traditional debt recorded at face value upon issuance.
In the April 2013 offering of notes, the notes were only offered to existing shareholders. All shares of Series A preferred stock, Series B preferred stock and/or Series C preferred stock, held by shareholders which did not participate in the convertible note financing automatically converted into shares of the Company’s common stock. If a shareholder purchased some but not all of its pro rata share of the convertible note financing, then a percentage of shares of Series A preferred stock, Series B preferred stock and/or Series C preferred stock (divided evenly among all such series of preferred stock held by such shareholder) equal to the percentage of its pro rata share not purchased automatically converted into common stock.
The preferred shares were converted to common stock on a one-for-one share basis, and as such, the Company concluded that there was no beneficial conversion feature since the conversion was at the money. As a result, the Company applied the carrying amount of the preferred shares to convert the common stock at par value with any excess applied to additional paid in capital per ASC 470-20-40-4.
The outstanding warrants to purchase Series C-2 preferred stock, as described in Note 11 Warrant Liabilities, were amended pursuant to the April convertible note offering to provide that warrants held by shareholders who did not participate in the convertible note financing expired 30 days after the closing of the financing. To the extent that a shareholder purchased a portion but not all of its pro-rata share, the warrants representing that proportion of under participation expired 30 days after the closing of the financing.
In the September offering, the notes were also offered to existing shareholders. Investors in this offering also were issued an aggregate of approximately ten million shares of common stock. Upon the closing of this offering, the shares of the Company’s formerly outstanding Series C-1 preferred stock held by investors participating in this note financing were converted into additional notes at the rate of one dollar face amount of convertible note for every three dollars in liquidation preference of Series C-1 Series preferred stock (Series A, B and C-2 preferred stock were not converted into notes). This non-cash conversion increased total convertible notes outstanding by an additional $5,250 with excess face value of C-1 series shares applied to additional paid in capital. Although the fair value of the Series C-1 preferred stock exceeded the face value of the resulting convertible notes at time of conversion, the Company elected to record the resulting notes at face value rather than fair value because the transaction was with a related party. Relevant disclosures are included in Note 16, Related-Party Transactions. The convertible notes balance at December 31, 2013 is $12,107, which includes accrued interest expense of $331.
| 10. | ACCRUED EXPENSES |
Accrued expenses consist of:
| 2013 | 2012 | |||||||
| Accrued warranties |
$ | 545 | $ | 571 | ||||
| Other accrued expenses |
1,613 | 909 | ||||||
|
|
|
|
|
|||||
| Total accrued expenses |
$ | 2,158 | $ | 1,480 | ||||
|
|
|
|
|
|||||
F-22
Table of Contents
Changes in the Company’s product warranty accrual during 2013 and 2012 consisted of the following:
| 2013 | 2012 | |||||||
| Beginning balance |
$ | 571 | $ | 1,302 | ||||
| Provisions, net of reversals |
222 | (331 | ) | |||||
| Settlements |
(248 | ) | (400 | ) | ||||
|
|
|
|
|
|||||
| Ending balance |
$ | 545 | $ | 571 | ||||
|
|
|
|
|
|||||
| 11. | WARRANT LIABILITIES |
In August 2011, the Company issued 1,608,322 shares of Series C-1 preferred stock, at a face amount of $6.30 per share, and Warrants to purchase 6,433,288 shares of Series C-2 preferred stock (the “Warrants”) for aggregate cash consideration of $10,016, net of issuance costs of $115. The Warrants represent a free-standing financial instrument that do not qualify for equity classification pursuant to ASC 815-40 and are therefore presented as a liability which is revalued periodically, and as of the reporting dates of these financial statements. As described in Note 12, during the third quarter of 2013, all remaining outstanding warrants converted to common stock.
In calculating the value of the Warrants, when outstanding, with the Black-Scholes model, the Company assumed (i) a risk free equal to the rate of 10 Year Treasury Notes prevailing at year end, (ii) a volatility of 85%, the average of a set of guideline companies determine to be representative of the Company at that time, and (iii) a time to maturity between 4-5 years, considering that the full 7-year term from date of issuance was subject to accelerated exercise.
As of December 31, 2012, the Company revalued the Warrants based upon the Black-Scholes option pricing model and concluded that the value had declined to $3,268. The reduction in value of the Warrants of $4,545 was recorded within the Company’s consolidated statements of operations and comprehensive loss.
The Company closed a convertible note offering to existing shareholders in March and April 2013, as described in Note 9, Debt and Senior Secured Convertible Notes. The outstanding Warrants to purchase Series C-2 preferred stock were amended pursuant to the convertible note offering to provide that Warrants held by shareholders which did not participate in the convertible note financing expired 30 days after the closing of the financing. To the extent that a shareholder purchased a portion but not all of its pro-rata share, the Warrants representing that proportion of under participation expired 30 days after the closing of the financing. Certain shareholders did not participate resulting in 1,432,978 Warrants expiring in April and May 2013. Such Warrants were revalued immediately prior to their expiration resulting in no change in fair value. At their expiration, the fair value of such Warrants was recorded in the Company’s consolidated statements of operations and comprehensive loss as a $775 increase in other income.
During the third quarter of 2013, the remaining 4,911,686 warrants outstanding converted to Series C-2 Preferred Stock. As such, as of December 31, 2013, the Company has no warrants outstanding.
The Company measured the value of its liability-classified warrants based upon the Black-Scholes option pricing model. The following is a summary of the key assumptions used to calculate the fair value of the warrants, along with the resulting fair value in such periods that the warrants were outstanding.
| Balance as of January 1, 2012 |
$ | 7,813 | ||
| Decrease in fair value |
(4,545 | ) | ||
|
|
|
|||
| Balance as of December 31, 2012 |
3,268 | |||
| Expired warrants |
(775 | ) | ||
| Increase in fair value |
602 | |||
| Warrants exercised |
(3,095 | ) | ||
|
|
|
|||
| Balance as of December 31, 2013 |
$ | — | ||
|
|
|
F-23
Table of Contents
| December 31, 2012 |
Fair Value at Conversion Date |
|||||||
| Risk-free interest rate |
1.78 | % | 2.64 | % | ||||
| Expected volatility |
84.5 | % | 84.5 | % | ||||
| Term (years) |
4 | 3.25 | ||||||
| Fair value |
$ | 3,268 | $ | 3,095 | ||||
| 12. | CAPITAL STRUCTURE |
Stock Split — On August 28, 2013, the board of directors approved the conversion of all outstanding Series A, B and C-2 preferred stock to common stock and a subsequent 1 for 11.6087 reverse split of the Company’s outstanding common stock. The Board also approved recommending that the Company’s shareholders approve amendments to the Company’s Certificate of Incorporation to effect such activities. The Company’s shareholders approved these amendments by written consent dated September 10, 2013. The split shares were effective on September 16, 2013. Relevant financial data has been retroactively adjusted in these financial statements to reflect the 1 for 11.6087 reverse stock-split.
Recapitalization — As presented in Note 9, Debt and Senior Secured Convertible Notes, the Company closed two offerings of convertible notes in the nine months ended September 30, 2013. Investors in the September offering also were issued an aggregate of approximately 10 million shares of common stock. Upon the closing of this offering, the shares of the Company’s formerly outstanding Series C-1 preferred stock held by investors participating in this note financing were converted into additional notes at the rate of one dollar face amount of convertible note for every three dollars in liquidation preference of Series C-1 preferred stock. This non-cash conversion increased total convertible notes outstanding by an additional $5,250. The convertible notes bear interest at a rate of 6% per annum payable upon maturity at June 30, 2014 or conversion to equity securities. These notes will automatically convert into equity securities issued by the Company in a subsequent “Qualified Financing” (defined as a future equity financing resulting in aggregate gross proceeds of at least $10,000 or any other future equity financing that is approved by the Company and holders of at least 60% of the aggregate principal amount of the convertible notes). Simultaneously with the convertible note offering described above, all outstanding shares of Series A, Series B and Series C-2 preferred stock, together with all accumulated dividends thereon, were converted into common stock based on an enterprise value of $50,000.
The Company currently is authorized to issue up to 6,000,000 shares of preferred stock and 44,000,000 shares of common stock.
Preferred Stock — At December 31, 2013, the Company had 6,000,000 authorized shares of Preferred Stock, of which 3,000,000 were designated as Series X-1 Preferred Stock (“Series X-1 preferred stock”), and 3,000,000 were designated as Series X-2 Preferred Stock (“Series X-2 preferred stock” and together with the Series X-1 preferred stock, the “Series X preferred stock”).
Series A Preferred Stock — The Company issued 3,540,000 shares of Series A preferred stock and 14,683 shares of common stock to the founding investors in August 2008 for cash consideration of $17,700.
The fair value of the common shares issued to the founding investors was $0.01 per common share as determined by the Company’s board of directors, issued in proportion to preferred stock ownership. In September 2008, the Company issued 7,750,200 shares of Series A preferred stock, at a face amount of $5.00 per share, for aggregate consideration of $36,759 net of issuance costs of $1,992.
The Company engaged a related party as its exclusive placement agent for the private placement equity offering subsequent to the closing of the wind turbine acquisition. Of the total equity raised by the Company in 2008, $13,001 is attributable to the purchase of 2,600,200 shares of Series A preferred stock by the placement agent on its own behalf and on behalf of its affiliates, officers, and investors. In September 2008, the Company paid the placement agent fees related to the offering totaling $1,938. Two of the placement agent’s managing directors were elected to the Company’s board of directors in September 2008, one of whom currently serves as chairman of the Company’s board of directors.
F-24
Table of Contents
Series B Preferred Stock — The Company issued 7,286,232 shares of Series B preferred stock in October and November 2009, at a face amount of $6.00 per share, for aggregate cash consideration of $43,532, net of issuance costs of $185. The Company issued an additional 2,121,707 shares of Series B preferred stock in December 2010 for aggregate cash consideration of $12,730 under the same terms as the 2009 offering.
Series C Preferred Stock — In August 2011, the Company sold units consisting of one share of Series C-1 preferred stock and a warrant to purchase four shares of Series C-2 preferred stock at an exercise price of $0.50 per share. The price per unit was $6.30. The Company issued 1,608,322 shares of Series C-1 preferred stock, at a face amount of $6.30 per share, and warrants to purchase 6,433,288 shares of Series C-2 preferred stock (the “Warrants”) for aggregate cash consideration of $10,016, net of issuance costs of $115.
It was determined by the Company that the fair value of the Series C offering was $35,145, of which $21,994 was associated with the Series C-1 preferred stock and $13,151 was associated with the Warrants. As all current investors had the opportunity to participate in the offering of the Series C, the Company determined that the $25,014 difference between the fair value of the Series C ($35,145) and the capital raised ($10,131), was appropriately recorded as a stock dividend. The stock dividend reflects the value lost in their historical holdings and was recorded as an increase in the Company’s accumulated deficit.
Series X Preferred Stock — The Series X-1 preferred stock was reserved for holders of options to purchase common stock of Northern, restricted stock units to acquire common stock of Northern, or common stock of Northern issued under Northern’s 2011 Stock Option and Grant Plan. The Series X-2 preferred stock was reserved for holders of options to purchase common stock of Utility Scale, restricted stock units to acquire common stock of Utility Scale, or common stock of Utility Scale issued under Utility Scale’s 2011 Stock Option and Grant Plan. As a result of the termination of these stock option plans in connection with the option exchange offer described in Note 13, the Company will not be issuing any shares of Series X-1 or X-2 preferred stock.
Dividend restrictions — The Company’s line of credit prohibits the payment of any dividends without obtaining its lenders’ prior written consent.
Common Stock — The Company has authorized 44,000,000 shares of common stock, par value $0.01 per share, of which 12,840,187 are outstanding as of December 31, 2013.
At December 31, 2013, the Company had reserved 2,568,089 shares of common stock for both future exercise of outstanding stock options and shares available for future option grants.
Investors’ Rights Agreement — In August 2013, certain of the Company’s investors entered into a Fourth Amended and Restated Investors’ Rights Agreement (the “Investors’ Rights Agreement”) providing such investors (“Holders”) with certain registration and other investment rights at any time prior to the termination of the agreement. Pursuant to the agreement, the Company has granted a right of first offer to Holders obligating the Company, each time the Company proposes to offer any shares of or securities convertible into any class of its capital stock, to first offer such securities to Holders. Certain issuances, including securities to be issued pursuant to Board approved option plans or in a Qualified IPO (defined as a firm commitment public underwriting with gross proceeds of not less than $40,000 at a Company valuation of not less than $175,000, reduced by the aggregate amount of any Extraordinary Dividend but in no event less than $100,000) are exempt from the right of first offer. The Investors’ Rights Agreement also provides, subject to certain limitations, up to three demand registration rights to investors, beginning six months after the effective date of a Qualified IPO, pursuant to which Holders may request that the Company register for public resale not less than $15,000 of common stock. The Investors’ Rights Agreement also provides Holders the right, at such times as the Company is eligible to file on Form S-3, the right to request other public registrations. The Investors Rights Agreement also provides Holders with certain inspection rights and the right to receive financial statements of the Company. The rights of first offer, inspection and to receive financial statements terminate as to each Holder immediately prior to the consummation of a Qualified IPO.
Voting Agreement — Investors in the Company are party to a Fourth Amended and Restated Voting Agreement (the “Voting Agreement”) providing certain board representation rights, a drag-along right, as
F-25
Table of Contents
well as a right of first refusal and co-sale right in the event shareholders propose to transfer Company stock while the Voting Agreement is in effect. Pursuant to the Voting Agreement, the Company’s board of directors is currently set at eight members, and investors have agreed to cause their votes to be cast such that the founding investors (those investors funding the acquisition of the wind turbine business of DESC) shall be entitled to designate two directors for so long as such investors hold at least 10% of the Company’s common stock; two directors are to be designated by Allen & Company LLC for so long as such investor holds at least 10% of the Company’s common stock; one director is to be designated by RockPort Capital Partners III, L.P. for so long as RockPort Capital Partners III, L.P. or their affiliates own at least 10% of the Company’s common stock; the Company’s chief executive officer is to serve as a director; and two individuals acceptable to the majority of the other members of the board is to serve as independent directors. The Voting Agreement also provides a drag-along right pursuant to which if 60% or more of the Company’s shareholders approve of a sale of the Company (either pursuant to a transaction in which an entity or group of related entities acquires 50% or more of the stock of the Company or in the case of a deemed liquidation event as defined in the Company’s restated Certificate of Incorporation), the shareholders of the Company agree to vote in favor of such transaction if shareholder approval is required, and to sell their stock in the same proportion as the selling shareholders triggering the drag-along right have agreed to sell their shares. The Voting Agreement also places restrictions on the ability of the Company’s shareholders to sell their shares at any point prior to the consummation of a firm commitment underwritten public offering of the Common Stock, by requiring any shareholder who proposes to sell shares to provide first to the Company and then to the Company’s remaining shareholders (those not triggering the proposed transfer) written notice specifying the proposed transferee, the number of shares proposed to be transferred, and the proposed sale price. The Company has the first right to purchase all or any portion of such shares proposed to be transferred and, in the event the Company shall not elect to purchase all such shares, the remaining shareholders shall have the right to purchase such shares proposed for transfer in an amount proportionate to such remaining shareholders’ interest in the Company. If neither the Company nor the remaining shareholders do not fully purchase such shares proposed for transfer, the remaining shareholders are provided a co-sale right pursuant to which they may elect to participate in the proposed transfer of stock in an amount proportionate to their interest in the Company.
Note 18, Subsequent Events, describes the status of subsequent capital financing events occurring after December 2013.
| 13. | STOCK BASED COMPENSATION AND EMPLOYEE BENEFIT PLANS |
2008 Equity Incentive Plan — In October 2008, the Company adopted the 2008 Equity Incentive Plan (the “2008 Plan”). The 2008 Plan provides for the grant of incentive stock options, non-statutory stock options, and other types of stock awards to employees, consultants, and directors of the Company. The 2008 Plan, as amended in 2010, has reserved for issuance upon grant or exercise of awards up to 55 adjusted shares of the Company’s common stock.
2011 Subsidiary Stock Option and Grant Plans — In August 2011, the Company’s two operating subsidiaries adopted new plans. As such, Northern adopted the Northern Power Systems, Inc. 2011 Stock Option and Grant Plan (the “Northern 2011 Plan”) and Utility Scale adopted the Northern Power Systems Utility Scale, Inc. 2011 Stock Option and Grant Plan (the “Utility Scale 2011 Plan,” and together with the Northern 2011 Plan, the “Subsidiary Plans”). The Subsidiary Plans provide for the grant of incentive stock options, non-statutory stock options, and other types of stock awards to employees, consultants, and directors of the Company. The Subsidiary Plans each reserve for issuance upon grant or exercise of awards up to 3,000,000 shares of such subsidiary’s common stock. In addition, 3,000,000 shares of each X-1 Series and X-2 Series of the Company’s preferred stock have been reserved, respectively, for issuance upon exercise of the respective Subsidiary Plans’ options in the event of certain potential liquidation events of the Company. Based upon the provisions of the Subsidiary Plans’ option exercises into the Company’s preferred stock, the Company has determined that these options should be accounted for as liability classified awards.
F-26
Table of Contents
2013 Stock Option and Grant Plan — In November 2013, the Company adopted the Wind Power Holdings, Inc. 2013 Stock Option and Grant Plan (“the 2013 WPHI Plan”). This plan provides for the grant of incentive stock options, non-statutory stock options, and other types of stock awards to employees, consultants and directors of the Company. 2,568,034 shares of WPHI common stock are authorized for issuance under the 2013 WPHI Plan. The Company reviewed the guidance at ASC 718 and has classified the grants as equity awards.
In connection with the adoption of the 2013 WPHI Plan, the board of directors and shareholders of Wind Power Holdings, Inc. authorized the termination of the Wind Power Holdings, Inc. 2008 Equity Incentive Plan, the Northern Power Systems, Inc. 2011 Stock Option and Grant Plan, and the Northern Power Systems Utility Scale, Inc. 2011 Stock Option and Grant Plan, to be effective upon completion of the exchange offer described above. Options which are outstanding under the Wind Power Holdings, Inc. 2008 Equity Incentive Plan will remain outstanding under the terms of the applicable option agreements and such plan, but no further grants will be made under such plan. Options which are outstanding under the Northern Power Systems, Inc. 2011 Stock Option and Grant Plan, and the Northern Power Systems Utility Scale, Inc. 2011 Stock Option and Grant Plan and not tendered for exchange by the holders thereof were automatically converted to options to purchase WPHI common stock under the 2013 WPHI Plan as part of the merger of Utility Scale into Northern and the recapitalization of Northern described above.
The exercise price for incentive and non-statutory stock options granted under any of the 2008 Plan, Northern 2011 Plan, Utility Scale 2011 Plan and 2013 WPHI plan shall not be less than the fair market value of the common stock at the time the stock option is granted; provided however, that in the case of an incentive stock option granted to an employee who on the grant date owns stock representing more than 10% of the voting power of all classes of stock of the Company or any subsidiary, the per share exercise price shall be no less than 110% of the fair market value per share on the grant date.
In September 2011, certain employees of Northern and Northern Power Systems AG accepted an offer from the Company to exchange options of 141,189 adjusted shares issued under the 2008 Plan (the “Exchanged Options”) for options to purchase an aggregate of 1,849,924 and 1,985,424 shares of common stock of Northern and Utility Scale, respectively, under the Subsidiary Plans (the “New Options”). The exercise price for the New Options was equal to the fair market value of the common stock of Northern or Utility Scale at the date of the closing of the exchange offer. The New Options were vested to the extent that the Exchanged Options were vested and will terminate on the same date as the Exchanged Options. In addition, the Boards of Directors of Northern and Utility Scale granted additional options under the Subsidiary Plans to certain employees of Northern and Northern Power Systems AG in order to incent and retain such employees. The exercise price for these additional options was equal to the fair market value of the common stock of Northern or Utility Scale at the date of the offer and will vest in accordance with the Subsidiary Plans’ standard vesting schedule.
The Company calculates the fair value of stock-based payment awards on the date of grant for equity awards and as of each reporting period for liability awards, along with, on a one-time basis, the date of the options exchange, each as estimated using the Black-Scholes option pricing model. The value of the portion of the award that is ultimately expected to vest is recognized as expense over the requisite service periods. Option pricing model input assumptions such as expected term, expected volatility, risk-free interest rate, dividend rate, and the fair value of the Company’s, or as applicable the Subsidiary’s, common stock impact the fair value estimate. Further, the forfeiture rate impacts the amount of aggregate compensation. These assumptions are subjective and generally require significant analysis and judgment to develop. The Company uses the simplified method for estimating expected term representing the midpoint between the vesting period and the contractual term. The Company estimates volatility based on the historical volatility of a peer group of publicly-traded companies. The risk-free interest rate is the implied yield currently available on U.S. treasury zero-coupon issues with a remaining term equal to the expected vesting term. Estimated forfeitures are adjusted over the requisite service period based on the extent to which actual forfeitures differ from estimated forfeitures.
F-27
Table of Contents
At December 31, 2013, both the Northern 2011 Plan and the Utility Scale 2011 Plan still existed, as did all options outstanding under those plans. Effective on January 1, 2014, all options to purchase Northern Power Systems, Inc. or Northern Power Systems Utility Scale, Inc. stock automatically converted to options to purchase WPHI common stock on a value-for-value basis. Upon the completion of the exchange offer on January 28, 2014, option holders who accepted the exchange received a lesser number of options than they would have received on the value-for-value basis, but at a lower exercise price. Option holders who did not accept the exchange retained the value-for-value options.
At December 31, 2013, the Company estimated a $598 liability for the fair value of the Subsidiary Plans’ outstanding options using the Black-Scholes option pricing model. The liability balance reflects the earned portion of the option awards vested and expected to vest. The Company recorded an increase in additional paid-in capital of $266 for the excess of expense over the change in fair value of the Exchange Options. Since the subsidiary options will all convert to options in the WPHI plan as described below and become equity classified awards the liability balance associated with such awards is presented as a current liability at December 31, 2013.
At December 31, 2012, the Company estimated the fair value of the Subsidiary Plans’ outstanding options using the Black-Scholes option pricing model and a resulting liability was recorded of $456, reflecting the earned portion of the awards vested and expected to vest. The Company recorded $1,774 of additional paid-in capital reflecting the decrease in the fair value associated with the Exchanged Options.
A summary of the stock option activity under the 2008 Plan is as follows:
| Shares | Weighted- Average Exercise Price |
Average (in Years) |
Aggregate Intrinsic Value |
|||||||||||||
| Outstanding — January 1, 2012 |
6,913 | $ | 81.43 | 2.00 years | $ | — | ||||||||||
| Granted |
— | — | ||||||||||||||
| Exercised |
— | — | ||||||||||||||
| Canceled |
(110 | ) | $ | 81.43 | ||||||||||||
| Exchanged |
— | — | ||||||||||||||
|
|
|
|||||||||||||||
| Outstanding — December 31, 2012 |
6,803 | $ | 81.43 | 0.95 years | $ | — | ||||||||||
| Granted |
— | |||||||||||||||
| Exercised |
— | |||||||||||||||
| Canceled |
(6,748 | ) | $ | 81.37 | ||||||||||||
| Exchanged |
— | |||||||||||||||
|
|
|
|||||||||||||||
| Outstanding — December 31, 2013 |
55 | $ | 89.50 | 2.90 years | $ | — | ||||||||||
|
|
|
|||||||||||||||
| Exercisable — December 31, 2013 |
55 | $ | 89.50 | 2.90 years | $ | — | ||||||||||
|
|
|
|||||||||||||||
The aggregate intrinsic value in the table above represents the difference between the estimated fair value of common stock and the exercise price of outstanding, in-the-money stock options. In all periods presented, the estimated fair value of common stock was less than the exercise price of the options.
F-28
Table of Contents
A summary of the stock option activity under the Northern 2011 Plan is as follows:
| Shares | Weighted- Exercise |
Average Remaining Weighted average Contractual Term (in Years) |
Aggregate Intrinsic Value |
|||||||||||||
| Outstanding — January 1, 2012 |
2,831,581 | $ | 1.45 | 5.70 years | $ | — | ||||||||||
| Granted |
43,500 | $ | 1.37 | |||||||||||||
| Exercised |
||||||||||||||||
| Canceled |
(684,985 | ) | $ | 1.45 | ||||||||||||
| Exchanged |
||||||||||||||||
|
|
|
|||||||||||||||
| Outstanding — December 31, 2012 |
2,190,096 | $ | 1.45 | 4.61 years | $ | — | ||||||||||
| Granted |
2,500 | $ | 0.54 | |||||||||||||
| Exercised |
||||||||||||||||
| Canceled |
(254,502 | ) | $ | 1.44 | ||||||||||||
| Exchanged |
||||||||||||||||
|
|
|
|||||||||||||||
| Outstanding — December 31, 2013 |
1,938,094 | $ | 1.45 | 3.49 years | $ | — | ||||||||||
|
|
|
|||||||||||||||
| Exercisable — December 31, 2013 |
1,832,339 | $ | 1.45 | 3.41 years | $ | — | ||||||||||
|
|
|
|||||||||||||||
| Shares vested and expected to vest December 31, 2013 |
1,932,614 | $ | 1.45 | 3.48 years | $ | — | ||||||||||
|
|
|
|||||||||||||||
The aggregate intrinsic value in the table above represents the difference between the estimated fair value of common stock and the exercise price of outstanding, in-the-money stock options. In all periods presented, the estimated fair value of common stock was less than the exercise price of the options.
The weighted average reporting-date fair value of options granted under the Northern 2011 Plan at December 31, 2013 was $0.61 per share. The weighted average reporting-date fair value of options granted under the Northern 2011 Plan at December 31, 2012 was $0.53 per share. At December 31, 2013, unrecognized stock compensation expense related to non-vested stock options is $39, which is expected to be recognized over the weighted average remaining vesting period of 0.75 years.
The Company estimated the grant-date fair values of stock options granted, along with the reporting-date fair value for options granted using the Black-Scholes option pricing model and the following assumptions, respectively:
| Reporting Date December 31, 2013 |
2013 Grant Dates |
Reporting Date December 31, 2012 |
2012 Grant Dates | |||||
| Risk free interest rate |
0.13% – 1.14% | 1.14% | 0.21% – 0.63% | 0.50% – 0.63% | ||||
| Expected dividend yield |
0% | 0% | 0% | 0% | ||||
| Expected life of options (in years) |
1.0 – 3.75 | 3.75 | 1.5 – 4.5 | 4.5 | ||||
| Expected volatility |
79% – 94% | 87% | 69% – 92% | 82% – 92% |
F-29
Table of Contents
A summary of the stock option activity under the Utility Scale 2011 Plan is as follows:
| Shares | Weighted- Exercise |
Average Remaining Weighted average Contractual Term (in Years) |
Aggregate Intrinsic Value |
|||||||||||||
| Outstanding — January 1, 2012 |
2,786,124 | $ | 1.98 | 5.64 years | $ | — | ||||||||||
| Granted |
— | |||||||||||||||
| Exercised |
(100 | ) | $ | 1.98 | ||||||||||||
| Canceled |
(458,866 | ) | $ | 1.98 | ||||||||||||
| Exchanged |
— | |||||||||||||||
|
|
|
|||||||||||||||
| Outstanding — December 31, 2012 |
2,327,158 | $ | 1.98 | 4.51 years | $ | — | ||||||||||
| Granted |
1,000 | $ | 0.70 | |||||||||||||
| Exercised |
— | |||||||||||||||
| Canceled |
(239,316 | ) | $ | 1.98 | ||||||||||||
| Exchanged |
— | |||||||||||||||
|
|
|
|||||||||||||||
| Outstanding — December 31, 2013 |
2,088,842 | $ | 1.98 | 3.43 years | $ | — | ||||||||||
|
|
|
|||||||||||||||
| Exercisable — December 31, 2013 |
1,990,895 | $ | 1.98 | 3.37 years | $ | — | ||||||||||
|
|
|
|||||||||||||||
| Shares vested and expected to vest December 31, 2013 |
2,084,114 | $ | 1.98 | 3.43 years | $ | — | ||||||||||
|
|
|
|||||||||||||||
The aggregate intrinsic value in the table above represents the difference between the estimated fair value of common stock and the exercise price of outstanding, in-the-money stock options. In all periods presented, the estimated fair value of common stock was less than the exercise price of the options.
The weighted average reporting-date fair value of options granted under the Utility Scale 2011 Plan at December 31, 2013 was $0.80 per share. The weighted average reporting-date fair value of options granted under the Utility Scale 2011 Plan at December 31, 2012 was $0.70 per share. At December 31, 2013, unrecognized stock compensation expense related to non-vested stock options was $37, which is expected to be recognized over the weighted average remaining vesting period of 0.22 years.
The Company estimated the grant-date fair values of stock options granted, along with the reporting-date fair value for options granted using the Black-Scholes option pricing model and the following assumptions, respectively:
| Reporting Date December 31, 2013 |
2013 Grant Dates |
Reporting Date December 31, 2012 | ||||
| Risk free interest rate |
0.13% – 1.14% | 1.14% | 0.21% – 0.50% | |||
| Expected dividend yield |
0% | 0% | 0% | |||
| Expected life of options (in years) |
1.0 – 3.75 | 3.75 | 1.5 – 3.75 | |||
| Expected volatility |
79% – 94% | 87% | 69% – 84% |
F-30
Table of Contents
A summary of the stock option activity under the 2013 WPHI Plan is as follows:
| Shares | Weighted- Average Exercise Price |
Average Remaining Weighted average Contractual Term (in Years) |
Aggregate Intrinsic Value |
|||||||||||||
| Granted |
1,667,883 | $ | 1.59 | 6.91 years | $ | — | ||||||||||
| Exercised |
— | |||||||||||||||
| Canceled |
— | |||||||||||||||
| Exchanged |
— | |||||||||||||||
|
|
|
|||||||||||||||
| Outstanding — December 31, 2013 |
1,667,883 | $ | 1.59 | 6.91 years | $ | — | ||||||||||
|
|
|
|||||||||||||||
| Exercisable — December 31, 2013 |
330,463 | $ | 1.59 | 6.91 years | $ | — | ||||||||||
|
|
|
|||||||||||||||
| Shares vested and expected to vest December 31, 2013 |
1,473,049 | $ | 1.59 | 6.91 years | $ | — | ||||||||||
|
|
|
|||||||||||||||
The aggregate intrinsic value in the table above represents the difference between the fair value grant date of common stock and the exercise price of outstanding, in-the-money stock options. At December 31, 2013 the estimated fair value of common stock was equal to the exercise price of the options.
The weighted average grant-date fair value of options granted under the 2013 WPHI Plan at grant was $1.59 per share. At December 31, 2013, unrecognized stock compensation expense related to non-vested stock options is $1,293, which is expected to be recognized over the weighted average remaining vesting period of 2.91 years.
The Company estimated the grant-date fair values of stock options granted, using the Black-Scholes option pricing model and the following assumptions, respectively:
| 2013 Grant Dates | ||
| Risk free interest rate |
1.17% –1.35% | |
| Expected dividend yield |
0% | |
| Expected life of options (in years) |
4.29 – 4.50 | |
| Expected volatility |
85.5% – 86.0% |
The Company recognizes stock-based compensation expense net of estimated forfeitures on a straight-line basis over the requisite service period. The forfeiture rate was 10% for both the years ended December 31, 2013 and 2012. Stock-based compensation expense, a noncash expense, is included in each respective expense category as follows, for the years ended December 31, 2013 and 2012:
| 2013 | 2012 | |||||||
| Cost of revenue |
$ | 71 | $ | 143 | ||||
| Sales and marketing |
43 | 87 | ||||||
| Research and development |
68 | 18 | ||||||
| General and administrative |
519 | 723 | ||||||
|
|
|
|
|
|||||
| Total stock-based compensation expense |
701 | 971 | ||||||
| Restructuring |
75 | 522 | ||||||
|
|
|
|
|
|||||
| $ | 776 | $ | 1,493 | |||||
|
|
|
|
|
|||||
In 2012, the Company modified options held by certain executives as part of separation agreements to fully vest such options as well as extend the contractual terms. In 2012, the Company recognized $522 of additional stock-based compensation expense within the restructuring expense category. In 2013 the Company recognized an additional expense of $75 reflecting the change in fair value of such options.
F-31
Table of Contents
| 14. | 401(k) PLAN |
The Company has a defined contribution plan covering substantially all of its employees, subject to certain eligibility requirements. Under the plan, participating employees may defer up to 15% of their pre-tax compensation, as defined. The Company contributes 50% of the amount contributed by a participating employee, up to a maximum of 6% of the participant’s pre-tax compensation. Company matching contributions for 2013 and 2012 were $179 and $220, respectively.
| 15. | INCOME TAXES |
The provision for income taxes for the years ended December 31, 2013 and 2012, consists of the following:
| 2013 | 2012 | |||||||
| Current Provision |
||||||||
| Federal |
$ | — | $ | — | ||||
| State |
2 | (28 | ) | |||||
| Foreign |
25 | 1,024 | ||||||
|
|
|
|
|
|||||
| Total current provision |
27 | 996 | ||||||
|
|
|
|
|
|||||
| Deferred Expense |
||||||||
| Federal |
7 | 15 | ||||||
| State |
1 | 3 | ||||||
|
|
|
|
|
|||||
| Total deferred expense |
8 | 18 | ||||||
|
|
|
|
|
|||||
| Total provision for income taxes |
$ | 35 | $ | 1,014 | ||||
|
|
|
|
|
|||||
Components of deferred income tax assets and liabilities at December 31, 2013 and 2012 are as follows:
| 2013 | 2012 | |||||||
| Deferred income tax assets: |
||||||||
| Net operating losses |
$ | 41,537 | $ | 37,960 | ||||
| Research and development tax credits |
1,196 | 1,192 | ||||||
| Bad debts |
39 | 8 | ||||||
| Deferred revenue |
4,206 | 931 | ||||||
| Inventories |
173 | 539 | ||||||
| Intangible assets and property |
3,230 | 2,828 | ||||||
| Stock-based compensation |
2,673 | 2,379 | ||||||
| Accrued expenses and other |
1,190 | 798 | ||||||
|
|
|
|
|
|||||
| 54,244 | 46,635 | |||||||
|
|
|
|
|
|||||
| Deferred income tax liabilities: |
||||||||
| Goodwill |
148 | 140 | ||||||
| Prepaid expenses |
138 | 123 | ||||||
| Deferred costs |
2,850 | 488 | ||||||
|
|
|
|
|
|||||
| 3,136 | 751 | |||||||
|
|
|
|
|
|||||
| Net deferred income tax assets |
(51,108 | ) | (45,884 | ) | ||||
| Valuation allowance |
(51,256 | ) | (46,024 | ) | ||||
|
|
|
|
|
|||||
| Carrying value of net deferred liability |
$ | (148 | ) | $ | (140 | ) | ||
|
|
|
|
|
|||||
F-32
Table of Contents
A reconciliation of the U.S. statutory federal income tax rate and the Company’s effective income tax rate for the years ended December 31, 2013 and 2012 is as follows:
| 2013 | 2012 | |||||||
| Federal statutory rate |
(34.00 | )% | (34.00 | )% | ||||
| State taxes — net of federal benefit |
0.02 | 0.12 | ||||||
| Convertible debt interest expense |
0.92 | — | ||||||
| Tax credits |
(0.02 | ) | (7.40 | ) | ||||
| Change in fair value of warrants |
(0.42 | ) | (29.78 | ) | ||||
| Other permanent items |
(1.42 | ) | (0.64 | ) | ||||
| Foreign withholding tax |
— | 11.57 | ||||||
| Valuation allowance |
35.18 | 79.68 | ||||||
|
|
|
|
|
|||||
| Effective income tax rate |
0.26 | % | 19.55 | % | ||||
|
|
|
|
|
|||||
As of December 31, 2013, the Company had $110,512 of federal net operating loss carryforwards that expire through 2028, $71,029 of state net operating loss carryforwards that expire from 2013 through 2028, and $1,196 of research and development tax credits that expire in 2028. The amount of the net operating loss and research and development tax credit carryforwards that may be utilized annually to offset future taxable income and tax liability may be limited as a result of certain ownership changes pursuant to Section 382 of the Internal Revenue Code. We have not completed a study to assess whether there have been one or more ownership changes since our inception due to the costs and complexities associated with such a study.
In 2012, the Company earned $10,000 of revenue from a technology licensing arrangement with a Chinese customer. Chinese tax law imposes a 10% income tax on such arrangements therefore $1,000 was withheld and remitted by the customer. The tax amount withheld effectively equals the tax due; therefore, the Company is not required to file a Chinese tax return. The withholding has been recorded as income tax expense in 2012.
The Company recognizes in its consolidated financial statements only those tax positions that are “more-likely-than-not” of being sustained upon examination by taxing authorities, based on the technical merits of the position. The Company performed a comprehensive review of its material tax positions in accordance with recognition and measurement standards. Based on this review, the Company has concluded that there are no uncertain tax positions that would require recognition or disclosure within the consolidated financial statements. As of December 31, 2013 and 2012, there are no uncertain tax positions. In addition, there are no amounts required to be included in the financial statements for interest or penalties on uncertain tax positions.
The Company files federal and various state income tax returns. The Company’s federal tax returns for 2010 and subsequent years remain open to examination by the tax authorities. The Company’s 2009 federal return has been audited and the audit was closed without any changes to the return positions. In addition, state tax returns for 2009 and subsequent years remain open to examination and the statute of limitations is not closed for the Company’s Switzerland-based subsidiary for 2009 and subsequent periods.
| 16. | RELATED-PARTY TRANSACTIONS |
In 2011, the Company engaged an investor in the Company to act as a co-lead investment banker in pursuing a sale of certain assets of the business. This sale was ultimately not consummated and rather the business was restructured in April 2012 at which time the Company ended efforts to sell the business. The agreement with the investor to market this business was terminated as of May 2013.
In 2013, the Company issued convertible notes to Rockport Capital Partners, Allen & Company, LLC and CWE LLC. These notes were valued collectively at $8,028 which consisted of $4,517 in cash and $3,511 in non-cash ascribed to the conversion of the C-1 shares (see Note 9). At December 31, 2013, accrued interest for these notes totaled $229 bringing the convertible value of such notes held by the investors to $8,257.
F-33
Table of Contents
| 17. | SEGMENT REPORTING |
The Company’s segments are defined as components of the enterprise about which separate financial information is available that is evaluated regularly by the chief operating decision maker in deciding how to allocate resources and in assessing performance.
The performance of the segments is evaluated based upon several factors, of which the primary financial measures are segment revenues, gross profits, and loss from operations. The disaggregated financial results of the segments reflect the allocation of certain functional expense categories consistent with the basis and manner in which management internally disaggregates financial information for the purpose of assisting in making internal operating decisions. In addition, certain expenses and other shared costs which management does not believe are specifically and directly attributable or allocable to any of the business segments have been excluded from the presented segment contribution margins. The accounting policies of the business segments are the same as those for the consolidated Company. The Company assigns revenues to individual countries based on the customer’s shipment location.
The Company manages its business with the four following segments:
| • | Product Sales and Service — Included in this business segment are the Company’s sales of distributed turbines along with related services, other products produced and sold to customers, as well as, in the future the Company’s direct sales of utility-class turbines. |
| • | Technology Licensing — Included in this business segment is the licensing of packages of the Company’s developed technology. |
| • | Technology Development — Included in this business segment is the Company’s development of technology for customers. |
| • | Shared Services — These costs and expenses are comprised mainly of the general and administrative departments including executive, finance and accounting, legal, human resources, and IT support, as well as certain shared engineering, and in certain circumstances, sales and marketing activities. |
Unallocated costs and expenses include depreciation and amortization, stock compensation, and certain other non-cash charges, such as restructuring and impairment charges.
Revenue for the four business segments are shown as follows:
| 2013 | 2012 | |||||||
| Product Sales and Services |
$ | 20,076 | $ | 17,400 | ||||
| Technology Licensing |
— | 10,000 | ||||||
| Technology Development |
522 | — | ||||||
|
|
|
|
|
|||||
| Total |
$ | 20,598 | $ | 27,400 | ||||
|
|
|
|
|
|||||
The loss from operations for the business segments and unallocated costs and expenses are as follows:
| 2013 | 2012 | |||||||
| Product Sales and Services |
$ | (3,452 | ) | $ | (6,924 | ) | ||
| Technology Licensing |
(1,587 | ) | 9,183 | |||||
| Technology Development |
317 | (22 | ) | |||||
| Shared Services |
(6,516 | ) | (6,219 | ) | ||||
| Unallocated costs and expenses |
(2,513 | ) | (5,675 | ) | ||||
|
|
|
|
|
|||||
| Loss from operations |
$ | (13,751 | ) | $ | (9,657 | ) | ||
|
|
|
|
|
|||||
F-34
Table of Contents
Unallocated costs and expenses consist of:
| 2013 | 2012 | |||||||
| Depreciation and amortization |
$ | (985 | ) | $ | (1,726 | ) | ||
| Stock-based compensation expense |
(701 | ) | (971 | ) | ||||
| Loss from disposals of property and equipment |
— | (44 | ) | |||||
| Asset held for sale loss |
(768 | ) | — | |||||
| Noncash restructuring charges |
(70 | ) | (1,512 | ) | ||||
| Impairment of long-lived assets |
— | (1,451 | ) | |||||
| Other |
11 | 29 | ||||||
|
|
|
|
|
|||||
| $ | (2,513 | ) | $ | (5,675 | ) | |||
|
|
|
|
|
|||||
Total business segment assets are as follow:
| 2013 | 2012 | |||||||
| Product Sales and Services |
$ | 17,583 | $ | 11,889 | ||||
| Technology Licensing |
1,059 | 709 | ||||||
| Technology Development |
274 | — | ||||||
| Shared Services |
290 | 370 | ||||||
| Unallocated assets |
8,339 | 7,058 | ||||||
|
|
|
|
|
|||||
| Total |
$ | 27,545 | $ | 20,026 | ||||
|
|
|
|
|
|||||
Unallocated assets consist of the following:
| 2013 | 2012 | |||||||
| Cash |
$ | 4,236 | $ | 4,241 | ||||
| Other current assets |
372 | 209 | ||||||
| Property, plant and equipment, net |
47 | 122 | ||||||
| Deferred tax assets |
2,384 | 409 | ||||||
| Asset held for sale |
1,300 | 2,077 | ||||||
|
|
|
|
|
|||||
| Total |
$ | 8,339 | $ | 7,058 | ||||
|
|
|
|
|
|||||
Geographic information about revenue, based on shipments and/or services to customers by region, is as follows:
| 2013 | 2012 | |||||||
| United States |
$ | 4,532 | $ | 3,653 | ||||
| United Kingdom |
6,926 | 11,445 | ||||||
| Italy |
8,760 | 302 | ||||||
| China |
— | 12,000 | ||||||
| Rest of the world |
380 | — | ||||||
|
|
|
|
|
|||||
| Total |
$ | 20,598 | $ | 27,400 | ||||
|
|
|
|
|
|||||
For the years ended December 31, 2013 and 2012, 78% and 87% of revenues, respectively, were recognized from sales outside the U.S.
Geographic information about long-lived assets associated with particular regions is as follows:
| 2013 | 2012 | |||||||
| United States |
$ | 3,865 | $ | 5,273 | ||||
| Rest of the world |
80 | 122 | ||||||
|
|
|
|
|
|||||
| Consolidated Total |
$ | 3,945 | $ | 5,395 | ||||
|
|
|
|
|
|||||
F-35
Table of Contents
| 18. | SUBSEQUENT EVENTS |
Private Placement
On January 15, 2014, the Company signed a letter of intent to be acquired by Mira III Acquisition Corp., (“Mira III”), a Canadian capital pool company, in a reverse takeover transaction. Upon completion of the transaction, the Company would be a wholly-owned subsidiary of Mira III, but the Company’s business would become Mira III’s operating business and the Company’s directors and officers would become Mira III’s directors and officers. Mira III also would succeed to the Company’s status as a reporting company under the Exchange Act which would permit it to continue to prepare financial statements in accordance with U.S. GAAP. Mira III’s common stock is listed for trading on the TSX Venture Exchange (“Exchange”) under the symbol MRQ.P. Closing of the acquisition by Mira III is contingent upon, among other things, execution of definitive merger agreement, approval by the Company’s shareholders and by the shareholders of Mira III, and the approval by the Toronto Stock Exchange and the TSX Venture Exchange. On March 17, 2014 the private placement was completed and the gross proceeds raised of $22,273 have been placed in escrow until the closing date has been determined. Upon the closing, equity securities issued to the private placement investors would be automatically exchanged for shares of Mira III’s common stock. Also upon the closing of the acquisition, all of the outstanding common stock of the Company would be exchanged for common shares of Mira III and all outstanding senior secured convertible notes of the Company would be converted to common shares of Mira III, as disclosed in Mira III Filing Statement.
In March 2014, the Toronto Stock Exchange (the “TSX”) informed the Company that it would be required to reprice the options issued in January 2014 upon completion of the option exchange described in Note 13, Stock Based Compensation and Employee Benefit Plans, so that the exercise price for such options would be equal to the price per equity security sold in the private placement. The board of directors of the Company determined effective the end of March 2014 that it would reprice these options as required by the TSX and as permitted by the option exchange documents, but would not modify the number of shares issued to employees. The Company will account for the March repricing by considering the event a modification of such options at such time. The Company will be concluding the accounting for all activities associated with the option exchange as well as repricing as part of reporting its results for the three months ended March 31, 2014.
On March 31, 2014 the Company successfully completed its Filing Statement with the Exchange. The Exchange has conditionally accepted the merger subject to Mira III fulfilling all of the requirements of the Exchange on or before June 30, 2014. In addition, the Toronto Stock Exchange has conditionally approved the listing of the Voting Common Shares on the Toronto Stock Exchange subject to Mira III fulfilling all of the requirements of the Toronto Stock Exchange on or before June 26, 2014.
On April 16, 2014, the Company consummated the reverse takeover transaction and the listing of its Voting Common Shares on the TSX under the symbol NPS, and received the escrowed gross proceeds of $22,273. As described in Note 1, the receipt of such proceeds has mitigated the previously reported going concern uncertainty. Also, WPHI’s Senior Secured Convertible Notes, originally due June 30, 2014, were converted into Mira III common shares and have been reported as a long-term liability as of December 31, 2013. On April 16, 2014, each of the 20,000,075 shares of WPHI common stock issued and outstanding were automatically combined, reclassified and changed into 0.6420084 of one fully paid and non-assessable share of common stock resulting in a post-split total of 12,840,187 shares, without any action on the part of the holder thereof. All of the share and per share data in these financial statements have been retroactively adjusted to give effect to this reverse stock split.
Facility Sale and Leaseback
On March 5, 2014, the Company signed a Purchase and Sale Agreement with Malone Properties, Inc., (the “Buyer”) of Montpelier, VT, at a proposed purchase price of $1,300. Upon signing the Lease Agreement (the “Lease”), the Company’s rent expense will be $345 annually plus the cost of certain maintenance,
F-36
Table of Contents
insurance and property taxes. The Company will have the right to terminate the lease at the end of years two, three and four with six months prior notice. The Lease will be signed and executed at the time of closing, which is expected to occur during the second quarter of 2014.
Material Contract
In March 2014, the Company executed an agreement with a Brazilian-based company, WEG Equipamentos Elétricos S.A. (“WEG”) to develop a 3.3 MW turbine platform. This contract is stand-alone in nature and does not alter any terms of previous agreements with WEG. Under this new agreement, the Company will provide certain design, production support and testing services in exchange for $8 million, which is earned over time. WEG will own the resulting turbine design and any newly-developed intellectual property and will have the exclusive right to produce and sell turbines based upon such design in South America, Central America (other than the Caribbean) and sub-Saharan Africa. The Company has the right to license such design or produce turbines based upon this design in all other parts of the world, but must provide WEG with a right of first refusal on such production. The contract also grants WEG the option to potentially acquire rest of world rights to produce and sell turbines based upon the 3.3 MW design. The Company retains the right to develop alternative 3 MW turbine platforms. The Company is currently concluding the appropriate accounting for this contract.
Northern Power Systems S.r.l, an Italian limited liability company was established on January 23, 2014 is a subsidiary of Northern. Northern Power Systems S.r.l. was established to provide installation and maintenance services for the Company’s customers in Italy.
| 19. | COMMITMENTS AND CONTINGENCIES |
On March 31, 2011, the Company entered into an agreement to provide maintenance and repair services for an expected fifteen or more utility-class wind turbines with a customer. This agreement obligated the Company to provide such services for up to a 12 year period. Since the Company anticipated multiple sales of utility-class wind turbines under this agreement it created a service infrastructure to support such a deployment. The Company, in fact, has only sold two prototype turbines to this customer resulting in a potential cost to perform this obligation being in excess of expected revenue sources. As a separately priced maintenance agreement, accounting for this contract is under ASC 460 Guarantees, which requires that the measurement of a guarantee liability be the fair value of the obligation at the reporting period. If the consideration of the fair value of an obligation results in the potential of a contingent loss, consideration of the probable and estimable criteria of ASC 450-20-25 is appropriate. Furthermore, for longer-term obligations, such as this, the Company considers the use of a discount factor in determining the estimated liability is appropriate. The agreement is currently under renegotiation and depending on the outcome could have an impact on the estimated liability.
In 2011, the Company both commenced a significant infrastructure redesign to reduce costs and initiated negotiations with the customer to change the terms of this service contract based upon an option that the Company has within the agreement. In consideration of those factors, the Company determined that a loss was not probable at such time and as such did not record a liability in its 2011 consolidated financial statements. Despite the Company’s implementation of cost reductions the Company concluded during 2012 that a loss was probable. The Company estimated the discounted value of such exposure at $562, using a discount rate of 9% over approximately 10 years. As of December 31, 2013, total liability related to this exposure is $417 of which $159 is recorded as a current liability.
In 2012, the Company was notified by the U.S. Department of Energy of audits of the Company’s incurred cost submissions associated with various contracts the Company has with the U.S. Department of Energy . The Defense Contract Auditing Agency (“DCAA”) completed its audit of 2003 in November of 2013 and the outcome of this audit did not result in a cost to the Company. The DCAA is currently auditing the years 2004 through 2007 and an external independent audit firm is auditing 2010. These audits are in various stages of completion and although the Company received information requests from the auditors in 2012,
F-37
Table of Contents
substantive audit procedures did not begin until June 2013. The Company does not have adequate information at the date of issuance of these financial statements to determine if the outcome of any of these remaining open audits will result in a cost to the Company.
The Company has entered into several operating lease agreements, primarily for the lease of office facilities, and office equipment, expiring through 2018. Rental expense under these operating lease arrangements for the years ended December 31, 2013 and 2012 was $388 and $544, respectively.
Future minimum lease payments under noncancelable lease agreements (with initial or remaining lease terms in excess of one year) are as follows:
| Years Ending December 31 |
||||
| 2014 |
$ | 266 | ||
| 2015 |
57 | |||
| 2016 |
55 | |||
| 2017 |
4 | |||
| 2018 |
4 | |||
| Thereafter |
2 | |||
|
|
|
|||
| $ | 388 | |||
|
|
|
F-38
Table of Contents
FORMERLY KNOWN AS WIND POWER HOLDINGS, INC.
CONDENSED CONSOLIDATED BALANCE SHEETS
AS OF SEPTEMBER 30, 2014 AND DECEMBER 31, 2013
(In thousands, except share and per share amounts)
| September 30, 2014 (Unaudited) |
December 31, (Note 1) |
|||||||
| ASSETS |
||||||||
| CURRENT ASSETS: |
||||||||
| Cash and cash equivalents |
$ | 16,318 | $ | 4,534 | ||||
| Accounts receivable — net of allowance for doubtful accounts of $260 and $103 at September 30, 2014 and December 31, 2013, respectively |
3,820 | 1,175 | ||||||
| Unbilled revenue |
2,030 | 786 | ||||||
| Inventories — net (Note 4) |
15,000 | 11,682 | ||||||
| Deferred costs |
951 | 1,443 | ||||||
| Prepaid expenses and other current assets |
1,665 | 1,365 | ||||||
|
|
|
|
|
|||||
| Total current assets |
39,784 | 20,985 | ||||||
| Property, plant and equipment — net (Note 6) |
1,624 | 1,414 | ||||||
| Intangible assets — net (Note 7) |
369 | 509 | ||||||
| Goodwill |
722 | 722 | ||||||
| Deferred income taxes (Note 13) |
281 | 2,384 | ||||||
| Asset held for sale |
— | 1,300 | ||||||
| Other assets |
250 | 231 | ||||||
|
|
|
|
|
|||||
| Total assets |
$ | 43,030 | $ | 27,545 | ||||
|
|
|
|
|
|||||
| LIABILITIES AND SHAREHOLDERS’ EQUITY (DEFICIENCY) |
||||||||
| CURRENT LIABILITIES: |
||||||||
| Working capital revolving line of credit |
$ | 4,000 | $ | — | ||||
| Current portion of long-term debt (Note 8) |
— | 141 | ||||||
| Accounts payable |
2,004 | 2,148 | ||||||
| Accrued expenses (Note 9) |
4,146 | 2,158 | ||||||
| Accrued compensation |
2,195 | 2,207 | ||||||
| Deferred revenue |
5,124 | 4,221 | ||||||
| Deferred income taxes (Note 13) |
439 | 2,532 | ||||||
| Customer deposits |
6,860 | 10,917 | ||||||
| Liability for stock-based compensation (Note 11) |
— | 598 | ||||||
| Other current liabilities |
94 | 197 | ||||||
|
|
|
|
|
|||||
| Total current liabilities |
24,862 | 25,119 | ||||||
|
|
|
|
|
|||||
| Deferred revenue, less current portion |
1,531 | 1,163 | ||||||
| Senior secured convertible notes (Note 8) |
— | 12,107 | ||||||
| Long-term debt, less current portion (Note 8) |
— | 300 | ||||||
| Other long-term liability (Note 17) |
278 | 258 | ||||||
|
|
|
|
|
|||||
| Total Liabilities |
26,671 | 38,947 | ||||||
|
|
|
|
|
|||||
| Commitments and Contingencies (Note 17) |
||||||||
| SHAREHOLDERS’ EQUITY (DEFICIENCY): |
||||||||
| Voting common shares, no par value — Unlimited shares authorized; 14,893,981 shares issued and outstanding as of September 30, 2014, none authorized as of December 31, 2013. |
87,205 | — | ||||||
| Class B restricted voting common shares, no par value — Unlimited shares authorized; 7,840,582 shares issued and outstanding as of September 30, 2014, none authorized as of December 31, 2013. |
78,134 | — | ||||||
| Series X convertible preferred stock, 6,000,000 shares authorized and no shares issued and outstanding as of December 31, 2013, none authorized as of September 30, 2014. |
— | — | ||||||
| Common shares, $0.01 par value — 44,000,000 shares authorized; 12,840,187 shares issued and outstanding as of December 31, 2013, none authorized as of September 30, 2014. |
— | 128 | ||||||
| Additional paid-in capital |
7,831 | 139,804 | ||||||
| Accumulated deficit |
(156,811 | ) | (151,334 | ) | ||||
|
|
|
|
|
|||||
| Total Shareholders’ Equity (Deficiency) |
16,359 | (11,402 | ) | |||||
|
|
|
|
|
|||||
| Total Liabilities and Shareholders’ Equity (Deficiency) |
$ | 43,030 | $ | 27,545 | ||||
|
|
|
|
|
|||||
The accompanying notes are an integral part of these consolidated financial statements.
F-39
Table of Contents
FORMERLY KNOWN AS WIND POWER HOLDINGS, INC.
CONDENSED CONSOLIDATED STATEMENTS OF OPERATIONS (unaudited)
FOR THE NINE MONTHS ENDED SEPTEMBER 30, 2014 AND 2013
(In thousands, except share and per share amounts)
| For the nine months ended September 30, |
||||||||
| 2014 | 2013 | |||||||
| REVENUES: |
||||||||
| Product |
$ | 37,484 | $ | 9,858 | ||||
| License |
2,541 | — | ||||||
| Design service |
1,063 | 522 | ||||||
| Service |
1,470 | 1,220 | ||||||
|
|
|
|
|
|||||
| Total revenues |
42,558 | 11,600 | ||||||
| Cost of product revenues |
31,154 | 8,905 | ||||||
| Cost of service and design service revenues |
3,171 | 2,207 | ||||||
|
|
|
|
|
|||||
| Gross profit |
8,233 | 488 | ||||||
| COSTS AND OPERATING EXPENSES: |
||||||||
| Sales and marketing |
2,668 | 2,044 | ||||||
| Research and development |
3,537 | 2,845 | ||||||
| General and administrative |
6,793 | 4,729 | ||||||
| Restructuring charges |
— | 23 | ||||||
|
|
|
|
|
|||||
| Total costs and operating expenses |
12,998 | 9,641 | ||||||
|
|
|
|
|
|||||
| Income (loss) from operations |
(4,765 | ) | (9,153 | ) | ||||
| Change in fair value of warrants |
— | 173 | ||||||
| Interest income |
5 | — | ||||||
| Interest expense |
(317 | ) | (230 | ) | ||||
| Other income (expense) — net |
41 | (36 | ) | |||||
|
|
|
|
|
|||||
| Income (loss) before provision (benefit) for income taxes |
(5,036 | ) | (9,246 | ) | ||||
| Provision (benefit) for income taxes (Note 13) |
441 | 13 | ||||||
|
|
|
|
|
|||||
| NET LOSS |
$ | (5,477 | ) | $ | (9,259 | ) | ||
|
|
|
|
|
|||||
| Net loss applicable to common shareholders (Note 2) |
$ | (5,477 | ) | $ | (12,946 | ) | ||
| Net loss per common share |
||||||||
| Basic and diluted |
$ | (0.29 | ) | $ | (15.21 | ) | ||
| Weighted average number of common shares outstanding |
||||||||
| Basic and diluted |
18,919,146 | 850,950 | ||||||
F-40
Table of Contents
FORMERLY KNOWN AS WIND POWER HOLDINGS, INC.
CONDENSED CONSOLIDATED STATEMENTS OF CHANGES IN SHAREHOLDERS’ EQUITY (DEFICIENCY)
FOR THE YEAR ENDED DECEMBER 31, 2013 AND THE NINE MONTHS ENDED SEPTEMBER 30, 2014 (unaudited)
(All amounts in thousands except share amounts)
| Preferred Stock | Common Shares | Voting Common Shares-No Par |
Class B Restricted Voting Common Shares-No Par |
Additional Paid-In Capital |
Accumulated Deficit |
Total Shareholders’ Equity (Deficiency) |
||||||||||||||||||||||||||||||||||||||
| Shares | Amount | Shares | Amount | Shares | Amount | Shares | Amount | |||||||||||||||||||||||||||||||||||||
| BALANCE — January 1, 2013 |
22,376,146 | $ | 135,073 | 15,072 | $ | — | — | $ | — | — | $ | — | $ | 6,379 | $ | (137,206 | ) | $ | 4,246 | |||||||||||||||||||||||||
| Stock based compensation expense |
— | — | — | — | — | — | — | — | 369 | — | 369 | |||||||||||||||||||||||||||||||||
| Change in the liability classification of stock-based compensation |
— | — | — | — | — | — | — | — | 266 | — | 266 | |||||||||||||||||||||||||||||||||
| April conversion of preferred stock to common shares |
(5,531,240 | ) | (34,166 | ) | 305,931 | 3 | — | — | — | — | 34,163 | — | — | |||||||||||||||||||||||||||||||
| Warrant conversion |
2,734,390 | 3,095 | — | — | — | — | — | — | — | — | 3,095 | |||||||||||||||||||||||||||||||||
| September automatic conversion of preferred stock to common shares |
(18,329,219 | ) | (86,907 | ) | 6,099,066 | 61 | — | — | — | — | 86,846 | — | — | |||||||||||||||||||||||||||||||
| Series C-1 conversion to senior secured convertible notes |
(1,250,077 | ) | (17,095 | ) | 6,420,118 | 64 | — | — | — | — | 11,781 | — | (5,250 | ) | ||||||||||||||||||||||||||||||
| Net loss |
— | — | — | — | — | — | — | — | — | (14,128 | ) | (14,128 | ) | |||||||||||||||||||||||||||||||
|
|
|
|
|
|
|
|
|
|
|
|
|
|
|
|
|
|
|
|
|
|
|
|||||||||||||||||||||||
| BALANCE — December 31, 2013 |
— | — | 12,840,187 | 128 | — | — | — | — | 139,804 | (151,334 | ) | (11,402 | ) | |||||||||||||||||||||||||||||||
| Stock based compensation expense |
— | — | — | — | — | — | — | — | 746 | — | 746 | |||||||||||||||||||||||||||||||||
| Reclassification of liability for stock-based compensation to equity |
— | — | — | — | — | — | — | — | 598 | — | 598 | |||||||||||||||||||||||||||||||||
| Effect of reverse take over |
— | — | (12,840,187 | ) | (128 | ) | 4,306,076 | 43,703 | 8,893,486 | 90,260 | (133,937 | ) | — | (102 | ) | |||||||||||||||||||||||||||||
| Common shares issued at $3.64, net of expenses |
— | — | — | — | 6,125,000 | 19,003 | — | — | 620 | — | 19,623 | |||||||||||||||||||||||||||||||||
| Conversion of senior secured convertible notes to common shares |
— | — | — | — | 1,016,534 | 3,700 | 2,368,221 | 8,620 | — | — | 12,320 | |||||||||||||||||||||||||||||||||
| Conversion of restricted class B voting common shares to common shares |
— | — | — | — | 3,421,125 | 20,746 | (3,421,125 | ) | (20,746 | ) | — | — | — | |||||||||||||||||||||||||||||||
| Proceeds from exercise of stock options |
— | — | — | — | 25,246 | 53 | — | — | — | — | 53 | |||||||||||||||||||||||||||||||||
| Net loss |
— | — | — | — | — | — | — | — | — | (5,477 | ) | (5,477 | ) | |||||||||||||||||||||||||||||||
|
|
|
|
|
|
|
|
|
|
|
|
|
|
|
|
|
|
|
|
|
|
|
|||||||||||||||||||||||
| BALANCE — September 30, 2014 |
— | $ | — | — | $ | — | 14,893,981 | $ | 87,205 | 7,840,582 | $ | 78,134 | $ | 7,831 | $ | (156,811 | ) | $ | 16,359 | |||||||||||||||||||||||||
|
|
|
|
|
|
|
|
|
|
|
|
|
|
|
|
|
|
|
|
|
|
|
|||||||||||||||||||||||
The accompanying notes are an integral part of these consolidated financial statements.
F-41
Table of Contents
FORMERLY KNOWN AS WIND POWER HOLDINGS, INC.
CONDENSED CONSOLIDATED STATEMENTS OF CASH FLOWS
FOR THE NINE MONTHS ENDED SEPTEMBER 30, 2014 AND 2013
(In thousands)
| For the nine months ended | ||||||||
| September 30, 2014 (Unaudited) |
September 30, 2013 (Unaudited) |
|||||||
| OPERATING ACTIVITIES: |
||||||||
| Net loss |
$ | (5,477 | ) | $ | (9,259 | ) | ||
| Adjustments to reconcile net loss to net cash used in operating activities: |
||||||||
| Change in fair value of warrants |
— | (173 | ) | |||||
| Provision for inventory obsolescence |
125 | 35 | ||||||
| Provision for (recovery of) doubtful accounts |
224 | (22 | ) | |||||
| Stock-based compensation expense |
746 | 264 | ||||||
| Depreciation and amortization |
763 | 771 | ||||||
| Noncash restructuring charges |
— | 23 | ||||||
| Deferred income taxes |
10 | 10 | ||||||
| Changes in operating assets and liabilities: |
||||||||
| Accounts receivable and unbilled revenue |
(4,113 | ) | (37 | ) | ||||
| Other current and noncurrent assets |
(317 | ) | (517 | ) | ||||
| Inventories |
(3,581 | ) | (3,924 | ) | ||||
| Deferred costs |
492 | (420 | ) | |||||
| Accounts payable |
(146 | ) | 1,662 | |||||
| Accrued expenses |
2,171 | 778 | ||||||
| Customer deposits |
(4,057 | ) | 2,948 | |||||
| Deferred revenue and other short term liabilities |
1,168 | 2,028 | ||||||
| Other liabilities |
19 | (54 | ) | |||||
|
|
|
|
|
|||||
| Net cash used in operating activities |
(11,973 | ) | (5,887 | ) | ||||
|
|
|
|
|
|||||
| INVESTING ACTIVITIES: |
||||||||
| Proceeds from sale of property, net |
1,218 | — | ||||||
| Purchases of property and equipment |
(696 | ) | (195 | ) | ||||
|
|
|
|
|
|||||
| Net cash provided by (used in) investing activities |
522 | (195 | ) | |||||
|
|
|
|
|
|||||
| FINANCING ACTIVITIES: |
||||||||
| Proceeds private placement equity financing, net of offering costs |
19,623 | — | ||||||
| Proceeds from working capital revolving line of credit, net |
4,000 | — | ||||||
| Proceeds from exercise of stock options |
53 | — | ||||||
| Proceeds from issuance of convertible debt |
— | 6,525 | ||||||
| Net borrowing on line of credit agreement |
— | 98 | ||||||
| Debt principal payments |
(441 | ) | (34 | ) | ||||
|
|
|
|
|
|||||
| Net cash provided by financing activities |
23,235 | 6,589 | ||||||
|
|
|
|
|
|||||
| Change in cash and cash equivalents |
11,784 | 507 | ||||||
| Cash and cash equivalents — beginning of the period |
4,534 | 4,456 | ||||||
|
|
|
|
|
|||||
| Cash and cash equivalents — end of the period |
$ | 16,318 | $ | 4,963 | ||||
|
|
|
|
|
|||||
| SUPPLEMENTAL DISCLOSURES OF CASH FLOW INFORMATION: |
||||||||
| Cash paid during the period for interest |
$ | 33 | $ | 30 | ||||
|
|
|
|
|
|||||
| Income taxes paid |
$ | 15 | $ | 58 | ||||
|
|
|
|
|
|||||
| Noncash financing activity: |
||||||||
| Settlement of stock-based compensation liability awards with equity awards |
$ | 598 | $ | — | ||||
|
|
|
|
|
|||||
| Conversion of debt to equity |
$ | 12,320 | $ | — | ||||
|
|
|
|
|
|||||
| Issuance of options to placement agents |
$ | 620 | $ | — | ||||
|
|
|
|
|
|||||
The accompanying notes are an integral part of these consolidated financial statements.
F-42
Table of Contents
FORMERLY KNOWN AS WIND POWER HOLDING, INC.
NOTES TO CONDENSED CONSOLIDATED FINANCIAL STATEMENTS (unaudited)
AS OF THE NINE MONTHS ENDED SEPTEMBER 30, 2014 and 2013
(In thousands except share and per share amounts)
| 1. | DESCRIPTION OF BUSINESS |
The Company, as defined below, is a provider of advanced technology for the renewable energy sector. It designs, manufactures and services next-generation Permanent Magnet Direct-Drive (PM/DD) wind turbines for the distributed wind market, and licenses existing and evolving utility-class wind turbine platforms to large manufacturers on a global basis. The Company also provides power technology products and engineering and development services for a wide variety of renewable energy applications.
The Company’s headquarters are in Barre, Vermont, and it has sales offices in Zurich, Switzerland and Bari, Italy.
As of December 31, 2013, the parent holding company of the group was Wind Power Holdings, Inc. (“WPHI”), which had a wholly owned subsidiary, Northern Power Systems, Inc. (“Northern”). Northern has two wholly-owned subsidiaries, Northern Power Systems AG and Northern Power Systems S.r.l. WPHI was formed on August 12, 2008, and Northern was formed on July 14, 2008. WPHI previously had another wholly owned subsidiary, Northern Power Systems Utility Scale, Inc. (“Utility Scale”), which was formed on November 13, 2009. Utility Scale was merged into Northern effective December 31, 2013.
On April 16, 2014, Northern Power Systems Corp. completed a reverse takeover (“RTO”) transaction pursuant to a Merger Agreement and Plan of Reorganization dated as of March 31, 2014 (the “Merger Agreement”), between Northern Power Systems Corp. (formerly Mira III Acquisition Corp., a Canadian capital pool company (“Mira III”)), WPHI, Mira Subco Inc., and Mira Subco LLC. Under the Merger Agreement, Mira Subco Inc., a wholly-owned subsidiary of Mira III, merged with and into WPHI, with WPHI as the surviving corporation, and WPHI merged with and into Mira Subco LLC, a wholly-owned subsidiary of Mira III, with Mira Subco LLC as the surviving entity, as part of an integrated transaction (the “Merger”). In connection with the RTO, all of the equity securities of WPHI were exchanged for common shares and restricted voting shares of Mira III. Following the completion of the transaction, Mira III changed its name to Northern Power Systems Corp. (“NPS Corp.”). NPS Corp. and its subsidiaries or WPHI and its subsidiaries as applicable are referred to herein as the “Company.” The foregoing is only a brief description of the RTO, does not purport to be complete and is qualified in its entirety by reference to the Merger Agreement, a copy of which is included in Exhibit 10.9 to Amendment No. 2 to WPHI’s Registration Statement on Form 10, filed with the Securities and Exchange Commission on April 14, 2014. On July 29, 2014 Mira Subco LLC was liquidated. As a result, Northern became a direct, wholly-owned subsidiary of NPS Corp.
Since the shareholders of WPHI received the majority of the voting shares of NPS Corp., the Merger was accounted for as a RTO whereby WPHI was the accounting acquirer (legal acquiree) and NPS Corp. was the accounting acquiree (legal acquirer) under reverse takeover accounting. The balance sheets consist of the net assets of the accounting acquirer at historical cost and the net assets of the legal acquirer which approximate fair value. The statements of operations include the operations of the accounting acquirer for the periods presented and the operations of the legal acquirer from the date of the Merger.
Under accounting principles generally accepted in the United States (“U.S. GAAP”), the Merger, as described, is considered to be a capital transaction in substance, rather than a business combination. The Merger is equivalent to the issuance of stock by WPHI for the net monetary assets of NPS Corp. accompanied by a recapitalization, and is accounted for as a change in capital structure. Accordingly, the accounting for the Merger was identical to that resulting from a reverse acquisition, except no goodwill was recorded. Under reverse takeover accounting, the post reverse acquisition comparative historical financial statements of the legal acquirer, NPS Corp., are those of the legal acquiree, WPHI, which is considered to be the accounting acquirer.
F-43
Table of Contents
Liquidity — The Company disclosed a going-concern uncertainty in its consolidated financial statements for the year ended December 31, 2013. Management believes that, with the completion of its equity capital raise on April 16, 2014, the Company has adequate capital to fund operations for at least one year from the date of issuance of these financial statements. As described in Note 10, the Company closed a private equity placement in connection with the RTO. The private placement provided gross proceeds of CDN$24,500 (USD$22,273) which were received on April 16, 2014. The Company believes that the receipt of the private placement proceeds has mitigated the previously reported going concern uncertainty. As a result the Company issued updated audited financial statements for the year ended December 31, 2013, and the Company’s former independent registered public accounting firm reissued its 2013 audit opinion to remove the going concern uncertainty. A complete description of the reissuance is included in Exhibit 99.1 to the Company’s Current Report on Form 8-K (File No. 000-55184), filed on September 3, 2014.
Basis of Presentation — The accompanying unaudited consolidated financial statements have been prepared in accordance with U.S. GAAP for interim financial information and with the instructions to Form 10-Q and Article 8 of Regulation S-X. Accordingly, they do not include all of the information and footnotes required by U.S. GAAP for complete financial statements and, therefore, should be read in conjunction with the Company’s 2013 consolidated financial statements and related notes included in the Registration Statement on Form 10 (File No. 001-36317) filed by WPHI. The condensed consolidated balance sheet as of December 31, 2013 and the condensed consolidated statement of changes in shareholders’ equity (deficiency) for the year ended December 31, 2013 were derived from the Company’s annual audited financial statements. The preparation of financial statements in conformity with U.S. GAAP requires management to make estimates and assumptions that affect the timing and amount of assets, liabilities, equity, revenue and expenses reported and disclosed. Actual amounts could differ from these estimates. All adjustments, consisting of normal recurring adjustments, which are, in the opinion of management, necessary for a fair presentation of the results for the interim periods have been recorded. Actual amounts could differ from these estimates. Due to differing business conditions and seasonality, operating results for the nine months ended September 30, 2014 are not necessarily indicative of the results that may be expected in subsequent quarters or for the full year ending December 31, 2014.
| 2. | NET LOSS PER SHARE |
Basic loss per share is determined by dividing loss attributable to common shareholders by the weighted average common shares outstanding during the period. Diluted earnings per share is determined by dividing loss attributable to common shareholders by diluted weighted average shares outstanding during the period. Diluted weighted average shares reflect the dilutive effect, if any, of potential common shares. To the extent their effect is dilutive, employee equity awards and warrants, based on the treasury stock method, are included in the calculation of diluted earnings per share. For the nine months ended September 30, 2014 and 2013, all potential common shares were anti-dilutive due to the net loss and were excluded from the diluted net loss per share calculations.
F-44
Table of Contents
The calculations of net loss attributable to common shareholders and of basic and diluted net loss per share are as follows:
| For the nine months ended September 30, |
||||||||
| 2014 | 2013 | |||||||
| Basic earnings per share calculation: |
||||||||
| Numerator |
||||||||
| Net loss |
$ | (5,477 | ) | $ | (9,259 | ) | ||
| Series A preferred stock dividends |
— | (1,810 | ) | |||||
| Series B preferred stock dividends |
— | (1,556 | ) | |||||
| Series C preferred stock dividends |
— | (321 | ) | |||||
|
|
|
|
|
|||||
| Net loss attributable to common shareholders |
$ | (5,477 | ) | $ | (12,946 | ) | ||
|
|
|
|
|
|||||
| Denominator |
||||||||
| Weighted average common shares outstanding- basic and diluted |
18,919,146 | 850,950 | ||||||
| Net loss per share- basic and diluted |
$ | (0.29 | ) | $ | (15.21 | ) | ||
As described in Note 10, the Company completed a reverse stock split effective April 16, 2014. As such, the SEC’s Staff Accounting bulletin (“SAB”) 4c required the Company to retrospectively present and disclose the reverse stock split as if it were effective at each period presented. As a result, all share and per share data have been retroactively adjusted to give effect to this reverse stock split.
The following potentially dilutive securities were excluded from the calculation of diluted weighted average shares outstanding because they were considered anti-dilutive due to the Company’s loss position. Preferred shares were convertible to common shares in the ratio of 1 share of common shares for every 11.609 shares of preferred stock. All of the outstanding preferred stock was converted to common shares during 2013:
| September 30, 2014 | September 30, 2013 | |||||||
| Common share options |
2,461,275 | 11 | ||||||
|
|
|
|
|
|||||
| Total potentially dilutive securities |
2,461,275 | 11 | ||||||
|
|
|
|
|
|||||
As described in Note 10 the Company has 367,500 placement agent options outstanding as of September 30, 2014. In addition, as described in Note 11, the Company has 2,057,810 and 35,938 options outstanding as of September 30, 2014 related to the 2014 NPS Corp. and the Mira III plans, respectively. Such options are considered to be potentially dilutive securities.
| 3. | FAIR VALUE MEASUREMENTS |
Financial Instruments — The Company’s financial instruments consist primarily of cash and cash equivalents, accounts receivable, unbilled revenue, accounts payable, the working capital revolving line of credit and debt. The carrying amounts of cash, accounts receivable, unbilled revenue, accounts payable and the working capital revolving line of credit, as of September 30, 2014 and December 31, 2013, approximate fair value due to their short-term nature and are classified within Level 1 of the valuation hierarchy. The Company defines cash equivalents as highly liquid instruments with maturities of three months or less that are regarded as high quality, low risk investments. Cash equivalents consist of principally FDIC insured certificates of deposits.
Debt and Senior Secured Convertible Notes — The carrying values of the Company’s non-convertible debt approximate fair value. This is explained by the market value interest rates on such debt and the relatively low outstanding debt balances. In April 2014, as part of the reverse takeover, the Company’s Senior Secured Convertible Notes were converted to common shares at the face value of the notes plus accrued interest, which equaled carrying value, at the then current share price. This supported a fair value equal to carrying value
F-45
Table of Contents
because the note holder received common shares with a fair value equal to the carrying value of the notes. Furthermore, the share price was determined through offers to buy and sell shares on a public equity exchange. The fair value as of December 31, 2013, was calculated via a Probability Weighted Expected Return Method (PWERM) which utilized the Company’s current overall valuation. The PWERM (Level 3) applied a range of probabilities to a set of possible outcomes and attributed a value applicable to the Senior Secured Convertible Notes and to the common shares (the only other material equity interest in the Company at that time) in the event of each outcome. The Company determined that the PWERM was the most reliable approach given the complexity of the terms of the Senior Secured Convertible Notes, which could participate in any distribution as a holder of a liquidation preference or an equity participant, depending on the circumstances. The probabilities and weightings used in the analysis were based on management’s views of the opportunities available to the Company at that time for raising capital required to meet its plans, as well as a review of the outcomes to the Senior Secured Convertible Notes and common shares that would result from the selected scenarios. The PWERM was readily applicable to scenarios that resulted in immediate returns to the equity owners, so for those scenarios that would result in a continuing illiquid interest in the common shares, the option price method (or OPM) was employed. This combination of the OPM with the PWERM is sometimes referred to as a hybrid valuation method. The OPM treated the common shares interest as a “call option” on the Company’s overall enterprise value, determining the residual value to the common shares in the event that the Company was successful enough to satisfy the obligations due on the senior securities — in this case the holders of the Company’s Senior Secured Convertible Notes.
Fair value of the Company’s debt as of December 31, 2013 follows:
| Fair Value | Carrying Value | |||||||
| Senior Secured Convertible Notes — Mature in less than 1 Year |
$ | 17,712 | $ | 12,107 | ||||
| Current maturities of long-term debt |
141 | 141 | ||||||
| Long-term debt |
300 | 300 | ||||||
|
|
|
|
|
|||||
| Total |
$ | 18,153 | $ | 12,548 | ||||
|
|
|
|
|
|||||
The Company measures fair value using the framework specified in U.S. GAAP. This framework emphasizes that fair value is a market-based measurement, not an entity-specific measurement, and establishes a fair value hierarchy that distinguishes between assumptions based on market data obtained from independent sources and those based on an entity’s own assumptions. The hierarchy prioritizes the inputs for fair value measurement into three levels:
Level 1 — Measurements utilizing unadjusted quoted prices in active markets that the entity has the ability to access for identical assets or liabilities.
Level 2 — Measurements that include quoted prices for similar assets and liabilities in active markets, quoted prices for identical or similar assets or liabilities in markets that are not active, and other observable inputs, such as interest rates and yield curves that are observable at commonly quoted intervals.
Level 3 — Measurements using unobservable inputs for assets or liabilities for which little or no market information exists, and are based on the best information available and might include the entity’s own data.
In some valuations, the inputs used may fall into different levels of the hierarchy. In these cases, the financial instrument’s level within the fair value hierarchy is based on the lowest level of input that is significant to the fair value measurement.
Nonrecurring Fair Value Measurements — The Company holds certain assets and liabilities that are measured at fair value on a nonrecurring basis in periods subsequent to initial recognition.
Effective December 12, 2013, the Company’s Barre, Vermont facility became an asset held for sale. Based upon the marketing of the facility as well as the indication of value from a potential buyer, the Company believed that
F-46
Table of Contents
the current fair value of the facility was $1,300 at December 31, 2013. As of the measurement date, the Company calculated an asset held for sale loss by taking the difference between the fair value and the carrying value of the building along with the estimated direct costs of a sale transaction which resulted in a loss of $768 in the fourth quarter of 2013. Due to the use of significant unobservable inputs to determine fair value this value falls within Level 3 of the fair value hierarchy at December 31, 2013. The Barre, Vermont facility was sold for $1,300 in June 2014 and is no longer disclosed on the balance sheet as an asset held for sale.
| 4. | INVENTORIES |
Inventories as of September 30, 2014 and December 31, 2013 consist of:
| September 30, 2014 |
December 31, 2013 |
|||||||
| Raw materials |
$ | 4,198 | $ | 2,511 | ||||
| Work in process |
2,645 | 1,124 | ||||||
| Finished goods |
8,310 | 8,610 | ||||||
| Freight deferred costs |
292 | — | ||||||
| Allowance for obsolescence |
(445 | ) | (563 | ) | ||||
|
|
|
|
|
|||||
| Total inventory — net |
$ | 15,000 | $ | 11,682 | ||||
|
|
|
|
|
|||||
For the nine months ended September 30, 2014 and 2013, the Company recorded inventory write-downs of approximately $125, and $35, respectively.
| 5. | RESTRUCTURING |
In April 2012, the Company committed to a restructuring plan for its utility-class wind business, changing the nature of its operations from being primarily a designer and developer of utility scale wind turbines to a provider of licensing and co-development for wind applications and engineering services for other applications. These actions resulted in the reduction of approximately 40% of the Company’s total headcount and the closure of a manufacturing facility. The restructured business continued to operate in the Utility Scale legal entity through December 31, 2013, and after such date it transitioned to operate within Northern with the merger of those two subsidiaries effective on such date. In association with this restructuring, during the nine months ended September 30, 2014 and 2013, the Company recorded restructuring charges in the aggregate amount of $0 and $23, respectively, as detailed in the table below. Workforce-related activity includes stock compensation charges for certain modifications made to executive option grants as part of the restructuring. These options were accounted for as liability awards and marked to market though the statements of operations for subsequent changes in fair value for such time as they were liabilities in nature. These awards were exchanged for awards determined to be equity classification on January 1, 2014. As such there will be no additional expense associated with these options and the accrued liability of $246, which was classified as a stock based compensation liability, was reclassified to additional paid-in capital.
| Activity for the nine months ended September 30, 2014 | ||||||||||||||||
| Balance December 31, 2013 |
Expense | Equity Award Exchange |
Balance September 30, 2014 |
|||||||||||||
| Workforce — related |
$ | 246 | $ | — | $ | (246 | ) | $ | — | |||||||
|
|
|
|
|
|
|
|
|
|||||||||
| $ | 246 | $ | — | $ | (246 | ) | $ | — | ||||||||
|
|
|
|
|
|
|
|
|
|||||||||
| Activity for the nine months ended September 30, 2013 | ||||||||||||||||
| Balance December 31, 2012 |
Expense | Utilization | Balance September 30, 2013 |
|||||||||||||
| Workforce — related |
$ | 198 | $ | 23 | $ | (22 | ) | $ | 199 | |||||||
|
|
|
|
|
|
|
|
|
|||||||||
| $ | 198 | $ | 23 | $ | (22 | ) | $ | 199 | ||||||||
|
|
|
|
|
|
|
|
|
|||||||||
F-47
Table of Contents
| 6. | PROPERTY, PLANT AND EQUIPMENT |
Property, plant and equipment at September 30, 2014 and December 31, 2013 consist of:
| September 30, 2014 |
December 31, 2013 |
|||||||
| Leasehold improvements |
$ | 66 | $ | 30 | ||||
| Machinery and equipment |
1,854 | 1,710 | ||||||
| Patterns and tooling |
1,410 | 880 | ||||||
| Office furniture and equipment |
424 | 424 | ||||||
| Information technology equipment and software |
1,271 | 1,149 | ||||||
| Field service spare parts |
122 | 121 | ||||||
|
|
|
|
|
|||||
| 5,147 | 4,314 | |||||||
| Less accumulated depreciation |
(3,523 | ) | (2,900 | ) | ||||
|
|
|
|
|
|||||
| Total property, plant and equipment |
$ | 1,624 | $ | 1,414 | ||||
|
|
|
|
|
|||||
Depreciation expense was $623 and $631, for the nine months ended September 30, 2014 and 2013, respectively.
On December 12, 2013, the board of directors of the Company approved a plan to sell its corporate headquarters and production facility located at 29 Pitman Road, Barre, Vermont. The Company marketed such facility through a real estate broker which initially found three potential purchasers. The Company believes that effective December 12, 2013, the facility became an asset held for sale based upon the decision of the Company’s board of directors at such time, as well as meeting the other criteria in Accounting Standards Codification (“ASC”) 360-10-45-8, Impairment and Disposal of Long-Lived Assets – Other Presentation Matters – Long-Lived Assets Classified as Held for Sale. Therefore, the Company had classified the land, building, and building improvements as assets held for sale as of December 31, 2013. Based upon the marketing of the facility, the building was sold for $1,300. In June 2014, the sale transaction closed and the Company leased the facility back from the buyer for up to a five year term. The Company has the right to terminate the lease without penalty upon at least six months’ prior notice effective at the end of the second, third or fourth year of the lease term. As such the Company considers the lease to be an operating lease in accordance with ASC 840. The Company may relocate to other more suitable production and technology space within the state of Vermont or may remain in the Barre facility for some or all of the duration of the lease term. See Note 17: Commitments and Contingencies for further details on this topic.
| 7. | INTANGIBLE ASSETS |
Intangible assets consist of:
| September 30, 2014 | ||||||||||||||||
| Average Remaining Amortization Period |
Cost | Accumulated Amortization |
Net Carrying Amount End of Period |
|||||||||||||
| Core technology |
1.9 years | $ | 978 | $ | (649 | ) | $ | 329 | ||||||||
| Trade name |
2.9 years | 89 | (49 | ) | 40 | |||||||||||
|
|
|
|
|
|
|
|||||||||||
| $ | 1,067 | $ | (698 | ) | $ | 369 | ||||||||||
|
|
|
|
|
|
|
|||||||||||
| December 31, 2013 | ||||||||||||||||
| Average Remaining Amortization Period |
Cost | Accumulated Amortization |
Net Carrying Amount End of Year |
|||||||||||||
| Core technology |
2.7 years | $ | 978 | $ | (518 | ) | $ | 460 | ||||||||
| Trade name |
3.7 years | 89 | (40 | ) | 49 | |||||||||||
|
|
|
|
|
|
|
|||||||||||
| $ | 1,067 | $ | (558 | ) | $ | 509 | ||||||||||
|
|
|
|
|
|
|
|||||||||||
F-48
Table of Contents
Amortization expense was $140, for the nine months ended September 30, 2014 and 2013.
| 8. | DEBT AND SENIOR SECURED CONVERTIBLE NOTES |
Debt at September 30, 2014 and December 31, 2013 consists of:
| September 30, 2014 |
December 31, 2013 |
|||||||
| VEDA Barre, Vermont facility mortgage |
$ | — | $ | 346 | ||||
| ICC insurance premium loan |
— | 95 | ||||||
| Working capital revolving line of credit |
4,000 | — | ||||||
|
|
|
|
|
|||||
| Total debt |
4,000 | 441 | ||||||
| Less current portion |
(4,000 | ) | (141 | ) | ||||
|
|
|
|
|
|||||
| Long-term debt |
$ | — | $ | 300 | ||||
|
|
|
|
|
|||||
| Senior secured convertible notes, due June 30, 2014 |
$ | — | $ | 12,107 | ||||
|
|
|
|
|
|||||
Northern assumed mortgage debt with the Vermont Economic Development Authority (VEDA) related to a manufacturing facility in Barre, Vermont. The VEDA mortgage was a variable interest rate loan bearing interest of 3.75% as of December 31, 2013. The loan was collateralized by the Barre, Vermont property. The Company successfully completed a sale of the facility in June 2014 and used a portion of such proceeds to pay off the VEDA mortgage. There were no early payment penalties on the mortgage.
In February 2013, Northern entered into a one year renewal agreement for its foreign working capital revolving line of credit with Comerica Bank extending the maturity date to June 30, 2014. The renewal permitted Northern to borrow up to $4,000, with the available borrowing base being limited to the amount of collateral available at the time the line is drawn.
As of October 23, 2013, the Company increased its foreign working capital revolving line of credit with Comerica to $6,000 to support exports of its distributed-class turbines. Effective with the merger of Utility Scale into Northern at December 31, 2013, the Company’s foreign working capital line of credit was renegotiated with Comerica to allow for the combined business operations to be included.
The Company negotiated a revised credit facility prior to the maturity date in June 2014, whereby the Company renewed the existing foreign working capital revolving credit line with Comerica for the amount of $6,000 and extended the maturity date to June 30, 2015. The renegotiated loan agreement with Comerica contains a financial covenant which requires the Company to maintain unencumbered liquid assets having a value of at least $1,500 at all times.
At September 30, 2014, there was $4,000 outstanding on the revolving line of credit as well as an outstanding performance letter of credit guarantee of $1,000 issued to one customer and the Company had a net maximum supported borrowing base of $4,960. The Company was in compliance with all covenants under this credit facility in all periods.
The Company closed a $4,525 convertible note offering in April 2013, and then closed a further $2,000 convertible note offering in September 2013. In both the April and the September offerings, the notes were offered to existing shareholders. Upon the closing of the September offering, the shares of the Company’s formerly outstanding Series C-1 preferred stock held by investors participating in this note financing were converted into additional notes at the rate of one dollar face amount of convertible note for every three dollars in liquidation preference of Series C-1 preferred stock (Series A, B and C-2 preferred stock were not converted into notes). This non-cash conversion increased total convertible notes outstanding by an additional $5,250.
F-49
Table of Contents
The convertible notes bore interest at a rate of 6% per annum payable upon maturity or conversion to equity securities. The notes contained a provision by which the outstanding principal and accrued interest on these notes would automatically convert into equity securities issued by the Company in a subsequent “Qualified Financing” (defined as a future equity financing resulting in aggregate gross proceeds of at least $10,000 or any other future equity financing that is approved by the Company and holders of at least 60% of the aggregate principal amount of the convertible notes) at the same price at which the shares issued in the qualified financing are sold. Such a Qualified Financing occurred April 16, 2014 as described in Note 10, Capital Structure. In the event the notes were not converted, as outlined above, the principal balance along with any accrued interest would have become due and payable on June 30, 2014. The convertible notes were collateralized by a pledge of the capital stock of Northern and certain intellectual property of Northern. The Company determined that the embedded equity-linked component did not contain a net settlement provision as defined by ASC 815-10-15-00 and therefore, did not meet the definition of a derivative under ASC 815-10-15-83. As a result, under the guidance from ASC 815-15-25-1 the Company was not required to separate the equity-linked component from the debt host. These convertible notes had the characteristics of conventional debt described in ASC 470-20 as follows: (1) the conversion feature is settled in shares; (2) there is an absence of a cash conversion feature; (3) the note holders cannot obtain shares at below market price; and (4) the issuer must deliver shares upon conversion. Therefore, the Company accounted for these notes as traditional debt recorded at face value upon issuance. Due to the “Qualified Financing” reverse takeover transaction, these notes were converted to equity in April 2014, and have therefore been reclassified to long-term on the accompanying condensed consolidated balance sheet as of December 31, 2013.
| 9. | ACCRUED EXPENSES |
Accrued Expenses at September 30, 2014 and December 31, 2013 consist of:
| September 30, 2014 |
December 31, 2013 |
|||||||
| Accrued warranties |
$ | 1,590 | $ | 545 | ||||
| Rebates, allowances and discounts |
1,056 | 12 | ||||||
| Other accrued expenses |
1,500 | 1,601 | ||||||
|
|
|
|
|
|||||
| Total accrued expenses |
$ | 4,146 | $ | 2,158 | ||||
|
|
|
|
|
|||||
A summary of warranty accrual activity for the nine months ended September 30, 2014 is as follows:
| Nine months ended September 30, |
||||
| 2014 | ||||
| Balance as of December 31, 2013 |
$ | 545 | ||
| Provisions, net of reversals |
1,535 | |||
| Settlements |
(490 | ) | ||
|
|
|
|||
| Balance as of September 30, 2014 |
$ | 1,590 | ||
|
|
|
|||
| 10. | CAPITAL STRUCTURE |
Reverse Take Over Transaction — On April 16, 2014, WPHI consummated the Merger with NPS Corp. (formerly Mira III). Under the Merger Agreement, WPHI exchanged 12,840,187 its shares of common shares, constituting all of its outstanding shares for NPS Corp. common shares. As a result, holders of WPHI stock received 3,946,701 voting common shares and 8,893,486 class B restricted voting common shares which are convertible into voting common shares on a one-for-one basis at the option of the holder thereof at any time after July 15, 2014. During the third quarter 3,421,125 of class B restricted voting common shares were converted into the same number of voting common shares. At the time of the transaction Mira III had 359,375 common shares outstanding which were exchanged on a one-for-one basis for the same number of voting common shares of NPS
F-50
Table of Contents
Corp. WPHI’s Senior Secured Convertible Notes with a carrying value of $12,320 were converted into 1,016,534 voting common shares and 2,368,221 class B restricted voting common shares. Finally, the outstanding stock options held by former directors and officers of Mira III and a placement agent from Mira III’s initial public offering were split into 43,125 options.
Since the shareholders of WPHI received the majority of the voting shares of NPS Corp., the Merger was accounted for as a RTO whereby WPHI was the accounting acquirer (legal acquiree) and NPS Corp. was the accounting acquiree (legal acquirer) under reverse takeover accounting. The net assets of the combined entity have been included in the balance sheet at September 30, 2014. The statements of operations include the operations of the accounting acquirer for the periods presented and the operations of the legal acquirer from the date of the Merger. NPS Corp. has no stated par on its common shares and as such, all of the stated capital value of NPS Corp. and Mira III is presented as the resulting common share value of $133,963 in the caption “effect of reverse takeover” on the shareholder equity (deficiency) statement, and was reclassified into common share value. The remaining additional Paid-in Capital (“APIC”) included the accumulation of stock based compensation expense and the difference between the consideration issued to the Mira III shareholders and Mira III’s net liabilities acquired of $1,410. The Company recorded the assets and liabilities of Mira III as follows:
Net assets of Mira III:
| Prepaids |
$ | 4 | ||
| Accounts payable and accrued liabilities |
(106 | ) | ||
|
|
|
|||
| Net liabilities acquired |
(102 | ) | ||
| Consideration paid- Mira III stock at fair value |
1,308 | |||
|
|
|
|||
| Reduction in APIC |
$ | (1,410 | ) | |
|
|
|
Private Placement — The Company completed a private placement on April 16, 2014, issuing 6,125,000 shares of no stated par value voting common shares at price per share of $3.64 for total gross proceeds, before placement commissions and expenses, of $22,273. The placement agent received cash commissions equal to 6% of the gross proceeds. Such commissions equaled $1,522 and were charged against the gross proceeds. The placement agent also received stock options to purchase the Company’s common shares equal to 6% of shares (or 367,500 options) sold in the offering. Such stock options had a fair value of $620 and were fully vested as of April 16, 2014. Each option has an exercise price of $3.64 per share and is exercisable for two years. In calculating the value of the stock options with the Black-Scholes model, the Company assumed (i) a risk free rate equal to the rate of the two year treasury prevailing at April 16, 2014, (ii) a volatility of 87.0%, the average of a set of guideline companies determined to be representative of the Company at that time, and (iii) an expected term of two years. The Company charged $1,128 of direct legal, accounting and printing fees to the gross proceeds.
New Capital Structure
Common Shares-No Par — In connection with the RTO the Company’s resulting authorized capital consists of an unlimited number of voting common shares and an unlimited number of class B restricted voting shares. As of September 30, 2014, there were 14,893,981 voting common shares issued and outstanding and 7,840,582 class B restricted voting shares issued and outstanding. The class B restricted voting shares are convertible into voting common shares on a one-for-one basis at the option of the holder thereof at any time after July 15, 2014. The holders of the class B restricted voting shares are entitled to receive notice of and to attend all meetings of the Company’s shareholders and to vote on all matters properly presented at any such meeting, provided that the holders of the class B restricted voting shares are not entitled to vote for the election or removal of the Company’s directors. On November 20, 2014 the Company exercised its option to convert all outstanding Class B shares to common shares, effective November 30. 2014.
F-51
Table of Contents
2014 Reverse Stock Split — In conjunction with but prior to the reverse takeover transaction disclosed above, on April 16, 2014, each of the 20,000,075 shares of WPHI common shares issued and outstanding were automatically combined, reclassified and changed into 0.6420084 of one fully paid and non-assessable share of common shares resulting in a post-split total of 12,840,187 shares, without any action on the part of the holder thereof. All shares of common shares issued to any shareholder (including as a result of the conversion of senior secured convertible notes into common shares) were aggregated for the purpose of determining the number of shares of common shares to which such holder was entitled to receive. The effect of this transaction was retrospectively applied to the financial statements presented in this filing, as required by the SEC’s Staff Accounting Bulletin (“SAB”) 4c. As a result, all share and per share data have been retroactively adjusted to give effect to this reverse stock split.
The accounting effect of the 2014 reverse stock split resulted in the par value per share of the Company’s common shares being the same after the reverse stock split. On the effective date, the stated capital on the Company’s consolidated balance sheet attributable to common shares was reduced and the additional paid-in-capital account was increased by the amount of the stated capital reduction.
Capital Structure Prior to the RTO
2013 Stock Split — On August 28, 2013, the board of directors approved the conversion of all outstanding Series A, B and C-2 preferred stock to common shares and a subsequent 1 for 11.6087 reverse split of the Company’s outstanding common shares. The Board also approved recommending that the Company’s shareholders approve amendments to the Company’s Certificate of Incorporation to effect such activities. The Company’s shareholders approved these amendments by written consent dated September 10, 2013. The split shares were effective on September 16, 2013. Relevant financial data has been retroactively adjusted in these financial statements to reflect the 1 for 11.6087 reverse stock-split.
2013 Recapitalization — As presented in Note 8, Debt and Senior Secured Convertible Notes, the Company closed two offerings of convertible notes during 2013. Investors in the September offering also were issued an aggregate of approximately 6.4 million shares of common shares. Upon the closing of this offering, the shares of the Company’s formerly outstanding Series C-1 preferred stock held by investors participating in this note financing were converted into additional notes at the rate of one dollar face amount of convertible note for every three dollars in liquidation preference of Series C-1 preferred stock. This non-cash conversion increased total convertible notes outstanding by an additional $5,250. The convertible notes bore interest at a rate of 6% per annum payable upon maturity at June 30, 2014 or conversion to equity securities. These notes were set up to automatically convert into equity securities issued by the Company in a subsequent “Qualified Financing” (defined as a future equity financing resulting in aggregate gross proceeds of at least $10,000 or any other future equity financing that is approved by the Company and holders of at least 60% of the aggregate principal amount of the convertible notes). Simultaneously with the convertible note offering described above, all outstanding shares of Series A, Series B and Series C-2 preferred stock, together with all accumulated dividends thereon, were converted into common shares based on an enterprise value of $50,000.
Preferred Stock — Prior to the completion of the RTO, WPHI had 6,000,000 authorized shares of Preferred Stock, of which 3,000,000 were designated as Series X-1 Preferred Stock (“Series X-1 preferred stock”), and 3,000,000 were designated as Series X-2 Preferred Stock (“Series X-2 preferred stock” and together with the Series X-1 preferred stock, the “Series X preferred stock”). Such preferred stock was canceled as part of the completion of the reverse takeover transaction as explained above.
Series A Preferred Stock — WPHI had issued 3,540,000 shares of Series A preferred stock and 14,683 shares of common shares to the founding investors in August 2008 for cash consideration of $17,700, all of which were converted in 2013 to common shares as described above in the section 2013 Recapitalization.
Series B Preferred Stock — WPHI had issued 7,286,232 shares of Series B preferred stock in October and November 2009, at a face amount of $6.00 per share, for aggregate cash consideration of $43,532, net of issuance
F-52
Table of Contents
costs of $185. WPHI had issued an additional 2,121,707 shares of Series B preferred stock in December 2010 for aggregate cash consideration of $12,730 under the same terms as the 2009 offering. All of such Series B Preferred Stock was converted in 2013 to common shares as described above in the section 2013 Recapitalization.
Series C Preferred Stock — In August 2011, WPHI sold units consisting of one share of Series C-1 preferred stock and a warrant to purchase four shares of Series C-2 preferred stock at an exercise price of $0.50 per share. The price per unit was $6.30. WPHI issued 1,608,322 shares of Series C-1 preferred stock, at a face amount of $6.30 per share, and warrants to purchase 6,433,288 shares of Series C-2 preferred stock (the “Warrants”) for aggregate cash consideration of $10,016, net of issuance costs of $115. All of such Series C-1, C-2 and Warrants were converted to common shares or convertible notes as described above in the section 2013 Recapitalization and Note 8 Debt and Senior Secured Convertible Notes.
Series X Preferred Stock — The Series X-1 preferred stock was reserved for holders of options to purchase common shares of Northern, restricted stock units to acquire common shares of Northern, or common shares of Northern issued under Northern’s 2011 Stock Option and Grant Plan. The Series X-2 preferred stock was reserved for holders of options to purchase common shares of Utility Scale, restricted stock units to acquire common shares of Utility Scale, or common shares of Utility Scale issued under Utility Scale’s 2011 Stock Option and Grant Plan. As a result of the termination of these stock option plans in connection with the option exchange offer described in Note 11, the Company will not be issuing any shares of Series X-1 or X-2 preferred stock. Such stock expired as of April 16, 2014.
Dividend Restrictions — The Comerica line of credit prohibits the payment of any dividends without obtaining Comerica’s prior written consent.
Common Shares — Prior to the completion of the RTO, WPHI had authorized 44,000,000 shares of common shares, par value $0.01 per share. None of these shares were outstanding at September 30, 2014 as a result of the RTO.
Investors’ Rights Agreement — In August 2013, certain of WPHI’s investors entered into a Fourth Amended and Restated Investors’ Rights Agreement providing such investors with certain registration and other investment rights at any time prior to the termination of the agreement. The Investors’ Rights Agreement was amended and restated on the closing of the reverse takeover transaction to provide certain former security holders of WPHI (the “Rights Holders”) or their permitted transferees with registration rights under the Securities Act of 1933, as amended, of certain common shares of the Company held by them. These rights include demand registration rights, short-form registration rights and piggyback registration rights. All fees, costs and expenses of underwritten registrations will be borne by the Company and all selling expenses, including underwriting discounts and selling commissions, will be borne by the holders of the shares being registered. The rights under the Investors’ Rights Agreement shall only become effective upon the listing of the Company’s shares on a U.S. national securities exchange. Rights Holders which hold at least 50% of the shares covered by the agreement have the right to require the Company to list the common shares on a U.S. national securities exchange at any time after December 31, 2015.
Voting Agreement — Investors in WPHI previously were party to a Fourth Amended and Restated Voting Agreement providing certain board representation rights, a drag-along right, as well as a right of first refusal and co-sale right in the event shareholders proposed to transfer WPHI stock while the Voting Agreement was in effect. The Voting Agreement was terminated on the closing of the reverse takeover transaction as described above.
| 11. | STOCK BASED COMPENSATION AND EMPLOYEE BENEFIT PLANS |
2008 Equity Incentive Plan — In October 2008, WPHI adopted the 2008 Equity Incentive Plan (the “2008 Plan”). The 2008 Plan provided for the grant of incentive stock options, non-statutory stock options, and other
F-53
Table of Contents
types of stock awards to employees, consultants, and directors of the Company. The 2008 Plan, as amended in 2010, has reserved for issuance upon grant or exercise of awards up to 55 adjusted shares of the Company’s common shares. As described below, in April 2014 all outstanding options were converted on a value-for-value basis to options in the 2014 NPS Corp Plan.
2011 Subsidiary Stock Option and Grant Plans — In August 2011, the Company’s two then operating subsidiaries adopted new plans. As such, Northern adopted the Northern Power Systems, Inc. 2011 Stock Option and Grant Plan (the “Northern 2011 Plan”) and Utility Scale adopted the Northern Power Systems Utility Scale, Inc. 2011 Stock Option and Grant Plan (the “Utility Scale 2011 Plan,” and together with the Northern 2011 Plan, the “Subsidiary Plans”). The Subsidiary Plans provided for the grant of incentive stock options, non-statutory stock options, and other types of stock awards to employees, consultants, and directors of the Company. The Subsidiary Plans each reserved for issuance upon grant or exercise of awards up to 3,000,000 shares of such subsidiary’s common shares. In addition, 3,000,000 shares of each Series X-1 and Series X-2 of the Company’s preferred stock had been reserved, respectively, for issuance upon exercise of the respective Subsidiary Plans’ options in the event of certain potential liquidation events of the Company. Based upon the provisions of the Subsidiary Plans’ option exercises into the Company’s preferred stock, the Company had determined that these options should be accounted for as liability classified awards.
2013 Stock Option and Grant Plan — In November 2013, WPHI adopted the Wind Power Holdings, Inc. 2013 Stock Option and Grant Plan (the “2013 WPHI Plan”). This plan provided for the grant of incentive stock options, non-statutory stock options, and other types of stock awards to employees, consultants and directors of the Company. 2,568,034 shares of WPHI common shares were authorized for issuance under the 2013 WPHI Plan. The Company reviewed the guidance at ASC 718 and had classified the grants as equity awards.
In connection with the adoption of the 2013 WPHI Plan, the board of directors and shareholders of WPHI authorized the termination of the Wind Power Holdings, Inc. 2008 Equity Incentive Plan, the Northern Power Systems, Inc. 2011 Stock Option and Grant Plan, and the Northern Power Systems Utility Scale, Inc. 2011 Stock Option and Grant Plan, to be effective upon completion of certain exchange offers and recapitalizations. Options which were outstanding under the Wind Power Holdings, Inc. 2008 Equity Incentive Plan would remain outstanding under the terms of the applicable option agreements and such plan, but no further grants would be made under such plan. Options which were outstanding under the Northern Power Systems, Inc. 2011 Stock Option and Grant Plan, and the Northern Power Systems Utility Scale, Inc. 2011 Stock Option and Grant Plan and not tendered for exchange by the holders thereof were automatically converted to options to purchase WPHI common shares under the 2013 WPHI Plan as part of the merger of Utility Scale into Northern and the recapitalization of Northern.
The Company calculates the fair value of stock-based payment awards on the date of grant for equity awards and as of each reporting period for liability awards until a measurement date is established for such awards. The value of the portion of the award that is ultimately expected to vest is recognized as expense over the requisite service periods. Option pricing model input assumptions such as expected term, expected volatility, risk-free interest rate, dividend rate, and the fair value of the Company’s or, as applicable, the Subsidiary’s common shares impact the fair value estimate. Further, the forfeiture rate impacts the amount of aggregate compensation. These assumptions are subjective and generally require significant analysis and judgment to develop. The Company uses the simplified method for estimating expected term representing the midpoint between the vesting period and the contractual term. The Company estimates volatility based on the historical volatility of a peer group of publicly-traded companies. The risk-free interest rate is the implied yield currently available on U.S. treasury zero-coupon issues with a term equal to the expected vesting term. Estimated forfeitures are adjusted over the requisite service period based on the extent to which actual forfeitures differ from estimated forfeitures.
Effective on January 1, 2014, all options in the Subsidiary Plans automatically converted to options in the 2013 WPHI Plan on a value-for-value basis. At such time the Company considered the modification of such awards in accordance with ASC 718 and concluded that such transaction modified the Subsidiary Plan awards from liability
F-54
Table of Contents
accounting to equity treatment in nature. As such, as of such date, the measurement date for these awards was established and they would be accounted for as equity awards on a prospective basis. Awards that had originally been issued under the 2008 Plan, exchanged into options under the Subsidiary Plans, and then to the 2013 WPHI Plan, retained their original grant date fair value for purposes of calculating share-based compensation expense. The comparison of the fair value of the awards immediately before and after the modification resulted in the determination that no additional compensation expense was realized. Effective at such time the Company reclassified any values presented as liabilities for stock-based compensation to additional paid-in capital.
In November 2013 option holders of the Subsidiary Plans were granted an offer to exchange their awards for awards in the 2013 WPHI Plan receiving a lesser number of options than they would have received on the value-for-value basis, but at a lower exercise price as had been established in November 2013. Such exchange closed on January 28, 2014, and option holders who did not accept the exchange retained the value-for-value options that had converted on January 1, 2014. At such time the Company considered the fair value of such awards immediately before and after the closing of such exchange and determined that there was no additional compensation expense.
In March 2014, the Toronto Stock Exchange (“TSX”) informed the Company that it would be required to reprice the options issued in January 2014 upon completion of the option exchange described above, so that the exercise price for such options would be equal to the price per equity security sold in the private placement. The board of directors of the Company determined effective the end of March 2014 that it would reprice these options as required by the TSX and as permitted by the option exchange documents, but would not modify the number of shares issued to employees. The Company considered the fair value of such awards immediately before and after such repricing and determined that there was no additional compensation expense.
Immediately prior to the conversion described below, the Company had reserved 2,568,089 shares of common shares collectively in the 2008 Equity Incentive Plan and the 2013 WPHI Plan for both future exercise of outstanding stock options and shares available for future option grants. As described above, in April 2014 all outstanding options were converted on a value-for-value basis to options in the 2014 NPS Corp Plan.
2014 Northern Power Systems Corp. Stock Option and Incentive Plan — In April 2014 and as a result of the reverse takeover transaction, the Company adopted the Northern Power Systems Corp. 2014 Stock Option and Incentive Plan (the “2014 NPS Corp Plan”) which reserved 4,000,000 shares of the Company’s voting common shares for both future exercise of outstanding stock options and shares available for future outstanding grants. All options in the 2013 WPHI Plan and the 2008 Equity Incentive Plan were converted on a value-for-value basis to options in the 2014 NPS Corp plan. All other relevant terms and conditions remained the same. At such time the Company considered the modification of such awards in accordance with ASC 718 and concluded that such transaction did not result in additional compensation expense. The Company is accounting for grants under the 2014 NPS Corp Plan as equity awards.
F-55
Table of Contents
A summary of the stock option activity under the 2014 NPS Corp Plan for the nine months ended September 30, 2014 is as follows:
| Shares | Weighted- Average Exercise Price |
Average Remaining Weighted Contractual (in Years) |
Aggregate Intrinsic Value |
|||||||||||||
| Outstanding — December 31, 2013 |
— | — | — | — | ||||||||||||
| Assumed in reverse takeover |
1,830,012 | $ | 1.78 | |||||||||||||
| Granted |
250,500 | $ | 3.95 | |||||||||||||
| Exercised |
(18,059 | ) | $ | 1.59 | ||||||||||||
| Canceled |
(4,643 | ) | $ | 2.92 | ||||||||||||
|
|
|
|||||||||||||||
| Outstanding — September 30, 2014 |
2,057,810 | $ | 2.05 | 5.97 years | $ | 3,257 | ||||||||||
|
|
|
|||||||||||||||
| Exercisable — September 30, 2014 |
933,491 | $ | 2.30 | 5.67 years | $ | 1,270 | ||||||||||
|
|
|
|||||||||||||||
| Shares vested and expected to vest September 30, 2014 |
1,928,634 | $ | 2.06 | 5.95 years | $ | 3,034 | ||||||||||
|
|
|
|||||||||||||||
The aggregate intrinsic value in the table above represents the difference between the fair value of common shares and the exercise price of outstanding, in-the-money, stock options.
The weighted average grant-date fair value of options granted under the 2014 NPS Corp Plan at the grant date was $2.34 per share. At September 30, 2014, unrecognized stock-based compensation expense related to non-vested stock options is $1,233 which is expected to be recognized over the weighted average remaining vesting period of 2.2 years.
The Company estimated the grant-date fair values of stock options granted during the nine months ended September 30, 2014, using the Black-Scholes option pricing model and the following assumptions:
| 2014 | ||
| Expected volatility |
77.0% – 83.0% | |
| Risk-free interest rate |
1.05% – 1.54% | |
| Expected life (years) |
3.5 – 4.5 | |
| Dividend yield |
0.0% |
The Company recognizes stock-based compensation expense on a straight-line basis over the requisite service period. The forfeiture rate was 10% for the nine months ended September 30, 2014. Stock-based compensation expense, a non-cash expense, is included in each respective expense category as follows, for the nine months ended September 30, 2014 and 2013:
| Nine months ended September 30, |
||||||||
| 2014 | 2013 | |||||||
| Cost of revenue |
$ | 72 | $ | 29 | ||||
| Sales and marketing |
68 | 12 | ||||||
| Research and development |
— | 37 | ||||||
| General and administrative |
606 | 186 | ||||||
|
|
|
|
|
|||||
| Total stock-based compensation expense |
746 | 264 | ||||||
| Restructuring |
— | 23 | ||||||
|
|
|
|
|
|||||
| $ | 746 | $ | 287 | |||||
|
|
|
|
|
|||||
F-56
Table of Contents
In 2012, the Company modified options held by certain executives as part of separation agreements to fully vest such options as well as extend the contractual terms. For the nine months ended September 30, 2013, the Company recognized an additional restructuring expense of $23, reflecting the change in fair value of such options. Such options were converted to WPHI options on January 1, 2014 and are accounted for as equity awards. As such, there will be no additional expense associated with these options.
Mira III Stock Option Awards — The former officers and directors of Mira III had 35,938 stock options fully vested as of April 16, 2014 which provide the option to purchase shares of the Company’s common shares at an exercise price of CDN$3.48 per share during a one year period ending on April 16, 2015. A placement agent from a previous offering had also been granted options to purchase 7,187 Mira III common shares which were exercised in April 2014 at an exercise price of CDN$3.48 per share. A summary of the former officers and directors of Mira III option activity for the nine months ended September 30, 2014 is as follows:
| Shares | Weighted- (CDN) |
Average Remaining Weighted average Contractual Term (in Years) |
Aggregate Intrinsic Value (USD) |
|||||||||||||
| Outstanding — December 31, 2013 |
— | — | — | — | ||||||||||||
| Assumed in Reverse Takeover |
43,125 | $ | 3.48 | 1 Year | — | |||||||||||
| Granted |
— | |||||||||||||||
| Exercised |
(7,187 | ) | $ | 3.48 | ||||||||||||
| Canceled |
— | |||||||||||||||
|
|
|
|||||||||||||||
| Outstanding — September 30, 2014 |
35,938 | $ | 3.48 | .6 Years | $ | 11 | ||||||||||
|
|
|
|||||||||||||||
| Exercisable — September 30, 2014 |
35,938 | $ | 3.48 | .6 Years | $ | 11 | ||||||||||
|
|
|
|||||||||||||||
| Shares vested and expected to vest September 30, 2014 |
35,938 | $ | 3.48 | .6 Years | $ | 11 | ||||||||||
|
|
|
|||||||||||||||
| 12. | 401(k) PLAN |
The Company has a defined contribution plan covering substantially all of its employees, subject to certain eligibility requirements. Under the plan, participating employees may defer up to 15% of their pre-tax compensation, as defined. The Company contributes 50% of the amount contributed by a participating employee, up to a maximum of 6% of the participant’s pre-tax compensation. Company matching contributions for the nine months ended September 30, 2014 and 2013 were $145 and $133, respectively.
| 13. | INCOME TAXES |
For the nine months ended September 30, 2014, the Company recorded income tax expense of $441, which is comprised of $431 current expense and $10 deferred expense. For the nine months ended September 30, 2013, the Company recorded income tax expense of $13, which is comprised of $2 current expense and $11 deferred expense.
For the nine months ended September 30, 2014 the current income tax expense included approximately $400 of foreign tax expense related to Brazilian withholding taxes. Such taxes are applicable to licensing, technology services and royalty revenues earned within Brazil. The tax rate for such taxes is between 15% -18% and is based upon the character of the revenue and the jurisdiction of where it was earned.
As of December 31, 2013, the Company had $110,512 of federal net operating loss carryforwards that expire beginning in 2028, $72,307 of state net operating loss carryforwards that expire from 2014 through 2034, and $1,196 of research and development tax credits that expire beginning in 2028. The amount of the net operating loss and research and development tax credit carryforwards that may be utilized annually to offset future taxable
F-57
Table of Contents
income and tax liability may be limited as a result of certain ownership changes pursuant to Section 382 of the Internal Revenue Code. The Company has not completed a study to assess whether there have been one or more ownership changes since its inception due to the costs and complexities associated with such a study.
Income taxes are accounted for under the asset and liability method. Deferred tax assets and liabilities are recognized for the future tax consequences attributable to differences between the financial statement carrying amounts of existing assets and liabilities and their respective tax bases and operating loss and tax credit carryforwards. Deferred tax assets and liabilities are measured using enacted tax rates expected to apply to taxable income in the years in which those temporary differences are expected to be recovered or settled. A valuation allowance is established for any deferred tax asset for which realization is not more likely than not.
The Company recognizes in its consolidated financial statements only those tax positions that are “more likely than not” of being sustained upon examination by taxing authorities, based on the technical merits of the position. As of September 30, 2014, there are no uncertain tax positions. In addition, there are no amounts required to be included in the financial statements for interest or penalties on uncertain tax positions.
| 14. | RELATED-PARTY TRANSACTIONS |
In 2013, the Company issued convertible notes to Rockport Capital Partners, Allen & Company, LLC and CWE LLC. These notes were valued collectively at $8,399 which consisted of $4,765 in cash and $3,634 in non-cash ascribed to the conversion of the Series C-1 preferred shares (see Note 8: Debt and Senior Secured Convertible Notes). In connection with the private placement on April 16, 2014, such notes were automatically converted into 629,061 voting common shares and 1,678,786 class B restricted voting common shares in accordance with the terms of the notes. Interest expense related to such notes was $62 and $105 for the nine months ended September 30, 2014 and 2013, respectively.
| 15. | SEGMENT REPORTING |
The Company’s segments are defined as components of the enterprise about which separate financial information is available that is evaluated regularly by the chief operating decision maker in deciding how to allocate resources and in assessing performance.
The performance of the segments is evaluated based upon several factors, of which the primary financial measures are segment revenues, gross profits and loss from operations. The disaggregated financial results of the segments reflect the allocation of certain functional expense categories consistent with the basis and manner in which management internally disaggregates financial information for the purpose of assisting in making internal operating decisions. In addition, certain expenses and other shared costs which management does not believe are specifically and directly attributable or allocable to any of the business segments have been excluded from the presented segment contribution margins. The accounting policies of the business segments are the same as those for the consolidated Company. The Company assigns revenues to individual countries based on the customer’s shipment location.
The Company manages its business with the four following segments:
| • | Product Sales and Service — Included in this business segment are the Company’s sales of distributed turbines along with related services, other products produced and sold to customers, as well as, in the future the Company’s direct sales of utility-class turbines. |
| • | Technology Licensing — Included in this business segment is the licensing of packages of the Company’s developed technology. |
| • | Technology Development — Included in this business segment is the Company’s development of technology for customers. |
F-58
Table of Contents
| • | Shared services — These costs and expenses are comprised mainly of the general and administrative departments including executive, finance and accounting, legal, human resources, and information technology support, as well as certain shared engineering, and in certain circumstances, sales and marketing activities. |
Unallocated costs and expenses include depreciation and amortization, stock-based compensation and certain other non-cash charges, such as restructuring and impairment charges.
Revenue by business segment is as follows:
| For the nine months ended September 30, |
||||||||
| 2014 | 2013 | |||||||
| Product Sales and Services |
$ | 38,954 | $ | 11,078 | ||||
| Technology Licensing |
2,541 | — | ||||||
| Technology Development |
1,063 | 522 | ||||||
|
|
|
|
|
|||||
| Total |
$ | 42,558 | $ | 11,600 | ||||
|
|
|
|
|
|||||
Income (loss) from operations for the business segments and unallocated costs and expenses are as follows:
| For the nine months ended September 30, |
||||||||
| 2014 | 2013 | |||||||
| Product Sales and Services |
$ | 841 | $ | (2,448 | ) | |||
| Technology Licensing |
1,445 | (1,392 | ) | |||||
| Technology Development |
793 | 317 | ||||||
| Shared Services |
(6,102 | ) | (4,641 | ) | ||||
| Unallocated costs and expenses |
(1,742 | ) | (989 | ) | ||||
|
|
|
|
|
|||||
| Income (loss) from operations |
$ | (4,765 | ) | $ | (9,153 | ) | ||
|
|
|
|
|
|||||
Unallocated cost and expenses consist of:
| For the nine months ended September 30, |
||||||||
| 2014 | 2013 | |||||||
| Depreciation and amortization |
$ | (763 | ) | $ | (771 | ) | ||
| Stock-based compensation expenses |
(746 | ) | (264 | ) | ||||
| Noncash restructuring charges |
— | (23 | ) | |||||
| Other |
(233 | ) | 69 | |||||
|
|
|
|
|
|||||
| Total |
$ | (1,742 | ) | $ | (989 | ) | ||
|
|
|
|
|
|||||
Total business segment assets are as follows:
| September 30, 2014 | December 31, 2013 | |||||||
| Product Sales and Services |
$ | 25,817 | $ | 17,583 | ||||
| Technology Licensing |
653 | 1,059 | ||||||
| Technology Development |
111 | 274 | ||||||
| Shared Services |
176 | 290 | ||||||
| Unallocated assets |
16,273 | 8,339 | ||||||
|
|
|
|
|
|||||
| Total |
$ | 43,030 | $ | 27,545 | ||||
|
|
|
|
|
|||||
F-59
Table of Contents
Unallocated assets consist of the following:
| September 30, 2014 | December 31, 2013 | |||||||
| Cash |
$ | 15,956 | $ | 4,236 | ||||
| Other current assets |
— | 372 | ||||||
| Property, plant and equipment, net |
36 | 47 | ||||||
| Deferred tax assets |
281 | 2,384 | ||||||
| Asset held for sale |
— | 1,300 | ||||||
|
|
|
|
|
|||||
| Total |
$ | 16,273 | $ | 8,339 | ||||
|
|
|
|
|
|||||
Geographic information about revenue, based on shipments and/or services to customers by region, is as follows:
| For the nine months ended September 30, |
||||||||
| 2014 | 2013 | |||||||
| United States |
$ | 5,048 | $ | 3,576 | ||||
| United Kingdom |
15,865 | 4,074 | ||||||
| Italy |
13,914 | 3,600 | ||||||
| Brazil |
6,269 | — | ||||||
| Asia |
1,406 | — | ||||||
| Rest of the world |
56 | 350 | ||||||
|
|
|
|
|
|||||
| Total |
$ | 42,558 | $ | 11,600 | ||||
|
|
|
|
|
|||||
For the nine months ended September 30, 2014 and 2013, 88% and 69% of revenues, respectively, were recognized from sales outside the U.S.
Geographic information about long-lived assets associated with particular regions is as follows:
| September 30, 2014 |
December 31, 2013 |
|||||||
| United States |
$ | 2,497 | $ | 3,865 | ||||
| Rest of the world |
218 | 80 | ||||||
|
|
|
|
|
|||||
| Consolidated Total |
$ | 2,715 | $ | 3,945 | ||||
|
|
|
|
|
|||||
| 16. | RECENT ACCOUNTING PRONOUNCEMENTS |
In April 2014, the FASB issued Accounting Standards Update No. 2014-08, Presentation of Financial Statements (Topic 205) and Property, Plant and Equipment (Topic 360): Reporting Discontinued Operations and Disclosures of Disposals of Components of an Entity (“ASU 2014-08”), which raises the threshold for a disposal to qualify as a discontinued operation and requires new disclosures of both discontinued operations and certain other disposals that do not meet the new definition of a discontinued operation. It also allows an entity to present a discontinued operation even when it has continuing cash flows and significant continuing involvement with the disposed component. The amendments in ASU 2014-08 are effective prospectively for disposals (or classifications as held for sale) of components of an entity that occur within annual periods beginning on or after December 15, 2014, and interim periods within those years. Early adoption is permitted but only for disposals (or classifications as held for sale) that have not been reported in financial statements previously issued or available for issuance. The impact of the adoption of this ASU on the Company’s results of operations, financial position, cash flows and disclosures will be based on its future disposal activity.
In May 2014, the FASB issued Accounting Standards Update No. 2014-09, Revenue from Contracts with Customers (Topic 606) (“ASU 2014-09”). The core principle of ASU 2014-09 is that an entity should recognize revenue to depict the transfer of promised goods or services to customers in an amount that reflects the
F-60
Table of Contents
consideration to which the entity expects to be entitled in exchange for those goods or services. To achieve that core principle, an entity should apply the following steps: identify the contract(s) with a customer; identify the performance obligations in the contract; determine the transaction price; allocate the transaction price to the performance obligations in the contract; and recognize revenue when (or as) the entity satisfies a performance obligation. ASU 2014-09 supersedes the revenue recognition requirements in Accounting Standards Codification Topic No. 605, Revenue Recognition, most industry-specific guidance throughout the industry topics of the accounting standards codification, and some cost guidance related to construction-type and production-type contracts. ASU 2014-09 is effective for public entities for annual periods and interim periods within those annual periods beginning after December 15, 2016. Early adoption is not permitted. Companies may use either a full retrospective or a modified retrospective approach to adopt ASU 2014-09. The Company is currently evaluating the potential impact of adopting this guidance on the consolidated financial statements.
In June 2014, the FASB issued Accounting Standards Update No. 2014-12, Accounting for Share-Based Payments When the Terms of an Award Provide That a Performance Target Could Be Achieved after the Requisite Service Period (“ASU 2014-12”). The amendments in ASU 2014-12 require that a performance target that affects vesting and that could be achieved after the requisite service period be treated as a performance condition. A reporting entity should apply existing guidance in Accounting Standards Codification Topic No. 718, Compensation — Stock Compensation (“ASC 718”), as it relates to awards with performance conditions that affect vesting to account for such awards. The amendments in ASU 2014-12 are effective for annual periods and interim periods within those annual periods beginning after December 15, 2015. Early adoption is permitted. Entities may apply the amendments in ASU 2014-12 either: (a) prospectively to all awards granted or modified after the effective date; or (b) retrospectively to all awards with performance targets that are outstanding as of the beginning of the earliest annual period presented in the financial statements and to all new or modified awards thereafter. The Company does not have any performance-based awards outstanding as of the reporting date. The Company is currently evaluating the potential impact of the adoption of this guidance on its consolidated financial statements; however, it does not expect there to be a material impact at this time.
In August 2014, the FASB issued Accounting Standards Update No. 2014-15, Presentation of Financial Statements — Going Concern (Subtopic 205-40): Disclosure of Uncertainties about an Entity’s Ability to Continue as a Going Concern (“ASU 2014-15”) which provides guidance on determining when and how to disclose going concern uncertainties in the financial statements. The new standard requires management to perform interim and annual assessments of an entity’s ability to continue as a going concern within one year of the date the financial statements are issued. An entity must provide certain disclosures if conditions or events raise substantial doubt about the entity’s ability to continue as a going concern. The ASU applies to all entities and is effective for annual periods ending after December 15, 2016, and interim periods thereafter, with early adoption permitted. The Company is currently evaluating the impact this accounting standard update may have on its financial statements.
| 17. | COMMITMENTS AND CONTINGENCIES |
On March 31, 2011, the Company entered into an agreement to provide maintenance and repair services for an expected fifteen or more utility-class wind turbines with a customer. This agreement obligated the Company to provide such services for up to a 12 year period. Since the Company anticipated multiple sales of utility-class wind turbines under this agreement it created a service infrastructure to support such a deployment. The Company, in fact, has only sold two prototype turbines to this customer resulting in a potential cost to perform this obligation being in excess of expected revenue sources. As a separately priced maintenance agreement, accounting for this contract is under ASC 460 Guarantees, which requires that the measurement of a guarantee liability be the fair value of the obligation at the reporting period. If the consideration of the fair value of an obligation results in the potential of a contingent loss, consideration of the probable and estimable criteria of ASC 450-20-25 is appropriate. Furthermore, for longer-term obligations, such as this, the Company considers the use of a discount factor in determining the estimated liability is appropriate. The agreement was renegotiated in April 2014 and the liability was reduced by $80 in the second quarter of 2014. The total liability related to this exposure, as of September 30, 2014, is $333 of which $54 is recorded as a current liability.
F-61
Table of Contents
In 2012, the Company was notified by the U.S. Department of Energy of audits of the Company’s incurred cost submissions associated with various contracts the Company has with the U.S. Department of Energy. The Defense Contract Audit Agency (“DCAA”) completed its audit of 2003 in November of 2013 and the outcome of this audit did not result in a cost to the Company. The DCAA is currently auditing the years 2004 through 2007 and an external independent audit firm is auditing 2010. These audits are in various stages of completion and although the Company received information requests from the auditors in 2012, substantive audit procedures did not begin until June 2013. During the third quarter of 2014 there was limited activity on the 2004 audit although there has been no audit activity related to any other year. Although the Company has not received formal notification that such audits are on hold, management believes that as of the date of these financial statements these audits have been delayed or placed on hold. Based upon the lack of activity on these audits, the Company does not have adequate information at the date of issuance of these financial statements to determine if the outcome of any of these remaining open audits will result in a cost to the Company.
The Company has entered into several operating lease agreements, primarily for the lease of office facilities, and office equipment, expiring through 2019. Rental expense under these operating lease arrangements for the nine months ended September 30, 2014 and 2013 was $132 and $147, respectively. As described in Note 6, Property, Plant and Equipment, the Company has leased its headquarters and production facility back from the buyer for a five year term. The Company can terminate the lease after two years without penalty. Therefore, only two years of rental expense are included in the table below.
Future minimum lease payments under noncancelable lease agreements (with initial or remaining lease terms in excess of one year) are as follows:
| As of September 30, 2014 | ||||
| 2014 |
$ | 137 | ||
| 2015 |
408 | |||
| 2016 |
202 | |||
| 2017 |
4 | |||
| 2018 |
4 | |||
| Thereafter |
2 | |||
|
|
|
|||
| Total |
$ | 757 | ||
|
|
|
|||
If the Company continues to lease the Barre facility after the two year cancellation period, it would have additional annual lease payment obligations of $201 in 2016, $345 in 2017, $345 in 2018 and $162 in 2019.
**********
F-62
Table of Contents
FORMERLY KNOWN AS WIND POWER HOLDINGS, INC.
SCHEDULE II — VALUATION AND QUALIFYING ACCOUNTS
(In thousands)
| Balance Beginning of Year |
Charged to Expense |
Write- Offs |
Recoveries | Balance End of Year |
||||||||||||||||
| Allowance for doubtful accounts receivable: |
||||||||||||||||||||
| Fiscal year ended December 31, 2013 |
$ | 22 | $ | 152 | $ | (23 | ) | $ | (48 | ) | $ | 103 | ||||||||
| Fiscal year ended December 31, 2012 |
$ | 329 | $ | (196 | ) | $ | (111 | ) | $ | — | $ | 22 | ||||||||
| Balance Beginning of Year |
Additions | Write- Offs |
Recoveries | Balance End of Year |
||||||||||||||||
| Deferred tax asset valuation allowance: |
||||||||||||||||||||
| Fiscal year ended December 31, 2013 |
$ | 46,024 | $ | 5,232 | $ | — | $ | — | $ | 51,256 | ||||||||||
| Fiscal year ended December 31, 2012 |
$ | 41,647 | $ | 4,377 | $ | — | $ | — | $ | 46,024 | ||||||||||
| Balance Beginning of Year |
Additions | Write- Offs |
Recoveries | Balance End of Year |
||||||||||||||||
| Inventory excess and obsolete reserve: |
||||||||||||||||||||
| Fiscal year ended December 31, 2013 |
$ | 1,454 | $ | 22 | $ | (913 | ) | $ | — | $ | 563 | |||||||||
| Fiscal year ended December 31, 2012 |
$ | 1,024 | $ | 430 | $ | — | $ | — | $ | 1,454 | ||||||||||
F-63
Table of Contents
NORTHERN POWER SYSTEMS CORP.
Common Shares
Prospectus
Needham & Company
| Craig-Hallum Capital Group | Northland Capital Markets | |
, 2015
Through and including , 2015 (the 25th day after the date of this prospectus), all dealers effecting transactions in these securities, whether or not participating in this offering, may be required to deliver a prospectus. This is in addition to a dealer’s obligation to deliver a prospectus when acting as an underwriter and with respect to an unsold allotment or subscription.
Table of Contents
PART II
INFORMATION NOT REQUIRED IN PROSPECTUS
| Item 13. | Other Expenses of Issuance and Distribution |
The expenses (other than underwriting discounts and commissions) incurred in connection with this offering are as follows:
| Amount | ||
| SEC registration fee |
$3,486 | |
| Financial Industry Regulatory Authority, Inc. fee |
$5,000 | |
| NASDAQ Capital Market fee |
$50,000 | |
| Toronto Stock Exchange fee |
$50,886 | |
| Accountants’ fees and expenses |
* | |
| Legal fees and expenses |
* | |
| Transfer Agent and registrar fees and expenses |
* | |
| Printing and engraving expenses |
* | |
| Blue sky qualification fees and expenses |
* | |
| Miscellaneous expenses |
* | |
| Total expenses |
* |
All expenses are estimated except for the SEC fee, the Financial Industry Regulatory Authority, Inc. fee and the NASDAQ Capital Market initial listing fee.
| * | To be provided by amendment. |
| Item 14. | Indemnification of Directors and Officers |
We are subject to the provisions of Part 5, Division 5 of the Business Corporations Act (British Columbia), S.B.C. 2002, c.57, or the BCBCA.
Under Section 160 of the BCBCA, we may, subject to Section 163 of the BCBCA:
(1) indemnify an individual who:
| • | is or was a director or officer of our company; |
| • | is or was a director or officer of another corporation (i) at a time when such corporation is or was an affiliate of our company; or (ii) at our request, or |
| • | at our request, is or was, or holds or held a position equivalent to that of, a director or officer of a partnership, trust, joint venture or other unincorporated entity, |
and including, subject to certain limited exceptions, the heirs and personal or other legal representatives of that individual (collectively, an “eligible party”), against all eligible penalties to which the eligible party is or may be liable; and
(2) after final disposition of an eligible proceeding, pay the expenses actually and reasonably incurred by an eligible party in respect of that proceeding, where:
“eligible penalty” means a judgment, penalty or fine awarded or imposed in, or an amount paid in settlement of, and eligible proceeding.
“eligible proceeding” means a proceeding in which an eligible party or any of the heirs and personal or other legal representatives of the eligible party, by reason of the eligible party being or having been a director or
II-1
Table of Contents
officer of, or holding or having held a position equivalent to that of a director or officer of, our company or an associated corporation (a) is or may be joined as a party, or (b) is or may be liable for or in respect of a judgment, penalty or fine in, or expenses related to, the proceeding.
“proceeding” includes any legal proceeding or investigative action, whether current, threatened, pending or completed.
Under Section 161 of the BCBCA, and subject to Section 163 of the BCBCA, we must, after the final disposition of an eligible proceeding, pay the expenses actually and reasonably incurred by an eligible party in respect of that proceeding if the eligible party (a) has not been reimbursed for those expenses, and (b) is wholly successful, on the merits or otherwise, in the outcome of the proceeding or is substantially successful on the merits in the outcome of the proceeding.
Under Section 162 of the BCBCA, and subject to Section 163 of the BCBCA, we may pay, as they are incurred in advance of the final disposition of an eligible proceeding, the expenses actually and reasonably incurred by an eligible party in respect of the proceeding, provided that we must not make such payments unless we first receive from the eligible party a written undertaking that, if it is ultimately determined that the payment of expenses is prohibited under Section 163 of the BCBCA, the eligible party will repay the amounts advanced.
Under Section 163 of the BCBCA, we must not indemnify an eligible party against eligible penalties to which the eligible party is or may be liable or pay the expenses of an eligible party in respect of that proceeding under Sections 160, 161 or 162 of the BCBCA, as the case may be, if any of the following circumstances apply:
| • | if the indemnity or payment is made under an earlier agreement to indemnify or pay expenses and, at the time that the agreement to indemnify or pay expenses was made, we were prohibited from giving the indemnity or paying the expenses by our memorandum or articles; |
| • | if the indemnity or payment is made otherwise than under an earlier agreement to indemnify or pay expenses and, at the time that the indemnity or payment is made, we are prohibited from giving the indemnity or paying the expenses by our memorandum or articles; |
| • | if, in relation to the subject matter of the eligible proceeding, the eligible party did not act honestly and in good faith with a view to the best interests of our company or the associated corporation, as the case may be; or |
| • | in the case of an eligible proceeding other than a civil proceeding, if the eligible party did not have reasonable grounds for believing that the eligible party’s conduct in respect of which the proceeding was brought was lawful. |
If an eligible proceeding is brought against an eligible party by or on behalf of our company or by or on behalf of an associated corporation, we must not either indemnify the eligible party against eligible penalties to which the eligible party is or may be liable, or pay the expenses of the eligible party under Sections 160, 161 or 162 of the BCBCA, as the case may be, in respect of the proceeding.
Under Section 164 of the BCBCA, and despite any other provision of Part 5, Division 5 of the BCBCA and whether or not payment of expenses or indemnification has been sought, authorized or declined under Part 5, Division 5 of the BCBCA, on application of our company or an eligible party, the Supreme Court of British Columbia may do one or more of the following:
| • | order us to indemnify an eligible party against any liability incurred by the eligible party in respect of an eligible proceeding; |
| • | order us to pay some or all of the expenses incurred by an eligible party in respect of an eligible proceeding; |
| • | order the enforcement of, or payment under, an agreement of indemnification entered into by us; |
II-2
Table of Contents
| • | order us to pay some or all of the expenses actually and reasonably incurred by any person in obtaining an order under Section 164 of the BCBCA; or |
| • | make any other order the court considers appropriate. |
Section 165 of the BCBCA provides that we may purchase and maintain insurance for the benefit of an eligible party or the heirs and personal or other legal representatives of the eligible party against any liability that may be incurred by reason of the eligible party being or having been a director or officer of, or holding or having held a position equivalent to that of a director or officer of, our company or an associated corporation.
Under our articles of association, as amended, or our Articles, and subject to the BCBCA, we must indemnify an eligible party and his or her heirs and legal personal representatives against all eligible penalties to which such person is or may be liable, and we must, after the final disposition of an eligible proceeding, pay the expenses actually and reasonably incurred by such person in respect of that proceeding. Each eligible party is deemed to have contracted with our company on the terms of the indemnity contained in our articles.
Under our Articles, and subject to the BCBCA, we may agree to indemnify and may indemnify any person (including an eligible party) against eligible penalties and pay expenses incurred in connection with the performance of services by that person for us. Under our Articles, and subject to the Act, we may advance expenses to an eligible party. Pursuant to our Articles, the failure of an eligible party to comply with the Act or our Articles does not, of itself, invalidate any indemnity to which he or she is entitled under our Articles.
We maintain general liability insurance which covers certain liabilities of our directors and officers arising out of claims based on acts or omissions in their capacities as directors or officers, including liabilities under the U.S. Securities Act of 1933, as amended, or the Securities Act, and the BCBCA.
The underwriting agreement to be filed as Exhibit 1.1 to this registration statement will provide for indemnification of us and our directors and officers by the underwriters against certain liabilities under the Securities Act and the U.S. Securities Exchange Act of 1934, as amended, or the Exchange Act.
| Item 15. | Recent Sales of Unregistered Securities |
During the past three years, we have issued securities in the following transactions, each of which was exempt from the registration requirements of the Securities Act. Except for (a) the shares of common stock of WPHI that were issued upon the conversion of shares of the preferred stock and warrants of WPHI, (b) our common shares and Class B restricted voting shares that were issued upon the conversion of the WPHI common stock and WHI senior secured convertible notes, and (c) our common shares that were issued upon the conversion of our Class B restricted voting shares, all of the below-referenced securities were issued pursuant to the exemption from registration under Section 4(2) of the Securities Act or Regulation D promulgated thereunder, or Rule 701 promulgated under Section 3(b) of the Securities Act as transactions by an issuer not involving any public offering or pursuant to benefit plans and contracts relating to compensation as provided under Rule 701, and the securities so issued are deemed to be restricted securities for purposes of the Securities Act. There were no underwriters or placement agents employed in connection with any of these transactions.
Use of the exemption provided in Section 4(2) or Regulation D thereunder for transactions not involving a public offering is based on the following facts:
| • | Neither we nor any person acting on our behalf solicited any offer to buy or sell securities by any form of general solicitation or advertising. |
| • | The recipients were either accredited or otherwise sophisticated individuals who had such knowledge and experience in business matters that they were capable of evaluating the merits and risks of the prospective investment in our securities. |
II-3
Table of Contents
| • | All recipients had adequate access through their relationships with us to business and financial information concerning our company. |
| • | All recipients of the securities in each of these transactions represented their intentions to acquire the securities for investment only and not with a view to or for sale in connection with any distribution thereof, and appropriate legends were placed upon the stock certificates issued in these transactions. All securities issued and may only be disposed of pursuant to an effective registration or exemption from registration in compliance with federal and state securities laws. |
Since December 1, 2011, we made sales of the following unregistered securities:
Convertible Note Offerings
In March and April of 2013, we closed an offering to existing investors of convertible notes of Wind Power Holdings, Inc., or WPHI. The WPHI convertible notes were sold for cash at face value for an aggregate purchase price of $4,525,000, without discount. In September 2013, we closed an offering to existing investors of WPHI convertible notes and WPHI common stock for cash in the aggregate amount of $2,000,000, without discount. The proceeds of these offerings were used to fund our working capital.
Conversion of Outstanding Securities
Pursuant to the cashless exercise feature of warrants to purchase Series C-2 preferred stock of WPHI of held by certain of our employees, we issued in 2012 an aggregate of 69,685 shares of WPHI common stock to such employees.
All shares of the WPHI Series A, B and/or C preferred stock held by stockholders that did not participate in the March/April 2013 convertible note financing automatically converted into WPHI common stock. If a stockholder purchased some but not all of its pro rata share of the convertible note financing, then the percentage of shares of WPHI Series A, B and/or C preferred stock (divided evenly among all such series of WPHI preferred stock held by such stockholder), equal to the percentage of its pro rata share not purchased automatically, converted into WPHI common stock.
Pursuant to a recapitalization completed in September 2013, all issued and outstanding shares of the WPHI Series A, B, and C-2 preferred stock were converted into WPHI common stock at a rate that reflected the WPHI stockholders’ aggregate liquidation preference of their respective holdings of the WPHI preferred securities and an assumed enterprise value of $50,000,000. Upon conversion of the WPHI Series C-1 preferred stock, we issued an aggregate amount of $5,250,000 in face amount of WPHI convertible notes. The recapitalization was approved by our stockholders and effective simultaneous with closing of the convertible note placement in September 2013. Adjusted for the reverse stock split effective on September 16, 2013, we issued and outstanding 20,000,075 shares of WPHI common stock just before the reverse takeover transaction, or RTO.
The WPHI common stock that were issued upon the conversion of shares of the WPHI preferred stock and warrants were issued pursuant to the exemption from registration under Section 3(a)(9) of the Securities Act and are deemed to be restricted securities for purposes of the Securities Act.
The number of shares of WPHI common stock issued in each transaction, and the price per share of common stock in each transaction, has been adjusted to give effect to the 1-for-11.6087 reverse stock split of the common stock effected on September 16, 2013.
Reverse Takeover and Private Placement.
On April 16, 2014, we, as Wind Power Holdings, Inc., or WPHI, completed a reverse takeover transaction, or RTO, with Mira III Acquisition Corp., a Canadian capital pool company incorporated in British Columbia,
II-4
Table of Contents
Canada, or Mira III, whereby all of the equity securities of WPHI were exchanged for common shares and restricted voting shares of Mira III, which became the holding company of our corporate group. In connection with the RTO, Mira III changed its name to Northern Power Systems Corp. and the historical consolidated financial statements of WPHI included in this prospectus became the historical consolidated financial statements of Northern Power Systems Corp.
In connection with the RTO, WPHI completed a private placement, the Private Placement, of 6,125,000 subscription receipts, the Subscription Receipts, on March 17, 2014 for aggregate gross proceeds of CDN$24.5 million (US$22.3 million) at a price of CDN$4.00 per Subscription Receipt. Immediately prior to the completion of the RTO, (i) each Subscription Receipt converted into one share of WPHI common stock, a WPHI Share, after the consolidation of WPHI Shares on the basis of one-post consolidated WPHI Share for every 1.557612 pre-consolidated WPHI Shares, the WPHI Consolidation, (and ultimately entitling the holder thereof to acquire one common share of Northern Power Systems Corp.) and (ii) all of WPHI’s outstanding senior secured convertible notes automatically converted into an aggregate of 3,384,755 WPHI Shares.
In connection with the RTO, each WPHI Share held by U.S. residents who are accredited investors were exchanged for 0.72742473 of our restricted voting shares and 0.27257527 of our common shares. All other issued and outstanding WPHI Shares were exchanged for our common shares on a 1-to-1 basis. Additionally, all outstanding options to purchase WPHI Shares were exchanged and cancelled for options to purchase our common shares on a 1-to-1 basis with terms substantially the same to the options being exchanged.
Conversion of Outstanding Securities
On November 20, 2014, we exercised our option to convert all outstanding Class B restricted voting shares to common shares effective November 30, 2014.
Option Exchanges
In January 2014, certain employees of our subsidiaries Northern Power Systems, Inc., Northern Power Systems Utility Scale, Inc. and Northern Power Systems AG accepted an offer from us to exchange options to purchase an aggregate of 1,928,314 and 2,088,380 common stock of Northern Power Systems, Inc. and Northern Power Systems Utility Scale, Inc., respectively, under our 2011 subsidiary equity incentive plans for options to purchase an aggregate of 233,427 shares of WPHI common stock under the 2013 Stock Option and Grant Plan. The exercise price for the new options was equal to the fair market value of the WPHI common stock as of the date of the closing of the exchange offer. However, in connection with the application process for the listing of Mira III’s shares on the Toronto Stock Exchange, the exercise price of such options was increased to US$2.33 per share. The new options were vested to the extent that the exchanged options were vested and will terminate on the same date as the exchanged options.
We believe that all of the above transactions were exempt from registration under the Securities Act in reliance upon Section 4(2) of the Securities Act or Regulation D promulgated thereunder, or Rule 701 promulgated under Section 3(b) of the Securities Act as transactions by an issuer not involving any public offering or pursuant to benefit plans and contracts relating to compensation as provided under Rule 701. The recipients of the securities in each of these transactions represented their intentions to acquire the securities for investment only and not with a view to or for sale in connection with any distribution thereof, and appropriate legends were placed upon the stock certificates issued in these transactions. All recipients had adequate access, through their relationships with us, to information about Wind Power Holdings, Inc.
Option Exercises
Since January 1, 2012, certain of the Company’s option holders exercised an aggregate of 47,968 options. The exercise price for each of the options was equal to the fair market value of the underlying security as of the date of the grant.
II-5
Table of Contents
Option Grants
Since January 1, 2012, the Company granted options to purchase an aggregate of 46,000 and 1,000 shares of common stock of Northern Power Systems, Inc. and Northern Power Systems Utility Scale, Inc., respectively, under its 2011 subsidiary equity incentive plans to officers and employees, with per share exercise prices ranging from $0.54 to $1.45. As noted above under “Option Exchanges,” all such options were exchanged for options to purchase common stock of WPHI under the 2013 Stock Option and Grant Plan. Since January 1, 2012, the Company granted options to purchase an aggregate of 2,852,982 shares of WPHI common stock under the 2013 Stock Option and Grant Plan to officers and employees, with per share exercise prices ranging from $1.02 to $5.65. In connection with the RTO, all such options were converted to options to purchase Shares under the 2014 Stock Option and Incentive Plan. No exercisable options have been granted under the 2014 Stock Option and Incentive Plan. The exercise price of each of the options was equal to the fair market value of the underlying security as of the date of the grant.
| Item 16. | Exhibits and Financial Statement Schedules |
(a) Exhibits
See the Exhibit Index on the page immediately following the signature page for a list of exhibits filed as part of this registration statement on Form S-1, which Exhibit Index is incorporated herein by reference.
(b) Schedules
Schedule II — Valuation and Qualifying Accounts is included in this registration statement beginning on page F-63.
| Item 17. | Undertakings |
Insofar as indemnification for liabilities arising under the Securities Act may be permitted to directors, officers and controlling persons of the registrant pursuant to the foregoing provisions, or otherwise, the registrant has been advised that in the opinion of the Securities and Exchange Commission such indemnification is against public policy as expressed in the Securities Act and is, therefore, unenforceable. In the event that a claim for indemnification against such liabilities (other than the payment by the registrant of expenses incurred or paid by a director, officer or controlling person of the registrant in the successful defense of any action, suit or proceeding) is asserted by such director, officer or controlling person in connection with the securities being registered, the registrant will, unless in the opinion of its counsel the matter has been settled by controlling precedent, submit to a court of appropriate jurisdiction the question whether such indemnification by it is against public policy as expressed in the Securities Act and will be governed by the final adjudication of such issue.
The undersigned registrant hereby undertakes:
(a) to deliver or cause to be delivered with the prospectus, to each person to whom the prospectus is sent or given, the latest annual report to security holders that is incorporated by reference in the prospectus and furnished pursuant to and meeting the requirements of Rule 14a-3 or Rule 14c-3 under the Exchange Act; and, where interim financial information required to be presented by Article 3 of Regulation S-X are not set forth in the prospectus, to deliver, or cause to be delivered to each person to whom the prospectus is sent or given, the latest quarterly report that is specifically incorporated by reference in the prospectus to provide such interim financial information;
(b) that, for purposes of determining any liability under the Securities Act, the information omitted from the form of prospectus filed as part of this registration statement in reliance upon Rule 430A and contained in a form of prospectus filed by the registrant pursuant to Rule 424(b)(1) or (4) or 497(h) under the Securities Act shall be deemed to be part of this registration statement as of the time it was declared effective; and
(c) that, for the purpose of determining any liability under the Securities Act, each post-effective amendment that contains a form of prospectus shall be deemed to be a new registration statement relating to the securities offered therein, and the offering of such securities at that time shall be deemed to be the initial bona fide offering thereof.
II-6
Table of Contents
SIGNATURES
Pursuant to the requirements of the Securities Act of 1933, as amended, the registrant has duly caused this Amendment No. 1 to Registration Statement to be signed on its behalf by the undersigned, thereunto duly authorized, in the City of Barre, State of Vermont, on this 14th day of January, 2015.
| NORTHERN POWER SYSTEMS CORP. | ||
| By: |
/s/ Elliot J. Mark | |
| Elliot J. Mark Vice President and General Counsel | ||
Pursuant to the requirements of the Securities Act of 1933, as amended, this Amendment No. 1 to Registration Statement has been signed by the following persons in the capacities and on the dates indicated.
| Signature |
Title |
Date | ||
| * Troy C. Patton |
President, Chief Executive Officer and Director (Principal Executive Officer) |
January 14, 2015 | ||
| * Ciel R. Caldwell |
Chief Financial Officer (Principal Financial and Accounting Officer) |
January 14, 2015 | ||
| * Marcus D. Baker |
Director |
January 14, 2015 | ||
| * Alexander Ellis, III |
Director |
January 14, 2015 | ||
| * Richard Hokin |
Director |
January 14, 2015 | ||
| * John Simon |
Director |
January 14, 2015 | ||
| * William F. Leimkuhler |
Director |
January 14, 2015 | ||
| * Robert L. Lentz |
Director |
January 14, 2015 | ||
| *By: | /s/ Elliot J. Mark | |
| Elliot J. Mark Attorney-in-fact | ||
II-7
Table of Contents
EXHIBIT INDEX
| Number |
Description | |
| 1.1* | Form of Underwriting Agreement | |
| 3.1** | Articles of Association of the Registrant, as amended (filed as Exhibit 3.1 to the Registrant’s Current Report on Form 8-K (File No. 000-55184) on April 23, 2014 and incorporated herein by reference) | |
| 4.1** | Form of Common Share Certificate of Registrant (filed as Exhibit 4.1 to Amendment No. 3 to the Registrant’s Registration Statement on Form 10 (File No. 001-36317), filed by Wind Power Holdings, Inc., the predecessor to the Registrant, on May 12, 2014 and incorporated herein by reference) | |
| 4.2** | Form of Class B Restricted Voting Share Certificate of the Registrant (filed as Exhibit 4.1A to Amendment No. 3 to the Registrant’s Registration Statement on Form 10 (File No. 001-36317) by Wind Power Holdings, Inc., the predecessor to the Registrant, on May 12, 2014 and incorporated herein by reference) | |
| 4.3** | Fifth Amended and Restated Investors’ Rights Agreement by and between Wind Power Holdings, Inc. and certain of its shareholders dated as of April 14, 2014 (filed as Exhibit 10.1 to the Registrant’s Current Report on Form 8-K (File No. 000-55184) on April 23, 2014 and incorporated herein by reference) | |
| 5.1* | Opinion of Fasken Martineau DuMoulin LLP | |
| 10.1#** | Northern Power Systems Corp. 2014 Stock Option and Incentive Plan (filed as Exhibit 10.2 to the Registrant’s Current Report on Form 8-K (File No. 000-55184) on April 23, 2014 and incorporated herein by reference) | |
| 10.2** | Northern Power Systems Corp. 2014 Stock Option and Incentive Plan Form of Non-Qualified Stock Option Grant (filed as Exhibit 10.3 to the Registrant’s Current Report on Form 8-K (File No. 000-55184) on April 23, 2014 and incorporated herein by reference) | |
| 10.3** | Employment Agreement by and between the Registrant and Troy C. Patton (filed as Exhibit 10.5 to the Registrant’s Registration Statement on Form 10 (File No. 001-36317) by Wind Power Holdings, Inc., the predecessor to the Registrant, on February 12, 2014 and incorporated herein by reference | |
| 10.4#** | Employment Agreement dated as of January 31, 2013 by and between the Registrant and Ciel R. Caldwell | |
| 10.5#** | Employment Agreement dated as of September 19, 2010 by and between the Registrant and Jonathan Lynch | |
| 10.6#** | Employment Agreement dated as of September 10, 2010 by and between the Registrant and Elliot J. Mark | |
| 10.7#** | Employment Agreement dated as of May 5, 2014 by and between Northern Power Systems, Inc. and Lawrence D. Willey (filed as Exhibit 10.7 to the Registrant’s Quarterly Report on Form 10-Q (File No. 000-55184) on August 14, 2014 and incorporated herein by reference) | |
| 10.8** | Amended and Restated Loan and Security Agreement by and between the Registrant and Comerica Bank, dated December 31, 2013, as amended June 30, 2014 | |
| 10.9†** | Technological Know-How Transfer Agreement for NPS 2.X by and between the Registrant and WEG Equipamentos Elétricos S.A. dated March 20, 2013 (filed as Exhibit 10.8 to Amendment No. 3 to the Registrant’s Registration Statement on Form 10 (File No. 001-36317) by Wind Power Holdings, Inc., the predecessor to the Registrant, on May 12, 2014 and incorporated herein by reference) | |
Table of Contents
| Number |
Description | |
| 10.10†** | Turbine Design and Development Agreement for 3.3 MW by and between Registrant and WEG Equipamentos Elétricos S.A. dated February 28, 2014 (filed as Exhibit 10.12 to Amendment No. 3 to the Registrant’s Registration Statement on Form 10 (File No. 001-36317) by Wind Power Holdings, Inc., the predecessor to the Registrant, on May 12, 2014 and incorporated herein by reference) | |
| 10.11** | Lease Agreement dated as of June 19, 2014 by and between Northern Power Systems, Inc. and Malone 29 Pitman Road Properties, LLC (filed as Exhibit 10.6 to the Registrant’s Quarterly Report on Form 10-Q (File No. 000-55184) on August 14, 2014 and incorporated herein by reference) | |
| 10.12** | Merger Agreement by and between Wind Power Holdings, Inc., Mira III Acquisition Corp., Mira Subco Inc. and Mira Subco LLC dated as of March 31, 2014 (filed as Exhibit 10.9 to Amendment No. 2 to the Registrant’s Registration Statement on Form 10 (File No. 001-36317) by Wind Power Holdings, Inc., the predecessor to the Registrant, on April 14, 2014 and incorporated herein by reference) | |
| 10.13** | Purchase and Sale Agreement dated as of March 5, 2014 by and between Wind Power Holdings, Inc. and Malone Properties, Inc. (filed as Exhibit 10.16 to Amendment No. 3 to the Registrant’s Registration Statement on Form 10 (File No. 001-36317) by Wind Power Holdings, Inc., the predecessor to the Registrant, on May 12, 2014 and incorporated herein by reference) | |
| 10.14** | Escrow Agreement made and entered into as of April 16, 2014, by and among the Registrant, Equity Financial Trust Company, as escrow agent, and the shareholders named therein (filed as Exhibit 10.4 to the Registrant’s Current Report on Form 8-K (File No. 000-55184) on April 23, 2014 and incorporated herein by reference) | |
| 16.1** | Letter from CohnReznick LLP (former auditor) (filed as Exhibit 16.1 to the Registrant’s Current Report on Form 8-K (File No. 000-55184) on September 17, 2014 and incorporated herein by reference). | |
| 16.2** | Letter from Zeifmans LLP (former auditor) (filed as Exhibit 16.2 to the Registrant’s Current Report on Form 8-K (File No. 000-55184) on September 17, 2014 and incorporated herein by reference). | |
| 21.1** | Subsidiaries of the Registrant | |
| 23.1 | Consent of CohnReznick LLP, Independent Registered Public Accounting Firm | |
| 23.2* | Consent of Fasken Martineau DuMoulin LLP (included in Exhibit 5.1) | |
| 24.1** | Power of Attorney (included in II-7) | |
| 101.INS** | XBRL Instance Document | |
| 101.SCH** | XBRL Taxonomy Extension Schema Document | |
| 101.CAL** | XBRL Taxonomy Calculation Linkbase Document | |
| 101.DEF** | XBRL Definition Linkbase Document | |
| 101.LAB** | XBRL Taxonomy Label Linkbase Document | |
| 101.PRE** | XBRL Taxonomy Presentation Linkbase Document | |
| * | To be filed by amendment. |
| ** | Previously filed. |
| # | Indicates management contract or compensatory plan, contract or agreement. |
| † | Portions of this exhibit (indicated by asterisks) have been omitted pursuant to a request for confidential treatment, which has been granted by the SEC. |