Attached files
| file | filename |
|---|---|
| 8-K - FORM 8-K - MEDASSETS INC | d850716d8k.htm |
 Performance Improvement
for Healthcare Providers
J. P. Morgan Healthcare Conference
January 13, 2015
Exhibit 99.1
Confidential. Property of MedAssets. MedAssets® is a registered trademark of MedAssets, Inc.
© 2013 MedAssets, Inc. All rights reserved. |
| 2
Safe Harbor/Non-GAAP Disclosures
Safe Harbor Statement
This presentation contains forward-looking statements within the meaning of the
Securities Act of 1933 and the Securities Exchange Act of 1934, as amended
by the Private Securities Litigation Reform Act of 1995, and include the
intent, belief or current expectations of the Company and its management team with respect to the Company’s
future
business
operations
that
include,
but
are
not
limited
to:
2014
financial
guidance,
revenue
growth
and
other
financial projections and forecasts. Any forward-looking statements are not
guarantees of future performance, involve risks and uncertainties, and
actual results may differ materially from those contemplated by such forward-
looking statements. Important factors currently known to management that could
cause actual results to differ materially from those contemplated by the
forward-looking statements in this presentation include, but are not limited
to: failure to realize improvements in performance, efficiency and
profitability; failure to complete anticipated sales under negotiations;
failure to successfully implement revenue backlog; lack of revenue growth; client losses; and
adverse developments with respect to the operation or performance of the
Company’s business units or the market price of its common stock.
Additional factors that could cause actual results to differ materially from those
contemplated within this presentation can also be found in the Company’s Risk
Factor disclosures in its Form 10-K for the year ended December 31, 2013
filed with the Securities and Exchange Commission and available at
http://ir.medassets.com. The Company disclaims any responsibility to update any
forward-looking statements. Use of Non-GAAP Financial Information
In order to provide investors with greater insight, promote transparency and allow
for a more comprehensive understanding of the information used by management
in its financial and operational decision-making, the Company
supplements its condensed consolidated financial statements presented on a GAAP
basis herein with certain non- GAAP financial information, including:
gross fees; gross administrative fees; revenue share obligation; EBITDA;
adjusted EBITDA; adjusted EBITDA margin; adjusted net income; diluted adjusted EPS;
and free cash flow. Reconciliations of these non-GAAP measures to their
most directly comparable GAAP measures, where possible, are included in the
financial schedules in the Appendix of this presentation, as well as in the Company’s quarterly
financial press releases and related Form 8-K filings with the SEC. This
information can be accessed for free by visiting www.medassets.com or
www.sec.gov. |
 3
Insight:
Predictive,
proprietary
data
analytics and intelligence
Impact:
Technology
and
services
to
improve provider performance
through total cost and revenue
management
Underpinned by great process:
Process improvement and clinical
resource utilization solutions
Highly recurring revenue model:
SaaS technologies and market-
leading GPO
MedAssets Business Overview
Headquarters:
Alpharetta, GA
(north Atlanta)
Clients:
•
4,400+ hospitals
(Includes 1,500+ organizations
serviced by Sg2)
•
122,000+ non-acute providers
NASDAQ:
MDAS
Founded:
1999
Unique mix of insight & execution to drive Total Performance
for Healthcare Providers
Financials:
Net revenue*
~$718M
Adjusted EBITDA*
~$236M
Market cap
~$1.2B
Enterprise value
~$2.1B
* FY’14 guidance (updated 10.29.14) |
 4
Evolving Market Dynamics Offer Opportunities
Linking insight and high impact, high ROI execution to deliver sustainable value
•
Market insight to adapt to
competitive, regulatory and
reimbursement dynamics
•
Comprehensive
assessment process to
target most critical needs
•
Invest in programmatic
support of provider
executive agendas
•
Extending into broader
cost, revenue and
process opportunity
•
Evolution to value-
based reimbursement
•
High impact, proven
solutions remain relevant
in any environment
•
Unique technology assets
•
Long track record of
sustainable value for
clients
Rapidly
changing
client
needs
Evolving
MDAS
business
model
Consistent
focus on value
creation |
 5
Performance Partner Delivering High ROI Results
Manages
$51 Billion
in spend
Touches
$400+
Billion
in patient
revenue
Delivered
$3+
Billion
from
documented
and guaranteed
savings
# of
clients
SCM Segment
3,200+
RCM Segment
2,700+
Total Acute Care
Hospitals
Total Non-Acute
Providers
4,400+
122,000+
Delivers
significantly
more
than
$3.5
Billion
in
annual client
value
Proven delivery of measurable financial impact across market-leading footprint
|
 6
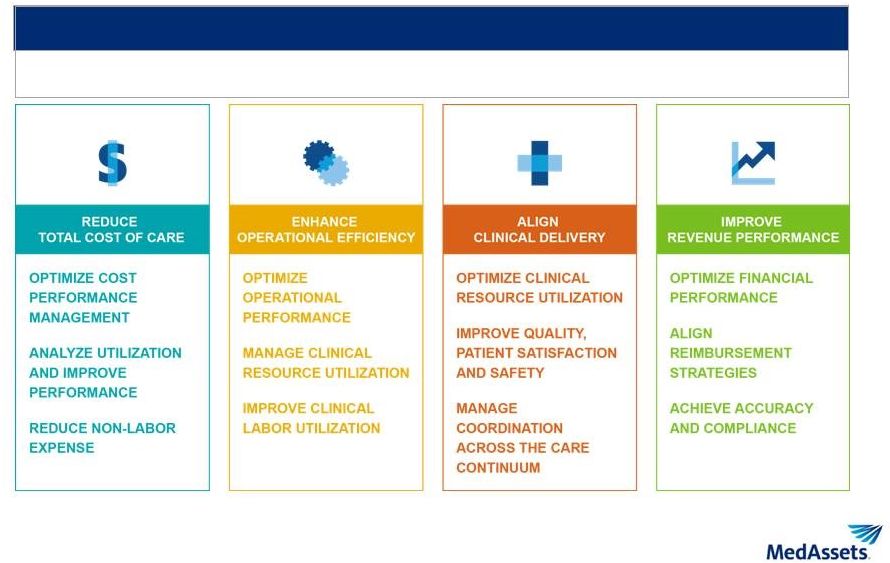
Broad Capabilities to Deliver Total Performance
Unique
set
of
capabilities
to
support
financial,
operational
and
clinical
success
DELIVER MARKET-LEADING INSIGHT
ASSESS, BENCHMARK AND INVEST SUPPORTED BY HIGH-IMPACT STRATEGIC AND OPERATIONAL
ANALYTICS |
 7
Two Primary Business Segments
Aligned to drive effective market choices for healthcare providers supported by
operational rigor to win
Spend & Clinical Resource
Management (SCM)
Revenue Cycle Management
(RCM)
Advisory Solutions spans both
•
Strategy,
cost
management
and
process
improvement
solutions
•
Best pricing in strategic sourcing to
reduce supply expenses by 3-10%
•
Clinical resource management,
workforce
and
lean
consulting
•
Data
analytics
to
transform
strategic,
clinical
and
operational
performance
•
Full suite of SaaS applications
and
service
expertise
to
optimize
revenue capture & accelerate cash
•
Low
upfront
cost
(opex
vs
capex)
and fast, measurable ROI
•
Innovative solutions to manage
value-based reimbursement,
improve transparency
& compliance
|
 8
5
3
3
24
2
4
4
3
Delivering Total Performance Management
Opportunity
Execution
Sample
Total
Performance
Management
assessment
-
Year
1
financial
impact
($ millions)
Salaries
and wages
Purchased
services
Revenue
capture
from RCM
fixes
Revenue gains
through
process
improvement
PPI and
clinical
resource
management
One-time
revenue
cycle
opportunities
Process
improvement
(non-RCM)
Long-term engagement with provider leadership to tackle critical business
issues •
Clients looking for partners with breadth of offerings
•
Complete
solution
to
deliver
clinical
and
financial
performance,
often
multi-year
in
scope with recurring, programmatic engagements
•
Enterprise, consultative sales approach to deliver strategy and performance
improvement solutions grounded in data-driven approach
•
Smooth process integration of SaaS tools, expert advisory & consulting
services |
 9
2014 Operational Update
•
Solid performance in RCM segment across technology & services
•
SCM segment revenue toward lower end of expectations
•
Stronger second-half results for GPO, partially offsetting first-half
volume weakness
•
Continued strength in advisory solutions and services
•
Performance-related fees generally on target and on
schedule •
4Q’14 bookings led by RCM Services, GPO and Advisory Solutions
•
Enterprise sales momentum building
•
Additional investments in sales & marketing
•
Stronger gross administrative fee (GAF) growth in 4Q & 2H’14
(preliminary: 2H’14 ~5.6% vs +4.1% in 1H’14)
highlights ongoing
value delivery of GPO contracts
•
Working to ensure client value and MDAS revenue capture are better
aligned
Second half administrative fee recovery and client momentum in RCM
Q4 revenue in
line with
expectations
FY’14 bookings
slightly lower
than internal
expectations
Early
successes
driving new
GPO expansion
•
Aligned SCM organization to better focus leadership, resources and
tools on accountability, compliance and pricing differentiation
|
 10
Focused on Consistent, Long-Term Growth
Align powerful assets to maintain client momentum & grow new businesses in
2015 •
Powerful link between operational and strategic analytics
(including Sg2) and advisory capability
•
Deliver expanded SaaS platform and unique, valuable research
•
Grow proven, high-value consultative offerings
•
Maintain momentum in same store execution
•
Better
align
client
value
creation
(i.e.,
gross
admin
fees)
with
client
contracting and MDAS revenue capture (i.e., net admin fees)
•
Drive more predictable, more consistent baseline growth in non-acute
•
Invest in sales capacity and execution to translate customer service
successes to more rapid growth
•
Scale RCS in line with successful implementation models
•
Enhance market impact of high-value solutions that are relevant in
any environment
•
Continue investment in value-based transition for technology
-
e.g., product value analysis, episodic care and digital supply chain
Grow Analytics
and Advisory
Strengthen GPO
Value Capture
Maintain RCM
Momentum
Adapt to New
Market Drivers |
 11
Sg2: Predictive Market Analytics, Expert-led Intelligence
•
SaaS-based
EDGE
®
intelligence
&
analytics
platform
provides
valuable
lens
into
national, regional and local market dynamics across the care continuum
1,500+ hospital, health system, pharmaceutical & medical device clients
Sg2’s FY’14 net revenue to be ~$40 million (excluding
any purchase accounting adjustments) Recurring subscription fees from
SaaS analytics tools comprise ~75% of revenue |
 12
Sg2 System of CARE™
-
Assess, Build, Grow, Manage
CARE = Clinical Alignment and Resource Effectiveness
WHAT SERVICE LINES SHOULD YOU
FOCUS ON FOR LONG-TERM GROWTH?
HOW SHOULD YOU DIFFERENTIATE YOUR
SERVICE LINES ACROSS THE SYSTEM OF CARE? |
 13
Sg2 Analytics Highlight Growth Opportunities Across
the Care Continuum
Note: The analysis excludes 0–17 age group. Other includes nonhospital
locations such as OP rehab facilities, psychiatric centers, hospice centers,
federally qualified health centers and assisted living facilities. ASC = ambulatory surgery center; E&M = evaluation and management;
SNF
=
skilled
nursing
facility.
Sources:
Impact
of
Change
®
v14.0;
NIS;
PharMetrics;
CMS;
Sg2
Analysis,
2014. |
 14
Utilization Shifts Redefine Growth Opportunities
Note:
Forecast
excludes
0–17
age
group.
IP
=
inpatient;
OP
=
outpatient.
Sources:
Impact
of
Change
®
v14.0;
NIS;
PharMetrics;
CMS;
Sg2
Analysis,
2014.
Sg2 IP Forecast
Population-Based Forecast
Sg2 OP Forecast |
 15
Impact of Industry Trends Varies Across Service Lines
Note: All service lines exclude 0–17 age group except for Pediatrics, which
excludes 18+ age group. Cardiovascular includes cardiology and vascular. Medicine/Surgery includes
allergy and immunology, burns, dermatology, endocrinology, ENT, gastroenterology,
medicine and surgery, infectious diseases, nephrology, ophthalmology, pulmonology,
rheumatology, and urology. Neurosciences includes brain/CNS cancer CARE Family. OP
Pediatrics excludes psychiatry, gynecology and obstetrics; IP Pediatrics additionally excludes
normal newborns and neonatology. CNS = central nervous system; ENT = ear, nose and
throat; IP = inpatient; OP = outpatient. Sources:
Impact
of
Change
®
v14.0;
NIS;
PharMetrics;
CMS;
Sg2
Analysis,
2014. |
 16
Market Analytics and
Intelligence
Evidence-based Technology
Operational and Implementation Excellence
Market Insight + Rapid Execution = Tomorrow’s Success
Powerful combination of market insight for growth with total performance
management capabilities for financial, clinical and operational success
Assess & Optimize Care
Continuum Opportunities
Reduce Total Cost of Care
Enhance Operational Efficiency
Align Clinical Delivery
Improve Revenue Performance
Total Performance
Management
Plan and Develop
your
System
Assets
Build Growth and Performance Strategies
Analyze Market Dynamics
Prepare and Model New Payments
SaaS-Based
Analytics
Market
Intelligence
Expert
Advisory
Implementation
& Delivery
Sustainable
Results |
 Financial Review & Update |
 18
Financial
Snapshot
(updated
10.29.14)
(In millions)
Adj EBITDA
margin %
31.5 %
32.4 %
32.5 %
32.9 %
(In millions)
1
Pro Forma for Broadlane acquisition in 2010
2
Corporate expense allocated to segments based on percentage of revenue; using 2013
Adj EBITDA mix by segment to illustrate potential 2014 mix $585
$640
$680
$718
$400
$500
$600
$700
2012
2013
2014 est.
Total Net Revenue
$184
$207
$221
$236
$100
$150
$200
$250
2012
2013
Adjusted EBITDA
2011
1
2014 est.
$0.99
$1.13
$1.32
$1.36
$0.40
$0.80
$1.20
$1.60
2012
2013
2014 est.
Adjusted EPS
2011
1
2011
1 |
 19
Capital
Structure
(as
of
9.30.14)
•
Net leverage of ~4.0x LTM adjusted EBITDA
-
Target leverage ratio of ~3.6x at YE’14, and 2.5-3.5x long term
•
Current S&P/Moody’s credit ratings: BB-/B1 (Corporate), BB+/Ba3 (Term
Loans) (Unaudited; $ In Millions)
Interest
Rate%
9/30/14
Cash and Cash Equivalents
Debt
Term Loan A (LIBOR +2.25% w/ No LIBOR Floor, Due 2017)
Term Loan B (LIBOR +2.75% w/1.25% LIBOR Floor, Due 2019)
$300M Revolving Credit Facility (LIBOR +2.25%)
8% Senior Notes, Due 2018
Total
Bank
and
Bond
Debt,
Including
Current
Portion
(net
of
cash)
$ 13.9
228.1
179.7
167.0
325.0
$ 886.0
Column amounts may not add to total due to rounding
2.5%
4.0
2.5
8.0
4.8%
* Cash provided by operating activities less capital expenditures, which includes
purchases of property, equipment and software & capitalized software
development costs Blended Interest Rate |
 20
NOTE:
FY’14
Current
Estimate
for
SCM
segment
net
revenue
and
Consolidated
net
revenue
includes
$10.5-$11.0 million in additional revenue as a result of the acquisition of
Sg2 on September 22, 2014 * Column amounts may not add to total due to
rounding FY’14 Financial Guidance
(updated 10.29.14)
Preliminary Commentary
(Subject to Change)
•
Expect consolidated net revenue
at midpoint of range
–
RCM at high end
–
SCM below midpoint
•
Expect adjusted EBITDA near
low end of range, and adjusted
EPS near midpoint of range
–
Revenue mix
–
Healthcare benefit costs
(incurred
but
not
reported
-
IBNR)
–
IT and other investments
•
Expect to report final 4Q and
FY’14 financial results on
2.25.15 after market close |
 21
Recap of FY’15 Considerations and Preliminary
Views
Revenue
Addition of full year of Sg2 net revenue (FY’14 pro forma ~$40M) and
growing ~$28M in net revenue recognized in FY’14 will not
recur in FY’15 due to
conclusion of Barnabas RCM outsourcing agreement on 12.31.14
Expected revenue mix to include faster growth from advisory, analytics and
services capabilities (lower relative margin rates than GPO)
Depreciation expense to be approximately $60M
Higher incentive compensation expense in FY’15 as performance in SCM
segment in FY’14 reduced incentive compensation expense by ~$10M
Adjusted EBITDA and Adjusted EPS |
 22
Transparent, High ROI Performance Improvement
Enhanced focus on commercial execution and innovation
Significant client base with deep relationships and
opportunity to expand use of MedAssets solutions
High-quality financial model with:
80-85%
recurring
revenue
~30+%
adjusted
EBITDA
margins
Robust
free
cash
flow
generation
Breadth of predictive, price, process and payment solutions
for healthcare organizations
MedAssets (NASDAQ: MDAS) |
 23
Reconciliation of GAAP Net Income to Non-GAAP EBITDA
In 000s
2014
2013
2014
2013
Net income
7,740
$
6,902
$
22,014
$
19,690
$
Depreciation
11,845
10,926
35,247
29,979
Depreciation (included in cost of revenue)
1,094
571
2,166
1,740
Amortization of intangibles
13,936
15,341
41,989
47,957
Interest expense, net
11,338
11,813
33,625
35,544
Income tax expense
5,712
3,983
16,293
12,141
Non-GAAP EBITDA
51,665
$
49,536
$
151,334
$
147,051
$
Share-based compensation
4,809
4,361
14,703
11,783
Rental income from capitalized building lease
(110)
(109)
(329)
(328)
Purchase accounting adjustments
94
-
94
-
Restructuring, acquisition and integration-related expenses
3,010
111
4,707
9,576
Non-GAAP Adjusted EBITDA
59,468
$
53,899
$
170,509
$
168,082
$
Three Months Ended
September 30,
Nine Months Ended
September 30,
SUPPLEMENTAL REPORTING OF ADJUSTED EBITDA
RECONCILIATION OF SELECTED NON-GAAP MEASURES TO GAAP MEASURES
(UNAUDITED) |
 24
Reconciliation of GAAP to Non-GAAP EPS
In 000s, except per share data
2014
2013
2014
2013
Net income
7,740
$
6,902
$
22,014
$
19,690
$
Pre-tax non-cash, acquisition-related intangible
amortization and depreciation
13,936
15,814
41,989
49,378
Pre-tax non-cash, share-based compensation
4,809
4,361
14,703
11,783
Pre-tax restructuring, acquisition and integration-related
expenses
3,010
111
4,707
9,576
Pre-tax purchase accounting adjustment
94
-
94
-
Tax effect on pre-tax adjustments
(8,739)
(8,115)
(24,596)
(28,295)
Non-GAAP adjusted net income
20,850
$
19,073
$
58,911
$
62,132
$
Income
Per
Share
(EPS)
-
diluted
0.13
$
0.11
$
0.36
$
0.32
$
Pre-tax non-cash, acquisition-related intangible
amortization and depreciation
0.23
0.26
0.69
0.81
Pre-tax non-cash, share-based compensation
0.07
0.07
0.23
0.19
Pre-tax restructuring, acquisition and integration-related
expenses
0.05
-
0.08
0.16
Pre-tax purchase accounting adjustment
-
-
-
-
Tax effect on pre-tax adjustments
(0.14)
(0.13)
(0.40)
(0.46)
Non-GAAP
adjusted
EPS
-
diluted
0.34
$
0.31
$
0.96
$
1.02
$
Weighted
average
shares
-
diluted
(in
000s)
60,662
61,476
61,269
60,912
(c) The Company used a tax rate of 40.0% for the three and nine months ended
September 30, 2014 and 2013 to calculate the tax effect of each adjustment
since it believes 40.0% will be the Company's normalized long-term tax
rate.
Three Months Ended
September 30,
Nine Months Ended
September 30,
SUPPLEMENTAL NET INCOME AND EARNINGS PER SHARE REPORTING
RECONCILIATION OF SELECTED NON-GAAP MEASURES TO GAAP MEASURES
(UNAUDITED)
c
c |
 25
Reconciliation of GAAP to Non-GAAP EBITDA Guidance
In 000s
(Low)
(High)
Net Income
30,000
$
32,400
$
Depreciation
48,000
48,000
Depreciation (included in cost of revenue)
3,200
3,200
Amortization of intangibles
57,600
57,600
Interest expense, net
45,700
45,700
Income tax expense
20,900
22,500
Non-GAAP EBITDA
205,400
209,400
Share-based compensation
20,100
20,100
Restructuring, acquisition and integration-related expenses
7,900
7,900
Purchase accounting adjustments
1,000
1,000
Rental income from capitalized building lease
(400)
(400)
Non-GAAP adjusted EBITDA
234,000
$
238,000
$
RECONCILIATION OF SELECTED NON-GAAP MEASURES TO GAAP MEASURES
(UNAUDITED)
December 31, 2014
Guidance Range for
Twelve Months Ending
SUPPLEMENTAL 2014 ADJUSTED EBITDA GUIDANCE |
 26
Reconciliation of GAAP to Non-GAAP EPS Guidance
(d) The Company used a tax rate of 40.0% for the full year ending December 31, 2014
to calculate the tax effect of each adjustment since it believes 40.0% will be the
Company's normalized long-term tax rate.
(e) Column amounts may not add to total due to rounding.
In 000s, except per share data
(Low)
(High)
Net Income
30,000
$
32,400
$
EPS -
diluted
0.49
0.53
0.94
0.94
Pre-tax non-cash, share-based compensation
0.33
0.33
0.13
0.13
0.02
0.02
Tax effect on pre-tax adjustments
d
(0.57)
(0.56)
Non-GAAP
adjusted
EPS
-
diluted
e
1.34
$
1.38
$
Fully diluted weighted average shares outstanding
61,200
61,200
Guidance Range for
Twelve Months Ending
Pre-tax purchase accounting adjustments
Pre-tax restructuring, acquisition and integration-related expenses
SUPPLEMENTAL 2014 EARNINGS PER SHARE GUIDANCE
RECONCILIATION OF SELECTED NON-GAAP MEASURES TO GAAP MEASURES
(UNAUDITED)
December 31, 2014
Pre-tax non-cash, acquisition-related intangible amortization and
depreciation |
 27
Reconciliation of GAAP to Non-GAAP Cash Flow
(In 000s)
2011
2012
2013
2014 est.
Cash Provided by Operating Activities
124,196
$
157,873
$
152,902
$
152,500
$
Capital Expenditures (includes Purchases of
Property, Equipment and Software, as well as
(48,973)
(66,426)
(58,818)
(60,000)
Capitalized Software Development Costs)
Non-GAAP Free Cash Flow (FCF)
75,223
$
91,447
$
94,084
$
92,500
$
SUPPLEMENTAL REPORTING OF FREE CASH FLOW
RECONCILIATION OF SELECTED NON-GAAP TO GAAP MEASURES
(UNAUDITED) |
 28
Reconciliation of Gross Fees to Net Revenue
In 000s
2014
2013
% Change
Non-GAAP gross administrative fees
$ 121,729
$ 115,478
5.4%
Other service fees
104,917
96,945
8.2%
Non-GAAP gross fees
226,646
RSO %
212,423
RSO %
6.7%
Non-GAAP revenue share obligation (RSO)
(50,941)
41.8%
(46,052)
39.9%
10.6%
Net revenue
$ 175,705
$ 166,371
5.6%
In 000s
2014
2013
% Change
Non-GAAP gross administrative fees
$ 367,496
$ 351,602
4.5%
Other service fees
304,862
293,503
3.9%
Non-GAAP gross fees
672,358
RSO %
645,105
RSO %
4.2%
Non-GAAP RSO
(150,371)
40.9%
(135,155)
38.4%
11.3%
Net revenue
$ 521,987
$ 509,950
2.4%
SUPPLEMENTAL REVENUE REPORTING
RECONCILIATION OF GROSS FEES (A NON-GAAP MEASURE) TO NET REVENUE
(UNAUDITED)
Three Months Ended September 30,
Nine Months Ended September 30, |
 29
Use of Non-GAAP Financial Measures
In order to provide investors with greater insight, promote transparency and allow for a more
comprehensive understanding of the information used by management and the board of directors in
their financial and operational decision-making, the Company supplements its condensed consolidated financial statements presented on a GAAP basis
herein with the following non-GAAP financial information: gross fees; gross administrative
fees; revenue share obligation; EBITDA; adjusted EBITDA; adjusted EBITDA margin; adjusted net
income; diluted adjusted EPS; and free cash flow.
These non-GAAP financial measures may have limitations as analytical tools and should not be
considered in isolation or as a substitute for analysis of the Company’s results as
reported under GAAP. The Company compensates for such limitations by relying primarily on the Company’s GAAP results and using non-GAAP financial
measures only supplementally. Where possible, the Company provides reconciliations of non-GAAP
financial measures to the most directly comparable GAAP measures. Investors are
encouraged to carefully review those reconciliations. In addition, because these non-GAAP measures are not measures of financial performance under GAAP
and are susceptible to varying calculations, these measures, as defined by the Company, may differ
from and may not be comparable to similarly titled measures used by other companies.
Gross fees include gross administrative fees the Company receives pursuant to its vendor contracts and
all other fees the Company receives from clients. The Company's revenue share obligation
represents the portion of the gross administrative fees the Company is contractually obligated to share with certain of its GPO clients. Net
administrative fees (a GAAP measure) are the Company's gross administrative fees net of its revenue
share obligation. Total net revenue (a GAAP measure) reflects the Company's gross fees net of
its revenue share obligation. These non-GAAP measures assist management and the board of directors and may be helpful to investors in
analyzing the Company's growth in its Spend and Clinical Resource Management segment given that
administrative fees constitute a material portion of the Company's revenue and are paid to the
Company by approximately 1,150 suppliers and other vendors contracted by its GPO, and that the Company's revenue share obligation
constitutes a significant outlay to certain of its GPO clients.
The Company defines: EBITDA as net income (loss) before net interest expense, income tax expense
(benefit), depreciation and amortization; and adjusted EBITDA as net income (loss) before net
interest expense, income tax expense (benefit), depreciation and amortization and other non-recurring, non-cash or non-operating items. EBITDA
and adjusted EBITDA are used by the Company to facilitate a comparison of its operating performance on
a consistent basis from period to period and provides for a more complete understanding of
factors and trends affecting our business. These measures assist management and the board of directors and may be useful to investors in
comparing the Company's operating performance consistently over time as it removes the impact of its
capital structure (primarily interest charges and amortization of debt issuance costs), asset
base (primarily depreciation and amortization) and items outside the control of the management team (taxes), as well as other non-cash (purchase
accounting adjustments and imputed rental income) and non-recurring items, from the Company’s
operational results. Adjusted EBITDA also removes the impact of non- cash share-based
compensation expense and certain restructuring, acquisition and integration-related charges. EBITDA and adjusted EBITDA are not measures of liquidity
under GAAP, or otherwise, and are not alternatives to cash flow from continuing operating activities. The
Company defines adjusted net income as earnings excluding non-cash acquisition-related intangible amortization and non-recurring expense items on a tax-adjusted
basis, non-cash tax-adjusted shared-based compensation expense, certain restructuring,
acquisition and integration-related expenses on a tax-adjusted basis, purchase
accounting adjustments on a tax-adjusted basis and diluted adjusted EPS as earnings per share
excluding non-cash acquisition-related intangible amortization, depreciation and
non-recurring expense items on a tax-adjusted basis, non-cash tax-adjusted shared-based compensation expense and certain restructuring, acquisition and integration-
related expenses on a tax-adjusted basis. Adjusted net income and diluted adjusted EPS are not
measures of liquidity under GAAP, or otherwise, and are not alternatives to cash flow from
continuing operating activities. Use of this measure for this purpose allows management and the board of directors to analyze the Company’s operating
performance on a consistent basis by removing the impact of certain non-cash and non-recurring
items from our operations, and by rewarding organic growth and accretive business
transactions. As a significant portion of senior management’s incentive based compensation has historically been based on the achievement of certain diluted
adjusted EPS growth over time, investors may find such information useful. The
Company defines free cash flow as cash provided by operating activities less purchases of property, equipment and software and capitalized software development
costs. Management believes free cash flow is an important measure because it represents the cash that
the Company is able to generate after spending capital on infrastructure to maintain its
business and investing in new and upgraded products and services to support future growth. Free cash flow is important because it allows the
Company to pursue opportunities that are intended to enhance shareholder value, which could include
debt reduction, share repurchases, partnerships, alliances and acquisitions, and/or dividend
payments. The Company's definition of free cash flow does not consider non-discretionary cash payments, such as debt.
|