Attached files
| file | filename |
|---|---|
| 8-K - 8-K - Sagent Pharmaceuticals, Inc. | d850630d8k.htm |
 Sagent
Pharmaceuticals 33
rd
Annual JP Morgan
Healthcare Conference
January 14, 2015
A Global Pharmaceutical
Company
Exhibit 99.1 |
 2
Disclaimer
Statements contained in this presentation contain forward-looking statements that are
subject to risks and uncertainties. All statements other than statements of
historical fact included in this presentation are forward-looking statements within the
meaning of the Private Securities Litigation Reform Act of 1995. Forward-looking
statements give Sagent's current expectations and projections relating to its
financial condition, results of operations, plans, objectives, future performance and business as of the
date of this presentation. You can identify forward-looking statements by the fact that
they do not relate strictly to historical or current facts. These statements may
include words such as "anticipate," "estimate," "expect," "project," "plan," "intend,"
"believe," "may," "will," "should," "can have,"
"likely" and other words and terms of similar meaning in connection with any
discussion of the timing or nature of future operating or financial performance or other events.
Sagent's expectations are not predictions of future performance, and future results may
substantially differ from current expectations based upon a variety of factors,
risks and uncertainties affecting Sagent's business, including, among others, our
reliance upon our business partners for timely supply of sufficient high quality API and
finished products in the quantities we require; the difficulty of predicting the
timing or outcome of product development efforts and global regulatory approvals; the
difficulty of predicting the timing and outcome of any pending litigation including litigation
involving third parties that may have an impact on the timing of Sagent's product
launches; the impact of competitive products and pricing and actions by Sagent's
competitors with respect thereto; the timing of product launches; compliance with FDA and
other global governmental regulations by Sagent and its third party
manufacturers; changes in laws and regulations; our ability to successfully integrate our newly
acquired Omega subsidiary; our ability to realize the expected benefits from our acquisition
of and investment in our China and Omega subsidiaries; the additional capital
investments we will be required to make in our international subsidiaries to achieve their
manufacturing potential; the implementation and maintenance of our new enterprise resource
planning software and other related applications and such other risks
detailed in Sagent's periodic public filings with the Securities and Exchange Commission, including
but not limited to Sagent's Quarterly Report on Form 10-Q for the period ended September
30, 2014, filed on November 4, 2014. Sagent disclaims and does not undertake any
obligation to update or revise any forward-looking statement in this press
release, except as required by applicable law.
This presentation includes a discussion of certain non-GAAP financial measures. Please
refer to the appendix to this presentation for further definition of these
measures and a reconciliation of such non-GAAP measures to the most closely comparable GAAP
measures.
|
 ABOUT SAGENT
PHARMACEUTICALS |
 4
Sagent Pharmaceuticals Overview
Fastest
growing
Generic
Injectables
company
in
the
U.S.
Market
Deepest
product
portfolio
in
the
industry
drives
strong
long-term
margin
and
revenue
growth
Extensive
global
partner
network
with
state-of-the-art
facilities
enabling
accelerated
growth
Solid
relationships
at
all
levels
of
the
supply
chain
enhancing
responsiveness
to
industry
demands
2013
acquisition
of
Sagent
China
Pharmaceuticals
(SCP)
supports
vertical
integration
and
provides
additional
growth
opportunities
and
an
increased
presence
in
China
Global
excellence
in
manufacturing
;
exceptional
quality
and
safety
track
record
Capacity
to
deliver
multiple
presentations
for
one
product
;
including
single
and
multi-dose
vials,
pre-filled
ready-to-use syringes, premix bags, emulsions and suspensions
2014
acquisition
of
Omega
Laboratories
supports
additional
vertical
integration
and
expands
global
footprint,
product portfolio, and industry-leading development pipeline |
 5
Omega Laboratories
Montreal, Canada
Development Manufacturing
Employees: 157
Sagent Global Headquarters
Schaumburg, Illinois
Administrative Corporate Office
Employees: 117
Sagent China Pharmaceuticals
Chengdu, China
Development Manufacturing
Employees: 190
Sagent Pharmaceuticals Operations |
 6
Generic Market Opportunity
Strictly Private and Confidential: For discussion Purposes Only,
Subject to Due Diligence
Significant macro economic and industry factors driving demand and creating opportunities
(1)
Growth
Statistics
based
on
Frost
&
Sullivan
“Generic
Pharmaceuticals
Market
–
A
Global
Analysis”,
December
2011
Generic
Market
set
to
increase
by
$100
Billion
in
5
years
(1)
Expected
to
reach
$231
billion
globally
by 2017
Injectable
drugs
represents
largest
opportunity
with
10%
growth
rate
annually
Sagent delivers a consistent, reliable supply of quality products which is paramount
to healthcare customers
(GPOs, Hospitals, Wholesalers, Distributors)
•
China, India, Russia, Brazil,
Turkey and S. Korea
•
All within Sagent’s existing
footprint
•
As many as 300 shortages
annually in U.S.
•
Majority are injectable products
•
Creating vast opportunities
INDUSTRY
CONSOLIDATION
GLOBAL
POTENTIAL
DRUG
SHORTAGES |
 7
Business Model with Proven Track Record
(1) As of December 31, 2014
44 Partners Worldwide
(1)
API providers, development, global
manufacturing locations
Sagent China
Pharmaceuticals/GRC
Vertically integrated
manufacturing and State-of
the-art research capability
Omega Laboratories
Market leading Canadian specialty
Pharma company
Sagent Agila LLC
Covers 18 products represented by 28
ANDAs
(1)
Leveraging a global partner network, vertically integrated manufacturing and research
capabilities
in
China
and
Canada
and
extensive
product
lifecycle
management
expertise
Key Highlights
•
Track record of strong performance on
ANDA
submissions,
ANDA
approvals
and
product launches
•
Extensive pipeline with
75 ANDAs pending
approval
or
launch
(1)
and
68
products
in
development or submitted in the US, 26 products
in development or submitted in
Canada
(1)
•
54
marketed
products
,
158
presentations
in
the
US,
and
62
marketed
products
,
153
presentations in Canada
(1)
•
Indications
including
anti-infective,
oncolytic
and critical care
•
Multiple
presentation
capabilities
:
single
and multi-dose vials, pre-filled ready-to-use
syringes, premix bags, emulsions and
suspensions
Unique
approach
enables
development
of
one
of
the
broadest
product portfolios and deepest pipelines in the industry
Evolving Partnerships
Sophisticated technology and low costs |
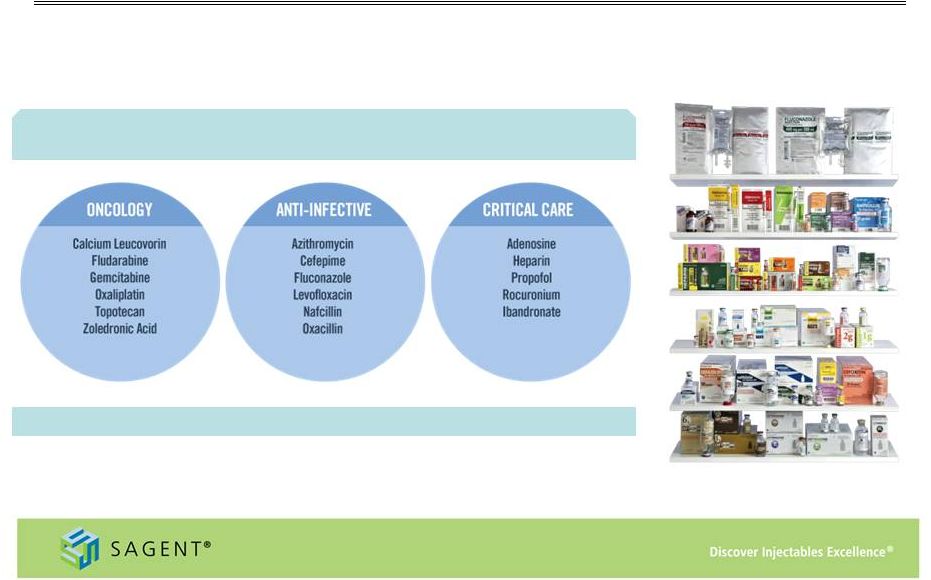 8
Growing Product Portfolio
Wide
range
of
marketed
products
–
54
products
and
158
SKUs
(1)
–
with
30%
of
the
portfolio
holding
the
#1
or
#2
market
position
(1)
As of December 31, 2014
(2)
Based on November 2014 IMS data
Key indication areas and products include:
Filed an additional 15 products in 2014
(2) |
 9
Strong Sequential Growth
(1)
Mid-point of Guidance as issued in 3Q’14 earnings release on November 4, 2014
(1)
Revenue
Forecast Revenue
Adjusted GP%
(2)
Heparin
Topotecan
Levofloxacin
Gemcitabine
Oxaliplatin
Oxacillin
Leucovorin
Zoledronic Acid
Docetaxel
Propofol
Adenosine
GLYDO
TM
Key Launches
$350
$300
$250
$200
$150
$100
$50
$0
2010
35.0%
30.0%
25.0%
20.0%
15.0%
10.0%
5.0%
0.0%
2011
2012
2013
2014
12.8%
13.7%
20.0%
32.8%
31.5%
(2)
Adjusted
Gross
Profit
as
a
percentage
of
net
revenues
is
a
non-GAAP
meausre.
Please
refer
to
slide
#28:
Appendix
–
Non
GAAP
Reconciliation
for
further
detail |
 10
2014 Guidance
Revenue
Adjusted Gross Profit
(3)
Operating Expenses
Net income
(1)
Guidance as issued in 4Q ’13 earnings release on February 11, 2014
(2)
Guidance as issued in 3Q’14 earnings release on November 4, 2014
(3)
Adjusted
Gross
Profit
as
a
percentage
of
net
revenues
is
a
non-GAAP
meausre.
Please
refer
to
slide
#28:
Appendix
–
Non
GAAP
Reconciliation
for
further
detail
$250M -
$290M
24% -
28%
Initial
(1)
Current
(2)
30% -
33%
$275M -
$285M
$65M -
$76M
$67M -
$73M
$10M Loss to
$10M Earnings
$5M -
$10M
Earnings |
 GROWTH
DRIVERS |
 12
Catalysts Driving Shareholder Value
Sagent’s stock does not fully reflect the multiple
drivers of growth and upside opportunities
History of successful product
launches at market formation
Leading product
market share position
Unmatched development capability and
strong record of ANDA approvals
Robust product pipeline
Geographic expansion in
high growth markets |
 13
Robust Product Pipeline
More products in the pipeline than existing portfolio, includes:
Notable Pipeline Features
9 505(b)2s
with
$3.0 Billion
Total Market Opportunity
17 Potential PIVs
with over
$7 Billion
Total Market Opportunity
11 Novel Products
with
$2.3 Billion
Total Market Opportunity
13 High Value
Opportunities
with over
$8.2 Billion
Total Market Opportunity
(1) Based on November 2014 IMS data
Pipeline
represents
an
IMS
value
in
excess
of
$11.8
billion
(1)
•
Maintaining leading product launch track record
Launched
7
products
in 2014, despite a difficult FDA environment
15
ANDA
filings during 2014
•
42
products represented by
64
ANDAs under review by the FDA
•
3
products represented by
11
ANDAs recently approved and pending commercial launch |
 14
Key Products Driving Growth
Successful Launches
Zoledronic Acid
Propofol
Adenosine Injection
•
Launched vials in March 2013 at
market formation, followed by 4mg
and 5mg pre-mixed bags in second
half of 2013
•
Market is approximately $200M
(1)
•
Multiple presentation strategy
demonstrates the strength of
Sagent’s model
•
Launched in November 2013
•
Market is approximately $265M
(1)
•
Generic form of Adenoscan®
•
Launched product after Teva
exclusivity expired in March 2014
•
Market is approximately $36M
(1)
•
Sagent sales organization has extensive
historical experience with the product
(1) Based on November 2014 IMS data |
 15
Key Products Driving Growth (con’t)
Future Launches
Iron Sucrose
Pentobarbital
Enoxaparin
Fulvestrant
Bendamustine
•
Generic form of
Venofer®
•
High barrier to entry for
generic manufacturing
•
Received FDA Complete
Response Letter in
December 2013
•
Market is ~$335M
(1)
•
Generic form of
Nembutal®
•
High barrier to entry for
generic manufacturing;
Sagent will be first
generic
•
Anticipate approval in
second half of 2015
•
Market is ~$30M
•
Generic form of
Lovenox®
•
Single-dose PFS’s with
automatic safety device
filed with FDA
•
High barriers to entry
due to product
complexity and API
supply
•
Market is ~$1.35B
(1)
•
Generic form of
Faslodex®
•
Two PFS kit designed for
clinician IM injection
filed with FDA
•
Sagent to be at market
formation October 2016
•
Market is ~$340M
(1)
•
Generic form of
Treanda®
•
Both vial presentation
filed with FDA
•
High barrier to entry due
to manufacturing
complexity
•
Market is approximately
$690M
(1)
(1) Based on November 2014 IMS data |
 16
Vertical Integration
Benefiting from Sagent China Pharmaceuticals (SCP) investment
Acquired remaining 50% of our
JV in China (June of 2013)
•
State-of-the-art isolator technology
for aseptic filing
•
FDA and current Good
Manufacturing Practices compliant
facility
•
Facility received EIR in the first half
of 2013; first product launched in
November 2013
•
Multiple products developed and
filed from SCP in 2013 and 2014
•
First CBE-30 approval for Atracurium
received December 2014
Unique and flexible business:
•
Sagent controls its own destiny
•
Increases responsiveness to drug shortages
•
Targeted to support 25% of capacity
Pursuing additional product development
and capacity expansion investment
•
$12
-
$16
million
annual
operating
costs
•
$30
-
$35
million
capital
expansion
in
high speed isolator technology |
 17
Expansion Opportunities in China Pharma Market
Sagent’s FDA approved facility on mainland China creates significant
competitive advantages within the domestic Chinese market opportunity
•
Expected to be 2nd largest pharmaceutical
market
•
Market growth driven by increasing demand
in cities and provinces and growth of the
middle class
•
Demand for high quality drugs growing and
price is aligning with developed markets
•
Regulatory pathway evolving
•
Local drug shortages may drive improved
pricing and regulatory harmonization
•
Develop injectable formulations for the US
and global markets
•
Focus on developing and formulating niche
products and complex molecules
•
Located in a leading Science and Technology
Center in Chengdu, China
•
Positions Sagent as a global thought leader
China Market Opportunity
Global Research Center |
 18
Omega Laboratories
Sagent has acquired Omega Laboratories Limited (“Omega”), a market
leading specialty pharmaceutical company based in Montreal, Canada.
•
Transaction closed on October 1, 2014
•
Sagent acquired Omega for approximately
USD $83M (C$93M)
•
Immediately accretive to cash earnings
•
Financed entirely with cash on the
balance sheet
•
Expected to contribute $6 -
$8 million in
revenues in 2014
The combination of Sagent and Omega creates a premier generic injectable company with a
robust product portfolio, deep development pipeline and strong global presence.
|
 19
Omega Laboratories Profile
2011
Compound Annual Growth Rate (CAGR) = 22.6%
2013 Revenues = C$ 36.5 million
Omega has been providing
the Canadian market with
a comprehensive line of
innovative pharmaceutical
products since 1958.
62
products,
153
presentations
marketed in Canada
International distribution in over
40 countries
26
generic injectable drugs
scheduled to be launched
between
2014 and
2019 2012
2013 |
 20
M&A Strategy
Sagent has the bandwidth and the balance sheet to pursue
additional acquisitions that meet the following criteria:
Strengthens product portfolio and pipeline
Expands global footprint
Enhances long-term growth profiles
•
Provides new products that can be immediately monetized
•
Fit well or are complementary to existing portfolio
•
Provide manufacturing and development capabilities
•
Immediately accretive to business
•
Organic growth investment in product development must be
augmented by M&A activity |
 21
Strong and Experienced Management Team
Jeffrey Yordon
CEO & Chairman
James Hussey
President
Jonathon Singer
EVP & CFO
Michael Logerfo
EVP Legal
Albert Patterson
EVP, Natl Accts & Corp Dev
Lorin Drake
Corp VP Sales
Sheila Moran
CVP Global QA & Facility Compliance
Tom Moutvic
VP RA
Ravi Malhotra
CSO
YorPharm Inc. |
 2015
OUTLOOK |
 23
2015 Financial Guidance
Revenue
$325M -
$375M
Adjusted Gross Profit
(1)
Operating Expenses
Adjusted EBITDA
(2)
$20M -
$50M
(1)
Adjusted
Gross
Profit
is
a
non-GAAP
measure.
Please
refer
to
slide
#28:
Appendix
–
Non
GAAP
Reconciliation
for
further
detail.
(2)
Adjusted
EBITDA
is
a
non=GAAP
measure.
Please
refer
to
slide
#29:
Appendix
–
Non
GAAP
Reconciliation
for
further
detail.
27% -
31%
$80M -
$90M |
 24
Key Variables for 2015
The following variables could have a potential impact on the performance of the
business in the new year, and Sagent is taking steps to maximize/mitigate the impact:
?
OPPORTUNITIES
CHALLENGES
•
Shortage strategy and investment
•
SCP product transfers and Global
Research Center development
activity
•
Pricing
•
Guaranteed supply agreements
•
Government contracts
•
GPO contract renewals
•
Slowdown at FDA
•
Key product delays (Iron Sucrose,
Pentobarbital)
•
Actavis product bundle replacement
•
Mylan/Agila regulatory delays
•
Heparin pricing erosion due to
increasingly competitive environment
•
GPO contract renewals |
 |
 APPENDIX |
 27
Appendix –
Non-GAAP Reconciliation
Adjusted Gross Profit
We use the
non-GAAP financial measure “Adjusted Gross Profit” and corresponding ratios. We define Adjusted Gross Profit as gross profit plus our share of the gross profit
earned through our Sagent Agila joint venture which is included in the Equity in net (income)
loss of joint ventures line on the Consolidated Statements of Operations and the impact
of product-related non-cash charges arising from business combinations. We believe that Adjusted Gross Profit is relevant and useful supplemental information for our
investors. Our management believes that the presentation of this non-GAAP financial
measure, when considered together with our GAAP financial measures and the
reconciliation to the most directly comparable GAAP financial measure, provides a more
complete understanding of the factors and trends affecting Sagent than could be
obtained absent these disclosures. Management uses Adjusted Gross Profit and corresponding
ratios to make operating and strategic decisions and evaluate our performance. We
have disclosed this non-GAAP financial measure so that our investors have the same financial data that management uses with the intention of assisting you in making
comparisons to our historical operating results and analyzing our underlying
performance. Our management believes that Adjusted Gross Profit provides a useful supplemental
tool to consistently evaluate the profitability of our products. The limitation of this
measure is that it includes items that do not have an impact on gross profit reported in
accordance with GAAP. The best way that this limitation can be addressed is by using
Adjusted Gross Profit in combination with our GAAP reported gross profit. Because
Adjusted Gross Profit calculations may vary among other companies, the Adjusted Gross Profit
figures presented below may not be comparable to similarly titled measures used by
other companies. Our use of Adjusted Gross Profit is not meant to and should not be considered in isolation or as a substitute for, or superior to, any GAAP financial measure.
You should carefully evaluate the following tables reconciling Adjusted Gross Profit to our
GAAP reported gross profit for the periods presented (dollars in thousands).
EBITDA and Adjusted EBITDA We use the non-GAAP
financial measures “EBITDA” and “Adjusted EBITDA” and corresponding growth ratios. We define EBITDA as net income less interest expense, net of
interest income, provision for income taxes, depreciation and amortization. We define Adjusted
EBITDA as net income less interest expense, net of interest income, provision for
income taxes, depreciation and amortization and stock-based compensation expense. We
believe that EBITDA and Adjusted EBITDA are relevant and useful supplemental
information for our investors. Our management believes that the presentation of these
non-GAAP financial measures, when considered together with our GAAP financial
measures and the reconciliation to the most directly comparable GAAP financial measures,
provides a more complete understanding of the factors and trends affecting Sagent than
could be obtained absent these disclosures. Management uses EBITDA, Adjusted EBITDA and corresponding ratios to make operating and strategic decisions and evaluate
our performance. We have disclosed these non-GAAP financial measures so that our investors
have the same financial data that management uses with the intention of assisting you
in making comparisons to our historical operating results and analyzing our underlying performance. Our management believes that EBITDA and Adjusted EBITDA are useful
supplemental tools to evaluate the underlying operating performance of the company on an
ongoing basis. The limitation of these measures is that they exclude items that have an
impact on net income. The best way that these limitations can be addressed is by using EBITDA and Adjusted EBITDA in combination with our GAAP reported net income.
Because EBITDA and Adjusted EBITDA calculations may vary among other companies, the EBITDA and
Adjusted EBITDA figures presented below may not be comparable to similarly titled
measures used by other companies. Our use of EBITDA and Adjusted EBITDA is not meant to and should not be considered in isolation or as a substitute for, or
superior to, any GAAP financial measure.
|
 28
Appendix –
Non-GAAP Reconciliation
2010
2011
2012
2013
2010
2011
2012
2013
Adjusted Gross Profit
9,460
$
20,833
$
36,746
$
80,249
$
12.8%
13.7%
20.0%
32.8%
Sagent portion of gross profit
earned by Sagent Agila joint
venture
417
2,064
5,639
2,727
0.6%
1.4%
3.1%
1.1%
Product-related non-cash charges
from business combinations
-
-
-
-
-
-
-
-
Gross Profit
9,043
$
18,769
$
31,107
$
77,522
$
12.2%
12.3%
16.9%
31.7%
Sagent's business plan for fiscal 2014 and 2015 currently anticipates:
2014
2015
Adjusted Gross Profit
30% - 33%
27% - 31%
Sagent portion of gross profit
earned by Sagent Agila joint
venture
1% - 2%
1% - 2%
Product-related non-cash charges
from business combinations
-
1% - 2%
Gross Profit
29% - 31%
25% - 27%
Percentage of net revenues
Year ended December 31,
Year ended December 31,
twelve months ended December 31,
Percentage of net revenues |
 29
Appendix –
Non-GAAP Reconciliation
Sagent's business plan for fiscal 2015 currently anticipates:
Twelve months ended
December 31, 2015
Adjusted EBITDA
$20 million - $50 million
Stock-based compensation expense
$4 million - $5 million
EBITDA
$16 million - $45 million
Depreciation and amortization expense
$15 million - $17 million
Interest expense, net
$1 million - $2 million
Provision for income taxes
$3 million - $15 million
Net income
$ 3 million loss to $13 million earnings |