Attached files
| file | filename |
|---|---|
| 8-K - FORM 8-K - NAUTILUS, INC. | d850305d8k.htm |
Exhibit 99.1
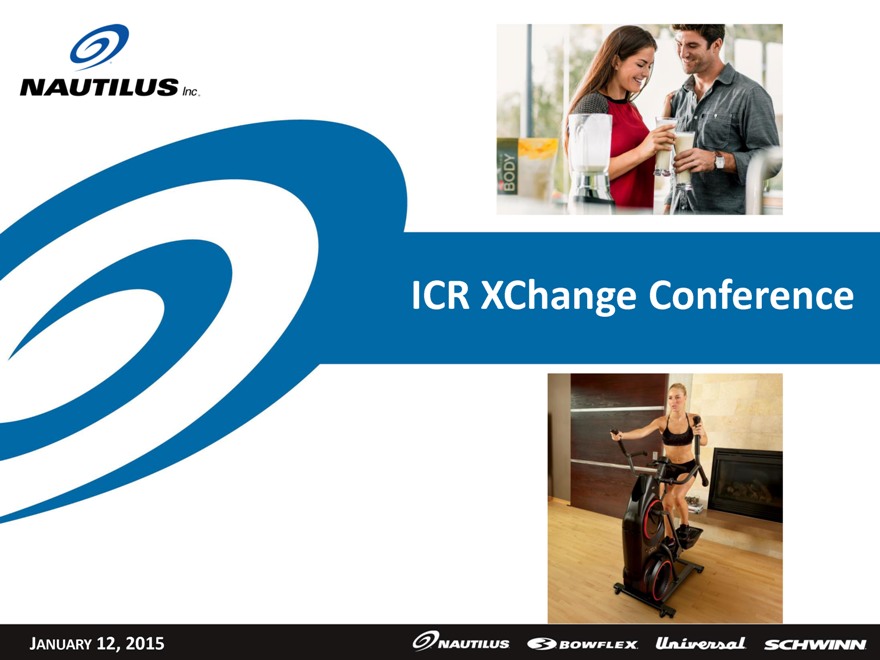
NAUTILUS Inc.
ICR
XChangeConference
JANUARY 12, 2015
NAUTILUS
BOWFLEX
Universal
SCHWINN
Safe Harbor Statement
This presentation includes forward-looking statements (statements which are not historical facts) within the meaning of the Private Securities Litigation Reform
Act of 1995, including statements concerning the Company’s prospects, resources, capabilities, current or future financial trends or operating results, demand for the Company‘s products, future plans for introduction of new products and
the anticipated outcome of new business initiatives, estimates of market size and growth, planned capital expenditures and statements concerning our ability to finance growth plans with cash generated from our operations. Factors that could cause
Nautilus, Inc.’s actual results to differ materially from these forward-looking statements include our ability to acquire inventory from sole source foreign manufacturers at acceptable costs, within timely delivery schedules and that meet our
quality control standards, availability and price of media time consistent with our cost and audience profile parameters, a decline in consumer spending due to unfavorable economic conditions in one or more of our current or target markets, an
adverse change in the availability of credit for our customers who finance their purchases, our ability to pass along vendor raw material price increases and increased shipping costs, our ability to effectively develop, market and sell future
products, our ability to protect our intellectual property, and the introduction of competing products. Additional assumptions, risks and uncertainties are described in detail in our registration statements, reports and other filings with the
Securities and Exchange Commission, including the “Risk Factors” set forth in our Annual Report on Form 10-K, as supplemented by our quarterly reports on Form 10-Q. Such filings are available on our website or at www.sec.gov. You are
cautioned that such statements are not guarantees of future performance and that actual results or developments may differ materially from those set forth in the forward-looking statements. We undertake no obligation to publicly update or revise
forward-looking statements to reflect subsequent events or circumstances.
Unless otherwise indicated, all information regarding our operating results pertain to
continuing operations.
© Nautilus, Inc. 2015
NAUTILUS
BOWFLEX
Universal
SCHWINN
2
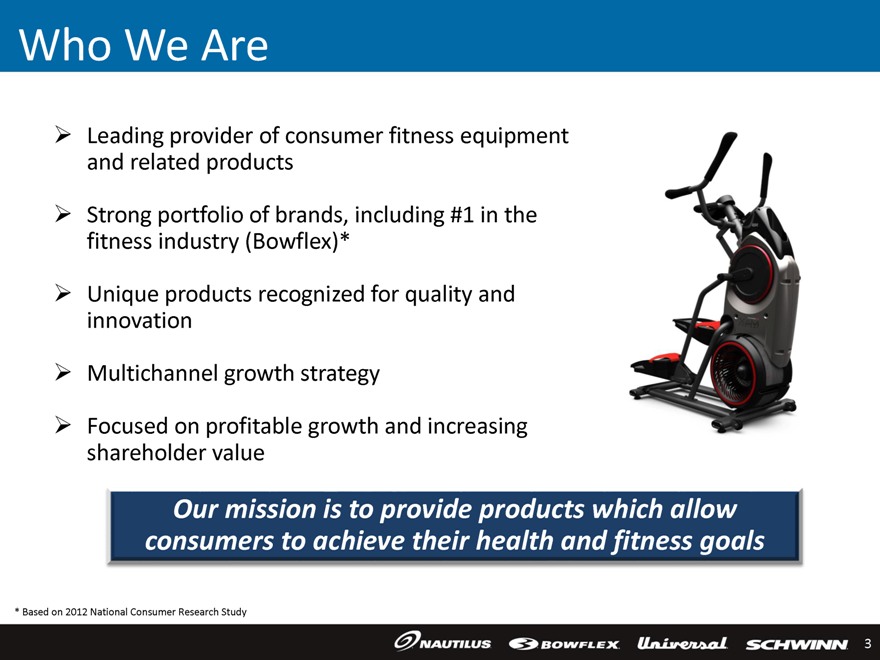
Who We Are
Leading
provider of consumer fitness equipment and related products
Strong portfolio of brands, including #1 in the fitness industry (Bowflex)*
Unique products recognized for quality and innovation
Multichannel growth strategy
Focused on profitable growth and increasing shareholder value
Our mission is to provide
products which allow consumers to achieve their health and fitness goals
* Based on 2012 National Consumer Research Study
NAUTILUS
BOWFLEX
Universal
SCHWINN
3
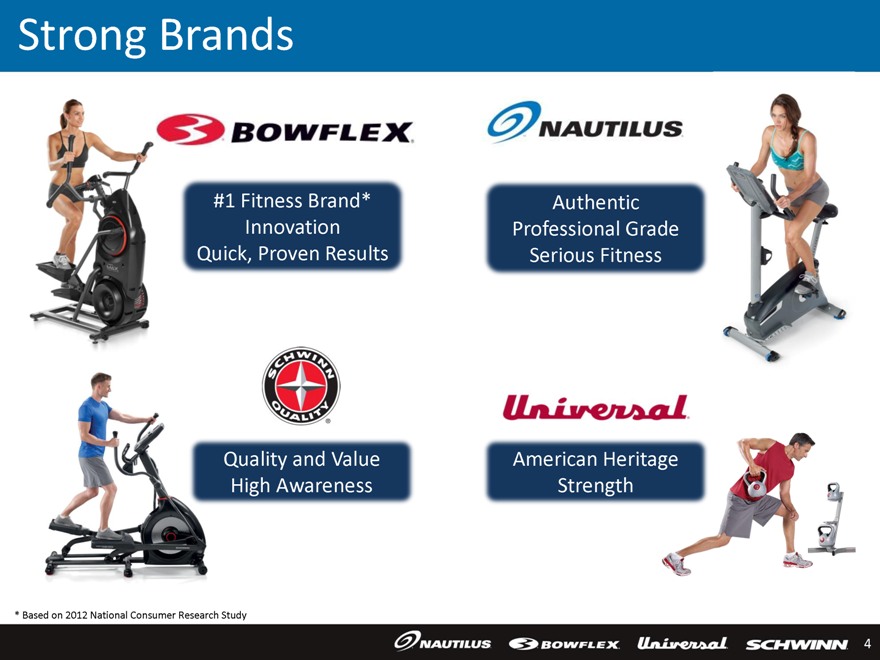
Strong Brands
BOWFLEX
#1 Fitness Brand* Innovation Quick, Proven Results
SCHWINN QUALITY ®
Quality and Value
High Awareness
NAUTILUS
Authentic Professional Grade Serious Fitness
Universal
American Heritage Strength
* Based on 2012 National Consumer Research Study
NAUTILUS
BOWFLEX
Universal
SCHWINN
4
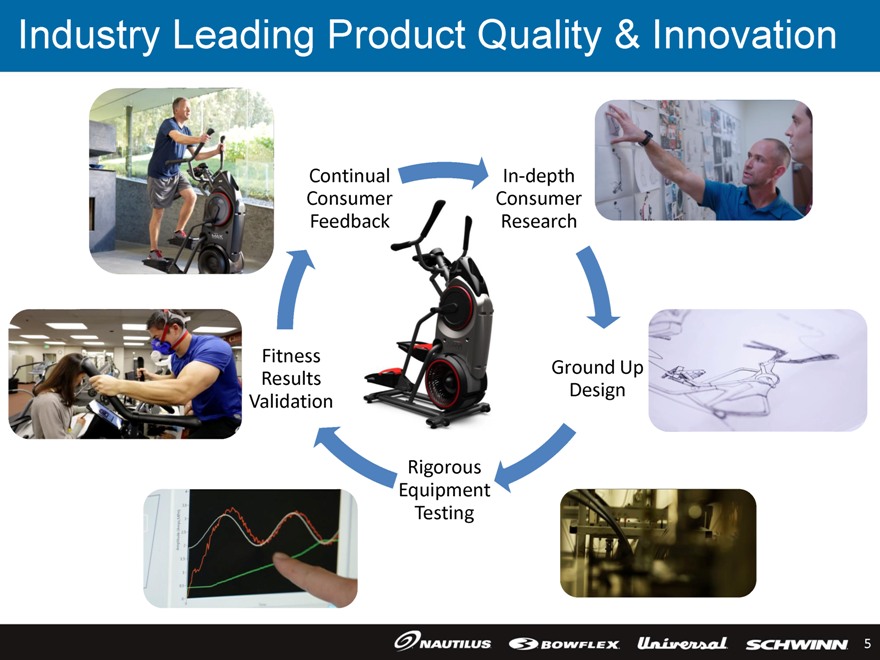
Industry Leading Product Quality & Innovation
Continual Consumer Feedback
Fitness Results Validation
Rigorous Equipment Testing
Ground Up Design
In-depth Consumer Research
NAUTILUS
BOWFLEX
Universal
SCHWINN
5
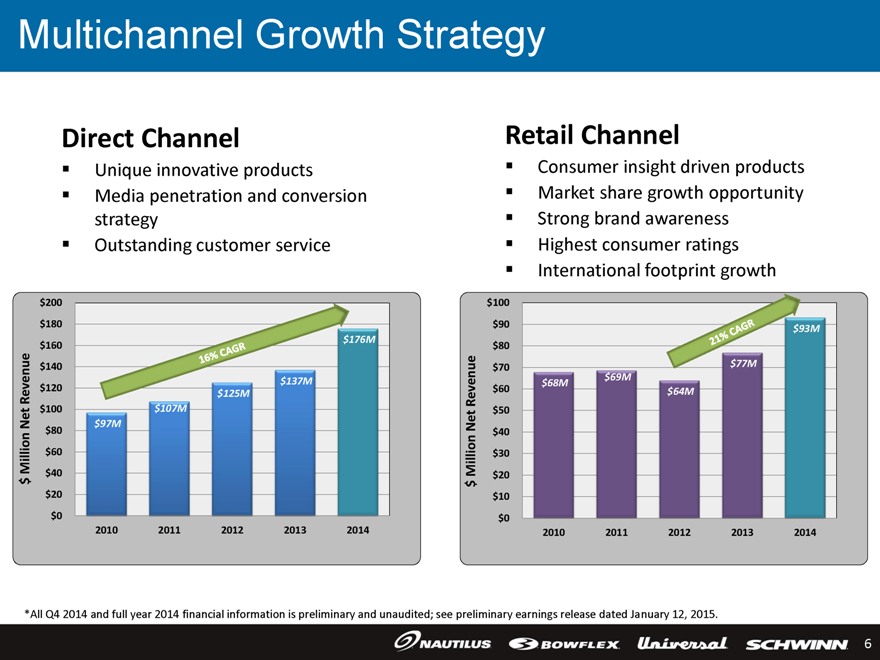
Multichannel Growth Strategy
Direct Channel
Unique innovative products
Media penetration and conversion strategy
Outstanding customer service
$ Million Net Revenue
$200 $180 $160 $140 $120 $100 $80 $60 $40 $20 $0
16% CAGR
$97M $107M $125M $137M $176M
2010 2011 2012 2013 2014
Retail Channel
Consumer insight driven products
Market share growth opportunity
Strong brand awareness
Highest consumer ratings
International footprint growth
$ Million Net Revenue
$100 $90 $80 $70 $60 $50 $40 $30 $20 $10 $0
21% CAGR
$68M $69M
$64M $77M
$93M
2010 2011 2012 2013 2014
*All Q4 2014 and full year 2014 financial information is preliminary and unaudited; see preliminary earnings release dated January 12, 2015.
NAUTILUS
BOWFLEX
Universal
SCHWINN
6
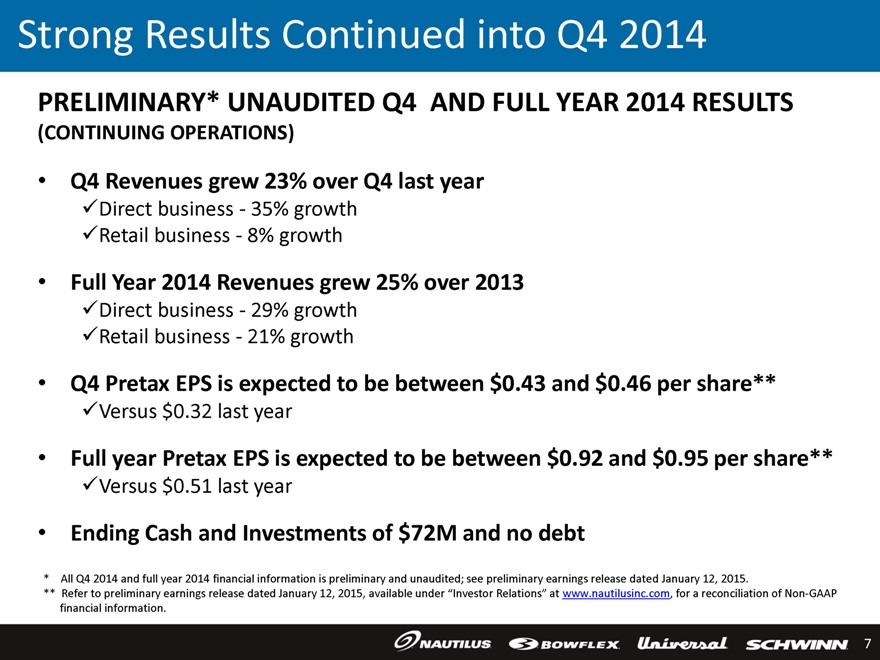
Strong Results Continued into Q4 2014
PRELIMINARY* UNAUDITED Q4 AND FULL YEAR 2014 RESULTS
(CONTINUING OPERATIONS)
Q4 Revenues grew 23% over Q4 last year
Direct business - 35% growth
Retail business - 8% growth
Full Year 2014 Revenues grew 25% over 2013
Direct business - 29% growth
Retail business - 21% growth
Q4 Pretax EPS is expected to be between $0.43 and $0.46 per share**
Versus $0.32 last year
Full year Pretax EPS is expected to be between $0.92 and $0.95 per share**
Versus $0.51 last year
Ending Cash and Investments of $72M and no debt
* All Q4 2014 and full year 2014 financial information is preliminary and unaudited; see preliminary earnings release dated January 12, 2015.
** Refer to preliminary earnings release dated January 12, 2015, available under “Investor Relations” at www.nautilusinc.com, for a reconciliation of Non-GAAP
financial information.
NAUTILUS
BOWFLEX
Universal
SCHWINN
7
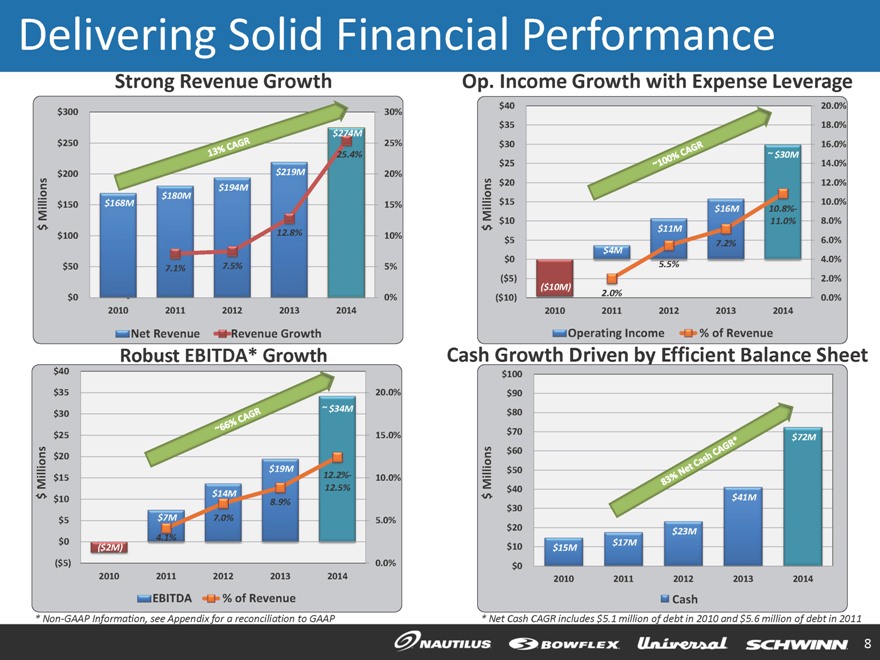
Delivering Solid Financial Performance Strong Revenue Growth $ Millions $300 $250 $200 $150 $100 $50 $0 13% CAGR $168M $194M $180M $219M $274M 7.1% 7.5% 12.8% 25.4% 30% 25% 20% 15% 10% 5% 0% 2010 2011 2012 2013 2014 Net Revenue Revenue Growth Robust EBITDA* Growth $ Millions $40 $35 $30 $25 $20 $15 $10 $5 $0 ($5) 67% CAGR ~66% CAGR ($2M) $7M $14M $19M ~ $34M 4.1% 7.0% 8.9% 12.2%-12.5% 20.0% 15.0% 10.0% 5.0% 0.0% 2010 2011 2012 2013 2014 EBITDA % of Revenue * Non-GAAP Information, see Appendix for a reconciliation to GAAP Op. Income Growth with Expense Leverage $ Millions $40 $35 $30 $25 $20 $15 $10 $5 $0 ($5) ($10) ~100% CAGR ($10M) $4M $11M $16M ~ $30M 2.0% 5.5% 7.2% 10.8%-11.0% 20.0% 18.0% 16.0% 14.0% 12.0% 10.0% 8.0% 6.0% 4.0% 2.0% 0.0% 2010 2011 2012 2013 2014 Operating Income % of Revenue Cash Growth Driven by Efficient Balance Sheet $ Millions $0 $10 $20 $30 $40 $50 $60 $70 $80 $90 $100 83% Net Cash CAGR* $15M $17M $23M $41M $72M 2010 2011 2012 2013 2014 Cash * Net Cash CAGR includes $5.1 million of debt in 2010 and $5.6 million of debt in 2011 NAUTILUS BOWFLEX Universal SCHWINN 8
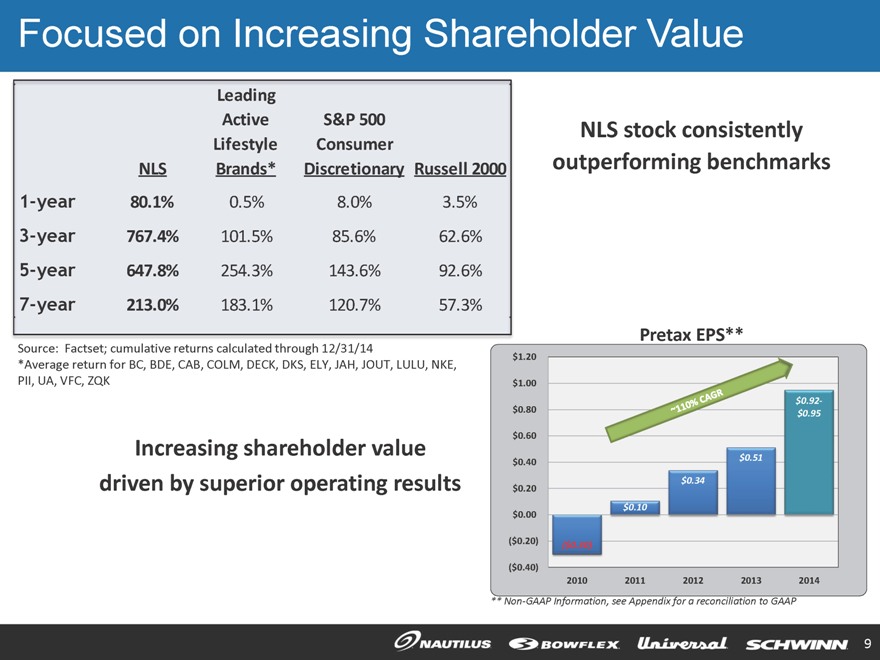
Focused on Increasing Shareholder Value NLS Leading Active Lifestyle Brands* S&P 500 Consumer Discretionary Russell 2000 1-year 80.1% 0.5% 8.0% 3.5% 3-year 767.4% 101.5% 85.6% 62.6% 5-year 647.8% 254.3% 143.6% 92.6% 7-year 213.0% 183.1% 120.7% 57.3% Source: Factset; cumulative returns calculated through 12/31/14 *Average return for BC, BDE, CAB, COLM, DECK, DKS, ELY, JAH, JOUT, LULU, NKE, PII, UA, VFC, ZQK Increasing shareholder value driven by superior operating results NLS stock consistently outperforming benchmarks Pretax EPS** $1.20 $1.00 $0.80 $0.60 $0.40 $0.20 $0.00 ($0.20) ($0.40) ~110% CAGR ($0.30) $0.10 $0.34 $0.51 $0.92-$0.95 2010 2011 2012 2013 2014 ** Non-GAAP Information, see Appendix for a reconciliation to GAAP NAUTILUS BOWFLEX Universal SCHWINN 9

NAUTILUS Inc.
Retail
Growth Drivers
10
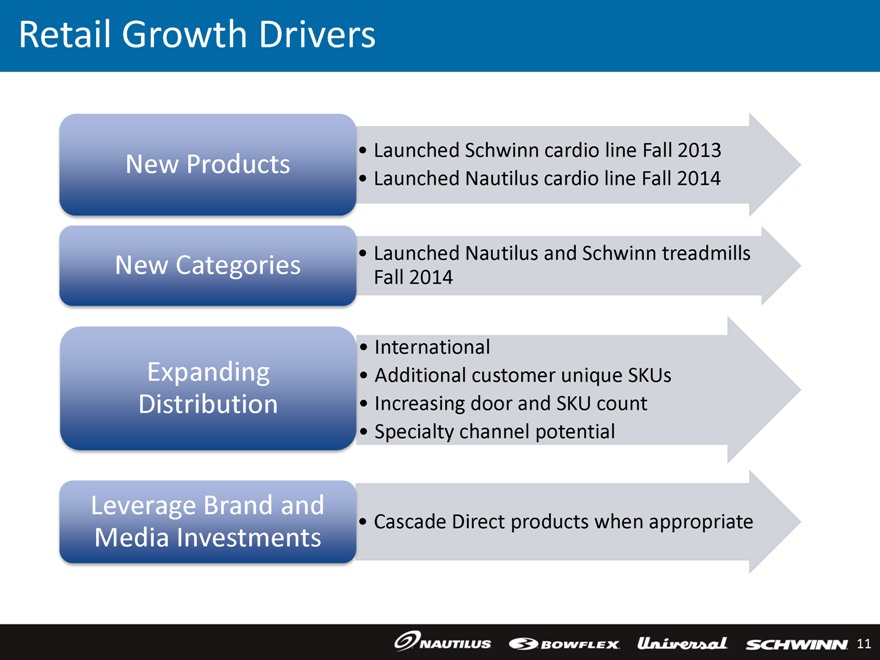
Retail Growth Drivers
New
Products
Launched Schwinn cardio line Fall 2013
Launched Nautilus cardio line
Fall 2014
New Categories
Launched Nautilus and Schwinn treadmills Fall 2014
Expanding Distribution
International
Additional customer unique SKUs
Increasing door and SKU count
Specialty channel potential
Leverage Brand and Media Investments
Cascade Direct products when appropriate
NAUTILUS
BOWFLEX
Universal
SCHWINN
11
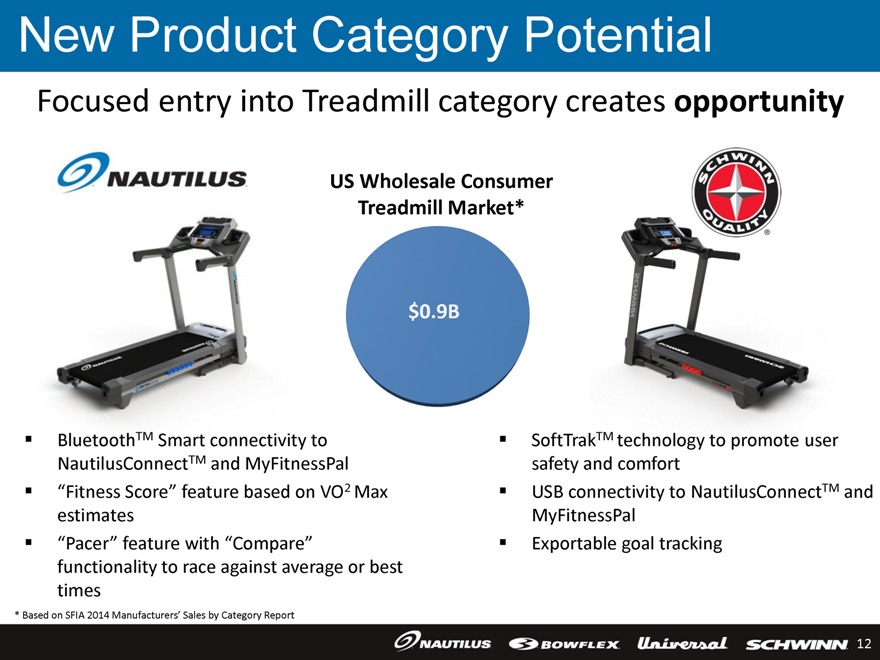
New Product Category Potential
Focused entry into Treadmill category creates opportunity
NAUTILUS
BluetoothTM Smart connectivity to NautilusConnectTM and MyFitnessPal
“Fitness Score”
feature based on VO2 Max estimates
“Pacer” feature with “Compare” functionality to race against average or best times
US Wholesale Consumer
Treadmill Market*
$0.9B
SCHWINN
QUALITY
SoftTrakTM technology to promote user safety and comfort
USB connectivity to NautilusConnectTM and MyFitnessPal
Exportable goal tracking
* Based on SFIA 2014 Manufacturers’ Sales by Category Report
NAUTILUS
BOWFLEX
Universal
SCHWINN
12
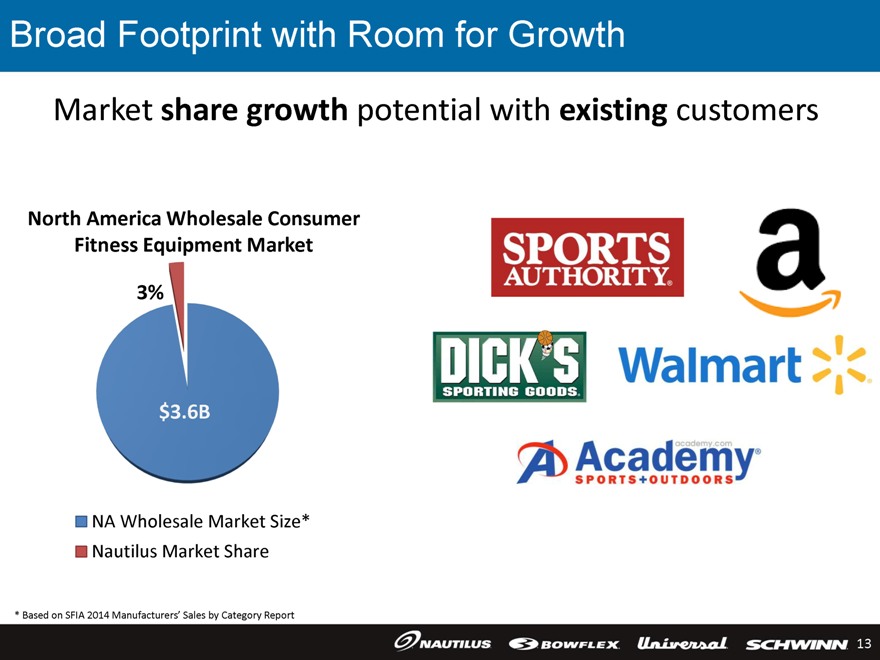
Broad Footprint with Room for Growth
Market share growth potential with existing customers
North America Wholesale Consumer Fitness
Equipment Market
3%
$3.6B
NA Wholesale Market Size*
Nautilus Market Share
* Based on SFIA 2014 Manufacturers’ Sales by Category Report
SPORTS AUTHORITY
DICKS
SPORTING GOODS
a
Walmart
A Academy academy.com
SPORTS+OUTDOORS
NAUTILUS
BOWFLEX
Universal
SCHWINN
13
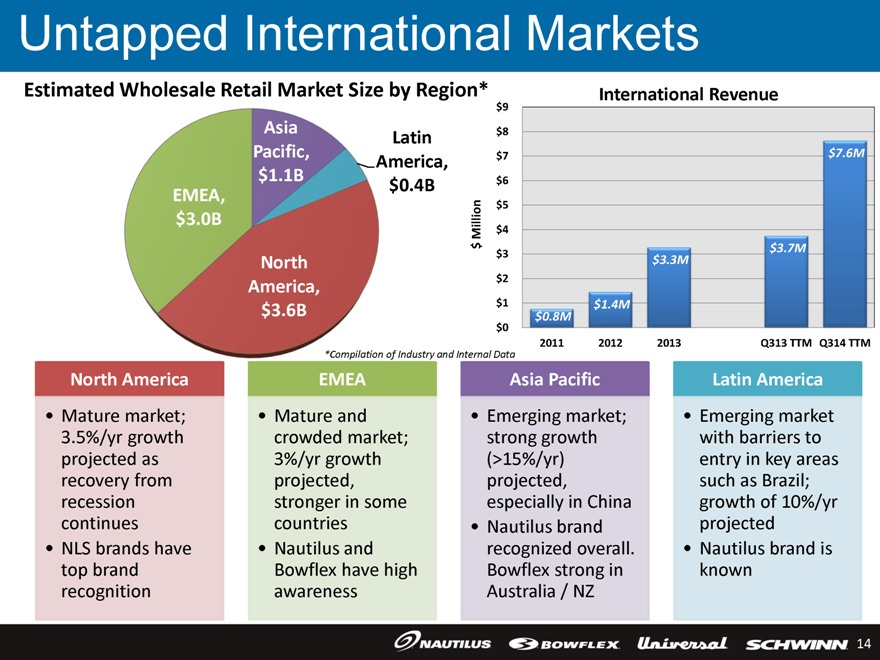
Untapped International Markets Estimated Wholesale Retail Market Size by Region* EMEA, $3.0B Asia Pacific, $1.1B North America, $3.6B Latin America, $0.4B *Compilation of Industry and Internal Data International Revenue $ Million $9 $8 $7 $6 $5 $4 $3 $2 $1 $0 $0.8M $1.4M $3.3M $3.7M $7.6M 2011 2012 2013 Q313 TTM Q314 TTM North America Mature market; 3.5%/yr growth projected as recovery from recession continues NLS brands have top brand recognition EMEA Mature and crowded market; 3%/yr growth projected, stronger in some countries Nautilus and Bowflex have high awareness Asia Pacific Emerging market; strong growth (>15%/yr) projected, especially in China Nautilus brand recognized overall. Bowflex strong in Australia / NZ Latin America Emerging market with barriers to entry in key areas such as Brazil; growth of 10%/yr projected Nautilus brand is known NAUTILUS BOWFLEX Universal SCHWINN 14

NAUTILUS Inc
Direct
Growth Drivers
15
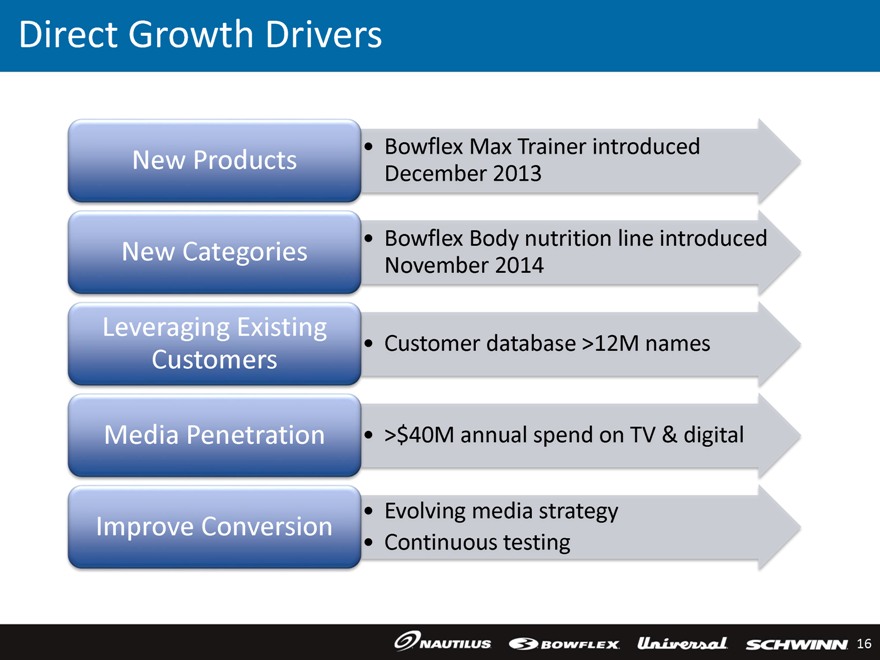
Direct Growth Drivers
New
Products
Bowflex Max Trainer introduced December 2013
New Categories
Bowflex Body nutrition line introduced November 2014
Leveraging Existing
Customers
Customer database >12M names
Media Penetration
>$40M annual spend on TV & digital
Improve Conversion
Evolving media strategy
Continuous testing
NAUTILUS
BOWFLEX
Universal
SCHWINN
16
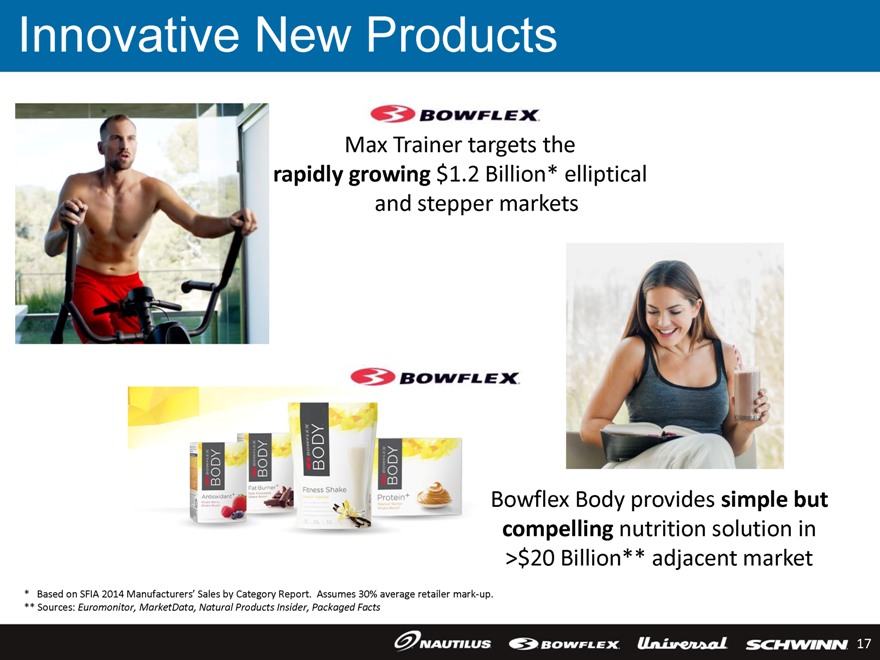
Innovative New Products
BOWFLEX
Max Trainer targets the rapidly growing $1.2 Billion* elliptical and
stepper markets
BOWFLEX
BOWFLEX BODY
Antioxidant
BOWFLEX BODY
Fat Burner
BOWFLEX BODY
Fitness Shake
BOWFLEX BODY
Protein +
Bowflex Body provides simple but compelling nutrition solution in
>$20 Billion** adjacent market
* Based on SFIA 2014 Manufacturers’ Sales by Category
Report. Assumes 30% average retailer mark-up.
** Sources: Euromonitor, MarketData, Natural Products Insider, Packaged Facts
NAUTILUS
BOWFLEX
Universal
SCHWINN
17
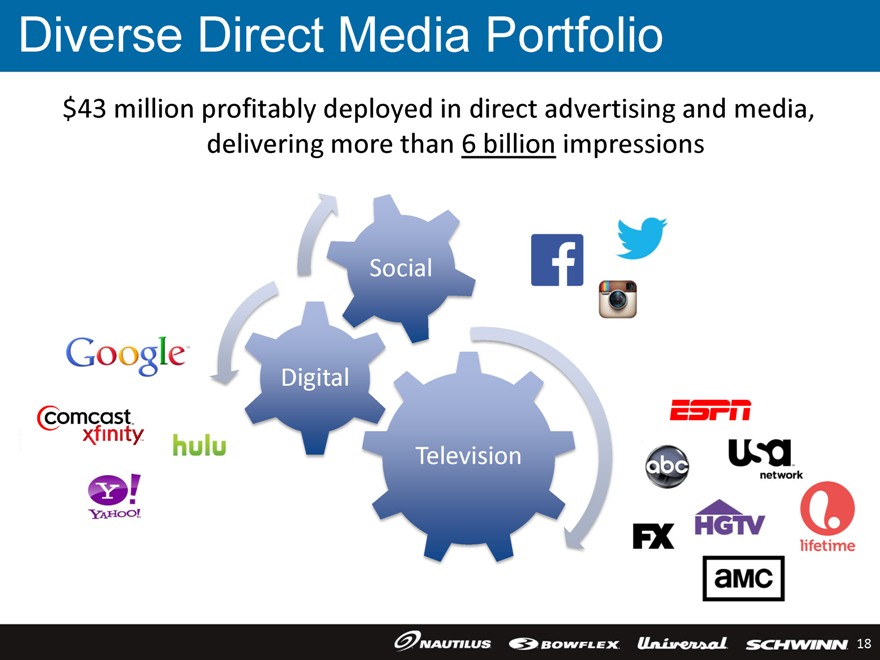
Diverse Direct Media Portfolio
$43 million profitably deployed in direct advertising and media, delivering more than 6 billion impressions
Social
Digital
Television
Google
comcast
xfinity
hulu
Y!
YAHOO!
ESPN
usa network
abc
FX
HGTV
lifetime
amc
NAUTILUS
BOWFLEX
Universal
SCHWINN
18

NAUTLUS Inc
Long-term
Goals
19
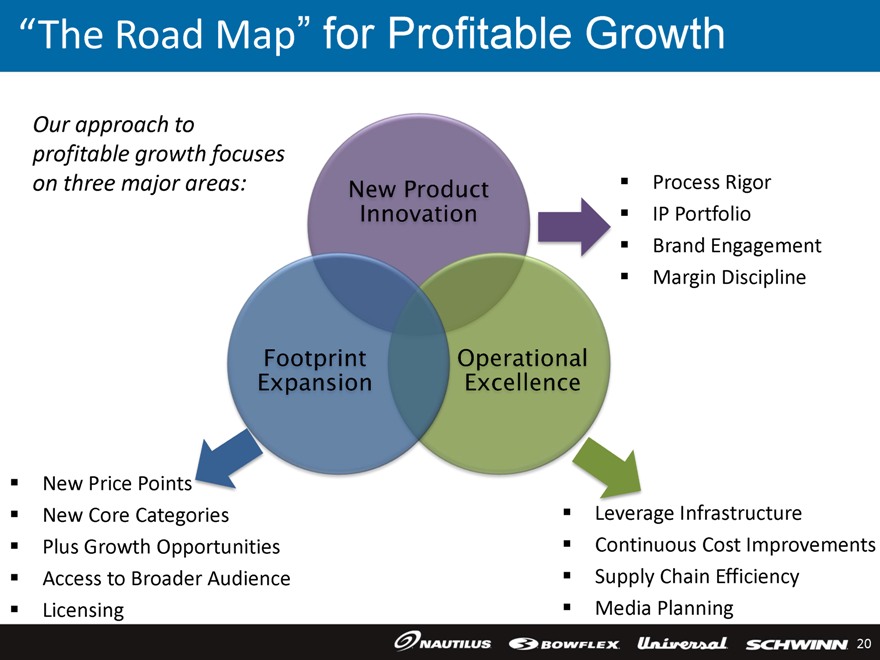
“The Road Map” for Profitable Growth
Our approach to profitable growth focuses on three major areas:
New Product Innovation
Process Rigor
IP Portfolio
Brand Engagement
Margin Discipline
Footprint Expansion
New Price Points
New Core Categories
Plus Growth Opportunities
Access to Broader Audience
Licensing
Operational Excellence
Leverage Infrastructure
Continuous Cost Improvements
Supply Chain Efficiency
Media Planning
NAUTILUS
BOWFLEX
Universal
SCHWINN
20
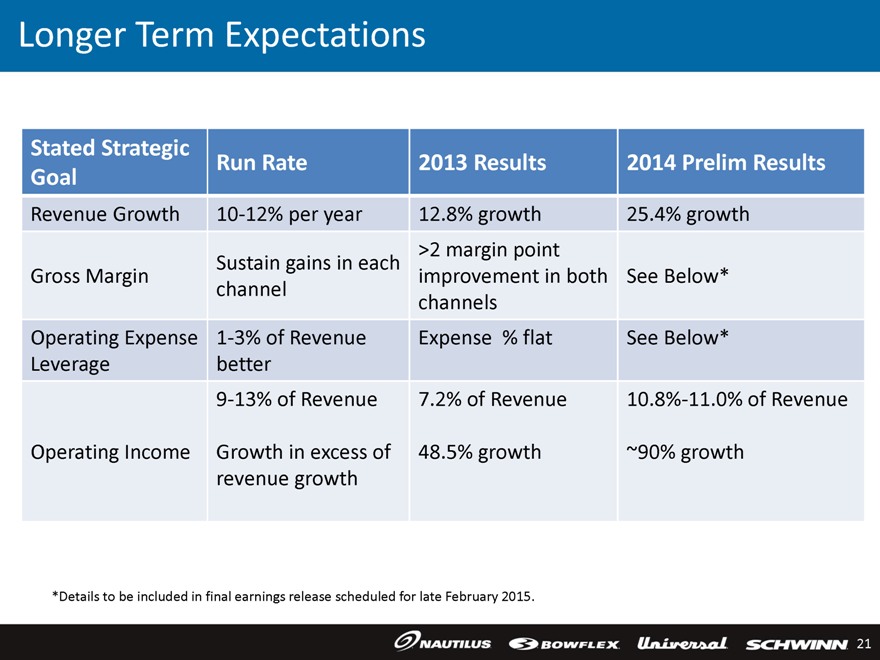
Longer Term Expectations
Stated Strategic Goal
Revenue Growth
Gross Margin
Operating Expense Leverage
Operating Income
Run Rate
10-12% per year
Sustain gains in each channel
1-3% of Revenue better 9-13% of Revenue
Growth in excess of revenue growth
2013 Results
12.8% growth >2 margin point improvement in both channels Expense % flat
7.2% of Revenue
48.5% growth
2014 Prelim Results
25.4% growth See Below* See Below*
10.8%-11.0% of Revenue
~90% growth
*Details to be included in final earnings release scheduled for late February 2015.
NAUTILUS
BOWFLEX
Universal
SCHWINN
21
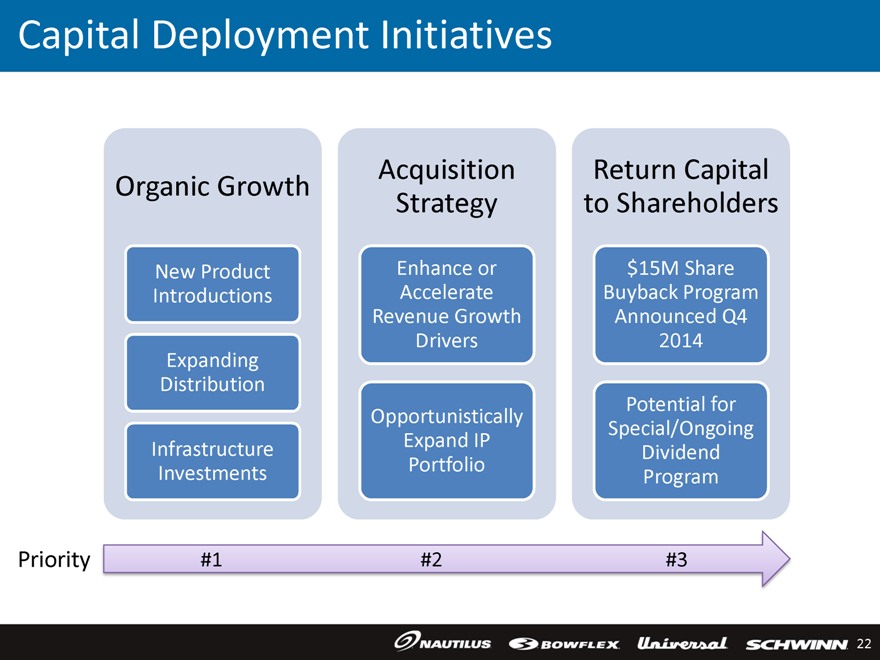
Capital Deployment Initiatives
Organic Growth
New Product Introductions
Expanding Distribution
Infrastructure Investments
Acquisition Strategy
Enhance or Accelerate Revenue Growth Drivers
Opportunistically Expand IP Portfolio
Return Capital to Shareholders
$15M Share Buyback Program Announced Q4 2014
Potential for Special/Ongoing Dividend Program
Priority #1 #2 #3
NAUTILUS
BOWFLEX
Universal
SCHWINN
22
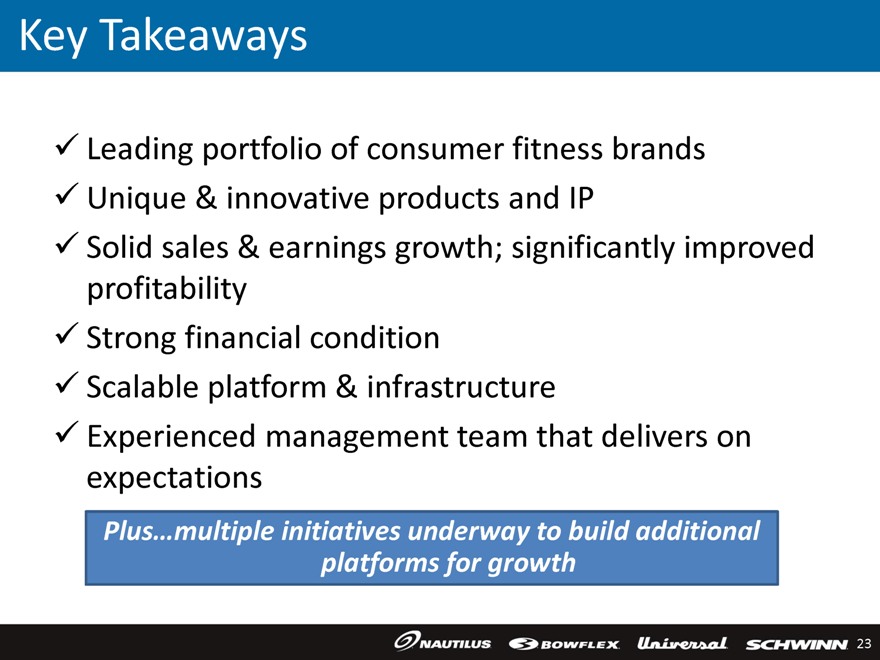
Key Takeaways
Leading
portfolio of consumer fitness brands
Unique & innovative products and IP
Solid sales & earnings growth; significantly improved profitability
Strong financial
condition
Scalable platform & infrastructure
Experienced management
team that delivers on expectations
Plus…multiple initiatives underway to build additional platforms for growth
NAUTILUS
BOWFLEX
Universal
SCHWINN
23

THANK YOU
24
NAUTILUS Inc
Appendix
25
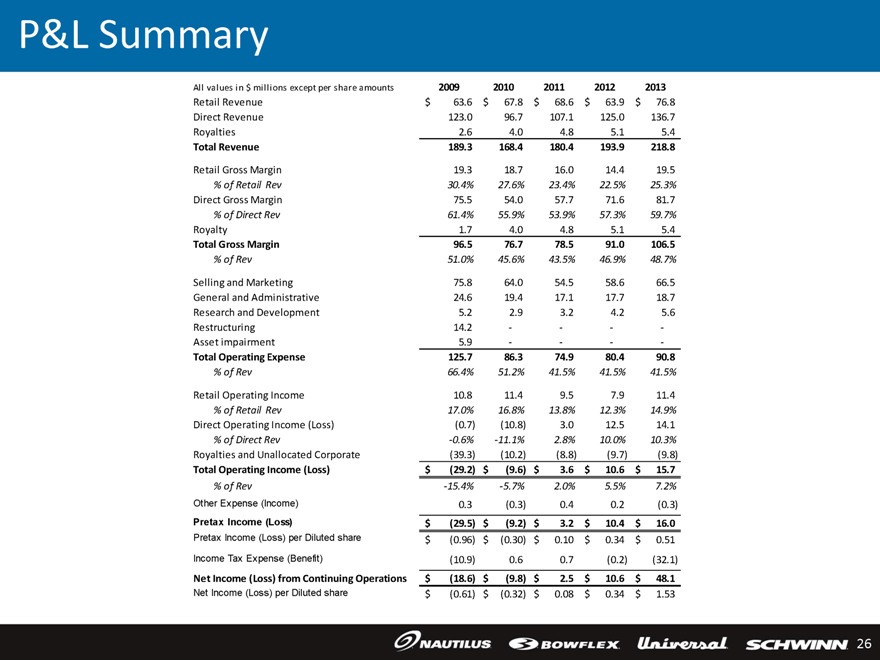
P&L Summary
All
values in $ millions except per share amounts 2009 2010 2011 2012 2013
Retail Revenue $63.6 $67.8 $68.6 $63.9 $76.8
Direct Revenue 123.0 96.7 107.1 125.0 136.7
Royalties 2.6 4.0 4.8 5.1 5.4
Total Revenue 189.3 168.4 180.4 193.9 218.8
Retail Gross Margin 19.3 18.7 16.0 14.4 19.5
% of Retail Rev 30.4% 27.6% 23.4% 22.5% 25.3%
Direct Gross Margin 75.5 54.0
57.7 71.6 81.7
% of Direct Rev 61.4% 55.9% 53.9% 57.3% 59.7%
Royalty 1.7 4.0
4.8 5.1 5.4
Total Gross Margin 96.5 76.7 78.5 91.0 106.5
% of Rev 51.0% 45.6%
43.5% 46.9% 48.7%
Selling and Marketing 75.8 64.0 54.5 58.6 66.5
General and
Administrative 24.6 19.4 17.1 17.7 18.7
Research and Development 5.2 2.9 3.2 4.2 5.6
Restructuring 14.2 - - - -
Asset impairment 5.9 - - - -
Total Operating Expense 125.7 86.3 74.9 80.4 90.8
% of Rev 66.4% 51.2% 41.5% 41.5% 41.5%
Retail Operating Income 10.8 11.4 9.5 7.9 11.4
% of Retail Rev 17.0% 16.8%
13.8% 12.3% 14.9%
Direct Operating Income (Loss) (0.7) (10.8) 3.0 12.5 14.1
%
of Direct Rev -0.6% -11.1% 2.8% 10.0% 10.3%
Royalties and Unallocated Corporate (39.3) (10.2) (8.8) (9.7) (9.8)
Total Operating Income (Loss) $(29.2) $(9.6) $3.6 $10.6 $15.7
% of Rev -15.4% -5.7% 2.0% 5.5%
7.2%
Other Expense (Income) 0.3 (0.3) 0.4 0.2 (0.3)
Pretax Income (Loss)
$(29.5) $(9.2) $3.2 $10.4 $16.0
Pretax Income (Loss) per Diluted share $(0.96) $(0.30) $0.10 $0.34 $0.51
Income Tax Expense (Benefit) (10.9) 0.6 0.7 (0.2) (32.1)
Net Income (Loss) from Continuing
Operations $(18.6) $(9.8) $2.5 $10.6 $48.1
Net Income (Loss) per Diluted share $(0.61) $(0.32) $0.08 $0.34 $1.53
NAUTILUS
BOWFLEX
Universal
SCHWINN
26
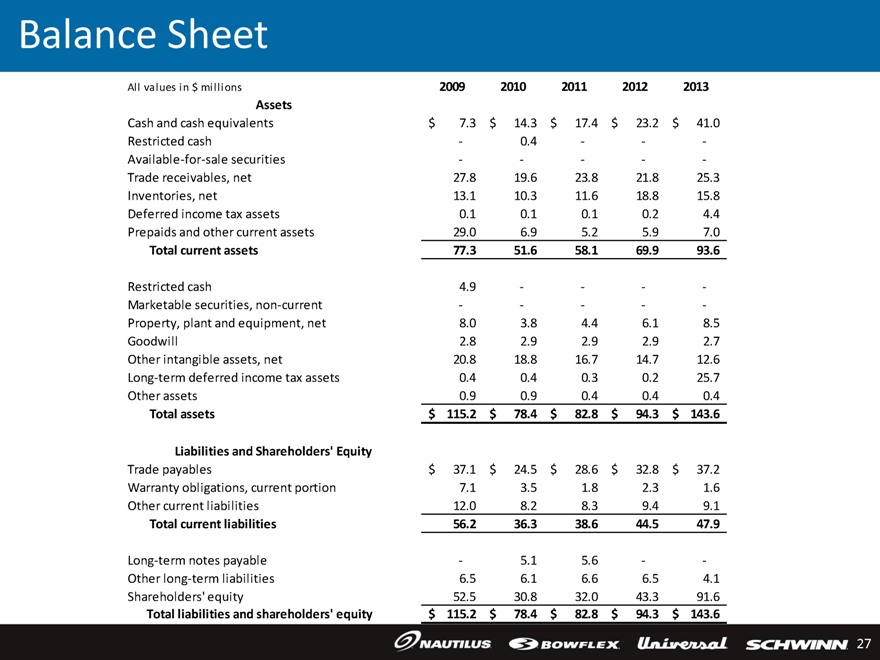
Balance Sheet
All values
in $ millions 2009 2010 2011 2012 2013
Assets
Cash and cash equivalents $7.3
$14.3 $17.4 $23.2 $41.0
Restricted cash - 0.4 - - -
Available-for-sale
securities - - - - -
Trade receivables, net 27.8 19.6 23.8 21.8 25.3
Inventories, net 13.1 10.3 11.6 18.8 15.8
Deferred income tax assets 0.1 0.1
0.1 0.2 4.4
Prepaids and other current assets 29.0 6.9 5.2 5.9 7.0
Total
current assets 77.3 51.6 58.1 69.9 93.6
Restricted cash 4.9 - - - -
Marketable securities, non-current - - - - -
Property, plant and equipment,
net 8.0 3.8 4.4 6.1 8.5
Goodwill 2.8 2.9 2.9 2.9 2.7
Other intangible assets,
net 20.8 18.8 16.7 14.7 12.6
Long-term deferred income tax assets 0.4 0.4 0.3 0.2 25.7
Other assets 0.9 0.9 0.4 0.4 0.4
Total assets $115.2 $78.4 $82.8 $94.3 $143.6
Liabilities and Shareholders’ Equity
Trade payables $37.1 $24.5 $28.6 $32.8 $37.2
Warranty obligations, current portion 7.1 3.5 1.8 2.3 1.6
Other current
liabilities 12.0 8.2 8.3 9.4 9.1
Total current liabilities 56.2 36.3 38.6 44.5 47.9
Long-term notes payable - 5.1 5.6 - -
Other long-term liabilities 6.5 6.1 6.6 6.5 4.1
Shareholders’ equity 52.5 30.8 32.0 43.3 91.6
Total liabilities and
shareholders’ equity $115.2 $78.4 $82.8 $94.3 $143.6
NAUTILUS
BOWFLEX
Universal
SCHWINN
27
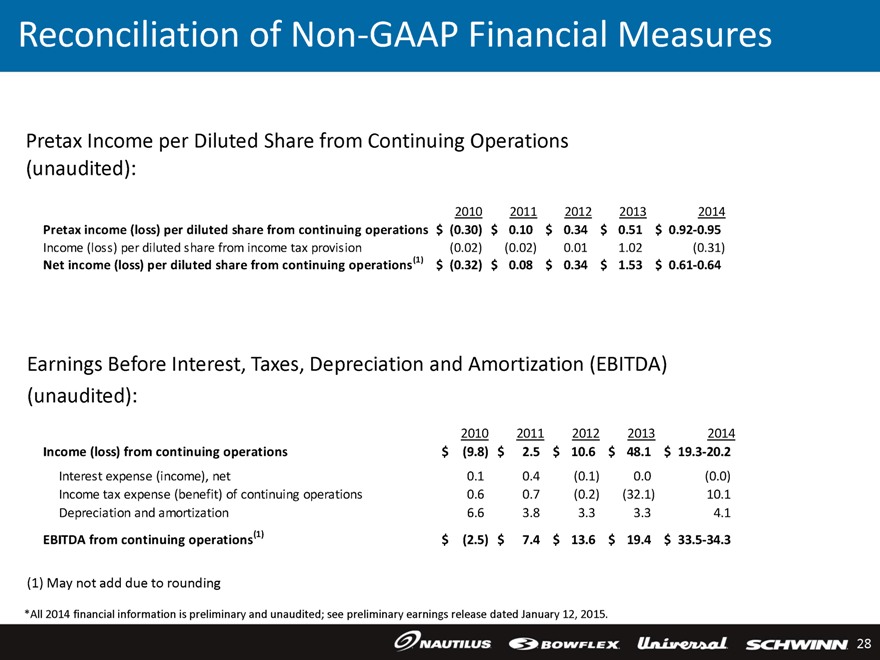
Reconciliation of Non-GAAP Financial Measures
Pretax Income per Diluted Share from Continuing Operations (unaudited):
2010 2011 2012 2013
2014
Pretax income (loss) per diluted share from continuing operations $(0.30) $0.10 $0.34 $0.51 $0.92-0.95
Income (loss) per diluted share from income tax provision (0.02) (0.02) 0.01 1.02 (0.31)
Net
income (loss) per diluted share from continuing operations(1) $(0.32) $0.08 $0.34 $1.53 $0.61-0.64
Earnings Before Interest, Taxes, Depreciation and Amortization
(EBITDA) (unaudited):
2010 2011 2012 2013 2014
Income (loss) from continuing
operations $(9.8) $2.5 $10.6 $48.1 $19.3-20.2
Interest expense (income), net 0.1 0.4 (0.1) 0.0 (0.0)
Income tax expense (benefit) of continuing operations 0.6 0.7 (0.2) (32.1) 10.1
Depreciation
and amortization 6.6 3.8 3.3 3.3 4.1
EBITDA from continuing operations(1) $(2.5) $7.4 $13.6 $19.4 $33.5-34.3
(1) May not add due to rounding
*All 2014 financial information is preliminary and unaudited;
see preliminary earnings release dated January 12, 2015.
NAUTILUS
BOWFLEX
Universal
SCHWINN
28