Attached files
| file | filename |
|---|---|
| 8-K - 8-K - ACCURAY INC | a15-2093_18k.htm |
Exhibit 99.1
|
|
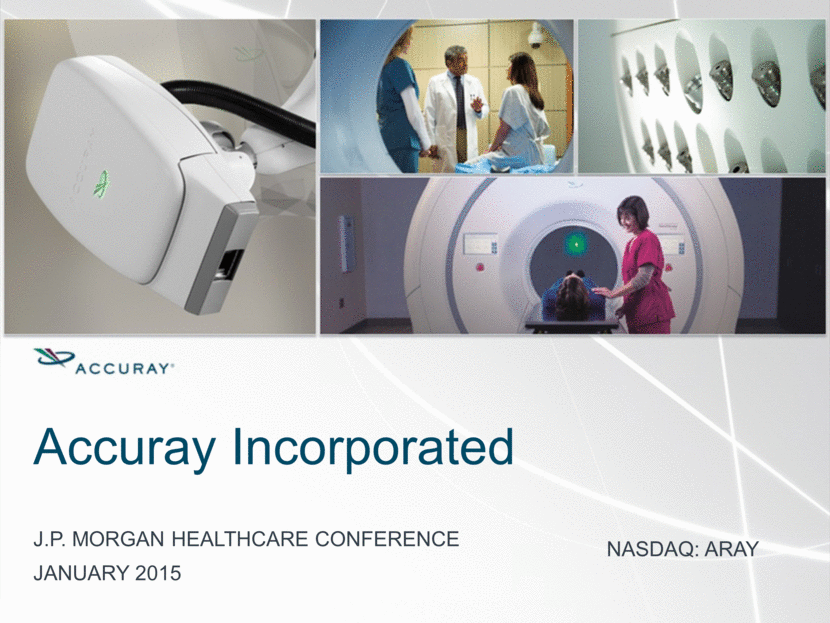
Accuray Incorporated j.p. morgan healthcare conference January 2015 NASDAQ: ARAY |
|
|
Safe Harbor Statement Forward Looking Statements Safe Harbor Statement Statements in this presentation (including the oral commentary that accompanies it) that are not statements of historical fact are forward-looking statements and are subject to the "safe harbor” provisions of the Private Securities Litigation Reform Act of 1995. Forward-looking statements in this presentation relate, but are not limited to the size and growth of the global market for radiation therapy systems, market position of our products, product roadmap, and our business opportunities and focus, including strategies for commercial execution, product positioning, customer accounts and emerging markets, and our expected financial results for the second quarter and full fiscal year 2015. Forward-looking statements are subject to risks and uncertainties that could cause actual results to differ materially from expectations, including but not limited to: the extent of market acceptance for the company’s products and services; the company’s ability to convert backlog to revenue; the success of its worldwide sales and marketing efforts; the ability to control operating expenses; continuing uncertainty in the global economic environment; potential differences between the Company’s preliminary financial analysis and the final results for the applicable period as a result of the completion of internal reporting process and review, and other risks detailed under the heading "Risk Factors" in the company’s report on Form 10-K for fiscal 2014, filed on August 29, 2014 and as updated from time to time in our other filings with the Securities and Exchange Commission. Forward-looking statements speak only as of the date the statements are made and are based on information available to the company at the time those statements are made and/or management’s good faith belief as of that time with respect to future events. The company assumes no obligation to update forward-looking statements to reflect actual performance or results, changes in assumptions or changes in other factors affecting forward-looking information, except to the extent required by applicable securities laws. Accordingly, investors should not put undue reliance on any forward-looking statements. This presentation also contains non-GAAP financial information. Management believes that this non-GAAP financial measure provides useful supplemental information to management and investors regarding the performance of the company and facilitates a more meaningful comparison of results for current periods with previous operating results. Additionally, it will assist management in analyzing future trends, making strategic and business decisions and establishing internal budgets and forecasts. A reconciliation is available in the Appendix. |
|
|
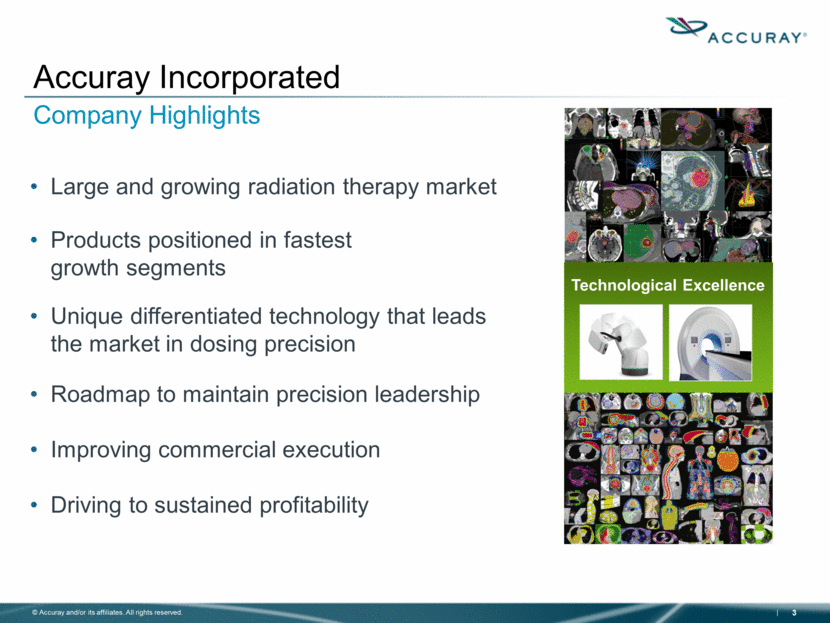
Company Highlights Large and growing radiation therapy market Products positioned in fastest growth segments Unique differentiated technology that leads the market in dosing precision Roadmap to maintain precision leadership Improving commercial execution Driving to sustained profitability Accuray Incorporated Technological Excellence |
|
|
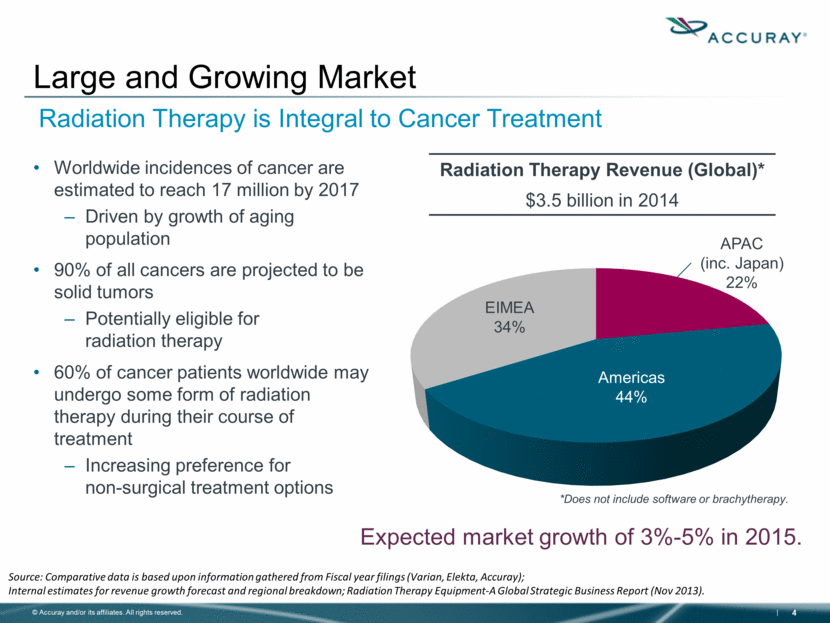
Worldwide incidences of cancer are estimated to reach 17 million by 2017 Driven by growth of aging population 90% of all cancers are projected to be solid tumors Potentially eligible for radiation therapy 60% of cancer patients worldwide may undergo some form of radiation therapy during their course of treatment Increasing preference for non-surgical treatment options Large and Growing Market Radiation Therapy Revenue (Global)* $3.5 billion in 2014 Source: Comparative data is based upon information gathered from Fiscal year filings (Varian, Elekta, Accuray); Internal estimates for revenue growth forecast and regional breakdown; Radiation Therapy Equipment-A Global Strategic Business Report (Nov 2013). Expected market growth of 3%-5% in 2015. Americas 44% EIMEA 34% APAC (inc. Japan) 22% *Does not include software or brachytherapy. Radiation Therapy is Integral to Cancer Treatment |
|
|
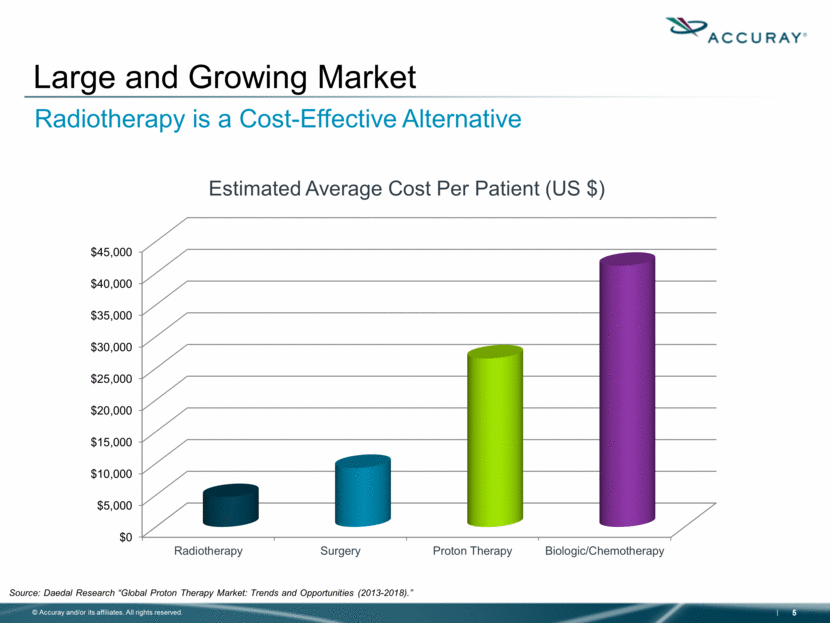
Source: Daedal Research “Global Proton Therapy Market: Trends and Opportunities (2013-2018).” Large and Growing Market Radiotherapy is a Cost-Effective Alternative $0 $5,000 $10,000 $15,000 $20,000 $25,000 $30,000 $35,000 $40,000 $45,000 Radiotherapy Surgery Proton Therapy Biologic/Chemotherapy Estimated Average Cost Per Patient (US $) |
|
|
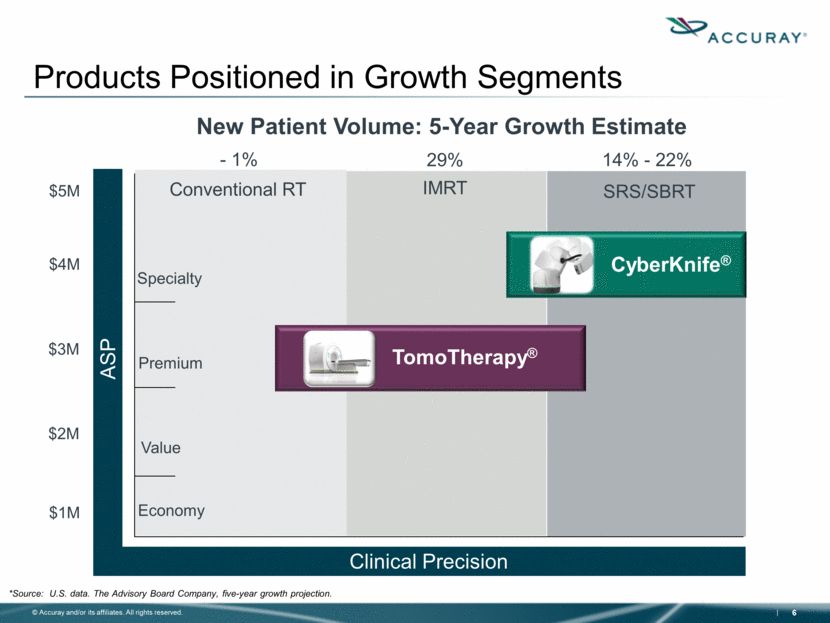
Specialty Economy Premium Value SRS/SBRT IMRT Conventional RT $1M $2M $3M $4M $5M Clinical Precision ASP CyberKnife® TomoTherapy® Products Positioned in Growth Segments - 1% 14% - 22% 29% *Source: U.S. data. The Advisory Board Company, five-year growth projection. New Patient Volume: 5-Year Growth Estimate |
|
|
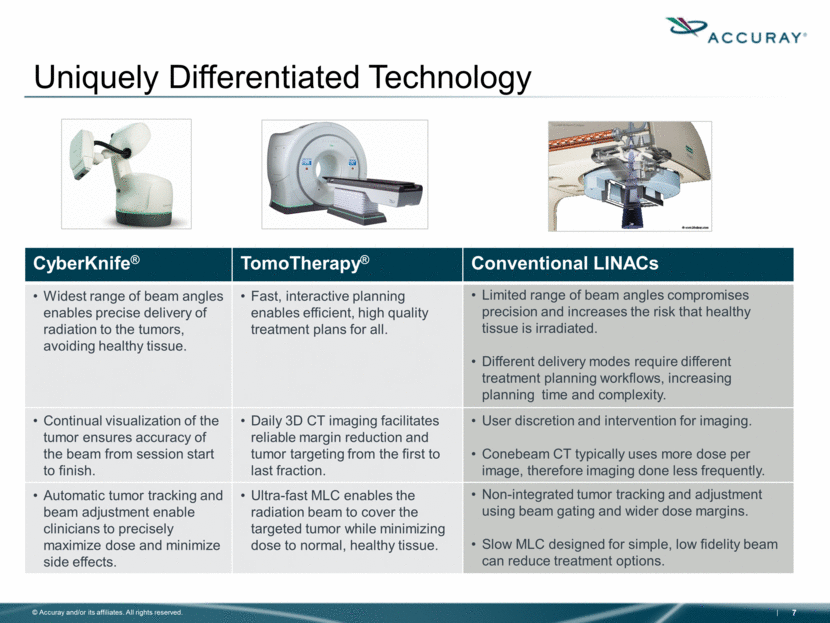
Uniquely Differentiated Technology CyberKnife® TomoTherapy® Conventional LINACs Widest range of beam angles enables precise delivery of radiation to the tumors, avoiding healthy tissue. Fast, interactive planning enables efficient, high quality treatment plans for all. Limited range of beam angles compromises precision and increases the risk that healthy tissue is irradiated. Different delivery modes require different treatment planning workflows, increasing planning time and complexity. Continual visualization of the tumor ensures accuracy of the beam from session start to finish. Daily 3D CT imaging facilitates reliable margin reduction and tumor targeting from the first to last fraction. User discretion and intervention for imaging. Conebeam CT typically uses more dose per image, therefore imaging done less frequently. Automatic tumor tracking and beam adjustment enable clinicians to precisely maximize dose and minimize side effects. Ultra-fast MLC enables the radiation beam to cover the targeted tumor while minimizing dose to normal, healthy tissue. Non-integrated tumor tracking and adjustment using beam gating and wider dose margins. Slow MLC designed for simple, low fidelity beam can reduce treatment options. |
|
|
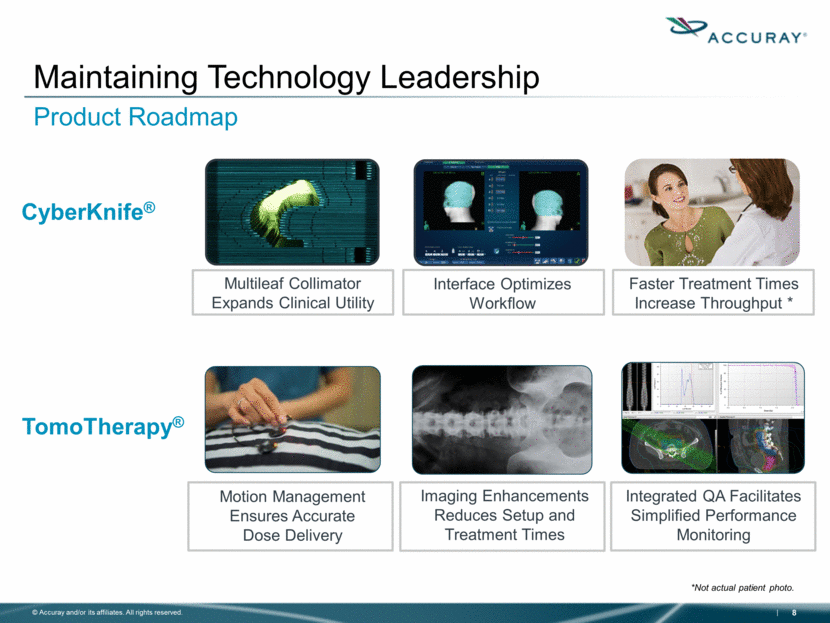
Maintaining Technology Leadership CyberKnife® Multileaf Collimator Expands Clinical Utility Interface Optimizes Workflow Faster Treatment Times Increase Throughput * TomoTherapy® Imaging Enhancements Reduces Setup and Treatment Times Integrated QA Facilitates Simplified Performance Monitoring Motion Management Ensures Accurate Dose Delivery *Not actual patient photo. Product Roadmap |
|
|
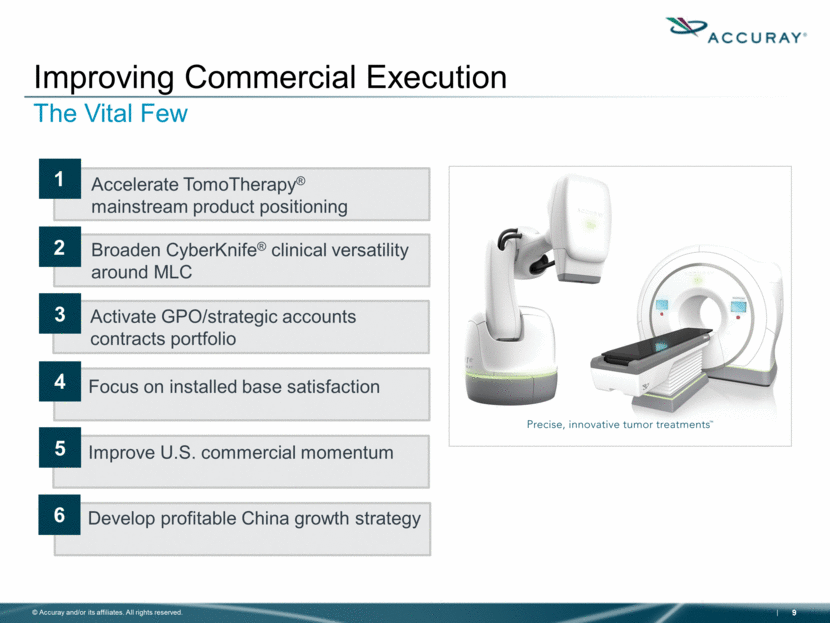
Improving Commercial Execution The Vital Few Focus on installed base satisfaction Accelerate TomoTherapy® mainstream product positioning Broaden CyberKnife® clinical versatility around MLC Activate GPO/strategic accounts contracts portfolio Develop profitable China growth strategy 1 6 2 3 5 4 Improve U.S. commercial momentum |
|
|
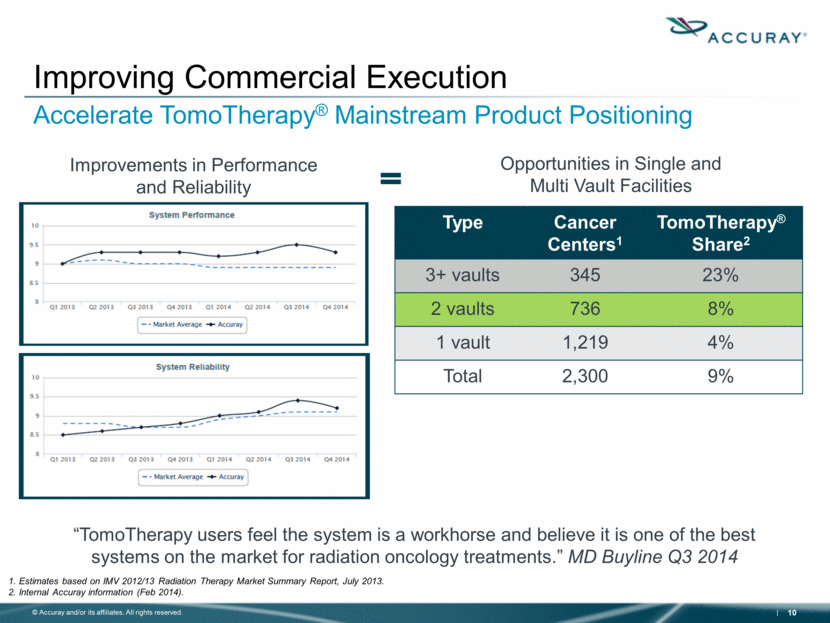
Improving Commercial Execution Accelerate TomoTherapy® Mainstream Product Positioning 1. Estimates based on IMV 2012/13 Radiation Therapy Market Summary Report, July 2013. 2. Internal Accuray information (Feb 2014). Improvements in Performance and Reliability Opportunities in Single and Multi Vault Facilities Type Cancer Centers1 TomoTherapy® Share2 3+ vaults 345 23% 2 vaults 736 8% 1 vault 1,219 4% Total 2,300 9% “TomoTherapy users feel the system is a workhorse and believe it is one of the best systems on the market for radiation oncology treatments.” MD Buyline Q3 2014 |
|
|
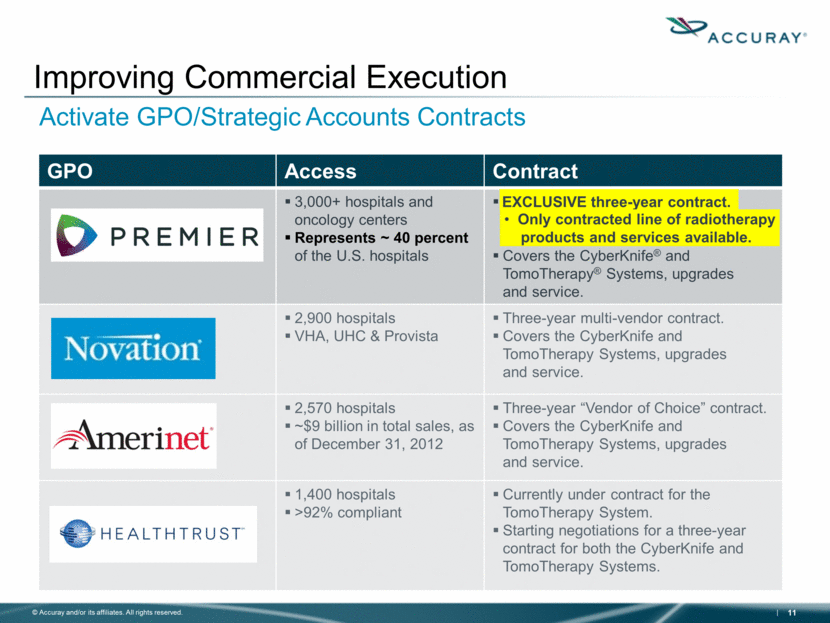
GPO Access Contract 3,000+ hospitals and oncology centers Represents ~ 40 percent of the U.S. hospitals EXCLUSIVE three-year contract. Only contracted line of radiotherapy products and services available. Covers the CyberKnife® and TomoTherapy® Systems, upgrades and service. 2,900 hospitals VHA, UHC & Provista Three-year multi-vendor contract. Covers the CyberKnife and TomoTherapy Systems, upgrades and service. 2,570 hospitals ~$9 billion in total sales, as of December 31, 2012 Three-year “Vendor of Choice” contract. Covers the CyberKnife and TomoTherapy Systems, upgrades and service. 1,400 hospitals >92% compliant Currently under contract for the TomoTherapy System. Starting negotiations for a three-year contract for both the CyberKnife and TomoTherapy Systems. Improving Commercial Execution Activate GPO/Strategic Accounts Contracts EXCLUSIVE three-year contract. Only contracted line Only contracted line of radiotherapy products and services available. |
|
|
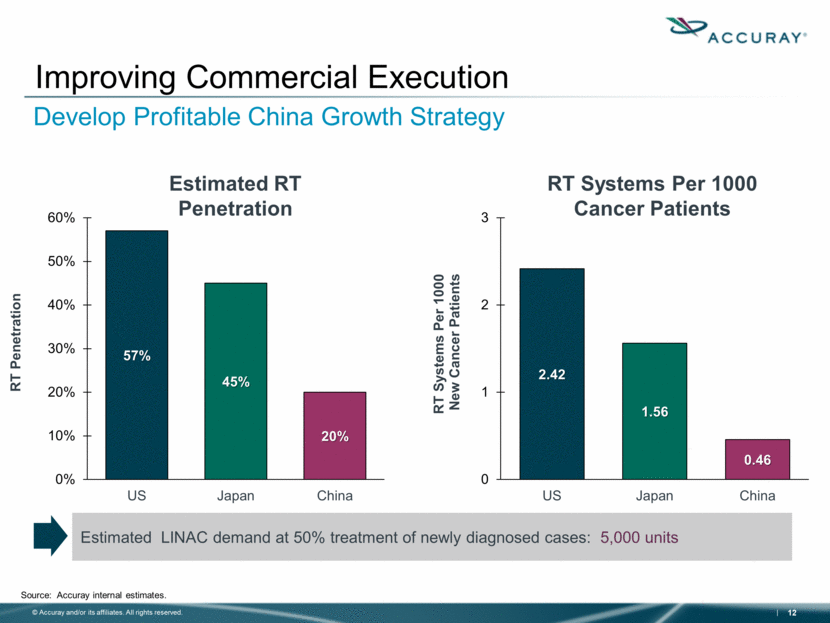
Improving Commercial Execution Develop Profitable China Growth Strategy RT Systems Per 1000 Cancer Patients Source: Accuray internal estimates. Estimated LINAC demand at 50% treatment of newly diagnosed cases: 5,000 units Estimated RT Penetration 2.42 1.56 0.46 0 1 2 3 US Japan China RT Systems Per 1000 New Cancer Patients 57% 45% 20% 0% 10% 20% 30% 40% 50% 60% US Japan China RT Penetration |
|
|
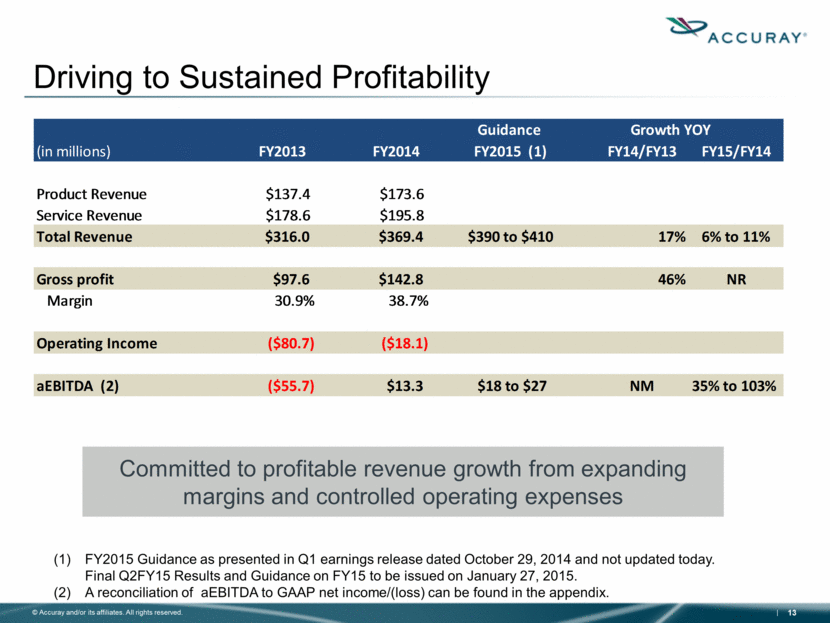
Driving to Sustained Profitability Committed to profitable revenue growth from expanding margins and controlled operating expenses FY2015 Guidance as presented in Q1 earnings release dated October 29, 2014 and not updated today. Final Q2FY15 Results and Guidance on FY15 to be issued on January 27, 2015. A reconciliation of aEBITDA to GAAP net income/(loss) can be found in the appendix. Guidance Growth YOY (in millions) FY2013 FY2014 FY2015 (1) FY14/FY13 FY15/FY14 Product Revenue $137.4 $173.6 Service Revenue $178.6 $195.8 Total Revenue $316.0 $369.4 $390 to $410 17% 6% to 11% Gross profit $97.6 $142.8 46% NR Margin 30.9% 38.7% Operating Income ($80.7) ($18.1) aEBITDA (2) ($55.7) $13.3 $18 to $27 NM 35% to 103% |
|
|
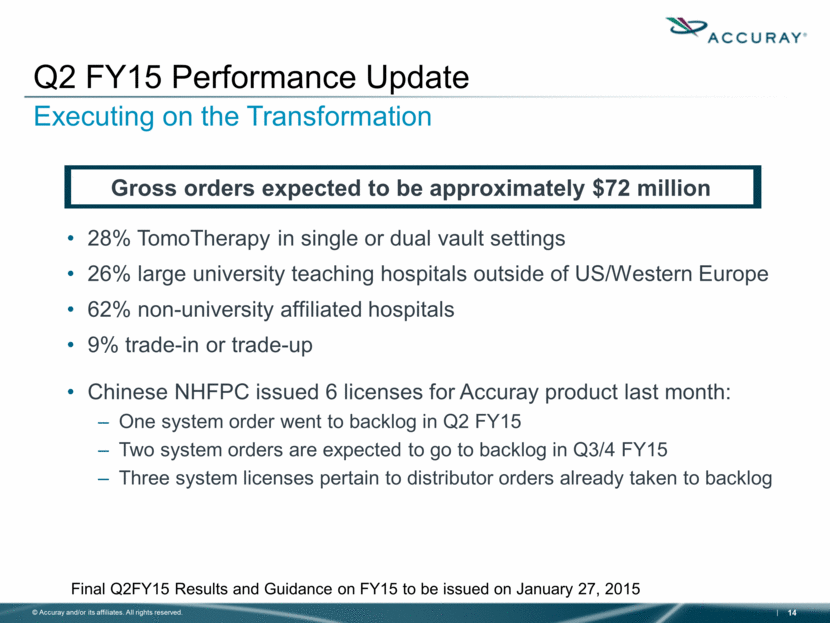
28% TomoTherapy in single or dual vault settings 26% large university teaching hospitals outside of US/Western Europe 62% non-university affiliated hospitals 9% trade-in or trade-up Chinese NHFPC issued 6 licenses for Accuray product last month: One system order went to backlog in Q2 FY15 Two system orders are expected to go to backlog in Q3/4 FY15 Three system licenses pertain to distributor orders already taken to backlog Q2 FY15 Performance Update Executing on the Transformation Gross orders expected to be approximately $72 million Final Q2FY15 Results and Guidance on FY15 to be issued on January 27, 2015 |
|
|
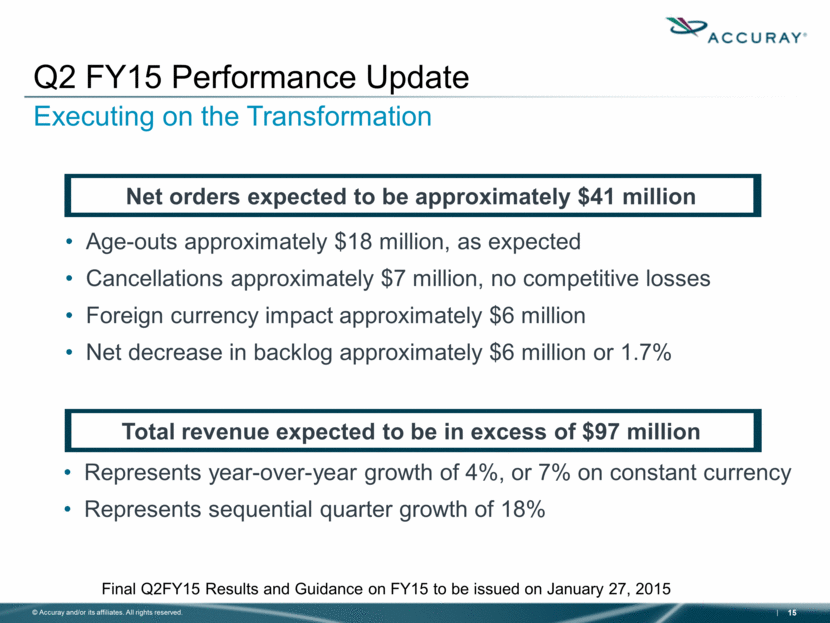
Age-outs approximately $18 million, as expected Cancellations approximately $7 million, no competitive losses Foreign currency impact approximately $6 million Net decrease in backlog approximately $6 million or 1.7% Q2 FY15 Performance Update Executing on the Transformation Net orders expected to be approximately $41 million Final Q2FY15 Results and Guidance on FY15 to be issued on January 27, 2015 Total revenue expected to be in excess of $97 million Represents year-over-year growth of 4%, or 7% on constant currency Represents sequential quarter growth of 18% |
|
|
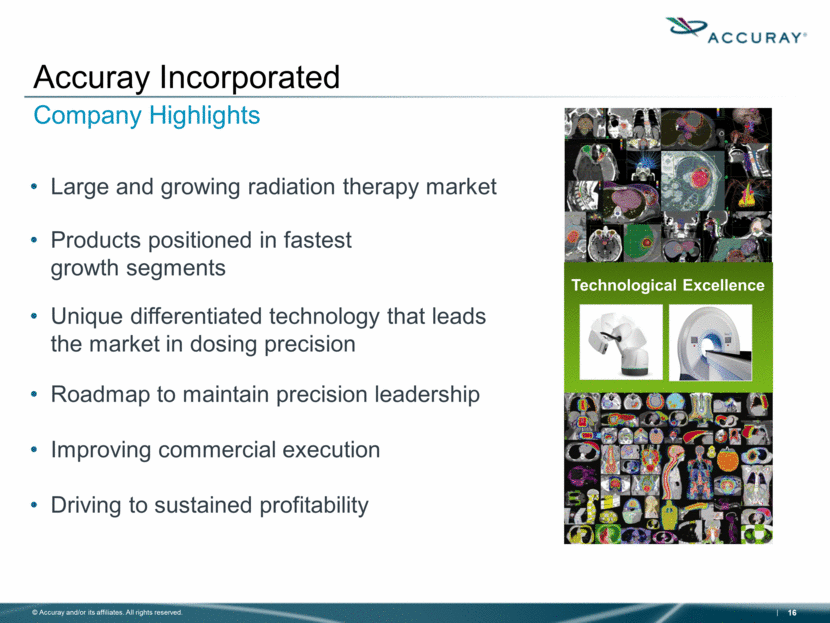
Company Highlights Large and growing radiation therapy market Products positioned in fastest growth segments Unique differentiated technology that leads the market in dosing precision Roadmap to maintain precision leadership Improving commercial execution Driving to sustained profitability Accuray Incorporated Technological Excellence |
|
|
[LOGO] |
|
|
Appendix |
|
|
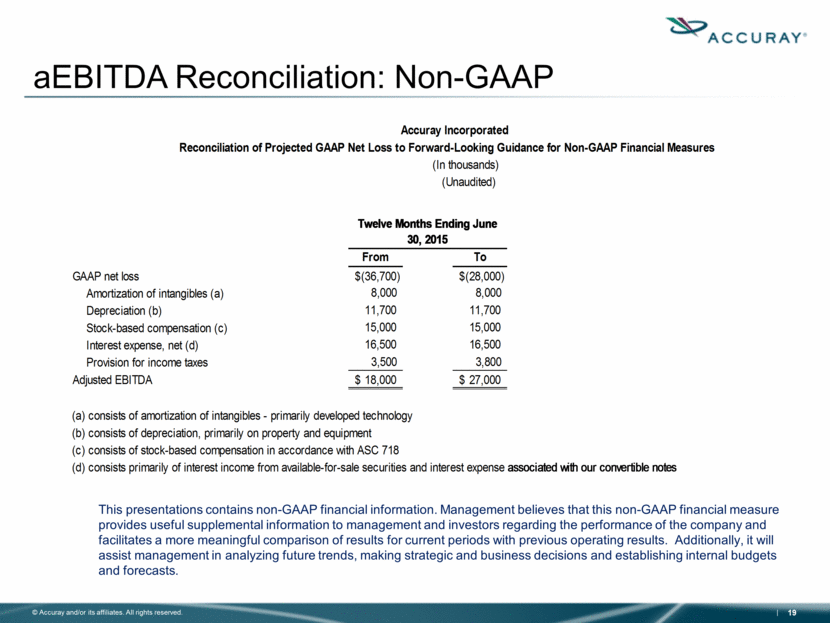
aEBITDA Reconciliation: Non-GAAP This presentations contains non-GAAP financial information. Management believes that this non-GAAP financial measure provides useful supplemental information to management and investors regarding the performance of the company and facilitates a more meaningful comparison of results for current periods with previous operating results. Additionally, it will assist management in analyzing future trends, making strategic and business decisions and establishing internal budgets and forecasts. Accuray Incorporated Reconciliation of Projected GAAP Net Loss to Forward-Looking Guidance for Non-GAAP Financial Measures (In thousands) (Unaudited) Twelve Months Ending June 30, 2015 From To GAAP net loss $(36,700) $(28,000) Amortization of intangibles (a) 8,000 8,000 Depreciation (b) 11,700 11,700 Stock-based compensation (c) 15,000 15,000 Interest expense, net (d) 16,500 16,500 Provision for income taxes 3,500 3,800 Adjusted EBITDA $ 18,000 $ 27,000 (a) consists of amortization of intangibles - primarily developed technology (b) consists of depreciation, primarily on property and equipment (c) consists of stock-based compensation in accordance with ASC 718 (d) consists primarily of interest income from available-for-sale securities and interest expense associated with our convertible notes |

