Attached files
| file | filename |
|---|---|
| EX-31.2 - EX-31.2 - E2open Inc | d825471dex312.htm |
| EX-32.1 - EX-32.1 - E2open Inc | d825471dex321.htm |
| EX-10.1 - EX-10.1 - E2open Inc | d825471dex101.htm |
| EX-31.1 - EX-31.1 - E2open Inc | d825471dex311.htm |
| EXCEL - IDEA: XBRL DOCUMENT - E2open Inc | Financial_Report.xls |
Table of Contents
UNITED STATES
SECURITIES AND EXCHANGE COMMISSION
Washington, D.C. 20549
FORM 10-Q
(Mark One)
| x | QUARTERLY REPORT PURSUANT TO SECTION 13 OR 15(d) OF THE SECURITIES EXCHANGE ACT OF 1934 |
For the quarterly period ended November 30, 2014
or
| ¨ | TRANSITION REPORT PURSUANT TO SECTION 13 OR 15(d) OF THE SECURITIES EXCHANGE ACT OF 1934 |
Commission file number: 001-35598
E2open, Inc.
(Exact name of registrant as specified in its charter)
| Delaware | 94-3366487 | |
| (State or other jurisdiction of incorporation or organization) |
(I.R.S. Employer Identification Number) |
4100 East Third Avenue, Suite 400
Foster City, California 94404
(Address of principal executive offices)
(650) 645-6500
Registrant’s telephone number, including area code
Indicate by check mark whether the registrant (1) has filed all reports required to be filed by Section 13 or 15(d) of the Securities Exchange Act of 1934 during the preceding 12 months (or for such shorter period that the registrant was required to file such reports), and (2) has been subject to such filing requirements for the past 90 days. Yes x No ¨
Indicate by check mark whether the registrant has submitted electronically and posted on its corporate Web site, if any, every Interactive Data File required to be submitted and posted pursuant to Rule 405 of Regulation S-T (§232.405 of this chapter) during the preceding 12 months (or for such shorter period that the registrant was required to submit and post such files). Yes x No ¨
Indicate by check mark whether the registrant is a large accelerated filer, an accelerated filer, a non-accelerated filer, or a smaller reporting company. See the definitions of “large accelerated filer,” “accelerated filer,” and “smaller reporting company” in Rule 12b-2 of the Exchange Act.
| Large accelerated filer | ¨ | Accelerated filer | x | |||
| Non-accelerated filer | ¨ (Do not check if a smaller reporting company) | Smaller reporting company | ¨ | |||
Indicate by check mark whether the registrant is a shell company (as defined in Rule 12b-2 of the Exchange Act). Yes ¨ No x
Indicate the number of shares outstanding of each of the issuer’s classes of common stock, as of the latest practicable date.
There were 29,317,807 shares of the registrant’s Common Stock issued and outstanding as of December 31, 2014.
Table of Contents
QUARTERLY REPORT ON FORM 10-Q
TABLE OF CONTENTS
i
Table of Contents
SPECIAL NOTE REGARDING FORWARD-LOOKING STATEMENTS
This Quarterly Report on Form 10-Q contains forward-looking statements that are based on our management’s beliefs and assumptions and on information currently available to our management. The forward-looking statements are contained principally in, but not limited to, the sections entitled “Business,” “Risk Factors,” and “Management’s Discussion and Analysis of Financial Condition and Results of Operations”. Forward-looking statements include all statements that are not historical facts and can be identified by terms such as “anticipates,” “believes,” “could,” “seeks,” “estimates,” “expects,” “intends,” “may,” “plans,” “potential,” “predicts”, “projects,” “should,” “will,” “would” or similar expressions and the negatives of those terms. Forward-looking statements include, but are not limited to, statements about:
| • | Our growth strategy; |
| • | Our plans for future products; |
| • | Our operating results; |
| • | Our ability to anticipate future market demands and future needs of our customers; |
| • | Our customer concentration; |
| • | Our ability to effectively manage our growth; |
| • | Our expectations regarding our expenses, sales and operations; |
| • | Our anticipated trends and challenges in the markets in which we operate; |
| • | Our competition; |
| • | Our ability to successfully enter new markets and manage our international expansion; and |
| • | Our intellectual property. |
Forward-looking statements involve known and unknown risks, uncertainties and other factors that may cause our actual results, performance or achievements to be materially different from any future results, performance or achievements expressed or implied by the forward-looking statements. We discuss these risks in greater detail in the section entitled “Risk Factors” and elsewhere in this Quarterly Report on Form 10-Q. Given these uncertainties, you should not place undue reliance on these forward-looking statements. Also, forward-looking statements represent our management’s beliefs and assumptions only as of the date of this Quarterly Report on Form 10-Q. You should read this Quarterly Report on Form 10-Q completely and with the understanding that our actual future results may be materially different from what we expect.
Except as required by law, we assume no obligation to update these forward-looking statements publicly, or to update the reasons actual results could differ materially from those anticipated in these forward-looking statements, even if new information becomes available in the future.
1
Table of Contents
| Item 1. | Financial Statements |
E2OPEN, INC.
CONDENSED CONSOLIDATED BALANCE SHEETS
(In thousands, except per share amounts)
(Unaudited)
| November 30, 2014 | February 28, 2014 | |||||||
| ASSETS |
||||||||
| Current assets: |
||||||||
| Cash and cash equivalents |
$ | 18,900 | $ | 42,723 | ||||
| Short-term investments |
5,271 | 14,374 | ||||||
| Accounts receivable, net of allowance of $80 and $78 |
18,134 | 21,995 | ||||||
| Prepaid expenses and other current assets |
4,655 | 4,380 | ||||||
|
|
|
|
|
|||||
| Total current assets |
46,960 | 83,472 | ||||||
| Long-term investments |
900 | 8,541 | ||||||
| Goodwill |
35,992 | 22,556 | ||||||
| Intangible assets, net |
23,436 | 11,395 | ||||||
| Property and equipment, net |
3,441 | 3,431 | ||||||
| Other assets |
1,245 | 1,316 | ||||||
|
|
|
|
|
|||||
| Total assets |
$ | 111,974 | $ | 130,711 | ||||
|
|
|
|
|
|||||
| LIABILITIES AND STOCKHOLDERS’ EQUITY |
||||||||
| Current liabilities: |
||||||||
| Accounts payable and accrued liabilities |
$ | 12,263 | $ | 12,366 | ||||
| Deferred revenue |
33,705 | 43,672 | ||||||
| Acquisition-related obligations |
9,960 | 5,473 | ||||||
| Current portion of notes payable and capital lease obligations |
3,915 | 2,995 | ||||||
|
|
|
|
|
|||||
| Total current liabilities |
59,843 | 64,506 | ||||||
| Deferred revenue |
2,472 | 1,587 | ||||||
| Notes payable and capital lease obligations, net of current portion |
2,557 | 2,599 | ||||||
| Other noncurrent liabilities |
1,907 | 2,195 | ||||||
|
|
|
|
|
|||||
| Total liabilities |
66,779 | 70,887 | ||||||
|
|
|
|
|
|||||
| Commitments and contingencies (note 10) |
||||||||
| Stockholders’ equity: |
||||||||
| Preferred stock, $0.001 par value. 10,000 authorized shares, no shares issued and outstanding |
— | — | ||||||
| Common stock, $0.001 par value. 100,000 authorized shares, 29,314 and 28,825 shares issued and outstanding as of November 30, 2014 and February 28, 2014 |
29 | 29 | ||||||
| Additional paid-in capital |
437,154 | 426,031 | ||||||
| Accumulated other comprehensive income |
13 | 31 | ||||||
| Accumulated deficit |
(392,001 | ) | (366,267 | ) | ||||
|
|
|
|
|
|||||
| Total stockholders’ equity |
45,195 | 59,824 | ||||||
|
|
|
|
|
|||||
| Total liabilities and stockholders’ equity |
$ | 111,974 | $ | 130,711 | ||||
|
|
|
|
|
|||||
The accompanying notes are an integral part of these condensed consolidated financial statements.
2
Table of Contents
E2OPEN, INC.
CONDENSED CONSOLIDATED STATEMENTS OF OPERATIONS
(In thousands, except per share data)
(Unaudited)
| Three Months Ended November 30, | Nine Months Ended November 30, | |||||||||||||||
| 2014 | 2013 | 2014 | 2013 | |||||||||||||
| Revenue |
||||||||||||||||
| Subscriptions and support |
$ | 16,650 | $ | 14,400 | $ | 49,689 | $ | 40,125 | ||||||||
| Professional services and other |
3,500 | 3,860 | 9,473 | 11,746 | ||||||||||||
|
|
|
|
|
|
|
|
|
|||||||||
| Total revenue |
20,150 | 18,260 | 59,162 | 51,871 | ||||||||||||
|
|
|
|
|
|
|
|
|
|||||||||
| Cost of revenue |
||||||||||||||||
| Subscriptions and support |
3,383 | 2,769 | 9,893 | 7,942 | ||||||||||||
| Professional services and other |
4,012 | 4,309 | 11,995 | 12,852 | ||||||||||||
| Amortization of acquired intangible assets |
735 | 408 | 1,807 | 466 | ||||||||||||
|
|
|
|
|
|
|
|
|
|||||||||
| Total cost of revenue |
8,130 | 7,486 | 23,695 | 21,260 | ||||||||||||
|
|
|
|
|
|
|
|
|
|||||||||
| Gross profit (loss) |
||||||||||||||||
| Subscriptions and support |
12,532 | 11,223 | 37,989 | 31,717 | ||||||||||||
| Professional services and other |
(512 | ) | (449 | ) | (2,522 | ) | (1,106 | ) | ||||||||
|
|
|
|
|
|
|
|
|
|||||||||
| Total gross profit |
12,020 | 10,774 | 35,467 | 30,611 | ||||||||||||
|
|
|
|
|
|
|
|
|
|||||||||
| Operating expenses: |
||||||||||||||||
| Research and development |
5,451 | 5,099 | 16,110 | 13,705 | ||||||||||||
| Sales and marketing |
11,204 | 9,683 | 32,109 | 26,334 | ||||||||||||
| General and administrative |
3,061 | 2,413 | 9,665 | 7,502 | ||||||||||||
| Acquisition-related expenses |
44 | 340 | 960 | 1,131 | ||||||||||||
| Amortization of acquired intangible assets |
685 | 369 | 1,651 | 394 | ||||||||||||
|
|
|
|
|
|
|
|
|
|||||||||
| Total operating expenses |
20,445 | 17,904 | 60,495 | 49,066 | ||||||||||||
|
|
|
|
|
|
|
|
|
|||||||||
| Loss from operations |
(8,425 | ) | (7,130 | ) | (25,028 | ) | (18,455 | ) | ||||||||
| Interest and other expense, net |
(576 | ) | (461 | ) | (564 | ) | (379 | ) | ||||||||
|
|
|
|
|
|
|
|
|
|||||||||
| Loss before income taxes |
(9,001 | ) | (7,591 | ) | (25,592 | ) | (18,834 | ) | ||||||||
| Benefit from (provision for) income taxes |
(65 | ) | 209 | (142 | ) | 135 | ||||||||||
|
|
|
|
|
|
|
|
|
|||||||||
| Net loss |
$ | (9,066 | ) | $ | (7,382 | ) | $ | (25,734 | ) | $ | (18,699 | ) | ||||
|
|
|
|
|
|
|
|
|
|||||||||
| Net loss per share: |
||||||||||||||||
| Basic and diluted |
$ | (0.31 | ) | $ | (0.28 | ) | $ | (0.89 | ) | $ | (0.72 | ) | ||||
|
|
|
|
|
|
|
|
|
|||||||||
| Weighted average shares used to compute net loss per share: |
||||||||||||||||
| Basic and diluted |
29,253 | 26,545 | 29,065 | 26,061 | ||||||||||||
|
|
|
|
|
|
|
|
|
|||||||||
The accompanying notes are an integral part of these condensed consolidated financial statements.
3
Table of Contents
E2OPEN, INC.
CONDENSED CONSOLIDATED STATEMENTS OF COMPREHENSIVE LOSS
(In thousands)
(Unaudited)
| Three Months Ended November 30, | Nine Months Ended November 30, | |||||||||||||||
| 2014 | 2013 | 2014 | 2013 | |||||||||||||
| Net loss |
$ | (9,066 | ) | $ | (7,382 | ) | $ | (25,734 | ) | $ | (18,699 | ) | ||||
| Other comprehensive income (loss), net: |
||||||||||||||||
| Net change in unrealized gains (losses) on investments |
(11 | ) | 19 | — | (1 | ) | ||||||||||
| Net foreign currency translation gains (losses) |
(28 | ) | 71 | (18 | ) | 65 | ||||||||||
|
|
|
|
|
|
|
|
|
|||||||||
| Total other comprehensive income (loss), net |
(39 | ) | 90 | (18 | ) | 64 | ||||||||||
|
|
|
|
|
|
|
|
|
|||||||||
| Comprehensive loss |
$ | (9,105 | ) | $ | (7,292 | ) | $ | (25,752 | ) | $ | (18,635 | ) | ||||
|
|
|
|
|
|
|
|
|
|||||||||
The accompanying notes are an integral part of these condensed consolidated financial statements.
4
Table of Contents
E2OPEN, INC.
CONDENSED CONSOLIDATED STATEMENTS OF CASH FLOWS
(In thousands)
(Unaudited)
| Nine Months Ended November 30, | ||||||||
| 2014 | 2013 | |||||||
| Cash flows from operating activities: |
||||||||
| Net loss |
$ | (25,734 | ) | $ | (18,699 | ) | ||
| Adjustments to reconcile net loss to net cash used in operating activities: |
||||||||
| Stock-based compensation |
7,128 | 4,009 | ||||||
| Depreciation and amortization |
5,329 | 2,312 | ||||||
| Other |
846 | (80 | ) | |||||
| Changes in operating assets and liabilities: |
||||||||
| Accounts receivable, net |
4,708 | 454 | ||||||
| Prepaid expenses and other current assets |
1,362 | (608 | ) | |||||
| Accounts payable and accrued liabilities |
1,106 | 3,100 | ||||||
| Deferred revenue |
(12,539 | ) | (6,370 | ) | ||||
| Other noncurrent liabilities |
(578 | ) | 476 | |||||
|
|
|
|
|
|||||
| Net cash used in operating activities |
(18,372 | ) | (15,406 | ) | ||||
|
|
|
|
|
|||||
| Cash flows from investing activities: |
||||||||
| Capital expenditures |
(391 | ) | (165 | ) | ||||
| Purchase of marketable securities |
(15,807 | ) | (10,465 | ) | ||||
| Proceeds from sale and maturities of marketable securities |
32,225 | 37,242 | ||||||
| Payments for acquisition of businesses, net of cash acquired |
(16,320 | ) | (11,489 | ) | ||||
| Cash placed in escrow in connection with acquisition of business |
(1,424 | ) | — | |||||
| Other assets |
1 | 67 | ||||||
|
|
|
|
|
|||||
| Net cash provided by (used in) investing activities |
(1,716 | ) | 15,190 | |||||
|
|
|
|
|
|||||
| Cash flows from financing activities: |
||||||||
| Proceeds from bank credit facilities |
4,171 | 2,518 | ||||||
| Repayments of bank credit facilities |
(4,171 | ) | (3,346 | ) | ||||
| Repayments of notes payable and capital lease obligations |
(3,055 | ) | (1,533 | ) | ||||
| Repayment of debt assumed from acquired company |
(143 | ) | (7,126 | ) | ||||
| Payments of stock offering costs |
(533 | ) | — | |||||
| Proceeds from exercise of common share options |
559 | 1,821 | ||||||
| Other |
(503 | ) | (17 | ) | ||||
|
|
|
|
|
|||||
| Net cash used in financing activities |
(3,675 | ) | (7,683 | ) | ||||
|
|
|
|
|
|||||
| Effect of exchange rate changes on cash and cash equivalents |
(60 | ) | 18 | |||||
|
|
|
|
|
|||||
| Net decrease in cash and cash equivalents |
(23,823 | ) | (7,881 | ) | ||||
| Cash and cash equivalents at beginning of period |
42,723 | 20,262 | ||||||
|
|
|
|
|
|||||
| Cash and cash equivalents at end of period |
$ | 18,900 | $ | 12,381 | ||||
|
|
|
|
|
|||||
| Supplemental cash flow information: |
||||||||
| Cash paid during the period for: |
||||||||
| Interest |
$ | 269 | $ | 143 | ||||
|
|
|
|
|
|||||
| Income taxes |
$ | 222 | $ | 121 | ||||
|
|
|
|
|
|||||
| Non-cash financing and investing activities: |
||||||||
| Property, software and equipment acquired under notes payable and capital leases |
$ | 1,242 | $ | 2,072 | ||||
|
|
|
|
|
|||||
| Prepaid software, maintenance and services under notes payable and capital leases |
$ | 1,939 | $ | 2,919 | ||||
|
|
|
|
|
|||||
| Issuance of common stock in connection with business acquisitions |
$ | 3,966 | $ | 8,849 | ||||
|
|
|
|
|
|||||
The accompanying notes are an integral part of these condensed consolidated financial statements.
5
Table of Contents
E2OPEN, INC.
NOTES TO CONDENSED CONSOLIDATED FINANCIAL STATEMENTS
(Unaudited)
(1) Organization and Business Description
E2open, Inc. and subsidiaries (the “Company”), a Delaware corporation, was incorporated in September 2003. The Company provides cloud-based, on-demand software solutions delivered on an integrated platform that enables companies to collaborate with their trading partners to procure, manufacture, sell and distribute products more efficiently. The Company’s customers depend on outsourced manufacturing strategies and complex trading networks to compete in today’s global economy. They use the Company’s solutions to gain visibility into and control over their trading networks. The Company’s solutions enable its customers and their trading partners to overcome problems arising from communications across disparate systems by offering a reliable source of data, processes and analytics, which its customers rely on as the single version of the truth. The Company’s solutions empower its customers to manage demand they cannot predict and supply they do not control.
The Company acquired Serus Corporation (“Serus”) on June 4, 2014 (see note 3 to the condensed consolidated financial statements).
The Company’s corporate headquarters are located in Foster City, California, with additional offices in San Jose, California, Austin and Dallas, Texas, China, Finland, France, Germany, India, Malaysia, Taiwan and the United Kingdom.
(2) Summary of Significant Accounting Policies
Basis of Presentation
The accompanying condensed consolidated financial statements are presented in accordance with generally accepted accounting principles in the United States of America (“GAAP”). The consolidated financial statements include the Company and its wholly-owned subsidiaries. All intercompany balances and transactions have been eliminated in consolidation. Certain information and notes normally included in annual financial statements prepared in accordance with GAAP have been condensed or omitted under the rules and regulations of the Securities and Exchange Commission (“SEC”).
Unaudited Interim Financial Information
These unaudited interim financial statements have been prepared in accordance with GAAP. In management’s opinion, the unaudited interim financial statements have been prepared on the same basis as the audited consolidated financial statements and include all adjustments of a normal recurring nature necessary for the fair presentation of the Company’s statement of financial position and operating results for the periods presented. The results for the three and nine months ended November 30, 2014 are not necessarily indicative of the results expected for the full fiscal year or any other period.
Accounting Policies
The accompanying unaudited interim condensed consolidated financial statements and accompanying related notes should be read in conjunction with the consolidated financial statements and related notes included in the Company’s Annual Report on Form 10-K for the year ended February 28, 2014.
6
Table of Contents
Accounting Updates
In May 2014, the Financial Accounting Standards Board (“FASB”) issued Accounting Standards Update ASU No. 2014-09, “Revenue from Contracts with Customers.” ASU 2014-09 supersedes the revenue recognition requirements in “Topic 605, Revenue Recognition” and requires entities to recognize revenue in a way that depicts the transfer of promised goods or services to customers in an amount that reflects the consideration to which the entity expects to be entitled in exchange for those goods or services. ASU 2014-09 is effective retrospectively for annual or interim reporting periods beginning after December 15, 2016, with early application not permitted. The Company is currently assessing the impact the adoption of this update will have on its consolidated financial statements.
In June 2014, the FASB issued ASU 2014-12-Compensation-Stock Compensation, which requires that a performance target that affects vesting and that could be achieved after the requisite service period be treated as a performance condition. ASU 2014-12 is effective for annual reporting periods, and interim periods within those years, beginning after December 15, 2015. Early adoption is permitted. The amendments may be applied prospectively to all awards granted or modified after the effective date or retrospectively to all awards with performance targets that are outstanding as of the beginning of the earliest annual period presented. The Company assessed that the adoption of this update will not have a material impact on its consolidated financial statements.
Use of Estimates
The preparation of the Company’s condensed consolidated financial statements in conformity with GAAP requires management to make certain estimates and assumptions that affect the reported amounts of assets and liabilities and disclosure of contingent assets and liabilities at the date of the condensed consolidated financial statements and the reported results of operations during the reporting period. Such estimates include the allowance for doubtful accounts receivable, revenue allocations, deferred tax asset valuation allowance, unrecognized tax benefits, fair value of acquired tangible and intangible assets, useful lives of tangible and intangible assets, potential impairment of goodwill or other long-lived assets, accrued liabilities, loss contingencies and stock-based compensation amortization periods and forfeiture rates. Actual results could differ from those estimates.
Revenue Recognition
The Company generates revenue primarily from the sale of subscriptions and support and professional services.
Subscriptions and Support. The Company offers on-demand software solutions, which enable its customers to have constant access to its solutions without the need to manage and support the software and associated hardware themselves. The Company houses the hardware and software in third-party facilities, and provides its customers with access to the software solutions, along with data security and storage, backup and recovery services and solution support. The Company’s customer contracts typically have terms of three to five years. The Company invoices its customers for subscriptions and support in advance for annual use of the software solutions. The Company’s payment terms typically require customers to pay within 30 to 90 days from the invoice date.
Professional Services. Professional services revenue is derived primarily from fees for enabling services, including solution consulting and solution deployment. These services are sold in conjunction with the sale of the Company’s on-demand software solutions. The Company provides professional services, both on a fixed fee and a time and materials basis, and invoices customers either in advance, monthly, or upon reaching project milestones.
The Company enters into arrangements with multiple elements, comprising subscriptions and support and professional services. Arrangements with customers typically do not provide the customer with the right to take possession of the software supporting the on-demand solutions. The Company commences revenue recognition when all of the following criteria are met: persuasive evidence of an arrangement exists, delivery has occurred or services have been rendered, the Company’s price to the customer is fixed or determinable, and collectability of the fees is reasonably assured.
The Company evaluates each of these criteria as follows:
Evidence of an Arrangement. The Company considers a binding agreement signed by it and the customer to be evidence of an arrangement.
Delivery. The Company typically considers delivery to have occurred when the on-demand software solutions are made available to the customer or services have been rendered. In arrangements where an existing customer purchases additional solutions, delivery occurs upon commencement of the contractual term.
7
Table of Contents
Fixed or Determinable Fee. The Company considers the fee to be fixed or determinable unless the fee is subject to refund or adjustment or is not payable within its standard payment terms. If the fee is not fixed or determinable, the Company recognizes the revenue as amounts become due and payable.
Collectability of the Fees is Reasonably Assured. Collectability of the fees is reasonably assured if the Company expects that the customer will be able to pay amounts under the arrangement as payments become due. If the Company determines that collection is not reasonably assured, the Company defers the recognition of revenue until cash collection.
The Company accounts for subscriptions and support and professional services revenue as separate units of accounting and allocates revenue to each deliverable in an arrangement based on a selling price hierarchy. As the Company has been unable to establish vendor specific objective evidence (“VSOE”) or third party evidence (“TPE”) for the elements of its arrangements, the Company determines the best estimated selling price (“BESP”) for each element primarily by considering prices the Company charges for similar offerings, size of the order and historical pricing practices. Revenue allocated to subscriptions and support is recognized over the contractual term. Professional services revenue sold on a fixed fee basis is recognized either under the proportional performance method of accounting using estimated labor hours, or upon acceptance of the services. Revenue from professional services sold on a time and material basis is recognized as services are delivered.
Impairment of Long-Lived Assets
The Company evaluates the recoverability of its long-lived assets, which consist principally of property and equipment and acquired intangible assets with finite lives, whenever events or circumstances indicate that the carrying amount of these assets may not be recoverable. Recoverability of an asset is measured by comparing the carrying amount to the expected future undiscounted cash flows that the asset is expected to generate. If that review indicates that the carrying amount of the long-lived asset is not recoverable, an impairment charge is recorded for the amount by which the carrying amount of the asset exceeds its fair value. The Company did not record any long-lived asset impairment charges during the nine months ended November 30, 2014 and 2013.
8
Table of Contents
(3) Acquisition
On June 4, 2014, the Company acquired all of the outstanding shares of Serus, a Company headquartered in Santa Clara, California and a leading provider of cloud-based manufacturing and supply chain visibility and intelligence solutions to semiconductor and other high tech companies, for approximately $24.8 million. The total initial purchase consideration comprised the following (in thousands):
| Cash payment |
$ | 12,405 | ||
| 238,194 shares of the Company’s common stock |
3,966 | |||
| Cash holdback |
1,850 | |||
| Fair value of earn-out liability |
6,600 | |||
|
|
|
|||
| Total |
$ | 24,821 | ||
|
|
|
The Company held back $1.9 million of the purchase price consideration, which constitutes partial security for indemnification obligations. This amount was recorded as “acquisition-related obligations to sellers” in the balance sheet, and is payable twelve months after the closing date, subject to agreement between the Company and the former shareholders of Serus.
Additionally, the former shareholders of Serus have rights to receive contingent cash consideration (“earn-out liability”) of up to $7.5 million, based upon the achievement of certain revenue-related financial performance milestones over a period of 12 months. The Company has recorded the estimated fair value of this earn-out liability based on probability weighted-payout discounted using a discount rate of 10% as of the acquisition date of $6.6 million under “acquisition-related obligations to sellers” in the balance sheet. Subsequent to the date of acquisition, the estimated fair value of the earn-out liability increased to $6.8 million as of November 30, 2014 primarily as a result of the passage of time and the corresponding impact of discounting. The change in fair value of the earn-out liability is recorded under acquisition-related expenses as a part of operating expenses in our condensed consolidated statements of operations. This preliminary amount of the earn-out liability may, however, differ from the amount that is ultimately settled.
Transaction costs of $1.0 million associated with the acquisition of Serus were expensed as incurred and presented as acquisition-related expenses as a part of operating expenses in our condensed consolidated statements of operations for the nine months ended November 30, 2014.
Allocation of Consideration
The identifiable assets acquired and liabilities assumed were recognized and measured as of the acquisition date based on their estimated fair values. The excess of the fair value of consideration transferred over estimated fair value of the net tangible assets and intangible assets was recorded as goodwill.
The Company is accounting for the Serus acquisition under the purchase method of accounting as a business combination. The following table summarizes the preliminary estimates of fair values of the assets and liabilities assumed at the acquisition date based on the preliminary purchase price allocation. The Company is in the process of validating and refining the assumptions and estimates required in establishing the fair values of the identifiable assets and liabilities, including identifiable intangible assets. The final purchase price allocation may differ from the preliminary amounts disclosed below (in thousands):
| Cash and cash equivalents |
$ | 82 | ||
| Accounts receivable |
846 | |||
| Prepaid expenses and other current assets |
136 | |||
| Property and equipment |
172 | |||
| Identifiable intangible assets |
15,500 | |||
| Other assets |
66 | |||
|
|
|
|||
| Total identifiable assets acquired |
16,802 | |||
| Accounts payable and accrued liabilities |
(1,646 | ) | ||
| Deferred revenue |
(3,457 | ) | ||
| Capital lease obligations and notes payable |
(64 | ) | ||
| Other noncurrent liabilities |
(22 | ) | ||
|
|
|
|||
| Total liabilities assumed |
(5,189 | ) | ||
|
|
|
|||
| Net identifiable assets acquired |
11,613 | |||
| Goodwill |
13,208 | |||
|
|
|
|||
| Total consideration |
$ | 24,821 | ||
|
|
|
9
Table of Contents
The key factor attributable to the creation of goodwill by the transaction is that, by combining Serus’ robust technology with the E2open Business Network, the Company extends its dominance in the high tech supply chain with the addition of technology for design for manufacturing, contracts and compliance, as well as early stage visibility in the semiconductor and technology-driven discrete manufacturing industries.
As of the date of acquisition, the identifiable intangible assets comprised developed technology of approximately $7.7 million and a customer relationship intangible of approximately $7.8 million. The Company is amortizing the intangible assets over the expected useful life of 5 years. The amortization for the post-acquisition period from June 4, 2014 to November 30, 2014 was $1.5 million.
Revenue earned by Serus was $2.3 million for the period from the acquisition date of June 4, 2014 to November 30, 2014 and was included in our condensed consolidated statements of operations. Immediately following the acquisition, Serus’ operations in the United States were merged into the Company’s operations, as such, the standalone Serus net income (loss) post-acquisition is not readily determinable. The unaudited pro forma revenue and net loss for the nine months ended November 30, 2014 presented below combine the consolidated results of the Company and Serus giving effect to the acquisition of Serus as if it had been completed on March 1, 2013, the beginning of the annual reporting period prior to the year of acquisition. This unaudited pro forma financial information is presented for informational purposes only and is not indicative of future operations or results had the acquisition been completed as of March 1, 2013. The unaudited pro forma financial results presented below do not include any anticipated synergies or other expected benefits of the acquisition and include certain adjustments for additional depreciation and amortization expense based upon the fair value step-up and estimated useful lives of Serus’ amortizable assets acquired in the transaction, adjustments to net interest expense based upon settlement of debt assumed upon acquisition, and adjustments to net income to reflect the decrease of interest income arising from the reduction of investments in available-for-sale securities. The provision for income taxes from continuing operations has also been adjusted for all periods, based upon the foregoing adjustments to historical results.
| Nine Months Ended November 30, |
||||||||
| 2014 | 2013 | |||||||
| (in thousands, except per share data) | ||||||||
| Pro forma revenue |
$ | 60,957 | $ | 54,951 | ||||
| Pro forma net loss |
(24,325 | ) | (24,669 | ) | ||||
| Pro forma net income (loss) per share: |
||||||||
| Basic and diluted |
(0.92 | ) | (0.94 | ) | ||||
(4) Cash and Investments
The following table presents cash, cash equivalents and investments for the periods presented (in thousands):
| Amortized Cost | Gross Unrealized Gains |
Gross Unrealized Losses |
Estimated Fair Market Value |
|||||||||||||
| As of November 30, 2014: |
||||||||||||||||
| Cash |
$ | 5,428 | $ | — | $ | — | $ | 5,428 | ||||||||
| Cash equivalents: |
||||||||||||||||
| Money market accounts |
7,564 | — | — | 7,564 | ||||||||||||
| Money market funds |
5,908 | — | — | 5,908 | ||||||||||||
| Commercial paper |
— | — | — | — | ||||||||||||
| Short-term investments: |
||||||||||||||||
| Commercial paper |
650 | — | — | 650 | ||||||||||||
| Corporate debt securities |
4,118 | 3 | (1 | ) | 4,120 | |||||||||||
| Agency bonds |
— | — | — | — | ||||||||||||
| Certificate of deposit |
501 | — | — | 501 | ||||||||||||
| Long-term investments: |
||||||||||||||||
| Corporate debt securities |
672 | — | — | 672 | ||||||||||||
| Asset-backed securities |
198 | — | — | 198 | ||||||||||||
| U.S. government securities |
— | — | — | — | ||||||||||||
| Common trust funds |
15 | — | — | 15 | ||||||||||||
| Insurance company contracts |
15 | — | — | 15 | ||||||||||||
|
|
|
|
|
|
|
|
|
|||||||||
| Total cash, cash equivalents, and investments |
$ | 25,069 | $ | 3 | $ | (1 | ) | $ | 25,071 | |||||||
|
|
|
|
|
|
|
|
|
|||||||||
10
Table of Contents
| Amortized Cost | Gross Unrealized Gains |
Gross Unrealized Losses |
Estimated Fair Market Value |
|||||||||||||
| As of February 28, 2014: |
||||||||||||||||
| Cash |
$ | 3,300 | $ | — | $ | — | $ | 3,300 | ||||||||
| Cash equivalents: |
||||||||||||||||
| Money market accounts |
11,905 | — | — | 11,905 | ||||||||||||
| Money market funds |
19,221 | — | — | 19,221 | ||||||||||||
| Commercial paper |
8,296 | 1 | — | 8,297 | ||||||||||||
| Short-term investments: |
||||||||||||||||
| Commercial paper |
10,492 | — | (1 | ) | 10,491 | |||||||||||
| Corporate debt securities |
2,378 | 1 | (1 | ) | 2,378 | |||||||||||
| Agency bonds |
1,504 | 1 | — | 1,505 | ||||||||||||
| Long-term investments: |
||||||||||||||||
| Corporate debt securities |
3,154 | 3 | (6 | ) | 3,151 | |||||||||||
| Asset-backed securities |
250 | — | — | 250 | ||||||||||||
| U.S. government securities |
5,005 | 3 | — | 5,008 | ||||||||||||
| Common trust funds |
120 | — | (4 | ) | 116 | |||||||||||
| Insurance company contracts |
16 | — | — | 16 | ||||||||||||
|
|
|
|
|
|
|
|
|
|||||||||
| Total cash, cash equivalents, and investments |
$ | 65,641 | $ | 9 | $ | (12 | ) | $ | 65,638 | |||||||
|
|
|
|
|
|
|
|
|
|||||||||
The available-for-sale securities that the Company intends to hold for less than one year are classified as short-term investments, and the securities that the Company intends to hold for more than one year are classified as long-term investments. The following table presents available-for-sale securities, recorded in cash equivalents and investments, by contractual maturity date as of November 30, 2014 (in thousands):
| Amortized Cost |
Estimated Fair Market Value |
|||||||
| Matures in one year or less |
$ | 5,269 | $ | 5,271 | ||||
| Matures after one year through two years |
901 | 900 | ||||||
|
|
|
|
|
|||||
| Total |
$ | 6,170 | $ | 6,171 | ||||
|
|
|
|
|
|||||
For the three and nine months ended November 30, 2014, the realized gains and losses, and unrealized losses on these available-for-sale securities were not material. Additionally, none of these securities were in a continuous unrealized loss position for more than 12 months. As of November 30, 2014, the Company did not consider any of its available-for-sale securities to be other-than-temporarily impaired.
(5) Goodwill and Intangible Assets
Goodwill and intangible assets are as follows (in thousands):
| November 30, 2014 |
February 28, 2014 |
|||||||
| Goodwill |
||||||||
| ICON |
$ | 22,784 | $ | 22,556 | ||||
| Serus (see note 3) |
13,208 | — | ||||||
|
|
|
|
|
|||||
| $ | 35,992 | $ | 22,556 | |||||
|
|
|
|
|
|||||
| Intangible assets |
||||||||
| Acquired technology |
$ | 14,700 | $ | 7,000 | ||||
| Less: accumulated amortization |
(2,624 | ) | (817 | ) | ||||
|
|
|
|
|
|||||
| Net acquired technology |
12,076 | 6,183 | ||||||
|
|
|
|
|
|||||
| Customer relationships |
13,700 | 5,900 | ||||||
| Less: accumulated amortization |
(2,340 | ) | (688 | ) | ||||
|
|
|
|
|
|||||
| Net customer relationships |
11,360 | 5,212 | ||||||
|
|
|
|
|
|||||
| Net intangible assets |
$ | 23,436 | $ | 11,395 | ||||
|
|
|
|
|
|||||
11
Table of Contents
The changes in the carrying amount of goodwill for the nine months ended November 30, 2014 are as follows (in thousands):
| As of February 28, 2014 |
$ | 22,556 | ||
| Acquisition of Serus |
13,208 | |||
| Adjustments to ICON goodwill |
228 | |||
|
|
|
|||
| As of November 30, 2014 |
$ | 35,992 | ||
|
|
|
During the nine months ended November 30, 2014, the Company recorded intangible assets comprising developed technology of approximately $7.7 million and customer relationship intangible of approximately $7.8 million from the acquisition of Serus. The Company is amortizing these intangible assets over the expected useful life of 5 years. The amortization expense of these intangible assets for the nine months ended November 30, 2014 was $1.5 million.
Total amortization expense of intangible assets for the three months ended November 30, 2014 was $1.4 million, of which, $0.7 million was recorded in cost of revenues, and $0.7 million in operating expenses. Total amortization expense of intangible assets for the nine months ended November 30, 2014 was $3.5 million, of which, $1.8 million was recorded in cost of revenues, and $1.7 million in operating expenses.
The expected future annual amortization expense related to the acquired intangible assets existing as of November 30, 2014, is as follows (in thousands):
| Fiscal year ending: |
||||
| 2015 (remaining three months) |
$ | 1,420 | ||
| 2016 |
5,680 | |||
| 2017 |
5,680 | |||
| 2018 |
5,680 | |||
| 2019 onwards |
4,976 | |||
|
|
|
|||
| Total |
$ | 23,436 | ||
|
|
|
(6) Consolidated Balance Sheet Components
Consolidated balance sheet components as of the dates presented comprised the following:
| November 30, 2014 |
February 28, 2014 |
|||||||
| Prepaid expenses and other current assets (in thousands): |
||||||||
| Prepaid software license fees, hardware and software maintenance |
$ | 1,503 | $ | 1,215 | ||||
| Restricted cash held in escrow (see note 10) |
1,424 | — | ||||||
| Other prepaid expenses and other current assets |
1,728 | 3,165 | ||||||
|
|
|
|
|
|||||
| $ | 4,655 | $ | 4,380 | |||||
|
|
|
|
|
|||||
The total cost of software licenses, maintenance, and insurance premiums financed under capital leases and notes payable included above was $4.7 million and $5.1 million as of November 30, 2014 and February 28, 2014. Accumulated amortization of software licenses under capital leases and notes payable was $1.3 million and $1.2 million as of November 30, 2014 and February 28, 2014. Amortization of software licenses held under capital leases and notes payable is included in cost of revenue and operating expenses. Prepaid maintenance and services are expensed over the term of the agreements.
| November 30, 2014 |
February 28, 2014 |
|||||||
| Property and equipment, net (in thousands): |
||||||||
| Computer equipment |
$ | 10,687 | $ | 9,569 | ||||
| Software |
9,635 | 9,461 | ||||||
| Furniture and fixtures |
419 | 214 | ||||||
| Leasehold improvements |
546 | 511 | ||||||
|
|
|
|
|
|||||
| 21,287 | 19,755 | |||||||
| Less: accumulated depreciation and amortization |
(17,846 | ) | (16,324 | ) | ||||
|
|
|
|
|
|||||
| $ | 3,441 | $ | 3,431 | |||||
|
|
|
|
|
|||||
12
Table of Contents
Property and equipment financed through capital leases and notes payable included above aggregated $4.4 million and $3.4 million as of November 30, 2014 and February 28, 2014. Accumulated depreciation and amortization on these assets aggregated $2.0 million and $1.0 million as of November 30, 2014 and February 28, 2014.
| November 30, 2014 |
February 28, 2014 |
|||||||
| Accounts payable and accrued liabilities (in thousands): |
||||||||
| Accrued compensation costs |
$ | 7,185 | $ | 7,494 | ||||
| Trade accounts payable |
3,502 | 3,242 | ||||||
| Accrued taxes and other |
1,576 | 1,630 | ||||||
|
|
|
|
|
|||||
| $ | 12,263 | $ | 12,366 | |||||
|
|
|
|
|
|||||
(7) Notes Payable and Capital Lease Obligations
The Company finances the purchase of certain equipment, software and related support and maintenance with notes payable and capital leases. The terms of the notes payable and capital leases range from nine months to three years and bear interest at rates ranging from 0.00% to 13.13% per annum. Total minimum payments due under notes payable and capital lease obligations as of November 30, 2014 are as follows (in thousands):
Total minimum payments due under capital lease obligations as of November 30, 2014 are as follows (in thousands):
| Fiscal year ending: |
||||
| 2015 (remaining 3 months) |
$ | 533 | ||
| 2016 |
1,720 | |||
| 2017 |
499 | |||
| 2018 |
122 | |||
|
|
|
|||
| Total minimum payments |
2,874 | |||
| Less: portion representing interest |
(181 | ) | ||
|
|
|
|||
| Total principal portion of minimum payments |
2,693 | |||
| Less: current portion |
(1,715 | ) | ||
|
|
|
|||
| Total principal portion of minimum payments, net of current portion |
$ | 978 | ||
|
|
|
Total amounts due under notes payable as of November 30, 2014 are as follows (in thousands):
| Fiscal year ending: |
||||
| 2015 (remaining 3 months) |
$ | 617 | ||
| 2016 |
2,055 | |||
| 2017 |
959 | |||
| 2018 |
148 | |||
|
|
|
|||
| Total |
3,779 | |||
| Less: current portion |
(2,200 | ) | ||
|
|
|
|||
| Total notes payable, net of current portion |
$ | 1,579 | ||
|
|
|
13
Table of Contents
(8) Bank Credit Facilities
On October 7, 2013, the Company entered into a business financing agreement for a revolving loan facility with a borrowing capacity of up to $20.0 million. Funds available are subject to a borrowing formula which is secured by the Company’s accounts receivable and contracted backlog. As of November 30, 2014, the available borrowing capacity amount is $15.6 million. This agreement is effective for a period of two years through October 2015. The revolving loan facility bears interest at a per annum rate ranging from the Wall Street Journal prime rate minus 0.25% to the Wall Street Journal prime rate plus 0.25%, with a floor for the prime rate of 3.25%. The revolving loan facility is a general obligation of the Company secured by the Company’s tangible and intangible assets, as well as a negative pledge whereby the Company agrees not to give any creditor a security interest on the Company’s intellectual property. There were no borrowings as of and for the nine months ended November 30, 2014.
A wholly-owned subsidiary in Germany maintains a bank overdraft facility with a local bank used primarily to fund working capital. For the nine months ended November 30, 2014, the Company borrowed and repaid $4.2 million from these overdraft facilities. As of November 30, 2014, the Company had approximately $0.7 million (€0.5 million) of overdraft capacity, with no outstanding balance.
(9) Related Party Transactions
One of the Company’s directors, Patrick J. O’Malley, III, is the Chief Financial Officer of Seagate Technology Public Limited Company, or Seagate PLC. Seagate LLC, a wholly-owned subsidiary of Seagate PLC (“Seagate”), is one of the Company’s customers and the Company earned revenue of $0.7 million and $0.9 million for the three months ended November 30, 2014 and 2013, and $2.1 million and $2.5 million for the nine months ended November 30, 2014 and 2013 from this customer. The Company received payments from Seagate of $2.5 million and $1.6 million for the three months ended November 30, 2014 and 2013, and $2.5 million and $2.8 million for the nine months ended November 30, 2014 and 2013. The Company has outstanding receivables from Seagate of $0.1 million and $0.1 million as of November 30, 2014 and February 28, 2014.
(10) Commitments and Contingencies
Acquisition-related Obligations
In accordance with the share purchase agreement for the acquisition of ICON, the Company placed in escrow approximately $5.4 million (€4.0 million) payable to ICON’s former shareholders. In September 2014, the Company released $4.0 million to ICON’s former shareholders. As of November 30, 2014, the remaining $1.4 million is recorded as restricted cash, under prepaid expenses and other current assets in the balance sheet, with the corresponding liability recorded under acquisition-related obligations in the balance sheet.
During the three months ended August 31, 2014, the Company completed the acquisition of Serus. The purchase consideration includes a contingent payment earnout of up to $7.5 million based upon the achievement of certain revenue-related financial performance milestones. This contingent consideration (“earn-out liability’) is recorded at fair value on the acquisition date and is re-measured quarterly based on the then-assessed fair value and adjusted if necessary. As of November 30, 2014, the estimated fair value of the earn-out liability was approximately $6.8 million and was recorded in acquisition-related obligations in our consolidated balance sheet. Additionally, there is a $1.9 million cash holdback payable on May 31, 2015, which was also reported under acquisition-related obligations in our consolidated balance sheet.
Leases
The Company leases its primary office space under noncancelable operating leases with various expiration dates through January 2020. Rent expense was $0.8 million and $0.7 million for the three months ended November 30, 2014 and 2013, and $2.3 million and $2.0 million for the nine months ended November 30, 2014 and 2013. Future minimum lease payments under noncancelable operating leases as of November 30, 2014 are as follows (in thousands):
| Fiscal year ending: |
||||
| 2015 (remaining 3 months) |
$ | 714 | ||
| 2016 |
2,645 | |||
| 2017 |
2,375 | |||
| 2018 |
2,245 | |||
| 2019 |
1,372 | |||
| 2020 |
694 | |||
|
|
|
|||
| Total minimum lease payments |
$ | 10,045 | ||
|
|
|
Several of the operating lease agreements require the Company to provide security deposits. As of November 30, 2014 and February 28, 2014, lease deposits totaled $0.5 million and $0.5 million. The deposits are generally refundable at the expiration of the lease, assuming all of the Company’s obligations under the lease agreement have been met, and are included in other assets in the condensed consolidated balance sheets.
14
Table of Contents
Contingencies
From time to time, the Company is subject to contingencies that arise in the ordinary course of business. The Company records an accrual for a contingency when it is both probable that a liability has been incurred and the amount of the loss can be reasonably estimated. The Company does not currently believe the resolution of any such contingencies will have a material effect upon the Company’s financial position, results of operations or cash flows.
In the normal course of business, the Company enters into contracts that include provisions indemnifying customers against liabilities if the Company’s products infringe a third-party’s intellectual property rights. The Company has not incurred any costs as a result of such indemnifications and has not accrued any liabilities related to such obligations.
(11) Interest and other income (expense), net
Interest and other income (expense), net for the periods presented consisted of the following (in thousands):
| Three Months Ended November 30, |
Nine Months Ended November 30, |
|||||||||||||||
| 2014 | 2013 | 2014 | 2013 | |||||||||||||
| Interest income |
$ | 34 | $ | 4 | $ | 100 | $ | 85 | ||||||||
| Interest expense |
(116 | ) | (77 | ) | (293 | ) | (145 | ) | ||||||||
| Bank financing fees |
(30 | ) | (34 | ) | (91 | ) | (35 | ) | ||||||||
| Foreign exchange gains (losses)—realized and unrealized, net |
(27 | ) | (181 | ) | 2 | (224 | ) | |||||||||
| Gains (losses) from foreign currency contracts—realized and unrealized, net |
(449 | ) | (174 | ) | (220 | ) | (71 | ) | ||||||||
| Other, net |
12 | 1 | (62 | ) | 11 | |||||||||||
|
|
|
|
|
|
|
|
|
|||||||||
| $ | (576 | ) | $ | (461 | ) | $ | (564 | ) | $ | (379 | ) | |||||
|
|
|
|
|
|
|
|
|
|||||||||
(12) Income Taxes
The Company records its interim income tax benefit or provision based on its estimated annual effective tax rate for the year. The benefit from (provision for) income taxes for the three months ended November 30, 2014 and 2013 was $(0.1) million and $0.2 million, and for the nine months ended November 30, 2014 and 2013, was $(0.1) million and $0.1 million. The provision for income taxes comprised primarily foreign and state income taxes.
The Company has incurred operating losses for most years since inception. As of February 28, 2014, it had net operating loss (“NOL”) carryforwards for federal income tax purposes of $340.9 million, which begin to expire in fiscal 2023, and had NOL carryforwards for state income tax purposes of $69.2 million, which begin to expire in fiscal 2015. In order to utilize the NOL carryforwards, the Company must generate consolidated taxable income which can offset such carryforwards. The deferred tax asset associated with the NOL carryforwards is $98.0 million. As a result of continuing losses, management has determined that insufficient evidence exists to support that it is more likely than not that the Company will realize the benefits of its U.S. net deferred tax assets and therefore has recorded a valuation allowance to reduce the net carrying value of these deferred tax assets to zero. Accordingly, the Company has not recorded a provision for income taxes for any of the periods presented other than provisions for estimated federal alternative minimum taxes, state and foreign taxes, as well as income taxes in foreign jurisdictions. The Company’s effective tax rate differs from the statutory rate due primarily to valuation allowances on deferred taxes, state taxes, foreign taxes, and tax contingencies.
The Company is subject to income tax in the United States as well as other tax jurisdictions in which it conducts business. Earnings from non-U.S. activities are subject to local country income taxes. The Company does not provide for federal income taxes on the undistributed earnings of its foreign subsidiaries as such earnings are expected to be reinvested indefinitely. There is $1.4 million of undistributed earnings of the Company’s foreign subsidiaries as of November 30, 2014. It is not practicable to determine the income tax liability that might be incurred if these earnings were to be repatriated.
As of November 30, 2014 and February 28, 2014, the total amount of gross unrecognized tax benefits was $8.3 million and $8.4 million, of which $0.6 million, if recognized, would affect the Company’s effective tax rate. The Company recognizes interest and penalties related to unrecognized tax benefits as a component of income tax expense. The total amount of gross interest and penalties accrued was $0.1 million as of November 30, 2014 and February 28, 2014, and was classified as other noncurrent liabilities in the consolidated balance sheets. The Company believes that it has adequately provided for any adjustments that may result from tax examinations. However, the outcome of tax audits cannot be predicted with certainty. The Company is not currently under examination or audit by any taxing authorities. For the three and nine months ended November 30, 2014, there has been no material change in the total amount or composition of the Company’s unrecognized tax benefits. The Company is subject to taxation in the U.S., various states and foreign jurisdictions. The 2000 to 2014 tax years’ statutes of limitations generally remain open and are subject to U.S. federal and state tax examinations. The statutes of limitations in foreign jurisdictions range from four to seven years, and the open tax years subject to examination are from 2007 to 2014.
15
Table of Contents
(13) Stock-based Compensation
Options and Awards Granted to Employees
The Company has the ability to issue incentive stock options (“ISOs”), nonstatutory stock options (“NSOs”), stock appreciation rights, restricted stock, restricted stock units (“RSUs”), performance units and performance shares to service providers, including employees and directors, upon Board approval. As of November 30, 2014, there were 6,744,706 shares of common stock reserved for issuance under all stock plans.
Options may be granted for periods of up to 10 years; provided, however, that (i) the exercise price of an ISO and NSO shall not be less than 100% of the estimated fair value of the shares of common stock on the date of grant, and (ii) the exercise price of an ISO granted to a 10% stockholder shall not be less than 110% of the estimated fair value of the underlying shares on the date of grant. Options generally vest 25% on the one-year anniversary of the option grant date, and then monthly for three additional years, and are exercisable for a period of 10 years after the date of grant. RSUs generally vest 25% on the first annual anniversary of the award grant date, and 25% each year thereafter on the annual anniversary of the award grant date for three additional years.
The determination of the fair value of stock-based payment awards on the date of grant using a pricing model is affected by the Company’s stock price as well as by certain assumptions including the Company’s expected stock price volatility over the term of the awards, actual and projected employee stock option exercise behavior, risk-free interest rates, and expected dividends. The estimated grant date fair values of the employee stock options were calculated using the Black Scholes valuation model, based on the following assumptions:
| Three Months Ended November 30, |
Nine Months Ended November 30, | |||||||
| 2014 | 2013 | 2014 | 2013 | |||||
| Expected term (in years) |
6.04 | 6.08 | 6.07 | 5.94 | ||||
| Expected stock price volatility |
50.07% | 50.02% | 50.07% - 50.96% | 50.02% - 51.76% | ||||
| Risk-free interest rate |
1.80% - 1.82% | 1.78% | 1.80% - 1.94% | 0.73% - 1.81% | ||||
| Expected dividend yield |
— | — | — | — | ||||
The expected term represents the period that stock-based awards are expected to be outstanding, giving consideration to the contractual terms of the stock-based awards, vesting schedules, and expectations of future employee behavior as influenced by changes to the terms of the Company’s stock-based awards. The Company estimated the expected term, using the simplified method due to limited exercise data, to be the period of time between the date of grant and the midpoint between option vesting and expiration. The Company estimated the expected volatility of its common stock based on the average of historical and implied volatility of comparable companies from a representative peer group based on industry and market capitalization data. The risk-free interest rate represents the yield on a constant maturity U.S. Treasury security with a term equal to the expected term of the options. Expected dividend yield is set at 0% because the Company does not expect to pay dividends during the term of the option, and historically has not paid any dividends to its stockholders. Management made an estimate of expected forfeitures and is recognizing compensation costs only for those equity awards expected to vest.
In July 2011, the Company awarded 749,464 stock options that were subject to certain financial performance requirements to be achieved by February 28, 2013, before vesting could occur. The vesting of these stock options was also dependent upon the employees’ continued employment after February 28, 2013. In March 2012, the Board of Directors approved a modification of the financial performance requirements. At the date of the modification, the Company determined that the achievement of the modified performance requirements was probable and, accordingly, the recording of compensation cost related to the modified awards commenced. Prior to this date, the Company had not recognized compensation expense associated with these grants because the Company believed that, based on the then-current and expected operational results, it was not probable that the associated financial performance requirements would be achieved. The modified financial performance requirements were achieved by February 28, 2013. The unrecognized compensation cost related to these options is $0.3 million as of November 30, 2014, and is being recognized over the remaining vesting term of three years from the measurement date of February 28, 2013.
In July 2013, the Company awarded 125,250 restricted stock units that were subject to certain financial performance requirements to be achieved by February 28, 2014 before vesting could occur. The vesting of these stock awards is also dependent upon the employees’ continued employment after February 28, 2014. In May 2014, the Board of Directors approved a modification of these awards which resulted in an incremental compensation expense to be recognized over the remaining vesting period. For the three and nine months ended November 30, 2014, the compensation cost related to these awards is $0.1 million and $1.0 million. The unrecognized compensation cost related to these awards as of November 30, 2014 is $0.3 million, and is being recognized over the remaining vesting period of nine months.
16
Table of Contents
For the nine months ended November 30, 2014 and fiscal 2014, the Company awarded 233,332 and 356,500 restricted stock units that are subject to certain financial performance requirements before vesting can occur, and the employees’ continued employment. The Company records compensation expense related to these awards based on the estimated probability of achievement of the financial performance requirements. The compensation cost related to the awards deemed probable of vesting amounting to $0.3 million and $0.9 million was recorded in the condensed consolidated statement of operations for the three and nine months ended November 30, 2014. The unrecognized compensation cost related to the awards is $1.2 million as of November 30, 2014, and is being recognized over the remaining vesting period ranging from nine months to two years and nine months.
Stock Options:
Stock option activity under the Company’s 2012 Plan for the years presented is as follows:
| Number of shares |
Weighted average exercise price |
Weighted average remaining term |
||||||||||
| Balance of options outstanding, February 28, 2014 |
2,241,784 | $ | 9.86 | 7.97 years | ||||||||
| Options granted |
376,366 | 14.90 | ||||||||||
| Options exercised |
(143,835 | ) | 3.89 | |||||||||
| Options canceled and forfeited |
(195,949 | ) | 16.84 | |||||||||
|
|
|
|||||||||||
| Balance of options outstanding, November 30, 2014 |
2,278,366 | 10.47 | 7.38 years | |||||||||
|
|
|
|||||||||||
| Balance of options expected to vest as of February 28, 2014 |
2,179,660 | 9.71 | 7.95 years | |||||||||
| Balance of options exercisable as of February 28, 2014 |
841,902 | 6.38 | 7.29 years | |||||||||
| Balance of options expected to vest as of November 30, 2014 |
2,197,617 | 10.32 | 7.34 years | |||||||||
| Balance of options exercisable as of November 30, 2014 |
1,167,281 | 8.03 | 6.77 years | |||||||||
The weighted average grant date fair value per share of the employee stock options granted during the three months ended November 30, 2014 and 2013 was $6.13 and $19.40, and for the nine months ended November 30, 2014 and 2013 was $14.90 and $18.60.
The intrinsic values of employee stock options exercised during the three months ended November 30, 2014 and 2013 was $0.1 million and $2.4 million, and for the nine months ended November 30, 2014 and 2013 was $1.3 million and $11.2 million. The intrinsic values of vested shares as of November 30, 2014 and February 28, 2014 were $2.7 million and $18.0 million.
As of November 30, 2014, the number of unvested options was 1,111,085.
As of November 30, 2014, the Company had $6.7 million of unrecognized compensation cost excluding estimated forfeitures, related to unvested stock option awards, which is expected to be recognized over a weighted average period of 2.35 years.
Restricted Stock Units:
The RSU activity under the Company’s 2012 Plan for the years presented is as follows:
| Number of shares |
Weighted average grant date fair value per share |
Weighted average remaining term |
||||||||||
| Balance of awards outstanding, February 28, 2014 |
568,195 | $ | 19.83 | 2.11 years | ||||||||
| Awards granted |
1,548,284 | 11.58 | ||||||||||
| Awards released |
(159,757 | ) | 12.55 | |||||||||
| Awards canceled and forfeited |
(65,184 | ) | 18.36 | |||||||||
|
|
|
|
|
|||||||||
| Balance of awards outstanding, November 30, 2014 |
1,891,538 | $ | 13.27 | 1.69 years | ||||||||
|
|
|
|
|
|||||||||
| Balance of awards expected to vest, February 28, 2014 |
520,774 | $ | 19.83 | 2.11 years | ||||||||
| Balance of awards expected to vest, November 30, 2014 |
1,665,013 | $ | 13.27 | 2.98 years | ||||||||
17
Table of Contents
The weighted average grant date fair value per share of the RSUs granted during the three months ended November 30, 2014 and 2013 was $5.65 and $22.41, and for the nine months ended November 30, 2014 and 2013 was $11.58 and $20.87.
The intrinsic value of outstanding RSUs as of November 30, 2014 was $12.7 million.
Total compensation expense for these awards recorded in the condensed consolidated statement of operations for the three months ended November 30, 2014 and 2013 was $1.4 million and $0.3 million, and for the nine months ended November 30, 2014 and November 30, 2013 was $4.6 million and $0.7 million. As of November 30, 2014, none of the outstanding awards were vested.
As of November 30, 2014, the Company had $1.5 million of unrecognized compensation expense related to these RSUs, which is expected to be recognized over a weighted average period of 2.98 years.
Total share-based compensation:
Total compensation expense recorded for share-based awards for the three months ended November 30, 2014 and 2013 was $2.3 million and $1.4 million, and for the nine months ended November 30, 2014 and November 30, 2013 was $7.1 million and $4.0 million. No compensation cost was capitalized during the three and nine months ended November 30, 2014 and 2013.
The table below sets forth the functional classification of share-based compensation expense for the periods presented (in thousands):
| Three Months Ended November 30, |
Nine Months Ended November 30, |
|||||||||||||||
| 2014 | 2013 | 2014 | 2013 | |||||||||||||
| Cost of revenue |
$ | 649 | $ | 403 | $ | 2,075 | $ | 1,132 | ||||||||
| Research and development |
206 | 133 | 581 | 349 | ||||||||||||
| Sales and marketing |
887 | 559 | 2,614 | 1,466 | ||||||||||||
| General and administrative |
572 | 351 | 1,858 | 1,062 | ||||||||||||
|
|
|
|
|
|
|
|
|
|||||||||
| $ | 2,314 | $ | 1,446 | $ | 7,128 | $ | 4,009 | |||||||||
|
|
|
|
|
|
|
|
|
|||||||||
(14) Net Loss Per Share
Basic net loss per share is computed by dividing the net loss by the weighted-average number of common shares outstanding during the period. Diluted net loss per share is computed by dividing the net loss by the weighted-average number of common shares outstanding, including potential dilutive common shares assuming the dilutive effect of outstanding stock options, restricted stock units and warrants using the treasury stock method. For periods in which the Company has generated a net loss, the Company does not include stock options, warrants, and unvested restricted stock units in its computation of diluted net loss per share, as the impact of these awards is anti-dilutive.
The following table sets forth the computation of basic and diluted net loss per share (in thousands, except per share data):
| Three Months Ended November 30, |
Nine Months Ended November 30, |
|||||||||||||||
| 2014 | 2013 | 2014 | 2013 | |||||||||||||
| Net loss |
$ | (9,066 | ) | $ | (7,382 | ) | $ | (25,734 | ) | $ | (18,699 | ) | ||||
|
|
|
|
|
|
|
|
|
|||||||||
| Basic and diluted shares: |
29,253 | 26,545 | 29,065 | 26,061 | ||||||||||||
|
|
|
|
|
|
|
|
|
|||||||||
| Net loss per share: |
||||||||||||||||
| Basic and diluted |
$ | (0.31 | ) | $ | (0.28 | ) | $ | (0.89 | ) | $ | (0.72 | ) | ||||
|
|
|
|
|
|
|
|
|
|||||||||
The following weighted average outstanding shares, options, restricted stock units and warrants were excluded from the computation of diluted net income per share in the periods presented because including them would have had an anti-dilutive effect (in thousands):
| Three Months Ended November 30, |
Nine Months Ended November 30, |
|||||||||||||||
| 2014 | 2013 | 2014 | 2013 | |||||||||||||
| Options to purchase common stock |
609 | 1,189 | 893 | 1,312 | ||||||||||||
| Restricted stock units |
627 | 320 | 745 | 230 | ||||||||||||
18
Table of Contents
(15) Fair Value Measurements
The Company’s financial instruments include cash and cash equivalents, investments, accounts receivable, net, accounts payable, acquisition-related obligations, notes payable and capital lease obligations. Accounts receivable, net, accounts payable and acquisition-related obligations are stated at their carrying value, which approximates fair value, due to their short maturity. The Company measures its cash equivalents, investments and foreign currency forward contracts at fair value based on an exchange or exit price as defined by the authoritative guidance on fair value measurements which represents the amount that would be received for an asset sale or an exit price, or paid to transfer a liability in an orderly transaction between knowledgeable and willing market participants. The Company estimates the fair value for notes payable and capital lease obligations by discounting the future cash flows of the related note and lease payments.
As a basis for considering such assumptions, accounting guidance establishes a three-tier value hierarchy, which prioritizes the inputs used in measuring fair value as follows:
| Level 1 | — | Observable inputs such as quoted prices in an active market; | ||
| Level 2 | — | Inputs other than the quoted prices in active markets that are observable either directly or indirectly; and | ||
| Level 3 | — | Unobservable inputs in which there is little or no market data, which requires the Company to develop its own assumptions. | ||
Observable inputs are based on market data obtained from independent sources. Unobservable inputs reflect the Company’s assessment of the assumptions market participants would use to value certain financial instruments. This hierarchy requires the Company to use observable market data, when available, and to minimize the use of unobservable inputs when determining fair value.
The Company’s assets and liabilities that are measured at fair value on a recurring basis, by level, within the fair value hierarchy as of November 30, 2014 and February 28, 2014, are summarized as follows (in thousands):
| November 30, 2014 | February 28, 2014 | |||||||||||||||||||||||||||||||
| Level 1 | Level 2 | Level 3 | Total | Level 1 | Level 2 | Level 3 | Total | |||||||||||||||||||||||||
| Assets: |
||||||||||||||||||||||||||||||||
| Cash equivalents: |
||||||||||||||||||||||||||||||||
| Money market accounts |
$ | 7,564 | $ | — | $ | — | $ | 7,564 | $ | 11,905 | $ | — | $ | — | $ | 11,905 | ||||||||||||||||
| Money market funds |
5,908 | — | — | 5,908 | 19,221 | — | — | 19,221 | ||||||||||||||||||||||||
| Commercial paper |
— | — | — | — | — | 8,297 | — | 8,297 | ||||||||||||||||||||||||
| Short-term investments: |
||||||||||||||||||||||||||||||||
| Commercial paper |
— | 650 | — | 650 | — | 10,491 | — | 10,491 | ||||||||||||||||||||||||
| Corporate debt securities |
— | 4,120 | — | 4,120 | — | 2,378 | — | 2,378 | ||||||||||||||||||||||||
| Agency bonds |
— | — | — | — | — | 1,505 | — | 1,505 | ||||||||||||||||||||||||
| Certificate of deposit |
501 | — | — | 501 | — | — | — | — | ||||||||||||||||||||||||
| Other current assets: |
||||||||||||||||||||||||||||||||
| Foreign currency forward contracts |
— | — | — | — | — | 60 | — | 60 | ||||||||||||||||||||||||
| Long-term investments: |
||||||||||||||||||||||||||||||||
| Corporate debt securities |
— | 672 | — | 672 | — | 3,151 | — | 3,151 | ||||||||||||||||||||||||
| Asset-backed securities |
— | 198 | — | 198 | — | 250 | — | 250 | ||||||||||||||||||||||||
| Common trust funds |
— | 15 | — | 15 | — | 116 | — | 116 | ||||||||||||||||||||||||
| Insurance company contracts |
— | 15 | — | 15 | — | 16 | — | 16 | ||||||||||||||||||||||||
| U.S. government securities |
— | — | — | — | 5,008 | — | — | 5,008 | ||||||||||||||||||||||||
| Other noncurrent assets: |
||||||||||||||||||||||||||||||||
| Certificate of deposit |
16 | — | — | 16 | 16 | — | — | 16 | ||||||||||||||||||||||||
|
|
|
|
|
|
|
|
|
|
|
|
|
|
|
|
|
|||||||||||||||||
| Total assets |
$ | 13,989 | $ | 5,670 | $ | — | $ | 19,659 | $ | 36,150 | $ | 26,264 | $ | — | $ | 62,414 | ||||||||||||||||
|
|
|
|
|
|
|
|
|
|
|
|
|
|
|
|
|
|||||||||||||||||
| Liabilities: |
||||||||||||||||||||||||||||||||
| Acquisition-related obligations: |
||||||||||||||||||||||||||||||||
| Earn-out liability (see note 3) |
— | — | 6,800 | 6,800 | — | — | — | — | ||||||||||||||||||||||||
| Other current liabilities: |
||||||||||||||||||||||||||||||||
| Foreign currency forward contracts |
— | 364 | — | 364 | — | (163 | ) | — | (163 | ) | ||||||||||||||||||||||
|
|
|
|
|
|
|
|
|
|
|
|
|
|
|
|
|
|||||||||||||||||
| Total liabilities |
$ | — | $ | 364 | $ | 6,800 | $ | 7,164 | $ | — | (163 | ) | — | (163 | ) | |||||||||||||||||
|
|
|
|
|
|
|
|
|
|
|
|
|
|
|
|
|
|||||||||||||||||
The fair values of the Company’s Level 1 financial instruments, which are traded in active markets, are based on quoted market prices for identical instruments. The fair values of the Company’s Level 2 financial instruments are based on quoted market prices for comparable instruments or model driven valuations using observable market data or inputs corroborated by observable market data. The Company’s foreign currency forward contracts are valued using pricing models that use observable market inputs and, therefore, are classified as Level 2. The Company’s earn-out liability is valued based on probability-weighted payout approach that use unobservable market input and, therefore, is classified as Level 3.
19
Table of Contents
In the nine months ended November 30, 2014, the Company sought to hedge the risks associated with exchange rate fluctuations through entry into forward exchange contracts. The contracts are classified as Level 2. The tables below present the notional amounts (at the contract exchange rates), the weighted-average contractual foreign currency exchange rates, and the estimated fair value of contracts outstanding as of November 30, 2014 and February 28, 2014 (in USD thousands, except average contract rate):
| November 30, 2014 | February 28, 2014 | |||||||||||||||||||||||
| Notional Sell (Buy) |
Average Contract Rate |
Estimated Fair Value |
Notional Sell (Buy) |
Average Contract Rate |
Estimated Fair Value |
|||||||||||||||||||
| Foreign currency forward exchange contracts: |
||||||||||||||||||||||||
| Euro |
$ | 65 | 1.3 | $ | 11 | $ | 7,401 | 1.4 | $ | (256 | ) | |||||||||||||
| Malaysian Ringgit |
(2,763 | ) | 3.3 | (101 | ) | (2,146 | ) | 3.2 | (59 | ) | ||||||||||||||
| British Pound |
(5,769 | ) | 1.6 | (274 | ) | (4,317 | ) | 1.6 | 212 | |||||||||||||||
|
|
|
|
|
|
|
|
|
|||||||||||||||||
| Total |
$ | (8,467 | ) | $ | (364 | ) | $ | 938 | $ | (103 | ) | |||||||||||||
|
|
|
|
|
|
|
|
|
|||||||||||||||||
The Company entered into the foreign exchange contracts with two counterparties. The Company has the right of offset for gains earned and losses incurred under contracts with the same counterparty, and therefore has recorded contracts with the same counterparty on a net basis in the balance sheet.
The Company does not use derivatives for speculative or trading purposes.
(16) Significant Customer Information
Customers accounting for 10% or more of revenue or accounts receivable were as follows:
| Three Months Ended November 30, 2014 |
Three Months Ended November 30, 2013 |
Nine Months Ended November 30, 2014 |
Nine Months Ended November 30, 2013 |
|||||||||||||||||||||||||||||
| Percentage of Total Revenue |
Percentage of Accounts Receivable |
Percentage of Total Revenue |
Percentage of Accounts Receivable |
Percentage of Total Revenue |
Percentage of Accounts Receivable |
Percentage of Total Revenue |
Percentage of Accounts Receivable |
|||||||||||||||||||||||||
| Customer A |
* | 10 | % | * | * | * | 10 | % | * | * | ||||||||||||||||||||||
| Customer B |
* | * | * | 16 | % | * | * | * | 16 | % | ||||||||||||||||||||||
| * | Indicates less than 10% |
Revenue by geographic region, based on the billing address of the customer, was as follows (in thousands):
| Three Months Ended November 30, |
Nine Months Ended November 30, |
|||||||||||||||
| 2014 | 2013 | 2014 | 2013 | |||||||||||||
| Revenue by geographic region: |
||||||||||||||||
| Americas |
$ | 15,770 | $ | 14,600 | $ | 45,895 | $ | 42,146 | ||||||||
| Europe |
4,140 | 3,476 | 12,603 | 9,157 | ||||||||||||
| Asia |
240 | 184 | 664 | 568 | ||||||||||||
|
|
|
|
|
|
|
|
|
|||||||||
| Total |
$ | 20,150 | $ | 18,260 | $ | 59,162 | $ | 51,871 | ||||||||
|
|
|
|
|
|
|
|
|
|||||||||
Countries accounting for 10% or more of revenue were as follows:
| Three Months Ended November 30, |
Nine Months Ended November 30, |
|||||||||||||||
| 2014 | 2013 | 2014 | 2013 | |||||||||||||
| Revenue by country: |
||||||||||||||||
| United States |
76.5 | % | 74.4 | % | 74.3 | % | 75.6 | % | ||||||||
| United Kingdom |
13.7 | * | 12.8 | * | ||||||||||||
| * | Indicates less than 10% |
20
Table of Contents
| Item 2. | Management’s Discussion and Analysis of Financial Condition and Results of Operations |
The following discussion and analysis of our financial condition and results of operations should be read in conjunction with our condensed consolidated financial statements and related notes appearing elsewhere in this Quarterly Report on Form 10-Q and our Annual Report on Form 10-K filed with the Securities and Exchange Commission (the “SEC”) dated May 2, 2014 (the “Annual Report”). The following discussion and analysis contains forward-looking statements that involve risks and uncertainties, as well as assumptions that, if they never materialize or prove incorrect, could cause our results to differ materially from those expressed or implied by such forward-looking statements. Statements that are not purely historical are forward-looking statements within the meaning of Section 27A of the Securities Act of 1933, as amended (the “Securities Act”), and Section 21E of the Securities Exchange Act of 1934, as amended (the “Exchange Act”). Forward-looking statements are often identified by the use of words such as, but not limited to, “anticipate,” “believe,” “can,” “continue,” “could,” “estimate,” “expect,” “intend,” “may,” “plan,” “potential,”, “possible”, “predict”, “if”, “future”, “project,” “seek,” “should,” “target,” “will,” “would” and similar words and phrases, including the negatives of these terms, or other expressions or variations intended to identify forward-looking statements. Such statements include, but are not limited to, statements concerning market opportunity, our future financial and operating results, investment strategy, sales and marketing strategy, management’s plans, beliefs and objectives for future operations, research and development, economic and industry trends or trend analysis, expectations about seasonality, use of non-GAAP financial measures, operating expenses, taxes, capital expenditures, cash flows and liquidity. These statements are based on the beliefs and assumptions of our management based on information currently available to us. Such forward-looking statements are subject to risks, uncertainties and other important factors that could cause actual results and the timing of certain events to differ materially from future results expressed or implied by such forward-looking statements. Factors that could cause or contribute to such differences include, but are not limited to, those identified below, and those discussed in the section titled “Risk Factors” included under Part II, Item 1A. Furthermore, such forward-looking statements speak only as of the date of this report. Except as required by law, we undertake no obligation to update any forward-looking statements to reflect events or circumstances after the date of such statements.
Overview
We are a leading provider of cloud-based, on-demand software solutions delivered on an integrated platform that enables companies to collaborate with their trading partners to procure, manufacture, sell and distribute products more efficiently. Our software applications allow network participants to input, access and share data and execute business processes across internal operating units and external entities in a secure, real-time and cost-effective manner. We refer to the combination of our software applications delivered on our cloud-based platform, the content contributed by our network participants and our enabling services as the E2open Business Network. The E2open Business Network supports key operational business processes of our customers and their trading partners, including supply chain management, procurement, sales and finance functions. These functions enable our customers to share product information, forecasts, inventory positions, sales orders, purchase orders, manufacturing work orders, quality and environmental data, shipments, invoices and payments with their trading partners.
The accelerating trends of supply chain globalization and outsourced manufacturing and distribution have combined to increase complexity and risk for brand owners while decreasing visibility into their expanding and evolving supply chains and distribution networks. These trends have created a fundamental shift in the way companies plan, source and distribute goods and services. They have led to an ever more complex product and service delivery paradigm which increasingly relies on specialized, globally distributed trading partners to reduce costs.
As trading networks become more complex, companies are increasingly demanding integrated solutions that facilitate not only collaborative inventory management, but also the demand and supply forecasts, procurement systems, order management and analytics required to efficiently coordinate a company’s entire business ecosystem. We believe a significant opportunity exists to help companies improve their competitive advantage by delivering the visibility and control once characteristic of vertically integrated companies while retaining the advantages of outsourcing. The ability to navigate modern supply chain complexities and to resolve problems in a timely and collaborative manner, combined with enhanced knowledge of end customer demand, is critical to enabling businesses to better match supply and demand.
On June 4, 2014, we acquired Serus Corporation (“Serus”), a leading provider of cloud-based manufacturing and supply chain visibility and intelligence solutions to semiconductor and other high tech companies headquartered in Santa Clara, CA, in a transaction valued at approximately $24.8 million in total consideration, including a contingent earnout consideration based upon the achievement of certain revenue-related financial performance milestones with an estimated fair value of $6.6 million as of the acquisition date. We acquired assets of $16.8 million, including $15.5 million of intangible assets, and assumed $5.2 million of liabilities. We recorded goodwill of approximately $13.2 million. The key factor attributable to the creation of goodwill by the transaction is that, by combining Serus’ robust technology with the E2open Business Network, the company extends its dominance in the high tech supply chain with the addition of technology for design for manufacturing, contracts and compliance, as well as early stage visibility in the semiconductor and technology-driven discrete manufacturing industries. As of the date of acquisition, the identifiable intangible assets comprised developed technology of approximately $7.7 million and a customer relationship intangible of approximately $7.8 million. We intend to make additional investments outside of the United States in order to expand our geographic reach.
21
Table of Contents
Our agreements with customers are typically three to five years in length with billings in advance for annual use of our software solutions. The annual contract value for each customer agreement is largely related to the size of the customer, the number of solutions the customer has purchased, the number of the customer’s unique registered users, and the maturity of our relationship with the customer. Average annual contract value can therefore fluctuate period to period depending upon the size of new customers and the pace at which we upsell additional solutions and services to existing customers. Additionally, these new and upsell customer agreements can create significant variability in the aggregate annual contract value of agreements signed in any given fiscal quarter.
As of November 30, 2014, we had 345 customers, of which 129 are what we refer to as Enterprise Customers who purchase both on-demand software solutions and network connectivity solutions. The remaining 216 customers purchase our network connectivity solutions directly. For the nine months ended November 30, 2014, Enterprise Customers represented 99.5% of total revenue. Our customers represent a wide range of industries and include many of the Fortune 500, among them seven out of the top ten supply chains in the world according to Gartner. The E2open Business Network is a community comprising our customers, over 41,000 unique registered trading partners and over 140,000 unique registered users.
We are headquartered in Foster City, California. We continue to expand our operations internationally. We currently generate a portion of our revenue outside the United States, including through our offices in the United Kingdom, Germany, China, France, Finland, India, Malaysia and Taiwan. For the three months ended November 30, 2014 and 2013, the percentage of our revenue generated outside of the United States was 23.5% and 25.6%. For the nine months ended November 30, 2014 and 2013, the percentage of our revenue generated outside of the United States was 25.7% and 24.4%. As part of our growth strategy, we expect the percentage of our revenue generated outside of the United States to increase as we invest in and enter new and emerging markets. In fiscal 2014, we acquired ICON, and continued to hire sales personnel in the United States, Europe and China. In fiscal 2015, we acquired Serus, with operations in the United States and India. Our financial objective is to create sustainable revenue, earnings and cash flow growth over the long term. Consistent with this objective, we intend to continue to invest in the development of our solutions and network. We expect to continue the aggressive expansion of our field sales organization and alliances to market our solutions both in the United States and internationally. We intend to continue making focused investments to upgrade our network infrastructure in order to improve our ability to profitably scale the business. We intend to further enable partners to deploy E2open solutions. This will allow E2open to grow deployment service capabilities for customers while maintaining focus as a cloud-based software products company and may mitigate potential constraints on company growth caused by challenges in scaling our own professional services organization. We may also evaluate acquisitions to further augment our strategies and objectives and will base our evaluation on a number of factors which may include strategic fit, stage of company, price, geography and industry.
We face challenges and risks related to the growth of our business, similar to other software companies, including the general economic environment, aggressive competition and prospective customers electing to postpone purchase decisions or maintain the status quo. We also face challenges and risks that may be unique to our own growth initiatives. We mitigate those risks, in part, by creating a balanced portfolio of growth initiatives while managing such risks to the best of our ability based on our prior experience and operating history. For example, one of our strategies relies upon our entrance into new vertical markets. Through our experience of entering into new markets, such as the Telecommunications, Technology and Consumer Products sectors, we believe we are better prepared to enter into adjacent markets. Another strategy involves expanding our target market to include mid-market customers. We believe our understanding of the complexities surrounding our existing customers has prepared us for evaluating and transitioning our solutions to be applicable to mid-market customers. Historically, we have collaborated, and will continue to interact, with our existing customers to define our product roadmap and specific functionalities. Many of our products resulted from such collaboration. For a more detailed analysis of the risks we face, see “Risk Factors.”
22
Table of Contents
Key Operating Performance Measures
We regularly review a number of metrics, including the following key metrics, to evaluate our business, measure our performance, identify trends affecting our business, formulate financial projections and make strategic decisions.
Bookings, Billings and Backlog. We generally recognize subscriptions and support revenue from our customer agreements over the contractual term. For this reason, a significant portion of our revenue in any period will be from customer agreements signed in prior periods rather than new business activity signed during such period. In order to assess our business performance with metrics that more fully reflect current period business activity, we track bookings, billings and backlog. Bookings represent the full value of customer orders or contracts signed during a reporting period. The value of our bookings is impacted by new contracts, renewals, amendments and terminations. Billings represent invoices issued to customers during the period. Backlog represents the cumulative value of bookings existing at the end of the period less the cumulative amount billed to customers. Due to the seasonality of our sales, bookings, billings and backlog fluctuate from quarter to quarter throughout the fiscal year. Thus, these metrics are evaluated on an annual basis, and disclosed in our Annual Report on Form 10-K filed with the SEC.
Number of Unique Registered Trading Partners. We define the number of unique registered trading partners as the number of distinct trading partner entities currently connected to the E2open Business Network as of the balance sheet date. We believe the number of unique registered trading partners is a key indicator of the growth of our network and both our ability and our customers’ ability to receive the benefits of the network effects resulting from such growth. Growth in the number of unique registered trading partners depends, in part, on our ability to successfully develop and market our solutions to our existing customers and companies that have not yet become part of our network. In addition to the growth in number of these entities, we view a large, existing network as providing greater incentive and ease for new customers seeking to join if they share existing trading partners already operating on our system.
The number of unique registered trading partners in the E2open Business Network increased from 38,548 as of February 28, 2014 to 41,130 as of November 30, 2014. While growth in the number of unique registered trading partners is an important indicator of expected revenue growth, it also informs our management of areas of our business that will require further investment to support such growth.
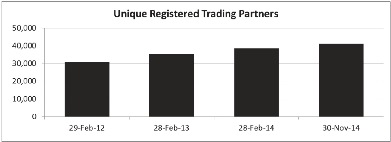
Number of Unique Registered Users. We define the number of unique registered users as individuals within our customers’ organizations and their trading partners who are currently authorized to use and access our software applications as of a balance sheet date. We view unique registered users as a key indicator of growth and whether we are providing our customers with useful tools and applications, thereby increasing user engagement. Growth in unique registered users will be driven by our business expansion, growth in the number of unique registered trading partners and improvements to features and products available to our customers. The number of unique registered users increased from 125,960 as of February 28, 2014 to 140,041 as of November 30, 2014.
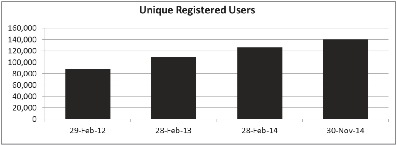
23
Table of Contents
Key Financial Performance Measures
We monitor the key financial performance measures set forth below as well as cash and cash equivalents and available debt capacity, which are discussed in “— Liquidity and Capital Resources,” to help us evaluate trends, establish budgets, measure the effectiveness of our sales and marketing efforts and assess operational effectiveness and efficiencies. These key financial performance measures include certain non-GAAP metrics, including Adjusted EBITDA and Free Cash Flow, as defined below. The presentation of the non-GAAP financial measures is not intended to be considered in isolation or as a substitute for, or superior to, the financial information prepared and presented in accordance with GAAP.
| Three Months Ended November 30, |
Nine Months Ended November 30, |
|||||||||||||||
| 2014 | 2013 | 2014 | 2013 | |||||||||||||
| (In thousands) | ||||||||||||||||
| Revenue |
$ | 20,150 | $ | 18,260 | $ | 59,162 | $ | 51,871 | ||||||||
| Gross profit |
$ | 12,020 | $ | 10,774 | $ | 35,467 | $ | 30,611 | ||||||||
| Gross margin |
59.7 | % | 59.0 | % | 59.9 | % | 59.0 | % | ||||||||
| Net loss |
$ | (9,066 | ) | $ | (7,382 | ) | $ | (25,734 | ) | $ | (18,699 | ) | ||||
| Adjusted EBITDA (1) |
$ | (3,348 | ) | $ | (3,335 | ) | $ | (9,618 | ) | $ | (9,243 | ) | ||||
| Operating cash flow |
$ | (9,223 | ) | $ | (8,023 | ) | $ | (18,372 | ) | $ | (15,406 | ) | ||||
| Free cash flow (2) |
$ | (9,038 | ) | $ | (7,588 | ) | $ | (17,975 | ) | $ | (14,862 | ) | ||||
| (1) | We define Adjusted EBITDA as net income (loss) adjusted for interest and other income (expense), net, benefit from (provision for) income taxes, depreciation and amortization, stock-based compensation expense, accelerated revenue from a contract amendment and deferred revenue purchase accounting adjustments, and acquisition-related expenses. See “Adjusted EBITDA” below for more information and for a reconciliation of Adjusted EBITDA to net income (loss), the most directly comparable financial measure calculated and presented in accordance with US generally accepted accounting principles (“GAAP”). |
| (2) | Free cash flow is defined as net cash provided by (used in) operating activities less capital expenditures, adjusted for payment of acquisition-related expenses. See “Free Cash Flow” below for more information and for a reconciliation of Free Cash Flow to net cash provided by (used in) operating activities, the most directly comparable financial measure calculated and presented in accordance with GAAP. |
Gross Profit and Gross Margin. Gross profit and gross margin have been and will continue to be affected by a variety of factors, including the average sales price of our products, the mix of solutions sold, the mix of revenue between subscriptions and support and professional services, and our level of investment in operating infrastructure. An increase in the proportion of our total revenue generated by sales of subscriptions and support for our on-demand software applications would increase our overall margins, due to the higher margins on subscriptions and support compared to professional services. Our gross margin may also fluctuate due to the timing of revenue recognition for our on-demand software solutions and services, since our cost of revenue is recognized as incurred whereas revenue on certain arrangements with customers is recognized over the contractual term.
Our total gross profit and gross margin for the three months ended November 30, 2014 was $12.0 million, or 59.7% compared to $10.8 million, or 59.0% for the three months ended November 30, 2013, and our gross profit and gross margin for the nine months ended November 30, 2014 was $35.5 million, or 59.9% compared to $30.6 million, or 59.0% for the nine months ended November 30, 2013.
Adjusted EBITDA. Adjusted EBITDA is defined as net income (loss) adjusted for interest and other income (expense), net, benefit from (provision for) income taxes, depreciation and amortization, stock-based compensation expense, accelerated revenue from a contract amendment and deferred revenue purchase accounting adjustments, and acquisition-related expenses. Management believes that the use of Adjusted EBITDA provides consistency and comparability with our past financial performance, facilitates period to period comparisons of operations, and also facilitates comparisons with other peer companies, many of which use similar non-GAAP financial measures to supplement their reported GAAP results.
Management believes that it is useful to exclude certain non-cash charges, such as depreciation and amortization and stock-based compensation, and non-core operational charges, such as interest and other income (expense), net, accelerated revenue from a contract amendment and deferred revenue purchase accounting adjustments, and acquisition-related expenses from Adjusted EBITDA because (1) the amount of such expenses in any specific period may not directly correlate to the underlying performance of our business operations and (2) such expenses can vary significantly between periods as a result of the timing of new stock-based awards, acquisitions or restructurings, as the case may be.
24
Table of Contents
For the three months ended November 30, 2014, Adjusted EBITDA was $(3.3) million compared to $(3.3) million for the three months ended November 30, 2013 and for the nine months ended November 30, 2014, Adjusted EBITDA was $(9.6) million compared to $(9.2) million for the nine months ended November 30, 2013. The Adjusted EBITDA for these periods reflect our continued investment in research and development and sales and marketing, fluctuations in revenue, and executing our strategy to grow an independent sales channel and deployment service capabilities through partner enablement.
The following table presents a reconciliation of Adjusted EBITDA to net loss for each of the periods indicated:
| Three Months Ended November 30, |
Nine Months Ended November 30, |
|||||||||||||||
| 2014 | 2013 | 2014 | 2013 | |||||||||||||
| (In thousands) | ||||||||||||||||
| Reconciliation of Adjusted EBITDA |
||||||||||||||||
| Net loss |
$ | (9,066 | ) | $ | (7,382 | ) | $ | (25,734 | ) | $ | (18,699 | ) | ||||
| Interest and other expense, net |
576 | 461 | 564 | 379 | ||||||||||||
| Provision for income taxes |
65 | (209 | ) | 142 | (135 | ) | ||||||||||
| Depreciation and amortization |
2,086 | 1,329 | 5,329 | 2,312 | ||||||||||||
| Stock-based compensation |
2,314 | 1,446 | 7,128 | 4,009 | ||||||||||||
| Accelerated revenue from contract amendment |
497 | 502 | 1,513 | 1,518 | ||||||||||||
| Deferred revenue purchase accounting adjustments |
136 | 178 | 480 | 242 | ||||||||||||
| Acquisition-related expenses |
44 | 340 | 960 | 1,131 | ||||||||||||
|
|
|
|
|
|
|
|
|
|||||||||
| Adjusted EBITDA |
$ | (3,348 | ) | $ | (3,335 | ) | $ | (9,618 | ) | $ | (9,243 | ) | ||||
|
|
|
|
|
|
|
|
|
|||||||||
Free Cash Flow. Free cash flow is a key measure used in our internal operating reports and allows us to manage the cash available to fund our debt obligations and potential strategic initiatives. Management believes that free cash flow is useful to investors as a supplemental measure to evaluate our business over time. Free cash flow is defined as net cash provided by (used in) operating activities less capital expenditures, adjusted for payment of acquisition-related expenses. Capital expenditures consist of purchases of property, equipment and software. Acquisition-related expenses consist of third-party accounting and legal services, travel expenses and other personnel-related expenses incurred solely to prepare for and execute an acquisition. Management believes that the presentation of free cash flow provides consistency and comparability with our past financial performance, facilitates period-to-period comparisons of operating performance and also facilitates comparisons with other peer companies, many of which use similar non-GAAP financial measures to supplement their GAAP results.
Free cash flow should not be considered a substitute for other measures of financial performance reported in accordance with GAAP. There are limitations to using non-GAAP financial measures, including that other companies may calculate these measures differently than we do. Management compensates for the inherent limitations associated with measuring free cash flow through disclosure of such limitations, presentation of our financial statements in accordance with GAAP and reconciliation of free cash flow to the most directly comparable GAAP measure, net cash provided by (used in) operating activities.
Our free cash flow was $(9.0) million for the three months ended November 30, 2014, compared to $(7.6) million for the three months ended November 30, 2013, and our free cash flow was $(18.0) million for the nine months ended November 30, 2014, compared to $(14.9) million for the nine months ended November 30, 2013. The following table presents a reconciliation of free cash flow to net cash provided by (used in) operating activities for each of the periods indicated:
| Three Months Ended November 30, |
Nine Months Ended November 30, |
|||||||||||||||
| 2014 | 2013 | 2014 | 2013 | |||||||||||||
| (In thousands) | ||||||||||||||||
| Reconciliation of Free Cash Flow |
||||||||||||||||
| Net cash provided by (used in) operating activities |
$ | (9,223 | ) | $ | (8,023 | ) | $ | (18,372 | ) | $ | (15,406 | ) | ||||
| Capital expenditures |
(202 | ) | (68 | ) | (391 | ) | (165 | ) | ||||||||
| Payment of acquisition-related expenses |
387 | 503 | 788 | 709 | ||||||||||||
|
|
|
|
|
|
|
|
|
|||||||||
| Free cash flow |
$ | (9,038 | ) | $ | (7,588 | ) | $ | (17,975 | ) | $ | (14,862 | ) | ||||
|
|
|
|
|
|
|
|
|
|||||||||
We have historically made significant investments in product development and in selling and marketing our solutions, resulting in net use of cash in operating activities since inception. We expect negative free cash flow for fiscal 2015 as we continue to invest in the development and implementation of new solutions and software applications, expand our sales and marketing resources in order to further penetrate our market both in the United States and internationally, and invest in growing our indirect sales channel and deployment service capabilities.
25
Table of Contents
Components of Results of Operations
Revenue
We generate our revenue primarily from selling access to our cloud-based platform of on-demand software solutions, which we refer to as subscriptions and support, through our field sales organization and alliance partners. We also generate revenue from professional services to deploy our on-demand software solutions. Our customer contracts typically have a term of three to five years in length and we generally invoice our customers for subscriptions and support in advance for annual use of our software solutions.
| Three Months Ended November 30, |
Nine Months Ended November 30, |
|||||||||||||||
| 2014 | 2013 | 2014 | 2013 | |||||||||||||
| (In thousands) | ||||||||||||||||
| Revenue by type: |
||||||||||||||||
| Subscriptions and support |
$ | 16,650 | $ | 14,400 | $ | 49,689 | $ | 40,125 | ||||||||
| Professional services and other |
3,500 | 3,860 | 9,473 | 11,746 | ||||||||||||
|
|
|
|
|
|
|
|
|
|||||||||
| Total |
$ | 20,150 | $ | 18,260 | $ | 59,162 | $ | 51,871 | ||||||||
|
|
|
|
|
|
|
|
|
|||||||||
| Percentage of revenue by type: |
||||||||||||||||
| Subscriptions and support |
82.6 | % | 78.9 | % | 84.0 | % | 77.4 | % | ||||||||
| Professional services and other |
17.4 | 21.1 | 16.0 | 22.6 | ||||||||||||
|
|
|
|
|
|
|
|
|
|||||||||
| Total |
100.0 | % | 100.0 | % | 100.0 | % | 100.0 | % | ||||||||
|
|
|
|
|
|
|
|
|
|||||||||
Subscriptions and Support. We offer on-demand software solutions, which enable our customers to have constant access to our solutions without the need to manage and support the software and associated hardware themselves. We house the hardware and software in third-party facilities, and provide our customers with access to the software applications, along with data security and storage, backup and recovery services, and solution support. We invoice our customers for subscriptions and support in advance for annual use of our software solutions.
Professional Services and Other. Professional services and other revenue is derived primarily from fees for enabling services, such as solution consulting, solution deployment and B2B on-boarding, that help our customers deploy our solutions. These services are sold in conjunction with the sale of our on-demand software solutions or on a standalone basis. We provide professional services both on a fixed fee and a time and materials basis, and invoice our customers in advance, monthly, or upon reaching project milestones.
Our future revenue growth will depend on our ability to increase sales of our existing and new on-demand software solutions and services to new and existing customers. Our revenue generally fluctuates, and we expect it to continue to fluctuate, between periods due primarily to inconsistent timing of sales of our software solutions, revenue recognition requirements and seasonality, among other factors. As a result, transactions that were expected to be recognized in one period may be recognized in a subsequent period, which may materially affect our financial performance in a reporting period.
Costs and Expenses
Cost of Revenue
Cost of Subscriptions and Support Revenue. Cost of subscriptions and support revenue consists of costs related to third-party hosting of our equipment, software license fees, amortization of acquired developed technology, salaries, benefits and other personnel-related expenses included in our operations and customer support departments, as well as an allocation of facilities, information technology and overhead costs. We expect the absolute cost of revenue to increase as we continue to invest in our business.
Cost of Professional Services and Other Revenue. Cost of professional services and other revenue consists of costs related to delivery of our software solutions, software license fees, salaries, benefits and other personnel-related expenses included in our professional services department, as well as an allocation of facilities, information technology and overhead costs. The cost associated with providing professional services is significantly higher as a percentage of professional services and other revenue than the cost associated with delivering our on-demand software applications due to the labor-intensive nature of providing professional services. We expect the absolute cost of professional services and other revenue to increase as we continue to invest in our business.
26
Table of Contents
Operating Expenses
Operating expenses consist of research and development, sales and marketing, general and administrative, acquisition-related expenses and amortization of acquired intangibles.
Research and Development. Research and development expense consists of salaries, benefits and other personnel-related expenses, software development tools, as well as an allocation of facilities, information technology and overhead costs. We expect to continue to invest in research and development to enhance and expand our existing solutions and develop new solutions and tools for improved deployment and customer support and, consequently, we expect research and development expense to increase in absolute dollars in future periods.
Sales and Marketing. Sales and marketing expense consists of salaries, benefits and other personnel-related expenses, including sales commissions, advertising and marketing materials, trade shows and other marketing events, travel and entertainment expenses, as well as an allocation of facilities, information technology and overhead costs. We intend to continue to invest in sales and marketing to pursue new customers and expand relationships with existing customers and to develop indirect sales channels. Accordingly, we expect sales and marketing expense to increase in absolute dollars in future periods.
General and Administrative. General and administrative expense consists of salaries, benefits and other personnel-related expenses for our finance, accounting, legal, and human resources departments, third-party professional fees, communication expenses, other administrative expenses, as well as an allocation of facilities, information technology and overhead costs. We expect that the costs of being a public company, including the costs of compliance with the Sarbanes-Oxley Act of 2002 and other regulations governing public companies, increased directors and officers insurance, and professional and other services, will increase our general and administrative expense in absolute dollars in future periods.
Acquisition-related expenses. Acquisition-related expenses consist of third-party accounting and legal services, travel expenses and other personnel-related expenses incurred solely to prepare for and execute an acquisition and changes in fair value of earn-out liability.
Amortization of acquired intangibles. Amortization of acquired intangibles included in operating expenses consists of amortization of acquired customer relationships.
Interest and Other Expense, Net. Interest and other expense, net, consists primarily of interest income on our cash and cash equivalents, and investments, interest expense on our credit facilities, notes payable and capital leases, financing fees, and foreign exchange currency transaction and translation gains and losses.
Provision for (Benefit from) Income Taxes. We are subject to income taxes in the United States as well as other jurisdictions or countries in which we conduct business. Earnings from our non-U.S. activities are subject to local country income tax. Our effective tax rates differ from the statutory rate due primarily to valuation allowances on our deferred taxes, state taxes, foreign taxes, research and development tax credits and tax contingencies.
27
Table of Contents
Results of Operations
Revenue, Cost of Revenue, Gross Profit and Gross Margin
| Three Months Ended November 30, |
Change | Nine Months Ended November 30, |
Change | |||||||||||||||||||||||||||||
| 2014 | 2013 | $ | % | 2014 | 2013 | $ | % | |||||||||||||||||||||||||
| (In thousands) | (In thousands) | |||||||||||||||||||||||||||||||
| Revenue |
||||||||||||||||||||||||||||||||
| Subscriptions and support |
$ | 16,650 | $ | 14,400 | $ | 2,250 | 15.6 | % | $ | 49,689 | $ | 40,125 | $ | 9,564 | 23.8 | % | ||||||||||||||||
| Professional services |
3,500 | 3,860 | (360 | ) | (9.3 | ) | 9,473 | 11,746 | (2,273 | ) | (19.4 | ) | ||||||||||||||||||||
|
|
|
|
|
|
|
|
|
|
|
|
|
|
|
|
|
|||||||||||||||||
| Total revenue |
20,150 | 18,260 | 1,890 | 10.4 | 59,162 | 51,871 | 7,291 | 14.1 | ||||||||||||||||||||||||
|
|
|
|
|
|
|
|
|
|
|
|
|
|
|
|
|
|||||||||||||||||
| Cost of revenue |
||||||||||||||||||||||||||||||||
| Subscriptions and support |
3,383 | 2,769 | 614 | 22.2 | 9,893 | 7,942 | 1,951 | 24.6 | ||||||||||||||||||||||||
| Professional services |
4,012 | 4,309 | (297 | ) | (6.9 | ) | 11,995 | 12,852 | (857 | ) | (6.7 | ) | ||||||||||||||||||||
| Amortization of acquired intangibles |
735 | 408 | 327 | 80.1 | 1,807 | 466 | 1,341 | 287.8 | ||||||||||||||||||||||||
|
|
|
|
|
|
|
|
|
|
|
|
|
|
|
|
|
|||||||||||||||||
| Total cost of revenue |
8,130 | 7,486 | 644 | 8.6 | 23,695 | 21,260 | 2,435 | 11.5 | ||||||||||||||||||||||||
|
|
|
|
|
|
|
|
|
|
|
|
|
|
|
|
|
|||||||||||||||||
| Gross profit (loss) |
||||||||||||||||||||||||||||||||
| Subscriptions and support |
12,532 | 11,223 | 1,309 | 11.7 | 37,989 | 31,717 | 6,272 | 19.8 | ||||||||||||||||||||||||
| Professional services |
(512 | ) | (449 | ) | (63 | ) | (14.0 | ) | (2,522 | ) | (1,106 | ) | (1,416 | ) | 128.0 | |||||||||||||||||
|
|
|
|
|
|
|
|
|
|
|
|
|
|
|
|
|
|||||||||||||||||
| Total gross profit |
$ | 12,020 | $ | 10,774 | $ | 1,246 | 11.6 | % | $ | 35,467 | $ | 30,611 | $ | 4,856 | 15.9 | % | ||||||||||||||||
|
|
|
|
|
|
|
|
|
|
|
|
|
|
|
|
|
|||||||||||||||||
| Gross margin (1) |
||||||||||||||||||||||||||||||||
| Subscriptions and Support |
75.3 | % | 77.9 | % | (2.6 | )% | 76.5 | % | 79.0 | % | (2.5 | )% | ||||||||||||||||||||
| Professional Services |
(14.6 | ) | (11.6 | ) | (3.0 | ) | (26.6 | ) | (9.4 | ) | (17.2 | ) | ||||||||||||||||||||
|
|
|
|
|
|
|
|
|
|
|
|
|
|||||||||||||||||||||
| Total gross margin |
59.7 | % | 59.0 | % | 0.7 | % | 59.9 | % | 59.0 | % | 0.9 | % | ||||||||||||||||||||
|
|
|
|
|
|
|
|
|
|
|
|
|
|||||||||||||||||||||
| (1) | The table presents gross margin as a percentage of each component of revenue. Amortization of acquired intangibles is a component of cost of subscriptions and support revenue. |
The table below sets forth the functional classification of stock-based compensation expense included in cost of revenue for the periods presented:
| Three Months Ended November 30, |
Change | Nine Months Ended November 30, |
Change | |||||||||||||||||||||||||||||
| 2014 | 2013 | $ | % | 2014 | 2013 | $ | % | |||||||||||||||||||||||||
| (In thousands) | (In thousands) | |||||||||||||||||||||||||||||||
| Subscriptions and support |
$ | 114 | $ | 77 | $ | 37 | 48.1 | % | $ | 375 | $ | 222 | $ | 153 | 68.9 | % | ||||||||||||||||
| Professional services |
535 | 326 | 209 | 64.1 | 1,700 | 910 | 790 | 86.8 | ||||||||||||||||||||||||
|
|
|
|
|
|
|
|
|
|
|
|
|
|
|
|
|
|||||||||||||||||
| Total cost of revenue |
$ | 649 | $ | 403 | $ | 246 | 61.0 | % | $ | 2,075 | $ | 1,132 | $ | 943 | 83.3 | % | ||||||||||||||||
|
|
|
|
|
|
|
|
|
|
|
|
|
|
|
|
|
|||||||||||||||||
Revenue
The total number of our Enterprise Customers was 104 as of November 30, 2013 and grew 24.0% to 129 as of November 30, 2014. We continue to increase our investment in sales and marketing, leverage our customer network and expand further to adjacent verticals to add new customers and create new markets for our products both domestically and abroad. We continue to develop new products and services to introduce to both our existing and new customers, and sell additional solutions and services to our existing customers. Typically, we sell additional solutions and services to our existing customers when they experience returns on investment from the use of our solutions in one business process or business unit, and they choose to purchase more solutions for additional business processes or business units.
28
Table of Contents
We also evaluate acquisitions to further augment our strategies and objectives. In July 2013, we acquired ICON, a market leader in supply chain planning and analytics. We expanded our market opportunity and solution portfolio to our product roadmap, and extended our position as a leader in the collaborative planning and execution space. In June 2014, we acquired Serus, a market leader in extended supply chain management for high tech companies. By combining Serus’ robust technology with the E2open Business Network, we extended our leadership in the high tech industry supply chains with the addition of technology for design for manufacturing, contracts and compliance, as well as visibility in the semiconductor and technology-driven discrete manufacturing industries.
Total revenue for the three months ended November 30, 2014 was $20.2 million. Subscriptions and support revenue and professional services and other revenue were 82.6% and 17.4% of total revenue. Total revenue for the three months ended November 30, 2014 increased $1.9 million, or 10.4%, compared to the three months ended November 30, 2013.
Subscriptions and support revenue for the three months ended November 30, 2014 increased 15.6% to $16.7 million compared to $14.4 million for the three months ended November 30, 2013. Subscriptions and support revenue increased $1.5 million from new customers and $0.8 million from existing customers. Revenue for the three months ended November 30, 2014 included $0.9 million of subscriptions and support revenue attributable to the acquisition of Serus.
Professional services revenue for the three months ended November 30, 2014 decreased 9.3% to $3.5 million compared to $3.9 million for the three months ended November 30, 2013 consistent with our strategy to maintain focus as a cloud-based software products company and enabling partners to deploy E2open solutions. Professional services revenue increased $1.3 million from new customers. Professional services revenue from existing customers decreased $1.7 million due primarily to the timing of deployments, and difference in the timing of revenue recognition. Revenue for the three months ended November 30, 2014 included $0.3 million of professional services revenue attributable to the acquisition of Serus.
For the three months ended November 30, 2014 and 2013, no single customer accounted for more than 10% of revenue. For the three months ended November 30, 2014, revenue attributable to customers headquartered in the United Kingdom and the United States each accounted for more than 10% of total revenue. For the three months ended November 30, 2013, revenue attributable to customers headquartered in the United States accounted for more than 10% of total revenue.
Total revenue for the nine months ended November 30, 2014 was $59.2 million. Subscriptions and support revenue and professional services and other revenue were 84.0% and 16.0% of total revenue. Total revenue for the nine months ended November 30, 2014 increased $7.3 million, or 14.1%, compared to the nine months ended November 30, 2013.
Subscriptions and support revenue for the nine months ended November 30, 2014 increased 23.8% to $49.7 million compared to $40.1 million for the nine months ended November 30, 2013. Subscriptions and support revenue increased $2.7 million from new customers and $6.9 million from existing customers. Revenue for the nine months ended November 30, 2014 included $1.7 million of subscriptions and support revenue attributable to the acquisition of Serus.
Professional services revenue for the nine months ended November 30, 2014 decreased 19.4% to $9.5 million compared to $11.7 million for the nine months ended November 30, 2013 consistent with our strategy to maintain focus as a cloud-based software products company and enabling partners to deploy E2open solutions. Professional services revenue increased $2.5 million from new customers. Professional services revenue from existing customers decreased $4.7 million due primarily to the timing of deployments, and difference in the timing of revenue recognition. Revenue for the nine months ended November 30, 2014 included $0.6 million of professional services revenue attributable to the acquisition of Serus.
For the nine months ended November 30, 2014 and 2013, no single customer accounted for more than 10% of revenue. For the nine months ended November 30, 2014, revenue attributable to customers headquartered in the United Kingdom and the United States each accounted for more than 10% of total revenue. For the nine months ended November 30, 2013, revenue attributable to customers headquartered in the United States accounted for more than 10% of total revenue.
Cost of Revenue
Total cost of revenue fluctuates from period to period depending on the growth of our professional services business and any associated increased costs relating to the delivery of our on-demand software solutions and professional services, as well as the timing of significant expenditures.
Total cost of revenue increased $0.6 million, or 8.6%, for the three months ended November 30, 2014 compared to the three months ended November 30, 2013. The increase in cost of revenue for the three months ended November 30, 2014 was attributable to a $0.3 million increase in amortization of intangible assets, $0.2 million increase in software license fees and depreciation of assets used to deliver our cloud-based solutions, $0.5 million increase in personnel-related costs due to increased headcount, offset by $0.4 million decrease in outside professional service fees.
29
Table of Contents
Total cost of subscriptions and support revenue increased $0.6 million, or 22.2% for the three months ended November 30, 2014 compared to the three months ended November 30, 2013. The increase in cost of subscriptions and support revenue for the three months ended November 30, 2014 was attributable to additional usage of our solutions by new and existing customers, and included increases of $0.8 million in personnel-related costs due to increased headcount, $0.2 million in software license fees and depreciation of assets used to deliver our cloud-based solutions, offset by $0.4 million decrease in outside professional service fees.
Total cost of professional services and other revenue decreased $0.3 million, or 6.9% for the three months ended November 30, 2014 compared to the three months ended November 30, 2013 consistent with our strategy to maintain focus as a cloud-based software products company and enabling partners to deploy E2open solutions.
Total cost of revenue increased $2.4 million, or 11.5%, for the nine months ended November 30, 2014 compared to the nine months ended November 30, 2013. The increase in cost of revenue for the nine months ended November 30, 2014 was attributable to a $1.3 million increase in amortization of intangible assets, $0.6 million increase in software license fees and depreciation of assets used to deliver our cloud-based solutions, $0.7 million increase in outside professional service fees, offset by $0.2 million decrease in personnel-related costs.
Total cost of subscriptions and support revenue increased $2.0 million, or 24.6% for the nine months ended November 30, 2014 compared to the nine months ended November 30, 2013. The increase in cost of revenue for the nine months ended November 30, 2014 was attributable to additional usage of our solutions by new and existing customers, and included increases of $0.6 million in software license fees and depreciation of assets used to deliver our cloud-based solutions, $1.5 million in personnel-related costs due to increased headcount, offset by $0.1 million decrease in outside professional service fees.
Total cost of professional services and other revenue decreased $0.9 million, or 6.7% for the nine months ended November 30, 2014 compared to the nine months ended November 30, 2013 consistent with our strategy to maintain focus as a cloud-based software products company and enabling partners to deploy E2open solutions.
Gross Profit and Gross Margin
Gross profit and gross margin are impacted by the timing of when we record our revenue and costs related to arrangements with customers. We recognize revenue on certain arrangements over the contract term or upon completion of work performed, whereas we recognize costs as incurred. As such, this may cause our gross margins to fluctuate between periods.
Total gross profit increased $1.2 million, or 11.6%, from $10.8 million to $12.0 million. Total gross margin increased from 59.0% to 59.7%, for the three months ended November 30, 2014 compared to the three months ended November 30, 2013. Gross margin on subscriptions and support revenue and professional services and other revenue was 75.3% and (14.6)% for the three months ended November 30, 2014 compared to 77.9% and (11.6)% for the three months ended November 30, 2013. The decrease in gross profit and gross margin on professional services and other revenue reflects the impact of our strategy to invest in the enablement of partners to deploy our solutions. This strategy allows us to grow deployment service capabilities for customers while maintaining focus as a cloud-based software products company.
Total gross profit increased $4.9 million, or 15.9%, from $30.6 million to $35.5 million, and total gross margin increased from 59.0% to 59.9%, for the nine months ended November 30, 2014 compared to the nine months ended November 30, 2013. Gross margin on subscriptions and support revenue and professional services and other revenue was 76.5% and (26.6)% for the nine months ended November 30, 2014 compared to 79.0% and (9.4)% for the nine months ended November 30, 2013. The decrease in gross profit and gross margin on professional services and other revenue reflects the impact of our strategy to invest in the enablement of partners to deploy our solutions. This strategy allows us to grow deployment service capabilities for customers while maintaining focus as a cloud-based software products company.
Operating Expenses
| Three Months Ended November 30, |
Change | Nine Months Ended November 30, |
Change | |||||||||||||||||||||||||||||
| 2014 | 2013 | $ | % | 2014 | 2013 | $ | % | |||||||||||||||||||||||||
| (In thousands) | (In thousands) | |||||||||||||||||||||||||||||||
| Operating expenses |
||||||||||||||||||||||||||||||||
| Research and development |
$ | 5,451 | $ | 5,099 | $ | 352 | 6.9 | % | $ | 16,110 | $ | 13,705 | $ | 2,405 | 17.5 | % | ||||||||||||||||
| Sales and marketing |
11,204 | 9,683 | 1,521 | 15.7 | 32,109 | 26,334 | 5,775 | 21.9 | ||||||||||||||||||||||||
| General and administrative |
3,061 | 2,413 | 648 | 26.9 | 9,665 | 7,502 | 2,163 | 28.8 | ||||||||||||||||||||||||
| Acquisition-related expenses |
44 | 340 | (296 | ) | (87.1 | ) | 960 | 1,131 | (171 | ) | (15.1 | ) | ||||||||||||||||||||
| Amortization of acquired intangibles |
685 | 369 | 316 | 85.6 | 1,651 | 394 | 1,257 | 319.0 | ||||||||||||||||||||||||
|
|
|
|
|
|
|
|
|
|
|
|
|
|
|
|
|
|||||||||||||||||
| Total operating expenses |
$ | 20,445 | $ | 17,904 | $ | 2,541 | 14.2 | % | $ | 60,495 | $ | 49,066 | $ | 11,429 | 23.3 | % | ||||||||||||||||
|
|
|
|
|
|
|
|
|
|
|
|
|
|
|
|
|
|||||||||||||||||
30
Table of Contents
The table below sets forth the functional classification of stock-based compensation expense included in operating expenses for the periods presented:
| Three Months Ended November 30, |
Change | Nine Months Ended November 30, |
Change | |||||||||||||||||||||||||||||
| 2014 | 2013 | $ | % | 2014 | 2013 | $ | % | |||||||||||||||||||||||||
| (In thousands) | (In thousands) | |||||||||||||||||||||||||||||||
| Research and development |
$ | 206 | $ | 133 | $ | 73 | 54.9 | % | $ | 581 | $ | 349 | $ | 232 | 66.5 | % | ||||||||||||||||
| Sales and marketing |
887 | 559 | 328 | 58.7 | 2,614 | 1,466 | 1,148 | 78.3 | ||||||||||||||||||||||||
| General and administrative |
572 | 351 | 221 | 63.0 | 1,858 | 1,062 | 796 | 75.0 | ||||||||||||||||||||||||
|
|
|
|
|
|
|
|
|
|
|
|
|
|
|
|
|
|||||||||||||||||
| $ | 1,665 | $ | 1,043 | $ | 622 | 59.6 | % | $ | 5,053 | $ | 2,877 | $ | 2,176 | 75.6 | % | |||||||||||||||||
|
|
|
|
|
|
|
|
|
|
|
|
|
|
|
|
|
|||||||||||||||||
Research and Development
Research and development expense increased $0.4 million, or 6.9%, for the three months ended November 30, 2014 compared to the three months ended November 30, 2013. The increase was attributable to an increase of $0.4 million in employee-related costs as we invest in developing our cloud-based software solutions, and integrating acquired developed technology into our product offerings. As a percentage of revenue, research and development expense was 27.1% for the three months ended November 30, 2014 and 27.9% for the three months ended November 30, 2013.
Research and development expense increased $2.4 million, or 17.5%, for the nine months ended November 30, 2014 compared to the nine months ended November 30, 2013. The increase was attributable to an increase of $2.4 million in employee-related costs as we invest in developing our cloud-based software solutions, and integrating acquired developed technology into our product offerings. As a percentage of revenue, research and development expense was 27.2% for the nine months ended November 30, 2014 and 26.4% for the nine months ended November 30, 2013.
Sales and Marketing
Sales and marketing expense increased $1.5 million, or 15.7%, for the three months ended November 30, 2014 compared to the three months ended November 30, 2013. The increase was attributable primarily to a $1.3 million increase in personnel-related costs and $0.2 million increase in marketing expenses. Our sales and marketing expense is expected to increase as we continue to invest in selling our solutions, enabling partners to sell and deploy our solutions, and expanding our presence globally. As a percentage of revenue, sales and marketing expense was 55.6% and 53.0% for the three months ended November 30, 2014 and 2013.
Sales and marketing expense increased $5.8 million, or 21.9%, for the nine months ended November 30, 2014 compared to the nine months ended November 30, 2013. The increase was attributable primarily to a $7.8 million increase in personnel-related costs. This is offset by a $1.3 million reduction in expenses related to outside services and contractors, as the Company invested in building internal talent to support our growth. Our sales and marketing expense is expected to increase as we continue to invest in selling our solutions, enabling partners to sell and deploy our solutions, and expanding our presence globally. As a percentage of revenue, sales and marketing expense was 54.3% and 50.8% for the nine months ended November 30, 2014 and 2013.
General and Administrative
General and administrative expense increased $0.6 million, or 26.9%, for the three months ended November 30, 2014 compared to the three months ended November 30, 2013. The increase was attributable primarily to a $0.6 million increase in personnel expenses. As a percentage of revenue, general and administrative expense was 15.2% for the three months ended November 30, 2014 and 13.2% for the three months ended November 30, 2013.
General and administrative expense increased $2.2 million, or 28.8%, for the nine months ended November 30, 2014 compared to the nine months ended November 30, 2013. The increase was attributable primarily to a $1.7 million increase in personnel expenses, including full-time equivalent contractors as we grow the business globally, $0.1 million increase in legal and accounting fees, and $0.3 million increase in facility and administrative expenses. As a percentage of revenue, general and administrative expense was 16.3% for the nine months ended November 30, 2014 and 14.5% for the nine months ended November 30, 2013.
31
Table of Contents
Acquisition-related Expenses
Acquisition-related expenses decreased $0.3 million, or 87.1%, for the three months ended November 30, 2014 compared to the three months ended November 30, 2013. Acquisition-related expenses for the three months ended November 30, 2014 are attributable to the Serus acquisition in June 2014, whereas the acquisition-related expenses for the three months ended November 30, 2013 are attributable to the ICON acquisition in July 2013. These expenses comprised third-party accounting and legal service fees, personnel-related expenses, travel expenses and other expenses incurred solely to prepare for and execute the acquisitions, and changes in fair value of the Serus earn-out liability. As a percentage of revenue, acquisition-related expense was 0.2% for the three months ended November 30, 2014 and 1.9% for the three months ended November 30, 2013.
Acquisition-related expense decreased $0.2 million, or 15.1%, for the nine months ended November 30, 2014 compared to the nine months ended November 30, 2013. Acquisition-related expenses for the nine months ended November 30, 2014 are attributable primarily to the Serus acquisition in June 2014, whereas the acquisition-related expenses for the nine months ended November 30, 2013 are attributable to the ICON acquisition in July 2013. These expenses comprised third-party accounting and legal service fees, personnel-related expenses, travel expenses and other expenses incurred solely to prepare for and execute the acquisitions, and changes in fair value of the Serus earn-out liability. As a percentage of revenue, acquisition-related expenses were 1.6% for the nine months ended November 30, 2014 and 2.2% for the nine months ended November 30, 2013.
Amortization of Acquired Intangibles
Amortization of customer relationship intangible assets increased $0.3 million, or 85.6%, for the three months ended November 30, 2014 compared to the three months ended November 30, 2013, and is recorded as part of operating expenses. This increase is attributable primarily to $0.4 million of amortization of acquired intangible assets from Serus.
Amortization of customer relationship intangible assets increased $1.3 million, or 319.0%, for the nine months ended November 30, 2014 compared to the nine months ended November 30, 2013, and is recorded as part of operating expenses. This increase is attributable primarily to $0.8 million of amortization of acquired intangible assets from Serus, and a $0.6 million increase in amortization of acquired intangible assets from ICON. In the third quarter of fiscal 2014, we revised our initial estimates of acquired ICON intangible assets’ useful lives ranging from 10 to 15 years, to 5 years. As a percentage of revenue, amortization of acquired customer relationship intangible assets was 2.8% for the nine months ended November 30, 2014, and 0.8% for the nine months ended November 30, 2013.
Interest and Other Expense, Net
| Three Months Ended November 30, |
Change | Nine Months Ended November 30, |
Change | |||||||||||||||||||||||||||||
| 2014 | 2013 | $ | % | 2014 | 2013 | $ | % | |||||||||||||||||||||||||
| (In thousands) | (In thousands) | |||||||||||||||||||||||||||||||
| Interest income |
$ | 34 | $ | 4 | $ | 30 | 750.0 | % | $ | 100 | $ | 85 | $ | 15 | 17.6 | % | ||||||||||||||||
| Interest expense |
(116 | ) | (77 | ) | (39 | ) | 50.6 | (293 | ) | (145 | ) | (148 | ) | 102.1 | ||||||||||||||||||
| Other expense, net |
(494 | ) | (388 | ) | (106 | ) | 27.3 | (371 | ) | (319 | ) | (52 | ) | 16.3 | ||||||||||||||||||
|
|
|
|
|
|
|
|
|
|
|
|
|
|
|
|
|
|||||||||||||||||
| $ | (576 | ) | $ | (461 | ) | $ | (115 | ) | 24.9 | % | $ | (564 | ) | $ | (379 | ) | $ | (185 | ) | 48.8 | % | |||||||||||
|
|
|
|
|
|
|
|
|
|
|
|
|
|
|
|
|
|||||||||||||||||
Interest and other expense, net increased due primarily to foreign exchange net losses and interest expense from financing of capital expenditures through capital leases and notes.
Provision for Income Taxes
| Three Months Ended November 30, |
Change | Nine Months Ended November 30, |
Change | |||||||||||||||||||||||||||||
| 2014 | 2013 | $ | % | 2014 | 2013 | $ | % | |||||||||||||||||||||||||
| (In thousands) | (In thousands) | |||||||||||||||||||||||||||||||
| Total provision for income taxes |
$ | (65 | ) | $ | 209 | $ | (274 | ) | (131.1 | )% | $ | (142 | ) | $ | 135 | $ | (277 | ) | (205.2 | )% | ||||||||||||
The provision for income taxes for the three and nine months ended November 30, 2014 and 2013 reflects net tax activity for the quarter and represents primarily foreign and state income taxes.
32
Table of Contents
Liquidity and Capital Resources
| Nine Months Ended November 30, | ||||||||
| 2014 | 2013 | |||||||
| (In thousands) | ||||||||
| Cash and cash equivalents at the end of the period |
$ | 18,900 | $ | 12,381 | ||||
| Net cash used in operating activities |
(18,372 | ) | (15,406 | ) | ||||
| Net cash provided by (used in) investing activities |
(1,716 | ) | 15,190 | |||||
| Net cash used in financing activities |
(3,675 | ) | (7,683 | ) | ||||
As of November 30, 2014, we had total cash, cash equivalents, and short-term and long-term investments of $25.1 million, including $5.3 million of short-term investments and $0.9 million of long-term investments in available-for-sale securities. As of November 30, 2014, $1.2 million of our cash, cash equivalents and short-term and long-term investments were held by foreign subsidiaries. Amounts held by foreign subsidiaries are generally subject to U.S. income taxation on repatriation to the U.S.
Operating Cash Flow
Our cash flow from operating activities is significantly influenced by the amount and timing of customer payments and the amount of cash we invest in personnel and infrastructure to support the anticipated future growth of our business. Net cash used in operating activities has historically resulted from losses from operations and changes in working capital.
Net cash used in operating activities was $18.4 million for the nine months ended November 30, 2014. The timing of our billings and collections relating to our sales and the timing of the payment of our liabilities have a significant impact on our cash flows. The use of cash in operating activities reflects our $(25.7) million net loss adjusted by non-cash stock-based compensation of $7.1 million, depreciation and amortization of $5.3 million, and deferred tax and other non-cash charges of $0.8 million. Additionally, there was $(6.0) million net change in our operating assets and liabilities. The net change in our operating assets and liabilities resulted primarily from a decrease in deferred revenue of $12.5 million as a consequence of the recognition of revenue for the nine months ended November 30, 2014 associated with cash collected in previous periods, offset by the acquisition of deferred revenue balance from Serus. This was offset by a decrease in accounts receivable of $4.7 million due to the timing of collections from customers and a decrease in prepaid expenses and other current assets of $1.4 million due to decrease in other acquisition-related receivables.
Net cash used in operating activities was $15.4 million for the nine months ended November 30, 2013. The timing of our billings and collections relating to our sales and the timing of the payment of our liabilities have a significant impact on our cash flows. The use of cash in operating activities reflects our $(18.7) million net loss adjusted by non-cash stock-based compensation of $4.0 million, and depreciation and amortization of $2.3 million. Additionally, we used $2.9 million from the net change in our operating assets and liabilities. The net change in our operating assets and liabilities resulted primarily from a decrease in deferred revenue of $6.4 million as a consequence of the recognition of revenue for the nine months ended November 30, 2013 associated with cash collected in previous periods, an increase in prepaid expenses of $0.6 million, offset by an increase in accounts payable of $3.1 million due to the timing of payments to our suppliers, and a decrease of $0.5 million in accounts receivable due to the timing of collections from customers.
Investing Cash Flow
Historically, our primary investing activities have consisted of capital expenditures associated with expanding our cloud-based, on-demand software solutions infrastructure and growing our workforce. We invested a portion of the proceeds from our initial public offering in available-for-sale securities.
Net cash used in investing activities for the nine months ended November 30, 2014 was $1.7 million, which comprised primarily a $16.3 million net payment for the acquisition of Serus and settlement of ICON-related acquisition obligations, a $1.4 million deposit to an escrow account related to the ICON acquisition, and $0.4 million of capital expenditures, offset by $16.4 million of sales (net of purchases) of investments in available-for-sale securities.
Net cash provided by investing activities for the nine months ended November 30, 2013 was $15.2 million, which comprised primarily $37.2 million in net proceeds from the sale and maturities of investments in available-for-sale securities, offset by $10.5 million used in purchase of investments in available-for-sale securities and $11.5 million net payment for acquisition of ICON.
33
Table of Contents
Financing Cash Flow
Net cash used in financing activities for the nine months ended November 30, 2014 was $3.7 million, which comprised primarily $3.1 million of net payments on our notes payable and capital lease obligations, $0.5 million of payments of stock offering costs and $0.1 million payment of debt assumed from Serus.
Net cash used in financing activities for the nine months ended November 30, 2013 was $7.7 million, which comprised $7.1 million payments of debt assumed from ICON, net payments of $1.5 million on our notes payable and capital lease obligations and $0.8 million of net payments under our credit facility, offset by $1.8 million in proceeds received from the exercise of stock options.
Adequacy of Capital Resources
Our future capital requirements may vary materially from those now planned and will depend on many factors. These may include the costs to develop and implement new solutions and applications, the sales and marketing resources needed to further penetrate our target markets, the expansion of our operations in the United States and internationally and the response of competitors to our solutions and applications.
We believe our existing cash, cash equivalents and investment balances, together with anticipated cash flow from operations, will be sufficient to meet our working capital and operating resource requirements for at least the next 12 months.
From time to time, we may consider additional financing sources and means to lower our cost of capital, which could include the sale of equity, equity-linked and debt financing.
In connection with any future acquisitions, we may require additional funding which may be provided in the form of additional debt, equity or equity-linked financing or a combination thereof. There can be no assurance that any additional financing will be available to us on acceptable terms or at all. In June 2014, we acquired Serus. Under the terms of the purchase agreement, the Serus stockholders received approximately $12.4 million in cash consideration, $4.0 million in shares of common stock of E2open, valued based on the average closing price per share for the ten trading days prior to signing of the agreement, and the right to receive $1.9 million in cash on the anniversary of the closing of the Serus acquisition, and up to $6.6 million in cash contingent upon the achievement of certain revenue-related financial performance milestones.
Our Indebtedness
On October 7, 2013, we entered into an agreement with a bank for a revolving loan facility with a borrowing capacity of up to $20 million. As of and for the nine months ended November 30, 2014, we did not draw on this loan facility. Funds available are subject to a borrowing formula which is secured by our accounts receivable and contracted backlog. As of January 5, 2015, the available borrowing capacity is $19.5 million. The revolving loan facility bears interest at a per annum rate ranging from the Wall Street Journal “prime rate” minus 0.25% to the Wall Street Journal prime rate plus 0.25%, with a floor for the prime rate of 3.25%. The revolving loan facility is our general obligation secured by our tangible and intangible assets, as well as a negative pledge whereby we agree not to give any creditor a security interest on our intellectual property.
Our wholly-owned subsidiary in Germany maintains a bank overdraft facility with a local bank used primarily to fund working capital. The amount available under the bank overdraft facilities was approximately $0.7 million (€0.5 million). For the nine months ended November 30, 2014, we borrowed and repaid $4.2 million from these overdraft facilities. As of November 30, 2014, we do not have any outstanding balance under this bank overdraft facility.
34
Table of Contents
Contractual Obligations, Commitments and Contingencies
We generally do not enter into long-term minimum purchase commitments. Our principal commitments, in addition to those related to our credit facilities discussed above, consist of obligations under capital leases for equipment and furniture and operating leases for computer equipment and office space. The following table summarizes our outstanding contractual obligations:
| As of November 30, 2014 | ||||||||||||||||
| Payments Due by Period | ||||||||||||||||
| Total | Less Than 1 Year |
1-3 Years |
3-5 Years |
|||||||||||||
| (In thousands) | ||||||||||||||||
| Notes payable (1) |
$ | 3,779 | $ | 2,200 | $ | 1,579 | $ | — | ||||||||
| Capital lease obligations (1) |
2,693 | 1,742 | 951 | — | ||||||||||||
| Operating lease obligations (2) |
10,044 | 2,696 | 4,754 | 2,594 | ||||||||||||
| Acquisition-related obligations (3,4) |
9,960 | 9,960 | — | — | ||||||||||||
| Tax contingencies (5) |
— | — | — | — | ||||||||||||
|
|
|
|
|
|
|
|
|
|||||||||
| Total contractual obligations |
$ | 26,476 | $ | 16,598 | $ | 7,284 | $ | 2,594 | ||||||||
|
|
|
|
|
|
|
|
|
|||||||||
| (1) | In fiscal 2014 and the nine months ended November 30, 2014, we financed the purchase of certain software licenses and related support and maintenance, and payments of insurance premiums with notes payable and capital leases. The term of the notes and capital leases range from nine months to three years, and bear interest ranging from 0% to 13.13%. |
| (2) | We lease our primary office space under noncancelable operating leases with various expiration dates through 2019. |
| (3) | In accordance with the share purchase agreement for the acquisition of ICON, we were contractually obligated to place in escrow approximately $5.4 million (€4 million) payable to ICON’s former shareholders. In June 2014, we deposited $5.4 million to the escrow account, $4.0 million of which has been released to ICON’s former shareholders in September 2014. As of November 30, 2014, we recorded restricted cash included in prepaid expenses and other current assets on the balance sheet of $1.4 million for the escrow balance and a corresponding payable to ICON shareholders. |
| (4) | In June 2014, we acquired Serus Corporation. The purchase consideration includes a contingent payment earnout of up to $7.5 million based upon the achievement of certain revenue-related financial performance milestones. The fair value of this contingent payment earnout was $6.8 million as of November 30, 2014. Additionally, we held back $1.9 million of the purchase price as partial security for indemnification obligation. |
| (5) | As of November 30, 2014, we had gross unrecognized tax benefits of $8.3 million and an additional $0.1 million of gross interest and penalties classified as other noncurrent liabilities in our consolidated balance sheets. As of the date of this report, we are unable to make a reasonably reliable estimate of the timing of payments in individual years due to uncertainties in the timing of settlement for potential tax audit outcomes. As a result, such amounts are not included in the above contractual obligations table. |
Related Party Transactions
One of our directors, Patrick J. O’Malley, III, is the Chief Financial Officer of Seagate Technology Public Limited Company (“Seagate PLC”). Seagate LLC, a wholly owned subsidiary of Seagate PLC, is one of our customers and we earned revenue of $0.7 million and $0.9 million for the three months ended November 30, 2014 and 2013, and $2.1 million and $2.5 million for the nine months ended November 30, 2014 and 2013. The Company received payments from Seagate of $2.5 million and $1.6 million for the three months ended November 30, 2014 and 2013, and $2.5 million and $2.8 million for the nine months ended November 30, 2014 and 2013. The Company has outstanding receivables from Seagate of $0.1 million and $0.1 million as of November 30, 2014 and February 28, 2014.
Off-Balance Sheet Arrangements
During the nine months ended November 30, 2014, we did not have any relationships with unconsolidated entities or financial partnerships, such as entities often referred to as structured finance or special purpose entities, which would have been established for the purpose of facilitating off-balance sheet arrangements or other contractually limited purposes.
Critical Accounting Policies and Estimates
Our condensed consolidated financial statements are prepared in accordance with generally accepted accounting principles in the United States. The preparation of these financial statements requires us to make estimates and judgments that affect the reported amounts of assets and liabilities, disclosure of contingent assets and liabilities at the date of the financial statements, and the reported amounts of revenue and expenses during the reported period. Generally, we base our estimates on historical experience and on various other assumptions in accordance with GAAP that we believe to be reasonable under the circumstances. Accordingly, actual results may differ from these estimates under other assumptions or conditions.
Critical accounting policies and estimates are those that we consider the most important to the portrayal of our financial condition and results of operations because they require our most difficult, subjective or complex judgments, often as a result of the need to make estimates about the effect of matters that are inherently uncertain. Our critical accounting policies and estimates include those related to:
| • | revenue recognition; |
| • | income taxes; |
| • | stock-based compensation; |
| • | valuation of acquired intangibles; |
| • | valuation of acquired goodwill; and |
35
Table of Contents
| • | impairment of goodwill, intangibles and other long-lived assets; |
There have been no material changes to the Company’s significant accounting policies as compared to the significant accounting policies disclosed in the Company’s audited consolidated financial statements for the fiscal year ended February 28, 2014 included in the Company’s Annual Report on Form 10-K dated May 2, 2014 as filed with the Securities and Exchange Commission.
New Accounting Pronouncements
In May 2014, the Financial Accounting Standards Board (“FASB”) issued Accounting Standards Update ASU No. 2014-09, “Revenue from Contracts with Customers.” ASU 2014-09 supersedes the revenue recognition requirements in “Topic 605, Revenue Recognition” and requires entities to recognize revenue in a way that depicts the transfer of promised goods or services to customers in an amount that reflects the consideration to which the entity expects to be entitled in exchange for those goods or services. ASU 2014-09 is effective retrospectively for annual or interim reporting periods beginning after December 15, 2016, with early application not permitted. We are currently assessing the impact the adoption of this update will have on our consolidated financial statements.
In June 2014, the FASB issued ASU 2014-12-Compensation-Stock Compensation, which requires that a performance target that affects vesting and that could be achieved after the requisite service period be treated as a performance condition. ASU 2014-12 is effective for annual reporting periods, and interim periods within those years, beginning after December 15, 2015. Early adoption is permitted. The amendments may be applied prospectively to all awards granted or modified after the effective date or retrospectively to all awards with performance targets that are outstanding as of the beginning of the earliest annual period presented. We assessed that the adoption of this update will have no material impact on our consolidated financial statements.
36
Table of Contents
| Item 3. | Quantitative and Qualitative Disclosures about Market Risk |
Market risk represents the risk of loss that may impact our financial position due to adverse changes in financial market prices and rates. Our market risk exposure is a result primarily of fluctuations in interest rates and foreign currency exchange rates. We do not hold or issue financial instruments for trading purposes.
Interest Rate Risk
We had $18.9 million cash and cash equivalents, $5.3 million short-term investments in available-for-sale securities, and $0.9 million long-term investments in available-for-sale securities.
Our cash and cash equivalents and investments consist of cash, money market funds and fixed income investments. Our fixed income portfolio is invested primarily in corporate bonds and commercial paper. We use a professional investment management firm to manage a large portion of our invested cash. Because the majority of our portfolio consists of cash and cash equivalents, which have a relatively short maturity, our portfolio’s fair value is relatively insensitive to interest rate changes. However, our fixed income investments carry a degree of interest rate risk. Fixed income investments may have their fair market value adversely impacted by a rise in interest rates. We believe a hypothetical 10% increase in interest rates as of November 30, 2014 would have an immaterial impact on our investment portfolio.
Foreign Currency Exchange Risk
Our results of operations and cash flows are subject to fluctuations due to changes in foreign currency exchange rates, particularly the exchange rates for the Euro, the Malaysian Ringgit and the British Pound. For the nine months ended November 30, 2014 and the year ended February 28, 2014, we sought to hedge the risks associated with exchange rate fluctuations through entry into forward exchange contracts. The tables below present the notional amounts (at the contract exchange rates), the weighted-average contractual foreign currency exchange rates, and the estimated fair value of our contracts outstanding as of November 30, 2014 and February 28, 2014.
| As of November 30, 2014 | As of February 28, 2014 | |||||||||||||||||||||||
| Notional Sell (Buy) |
Average Contract Rate |
Estimated Fair Value |
Notional Sell (Buy) |
Average Contract Rate |
Estimated Fair Value |
|||||||||||||||||||
| (Dollars in thousands except average contract rates) | ||||||||||||||||||||||||
| Foreign currency forward exchange contracts: |
||||||||||||||||||||||||
| Euro |
$ | 65 | 1.3 | $ | 11 | $ | 7,401 | 1.4 | $ | (256 | ) | |||||||||||||
| Malaysian Ringgit |
(2,763 | ) | 3.3 | (101 | ) | (2,146 | ) | 3.2 | (59 | ) | ||||||||||||||
| British Pound |
(5,769 | ) | 1.6 | (274 | ) | (4,317 | ) | 1.6 | 212 | |||||||||||||||
|
|
|
|
|
|
|
|
|
|||||||||||||||||
| Total |
$ | (8,467 | ) | $ | (364 | ) | $ | 938 | $ | (103 | ) | |||||||||||||
|
|
|
|
|
|
|
|
|
|||||||||||||||||
We entered into the foreign exchange contracts with two counterparties. Typically, we have the right of offset for gains earned and losses incurred under contracts with the same counterparty, and we therefore record contracts with the same counterparty on a net basis on our balance sheet.
The following table presents a sensitivity analysis of our foreign forward exchange contract portfolio using a statistical model to estimate the potential gain or loss in fair value that could arise from hypothetical appreciation or depreciation of foreign currency.
| As of November 30, 2014 | ||||||||||||||||||||
| Foreign Forward Exchange Contracts |
Value of Contracts Given X% Appreciation of Foreign Currency |
Notional Amount Sell (Buy) |
Value of Contracts Given X% Depreciation of Foreign Currency |
|||||||||||||||||
| 10% | 5% | -5% | -10% | |||||||||||||||||
| (In thousands) | ||||||||||||||||||||
| Euro |
$ | 59 | $ | 62 | $ | 65 | $ | 68 | $ | 72 | ||||||||||
| Malaysian Ringgit |
(2,487 | ) | (2,625 | ) | (2,763 | ) | (2,901 | ) | (3,039 | ) | ||||||||||
| British Pound |
(5,192 | ) | (5,481 | ) | (5,769 | ) | (6,057 | ) | (6,346 | ) | ||||||||||
As our international operations continue to grow, we may choose to utilize more foreign currency forward and option contracts to manage currency exposures.
We do not use derivative financial instruments for speculative or trading purposes; however, this does not mean that we may not adopt specific hedging strategies in the future.
37
Table of Contents
| Item 4. | Controls and Procedures |
Evaluation of Disclosure Controls and Procedures
Our management, with the participation of our Chief Executive Officer and our Chief Financial Officer, evaluated the effectiveness of our disclosure controls and procedures as of November 30, 2014. The term “disclosure controls and procedures,” as defined in Rules 13a-15(e) and 15d-15(e) under the Exchange Act, means controls and other procedures of a company that are designed to ensure that information required to be disclosed by a company in the reports that it files or submits under the Exchange Act is recorded, processed, summarized and reported, within the time periods specified in the SEC’s rules and forms. Disclosure controls and procedures include, without limitation, controls and procedures designed to ensure that information required to be disclosed by a company in the reports that it files or submits under the Exchange Act is accumulated and communicated to the company’s management, including its principal executive and principal financial officers, as appropriate to allow timely decisions regarding required disclosure. Based on the evaluation of our disclosure controls and procedures as of November 30, 2014, our Chief Executive Officer and Chief Financial Officer concluded that, as of such date, our disclosure controls and procedures were effective.
Changes in Internal Control over Financial Reporting
There were no changes in our internal control over financial reporting identified in connection with the evaluation required by Rule 13a-15(d) and 15d-15(d) of the Exchange Act that occurred during the quarter ended November 30, 2014 covered by this Quarterly Report on Form 10-Q that has materially affected, or is reasonably likely to materially affect, our internal control over financial reporting.
Inherent Limitations on Effectiveness of Controls
Our management, including our Chief Executive Officer and Chief Financial Officer, believes that our disclosure controls and procedures and internal control over financial reporting are designed to provide reasonable assurance of achieving their objectives and are effective at the reasonable assurance level. However, our management does not expect that our disclosure controls and procedures or our internal control over financial reporting will prevent all errors and all fraud. A control system, no matter how well conceived and operated, can provide only reasonable, not absolute, assurance that the objectives of the control system are met. Further, the design of a control system must reflect the fact that there are resource constraints, and the benefits of controls must be considered relative to their costs. Because of the inherent limitations in all control systems, no evaluation of controls can provide absolute assurance that all control issues and instances of fraud, if any, have been detected. These inherent limitations include the realities that judgments in decision making can be faulty, and that breakdowns can occur because of a simple error or mistake. Additionally, controls can be circumvented by the individual acts of some persons, by collusion of two or more people or by management override of the controls. The design of any system of controls also is based in part upon certain assumptions about the likelihood of future events, and there can be no assurance that any design will succeed in achieving its stated goals under all potential future conditions; over time, controls may become inadequate because of changes in conditions, or the degree of compliance with policies or procedures may deteriorate. Because of the inherent limitations in a cost-effective control system, misstatements due to error or fraud may occur and not be detected.
38
Table of Contents
| Item 1. | Legal Proceedings |
We are not currently engaged in any material legal proceedings.
| Item 1A. | Risk Factors |
Our operations and financial results are subject to various risks and uncertainties including those described below. If any of the following risks or others not specified below materialize, our business, financial condition, results of operations and prospects could be materially adversely affected. In that case, the trading price of our common stock could decline.
Risks Related to Our Business and Industry
We have incurred operating losses in the past and may incur operating losses in the future.
We began our operations in 2000. Throughout most of our history, we have experienced net losses and negative cash flows from operations. As of November 30, 2014 and February 28, 2014, we had an accumulated deficit of $392.0 million and $366.3 million. We expect our operating expenses to increase in the future as we expand our operations. Furthermore, as a public company, we incur additional legal, accounting and other expenses that we did not incur as a private company. If our revenue does not grow to offset these increased expenses, we will not be profitable. We cannot assure you that we will be able to achieve or maintain profitability. You should not consider recent revenue growth as indicative of our future performance.
If we are unable to attract new customers or sell additional products to our existing customers, our revenue growth and profitability will be adversely affected.
To increase our revenue and achieve and maintain profitability, we must regularly add new customers or sell additional solutions to our existing customers, which we plan to do. Numerous factors, however, may impede our ability to add new customers and sell additional solutions to our existing customers, including our inability to convert companies that have been referred to us by our existing network into paying customers, failure to attract and effectively train new sales and marketing personnel, failure to retain and motivate our current sales and marketing personnel, failure to develop relationships with resellers or failure to ensure the effectiveness of our marketing programs. In addition, if prospective customers do not perceive our solutions to be of sufficiently high value and quality, we will not be able to attract the number and types of new customers that we are seeking.
If we are unable to attract and enable third-party service providers, our revenue and margin growth will be adversely affected.
To enable anticipated growth of product subscriptions, we intend to utilize partners to provide integration and deployment services. This strategy depends upon successful marketing to and recruitment of partners. It also assumes successful training and transfer of the knowledge and skills required to deploy system integration and software functionality. We cannot assure the recruitment of sufficient partners to meet anticipated demand or that those partners who are recruited can be made effective substitutes for internal professional services resources.
We derive a significant portion of our revenue from a relatively small number of customers, and our growth depends on our ability to retain existing customers and add new customers.
We derive a significant percentage of our revenue from a relatively small number of customers, and the loss of any one or more of those customers for any reason, including without limitation, early termination of our contract with them could decrease our revenue and harm our current and future results of operations. For the nine months ended November 30, 2014, our top ten customers accounted for 47.8% of our total revenue. Although our largest customers may vary from period to period, we anticipate that we will continue to depend on revenue from a relatively small number of customers.
39
Table of Contents
We encounter long sales cycles, particularly with our larger customers, and seasonality in sales, which could have an adverse effect on the amount, timing and predictability of our revenue.
Our products have lengthy sales cycles, which typically extend from four to 12 months and may in some instances take longer than one year. Potential and existing customers, particularly larger enterprises, often commit significant resources to an evaluation of available solutions and services and require us to expend substantial time and resources in connection with our sales efforts. The length of our sales cycles also varies depending on the type of customer to which we are selling, the product being sold and customer requirements. We may incur substantial sales and marketing expenses and expend significant management effort during this time, regardless of whether we make a sale. Many of the risks relating to sales processes are beyond our control, including:
| • | Our customers’ budgetary and scheduling constraints; |
| • | The timing of our customers’ budget cycles and approval processes; |
| • | Our customers’ willingness to augment or replace their currently deployed software products; and |
| • | General economic conditions. |
As a result of the lengthy and uncertain sales cycles of our products and services, it is difficult for us to predict when customers may purchase products or services from us, thereby affecting when we can recognize the associated revenue, and our results of operations may vary significantly and may be adversely affected. The length of our sales cycle makes us susceptible to having pending transactions delayed or terminated by our customers if they decide to delay or withdraw funding for information technology, projects. Our customers may decide to delay or withdraw funding for various reasons, including global economic cycles and capital market fluctuations.
In addition, we may experience seasonality in the sales of our solutions. For instance, historically, the agreements we have signed in our fiscal first quarter have had an aggregate value less than that of the agreements signed in our preceding fiscal fourth quarter. Seasonal variations in our sales may lead to significant fluctuations in our cash flows and deferred revenue on a quarterly basis. If we fail to sign a significant customer agreement in any particular quarter, then our results of operations for such quarter and for subsequent quarters may be below the expectations of securities analysts or investors, which may result in a decline in our stock price.
Our quarterly results of operations may fluctuate. As a result, we may fail to meet or exceed the expectations of investors or securities analysts which could cause our stock price to decline.
Our quarterly revenue and results of operations may fluctuate as a result of a variety of factors, many of which are outside of our control. If our quarterly revenue or results of operations fall below the expectations of investors or securities analysts, the price of our common stock could decline substantially. Fluctuations in our results of operations may be due to a number of factors, including, but not limited to, those listed below:
| • | Demand for and market acceptance of our products; |
| • | Our ability to retain and increase sales to customers and attract new customers; |
| • | The timing of product deployment which determines when we can recognize the associated revenue; |
| • | The timing and success of introductions of new solutions or upgrades by us or our competitors; |
| • | The strength of the economy; |
| • | Changes in our pricing policies or those of our competitors; |
40
Table of Contents
| • | Competition, including entry into the industry by new competitors and new offerings by existing competitors; |
| • | The impact of seasonality on our business; |
| • | The amount and timing of expenditures related to expanding our operations, research and development or introducing new solutions; and |
| • | Changes in the payment terms for our solutions. |
Due to the foregoing factors, and the other risks discussed in this Quarterly Report on Form 10-Q, you should not rely on quarter-to-quarter comparisons of our results of operations as an indication of our future performance.
We operate in an emerging and evolving market, which may make it difficult to evaluate our business and future prospects. If this market does not develop or develops more slowly than we expect, our revenue may decline or fail to grow, and we may incur additional operating losses.
The market for trading network solutions, including our integrated platform, is in an early stage of development, and it is uncertain how rapidly this market will develop, and even if it does develop, whether our software and solutions will achieve and sustain high levels of demand and market acceptance.
Some companies may be reluctant or unwilling to use our solutions for a number of reasons, including existing investments in demand and supply network management technology. For example, supply chain management functions traditionally have been performed using purchased or licensed hardware and software implemented by each company in the supply chain. Because this traditional approach often requires significant initial investments to purchase the necessary technology and to establish systems that comply with customers’ unique requirements, suppliers may be unwilling to abandon their current options for our integrated, multi-enterprise solution.
Other factors that may limit market acceptance of our solutions include:
| • | Our ability to maintain high levels of customer satisfaction; |
| • | Our ability to maintain availability of service across all users of our products; |
| • | The price, performance and availability of competing products; |
| • | Our ability to address confidentiality concerns about information stored outside of our customers’ controlled computing environments; and |
| • | Concerns about data protection and confidentiality of data stored in the United States, for customers with headquarters outside of the United States. |
If companies do not perceive or value the benefits of our solutions, or if companies are unwilling to accept our platform as an alternative to the traditional approach, the market for our products might not continue to develop or might develop more slowly than we expect, either of which would significantly adversely affect our revenue and growth prospects.
41
Table of Contents
Downturns in general economic and market conditions and reductions in IT spending may reduce demand for our solutions, which could negatively affect our revenue, results of operations and cash flows.
Our revenue, results of operations and cash flows depend on the overall demand for our solutions. Concerns about the systemic impact of a potential widespread recession, energy costs, geopolitical issues, U.S. federal budget issues and the availability of credit have contributed to increased market volatility, decreased consumer confidence and diminished growth expectations in the U.S. economy and abroad. This in turn has resulted in reductions in IT spending by some of our customers.
Further worsening, broadening or protracted extension of the economic downturn could have a significant negative impact on our business, revenue, results of operations and cash flows. Prolonged economic slowdowns may result in customers requiring us to renegotiate existing contracts on less advantageous terms to us than those currently in place or defaulting on payments due on existing contracts.
Furthermore, during weak economic times, there is an increased risk that one or more of our customers will file for bankruptcy protection, which may adversely affect our revenue, profitability and results of operations. If a customer files for bankruptcy, we may be required to forego collection of pre-petition amounts owed and to repay amounts remitted to us during the 90-day preference period preceding the filing, which may be significant due to extended payment terms for software contract fees, and significant billings for professional services on large projects. We also face risk from international customers that file for bankruptcy protection in foreign jurisdictions, in that the outcome of the application of foreign bankruptcy laws may be more difficult to predict. In addition, we may determine that the cost of pursuing any claim may outweigh the recovery potential of such claim.
If we are unable to develop new products and services, sell our solutions into new markets or further penetrate our existing markets, our revenue will not grow as expected.
Our ability to attract new customers and increase revenue from existing customers will depend in large part on our ability to enhance and improve our solutions, to introduce new products and services in a timely manner, to sell into new markets and to further penetrate our existing markets. The success of any enhancement or new product or service depends on several factors, including the timely completion, introduction and market acceptance of the enhancement or new product or service. Any new product or service we develop or acquire may not be introduced in a timely or cost-effective manner and may not achieve the broad market acceptance necessary to generate significant revenue. Any new markets into which we attempt to sell our solutions, including new vertical markets and new countries or regions, may not be receptive. If we are unable to successfully develop or acquire new products or services, enhance our existing products or services to meet customer requirements, sell products and services into new markets or sell our products and services to additional customers in our existing markets, our revenue will not grow as expected. Moreover, we are frequently required to enhance and update our products and services as a result of changing standards and technological developments, which makes it difficult to recover the cost of development and forces us to continually qualify new products with our customers.
If we do not maintain the compatibility of our solutions with third-party applications that our customers use in their business processes, demand for our solutions could decline.
Our solutions can be used alongside a wide range of other systems, such as enterprise software systems and business software applications used by our customers in their businesses. If we do not support the continued integration of our solutions with third-party applications, including through the provision of application programming interfaces that enable data to be transferred readily between our solutions and third-party applications, demand for our solutions could decline, and we could lose sales. We will also be required to make our solutions compatible with new or additional third-party applications that are introduced into the markets that we serve. We may not be successful in making our solutions compatible with these third-party applications, which could reduce demand for our solutions. In addition, prospective customers, especially large enterprise customers, may require heavily customized features and functions unique to their business processes. If prospective customers require customized features or functions that we do not offer, then the market for our solutions will be adversely affected.
42
Table of Contents
Our inability to adapt to rapid technological change could impair our ability to remain competitive.
The industry in which we compete is characterized by rapid technological change, frequent introductions of new products and evolving industry standards. Our ability to attract new customers and increase revenue from customers will depend in significant part on our ability to anticipate industry standards and to continue to enhance existing solutions or introduce or acquire new solutions on a timely basis to keep pace with technological developments. The success of any enhancement or new solution depends on several factors, including the timely completion and market acceptance of the enhancement or new solution. Any new solution we develop or acquire might not be introduced in a timely or cost-effective manner and might not achieve the broad market acceptance necessary to generate significant revenue. If any of our competitors implements new technologies before we are able to implement them, those competitors may be able to provide more effective solutions than ours at lower prices. Any delay or failure in the introduction of new or enhanced solutions could adversely affect our business, results of operations and financial condition.
Our solutions are complex and customers may experience difficulty in implementing or upgrading our products successfully or otherwise achieving the benefits attributable to our products.
Due to the scope and complexity of the solutions that we provide, our implementation cycle can be lengthy and unpredictable. Our products may require modification or customization and must integrate with many existing computer systems and software programs of our customers and their trading partners. This can be time-consuming and expensive for our customers and can result in delays in the implementation and deployment of our products. As a result, some customers have had, and may in the future have, difficulty implementing our products successfully or otherwise achieving the expected benefits of our products. Delayed or ineffective implementation or upgrades of our software may limit our future sales opportunities, impact revenue, delay deployment of security patches, result in customer dissatisfaction and harm our reputation.
The markets in which we participate are highly competitive, and our failure to compete successfully would make it difficult for us to add and retain customers and would reduce or impede the growth of our business.
The markets for supply chain management solutions are increasingly competitive and global. We expect competition to increase in the future both from existing competitors and new companies that may enter our markets. Increased competition could result in pricing pressure, reduced sales, lower margins or the failure of our solutions to achieve or maintain broad market acceptance. We currently face, or may face in the future, competition from:
| • | SaaS providers that deliver B2B information systems; |
| • | Traditional on-premise software providers; and |
| • | Managed service providers that combine traditional on-premise software with professional information technology services. |
To remain competitive, we will need to invest continuously in software development, marketing, customer service and support and product delivery infrastructure. However, we cannot assure you that new or established competitors will not offer solutions that are superior to or lower in price than ours. We may not have sufficient resources to continue the investments in all areas of software development and marketing needed to maintain our competitive position. In addition, some of our competitors have longer operating histories, greater name recognition, larger customer bases and significantly greater financial, technical, sales, marketing and other resources than us, which may provide them with an advantage in developing, marketing or servicing new solutions. Increased competition could reduce our market share, revenue and operating margins, increase our operating costs and otherwise adversely affect our business.
43
Table of Contents
If we are unable to manage our diverse and complex operations, our reputation in the market and our ability to generate revenue from new or existing customers may be adversely affected.
Because our operations are geographically diverse and complex, our personnel resources and infrastructure could become strained and our reputation in the market and our ability to successfully implement our business plan may be adversely affected. We have experienced a period of rapid growth in our headcount and operations. For the nine months ended November 30, 2014, our employee headcount grew from 444 to 501. The growth in the size, complexity and diverse nature of our business and the expansion of our product lines and customer base have placed increased demands on our management and operations, and further growth, if any, may place additional strains on our resources in the future. Our ability to effectively compete and to manage our planned future growth will depend on, among other things, the following:
| • | Maintaining continuity in our senior management and key personnel; |
| • | Increasing the productivity of our existing employees; |
| • | Attracting, retaining, training and motivating our employees, particularly our technical and management personnel; |
| • | Deploying our solutions using third-party systems integrators, which will require changes to our applications, documentation and operational processes; |
| • | Improving our operational, financial and management controls; and |
| • | Improving our information reporting systems and procedures. |
If we do not manage the size, complexity and diverse nature of our business effectively, we could experience delayed software releases and longer response times for assisting our customers with implementation of our products and services, and could lack adequate resources to support our customers on an ongoing basis, any of which could adversely affect our reputation in the market, our ability to successfully implement our business plan and our ability to generate revenue from new or existing customers.
If we fail to retain our key employees, our business would be harmed and we might not be able to implement our business plan successfully.
Given the complex nature of the technology on which our business is based and the speed with which such technology advances, our future success is dependent, in large part, upon our ability to attract and retain highly qualified managerial, technical and sales personnel. In particular, Mark E. Woodward, our Chief Executive Officer, is critical to the management of our business and operations. Competition for talented personnel is intense, and we cannot be certain that we can retain our managerial, technical and sales personnel or that we can attract, assimilate or retain such personnel in the future. Our inability to attract and retain such personnel could have an adverse effect on our business, results of operations and financial condition.
Our growth is dependent upon the continued development of our direct sales force.
We believe that our future growth will depend on the continued development of our direct sales force and their ability to obtain new customers, particularly large enterprise customers, and to manage our existing customer base. Our ability to achieve significant growth in revenue in the future will depend, in large part, on our success in recruiting, training and retaining a sufficient number of direct sales personnel. New sales personnel require significant training and may, in some cases, take more than a year before becoming productive, if at all. If we are unable to hire and develop sufficient numbers of productive direct sales personnel, sales of our software and services will suffer and our growth will be impeded.
If we experience significant fluctuations in our rate of anticipated growth and fail to balance our expenses with our revenue forecasts, our results could be harmed.
Due to our evolving business model and the unpredictability of future general economic and financial market conditions, we may not be able to accurately forecast our rate of growth. We plan our expense levels and investment on estimates of future revenue and future anticipated rate of growth. We may not be able to adjust our spending quickly enough if the addition of new subscriptions or the renewal rate for existing subscriptions falls short of our expectations. As a result, we expect that our revenues, operating results and cash flows may fluctuate significantly on a quarterly basis. We believe that period to period comparisons of our revenues, operating results and cash flows may not be meaningful and should not be relied upon as an indication of future performance.
44
Table of Contents
Interruptions or delays in the services provided by third-party data centers and/or internet service providers could impair the delivery of our solutions and our business could suffer.
In North America, we host our solutions in Equinix co-location facilities in Sunnyvale and San Jose, California and a suburb of Chicago, Illinois. Exostar hosts our solutions for the aerospace and defense industry in third-party data centers and with third-party internet service providers outside of Washington, D.C. All of our solutions reside on hardware owned or leased and operated by us and Exostar in these locations. In China, we host our solutions in a data center in Shanghai operated by Shanghai Telecom. Our operations depend on the protection of the equipment and information we store in these third-party data centers and which third-party internet service providers transmit against damage or service interruptions that may be caused by fire, flood, severe storm, earthquake, power loss, telecommunications failures, unauthorized intrusion, computer viruses and disabling devices, natural disasters, war, criminal act, military action, terrorist attack and other similar events beyond our control. A prolonged service disruption affecting our solutions for any of the foregoing reasons could damage our reputation with current and potential customers, expose us to liability, cause us to lose customers from whom we receive recurring revenue or otherwise adversely affect our business. We may also incur significant costs for using alternative equipment or taking other actions in preparation for, or in reaction to, events that damage the data centers we use.
Our solutions are accessed by a large number of customers often at the same time. As we continue to expand the number of our customers and solutions available to our customers, we may not be able to scale our technology to accommodate the increased capacity requirements, which may result in interruptions or delays in service. In addition, the failure of our third-party data centers or third-party internet service providers to meet our capacity requirements could result in interruptions or delays in access to our solutions or impede our ability to scale our operations. In the event that our data center or third-party internet service provider arrangements are terminated, or there is a lapse of service, interruption of internet service provider connectivity, or damage to such facilities, we could experience interruptions in access to our solutions as well as delays and additional expense in arranging new facilities and services.
We may experience service failures or interruptions due to defects in the software, infrastructure, third-party components or processes that support our existing or new solutions, any of which could adversely affect our business.
Our products may contain undetected defects in the software, infrastructure, third-party components or processes that are part of the solutions we provide. If these defects lead to service failures after introduction of a solution or an upgrade to the solution, we could experience delays or lost revenue during the period required to correct the cause of the defects. We cannot be certain that defects will not be found in new solutions or upgraded solutions, resulting in loss of, or delay in, market acceptance, which could have an adverse effect on our business, results of operations and financial condition.
Because customers use our solutions for critical business processes, any defect in our solutions, any disruption to our solutions or any error in execution could cause recurring revenue customers to cancel their contracts with us, prevent potential customers from purchasing our solutions and harm our reputation. Although our contracts with our customers limit our liability to our customers for these defects, disruptions or errors, we nonetheless could be subject to litigation for actual or alleged losses to our customers’ businesses, which may require us to spend significant time and money in litigation or arbitration or to pay significant settlements or damages. We do not currently maintain any warranty reserves. Defending a lawsuit, regardless of its merit, could be costly and divert management’s attention and could cause our business to suffer.
The insurers under our existing liability insurance policy could deny coverage of a future claim that results from an error or defect in our technology or a resulting disruption in our solutions, or our existing liability insurance might not be adequate to cover all of the damages and other costs of such a claim. Moreover, we cannot assure you that our current liability insurance coverage will continue to be available to us on acceptable terms or at all. The successful assertion against us of one or more large claims that exceeds our insurance coverage, or the occurrence of changes in our liability insurance policy, including an increase in premiums or imposition of large deductible or co-insurance requirements, could have an adverse effect on our business, financial condition and results of operations. Even if we succeed in litigation with respect to a claim, we are likely to incur substantial costs and our management’s attention will be diverted from our operations.
45
Table of Contents
We may be required to defer recognition of some of our revenue, which may adversely affect our financial results in any given period.
We may be required to defer recognition of revenue for a significant period of time after entering into an agreement due to a variety of factors, including whether:
| • | The transaction involves both current on-demand software solutions and on-demand software solutions that are under development; |
| • | The customer requires significant modifications, configurations or complex interfaces that could delay delivery or acceptance of our solutions; |
| • | The transaction involves extended payment terms; |
| • | The transaction involves acceptance criteria or other terms that may delay revenue recognition; or |
| • | The transaction involves performance milestones or payment terms that depend upon the resolution of contingencies. |
Because of these factors and other specific revenue recognition requirements under GAAP, we must have very precise terms in our contracts in order to recognize revenue when we initially provide access to our software solutions or perform services. Although we strive to enter into agreements that meet the criteria under GAAP for current revenue recognition on delivered elements, our agreements are often subject to negotiation and revision based on the demands of our customers. The final terms of our agreements sometimes result in deferred revenue recognition well after the time of delivery, which may adversely affect our financial results in any given period. In addition, because of prevailing economic conditions, more customers may require extended payment terms, shorter term contracts or alternative licensing arrangements that could reduce the amount of revenue we recognize upon delivery of our solutions and could adversely affect our short-term profitability.
Furthermore, the presentation of our financial results requires us to make estimates and assumptions that may affect revenue recognition. In some instances, we could reasonably use different estimates and assumptions, and changes in estimates are likely to occur from period to period. Accordingly, actual results could differ significantly from our estimates.
If we are unable to substantially utilize our net operating loss carryforward, our future cash tax liability may increase.
As of February 28, 2014, our net operating loss (“NOL”), carryforward amounts for U.S. federal income and state tax purposes were approximately $340.9 million and $69.2 million. Under Section 382 of the Internal Revenue Code, a corporation that undergoes an “ownership change” may be subject to limitations on its ability to utilize its pre-change NOLs to offset future taxable income. In general, an ownership change occurs if the aggregate stock ownership of certain stockholders (generally 5% stockholders, applying certain look-through and aggregation rules) increases by more than 50% over such stockholders’ lowest percentage ownership during the testing period (generally three years). We believe that there was an ownership change in a prior year, which resulted in an annual NOL limitation. In addition, new issuances of our common stock, which is within our control, and purchases of our common stock in amounts greater than specified levels, which will be beyond our control, could create an additional limitation on our ability to utilize our NOLs for tax purposes in the future. Limitations imposed on our ability to utilize NOLs could cause U.S. federal and state income taxes to be paid earlier than would be paid if such limitations were not in effect and could cause such NOLs to expire unused, in each case reducing or eliminating the benefit of such NOLs. Furthermore, we may not be able to generate sufficient taxable income to utilize our NOLs before they expire. If any of these events occur, we may not derive some or all of the benefits from our NOLs. In addition, at the state level there may be periods during which the use of NOLs is suspended or otherwise limited, which would accelerate or may permanently increase state taxes owed.
If our goodwill or amortizable intangible assets become impaired we may be required to record a significant charge to earnings.
We acquire other companies and intangible assets and may not realize all the economic benefit from those acquisitions, which could result in an impairment of goodwill or intangibles. Under accounting principles generally accepted in the United States, we review our amortizable intangible assets for impairment when events or changes in circumstances indicate the carrying value may not be recoverable. We test goodwill for impairment at least annually. Factors that may be considered a change in circumstances, indicating that the carrying value of our goodwill or amortizable intangible assets may not be recoverable, include a decline in stock price and market capitalization, reduced future cash flow estimates, and slower growth rates in our industry. We may be required to record a significant charge in our financial statements during the period in which any impairment of our goodwill or amortizable intangible assets is determined, negatively impacting our results of operations.
46
Table of Contents
A failure to protect the integrity and security of our customers’ information could expose us to litigation, materially damage our reputation and harm our business. Furthermore, the unanticipated costs of protecting against such a failure could adversely affect our results of operations.
Our business involves the collection and use of confidential information of our customers and their trading partners. We cannot assure you that our efforts to protect this confidential information will be successful. If any compromise of this information security were to occur, we could be subject to legal claims and government action, experience an adverse effect on our reputation and need to incur significant additional costs to protect against similar information security breaches in the future, each of which could adversely affect our financial condition, results of operations and growth prospects. In addition, because of the critical nature of data security, any perceived breach of our security measures could cause existing or potential customers not to use our solutions and could harm our reputation.
Evolving regulation of the Internet may increase our expenditures related to compliance efforts, which may adversely affect our financial condition.
As Internet commerce continues to evolve, increasing regulation by federal, state or foreign agencies becomes more likely. We are particularly sensitive to these risks because the Internet and cloud computing are critical components of our business model. For example, we believe that increased regulation is likely in the area of data privacy on the Internet, and laws and regulations applying to the solicitation, collection, processing or use of personal or consumer information could affect our customers’ ability to use and share data, potentially reducing demand for solutions accessed via the Internet and restricting our ability to store, process and share data with our clients via the Internet. In addition, taxation of services provided over the Internet or other charges imposed by government agencies or by private organizations for accessing the Internet may be imposed. Any regulation imposing greater fees for Internet use or restricting information exchange over the Internet could result in a decline in the use of the Internet and the viability of Internet-based services, which could harm our business.
If we fail to protect our intellectual property and proprietary rights adequately, our business could be adversely affected.
We believe that proprietary technology is essential to establishing and maintaining our leadership position. We seek to protect our intellectual property through trade secrets, copyrights, confidentiality, non-compete and nondisclosure agreements, patents, trademarks, domain names and other measures, some of which afford only limited protection. We also rely on patent, trademark, trade secret and copyright laws to protect our intellectual property. Despite our efforts to protect our proprietary rights, unauthorized parties may attempt to copy aspects of our technology or to obtain and use information that we regard as proprietary. We cannot assure you that our means of protecting our proprietary rights will be adequate or that our competitors will not independently develop similar or superior technology or design around our intellectual property. In addition, the laws of some foreign countries do not protect our proprietary rights to as great an extent as the laws of the United States. Intellectual property protections may also be unavailable, limited or difficult to enforce in some countries, which could make it easier for competitors to capture market share. Our failure to adequately protect our intellectual property and proprietary rights could adversely affect our business, financial condition and results of operations.
An assertion by a third party that we are infringing its intellectual property could subject us to costly and time-consuming litigation or expensive licenses which could harm our business.
The industries in which we compete are characterized by the existence of a large number of patents, copyrights, trademarks and trade secrets and by frequent litigation based on allegations of infringement or other violations of intellectual property rights. As we seek to extend our solutions, we could be constrained by the intellectual property rights of others. In addition, our customer contracts require us to indemnify our customers against certain liabilities they may incur as a result of our infringement of any third-party intellectual property.
We might not prevail in any intellectual property infringement litigation given the complex technical issues and inherent uncertainties in such litigation. Defending such claims, regardless of their merit, could be time-consuming and distracting to management, result in costly litigation or settlement, cause development delays or require us to enter into royalty or licensing agreements. Furthermore, if our solutions exceed the scope of in-bound licenses or violate any third-party proprietary rights, we could be required to withdraw those solutions from the market, re-develop those solutions or seek to obtain licenses from third parties, which might not be available on reasonable terms or at all. Any efforts to re-develop our solutions, obtain licenses from third parties on favorable terms or license a substitute technology might not be successful and, in any case, might substantially increase our costs and harm our business, financial condition and results of operations. If we were compelled to withdraw any of our solutions from the market, our business, financial condition and results of operations could be harmed.
47
Table of Contents
The use of open source software in our products may expose us to additional risks and harm our intellectual property.
We incorporate open source software into our platform. Given the nature of open source software, third parties might assert copyright and other intellectual property infringement claims against us based on our use of certain open source software programs. The terms of many open source licenses to which we are subject have not been interpreted by U.S. or foreign courts, and there is a risk that those licenses could be construed in a manner that imposes unanticipated conditions or restrictions on our ability to commercialize our solutions. In that event, we could be required to seek licenses from third parties in order to continue offering our solutions, to re-develop our solutions, to discontinue sales of our solutions or to release our proprietary software code under the terms of an open source license, any of which could adversely affect our business.
Some of our products use or incorporate software that is subject to one or more open source licenses. Open source software is typically freely accessible, usable and modifiable. Certain open source software licenses require a user who intends to distribute the open source software as a component of the user’s software to disclose publicly part or all of the source code to the user’s software. In addition, certain open source software licenses require the user of such software to make any derivative works of the open source code available to others on unfavorable terms or at no cost. This can subject previously proprietary software to open source license terms.
While we monitor the use of all open source software in our products, processes and technology and try to ensure that no open source software is used in such a way as to require us to disclose the source code to the related product or solution when we do not wish to do so, such use may have inadvertently occurred in deploying our proprietary solutions. Additionally, if a third-party software provider has incorporated certain types of open source software into software we license from such third party for our products and solutions, we could, under certain circumstances, be required to disclose the source code to our products and solutions. This could harm our intellectual property position and have a material adverse effect on our business, results of operations and financial condition.
Our strategy has included and will continue to include pursuing acquisitions and our potential inability to successfully integrate newly-acquired companies or businesses may adversely affect our financial results.
We believe part of our growth will be driven by acquisitions of other companies or their businesses. Our acquisitions entail a high degree of risk and may not generate the financial returns we expect. Any acquisitions we complete will give rise to risks, including:
| • | Incurring significantly higher than anticipated capital expenditures and operating expenses; |
| • | Failing to assimilate the operations and personnel or failing to retain the key personnel of the acquired company or business; |
| • | Failing to integrate the acquired technologies, or incurring significant expense to integrate acquired technologies into our solutions; |
| • | Disrupting our ongoing business; |
| • | Incurring significant accounting charges; |
| • | Dissipating our management resources; |
| • | Failing to maintain uniform standards, controls and policies; |
| • | Impairing relationships with employees and customers as a result of changes in management; |
48
Table of Contents
| • | Finding that the acquired company, asset or technology does not further our business strategy, that we overpaid for the company, asset or technology or that we may be required to write off acquired assets or investments partially or entirely; |
| • | Not realizing the expected synergies of the transaction; |
| • | Facing delays in customer purchases due to difficulty in retaining customers of acquired businesses; |
| • | Exposure to unforeseen liabilities and contingencies that were not identified prior to acquiring the company; and |
| • | An inability to generate sufficient revenue from acquisitions to offset the associated acquisition costs. |
Fully integrating an acquired company or business into our operations may take a significant amount of time. We cannot assure you that we will be successful in overcoming these risks or any other problems encountered with acquisitions. To the extent we do not successfully avoid or overcome the risks or problems related to any acquisitions, our results of operations and financial condition could be adversely affected. Acquisitions also could impact our financial position and capital needs, and could cause substantial fluctuations in our quarterly and annual results of operations. Acquisitions could include significant goodwill and intangible assets, which may result in future impairment charges that would reduce our stated earnings. We may incur significant costs in our efforts to engage in strategic transactions and these expenditures may not result in successful acquisitions.
Future acquisitions of technologies or companies, which are paid for partially or entirely through the issuance of stock or stock rights, could dilute the ownership of our existing stockholders.
We expect that the consideration we might pay for any future acquisitions of companies or technologies could include stock, rights to purchase stock, cash or some combination of the foregoing. In July 2013, we issued 451,593 shares of our common stock as partial consideration in connection with the acquisition of ICON. In June 2014, we issued 238,194 shares of our common stock as partial consideration in connection with the acquisition of Serus. If we issue stock or rights to purchase stock in connection with future acquisitions, net income (loss) per share and then-existing holders of our common stock may experience dilution.
Mergers or other strategic transactions involving our competitors could weaken our competitive position, which could harm our results of operations.
Our industry is highly fragmented, and we believe it is likely that some of our existing competitors will consolidate or will be acquired. In addition, some of our competitors may enter into new alliances with each other or may establish or strengthen cooperative relationships with systems integrators, third-party consulting firms or other parties. Any such consolidation, acquisition, alliance or cooperative relationship could lead to pricing pressure and our loss of market share and could result in a competitor with greater financial, technical, marketing, service and other resources, all of which could have a material adverse effect on our business, results of operations and financial condition.
We may not receive significant revenue as a result of our current research and development efforts.
We have made and expect to continue to make significant investments in research and development and related product opportunities. For the nine months ended November 30, 2014, we spent $16.1 million on research and development expenses. High levels of expenditures for research and development could adversely affect our results of operations if not offset by corresponding future revenue increases. We believe that we must continue to dedicate a significant amount of resources to our research and development efforts to maintain our competitive position. However, it is difficult to estimate when, if ever, we will receive significant revenue as a result of these investments.
49
Table of Contents
We incur increased costs and demands upon management as a result of complying with the laws and regulations affecting public companies, which could adversely affect our results of operations and our ability to attract and retain qualified executives and board members.
As a public company, we incur legal, accounting and other expenses, including costs associated with public company reporting and corporate governance requirements. These requirements include compliance with Section 404 and other provisions of the Sarbanes-Oxley Act of 2002, the Dodd-Frank Wall Street Reform and Consumer Protection Act, or the Dodd-Frank Act, as well as rules implemented by the Securities and Exchange Commission, or the SEC, the NASDAQ Stock Market, or NASDAQ, and other applicable securities or exchange-related rules and regulations. In addition, our management team also has to adapt to the requirements of being a public company. We expect complying with these rules and regulations will substantially increase our legal and financial compliance costs and to make some activities more time-consuming and costly.
The increased costs associated with operating as a public company decreases our net income or increase our net loss, and may require us to reduce costs in other areas of our business or increase the prices of our products or services. Additionally, if these requirements divert our management’s attention from other business concerns, our results of operations could be adversely effected.
However, for as long as we remain an “emerging growth company” as defined in the Jumpstart Our Business Startups Act of 2012 (“JOBS Act”), we may take advantage of certain exemptions from various reporting requirements that are applicable to other public companies that are not “emerging growth companies” including, but not limited to, not being required to comply with the auditor attestation requirements of Section 404 of the Sarbanes-Oxley Act, reduced disclosure obligations regarding executive compensation in our periodic reports and proxy statements, and exemptions from the requirements of holding an annual nonbinding advisory vote on executive compensation and seeking nonbinding stockholder approval of any golden parachute payments not previously approved. We may take advantage of these reporting exemptions until we are no longer an “emerging growth company.”
We will remain an “emerging growth company” for up to five years, although we would cease to be an “emerging growth company” prior to such time if we have more than $1.0 billion in annual revenue, more than $700 million in market value of our common stock is held by non-affiliates or we issue more than $1.0 billion of non-convertible debt over a three-year period.
As a public company, it is more difficult and more expensive for us to obtain director and officer liability insurance, and we may be required to accept reduced policy limits and coverage or incur substantially higher costs to obtain the same or similar coverage. As a result, it may be more difficult for us to attract and retain qualified individuals to serve on our board of directors or as our executive officers.
We rely significantly on recurring revenue, which may decline or fail to be renewed, and our future results of operations could be harmed.
Our revenue from subscriptions to our software and software-related support services accounted for approximately 84.0% of our total revenue for the nine months ended November 30, 2014. Revenue from our subscriptions is recognized over the contractual term of the license, which is typically three to five years, and is generally recurring in nature. Sales of new or recurring subscriptions and software-related support service contracts and renewals after expiration of the initial term may decline or fluctuate as a result of a number of factors, including end customers’ level of satisfaction with our software solutions, the prices of our software solutions, the prices of products and services offered by our competitors or reductions in our customers’ spending levels. A software industry-wide movement towards shorter contractual license terms led by other SaaS providers, which competitive pressures may compel us to follow, could lead to increased volatility and diminished visibility into future recurring revenue. If our sales of new or recurring subscriptions and software related support service contracts decline, our revenue and revenue growth may decline, and our business will suffer.
Because we recognize certain revenue from subscriptions and support services over the term of the relevant service period, downturns or upturns in sales are not immediately fully reflected in our results of operations.
We recognize recurring subscriptions and software-related support services revenue monthly over the term of the relevant service period, which is typically three years. As a result, much of the revenue we report each quarter is the recognition of deferred revenue from recurring subscriptions and software-related support service contracts entered into during previous quarters. Consequently, a decline in new or renewed recurring subscriptions and software-related support service contracts in any one quarter will not be fully reflected in revenue in that quarter, but will negatively affect our revenue in future quarters. Accordingly, the effect of significant downturns in new or renewed sales of our recurring subscriptions and software-related support services are not reflected in full in our results of operations until future periods. Revenue from our recurring subscriptions and software-related support services also makes it difficult for us to rapidly increase our revenue through additional service sales in any period, as revenue from new and renewal software-related service contracts must be recognized over the applicable service period.
50
Table of Contents
Our failure to raise additional capital or generate cash flows necessary to expand our operations and invest in new technologies in the future could reduce our ability to compete successfully and adversely affect our results of operations.
We may need to raise additional funds, and we may not be able to obtain additional debt or equity financing on favorable terms, if at all. If we raise additional equity financing, our security holders may experience significant dilution of their ownership interests and the value of shares of our common stock could decline. If we engage in debt financing, we may be required to accept terms that restrict our ability to incur additional indebtedness, force us to maintain specified liquidity or other ratios or restrict our ability to pay dividends or make acquisitions. If we need additional capital and cannot raise it on acceptable terms, if at all, we may not be able to, among other things:
| • | Develop and enhance our solutions; |
| • | Continue to expand our technology development, sales and marketing organizations; |
| • | Hire, train and retain employees; |
| • | Respond to competitive pressures or unanticipated working capital requirements; or |
| • | Pursue acquisition opportunities. |
Our inability to do any of the foregoing could reduce our ability to compete successfully and adversely affect our results of operations.
Because our long-term success depends, in part, on our ability to expand the sales of our solutions to customers located outside of the United States, our business will be susceptible to risks associated with international operations.
We have limited experience operating in foreign jurisdictions. Conducting and launching operations on an international scale requires close coordination of activities across multiple jurisdictions and time zones and consumes significant management resources. Customers in countries outside of the United States accounted for 25.7% and 24.4% of our total revenue for the nine months ended November 30, 2014 and 2013. Our limited experience in operating our business outside of the United States increases the risk that our current and any future international expansion efforts will not be successful. Conducting international operations subjects us to new risks that, generally, we have not faced in the United States, including:
| • | Fluctuations in currency exchange rates; |
| • | Unexpected changes in foreign regulatory requirements; |
| • | Longer accounts receivable payment cycles and difficulties in collecting accounts receivable; |
| • | Difficulties in managing and staffing international operations, including differences in labor laws; |
| • | Potentially adverse tax consequences, including the complexities of foreign value added tax systems and restrictions on the repatriation of earnings; |
| • | Localization of our solutions, including translation into foreign languages and associated expenses; |
| • | The burdens of complying with a wide variety of foreign laws and different legal standards, including laws and regulations related to privacy and data security; |
51
Table of Contents
| • | Requirements for regional hosting of customer solutions and data, which may require additional capital expenditures necessary to set up new data centers; |
| • | Increased financial accounting and reporting burdens and complexities; |
| • | Political, social and economic instability abroad, terrorist attacks and security concerns in general; and |
| • | Reduced or varied protection for intellectual property rights in some countries. |
The occurrence of any one of these risks could negatively affect our international business and, consequently, our results of operations generally. Additionally, operating in international markets also requires significant management attention and financial resources. We cannot be certain that the investment and additional resources required in establishing, acquiring or integrating operations in other countries will produce desired levels of revenue or profitability.
From time to time, we may become defendants in legal proceedings as to which we are unable to assess our exposure and which could become significant liabilities in the event of an adverse judgment.
We may become defendants in legal proceedings from time to time. Companies in our industry have been subject to claims related to patent infringement and product liability, as well as contract and employment-related claims. We may not be able to accurately assess the risk related to these suits, and we may be unable to accurately assess our level of exposure.
We are required to comply with U.S. export control laws and regulations. Noncompliance with those laws and regulations could have a material adverse effect on our business.
Our solutions are subject to U.S. export controls and we incorporate encryption technology into certain of our solutions. These encrypted solutions and the underlying technology may be exported outside the United States only with the required export authorizations, including by license, a license exception or other appropriate government authorizations, including the filing of an encryption registration. U.S. export control laws and economic sanctions prohibit the shipment of certain solutions and services to U.S. embargoed or sanctioned countries, governments and persons and complying with export control and sanctions regulations for a particular sale may be time-consuming and may result in the delay or loss of sales opportunities. Penalties for violations of the U.S. export control laws include fines of up to $250,000 or twice the value of the transaction, whichever is greater, per violation, the possible loss of export or import privileges and criminal action for knowing or willful violations.
Further, if our operating partners fail to obtain appropriate import, export or re-export licenses or permits, we may also be adversely affected, become the subject of government investigations or penalties, and incur reputational harm.
In addition, various countries regulate the import of certain encryption technology, including import permitting and licensing requirements, and have enacted laws that could limit our ability to sell our solutions or could limit our customers’ ability to implement our solutions in those countries. Changes in our solutions or changes in export and import regulations may create delays in the introduction of our solutions in international markets, prevent our customers with international operations from deploying our solutions globally or, in some cases, prevent the export or import of our solutions to certain countries, governments or persons altogether. Any change in export or import regulations, economic sanctions or related legislation, shift in the enforcement or scope of existing regulations, or change in the countries, governments, persons or technologies targeted by such regulations, could result in decreased use of our solutions by, or in our decreased ability to export or sell our solutions to, existing or potential customers with international operations. Any decreased use of our solutions or limitation on our ability to export or sell our solutions would likely adversely affect our business, financial condition and results of operations.
Our facilities in California are located near known earthquake faults, and the occurrence of an earthquake or other catastrophic disaster could cause damage to our facilities and equipment, which could negatively impact our operations.
Our facilities in the San Francisco Bay Area are located near known earthquake fault zones and are vulnerable to damage from earthquakes. We are also vulnerable to damage from other types of disasters, including fire, floods, power loss, communications failures and similar events. If any disaster were to occur, our ability to operate our business at our facilities would be seriously, or potentially completely, impaired. The insurance we maintain may not be adequate to cover our losses resulting from disasters or other business interruptions. Accordingly, an earthquake or other disaster could materially and adversely harm our ability to conduct business.
52
Table of Contents
We may be subject to additional tax liabilities.
We are subject to income, sales, use, value added and other taxes in the United States and other countries in which we conduct business, which such laws and rates vary greatly by jurisdiction. Certain jurisdictions in which we do not collect sales, use, value added or other taxes on our sales may assert that such taxes are applicable, which could result in tax assessments, penalties and interest, and we may be required to collect such taxes in the future. Significant judgment is required in determining our worldwide provision for income taxes. These determinations are highly complex and require detailed analysis of the available information and applicable statutes and regulatory materials. In the ordinary course of our business, there are many transactions and calculations where the ultimate tax determination is uncertain. Although we believe our tax estimates are reasonable, the final determination of tax audits and any related litigation could be materially different from our historical tax practices, provisions and accruals. If we receive an adverse ruling as a result of an audit, or we unilaterally determine that we have misinterpreted provisions of the tax regulations to which we are subject, there could be a material effect on our tax provision, net income or cash flows in the period or periods for which that determination is made. In addition, liabilities associated with taxes are often subject to an extended or indefinite statute of limitations period. Therefore, we may be subject to additional tax liability (including penalties and interest) for a particular year for extended periods of time.
Changes in existing financial accounting standards or practices, or taxation rules or practices, may adversely affect our results of operations.
Changes in existing accounting or taxation rules or practices, new accounting pronouncements or taxation rules, or varying interpretations of current accounting pronouncements or taxation practice could have a significant adverse effect on our results of operations or the manner in which we conduct our business. Further, such changes could potentially affect our reporting of transactions completed before such changes are effective.
Risks Relating to Owning Our Common Stock
Our share price may be volatile.
The market price of our common stock could be subject to wide fluctuations in response to many risk factors listed in this section, and others beyond our control, including:
| • | Actual or anticipated fluctuations in our financial condition and results of operations; |
| • | Overall conditions in our industry and market; |
| • | Addition or loss of significant customers; |
| • | Changes in laws or regulations applicable to our products; |
| • | Actual or anticipated changes in our growth rate relative to our competitors; |
| • | Announcements by us or our competitors of significant acquisitions, strategic partnerships, joint ventures or capital commitments; |
| • | Additions or departures of key personnel; |
| • | Competition from existing products or new products that may emerge; |
53
Table of Contents
| • | Issuance of new or updated research or reports by securities analysts; |
| • | Fluctuations in the valuation of companies perceived by investors to be comparable to us; |
| • | Disputes or other developments related to proprietary rights, including patents, litigation matters and our ability to obtain intellectual property protection for our technologies; |
| • | Sales of our common stock by us or our stockholders; |
| • | Share price and volume fluctuations attributable to inconsistent trading volume levels of our shares; and |
| • | General economic and market conditions. |
Furthermore, the stock markets have experienced extreme price and volume fluctuations that have affected and continue to affect the market prices of equity securities of many companies. These fluctuations often have been unrelated or disproportionate to the operating performance of those companies. These broad market and industry fluctuations, as well as general economic, political and market conditions such as recessions, interest rate changes or international currency fluctuations, may negatively impact the market price of our common stock. In the past, companies that have experienced volatility in the market price of their stock have been subject to securities class action litigation. We may be the target of this type of litigation in the future. Securities litigation against us could result in substantial costs and divert our management’s attention from other business concerns, which could seriously harm our business.
If securities or industry analysts do not publish research or reports about our business, or publish negative reports about our business, our share price and trading volume could decline.
The trading market for our common stock will depend on the research and reports that securities or industry analysts publish about us or our business. We do not have any control over these analysts. If one or more of the analysts who cover us downgrade our shares or change their opinion of our shares, our share price would likely decline. If one or more of these analysts cease coverage of our company or fail to regularly publish reports on us, we could lose visibility in the financial markets, which could cause our share price or trading volume to decline.
Future sales of our common stock in the public market could cause our share price to fall.
Sales of a substantial number of shares of our common stock in the public market, or the perception that these sales might occur, could depress the market price of our common stock and could impair our ability to raise capital through the sale of additional equity securities. In addition, certain holders of our shares of common stock are entitled to rights with respect to registration of such shares under the Securities Act of 1933, as amended, or the Securities Act, pursuant to a registration rights agreement between such holders and us. If such holders, sell a large number of shares, the market price for our common stock could be adversely affected. If we file a registration statement for the purpose of selling additional shares to raise capital and are required to include shares held by these holders pursuant to the exercise of their registration rights, our ability to raise capital may be impaired.
All of the common stock sold in our IPO in July 2012 is freely tradable without restrictions or further registration under the Securities Act, except for any shares held by our affiliates as defined in Rule 144 under the Securities Act. All of the common stock sold in our secondary offering in January 2014 is freely tradable without restrictions or further registration under the Securities Act except for any shares held by our affiliates as defined in Rule 144 under the Securities Act.
We filed a registration statement on Form S-8 under the Securities Act to register shares for issuance under our 2012 Equity Compensation Plan. Our 2012 Equity Compensation Plan provides for automatic increases in the shares reserved for issuance under the plan which could result in additional dilution to our stockholders. These shares can be freely sold in the public market upon issuance and vesting, subject to restrictions provided under the terms of the applicable plan and/or the option agreements entered into with option holders.
We may also issue shares of our common stock or securities convertible into our common stock from time to time in connection with a financing, acquisition or otherwise. Any such issuance could result in substantial dilution to our existing stockholders and cause the trading price of our common stock to decline.
54
Table of Contents
As a result of becoming a public company, we are obligated to develop and maintain a system of effective internal controls over financial reporting. We may not complete our analysis of our internal control over financial reporting in a timely manner, or these internal controls may not be determined to be effective, which may adversely affect investor confidence in our company and, as a result, the value of our common stock.
We are required, pursuant to Section 404 of the Sarbanes-Oxley Act of 2002, to furnish a report by management on, among other things, the effectiveness of our internal control over financial reporting in the second annual report we file with the SEC. This assessment will need to include disclosure of any material weaknesses identified by our management in our internal control over financial reporting, as well as a statement that our auditors have issued an attestation report on effectiveness of our internal controls. However, our auditors will not be required to formally attest to the effectiveness of our internal control over financial reporting pursuant to Section 404 until we are no longer an “emerging growth company” as defined in the JOBS Act if we take advantage of the exemptions available to us through the JOBS Act.
We are in the early stages of the costly and challenging process of compiling the system and processing documentation necessary to perform the evaluation needed to comply with Section 404. We may not be able to remediate future material weaknesses, or to complete our evaluation, testing and any required remediation in a timely fashion. During the evaluation and testing process, if we identify one or more material weaknesses in our internal control over financial reporting, we will be unable to assert that our internal controls are effective. If we are unable to assert that our internal control over financial reporting is effective, or if our auditors are unable to express an opinion on the effectiveness of our internal controls, we could lose investor confidence in the accuracy and completeness of our financial reports, which would have a material adverse effect on the price of our common stock.
We are an “emerging growth company” and we cannot be certain whether the reduced disclosure requirements applicable to emerging growth companies will make our common stock less attractive to investors.
We are an “emerging growth company,” as defined in the JOBS Act, and we may take advantage of certain exemptions from various reporting requirements that are applicable to other public companies that are not “emerging growth companies” including, but not limited to, not being required to comply with the auditor attestation requirements of Section 404 of the Sarbanes-Oxley Act, reduced disclosure obligations regarding executive compensation in our periodic reports and proxy statements, and exemptions from the requirements of holding an annual non-binding advisory vote on executive compensation and nonbinding stockholder approval of any golden parachute payments not previously approved. We cannot predict if investors will find our common stock less attractive because we will rely on these exemptions. If some investors find our common stock less attractive as a result, there may be a less active trading market for our common stock and our stock price may become more volatile.
In addition, Section 107 of the JOBS Act provides that an “emerging growth company” can take advantage of the extended transition period provided in Section 7(a)(2)(B) of the Securities Act for complying with new or revised accounting standards. In other words, an “emerging growth company” can delay the adoption of certain accounting standards until those standards would otherwise apply to private companies. However, we have chosen to “opt out” of such extended transition period, and as a result, we will comply with new or revised accounting standards on the relevant dates on which adoption of such standards is required for non-emerging growth companies. Section 107 of the JOBS Act provides that our decision to opt out of the extended transition period for complying with new or revised accounting standards is irrevocable.
55
Table of Contents
Our directors, executive officers and principal stockholders have substantial control over us and could delay or prevent a change in corporate control.
As of November 30, 2014, our executive officers and directors, and entities that are affiliated with them, beneficially owned (as determined in accordance with the rules of the SEC) an aggregate of 18.6% of our outstanding common stock. As a result, these stockholders, acting together, have the ability to influence the outcome of matters submitted to our stockholders for approval, including the election of directors and any merger, consolidation or sale of all or substantially all of our assets. In addition, these stockholders, acting together, have the ability to influence the management and affairs of our company. Accordingly, this concentration of ownership might harm the market price of our common stock by:
| • | Delaying, deferring or preventing a change in corporate control; |
| • | Impeding a merger, consolidation, takeover or other business combination involving us; or |
| • | Discouraging a potential acquirer from making a tender offer or otherwise attempting to obtain control of us. |
Anti-takeover provisions in our charter documents and under Delaware law could make an acquisition of us, which may be beneficial to our stockholders, more difficult and may prevent attempts by our stockholders to replace or remove our current management and limit the market price of our common stock.
Provisions in our amended and restated certificate of incorporation and bylaws may have the effect of delaying or preventing a change of control or changes in our management. Our amended and restated certificate of incorporation and bylaws include provisions that:
| • | Authorize our board of directors to issue, without further action by the stockholders up to 10,000,000 shares of undesignated preferred stock; |
| • | Require that any action to be taken by our stockholders be effected at a duly called annual or special meeting and not by written consent; |
| • | Specify that special meetings of our stockholders can be called only by our board of directors, the Chairman of the Board, the Chief Executive Officer or the President; |
| • | Establish an advance notice procedure for stockholder approvals to be brought before an annual meeting of our stockholders, including proposed nominations of persons for election to our board of directors; |
| • | Provide that directors may be removed only for cause; |
| • | Provide that vacancies on our board of directors may be filled only by a majority of directors then in office, even though less than a quorum; |
| • | Establish that our board of directors is divided into three classes — Class I, Class II and Class III — with each class serving staggered terms; and |
| • | Require a super-majority of votes to amend certain of the above-mentioned provisions. |
These provisions, alone or together, could delay or prevent hostile takeovers and changes in control. These provisions may also frustrate or prevent any attempts by our stockholders to replace or remove our current management by making it more difficult for stockholders to replace members of our board of directors, which is responsible for appointing the members of our management.
As a Delaware corporation, we are also subject to provisions of Delaware law, including Section 203 of the Delaware General Corporation law, which prevents some stockholders holding more than 15% of our outstanding common stock from engaging in certain business combinations without approval of the holders of substantially all of our outstanding common stock.
Any provision of our amended and restated certificate of incorporation or bylaws or Delaware law that has the effect of delaying or deterring a change of control could limit the opportunity for our stockholders to receive a premium for their shares of our common stock, and could also affect the price that some investors are willing to pay for our common stock.
56
Table of Contents
We do not intend to pay dividends for the foreseeable future.
We have never declared or paid any cash dividends on our common stock and do not intend to pay any cash dividends in the foreseeable future. We anticipate that we will retain all of our future earnings for use in the operation of our business and for general corporate purposes. Any determination to pay dividends in the future will be at the discretion of our board of directors. Accordingly, investors must rely on sales of their common stock after price appreciation, which may never occur, as the only way to realize any future gains on their investments.
| Item 6. | Exhibits. |
The exhibits listed in the accompanying Exhibit Index are filed or incorporated by reference as part of this Quarterly Report.
57
Table of Contents
Pursuant to the requirements of the Securities Exchange Act of 1934, the Registrant has duly caused this report to be signed on its behalf by the undersigned thereunto duly authorized.
| Date: January 8, 2015 | E2OPEN, INC. | |||
| By: | /s/ Mark E. Woodward | |||
| Mark E. Woodward | ||||
| President, Chief Executive Officer and Director | ||||
| (Principal Executive Officer) | ||||
| Date: January 8, 2015 | By: | /s/ Peter J. Maloney | ||
| Peter J. Maloney | ||||
| Chief Financial Officer | ||||
| (Principal Financial and Accounting Officer) | ||||
58
Table of Contents
EXHIBIT INDEX
| Exhibit |
Description | |
| 10.1*† | Separation Agreement and Release entered into between E2open, Inc. and David Packer on September 10, 2014. | |
| 31.1* | Certification of Principal Executive Officer Required Under Rule 13a-14(a) and 15d-14(a) of the Securities Exchange Act of 1934, as amended. | |
| 31.2* | Certification of Principal Financial Officer Required Under Rule 13a-14(a) and 15d-14(a) of the Securities Exchange Act of 1934, as amended. | |
| 32.1* (1) | Certification of Principal Executive Officer and Principal Financial Officer Pursuant to 18 U.S.C. Section 1350, As Adopted Pursuant to Section 906 of the Sarbanes-Oxley Act of 2002. | |
| 101.INS | XBRL Instance Document | |
| 101.SCH | XBRL Taxonomy Schema Linkbase Document | |
| 101.CAL | XBRL Taxonomy Calculation Linkbase Document | |
| 101.DEF | XBRL Taxonomy Definition Linkbase Document | |
| 101.LAB | XBRL Taxonomy Labels Linkbase Document | |
| 101.PRE | XBRL Taxonomy Presentation Linkbase Document | |
| * | Filed herewith. |
| † | Indicates a management contract or compensatory plan or arrangement. |
| (1) | The certifications attached as Exhibit 32.1 accompany this Quarterly Report on Form 10-Q pursuant to 18 U.S.C Section 1350, as adopted pursuant to Section 906 of the Sarbanes-Oxley Act of 2002, and shall not be deemed “filed” by the registrant for the purpose of Section 18 of the Securities Exchange Act of 1934, as amended. |
59