Attached files
| file | filename |
|---|---|
| 8-K - 8-K - ATN International, Inc. | a14-26817_18k.htm |
| EX-2.1 - EX-2.1 - ATN International, Inc. | a14-26817_1ex2d1.htm |
| EX-99.1 - EX-99.1 - ATN International, Inc. | a14-26817_1ex99d1.htm |
Exhibit 99.2
|
|
Acquisition: Green Lake Capital / Ahana Renewables December 2014 |
|
|
This presentation contains forward-looking statements within the meaning of the Private Securities Litigation Reform Act of 1995, including the future financial performance of the acquired solar business, its growth prospects and its anticipated contributions to ATN. There are a number of important factors that could cause actual results or events to differ materially from those indicated by such forward-looking statements, including: (i) the performance of the solar industry generally and the acquired business specifically, (ii) ATN’s ability to operate in a new industry, (iii) changes in laws and government regulations affecting the acquired business, (iv) consumer demand for solar power and (v) the “Risk Factors” discussed in ATN’s public reports, including its most recent Quarterly Report on Form 10-Q filed with the SEC on November 11, 2014. The information set forth in this presentation speaks only as of the date hereof, and ATN disclaims any intention or obligation to update any forward-looking statements as a result of developments occurring after the date of this news release. In addition to financial measures prepared in accordance with generally accepted accounting principles (GAAP), this presentation also contains non-GAAP financial measures. The non-GAAP financial measures included in this presentation are not meant to be considered superior to or substitutes for results of operations prepared in accordance with GAAP. Forward Looking Statements and Non-GAAP Financial Information 2 |
|
|
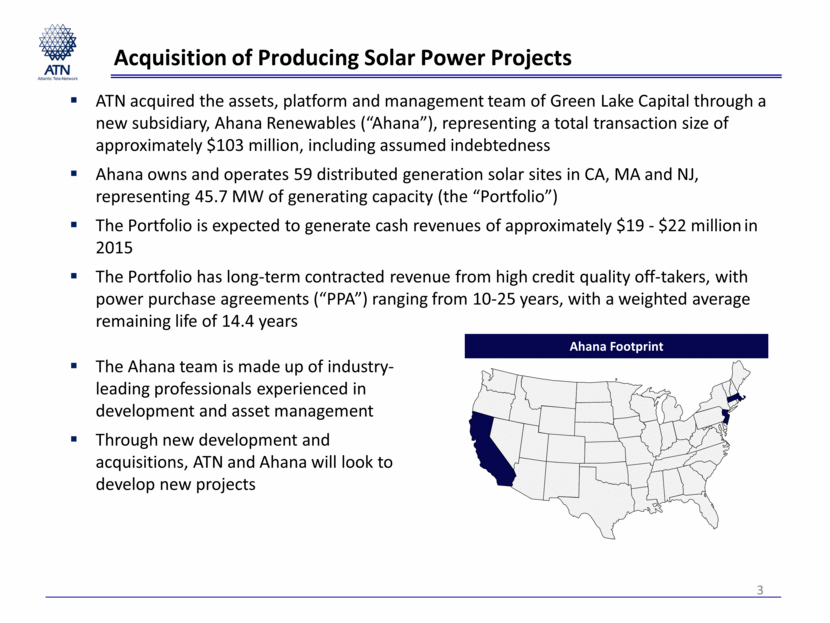
Acquisition of Producing Solar Power Projects 3 ATN acquired the assets, platform and management team of Green Lake Capital through a new subsidiary, Ahana Renewables (“Ahana”), representing a total transaction size of approximately $103 million, including assumed indebtedness Ahana owns and operates 59 distributed generation solar sites in CA, MA and NJ, representing 45.7 MW of generating capacity (the “Portfolio”) The Portfolio is expected to generate cash revenues of approximately $19 - $22 million in 2015 The Portfolio has long-term contracted revenue from high credit quality off-takers, with power purchase agreements (“PPA”) ranging from 10-25 years, with a weighted average remaining life of 14.4 years The Ahana team is made up of industry-leading professionals experienced in development and asset management Through new development and acquisitions, ATN and Ahana will look to develop new projects Ahana Footprint |
|
|
Strategic Rationale 4 Opportunity to enter high growth distributed solar power market at reasonable valuation Attractive risk adjusted returns Many parallels to ATN’s domestic wholesale wireless and fiber businesses Fragmented, fast moving market with potential advantages for well-funded platform Potential to leverage platform expertise to expand into high cost power markets ATN’s ability to utilize tax incentives may provide a competitive advantage over solar operators who require third-party tax investors |
|
|
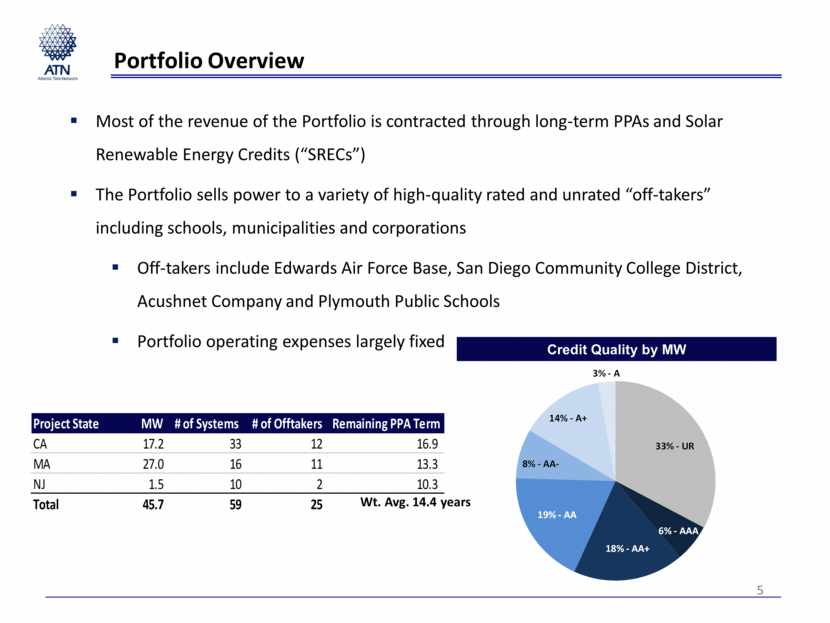
5 Portfolio Overview Credit Quality by MW Most of the revenue of the Portfolio is contracted through long-term PPAs and Solar Renewable Energy Credits (“SRECs”) The Portfolio sells power to a variety of high-quality rated and unrated “off-takers” including schools, municipalities and corporations Off-takers include Edwards Air Force Base, San Diego Community College District, Acushnet Company and Plymouth Public Schools Portfolio operating expenses largely fixed Wt. Avg. 14.4 years 33% - UR 6% - AAA 18% - AA+ 19% - AA 8% - AA - 14% - A+ 3% - A Project State MW # of Systems # of Offtakers Remaining PPA Term CA 17.2 33 12 16.9 MA 27.0 16 11 13.3 NJ 1.5 10 2 10.3 Total 45.7 59 25 |
|
|
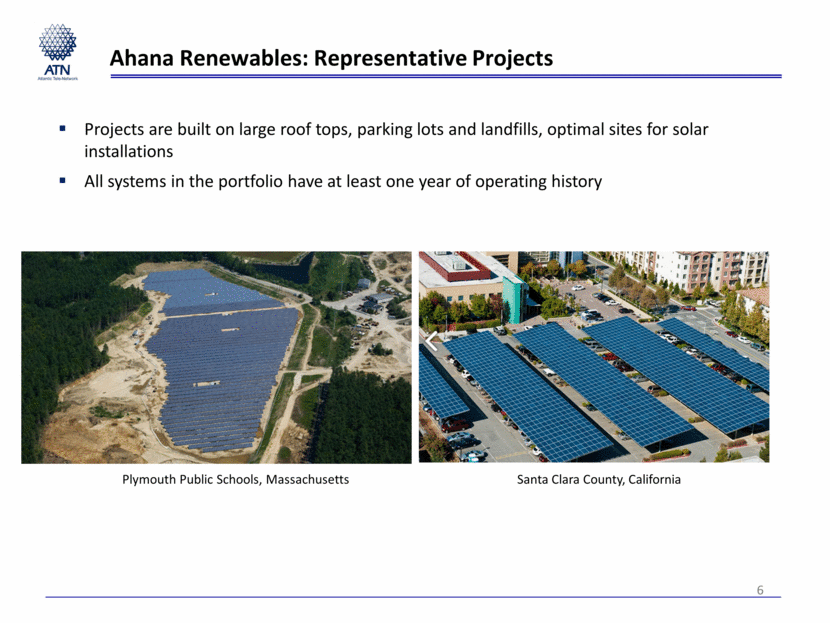
6 Ahana Renewables: Representative Projects Projects are built on large roof tops, parking lots and landfills, optimal sites for solar installations All systems in the portfolio have at least one year of operating history Plymouth Public Schools, Massachusetts Santa Clara County, California |
|
|
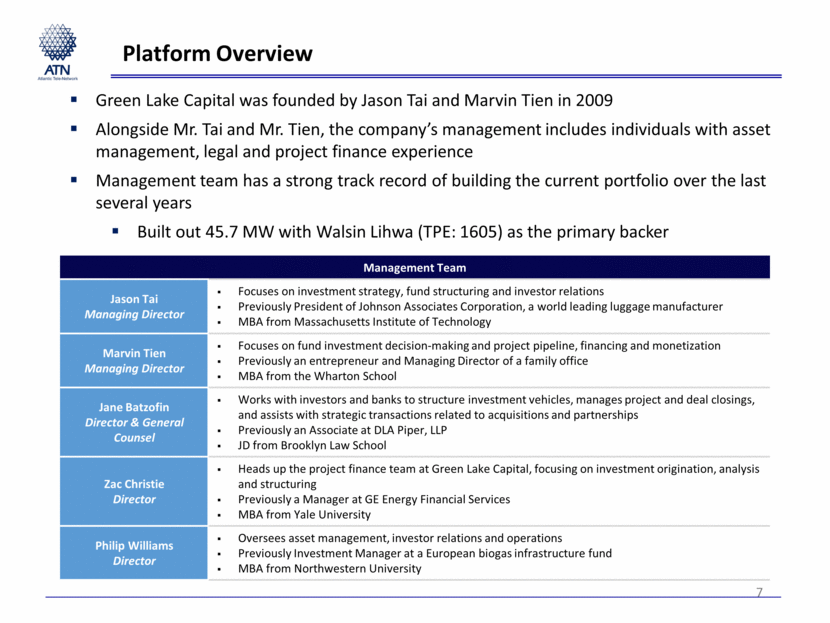
Platform Overview 7 Green Lake Capital was founded by Jason Tai and Marvin Tien in 2009 Alongside Mr. Tai and Mr. Tien, the company’s management includes individuals with asset management, legal and project finance experience Management team has a strong track record of building the current portfolio over the last several years Built out 45.7 MW with Walsin Lihwa (TPE: 1605) as the primary backer Management Team Jason Tai Managing Director Focuses on investment strategy, fund structuring and investor relations Previously President of Johnson Associates Corporation, a world leading luggage manufacturer MBA from Massachusetts Institute of Technology Marvin Tien Managing Director Focuses on fund investment decision-making and project pipeline, financing and monetization Previously an entrepreneur and Managing Director of a family office MBA from the Wharton School Jane Batzofin Director & General Counsel Works with investors and banks to structure investment vehicles, manages project and deal closings, and assists with strategic transactions related to acquisitions and partnerships Previously an Associate at DLA Piper, LLP JD from Brooklyn Law School Zac Christie Director Heads up the project finance team at Green Lake Capital, focusing on investment origination, analysis and structuring Previously a Manager at GE Energy Financial Services MBA from Yale University Philip Williams Director Oversees asset management, investor relations and operations Previously Investment Manager at a European biogas infrastructure fund MBA from Northwestern University |
|
|
8 Transaction Terms and Financial Reporting Total Transaction Value: approximately $103 million (excluding ATN transaction fees) Closed using approximately $64 million of cash and assumption of $39 million of debt Debt is floating rate, currently at average of about 5.25% to 5.5% with weighted average remaining term of approximately 6 years ATN and Ahana management team own 97% of Ahana Renewables Transaction expected to produce revenues of $19-22 million in 2015 with EBITDA margins of 70% to 75%, subject to final purchase accounting adjustments We will be reporting financial information as a new business segment within our SEC filings ATN has management control and will consolidate all entities Common to the industry, in addition to bank financing the projects were also financed with tax equity investors Due to tax equity structure, net income will be low in near term and increase as projects mature starting in mid 2016 |
|
|
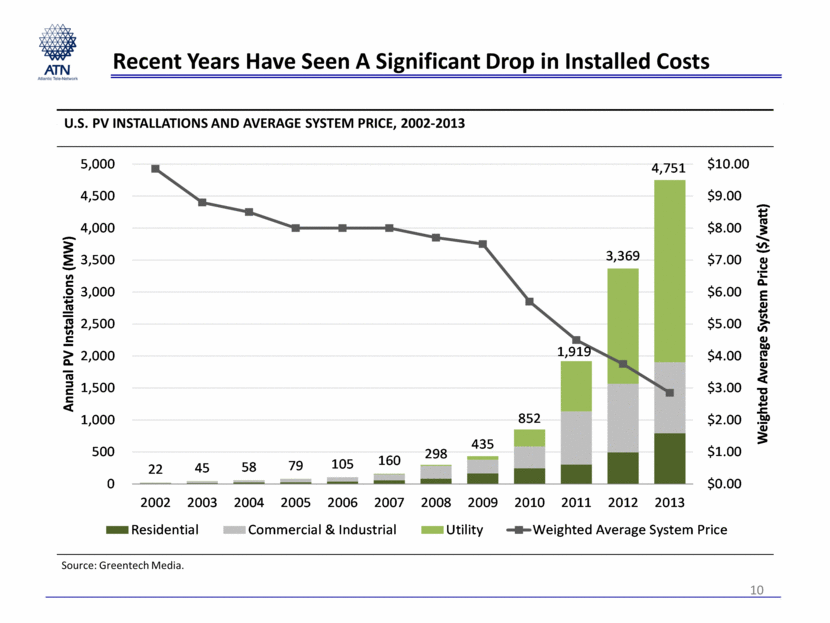
Industry Fundamentals 1. Solar power generation is a predictable cash flow business High capital expenditures: low ongoing operating expenses Contracted cash flows Very low churn Very predictable and consistent power production Proven technology 2. The potential market size for solar is large Capital expenditures are expected to grow at over 20% per year through 2016(1) Solar generation today represents less than 1% of U.S. power production 3. The solar distributed generation market is highly fragmented with many opportunities for consolidation 4. The industry is still emerging and changing rapidly and has risks associated with those factors 5. The growth in solar is driven by dramatic cost declines coupled with government incentives Costs have come down over 70% since 2002 Further declines expected as business continues to scale 6. With cost declines solar has attractive economics in many jurisdictions without subsidies In the West, Southwest and Northeast, solar is profitable with only the Federal ITC Continuing cost declines needed to make solar profitable with reduced ITC 9 Projected figures calculated as consensus estimates from Bloomberg, SEIA/GTM, Goldman Sachs and Deutsche Bank. |
|
|
Recent Years Have Seen A Significant Drop in Installed Costs U.S. PV INSTALLATIONS AND AVERAGE SYSTEM PRICE, 2002-2013 Source: Greentech Media. 10 22 45 58 79 105 160 298 435 852 1,919 3,369 4,751 $0.00 $1.00 $2.00 $3.00 $4.00 $5.00 $6.00 $7.00 $8.00 $9.00 $10.00 0 500 1,000 1,500 2,000 2,500 3,000 3,500 4,000 4,500 5,000 2002 2003 2004 2005 2006 2007 2008 2009 2010 2011 2012 2013 Weighted Average System Price ($/watt) Annual PV Installations (MW) Residential Commercial & Industrial Utility Weighted Average System Price |
|
|
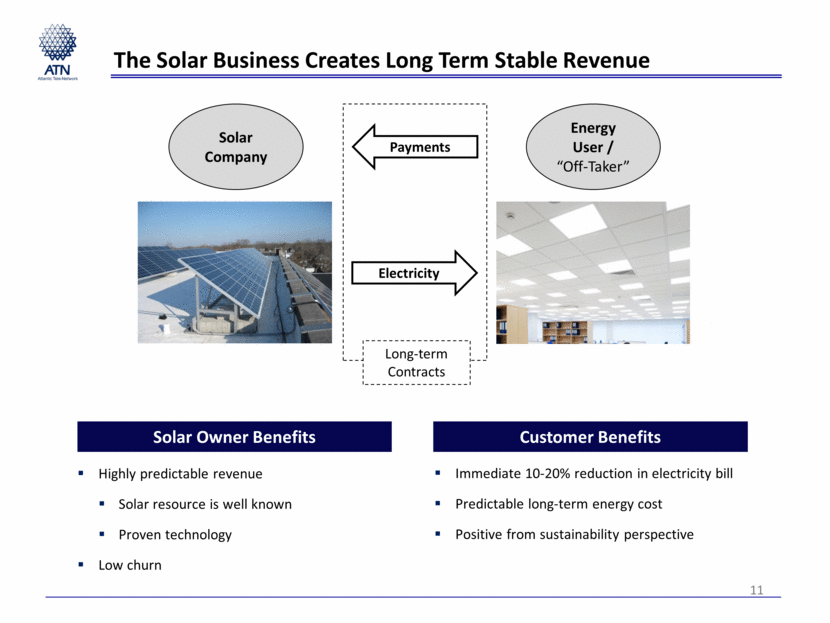
The Solar Business Creates Long Term Stable Revenue Customer Benefits Solar Owner Benefits Immediate 10-20% reduction in electricity bill Predictable long-term energy cost Positive from sustainability perspective Highly predictable revenue Solar resource is well known Proven technology Low churn Solar Company Energy User / “Off-Taker” Electricity Payments Long-term Contracts 11 |
|
|
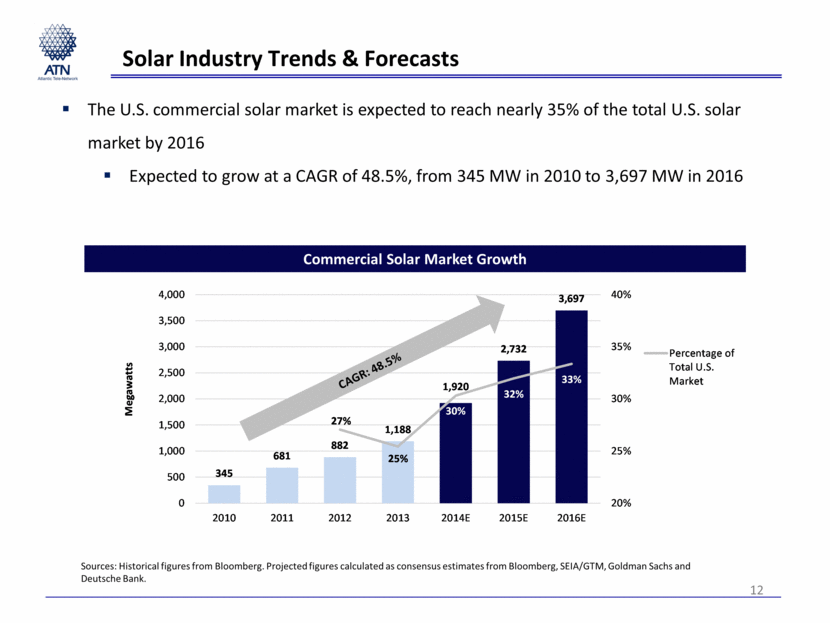
Solar Industry Trends & Forecasts 12 The U.S. commercial solar market is expected to reach nearly 35% of the total U.S. solar market by 2016 Expected to grow at a CAGR of 48.5%, from 345 MW in 2010 to 3,697 MW in 2016 Sources: Historical figures from Bloomberg. Projected figures calculated as consensus estimates from Bloomberg, SEIA/GTM, Goldman Sachs and Deutsche Bank. Commercial Solar Market Growth 345 681 882 1,188 1,920 2,732 3,697 27% 25% 30% 32% 33% 20% 25% 30% 35% 40% 0 500 1,000 1,500 2,000 2,500 3,000 3,500 4,000 2010 2011 2012 2013 2014E 2015E 2016E Megawatts Percentage of Total U.S. Market |
|
|
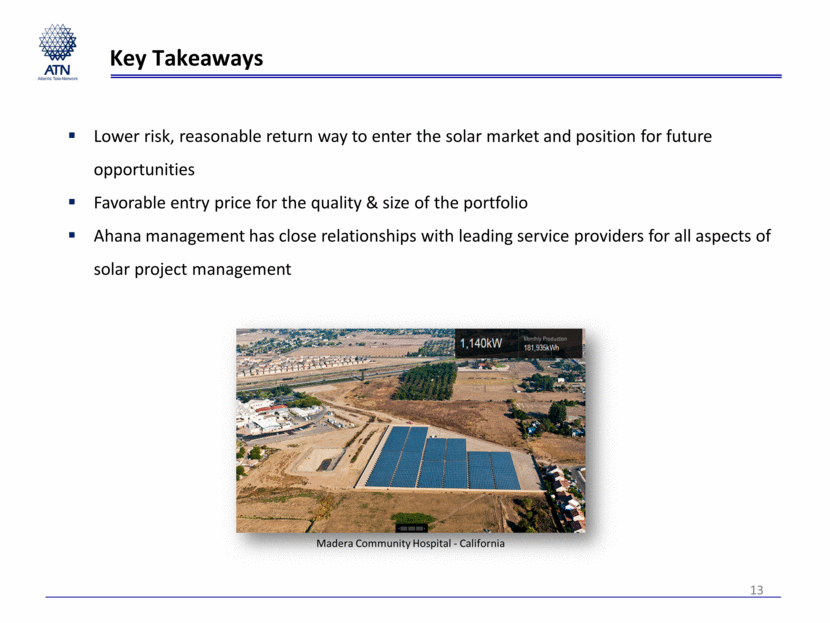
13 Key Takeaways Lower risk, reasonable return way to enter the solar market and position for future opportunities Favorable entry price for the quality & size of the portfolio Ahana management has close relationships with leading service providers for all aspects of solar project management Madera Community Hospital - California |
|
|
14 Q&A |

