Attached files
| file | filename |
|---|---|
| EX-4.5 - EX-4.5 - Black Knight, Inc. | d837244dex45.htm |
| EX-10.13 - EX-10.13 - Black Knight, Inc. | d837244dex1013.htm |
| EX-21.1 - EX-21.1 - Black Knight, Inc. | d837244dex211.htm |
| EX-10.8 - EX-10.8 - Black Knight, Inc. | d837244dex108.htm |
| EX-10.5 - EX-10.5 - Black Knight, Inc. | d837244dex105.htm |
| EX-10.12 - EX-10.12 - Black Knight, Inc. | d837244dex1012.htm |
| EX-10.6 - EX-10.6 - Black Knight, Inc. | d837244dex106.htm |
| EX-4.4 - EX-4.4 - Black Knight, Inc. | d837244dex44.htm |
| EX-3.1 - EX-3.1 - Black Knight, Inc. | d837244dex31.htm |
| EX-4.3 - EX-4.3 - Black Knight, Inc. | d837244dex43.htm |
| EX-10.7 - EX-10.7 - Black Knight, Inc. | d837244dex107.htm |
| EX-3.2 - EX-3.2 - Black Knight, Inc. | d837244dex32.htm |
| EX-23.1 - EX-23.1 - Black Knight, Inc. | d837244dex231.htm |
Table of Contents
As filed with the Securities and Exchange Commission on December 23, 2014
Registration No. 333-
UNITED STATES
SECURITIES AND EXCHANGE COMMISSION
Washington, D.C. 20549
FORM S-1
REGISTRATION STATEMENT
UNDER
THE SECURITIES ACT OF 1933
Black Knight Financial Services, Inc.
(Exact name of registrant as specified in its charter)
| Delaware | 7374 | 36-4798491 | ||
| (State or Other Jurisdiction of Incorporation or Organization) |
(Primary Standard Industrial Classification Code Number) |
(I.R.S. Employer Identification Number) |
601 Riverside Avenue
Jacksonville, Florida 32204
(904) 854-5100
(Address, Including Zip Code, and Telephone Number, Including Area Code, of Registrant’s Principal Executive Offices)
Michael L. Gravelle
Executive Vice President, General Counsel and Corporate Secretary
601 Riverside Avenue
Jacksonville, Florida 32204
(904) 854-5100
(Name, Address, Including Zip Code, and Telephone Number, Including Area Code, of Agent For Service)
Copies to:
| Alexander D. Lynch, Esq. Weil, Gotshal & Manges LLP 767 Fifth Avenue New York, New York 10153 (212) 310-8000 (Phone) (212) 310-8007 (Fax) |
Patrick S. Brown, Esq. Sullivan & Cromwell LLP 1888 Century Park East, Suite 2100 Los Angeles, California 90067 (310) 712-6600 (Phone) (310) 712-8800 (Fax) |
Approximate date of commencement of proposed sale to the public: As soon as practicable after the effective date of this Registration Statement.
If any of the securities being registered on this Form are to be offered on a delayed or continuous basis pursuant to Rule 415 under the Securities Act of 1933, check the following box. ¨
If this Form is filed to register additional securities for an offering pursuant to Rule 462(b) under the Securities Act, please check the following box and list the Securities Act registration statement number of the earlier effective registration statement for the same offering. ¨
If this Form is a post-effective amendment filed pursuant to Rule 462(c) under the Securities Act, check the following box and list the Securities Act registration statement number of the earlier effective registration statement for the same offering. ¨
If this Form is a post-effective amendment filed pursuant to Rule 462(d) under the Securities Act, check the following box and list the Securities Act registration statement number of the earlier effective registration statement for the same offering. ¨
Indicate by check mark whether the registrant is a large accelerated filer, an accelerated filer, a non-accelerated filer or a smaller reporting company. See the definitions of “large accelerated filer,” “accelerated filer” and “smaller reporting company” in Rule 12b-2 of the Exchange Act.
| Large accelerated filer | ¨ | Accelerated filer | ¨ | |||
| Non-accelerated filer | x | Smaller reporting company | ¨ | |||
CALCULATION OF REGISTRATION FEE
|
| ||||
| Title of Each Class of Securities to be Registered |
Proposed Maximum Aggregate Offering Price (1)(2) |
Amount of Registration Fee | ||
| Class A common Stock, $0.0001 par value per share |
$100,000,000 | $11,620 | ||
|
| ||||
|
| ||||
| (1) | Estimated solely for the purpose of calculating the registration fee in accordance with Rule 457(o) promulgated under the Securities Act. |
| (2) | Includes shares of Class A common stock that may be issuable upon exercise of an option to purchase additional shares granted to the underwriters. |
The Registrant hereby amends this Registration Statement on such date or dates as may be necessary to delay its effective date until the Registrant shall file a further amendment which specifically states that this Registration Statement shall thereafter become effective in accordance with Section 8(a) of the Securities Act or until the Registration Statement shall become effective on such date as the Commission, acting pursuant to said Section 8(a), may determine.
Table of Contents
The information in this prospectus is not complete and may be changed. We may not sell these securities until the registration statement filed with the Securities and Exchange Commission is effective. This prospectus is neither an offer to sell these securities nor a solicitation of an offer to buy these securities in any jurisdiction where the offer or sale is not permitted.
PRELIMINARY PROSPECTUS
SUBJECT TO COMPLETION, DATED DECEMBER 23, 2014
Shares

BLACK KNIGHT FINANCIAL SERVICES, INC.
Class A Common Stock
This is an initial public offering of shares of Class A common stock of Black Knight Financial Services, Inc. Black Knight Financial Services, Inc. is selling shares of Class A common stock.
Prior to this offering, there has been no public market for the Class A common stock. It is currently estimated that the initial public offering price per share of our Class A common stock will be between $ and $ . We intend to file an application for our Class A common stock to be listed on the New York Stock Exchange under the symbol “BKFS.”
Investing in our Class A common stock involves a high degree of risk. See “Risk Factors” beginning on page 25.
| Per Share | Total | |||||||
| Initial public offering price |
$ | $ | ||||||
| Underwriting discount |
$ | $ | ||||||
| Proceeds, before expenses, to us |
$ | $ | ||||||
To the extent that the underwriters sell more than shares of Class A common stock, the underwriters will have the option, for a period of 30 days from the date of this prospectus, to purchase up to additional shares of our Class A common stock at the initial public offering price, less the underwriting discount.
Neither the Securities and Exchange Commission nor any state securities commission has approved or disapproved of these securities or passed on the adequacy or accuracy of this prospectus. Any representation to the contrary is a criminal offense.
The underwriters expect to deliver the shares of Black Knight Financial Services, Inc.’s Class A common stock to investors on or about , 2015.
Prospectus dated , 2015
Table of Contents
| Page | ||||
| 1 | ||||
| 25 | ||||
| 47 | ||||
| 48 | ||||
| 56 | ||||
| 57 | ||||
| 58 | ||||
| 59 | ||||
| 61 | ||||
| Selected Historical Combined Financial Data of Commerce Velocity and Property Insight |
64 | |||
| 65 | ||||
| Management’s Discussion and Analysis of Financial Condition and Results of Operations |
80 | |||
| 111 | ||||
| 125 | ||||
| 133 | ||||
| 153 | ||||
| 155 | ||||
| 160 | ||||
| 165 | ||||
| Material U.S. Federal Income Tax Considerations for Non-U.S. Holders |
167 | |||
| 171 | ||||
| 177 | ||||
| 177 | ||||
| 177 | ||||
| F-1 | ||||
Neither we (or any of our affiliates), nor the underwriters have authorized anyone to provide any information other than that contained in this prospectus or in any free writing prospectus prepared by or on behalf of us or to which we have referred you. Neither we nor the underwriters take any responsibility for, and can provide no assurance as to the reliability of, any other information that others may give you. We are not and the underwriters are not, making an offer to sell these securities in any jurisdiction where the offer or sale is not permitted. You should assume that the information appearing in this prospectus and any free writing prospectus is only accurate as of its date. Our business, financial condition, results of operations and prospects may have changed since that date.
Table of Contents
BASIS OF PRESENTATION OF FINANCIAL INFORMATION
Prior to this offering, we conducted our business through Black Knight Financial Services, LLC, a Delaware limited liability company, and its subsidiaries. Prior to the consummation of this offering, Black Knight Financial Services, LLC will enter into a corporate reorganization, whereby certain indirect holders of membership interests of Black Knight Financial Services, LLC will become stockholders of Black Knight Financial Services, Inc., a Delaware corporation and the registrant. See “Our Corporate Structure.” Except as disclosed in this prospectus, the consolidated financial statements, selected historical consolidated financial data, unaudited pro forma condensed combined financial data and other financial information included in this prospectus are those of Black Knight Financial Services, LLC and its consolidated subsidiaries, or its predecessor, and do not give effect to the corporate reorganization that will be effected in connection with the offering contemplated by this prospectus. Shares of Class A common stock of Black Knight Financial Services, Inc. are being offered by this prospectus. Prior to the corporate reorganization and this offering, Black Knight Financial Services, Inc. held no material assets and did not engage in any operations.
TRADEMARKS, SERVICE MARKS AND TRADE NAMES
We own or have the rights to use various trademarks, service marks and trade names referred to in this prospectus. Solely for convenience, we refer to trademarks, service marks and trade names in this prospectus without the ™, SM and ® symbols. Such references are not intended to indicate, in any way, that we will not assert, to the fullest extent permitted by law, our rights to our trademarks, service marks and trade names. Other trademarks, service marks or trade names appearing in this prospectus are the property of their respective owners.
CERTAIN DEFINITIONS
Unless otherwise expressly indicated in this prospectus or the context otherwise requires:
| • | references to “BKFS” and the “issuer” refer to Black Knight Financial Services, Inc., a newly formed Delaware corporation, and not to any of its subsidiaries; |
| • | references to the “company,” “we,” “us” and “our” and similar terms (i) when used in the context of the periods following the completion of this offering refer to BKFS and its consolidated subsidiaries, including BKFS Operating LLC (defined below), (ii) when used in the context of the periods prior to the completion of this offering but following the Acquisition (defined below) refer to BKFS Operating LLC and its consolidated subsidiaries and (iii) when used in the context of periods prior to the Acquisition refer to that portion of the business of our predecessor, LPS (defined below), that was contributed to us in connection with the Internal Reorganization (defined below); |
| • | references to “BKFS Operating LLC” refer to Black Knight Financial Services, LLC, a Delaware limited liability company, which, together with its subsidiaries, conducts all of our business operations; |
| • | references to “FNF” refer to Fidelity National Financial, Inc., a Delaware corporation; |
| • | references to “BKHI” refer to Black Knight Holdings, Inc., a Delaware corporation and wholly-owned subsidiary of FNF; |
| • | references to “BKIS” refer to Black Knight InfoServ, LLC, a Delaware limited liability company and wholly-owned subsidiary of BKFS Operating LLC; |
| • | references to “LPS” refer to Lender Processing Services, Inc., our predecessor, a Delaware corporation that was converted into a Delaware limited liability company and renamed Black Knight InfoServ, LLC on January 3, 2014, in connection with the Internal Reorganization (defined below); |
| • | references to “THL” refer to Thomas H. Lee Partners, L.P., a Delaware limited partnership; |
ii
Table of Contents
| • | references to “THL Affiliates” collectively refer to THL Equity Fund VI Investors (BKFS-NB), LLC, a Delaware limited liability company, THL Equity Fund VI Investors (BKFS-LM), LLC, a Delaware limited liability company, THL Equity Fund VI Investors (BKFS) III, L.P., a Delaware limited partnership, THL Equity Fund VI Investors (BKFS), L.P., a Delaware limited partnership, THL Equity Fund VI Investors (BKFS) II, L.P., a Delaware limited partnership, Thomas H. Lee Equity Fund VI, L.P., a Delaware limited partnership, Thomas H. Lee Parallel Fund VI, L.P., a Delaware limited partnership, and Thomas H. Lee Parallel (DT) Fund VI, L.P., a Delaware limited partnership, THL Coinvestment Partners, L.P., a Delaware limited partnership, THL Operating Partners, L.P., a Delaware limited partnership, Great-West Investors, L.P., a Delaware limited partnership and Putnam Investments Employees’ Securities Company III, LLC, a Delaware limited liability company; |
| • | references to “THL Intermediaries” refer to THL Black Knight I Holding Corp. and THL Investors Black Knight I Holding Corp., each of which is a Delaware corporation and an affiliate of THL, formed for the purpose of holding investments in BKFS Operating LLC; |
| • | references to “THL Managers LLC” refer to THL Managers VI, LLC, a Delaware limited liability company and an affiliate of THL; |
| • | references to “Commerce Velocity” refer to Fidelity National Commerce Velocity, LLC, a Delaware limited liability company; |
| • | references to “Property Insight” refer to Property Insight, LLC, a California limited liability company; |
| • | references to the “Acquisition” refer to the acquisition of LPS by FNF on January 2, 2014; |
| • | references to the “Internal Reorganization” refer to the series of transactions following the acquisition of LPS by FNF pursuant to which, ultimately, (i) LPS was converted into a limited liability company and became BKIS; (ii) BKFS Operating LLC acquired all of the membership interests of BKIS; (iii) the former Transaction Services businesses of LPS were transferred by BKIS to BKHI and contributed by BKHI to another of its then wholly-owned subsidiaries or to another subsidiary of FNF; (iv) THL acquired membership interests in BKFS Operating LLC; and (v) all of the outstanding membership interests of Commerce Velocity were contributed by BKHI to BKFS Operating LLC; |
| • | references to the “Commerce Velocity Contribution” refer to the contribution by BKHI of all of the outstanding membership interests of Commerce Velocity to BKFS Operating LLC on January 3, 2014; |
| • | references to the “Property Insight Contribution” refer to the contribution by two wholly-owned subsidiaries of FNF of their respective interests in Property Insight to BKFS Operating LLC on June 2, 2014; and |
| • | references to the “Internal Reorganization Transactions” refer to the Acquisition, the Internal Reorganization and the Property Insight Contribution, collectively. |
See the section entitled “Our Corporate Structure” for more information.
MARKET AND INDUSTRY DATA
Market and industry data used throughout this prospectus, including information relating to our relative position in the U.S. mortgage servicing market, is based on the good faith estimates of our management, which in turn are based upon our management’s review of internal surveys, surveys commissioned by us, independent industry surveys and publications and other publicly available information prepared by third parties. Publicly available information relied upon was primarily prepared by the Mortgage Bankers Association, or MBA (www.mbaa.org), National Mortgage News, a weekly newspaper which services the mortgage industry (www.mortgagestats.com), the BKFS Mortgage Monitor report, a product of our own Data and Analytics segment, which is frequently quoted by public real estate and financial institutions, or the Board of Governors of
iii
Table of Contents
the Federal Reserve System of the United States, or the Fed (www.federalreserve.gov). Information regarding the largest loan originators and loan servicers was obtained from National Mortgage News and is used herein to comment on our client relationships with large market participants. All of the market data and industry information used in this prospectus involves a number of assumptions and limitations, and you are cautioned not to give undue weight to such estimates. Although we believe that these sources are reliable, neither we nor the underwriters have independently verified this information. While we believe the estimated market position, market opportunity and market size information included in this prospectus is generally reliable, such information, which in part is derived from management’s estimates and beliefs, is inherently uncertain and imprecise.
Projections, assumptions and estimates of our future performance and the future performance of the industry in which we operate are subject to a high degree of uncertainty and risk due to a variety of factors, including those described in “Risk Factors,” “Forward-Looking Statements” and elsewhere in this prospectus. These and other factors could cause results to differ materially from those expressed in our estimates and beliefs and in the estimates prepared by independent parties.
iv
Table of Contents
This summary highlights information appearing elsewhere in this prospectus. This summary is not complete and does not contain all of the information that you should consider before making a decision to participate in the offering. You should carefully read the entire prospectus, including the information presented under “Risk Factors,” “Selected Historical Consolidated Financial Data,” “Unaudited Pro Forma Condensed Combined Financial Data” and the historical financial statements and related notes presented elsewhere in this prospectus.
Our Company
We are a leading provider of integrated technology, workflow automation and data and analytics to the mortgage industry. Our solutions facilitate and automate many of the mission-critical business processes across the entire mortgage loan life cycle, from origination until asset disposition. We believe we differentiate ourselves by the breadth and depth of comprehensive, integrated solutions and the insight we provide to our clients.
We have market leading positions in mortgage processing and technology solutions combined with comprehensive real estate data and extensive analytic capabilities. Our solutions are utilized by 21 of the 25 largest U.S. mortgage originators and all of the 25 largest U.S. mortgage servicers, as well as other financial institutions, investors and real estate professionals, to support mortgage lending and servicing operations, analyze portfolios and properties, operate more efficiently, meet regulatory compliance requirements and mitigate risk.
The U.S. mortgage market is a large market. According to the Fed, U.S. total mortgage debt outstanding is approximately $9.9 trillion as of September 2014, while total U.S. mortgage originations are expected to exceed $1.1 trillion in 2014, according to the MBA.
The U.S. mortgage market is undergoing significant change and mortgage market participants have been subjected to more stringent oversight in recent years. Regulators have increasingly focused on better disclosure, improved risk mitigation and enhanced oversight. Mortgage lenders large and small have experienced higher costs in order to comply with this higher level of regulation. Despite these new regulatory burdens, the mortgage industry remains a competitive marketplace with numerous large lenders and smaller institutions competing for new loan originations. In order to comply with this increased regulatory burden and compete more effectively, mortgage market participants have continued to outsource mission-critical functions to third-party technology providers that can offer economical solutions due to their economies of scale.
We believe our comprehensive end-to-end, integrated solutions differentiate us from other technology providers serving the mortgage industry and positions us particularly well for evolving opportunities in this market. We have exclusively served the mortgage and real estate industries for over 50 years and utilize this experience to design and develop solutions that fit our clients’ ever-evolving needs. Our proprietary technology platforms and data and analytics capabilities reduce manual processes, improve compliance and quality, mitigate risk and deliver significant cost savings to our clients. Our scale allows us to continually and cost-effectively invest in our business in order to meet evolving industry requirements and maintain our position as an industry-standard platform for mortgage market participants. Our proprietary technology platform services more than 50% of all U.S. first lien mortgages based on the number of U.S. first lien mortgages according to the BKFS Mortgage Monitor Report, reflecting our leadership in the mortgage servicing market, and our market share has grown by more than four percentage points over the last five years.
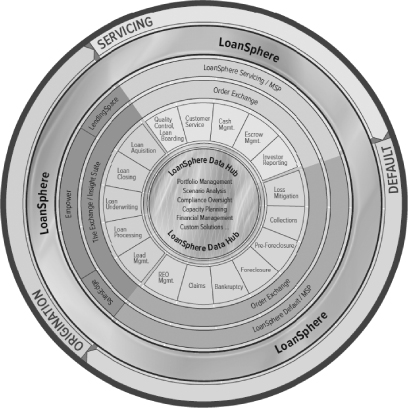
Capitalizing on our leadership position, we have launched an innovative product and delivery strategy, called LoanSphere, which provides a workflow management application designed to streamline and automate business processes across the mortgage loan life cycle. Some solutions have already been delivered under LoanSphere, and we are focused on providing integration and automation in all of the solutions we offer.
1
Table of Contents
Our business is organized into two segments:
| • | Technology—offers software and hosting solutions that support loan servicing, which includes the core mortgage servicing, specialty mortgage servicing including loss mitigation and default workflow management, loan origination and settlement services. |
| • | Data and Analytics—offers solutions to enhance and support our technology products in the mortgage, real estate and capital markets industries. These solutions include property ownership data, lien data, servicing data, automated valuation models, collateral risk scores, prepayment and default models, lead generation and other data solutions. |
We offer our solutions to a wide range of clients across the mortgage industry. The quality and breadth of our solutions contributes to the long-standing nature of our relationships with our clients, the majority of whom enter into long-term contracts across multiple products that are embedded in their mission critical workflow and decision processes. Given the contractual nature of our revenues and stickiness of our client relationships, our revenues are highly visible and recurring in nature. Due to our integrated suite of solutions and our scale in the mortgage market, we are able to drive significant operating leverage, which we believe enables our clients to operate more efficiently while allowing us to generate strong margins and cash flow.
Our Industry
The U.S. mortgage market is large and the loan life cycle is complex and consists of several stages. The total U.S. mortgage debt outstanding is approximately $9.9 trillion as of September 2014 according to the Fed. The mortgage loan life cycle includes origination, servicing and default. Mortgages are originated through home purchases or refinancings of existing mortgages. Once the mortgage is originated, it is serviced on a periodic basis by mortgage servicers, which may not be the lenders that originated the mortgage. Furthermore, if a mortgage goes into default, it triggers a set of multifaceted processes with an assortment of potential outcomes depending on a mix of variables.
Underlying the three major components of the mortgage loan life cycle is the technology and data and analytics support behind each process, which has become increasingly critical to industry participants. As the industry has grown in complexity, participants have responded by outsourcing to large scale specialty providers, automating manual processes and seeking end-to-end solutions that support the processes required to manage the entire mortgage loan life cycle.
Overview of the Mortgage Origination Market
The U.S. mortgage origination market consists of both purchase and refinance originations. According to the MBA Mortgage Finance Forecast as of November 19, 2014, the U.S. mortgage origination market is expected to be approximately $1.1 trillion in 2014. Factors that impact this market include unemployment, house prices, interest rates and other general economic factors. The mortgage origination process is complex and involves multiple parties, significant data exchange and significant regulatory oversight, which requires scale and substantial industry experience. As a result, the ten largest originators are expected to represent approximately 53% of the annual origination volume in 2014 according to National Mortgage News.
Overview of the Mortgage Servicing Market
The U.S. mortgage servicing market is comprised of first and second lien mortgage loans. The first lien mortgage market represents approximately 50 million mortgage loans according to the BKFS Mortgage Monitor with an outstanding balance of approximately $9.2 trillion. According to the Fed, the second lien mortgage market represents approximately 18 million mortgage loans with an outstanding balance of approximately $0.7 trillion. Many of these second lien mortgages were historically originated and serviced by banks. It is our experience that the factors that impact the mortgage servicing market include population, housing inventory stock, health of the overall economy and availability of credit.
2
Table of Contents
Since 1990, the first lien mortgage servicing market has grown from 18 million loans to 50 million loans, representing a compound annual growth rate of more than four percent according to the MBA. Even through previous downturns, the mortgage servicing market has generally remained stable, as the total number of mortgage loans outstanding tends to stay more constant than mortgage originations. For example, despite the most recent housing downturn, the total number of first lien mortgages outstanding today is approximately 10% higher than at the end of 2004. The mortgage servicing market is concentrated, with the ten largest servicers representing approximately 70% of the total market as of June 30, 2014 according to National Mortgage News.
While delinquent mortgages typically represent a small portion of the overall loan servicing market, the mortgage default process is long and complex and involves multiple parties, a significant exchange of data and documentation and extensive regulatory requirements. Providers to the default process must be able to meet strict regulatory guidelines, which are best met through the use of technology.
Recent Trends in the Mortgage Industry
The U.S. mortgage market has seen significant change over the past few years and is expected to continue to evolve going forward. Increased origination volatility and key regulatory actions arising from the recent financial crisis, such as the Dodd-Frank Wall Street Reform and Consumer Protection Act, or the Dodd-Frank Act, and the establishment of the Consumer Financial Protection Bureau, or the CFPB, impose new and evolving standards for market participants. These regulatory changes have spurred lenders and servicers to seek technology solutions that facilitate compliance obligations in the face of a changing regulatory environment while remaining efficient and profitable.
| • | Increased regulation. Most U.S. mortgage market participants have become subject to increasing regulatory oversight and regulatory requirements as federal and state governments have enacted various new laws, rules and regulations. One example of such legislation is the Dodd-Frank Act, which contains broad changes for many sectors of the financial services and lending industries and established the CFPB, a new federal regulatory agency responsible for regulating consumer financial protection within the United States. It is our experience that mortgage lenders have become more focused on the risk of non-compliance with these evolving regulations and are focused on technologies and solutions that help them to comply with the increased regulatory oversight and burdens. |
| • | Lenders increasingly focused on core operations. As a result of increased volatility in originations, greater regulatory scrutiny and the higher cost of doing business, we believe lenders have become increasingly focused on their core operations and customers. We believe lenders are increasingly shifting from affiliate business models and in-house technologies to solutions with third-party providers who can provide better technology and services more efficiently. Lenders require these vendors to provide best-in-class technology and management teams and to assist them in maintaining regulatory compliance. We believe that very few of these providers have the scale and regulatory infrastructure to meet both the technological efficiency and high regulatory standards that lenders require. |
| • | Growing role of technology in the U.S. mortgage industry. Banks and other lenders and servicers have become increasingly focused on technology automation and workflow management to operate more efficiently and meet their regulatory guidelines. We believe that vendors must be able to support the complexity in the market, display extensive industry knowledge and possess the financial resources to make the necessary investments in technology to support lenders. |
| • | Increased demand for enhanced transparency and analytic insight. As U.S. mortgage market participants work to minimize the risk in lending, servicing and capital markets, they increasingly rely on data and analytics to integrate with technologies that enhance the decision making process. These industry participants rely on large historical databases coupled with enhanced analytics to achieve these goals. |
3
Table of Contents
Our Solutions
Our solutions provide U.S. mortgage industry participants with a comprehensive integrated technology and work flow management solution set that is supported by what we believe is industry-leading data and analytics to enhance capabilities and drive efficiencies while assisting our clients in maintaining regulatory compliance.
Technology Solutions
Our Technology segment offers leading software and hosting solutions that facilitate and automate many of the business processes across the life cycle of a mortgage. These solutions primarily consist of mortgage origination, processing and workflow management software applications coupled with related support and services.
Our clients in this segment are primarily mortgage lenders and servicers. We believe they use our technology and services to reduce their operating costs, improve their ability to provide superior customer service and enhance the quality and consistency of various aspects of their mortgage operations. We continually work with our clients to enhance and integrate our software and services in order to assist them in gaining the greatest value from the solutions we provide.
The primary applications and services within our Technology segment are as follows:
| • | Servicing Technology. Our mortgage servicing platform, MSP, is a software-as-a-service, or SaaS, application that automates loan servicing, including loan setup and ongoing processing, customer service, accounting and reporting to the secondary mortgage market, and investor reporting. MSP serves as a core application and database of record for non-delinquent first and second lien mortgages. |
When a bank hires us to process its mortgage portfolio, we provide a hosted software solution and system support personnel whose role is to ensure our system remains up and running 24 hours a day, seven days a week; to monitor our programs and interfaces effectively; to make system and application changes as necessary; and to assist our clients in becoming or remaining compliant with applicable regulations.
LoanSphere Foreclosure and LoanSphere Bankruptcy are solutions that optimize default service processes. These applications leverage a workflow engine that utilizes sophisticated rules based functionality, can be configured to conform to existing servicer business practices and initiate tasks based on servicer milestones for foreclosure and bankruptcy. We also offer LoanSphere Invoicing, a sophisticated web-based solution designed to enhance the efficiency of processing default-related invoices by incorporating leading-edge technology to standardize and streamline every aspect of the billing and invoice process.
| • | Origination Technology. We offer two solutions that automate and facilitate the origination of mortgage loans in the United States: Empower, which supports retail and wholesale loan originations, and LendingSpace, which supports correspondent loan originations, which are originations that are funded by one lender, who sells the loan to another lender to service the loan or sell it on the secondary market. Our loan origination technologies are continuously enhanced to meet changing regulatory requirements, and are used to improve loan quality and store documents and images. |
We also offer the RealEC Exchange and the Insight suite of solutions. The RealEC Exchange is a platform that provides a fully interconnected network of originators, agents, settlement services providers and investors in the United States. This secure and integrated one-to-many platform allows lenders and their service providers to connect and do business electronically. Our Insight suite of solutions is integrated with the RealEC Exchange and is designed to help lenders meet loan quality and disclosure requirements established by the government-sponsored enterprises, or GSEs, CFPB, and Federal Housing Finance Agency, or FHFA.
4
Table of Contents
We build all of our technology platforms to be scalable, secure, flexible, standards-based, and web connected for easy use by our clients. Further, we have a history of being able to bring solutions to market quickly due to investments that we have made in integrating our technology and development processes.
Data and Analytics Solutions
Our Data and Analytics segment supports and enhances our technology solutions, and is designed to help lenders and servicers make more informed decisions, improve performance, identify and predict risk and generate more qualified leads. We believe that we have aggregated the largest residential real estate data set in the United States that is derived from both proprietary and public data sources. Our data set is comprised of data from servicers, our core first lien portfolio, home equity data, public records and the Multiple Listing Service, or MLS listings. Utilizing this data, subject to any applicable use restrictions, and our deep history and understanding of the mortgage market, we have created detailed real estate data solutions that assist in portfolio management, valuations, property records, lead generation and improved risk analysis for all aspects of origination, servicing, default and capital markets/investing.
Our primary data and analytics services are as follows:
| • | Property, Mortgage Performance Data and MLS. We make our real estate database available to our clients in a standard, normalized format. We also provide tax status data on properties and offer a number of value-added analytic services designed to enable our clients to utilize our data to assess and mitigate risk, determine property values, track market performance and generate leads. We also provide a MLS system to large MLS groups in the U.S. |
| • | Mortgage and Real Estate Analytics. We offer a broad range of property valuation services that allow our clients to analyze the value of underlying properties. These include, among others, automated valuation models, collateral risk scores, appraisal review services and valuation reconciliation services. To deliver these services, we utilize proprietary algorithms, detailed real estate statistical analysis and modified physical property inspections. These offerings are designed to reduce risk in origination, servicing and default transactions as well as aid investors in analysis of property and real estate assets. The offering can be tailored depending upon client needs and any regulatory requirements. |
Integrated Platform
We have launched an innovative product and delivery strategy, called LoanSphere, which we believe is the mortgage industry’s only end-to-end integrated technology platform. LoanSphere will deliver business process automation, workflow, rules, integration, data and a common user experience across technologies that support the entire lending life cycle from prospecting until asset disposition.
We believe the innovative LoanSphere platform will seamlessly integrate our industry-leading applications for originations, servicing, default and data and analytics. In the future LoanSphere will feature a centralized database for client’s loan data and documents, as well as client-selected industry data and analytics to enable powerful decision-making, improved loan and portfolio analysis and reduced risk.
5
Table of Contents
Delivered in phases, with many capabilities currently available, we believe LoanSphere enables clients to realize greater efficiencies, better manage risk and achieve greater financial results.
Our Competitive Strengths
We believe that our competitive strengths include the following:
| • | Market leadership with comprehensive and integrated solutions. We are a leading provider of comprehensive and integrated solutions to the mortgage industry. We have significant relationships with 21 of the top 25 largest mortgage originators and all of the top 25 largest U.S. mortgage servicers, service over 50% of all U.S. first lien mortgages and operate one of the industry’s largest exchanges connecting originators, agents, settlement services providers and investors. We believe our leadership position is, in part, the result of our unique expertise and insight developed from over 50 years serving the needs of customers in the mortgage industry. We have used this insight to develop an integrated and comprehensive suite of proprietary technology, data, and analytics solutions to automate many of the mission-critical business processes across the entire mortgage loan life cycle. These integrated solutions are designed to reduce manual processes, assist in improving organizational compliance and mitigating risk, and ultimately deliver significant cost savings to our clients. |
| • | Broad and deep client relationships with significant recurring revenue. We have deep and long-standing relationships with our largest clients. Our average relationship with our top 10 servicer clients is over 25 years, and these clients utilize an average of 6 products across our comprehensive solutions. We typically enter into long-term contracts with our clients and our products are typically embedded within our clients’ mission-critical workflow and decision processes across various parts of their |
6
Table of Contents
| organizations. As a result, we have developed recurring and sticky relationships with our clients. For example, the clients representing 95% of our 2013 revenue continued to be our clients in 2014. Given these deep relationships, we believe that we are well-positioned to continue to develop and cross-sell new products and services that will meet the evolving needs of the mortgage industry. |
| • | Extensive data assets and analytics capabilities. We develop and maintain large, accurate and comprehensive data sets on the mortgage and housing industry that we believe are competitively differentiated. Our unique data sets provide a combination of public and proprietary data in real-time and each of our data records feature a large number of attributes. Our data scientists utilize our data sets, subject to any applicable use restrictions, and comprehensive analytical capabilities to create highly customized reports, including models of customer behavior for originators and servicers, portfolio analytics for capital markets and government agencies and proprietary market insights for real estate agencies. Our data and analytics capabilities are also embedded into our technology platform and workflow products, providing our clients with integrated and comprehensive solutions. |
| • | Scalable and cost effective operating model. We believe we have a highly attractive and scalable operating model derived from our market leadership, hosted technology platforms and the large number of clients we serve across the mortgage industry. Our scalable operating model provides us with significant benefits. Our scale and operating leverage allows us to add incremental clients to our existing platforms with limited incremental cost. As a result, our operating model drives attractive margins and generates significant cash flow. Also, by leveraging our scale and leading market position, we are able to make cost effective investments in our technology platform to meet evolving regulatory and compliance requirements, further increasing our value proposition to clients. |
| • | World class management team with depth of experience and track record of success. Our management team has an average of over 20 years of experience in the banking technology and mortgage processing industries and a proven track record of strong execution capabilities. Following the Acquisition, we have significantly improved our operations and enhanced our go-to-market strategy, further integrated our technology platforms, expanded our data and analytics capabilities and introduced several new innovative products. We executed all of these projects while delivering attractive revenue growth and strong profitability. |
Our Growth Strategy
Our comprehensive and integrated technology platforms, robust data and analytic capabilities, differentiated business model and other competitive strengths enable us to pursue multiple growth opportunities. We intend to continue to expand our business and grow through the following key strategies:
| • | Further penetration of our solutions with existing clients. We believe our established client base presents a substantial opportunity for growth. We seek to capitalize on the trend of standardization and increased adoption of leading third-party solutions and increase the number of solutions provided to our existing client base. We intend to broaden and deepen our client relationships by cross-selling our suite of end-to-end technology solutions, as well as our robust data and analytics. We have established incentives within our sales force, as well as a core team of account managers, to encourage cross-selling of our full range of solutions to our existing clients. By helping our clients understand the full extent of our comprehensive solutions and the value of leveraging the multiple solutions that we offer, we believe we can expand our existing relationships by freeing our clients to focus on their core businesses and their customers. |
| • | Win new clients in existing markets. We intend to attract new clients in the mortgage industry by leveraging the value proposition provided by our technology platform and comprehensive solutions |
7
Table of Contents
| offering. In particular, we believe there is a significant opportunity to penetrate the underserved mid-tier mortgage originators and servicers market. We believe that these institutions can benefit from our proven solutions suite in order to address increasingly complex regulatory requirements and compete more effectively in the evolving mortgage market. We intend to continue to pursue this channel and benefit from the low incremental cost of adding new customers to our scaled technology infrastructure. |
| • | Continued innovation and expansion of new solutions. Our long-term vision is to be the industry leading provider for participants of the mortgage industry for their platform, data, and analytic needs. We intend to enhance what we believe is a leadership position in the industry by continuing to innovate our solutions and refine the insight we provide to our clients. We have a strong track record of introducing and developing new solutions that span the mortgage loan life cycle, are tailored to specific industry trends and that enhance our clients’ core operating functions. By working in partnership with key clients, we have been able to develop and market new and advanced solutions to our client base that meet the evolving demands of the mortgage industry. In addition, we will continue to develop and leverage insights from our large public and proprietary data assets to further improve our customer value proposition. |
| • | Powerful focus and dedication to staying up-to-date with regulatory requirements. We have dedicated significant technological and management resources to build and maintain a regulatory infrastructure and human capital base to assist our clients with increased regulatory oversight and requirements. We are able to leverage our consistent investment in this area through our SaaS technology solutions and our market-leading scale. We intend to continue our strategy of building and investing in solutions that help our clients with the regulatory environment. |
| • | Selectively pursue strategic acquisitions. The core focus of our strategy is to grow organically. However, we may selectively evaluate strategic acquisition opportunities that may allow us to expand our footprint, broaden our client base and deepen our product and service offerings. We believe that there are meaningful synergies that result from acquiring small companies that provide best-of-breed single point solutions. The potential revenue synergies would result from integrating and cross-selling these point solutions into our broader client base and cost synergies would result from integrating acquisitions into our efficient operating environment. |
History and Corporate Structure
History
Acquisition of LPS by FNF and Subsequent Reorganization
On January 2, 2014, FNF acquired LPS, and as a result, LPS became an indirect, wholly-owned subsidiary of FNF. Upon the closing of the transaction, the shares of LPS common stock, which previously traded under the ticker symbol “LPS” on the New York Stock Exchange, or the NYSE, ceased trading on, and were delisted from, the NYSE.
On January 3, 2014, pursuant to the Internal Reorganization, substantially all of the former Technology, Data and Analytics segment of LPS was transferred to us and the former Transaction Services businesses of LPS were transferred by BKIS to BKHI and contributed by BKHI to another of its then wholly-owned subsidiaries or to another subsidiary of FNF.
Also, on January 3, 2014, BKHI contributed Commerce Velocity, a former indirect subsidiary of FNF that had been contributed to BKHI in December 2013, to BKFS Operating LLC, which contributed it to BKIS. Thereafter, we issued 35.0% of the membership interests of BKFS Operating LLC to certain THL Affiliates and THL Intermediaries.
8
Table of Contents
Following the Internal Reorganization, we are majority owned by FNF through its wholly-owned subsidiary, BKHI, and minority owned by THL through certain THL Affiliates and THL Intermediaries. FNF and THL Managers LLC also provide us with management and consulting services. The agreements under which FNF and THL Managers LLC provide these services will be terminated in connection with the closing of this offering.
Contribution of Property Insight, LLC
On June 2, 2014, as part of an additional internal reorganization, two wholly-owned subsidiaries of FNF contributed to us their respective interests in Property Insight, a company that provides property information used by title insurance underwriters, title agents and closing attorneys to underwrite title insurance policies for real property sales and transfers. As a result, we are now the sole member of Property Insight. In connection with the Property Insight Contribution, BKFS Operating LLC issued an additional 6.4 million of its Units (as defined below) to BKHI. As a result of this issuance, THL Affiliates’ and certain THL Intermediaries’ combined percentage ownership in BKFS Operating LLC was reduced from 35.0% to 32.9%.
Corporate Structure and Reorganization
BKFS, the issuer in this offering, was incorporated in the State of Delaware on October 27, 2014 for the purpose of this offering and to date has engaged only in activities in contemplation of this offering. Prior to the completion of this offering, all of our business operations are being conducted through BKFS Operating LLC and its subsidiaries.
9
Table of Contents
As further described in “Our Corporate Structure,” we will effect a reorganization in connection with the offering contemplated by this prospectus, which we refer to herein as the Offering Reorganization. The diagram below depicts our organizational structure immediately prior to the Offering Reorganization:
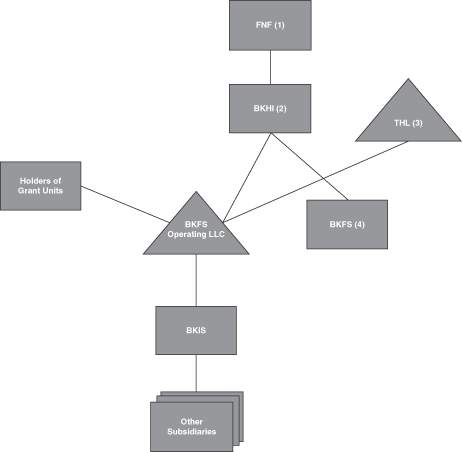
| (1) | FNF owns 100% of the equity interests of BKHI. |
| (2) | BKHI owns 67.1% of the Class A membership interests in BKFS Operating LLC, which we refer to herein as Units, and 100% of the shares of common stock of BKFS. |
| (3) | THL, through THL Intermediaries and certain THL Affiliates, owns 32.9% of the Units. |
| (4) | Members of the BKFS management team and other key employees of BKFS or FNF or its subsidiaries hold equity incentive awards in the form of profits interests in BKFS Operating LLC, which we refer to herein as Grant Units. |
10
Table of Contents
The Offering Reorganization
Prior to the closing of this offering, we will complete transactions that will result in the following:
| • | the amendment and restatement of the issuer’s certificate of incorporation to authorize the issuance of two classes of common stock, Class A common stock and Class B common stock, which we collectively refer to herein as our common stock, and which will generally vote together as a single class on all matters submitted for a vote to stockholders; |
| • | the issuance of shares of Class B common stock by the issuer to BKHI and certain THL Affiliates, the holders of Units prior to the offering (Class B common stock will not entitle the holders thereof to any of the economic rights, including rights to dividends and distributions upon liquidation that will be provided to holders of Class A common stock, and the total voting power of the Class B common stock will be equal to the percentage of Units not held by the issuer); and |
| • | the issuance of shares of Class A common stock to certain THL Affiliates, in connection with the merger of the THL Intermediaries with and into the issuer, pursuant to which the issuer will acquire Units. |
In connection with this offering, the following transactions will occur:
| • | the issuance of shares of Class A common stock by the issuer to the investors in this offering (the total voting power of Class A common stock outstanding will be proportional to the percentage of Units that will be held by the issuer); |
| • | the contribution by the issuer of the net cash proceeds received in this offering to BKFS Operating LLC in exchange for % of the Units and a managing member’s membership interest in BKFS Operating LLC; and |
| • | the restatement of the current limited liability company agreement of BKFS Operating LLC (which we refer to herein as the Amended and Restated Operating Agreement) to provide for the governance and control of BKFS Operating LLC by the issuer as its managing member and to establish the terms upon which other holders of Units may exchange those Units, and a corresponding number of shares of Class B common stock, for, at the issuer’s option, either shares of Class A common stock on a one-for-one basis, or a cash payment. |
Following the consummation of the Offering Reorganization, this offering and the application of the net proceeds therefrom, the issuer will be a holding company and through its managing member interest, will control the business and affairs of BKFS Operating LLC and its subsidiaries. The sole asset of the issuer will be its interest in BKFS Operating LLC.
In this prospectus, we refer to the transactions described above as the Offering Reorganization. For a detailed description of the Offering Reorganization, including a summary of the material terms and conditions of the documents and agreements adopted or that will be entered into in connection with the Offering Reorganization, see “Our Corporate Structure” and “Certain Relationships and Related Party Transactions.”
11
Table of Contents
The diagram below summarizes our anticipated organizational structure immediately after completion of the Offering Reorganization, including this offering and the application of the net proceeds from this offering (assuming an initial public offering price of $ per share, which is the mid-point of the estimated public offering range set forth on the cover page of this prospectus, and no exercise of the underwriters’ option to purchase additional shares).
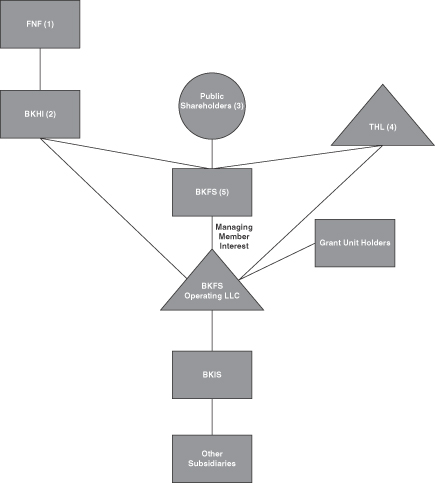
| (1) | FNF will own 100% of the equity interests of BKHI. |
| (2) | BKHI will own no outstanding shares of Class A common stock and % of the outstanding shares of Class B common stock of BKFS, representing no economic interest and % voting interest in BKFS and % of the Units of BKFS Operating LLC. |
| (3) | The public shareholders (excluding FNF and THL Affiliates) will own % of the outstanding shares of Class A common stock and no shares of Class B common stock of BKFS, representing a % economic and voting interest in BKFS. |
| (4) | THL, through certain THL Affiliates, will beneficially own % of the outstanding shares of Class A common stock and shares of Class B common stock of BKFS, representing a % economic and voting interest in BKFS and % of the Units of BKFS Operating LLC. |
| (5) | BKFS will own % of the Units and a managing member interest of BKFS Operating LLC. |
12
Table of Contents
| (6) | Members of the BKFS management team and other key employees of BKFS or FNF or its other subsidiaries will hold Grant Units. |
See “Our Corporate Structure,” “Certain Relationships and Related Party Transactions,” and “Description of Capital Stock” for more information on our corporate structure and the rights associated with our common stock, Units and Grant Units of BKFS Operating LLC.
Our Principal Equityholders
BKHI, which will hold % of our outstanding Class B common stock and % of the Units of BKFS Operating LLC following the consummation of this offering, is a wholly-owned subsidiary of FNF. FNF is a leading provider of title insurance, technology and transaction services to the real estate and mortgage industries. FNF is a leading title insurance company through its title insurance underwriters (Fidelity National Title, Chicago Title, Commonwealth Land Title, Alamo Title and National Title of New York) that collectively issue more title insurance policies than any other title company in the United States. FNF also provides mortgage transaction services through its indirectly, wholly-owned subsidiary ServiceLink Holdings LLC, or ServiceLink. In addition, in FNF’s FNF Ventures group, FNF owns majority and minority equity investment stakes in a number of entities, including American Blue Ribbon Holdings, LLC, J. Alexander’s, LLC, Ceridian HCM, Inc. and Digital Insurance, Inc.
THL, through certain THL Affiliates, will hold % of our outstanding Class A common stock, % of our outstanding Class B common stock and % of the Units of BKFS Operating LLC following the consummation of this offering. THL invests in growth-oriented companies, and focuses on global businesses headquartered primarily in North America. Since the firm’s founding in 1974, THL has acquired more than 100 portfolio companies and has completed over 200 add-on acquisitions, representing a combined value of more than $150 billion.
Agreements with Our Principal Equityholders
In addition to the documents and agreements described above that comprise the Offering Reorganization, in connection with this offering, we intend to enter into certain additional agreements with our existing equity holders regarding aspects of our relationship with them following this offering, including a registration rights agreement. We will also be a party to a reimbursement agreement with FNF, the parent holding company of our largest stockholder, BKHI, in which we will agree to reimburse FNF, at cost, for certain limited administrative services provided from time to time to us by FNF affiliated employees.
Upon the closing of this offering, we expect to enter into a tax receivable agreement with BKHI and certain THL Affiliates. See “Our Corporate Structure” and “Certain Relationships and Related Party Transactions” for a complete description of the foregoing agreements.
Class A Common Stock and Class B Common Stock
After completion of this offering, our outstanding capital stock will consist of shares of Class A common stock and shares of Class B common stock. Investors in this offering will receive shares of Class A common stock of BKFS, the managing member of BKFS Operating LLC. See “Description of Capital Stock.”
Implications of Being a Controlled Company
Upon completion of this offering, after giving effect to the Offering Reorganization, FNF, through BKHI and its affiliates, will beneficially own approximately % of the voting power of our outstanding common stock,
13
Table of Contents
or % if the underwriters exercise in full their option to purchase additional shares. As a result, we will be a “controlled company” within the meaning of the NYSE’s corporate governance rules as a result of the ownership position and voting rights of these persons. For a discussion of the applicable limitations and risks that may result from our status as a controlled company, see “Risk Factors—Risks Related to Our Structure—We are a ‘controlled company’ within the meaning of NYSE rules, and as a result, we qualify for, and may rely on, exemptions from certain corporate governance requirements. You may not have the same protections afforded to stockholders of companies that are subject to such requirements,” and “Management—Independent Directors.”
Risk Factors
An investment in our Class A common stock involves a high degree of risk. Our ability to execute on our strategy also is subject to certain risks. These risks are discussed more fully in the section titled “Risk Factors” immediately following this prospectus summary. Some of the more significant challenges and risks include the following:
| • | if we are unable to protect our information systems against data corruption, cyber-based attacks or network security breaches, or if we are unable to provide adequate security in the electronic transmission of sensitive data, it could have a material adverse effect on our business, financial condition and results of operations; |
| • | we rely on our top clients for a significant portion of our revenue and profit, which makes us susceptible to the same macro-economic and regulatory factors that impact our clients. If these clients are negatively impacted by current economic or regulatory conditions or otherwise experience financial hardship or stress, or if the terms of our relationships with these clients change, it could have a material adverse effect on our business, financial condition and results of operations; |
| • | we have a long sales cycle for many of our technology solutions and services and if we fail to close sales after expending significant time and resources on the sales process, it could have a material adverse effect on our business, financial condition and results of operations; |
| • | if we fail to meet the service level commitments we typically provide under our client contracts, we could be obligated to provide credits or refunds for prepaid amounts related to unused subscription services or face contract terminations, which could adversely affect our revenues; |
| • | any failure to offer high-quality technical support services may adversely affect our relationships with our clients and could have a material adverse effect on our business, financial condition and results of operations; |
| • | our clients and we are subject to various governmental regulations, and a failure to comply with government regulations or changes in these regulations could result in penalties, restrict or limit our or our clients’ operations or make it more burdensome to conduct such operations, any of which could have a material adverse effect on our business, financial condition and results of operations; |
| • | we may experience delays or difficulty in developing or implementing new or enhanced mortgage processing or technology solutions, which may negatively affect our relationships with existing and potential clients, reduce or delay the generation of revenues or increase development and implementation costs, which could have a material adverse effect on our business, financial condition and results of operations; |
| • | we are a holding company and our only material asset after completion of the Offering Reorganization and this offering will be our interest in BKFS Operating LLC and, accordingly, we are dependent upon distributions from BKFS Operating LLC to pay taxes and other expenses; |
| • | any payments made under the tax receivable agreement to our equity holders that are parties to such agreement could be significant and will reduce the amount of overall cash flow that would otherwise be available to us; |
14
Table of Contents
| • | we may not be able to realize all or a portion of the tax benefits that are expected to result from future exchanges of Units by holders; |
| • | because we are a “controlled company” within the meaning of NYSE rules, and as a result, we qualify for, and may rely on, exemptions from certain corporate governance requirements, you may not have the same protections afforded to stockholders of companies that are subject to such requirements; and |
| • | future sales of our Class A common stock in the public market could cause the market price of our Class A common stock to decrease significantly. |
The above list is not exhaustive. Before you invest in our Class A common stock, you should carefully consider all of the information in this prospectus, including matters set forth under the heading “Risk Factors” immediately following this prospectus summary.
Corporate Information
We were incorporated in Delaware on October 27, 2014. Our principal executive offices are located at 601 Riverside Avenue, Jacksonville, Florida 32204, and our telephone number is (904) 854-5100. Our corporate website address is www.bkfs.com. Our website and the information contained on, or that can be accessed through, the website is not deemed to be incorporated by reference in, and is not considered part of, this prospectus. You should not rely on any such information in making your decision whether to purchase our Class A common stock.
15
Table of Contents
THE OFFERING
| Issuer |
Black Knight Financial Services, Inc. |
| Class A common stock offered by us |
shares of Class A common stock. |
| Total offering |
shares of Class A common stock. |
| Class A common stock to be outstanding after this offering |
shares of Class A common stock ( shares if the underwriters’ option to purchase additional shares is exercised in full). |
| Class B common stock to be outstanding after this offering |
shares. Each share of our Class B common stock will generally have one vote on all matters submitted to a vote of stockholders but will have no economic rights (including no rights to dividends or distributions upon liquidation). Shares of our Class B common stock will be issued to the holders of Units, other than the issuer, in an amount equal to the number of Units held by such holders. The aggregate voting power of the outstanding Class B common stock will be equal to the aggregate percentage of Units held by the holders of Units other than the issuer. See “Description of Capital Stock.” |
| Option to purchase additional shares of Class A common stock |
The underwriters have an option to purchase a maximum of additional shares of Class A common stock from us. The underwriters can exercise this option at any time within 30 days from the date of this prospectus. |
| Voting rights |
Each share of our Class A common stock will have one vote per share on all matters submitted to a vote of stockholders. Class A common stock and Class B common stock generally vote together as a single class on all matters submitted to a vote of stockholders. See “Description of Capital Stock.” |
| Use of proceeds |
We estimate that the net proceeds from the sale of our Class A common stock in this offering, after deducting the underwriting discount and estimated offering expenses payable by us, will be approximately $ million ($ million if the underwriters exercise in full their option to purchase additional shares) based on an assumed initial public offering price of $ per share (the midpoint of the estimated public offering price range set forth on the cover page of this prospectus). |
| We intend to contribute the entire net proceeds of this offering, including any proceeds received from the underwriters’ option to purchase additional shares, if exercised, to BKFS Operating LLC in exchange for Units, at a purchase price per Unit equal to the initial public offering price per share of Class A common stock in this offering. |
16
Table of Contents
| We intend that BKFS Operating LLC will use a portion of the net proceeds contributed to it to repay $ principal amount of our outstanding debt. The remaining net proceeds received by BKFS Operating LLC will be used to continue to support its growth and for working capital and general corporate purposes. See “Use of Proceeds.” |
| Dividend policy |
We do not intend to pay dividends on our Class A common stock for the foreseeable future. We will not pay dividends on our Class B common stock (which holds no economic interest in the issuer). See “Dividend Policy.” |
| Listing |
We intend to apply to have our Class A common stock listed on the NYSE under the symbol “BKFS.” |
| Risk Factors |
Investing in our Class A common stock involves a high degree of risk. See the “Risk Factors” section of this prospectus for a discussion of factors you should carefully consider before deciding to purchase shares of our Class A common stock. |
Except as otherwise indicated, all information in this prospectus assumes:
| • | no exercise of the underwriters’ option to purchase additional shares; |
| • | shares of Class A common stock are reserved for issuance upon the exchange of Units held by persons that own Units (along with the corresponding number of shares of our Class B common stock); and |
| • | an initial public offering price of $ per share (the midpoint of the estimated public offering price range set forth on the cover page of this prospectus). |
17
Table of Contents
SUMMARY HISTORICAL FINANCIAL DATA
Summary Historical Consolidated Financial Data of the Company
The following tables present our summary historical and pro forma consolidated financial data for the periods ending on and as of the dates indicated. The following tables should be read in conjunction with “Unaudited Pro Forma Condensed Combined Financial Data,” “Management’s Discussion and Analysis of Financial Condition and Results of Operations” and the financial statements and the related footnotes thereto, included elsewhere in this prospectus. The periods presented below prior to January 2, 2014, the date of the Acquisition, are referred to as Predecessor periods and the periods presented after and including January 2, 2014 are referred to as Successor periods. The financial data for the Predecessor periods reflect the financial position and results of operations of our predecessor, LPS, which include the Transaction Services segment of LPS that was distributed by us to ServiceLink and another FNF subsidiary in connection with the Internal Reorganization on January 3, 2014. The financial data for the Successor periods does not include the financial position and results of operations of the Transaction Services segment of LPS. As a result, the financial data included in the Successor periods are not comparable to the financial data included in the Predecessor periods. See “Risk Factors,” “Selected Historical Consolidated Financial Data,” “Unaudited Pro Forma Condensed Combined Financial Data” and “Management’s Discussion and Analysis of Financial Condition and Results of Operations.”
The consolidated statements of operations data for the years ended December 31, 2013, December 31, 2012 and December 31, 2011 and the consolidated balance sheet data as of December 31, 2013 and December 31, 2012 are derived from the audited financial statements from our predecessor, LPS, included in this prospectus. The consolidated balance sheet data as of December 31, 2011 is derived from the audited financial statements from our predecessor, LPS, not included in this prospectus.
| Successor | Predecessor | |||||||||||||||||||||
| Period January 2, 2014 through September 30, 2014 |
One day ended January 1, 2014 |
Year Ended December 31, | ||||||||||||||||||||
| 2013 | 2012 | 2011 | ||||||||||||||||||||
| (unaudited) | (unaudited) | |||||||||||||||||||||
| (In millions, except per share amounts) | ||||||||||||||||||||||
| Statements of Operations Data: |
||||||||||||||||||||||
| Revenues |
$ | 631.8 | $ | — | $ | 1,716.2 | $ | 1,991.3 | $ | 1,980.0 | ||||||||||||
| Net (loss) earnings from continuing operations |
$ | (117.1 | ) | $ | (50.1 | ) | $ | 104.2 | $ | 79.6 | $ | 135.3 | ||||||||||
| Net (loss) earnings |
$ | (117.8 | ) | $ | (39.0 | ) | $ | 102.7 | $ | 70.4 | $ | 96.5 | ||||||||||
| Net earnings per share—basic from continuing operations |
$ | 1.22 | $ | 0.94 | $ | 1.58 | ||||||||||||||||
| Net earnings per share—basic |
$ | 1.20 | $ | 0.83 | $ | 1.13 | ||||||||||||||||
| Weighted average shares—basic |
85.4 | 84.6 | 85.6 | |||||||||||||||||||
| Net earnings per share—diluted from continuing operations |
$ | 1.21 | $ | 0.94 | $ | 1.58 | ||||||||||||||||
| Net earnings per share—diluted |
$ | 1.19 | $ | 0.83 | $ | 1.13 | ||||||||||||||||
| Weighted average shares—diluted |
85.9 | 84.9 | 85.7 | |||||||||||||||||||
| Balance Sheet Data: |
||||||||||||||||||||||
| Cash and cash equivalents |
$ | 52.4 | $ | 329.6 | $ | 236.2 | $ | 77.4 | ||||||||||||||
| Total assets |
$ | 3,608.3 | $ | 2,486.7 | $ | 2,445.8 | $ | 2,245.4 | ||||||||||||||
| Total debt (current and long-term) |
$ | 2,155.0 | $ | 1,068.1 | $ | 1,068.1 | $ | 1,149.2 | ||||||||||||||
| Cash dividends per share |
$ | 0.40 | $ | 0.40 | $ | 0.40 | ||||||||||||||||
| Technology and Data and Analytics Financial Data (unaudited)(1): |
||||||||||||||||||||||
| Revenues |
$ | 631.8 | $ | — | $ | 744.8 | $ | 718.9 | $ | 670.4 | ||||||||||||
| Operating (loss) income |
$ | (14.7 | ) | $ | (50.1 | ) | $ | 184.2 | $ | 176.1 | $ | 152.7 | ||||||||||
| Adjusted Revenue(2) |
$ | 642.2 | $ | — | $ | 744.8 | $ | 718.9 | $ | 670.4 | ||||||||||||
| Adjusted EBITDA |
$ | 255.2 | $ | — | $ | 294.0 | $ | 286.7 | $ | 286.6 | ||||||||||||
| Adjusted EBITDA Margin |
39.7 | % | — | 39.5 | % | 39.9 | % | 42.8 | % | |||||||||||||
18
Table of Contents
| (1) | The financial data provided under “Technology and Data and Analytics Financial Data (unaudited)” for the years ended December 31, 2013, 2012 and 2011 is derived from the results of operations of the former Technology, Data and Analytics segment of LPS and does not include the former Transaction Services segment of LPS. |
| (2) | See “—Non-GAAP Financial Measures (Unaudited)” for a more detailed description of adjustments to our financial measures that are not reported in accordance with U.S. generally accepted accounting principles, or GAAP. |
Non-GAAP Financial Measures (Unaudited)
Adjusted Revenue and Adjusted EBITDA are non-GAAP financial measures that we use to measure the performance of our businesses. The tables below reconcile these non-GAAP measures to the nearest GAAP financial measure for the former Technology and Data and Analytics segment (including corporate) of LPS for periods prior to the Acquisition and for BKFS Operating LLC for the period following the Acquisition. The results of operations for the former Transaction Services segment of LPS are not included in the non-GAAP financial measures below.
The following tables reconcile Revenue to Adjusted Revenue:
| Successor | Predecessor | |||||||||||
| Period January 2, 2014 through September 30, 2014 |
One Day Ended January 1, 2014 |
Nine Months Ended September 30, 2013 |
||||||||||
| (In millions) | ||||||||||||
| Revenue (as reported) |
$ | 631.8 | $ | — | $ | 560.5 | ||||||
| Deferred revenue adjustment(1) |
10.4 | — | — | |||||||||
|
|
|
|
|
|
|
|||||||
| Adjusted Revenue |
$ | 642.2 | $ | — | $ | 560.5 | ||||||
|
|
|
|
|
|
|
|||||||
| (1) | To adjust GAAP Revenue for the effect of purchase accounting related to the Acquisition. |
| (2) | For the years ending December 31, 2013, 2012 and 2011, there is no adjustment to GAAP Revenue. |
19
Table of Contents
The following tables reconcile GAAP Operating Income to Adjusted EBITDA:
| Successor | Predecessor | |||||||||||
| Period January 2, 2014 through September 30, 2014 |
One Day Ended January 1, 2014 |
Nine Months Ended September 30, 2013 |
||||||||||
| (In millions) | ||||||||||||
| Operating (loss) income (as reported) |
$ | (14.7 | ) | $ | (50.1 | ) | $ | 145.4 | ||||
| Operating margin |
— | — | — | |||||||||
| Depreciation and amortization |
143.1 | — | 62.2 | |||||||||
| Deferred revenue adjustment |
10.4 | — | — | |||||||||
| Equity-based compensation |
5.3 | — | 11.7 | |||||||||
| Legal and regulatory charges |
— | — | 0.8 | |||||||||
| Exits costs, impairments and other charges |
— | — | 4.1 | |||||||||
| Transition and integration costs (including acquisition costs) |
111.1 | 50.1 | — | |||||||||
|
|
|
|
|
|
|
|||||||
| Adjusted EBITDA |
$ | 255.2 | $ | — | $ | 224.2 | ||||||
|
|
|
|
|
|
|
|||||||
| Adjusted EBITDA margin(1) |
39.7 | % | — | % | 40.0 | % | ||||||
| Year Ended December 31, | ||||||||||||
| 2013(2) | 2012(2) | 2011(2) | ||||||||||
| (In millions) |
||||||||||||
| Operating income (as reported) |
$ | 184.2 | $ | 176.1 | $ | 152.7 | ||||||
| Depreciation and amortization |
83.6 | 75.8 | 68.4 | |||||||||
| Equity-based compensation |
15.6 | 14.5 | 13.2 | |||||||||
| Legal and regulatory charges |
2.5 | 14.4 | 10.4 | |||||||||
| Exits costs, impairments and other charges (including acquisition costs) |
8.1 | 5.9 | 37.7 | |||||||||
| Other non-recurring charges |
— | — | 4.2 | |||||||||
|
|
|
|
|
|
|
|||||||
| Adjusted EBITDA |
$ | 294.0 | $ | 286.7 | $ | 286.6 | ||||||
|
|
|
|
|
|
|
|||||||
| Adjusted EBITDA margin(1) |
39.5 | % | 39.9 | % | 42.8 | % | ||||||
| (1) | Adjusted EBITDA margin is calculated by dividing Adjusted EBITDA by GAAP Revenue for periods prior to the Acquisition or Adjusted Revenue for periods after the Acquisition. |
| (2) | Operating income reported for this period is derived from our predecessor’s, LPS, GAAP Operating Income reported in the audited financial statements from LPS. |
20
Table of Contents
Quarterly Financial Data (Unaudited)
| Predecessor | ||||||||||||||||
| 2013 Quarter Ended | ||||||||||||||||
| March 31 | June 30 | September 30 | December 31 | |||||||||||||
| (In millions, except per share data) | ||||||||||||||||
| Revenues |
$ | 469.7 | $ | 466.9 | $ | 417.2 | $ | 362.4 | ||||||||
| Net earnings (loss) from continuing operations(1) |
$ | 54.3 | $ | 20.5 | $ | 34.8 | $ | (5.4 | ) | |||||||
| Net earnings (loss)(1) |
$ | 53.9 | $ | 19.1 | $ | 35.5 | $ | (5.8 | ) | |||||||
| Net earnings (loss) per share—basic from continuing operations |
$ | 0.64 | $ | 0.24 | $ | 0.41 | $ | (0.06 | ) | |||||||
| Net earnings (loss) per share—basic |
$ | 0.63 | $ | 0.22 | $ | 0.42 | $ | (0.07 | ) | |||||||
| Weighted average shares—basic |
84.9 | 85.1 | 85.3 | 86.3 | ||||||||||||
| Net earnings (loss) per share—diluted from continuing operations |
$ | 0.64 | $ | 0.24 | $ | 0.40 | $ | (0.07 | ) | |||||||
| Net earnings (loss) per share—diluted |
$ | 0.63 | $ | 0.22 | $ | 0.41 | $ | (0.07 | ) | |||||||
| Weighted average shares—diluted |
85.1 | 85.6 | 86.0 | 86.9 | ||||||||||||
| Predecessor | ||||||||||||||||
| 2012 Quarter Ended | ||||||||||||||||
| March 31, | June 30, | September 30, | December 31, | |||||||||||||
| (In millions except per share data) | ||||||||||||||||
| Revenues |
$ | 484.6 | $ | 511.7 | $ | 495.7 | $ | 499.3 | ||||||||
| Net earnings (loss) from continuing operations(2) |
$ | 48.7 | $ | (35.2 | ) | $ | 60.2 | $ | 5.9 | |||||||
| Net earnings (loss)(2) |
$ | 47.1 | $ | (37.9 | ) | $ | 58.3 | $ | 2.9 | |||||||
| Net earnings (loss) per share—basic from continuing operations |
$ | 0.58 | $ | (0.42 | ) | $ | 0.71 | $ | 0.07 | |||||||
| Net earnings (loss) per share—basic |
$ | 0.56 | $ | (0.45 | ) | $ | 0.69 | $ | 0.03 | |||||||
| Weighted average shares—basic |
84.4 | 84.6 | 84.7 | 84.9 | ||||||||||||
| Net earnings (loss) per share—diluted from continuing operations |
$ | 0.58 | $ | (0.42 | ) | $ | 0.71 | $ | 0.07 | |||||||
| Net earnings (loss) per share—diluted |
$ | 0.56 | $ | (0.45 | ) | $ | 0.69 | $ | 0.03 | |||||||
| Weighted average shares—diluted |
84.6 | 84.6 | 84.9 | 85.1 | ||||||||||||
| (1) | During the fourth quarter of 2013, the company’s net earnings (loss) and net earnings (loss) from continuing operations included an asset impairment charge of $28.6 million and an addition to the legal and regulatory accrual of $20.4 million, as discussed in notes 8 and 15, respectively, to LPS’s audited consolidated financial statements of LPS included elsewhere in this prospectus. In addition, results for the fourth quarter of 2013 included expenses related to the Acquisition by FNF (see note 2 of LPS’s audited consolidated financial statements included elsewhere in this prospectus) of $8.1 million. |
| (2) | During the second and fourth quarters of 2012, the company’s net earnings (loss) and net earnings (loss) from continuing operations included an addition to the legal and regulatory accrual of $144.5 million and $47.9 million, respectively, as discussed in note 14 to LPS’s audited consolidated financial statements included elsewhere in this prospectus. |
21
Table of Contents
SUMMARY UNAUDITED HISTORICAL COMBINED FINANCIAL DATA OF COMMERCE VELOCITY AND PROPERTY INSIGHT
The following selected summary unaudited historical combined financial information has been derived from the unaudited financial information of Commerce Velocity and Property Insight which are not included or incorporated by reference into this prospectus. Certain financial information for Commerce Velocity and Property Insight has been included in the audited Black Knight Financial Services, LLC combined financial statements as of December 31, 2013 and for the period from October 16, 2013 through December 31, 2013 included elsewhere in this prospectus and in the unaudited Pro Forma Condensed Consolidated Financial Information for BKFS subsequent to the Acquisition.
The selected unaudited financial information as of and for each of the three years ending December 31, 2013 is derived from the historical financial records of FNF and includes all material adjustments, consisting of normal recurring adjustments, necessary for a fair presentation of the results of the unaudited periods. You should not rely on these results as being indicative of the results of Commerce Velocity and Property Insight after their contribution to BKFS Operating LLC or in the future.
| Year Ended December 31, | ||||||||||||
| 2013 | 2012 | 2011 | ||||||||||
| (In millions) | ||||||||||||
| Statement of Operations Data: |
||||||||||||
| Revenues |
$ | 71.9 | $ | 73.5 | $ | 64.5 | ||||||
| (Loss) earnings |
$ | (14.4 | ) | $ | 4.1 | $ | 4.6 | |||||
| Balance Sheet Data: |
||||||||||||
| Total assets |
$ | 88.1 | $ | 90.4 | $ | 79.6 | ||||||
22
Table of Contents
PRO FORMA CONDENSED COMBINED FINANCIAL DATA
Selected Unaudited Pro Forma Condensed Combined Financial Information
The following table presents selected unaudited pro forma condensed combined financial information about our consolidated balance sheet and statements of operations, after giving effect to the Internal Reorganization Transactions, the refinancing and other debt related activities undertaken in connection therewith, or the Acquisition Related Refinancing and the offering and the Offering Reorganization, with the resulting company being the issuer. The information under “Unaudited Pro Forma Condensed Combined Balance Sheet Data” in the table below assumes the Internal Reorganization Transactions, the Acquisition Related Refinancing and the Offering Reorganization had been completed on September 30, 2014. The information under “Unaudited Pro Forma Condensed Combined Statement of Operations Data” in the table below gives effect to the Internal Reorganization Transactions, the Acquisition Related Refinancing and the Offering Reorganization, as if all had been consummated on January 1, 2013, the beginning of the earliest period presented. This unaudited pro forma condensed combined financial information was prepared using the acquisition method of accounting with FNF considered the acquirer of LPS as pertaining to the Acquisition and using the accounting for transactions between entities under common control as pertaining to the Commerce Velocity Contribution and the Property Insight Contribution.
The information presented below should be read in conjunction with the historical consolidated financial statements and the related notes thereto, the unaudited pro forma condensed combined financial statements and the related notes, and “Management’s Discussion and Analysis of Financial Condition and Results of Operations” appearing elsewhere in this prospectus. See the section entitled “Where You Can Find More Information” and “Unaudited Pro Forma Condensed Combined Financial Information.” The unaudited pro forma condensed combined financial information has been presented for informational purposes only. The pro forma information is not necessarily indicative of what our financial position or results of operations actually would have been had the Internal Reorganization Transactions, the Acquisition Related Refinancing and the offering and Offering Reorganization been completed as of the dates indicated. In addition, the unaudited pro forma condensed combined financial information does not purport to project our future financial position or operating results. Transactions among the entities included in the unaudited pro forma condensed combined financial statements during the periods presented have been eliminated. In addition, the unaudited pro forma condensed combined financial information includes adjustments that are preliminary and may be revised. There can be no assurance that such revisions will not result in material changes.
Unaudited Pro Forma Condensed Combined Balance Sheet Data:
| As of September 30, 2014 | ||||
| (In millions) | ||||
| Total assets |
$ | |||
| Total liabilities |
$ | |||
| Total equity |
$ | |||
| Total liabilities and equity |
$ | |||
Unaudited Pro Forma Condensed Combined Statement of Operations Data:
| Nine Months Ended September 30, 2014 |
Year Ended December 31, 2013 |
|||||||
| (In millions) | ||||||||
| Total revenues |
$ | 634.5 | $ | 809.0 | ||||
| Total operating income |
$ | 104.5 | $ | 72.2 | ||||
| Net earnings (loss) |
$ | 9.8 | $ | (53.8 | ) | |||
| Net earnings from continuing operations attributable to BKFS common shareholders |
$ | $ | ||||||
23
Table of Contents
Unaudited Comparative Per Share Data
Presented below is our unaudited pro forma combined per share data for the nine months ended September 30, 2014 and for the year ended December 31, 2013. The information presented below should be read in conjunction with the historical audited financial statements and the related notes, the unaudited pro forma condensed combined financial statements and the related notes, and “Management’s Discussion and Analysis of Financial Condition and Results of Operations” appearing elsewhere elsewhere in this prospectus. The pro forma information is presented for illustrative purposes only and is not necessarily indicative of the operating results that would have occurred if the Internal Reorganization Transactions, the Acquisition Related Refinancing and the Offering Reorganization had been completed on January 1, 2013, the beginning of the earliest period presented, nor is it necessarily indicative of our future operating results or financial position. The pro forma earnings per share is computed by dividing the pro forma net earnings attributable to BKFS Class A common shareholders by the pro forma weighted average number of shares outstanding. The unaudited pro forma combined basic and diluted earnings per share for the periods presented are based on the pro forma combined basic and diluted shares expected to be issued as part of the offering.
Unaudited Pro Forma Per Share Data
For the Nine Months Ended September 30, 2014
(In millions, except per share data)
| BKFS Operating LLC | Pro Forma Adjustments |
Pro Forma BKFS Combined | ||||
| Net earnings per share—basic, attributable to BKFS Class A common shareholders |
||||||
|
|
|
| ||||
| Weighted average shares outstanding—basic |
||||||
|
|
|
| ||||
| Net earnings per share—diluted, attributable to BKFS Class A common shareholders |
||||||
|
|
|
| ||||
| Weighted average shares outstanding—diluted |
||||||
|
|
|
|
Unaudited Pro Forma Per Share Data
For the Year Ended December 31, 2013
(In millions, except per share data)
| BKFS Operating LLC | Pro Forma Adjustments |
Pro Forma BKFS Combined | ||||
| Net earnings per share—basic, attributable to BKFS Class A common shareholders |
||||||
|
|
|
| ||||
| Weighted average shares outstanding—basic |
||||||
|
|
|
| ||||
| Net earnings per share—diluted, attributable to BKFS Class A common shareholders |
||||||
|
|
|
| ||||
| Weighted average shares outstanding—diluted |
||||||
|
|
|
|
24
Table of Contents
Investing in our Class A common stock involves a high degree of risk. You should carefully consider the following risk factors and all other information contained in this prospectus before purchasing our Class A common stock. If any of the following risks occur, our business, financial condition or results of operations could be materially and adversely affected. In that case, the trading price of our Class A common stock could decline and you may lose some or all of your investment.
Risks Related to Our Business
If we are unable to protect our information systems against data corruption, cyber-based attacks or network security breaches, or if we are unable to provide adequate security in the electronic transmission of sensitive data, it could have a material adverse effect on our business, financial condition and results of operations.
We are highly dependent on information technology networks and systems, including the Internet, to securely process, transmit and store electronic information. Security breaches of this infrastructure, including physical or electronic break-ins, computer viruses, attacks by hackers and similar breaches, can create system disruptions, shutdowns or unauthorized disclosure of confidential information, including non-public personal information, consumer data and proprietary business information. Unauthorized access, including through use of fraudulent schemes such as “phishing” schemes, could jeopardize the security of information stored in our systems. In addition, malware or viruses could jeopardize the security of information stored or used in a user’s computer. If we are unable to prevent such security or privacy breaches, our operations could be disrupted, or we may suffer loss of reputation, financial loss, lawsuits and other regulatory imposed restrictions and penalties because of lost or misappropriated information, including sensitive consumer data, which could have a material adverse effect on our business, financial condition and results of operations.
Likewise, our clients are increasingly imposing more stringent contractual obligations on us relating to our information security protections. If we are unable to maintain protections and processes at a level commensurate with that required by our large clients, it could negatively affect our relationships with those clients, increase our operating costs or subject us to liability under those contractual obligations, which could have a material adverse effect on our business, financial condition and results of operations.
We rely on our top clients for a significant portion of our revenue and profit, which makes us susceptible to the same macro-economic and regulatory factors that impact our clients. If these clients are negatively impacted by current economic or regulatory conditions or otherwise experience financial hardship or stress, or if the terms of our relationships with these clients change, it could have a material adverse effect on our business, financial condition and results of operations.
We operate in a consolidated industry and as a result, a small number of our clients have accounted for a significant portion of our revenues. We expect that a limited number of our clients will continue to represent a significant portion of our revenues for the foreseeable future. During the period from January 2, 2014 to September 30, 2014, our largest client, Wells Fargo, N.A., or Wells Fargo, accounted for approximately 14% of our consolidated revenues and approximately 16% and 1% of the revenue from our Technology and Data and Analytics segments, respectively. JPMorgan Chase Bank, N.A., or JPMorgan Chase, our second largest client, accounted for approximately 13% of our consolidated revenues and approximately 14% and 1% of the revenues of our Technology and Data and Analytics segments, respectively. During the period from January 2, 2014 to September 30, 2014, our five largest clients accounted for approximately 40% of our consolidated revenues, approximately 42% of our Technology segment revenues and approximately 27% of our Data and Analytics segment revenues.
Our clients face continued pressure in the current economic and regulatory climate. Many of our relationships with these clients are long-standing and are important to our business and results of operations, but there is no
25
Table of Contents
guarantee that we will be able to retain or renew existing agreements or maintain our relationships on acceptable terms or at all. Additionally, we rely on cross-selling our products and services to our existing clients as a source of growth. The deterioration in or termination of any of these relationships could significantly reduce our revenue and could have a material adverse effect on our business, financial condition and results of operations. As a result, we may be disproportionately affected by declining revenue from, or loss of, a significant client. In addition, by virtue of their significant relationships with us, these clients may be able to exert pressure on us with respect to the pricing of our services.
We have a long sales cycle for many of our technology solutions and services and if we fail to close sales after expending significant time and resources on the sales process, it could have a material adverse effect on our business, financial condition and results of operations.
The sales of many of our technology solutions and services often involve significant capital commitments by our clients, particularly those with smaller operations. Potential clients generally commit significant resources to an evaluation of available technology solutions and require us to expend substantial time, effort and money educating them as to the value of our technology solutions and services. We incur substantial costs in order to obtain each new client as a result of this process. We may expend significant funds and management resources during the sales cycle and ultimately fail to close the sale. Our sales cycle may be extended due to our clients’ budgetary constraints or for other reasons. If we are unsuccessful in closing sales after expending significant funds and management resources or if we experience delays, it could have a material adverse effect on our business, financial condition and results of operations.
The time and expense associated with switching from our competitors’ software and services to ours may limit our growth.
The costs for a mortgage lender to switch providers of technology, data and analytics solutions and services can be significant and the process can sometimes take 12 to 18 months to complete. As a result, potential clients may decide that it is not worth the time and expense to begin using our solutions and services, even if we offer competitive and economic advantages. If we are unable to convince these clients to switch to our software and services, our ability to increase market share will be limited, which could have a material adverse effect on our business, financial condition and results of operations.
We typically provide service level commitments under our client contracts. If we fail to meet these contractual commitments, we could be obligated to provide credits or refunds for prepaid amounts related to unused subscription services or face contract terminations, which could adversely affect our revenues.
Our client agreements typically provide service level commitments measured on a daily and monthly basis. If we are unable to meet the stated service level commitments or suffer extended periods of unavailability for our applications, we may be contractually obligated to provide these clients with service credits or refunds or we could face contract terminations. If we suffer unscheduled downtime that exceeds the allowed downtimes under our agreements with our clients or if we experience any extended service outages, it could have a material adverse effect on our business, financial condition and results of operations.
Any failure to offer high-quality technical support services may adversely affect our relationships with our clients and could have a material adverse effect on our business, financial condition and results of operations.
Once our applications and technology are deployed, our clients depend on our support organization to resolve technical issues relating thereto. We may be unable to respond adequately to accommodate short-term increases in client demand for support services. We also may be unable to modify the format of our support services to compete with changes in support services provided by our competitors. Increased client demand for these services, without corresponding revenues, could increase costs and adversely affect our results of operations. In addition, our sales process is highly dependent on our applications and business reputation and on positive
26
Table of Contents
recommendations from our existing clients. Any failure to maintain high-quality technical support, or a market perception that we do not maintain high-quality support, could adversely affect our reputation and our ability to sell our applications to existing and prospective clients, any of which could have a material adverse effect on our business, financial condition and results of operations.
Our clients and we are subject to various governmental regulations, and a failure to comply with government regulations or changes in these regulations could result in penalties, restrict or limit our or our clients’ operations or make it more burdensome to conduct such operations, any of which could have a material adverse effect on our business, financial condition and results of operations.
Many of our clients’ and our businesses are subject to various federal, state, local and foreign laws and regulations. Our failure to comply with applicable laws and regulations could restrict our ability to provide certain services or result in imposition of civil fines and criminal penalties, substantial regulatory and compliance costs, litigation expense, adverse publicity and loss of revenue.
As a provider of electronic data processing to financial institutions, such as banks and credit unions, we are subject to regulatory oversight and examination by the Federal Financial Institutions Examination Council, an interagency body of the Federal Reserve Board, the Office of the Comptroller of the Currency, or the OCC, the Federal Deposit Insurance Corporation, or the FDIC, and various other federal and state regulatory authorities. In addition, independent auditors annually review several of our operations to provide reports on internal controls for our clients’ auditors and regulators. We also may be subject to possible review by state agencies that regulate banks in each state in which we conduct our electronic processing activities.
In addition, our businesses are subject to an increasing degree of compliance oversight by regulators and by our clients. Specifically, the CFPB has authority to write rules affecting the business of, supervise, conduct examinations of, and enforce compliance as to federal consumer financial protection laws and regulations with respect to certain “non-depository covered persons” determined by the CFPB to be “larger participants” that offer consumer financial products and services. The CFPB and the prudential financial institution regulators such as the OCC also have the authority to examine us in our role as a service provider to large financial institutions, although it is yet unclear how broadly they will apply this authority going forward. In addition, we believe that some of our largest bank clients are subject to consent orders with the OCC and/or are parties to the National Mortgage Settlement, both of which require them to exercise greater oversight and perform more rigorous audits of their key vendors such as us.
The Real Estate Settlement Procedures Act, or RESPA, and related regulations generally prohibit the payment or receipt of fees or any other item of value for the referral of real estate-related settlement services. RESPA also prohibits fee shares or splits or unearned fees in connection with the provision of residential real estate settlement services, such as mortgage brokerage and real estate brokerage. Notwithstanding these prohibitions, RESPA permits payments for goods furnished or for services actually performed, so long as those payments bear a reasonable relationship to the market value of the goods or services provided. RESPA and related regulations may to some extent restrict our real estate-related businesses from entering into certain preferred alliance arrangements. The U.S. Department of Housing and Urban Development is responsible for enforcing RESPA.
Changes to laws and regulations and enhanced regulatory oversight of our clients and us may compel us to increase our prices in certain situations or decrease our prices in other situations, may restrict our ability to implement price increases, or otherwise limit the manner in which we conduct our business. In addition, in response to increased regulatory oversight, participants in the mortgage lending industry may develop policies pursuant to which they limit the extent to which they can rely on any one vendor or service provider. If we are unable to adapt our products and services to conform to the new laws and regulations, or if these laws and regulations have a negative impact on our clients, we may experience client losses or increased operating costs, which could have a material adverse effect on our business, financial condition and results of operations.
27
Table of Contents
There may be consolidation in our end client market, which would reduce the use of our services by our clients and could have a material adverse effect on our business, financial condition and results of operations.
Mergers or consolidations among existing or potential clients could reduce the number of our clients and potential clients. If our clients merge with or are acquired by other entities that are not our clients, or that use fewer of our services, they may discontinue or reduce their use of our services. In addition, if potential clients merge, our ability to increase our client base may be adversely affected and the ability of our customers to exert pressure on our pricing may increase. Any of these developments could have a material adverse effect on our business, financial condition and results of operations.
Regulatory developments with respect to use of consumer data and public records could have a material adverse effect on our business, financial condition and results of operations.
Because our databases include certain public and non-public personal information concerning consumers, we are subject to government regulation and potential adverse publicity concerning our use of consumer data. We acquire, store, use and provide many types of consumer data and related services that are subject to regulation under the Fair Credit Reporting Act, the Gramm-Leach-Bliley Act, the Driver’s Privacy Protection Act and, to a lesser extent, various other federal, state, and local laws and regulations. These laws and regulations are designed to protect the privacy of consumers and to prevent the unauthorized access and misuse of personal information in the marketplace. Our failure to comply with these laws, or any future laws or regulations of a similar nature, could result in substantial regulatory penalties, litigation expense and loss of revenue, which could have a material adverse effect on our business, financial condition and results of operations.
In addition, some of our data suppliers face similar regulatory requirements and, consequently, they may cease to be able to provide data to us or may substantially increase the fees they charge us for this data which may make it financially burdensome or impossible for us to acquire data that is necessary to offer our products and services. Further, many consumer advocates, privacy advocates and government regulators believe that existing laws and regulations do not adequately protect privacy or ensure the accuracy of consumer-related data. As a result, they are seeking further restrictions on the dissemination or commercial use of personal information to the public and private sectors as well as contemplating requirements relative to data accuracy and the ability of consumers to opt to have their personal data removed from databases such as ours. Any future laws, regulations or other restrictions limiting the dissemination or use of personal information may reduce the quality and availability of our solutions and services, which could have a material adverse effect on our business, financial condition and results of operations.
Participants in the mortgage industry are under intense scrutiny, and efforts by the government to reform the mortgage industry or address the troubled mortgage market and the current economic environment could have a material adverse effect on our business, financial condition and results of operations.
Since the beginning of the housing crisis, the mortgage industry has been under intense scrutiny by governmental authorities, judges and the news media, among others. This scrutiny has included federal and state governmental review of all aspects of the mortgage lending business, and several actions to aid the housing market and the economy in general, and to implement more rigorous standards around mortgage servicing, with particular focus on loans that are in default.
New national servicing standards have been implemented that, among other things, require very specific loan modification procedures to be followed and offered to the borrower before any foreclosure proceeding can be implemented. These standards have further reduced the number of loans entering the foreclosure process and have negatively impacted our default technology revenue and profit, and it is unclear what effect these standards will have on us in the future.
28
Table of Contents
Additional state and federal government actions directed at housing and the mortgage industry are likely to occur and could have a material adverse effect on our business, financial condition and results of operations.
Our clients’ relationships with GSEs are subject to change, which could have a material adverse effect on our business, financial condition and results of operations.
Our clients have significant relationships with Fannie Mae and Freddie Mac, which are GSEs, tasked with working with financial institutions to provide liquidity to the mortgage market. They do this by purchasing loans from the lenders either for cash or in exchange for a mortgage-backed security that comprises those loans and that, for a fee, carries the GSE’s guarantee of timely payment of interest and principal. Because our clients service the loans owned by GSEs, we provide solutions and services for many of those loans. As a result of these relationships, GSEs have been able to implement changes to our pricing structure on certain products and services we provide. GSEs or other governmental agencies may be able to exert similar pressure on the pricing of our solutions and services in the future, which could have a material adverse effect on our business, financial condition and results of operations.
If we fail to adapt our solutions to technological changes or evolving industry standards, or if our ongoing efforts to upgrade our technology are not successful, we could lose clients and have difficulty attracting new clients for our solutions, which could have a material adverse effect on our business, financial condition and results of operations.
The markets for our solutions are characterized by constant technological changes, frequent introductions of new products and services and evolving industry standards. Our future success will be significantly affected by our ability to successfully enhance our current solutions, and develop and introduce new solutions and services that address the increasingly sophisticated needs of our clients and their customers. These initiatives carry the risks associated with any new product or service development effort, including cost overruns, delays in delivery and performance issues. There can be no assurance that we will be successful in developing, marketing and selling new solutions and services that meet these changing demands, that we will not experience difficulties that could delay or prevent the successful development, introduction, and marketing of these solutions and services, or that our new solutions and services and their enhancements will adequately meet the demands of the marketplace and achieve market acceptance. If our efforts are unsuccessful, it could have a material adverse effect on our business, financial condition and results of operations.
We operate in a competitive business environment and, if we are unable to compete effectively, it could have a material adverse effect on our business, financial condition and results of operations.
The markets for our solutions are intensely competitive. Our competitors vary in size and in the scope and breadth of the services they offer. Some of our competitors have substantial resources. In addition, we expect that the markets in which we compete will continue to attract new competitors and new technologies. There can be no assurance that we will be able to compete successfully against current or future competitors or that competitive pressures we face in the markets in which we operate will not have a material adverse effect on our business, financial condition and results of operations.
Recently, several new entrants in the mortgage industry have been aggressively acquiring mortgage servicing rights from large national lenders. These new entrants primarily use affiliated service providers rather than third parties such as us. Although we believe we compete favorably against these affiliates, to the extent this trend continues it could have a material adverse effect on our business, financial condition and results of operations.
Further, because many of our larger potential clients have historically developed their key processing applications in-house and therefore view their system requirements from a make-versus-buy perspective, we often compete against our potential clients’ in-house capacities. As a result, gaining new clients in our mortgage
29
Table of Contents
processing business can be difficult. For banks and other potential clients, switching from an internally designed system to an outside vendor, or from one vendor of mortgage processing services to a new vendor, is a significant undertaking. These potential clients worry about potential disadvantages such as loss of custom functionality, increased costs and business disruption. As a result, these potential clients often resist change. There can be no assurance that our strategies for overcoming potential clients’ reluctance to change will be successful, and if we are unsuccessful, it could have a material adverse effect on our business, financial condition and results of operations.
To the extent the availability of free or relatively inexpensive information increases, the demand for some of our data and information solutions may decrease, which could have a material adverse effect on our business, financial condition and results of operations.
Public sources of free or relatively inexpensive information have become increasingly available recently, particularly through the Internet, and this trend is expected to continue. Governmental agencies in particular have increased the amount of information to which they provide free public access. Public sources of free or relatively inexpensive information may reduce demand for, or the price that clients are willing to pay for, our data and information solutions. To the extent that clients choose not to obtain data and information from us and instead rely on information obtained at little or no cost from these public sources, it could have a material adverse effect on our business, financial condition and results of operations.
We rely upon proprietary technology and information rights, and if we are unable to protect our rights, it could have a material adverse effect on our business, financial condition and results of operations.
Our success depends, in part, upon our intellectual property rights. We rely primarily on a combination of patents, copyrights, trade secrets, and trademark laws and nondisclosure and other contractual restrictions on copying, distribution and creation of derivative products to protect our proprietary technology and information. This protection is limited, and our intellectual property could be used by others without our consent. In addition, patents may not be issued with respect to our pending or future patent applications, and our patents may not be upheld as valid or may not prevent the development of competitive products. Any infringement, disclosure, loss, invalidity of, or failure to protect our intellectual property could have a material adverse effect on our business, financial condition and results of operations. Moreover, litigation may be necessary to enforce or protect our intellectual property rights, to protect our trade secrets, or to determine the validity and scope of the proprietary rights of others. Such litigation could be time-consuming, result in substantial costs and diversion of resources and could have a material adverse effect on our business, financial condition and results of operations.
If our applications or services are found to infringe the proprietary rights of others, we may be required to change our business practices and may also become subject to significant costs and monetary penalties, any of which could have a material adverse effect on our business, financial condition and results of operations.
As our information technology applications and services develop, we may become increasingly subject to infringement claims. Any such claims, whether with or without merit, could:
| • | be expensive and time-consuming to defend; |
| • | cause us to cease providing solutions that incorporate the challenged intellectual property; |
| • | require us to redesign our solutions, if feasible; |
| • | divert management’s attention and resources; and |
| • | require us to enter into royalty or licensing agreements in order to obtain the right to use necessary technologies. |
Any one or more of the foregoing outcomes could have a material adverse effect on our business, financial condition and results of operations. Additionally, we may be liable for damages for past infringement if a court determines that our software or technologies infringe upon a third party’s patent or other proprietary rights.
30
Table of Contents
If we are unable to successfully consummate and integrate acquisitions, it could have a material adverse effect on our business, financial condition and results of operations.
One of our strategies to grow our business is to opportunistically acquire complementary businesses, technologies and services. This strategy will depend on our ability to find suitable acquisitions and finance them on acceptable terms. We may require additional debt or equity financing for future acquisitions, and doing so will be made more difficult by our substantial debt. Raising additional capital for acquisitions through debt financing would result in increased interest expense and may involve agreements that include covenants limiting or restricting our ability to take certain actions, such as incurring additional debt, making capital expenditures or declaring dividends. If we raise additional capital for acquisitions through equity financing, the ownership interests of existing stockholders will be diluted.
If we are unable to acquire suitable acquisition candidates, we may experience slower growth. Further, even if we successfully complete acquisitions, we will face challenges in integrating any acquired business. These challenges include eliminating redundant operations, facilities and systems, coordinating management and personnel, retaining key employees, managing different corporate cultures, and achieving cost reductions and cross-selling opportunities. Additionally, the acquisition and integration processes may disrupt our business and divert management attention and our resources. If we fail to successfully integrate acquired businesses, products, technologies and personnel, it could impair relationships with employees, clients and strategic partners, distract management attention from our core businesses, result in control failures and otherwise disrupt our ongoing business, any of which could have a material adverse effect on our business, financial condition and results of operations. We also may not be able to retain key management and other critical employees after an acquisition. In addition, we may be required to record future charges for impairment of goodwill resulting from such acquisitions.
Our profitability may be impacted by gains or losses on any sales of businesses, or lost operating income or cash flows from such businesses. We also may be required to record asset impairment or restructuring charges related to divested businesses, or indemnify buyers for liabilities, which may reduce our profitability and cash flows. We may also be unable to negotiate such divestitures on terms acceptable to us. If we are unsuccessful in divesting such businesses, it could have a material adverse effect on our business, financial condition and results of operations.
Our reliance on third parties subjects us to risk and may disrupt or adversely affect our operations. In addition, we may not realize the full benefit of our third-party arrangements, which may result in increased costs, or may adversely affect the service levels we are able to provide our clients.
We rely upon third parties for various business process and information technology services, including information security testing, telecommunications and software code development. Although we have contractual provisions with our providers that specify performance requirements, we do not ultimately control their performance, which may make our operations vulnerable to their performance failures. In addition, our failure to adequately monitor and regulate the performance of our third-party vendors could subject us to additional risk. Reliance on third parties also makes us vulnerable to changes in our vendors’ business, financial condition and other matters outside of our control, including their violations of laws or regulations, which could increase our exposure to liability or otherwise increase the costs associated with the operation of our business. The failure of our providers to perform as expected or as contractually required could result in significant disruptions and costs to our operations and to the services we provide to our clients, which could have a material adverse effect on our business, financial condition and results of operations.
31
Table of Contents
We depend on our ability to access data from external sources to maintain and grow our businesses. If we are unable to access needed data from these sources or if the prices charged for these services increase, the quality, pricing and availability of our solutions may be adversely affected, which could have a material adverse impact on our business, financial condition and results of operations.
We rely extensively upon data from a variety of external sources to maintain our proprietary and non-proprietary databases, including data from third-party suppliers, various government and public record sources and data contributed by our clients. Our data sources could cease providing or reduce the availability of their data to us, increase the price we pay for their data, or limit our use of their data for a variety of reasons, including legislatively- or judicially-imposed restrictions on use. If a number of suppliers are no longer able or are unwilling to provide us with certain data, or if our public record sources of data become unavailable or too expensive, we may need to find alternative sources. If we are unable to identify and contract with suitable alternative data suppliers and efficiently and effectively integrate these data sources into our service offerings, we could experience service disruptions, increased costs and reduced quality of our services. Moreover, some of our suppliers compete with us in certain product offerings, which may make us vulnerable to unpredictable price increases from them. Significant price increases could require us to seek substitute sources of data on more favorable economic terms, which may not be available at all. Loss of such access or the availability of data in the future on commercially reasonable terms or at all may reduce the quality and availability of our services and solutions, which could have a material adverse effect on our business, financial condition and results of operations.
Our international third-party service providers and our own international operations subject us to additional risks, which could have a material adverse effect on our business, financial condition and results of operations.
Over the last few years, we have sought to reduce our costs by utilizing lower-cost labor outside the United States in countries such as India. These countries are subject to higher degrees of political and social instability than the United States and may lack the infrastructure to withstand political unrest or natural disasters. Such disruptions can impact our ability to deliver our solutions on a timely basis, if at all, and to a lesser extent can decrease efficiency and increase our costs. Weakness of the U.S. dollar in relation to the currencies used and higher inflation rates experienced in these countries may also reduce anticipated savings. Furthermore, the practice of utilizing labor based in foreign countries has come under increased scrutiny in the United States and, as a result, many of our clients may require us to use labor based in the United States. We may not be able to pass on the increased costs of higher-priced United States-based labor to our clients, which could have a material adverse effect on our business, financial condition and results of operations.
In addition, the foreign countries in which we have outsourcing arrangements or operate could adopt new legislation or regulations that would make it difficult, more costly or impossible for us to continue our foreign activities as currently being conducted. In addition, in many foreign countries, particularly in those with developing economies, it is common to engage in business practices that are prohibited by laws and regulations applicable to us, such as the Foreign Corrupt Practices Act, or the FCPA, or other local anti-corruption laws. Any violations of FCPA or local anti-corruption laws by us, our subsidiaries or our local agents, could result in substantial financial and other penalties, which could have a material adverse effect on our business, financial condition and results of operations.
We have substantial investments in recorded goodwill as a result of the Acquisition, and an economic downturn or troubled mortgage market could cause these investments to become impaired, requiring write-downs that could have a material adverse effect on our results of operations.
Goodwill recorded on our balance sheet was approximately $2.2 billion, or approximately 61% of our total assets, as of September 30, 2014. Current accounting rules require that goodwill be assessed for impairment at least annually or whenever changes in circumstances indicate that the carrying amount may not be recoverable from estimated future cash flows. Factors that may indicate the carrying value of our intangible assets, including
32
Table of Contents
goodwill, may not be recoverable include, but are not limited to, significant underperformance relative to historical or projected future results of operations, a significant decline in our stock price and market capitalization, and negative industry or economic trends.
We expect that the results of our 2014 annual assessment of the recoverability of goodwill will indicate that the fair value net assets we acquired will be in excess of the carrying value. The valuation model that is used to estimate fair value contemplates certain assumptions made by management about the timing and volume of incremental business resulting from our investments. If actual results are not consistent with our assumptions, we may be required to record goodwill impairment charges in the future which could have a material adverse effect on our results of operations.
If we fail to develop widespread brand awareness cost-effectively, it could have a material adverse effect on our business, financial condition and results of operations.
We believe that developing and maintaining widespread awareness of our brand in a cost-effective manner is critical to our ability to achieve widespread acceptance of our technology and attract new clients. Brand promotion activities may not generate client awareness or increase revenues, and even if they do, any increase in revenues may not offset the expenses we incur in building our brand. If we fail to successfully promote and maintain our brand, or incur substantial expenses, we may fail to attract or retain clients necessary to realize a sufficient return on our brand-building efforts, or to achieve the widespread brand awareness that is critical for broad client adoption of our applications.
We may experience system failures with respect to our technology solutions, damage or interruption which could harm our business and reputation and expose us to potential liability.
We depend heavily upon the computer systems and our existing technology infrastructure located in our data centers and certain systems interruptions or events beyond our control could interrupt or terminate the delivery of our solutions and services to our clients and may interfere with our suppliers’ ability to provide necessary data to us and our employees’ ability to attend to work and perform their responsibilities.
These potential interruptions include, but are not limited to, damage or interruption from hurricanes, floods, fires, power losses, telecommunications outages, terrorist attacks, acts of war, human errors and similar events. Our U.S. corporate offices and primary data center are located in Jacksonville, Florida, which is an area that is at high risk of hurricane and flood damage. In addition, acts of terrorism, which may be targeted at metropolitan areas that have higher population density than rural areas, could cause disruptions in our business or the economy as a whole. The servers that we use through various third-party service providers may also be vulnerable to similar disruptions, which could lead to interruptions, delays and loss of critical data. Such service providers may not have sufficient protection or recovery plans in certain circumstances, and our insurance may not be sufficient to compensate us for losses that may occur.
Defects in our technology solutions, errors or delays in the processing of electronic transactions, or other difficulties could result in:
| • | interruption of business operations; |
| • | delay in market acceptance; |
| • | us, or our clients, missing a regulatory deadline; |
| • | additional development and remediation costs; |
| • | diversion of technical and other resources; |
| • | loss of clients; |
| • | negative publicity; or |
| • | exposure to liability claims. |
33
Table of Contents
Any one or more of the foregoing occurrences could have a material adverse effect on our business, financial condition and results of operations. Although we attempt to limit our potential liability through disclaimers and limitation-of-liability provisions in our license and client agreements, we cannot be certain that these measures will be successful in limiting our liability.
We may experience delays or difficulty in developing or implementing new or enhanced software or hosting solutions, which may negatively affect our relationships with existing and potential clients, reduce or delay the generation of revenues or increase development and implementation costs, which could have a material adverse effect on our business, financial condition and results of operations.
Our future financial performance and revenue growth depend upon the successful development, implementation and client acceptance of new and enhanced versions of our software and hosting solutions. We continually seek to develop enhancements to our solutions, including updates in response to changes in applicable laws, as well as new offerings to supplement our existing solutions, As a result, we are subject to the risks inherent in the development and integration of new technologies, including defects or undetected errors in our technology solutions, difficulties in installing or integrating our technologies on platforms used by our clients, or other unanticipated performance, stability and compatibility problems. Any of these problems could result in material delays in the introduction or acceptance of our solutions, increased costs, decreased client satisfaction, breach of contract claims, harm to our industry reputation and reduced or delayed revenues. If we are unable to deliver new solutions or upgrades or other enhancements to our existing solutions on a timely and cost-effective basis, it could have a material adverse effect on our business, financial condition and results of operations.
Because our revenue from clients in the mortgage lending industry is affected by the strength of the economy and the housing market generally, including the volume of real estate transactions, a change in any of these conditions could have a material adverse effect on our business, financial condition and results of operations.
Our revenue is primarily generated from technology, data and analytics we provide to the mortgage lending industry and, as a result, a weak economy or housing market may have a material adverse effect on our business, financial condition and results of operations. The volume of mortgage origination and residential real estate transactions is highly variable and reductions in these transaction volumes could have a direct impact on the revenues we generate from our technology business and some of our data and analytics businesses.
The revenues we generate from our servicing technology depend upon the total number of mortgage loans processed on our MSP platform, which tends to be comparatively consistent regardless of economic conditions. However, in the event that a difficult economy or other factors lead to a decline in levels of home ownership and a reduction in the number of mortgage loans outstanding and we are not able to counter the impact of those events with increased market share or higher fees, our mortgage processing revenues could be adversely affected. Moreover, negative economic conditions, including increased unemployment or interest rates or a downturn in other general economic factors, among other things, could adversely affect the performance and financial condition of some of our clients in many of our businesses, which may have a material adverse effect on our business, financial condition and results of operations if these clients go bankrupt or otherwise exit certain businesses.
A weaker economy and housing market tend to increase the volume of consumer mortgage defaults, which can increase revenues from our applications focused on supporting default management functions. However, government regulation of the mortgage industry in general, and the default and foreclosure process in particular, has greatly slowed the processing of defaulted mortgages in recent years and has changed the way many of our clients address mortgage loans in default. A downturn in the origination market and a concurrent slowdown or change in the way mortgage loans in default are addressed could have a material adverse effect on our business, financial condition and results of operations.
34
Table of Contents
We have substantial indebtedness, which could have a negative impact on our financing options and liquidity position.
As of September 30, 2014, we had approximately $2.2 billion of total debt outstanding, consisting of senior unsecured notes and intercompany loans that are payable to FNF.
Our substantial indebtedness could have important consequences to us, including:
| • | making us more vulnerable to economic downturns and adverse developments in our business, which may cause us to have difficulty borrowing money in the future for working capital, capital expenditures, acquisitions or other purposes and may limit our ability to pursue other business opportunities and implement certain business strategies; |
| • | requiring us to use a large portion of the money we earn to pay principal and interest on our debt, which will reduce the amount of money available to finance operations, acquisitions and other business activities; |
| • | exposing us to the risk of increased interest rates as approximately $820 million in principal amount of our debt bears interest at a floating rate (a one percent increase in interest rates would result in a $1.0 million increase in our annual interest expense for every $100 million of floating rate debt we incur, which may make it more difficult for us to service our debt); |
| • | exposing us to costs and risks associated with agreements limiting our exposure to higher interest rates that we may enter into in the future, as such agreements may not offer complete protection from these risks, and we are subject to the risk that one or more of the counterparties to these agreements may fail to satisfy their obligations under such agreements; and |
| • | causing a competitive disadvantage if we have higher levels of debt than our competitors by reducing our flexibility in responding to changing business and economic conditions, including increased competition. |
Risks associated with our indebtedness could have a material adverse effect on our business, financial condition and results of operations.
Despite our indebtedness level, we still may be able to incur significant additional amounts of debt, which could further exacerbate the risks associated with our substantial indebtedness.
We and our subsidiaries may be able to incur substantial additional indebtedness in the future. Although the agreements governing our intercompany loans and the indenture governing our senior unsecured notes each will impose operating and financial restrictions on our activities, these restrictions are subject to a number of significant qualifications and exceptions, and under certain circumstances, the amount of indebtedness that could be incurred in compliance with these restrictions could be substantial. If new debt is added to our outstanding debt levels, the risks related to our indebtedness that we will face would increase.
Certain of our financing arrangements subject us to various restrictions that could limit our operating flexibility.
The indenture governing our senior unsecured notes imposes operating and financial restrictions on our activities, and future debt instruments may as well. These restrictions may include compliance with, or maintenance of, certain financial tests and ratios, including a minimum interest coverage ratio and maximum leverage ratio, and limit or prohibit our ability to, among other things:
| • | create, incur or assume any additional debt and issue preferred stock; |
| • | create, incur or assume certain liens; |
| • | redeem and/or prepay certain subordinated debt we might issue in the future; |
35
Table of Contents
| • | pay dividends on our stock or repurchase stock; |
| • | make certain investments and acquisitions; |
| • | enter into or permit to exit contractual limits on the ability of our subsidiaries to pay dividends to us; |
| • | enter new lines of business; |
| • | engage in consolidations, mergers and acquisitions; |
| • | engage in specified sales of assets; and |
| • | enter into transactions with affiliates. |
These restrictions on our ability to operate our business could limit our ability to take advantage of financing, merger and acquisition and other corporate opportunities, which could have a material adverse effect on our business, financial condition and results of operations.
We may not be able to generate sufficient cash to service all of our indebtedness and may be forced to take other actions to satisfy our obligations under our outstanding debt instruments, which may not be successful.
Our ability to make scheduled payments on or refinance our debt obligations depends on our financial condition and results of operations, which are subject to prevailing economic and competitive conditions and to certain financial, business, legislative, regulatory and other factors beyond our control. We may be unable to maintain a level of cash flows from operating activities sufficient to permit us to pay the principal, premium, if any, and interest on our indebtedness. Our inability to generate sufficient cash flows to satisfy our debt obligations, or to refinance our indebtedness on commercially reasonable terms or at all, would have a material adverse effect on our business, financial condition and results of operations. If we cannot make scheduled payments on our debt, we will be in default and holders of the intercompany loans or senior unsecured notes could declare all outstanding principal and interest to be due and payable, and we could be forced into bankruptcy or liquidation.
Our risk management policies and procedures may prove inadequate for the risks we face, which could have a material adverse effect on our business, financial condition and results of operations.
We have devoted significant resources to develop our risk management policies and procedures and expect to continue to do so in the future. Nonetheless, our risk management strategies may not be fully effective in mitigating our risk exposure in all market environments or against all types of risk, including risks that are unidentified or unanticipated. If our solutions change and as the markets in which we operate evolve, our risk management strategies may not always adapt to such changes. Some of our methods of managing risk are based upon our use of observed historical market behavior and management’s judgment. Other of our methods of managing risk depend on the evaluation of information regarding markets, customers, catastrophe occurrence or other matters that is publicly available or otherwise accessible to us. This information may not always be accurate, complete, up-to-date or properly evaluated. As a result, these methods may not predict future risk exposures, which could be significantly greater than the historical measures or available information indicate. In addition, management of operational, legal and regulatory risks requires, among other things, policies and procedures to record and verify large numbers of transactions and events, which may not be fully effective. While we employ a broad and diversified set of risk monitoring and risk mitigation techniques, those techniques and the judgments that accompany their application cannot anticipate every economic and financial outcome or the timing of such outcomes. If our risk management efforts are ineffective, we could suffer losses that could have a material adverse effect on our business, financial condition or results of operations. In addition, we could be subject to litigation, particularly from our clients, and sanctions or fines from regulators.
36
Table of Contents
Certain members of our board of directors and certain of our officers and directors have interests and positions that could present potential conflicts.
We are party to a variety of related party agreements and relationships with FNF, certain of FNF’s subsidiaries and THL. Certain of our executive officers are employed by FNF or FNF’s subsidiaries and certain of our directors serve on the boards of directors of FNF or its subsidiaries or are affiliated with THL. As a result of the foregoing, there may be circumstances where certain of our executive officers and directors may be subject to conflicts of interest with respect to, among other things: (i) our ongoing relationships with FNF, FNF’s subsidiaries or THL, including related party agreements and other arrangements with respect to the administration of tax matters, employee benefits and indemnification; (ii) the quality, pricing and other terms associated with services that we provide to FNF or its subsidiaries, or that they provide to us, under related party agreements; (iii) business opportunities arising for any of us, FNF, FNF’s subsidiaries or THL; and (iv) conflicts of time with respect to matters potentially or actually involving or affecting us.
We seek to manage these potential conflicts through abstention by interested directors from approval of such arrangements and oversight by independent members of our board of directors. However, there can be no assurance that such measures will be effective or that we will be able to resolve all potential conflicts, or that the resolution of any such conflicts will be no less favorable to us than if we were dealing with an unaffiliated third party.
Our senior leadership team is critical to our continued success and the loss of such personnel could have a material adverse effect on our business, financial condition and results of operations.
Our future success substantially depends on the continued service and performance of the members of our senior leadership team. These personnel possess business and technical capabilities that are difficult to replace. We have attempted to mitigate this risk by entering into long-term (two to three year) employment contracts with the members of our senior management operating team. If we lose key members of our senior management operating team, we may not be able to effectively manage our current operations or meet ongoing and future business challenges, and this could have a material adverse effect on our business, financial condition and results of operations.
We may fail to attract and retain enough qualified employees to support our operations, which could have an adverse effect on our ability to expand our business and service our clients.
Our business relies on large numbers of skilled employees and our success depends on our ability to attract, train and retain a sufficient number of qualified employees. If our attrition rate increases, our operating efficiency and productivity may decrease. We compete for employees not only with other companies in our industry but also with companies in other industries, such as software services, engineering services and financial services companies, and there is a limited pool of employees who have the skills and training needed to do our work. If our business continues to grow, the number of people we will need to hire will increase. We will also need to increase our hiring if we are not able to maintain our attrition rate through our current recruiting and retention policies. Increased competition for employees could have a material adverse effect on our ability to expand our business and service our clients, as well as cause us to incur greater personnel expenses and training costs.
We may not be able to effectively achieve our growth strategies, which could adversely affect our financial condition or results of operations.
Our growth strategies depend in part on maintaining our competitive advantage with current solutions in new and existing markets, as well as our ability to develop new technologies and solutions to serve such markets. There can be no assurance that we will be able to compete successfully in new markets or continue to compete effectively in our existing markets. If we fail to introduce new technologies or solutions effectively or on a timely basis, or if we are not successful in introducing or obtaining regulatory or market acceptance for new solutions, we may lose market share and our results of operations or cash flows could be adversely affected.
37
Table of Contents
Current and future litigation, investigations or other actions against us could be costly and time consuming to defend.
We are from time to time subject to legal proceedings and claims that arise in the ordinary course of business, such as claims brought by our clients in connection with commercial disputes and employment claims made by our current or former employees. Litigation can result in substantial costs and may divert management’s attention and resources, which may seriously harm our business, overall financial condition and operating results.
For instance, as described in note 15 to the audited consolidated financial statements of our predecessor, LPS, titled “Commitments and Contingencies,” we have, in the past, incurred substantial costs associated with the settlement of a number of inquiries made by governmental agencies and claims made by several litigants concerning various current and past business practices of primarily our predecessor’s default operations, which since January 2014 have been owned by our sister company, ServiceLink. Also, as described in note 7 to the unaudited condensed consolidated financial statements of BKFS Operating LLC titled “Commitments and Contingencies,” we have recorded expenses relating to a proceeding filed by Merion Capital L.P. and Merion Capital II L.P., together referred to herein as Merion Capital, in connection with the Acquisition seeking a judicial determination of the “fair value” of Merion Capital’s shares of LPS common stock under Delaware law, together with statutory interest. On September 18, 2014, we reached an agreement with Merion Capital to resolve an interest motion and FNF paid Merion Capital the merger consideration and we paid interest of $9.0 million through the date of payment. As of the date of this prospectus, the appraisal proceeding is ongoing. Also, BKIS has been named as a defendant in lawsuits and investigations filed against the former LPS, even though the businesses associated with these cases have been contributed to ServiceLink.
In addition, in April 2011, the former LPS, now BKIS, and certain of its subsidiaries entered into a consent order, or the Consent Order, with several banking agencies in relation to its default operations, which are now part of ServiceLink. As part of the Consent Order, LPS agreed to further study the issues identified in a review by several banking agencies and to enhance its compliance, internal audit, risk management and board oversight plans, among additional agreed undertakings. In January 2013, LPS entered into settlement agreements with 49 states and the District of Columbia relating to certain practices within its default operations. However, the banking agencies are not precluded from seeking civil money penalties in the future. While the businesses underlying the subject matter of the Consent Order have been transferred to ServiceLink in connection with the Internal Reorganization and while we have entered into an indemnification agreement with ServiceLink that indemnifies us from claims relating to civil money penalties sought by the banking agencies relating to the Consent Order, there can be no guarantee that the banking agencies will not seek civil money penalties from us in the future or that we will be forestalled from making payments related thereto.
As of September 30, 2014, our accrual for legal and regulatory matters that are probable and estimable is $3.9 million, and includes costs associated with recently settled matters, as well as estimated costs of settlement, damages and associated legal fees applicable to certain pending litigation and regulatory matters, and assumes no third-party recoveries. There can be no assurance that we will not incur additional material costs and expenses in connection with ongoing or future investigations or claims, including but not limited to fines or penalties and legal costs, or be subject to other remedies, any of which could have a material adverse effect on our business, financial condition and results of operations. Insurance may not cover such investigations and claims, may not be sufficient for one or more such investigations and claims and may not continue to be available on terms acceptable to us. An investigation or claim brought against us that is uninsured or underinsured could result in unanticipated costs, management distraction or reputational harm, which could have a material adverse effect on our business, financial condition and results of operations and adversely impact the trading price of our stock.
38
Table of Contents
Risks Related to Our Structure
We are a holding company and our only material asset after completion of the Offering Reorganization and this offering will be our interest in BKFS Operating LLC and, accordingly, we are dependent upon distributions from BKFS Operating LLC to pay taxes and other expenses.
We will be a holding company and will have no material assets other than our ownership of Units of BKFS Operating LLC. We will have no independent means of generating revenue. BKFS Operating LLC will be treated as a partnership for United States federal income tax purposes and, as such, will not itself be subject to United States federal income tax. Instead, its taxable income will generally be allocated to its members, including us, according to the membership interests each member owns. Accordingly, we will incur income taxes on our share of any taxable income of BKFS Operating LLC and also will incur expenses related to our operations. Subject to the availability of net cash flow at the BKFS Operating LLC level and to applicable legal and contractual restrictions, we intend to cause BKFS Operating LLC to distribute cash to its members, including us, in an amount at least equal to the amount necessary to cover their respective tax liabilities, if any, with respect to their allocable share of the income of BKFS Operating LLC and to cover any other costs or expenses of the issuer, including dividends, if we ever determine to pay dividends, as well as any payments due under the tax receivable agreement, as described below. Prior to the completion of this offering, we intend to enter into an advancement agreement with BKFS Operating LLC pursuant to which BKFS Operating LLC will advance the cost of (or pay on behalf of the issuer) expenses incurred by the issuer, including fees and expenses incurred in any equity offering by the issuer, including this offering, customary costs and expenses associated with being a public company, including costs of professional advisors engaged by the issuer or board of directors, indemnification obligations of the issuer, directors fees and certain taxes. See “Certain Relationships and Related Party Transactions—Advancement Agreement.” To the extent that we need funds to pay our liabilities or to fund our operations, and BKFS Operating LLC is restricted from making distributions to us under applicable agreements, laws or regulations or does not have sufficient cash to make these distributions, we may have to borrow funds to meet these obligations and operate our business, and our liquidity and financial condition could be materially adversely affected. To the extent that we are unable to make payments under the tax receivable agreement for any reason, such payments will be deferred and will accrue interest until paid.
Any payments made under the tax receivable agreement to our equity holders that are parties to such agreement could be significant and will reduce the amount of overall cash flow that might otherwise be available to us if we did not distribute any income tax benefits we may be entitled to.
Upon the closing of this offering, we expect to enter into a tax receivable agreement with holders of our Units that will require us to pay such holders a fixed percentage of certain tax benefits to which we may become entitled. The payments we make under the tax receivable agreement may be substantial and would reduce the amount of overall cash flow that might otherwise be available to us if we did not distribute any income tax benefits to which we may be entitled. See “Our Corporate Structure—Tax Receivable Agreement.”
If we elect to have BKFS Operating LLC make cash payments for future exchanges of Units, in lieu of issuing shares of Class A common stock, such payments may reduce the amount of overall cash flow that would otherwise be available to us.
Each outstanding Unit, together with one share of our Class B common stock, is exchangeable for, at the issuer’s option, either one share of Class A common stock or a cash payment from BKFS Operating LLC, as described under “Our Corporate Structure—The Amended and Restated Operating Agreement.” We also expect that the Amended and Restated Operating Agreement will provide that, at the election of a Grant Unit holder, vested Grant Units may be converted into the right to receive a number of Units based on the value of BKFS Operating LLC above a specified hurdle amount in respect of such Grant Units, which can then be exchanged for, at the issuer’s option, either shares of our Class A common stock on a one-for-one basis, according to the terms of the Amended and Restated Operating Agreement, or a cash payment. If the issuer elects to have BKFS Operating LLC make cash payments in respect of exchanges of Units in lieu of issuing shares of Class A common stock,
39
Table of Contents
such payments may require the payment of significant amounts of cash and may reduce the amount of overall cash flow that would otherwise be available for distribution to us from BKFS Operating LLC, and our ability to successfully execute our growth strategy may be negatively affected.
We are a “controlled company” within the meaning of NYSE rules, and as a result, we qualify for, and may rely on, exemptions from certain corporate governance requirements. You may not have the same protections afforded to stockholders of companies that are subject to such requirements.
BKHI controls a majority of the voting power of our outstanding common stock and, upon completion of this offering, will continue to hold a controlling interest in us as a result of its ownership of Class B common stock. As a result, we qualify as a “controlled company” within the meaning of the corporate governance rules of the NYSE. Under these rules, a company of which more than 50% of the voting power in the election of directors is held by an individual, group or another company is a “controlled company” and may elect not to comply with certain corporate governance requirements, including the requirements that (i) a majority of the board of directors consist of independent directors and (ii) that the board of directors have compensation and nominating and corporate governance committees composed entirely of independent directors.
We intend to utilize the independence exception provided for our compensation and nominating and corporate governance committees. As a result, immediately following this offering we will not have a compensation or nominating and corporate governance committee composed entirely of independent directors. In addition, while our board of directors is currently composed of a majority of independent directors, we may have a board of directors that is not composed of a majority of independent directors at any time in the future so long as we are still a controlled company. Accordingly, you will not have the same protections afforded to stockholders of companies that are subject to all of the corporate governance requirements set by the NYSE. In the event that we cease to be a “controlled company” and our shares continue to be listed on the NYSE, we will be required to comply with these provisions within the applicable transition periods. These exemptions do not modify the independence requirements for our audit committee, and we intend to comply with the applicable requirements of the Securities and Exchange Commission, or the SEC, and the NYSE with respect to our audit committee within the applicable time frame following the completion of this offering.
We are controlled by FNF, whose interests may differ from those of our public stockholders.
We are controlled by FNF through its wholly-owned subsidiary, BKHI, and after this offering will continue to be controlled by FNF. After the completion of this offering, FNF, through BKHI, will beneficially own in the aggregate approximately % of the combined voting power of our common stock (or approximately % if the underwriters exercise their option to purchase additional shares in full). As a result of this ownership, FNF will have effective control over the outcome of votes on all matters requiring approval by our stockholders, including the election of directors, the adoption of amendments to our charter and bylaws and other significant corporate transactions, including a sale of control or such other corporate transactions that may affect our obligations under the tax receivable agreement. FNF can also cause BKHI to take actions that have the effect of delaying or preventing a change of control of us or discouraging others from making tender offers for our shares, which could prevent stockholders from receiving a premium for their shares. These actions may be taken even if other stockholders oppose them.
In addition, persons associated with FNF currently serve on our board of directors. Following this offering, the interests of FNF may not always coincide with the interests of our other stockholders, and the concentration of effective control in FNF will limit other stockholders’ ability to influence corporate matters. The concentration of ownership and voting power of FNF, through BKHI, may also delay, defer or even prevent an acquisition by a third party or other change of control and may make some transactions more difficult or impossible without their support, even if such events are in the best interests of our other stockholders. Therefore, the concentration of voting power controlled by FNF, through BKHI, may have an adverse effect on the price of our Class A common stock. We may also take actions that our other stockholders do not view as beneficial, which may adversely affect our results of operations and financial condition and cause the value of your investment to decline.
40
Table of Contents
Further, FNF may have an interest in pursuing acquisitions, divestitures, financing or other transactions, including, but not limited to, the issuance of additional debt or equity and the declaration and payment of dividends, that, in its judgment, could enhance their equity investments, even though such transactions may involve risk to us or to our creditors. Additionally, FNF may make investments in businesses that directly or indirectly compete with us, or may pursue acquisition opportunities that may be complementary to our business and, as a result, those acquisition opportunities may not be available to us.
Our charter and bylaws, the Amended and Restated Operating Agreement and provisions of Delaware law may discourage or prevent strategic transactions, including a takeover of our company, even if such a transaction would be beneficial to our stockholders.
Provisions contained in our charter and bylaws, the Amended and Restated Operating Agreement and provisions of the Delaware General Corporate Law, or DGCL, could delay or prevent a third party from entering into a strategic transaction with us, as applicable, even if such a transaction would benefit our stockholders. For example, our charter and bylaws:
| • | divide our board of directors into three classes with staggered three-year terms, which may delay or prevent a change of our management or a change of control; |
| • | authorize the issuance of “blank check” preferred stock that could be issued by us upon approval of our board of directors to increase the number of outstanding shares of capital stock, making a takeover more difficult and expensive; |
| • | provide that directors may be removed from office only for cause and only by the affirmative vote of 66 2/3% or more of the voting power of all of the shares of our capital stock entitled to vote and that any vacancy on our board of directors may only be filled by a majority of our directors then in office, which may make it difficult for other stockholders to reconstitute our board of directors; |
| • | do not permit stockholders to take action by written consent; |
| • | provide that special meetings of the stockholders may be called only upon the request of a majority of our board of directors or by our Chief Executive Officer; |
| • | require advance notice to be given by stockholders for any stockholder proposals or director nominees; |
| • | require a super-majority vote of the stockholders to amend certain provisions of our charter; and |
| • | allow our board of directors to amend our bylaws by the affirmative vote of a majority of directors but only allow stockholders to amend our bylaws upon the approval of 66 2/3% or more of the voting power of all of the shares of our capital stock entitled to vote. |
In addition, we are subject to certain provisions of Delaware law that limit, in some cases, our ability to engage in certain business combinations with significant stockholders. See “Description of Capital Stock.”
These restrictions and provisions could keep us from pursuing relationships with strategic partners and from raising additional capital, which could impede our ability to expand our business and strengthen our competitive position. These restrictions could also limit stockholder value by impeding a sale of us or BKFS Operating LLC.
Risks Related to this Offering
There is no existing market for our Class A common stock, and we do not know if one will develop. Even if a market does develop, the stock prices in the market may not exceed the offering price.
Prior to this offering, there has not been a public market for our Class A common stock or any of our equity interests. We cannot predict the extent to which investor interest in our company will lead to the development of an active trading market on the NYSE, or how liquid that market may become. An active public market for our Class A
41
Table of Contents
common stock may not develop or be sustained after this offering. If an active trading market does not develop or is not sustained, you may have difficulty selling any shares of our Class A common stock that you buy.
The initial public offering price for our Class A common stock will be determined by negotiations among us and the representatives of the underwriters and may not be indicative of prices that will prevail in the open market following this offering. Consequently, you may not be able to sell shares of our Class A common stock at prices equal to or greater than the price you pay in this offering.
The market price of our Class A common stock may be volatile and you may lose all or part of your investment.
The market price of our Class A common stock could fluctuate significantly, and you may not be able to resell your shares at or above the offering price. Those fluctuations could be based on various factors in addition to those otherwise described in this prospectus, including those described under “—Risks Related to Our Business” and the following:
| • | our operating performance and the performance of our competitors and fluctuations in our operating results; |
| • | the public’s reaction to our press releases, our other public announcements and our filings with the SEC; |
| • | the failure of security analysts to cover our Class A common stock after this offering or changes in earnings estimates or recommendations by research analysts who follow us or other companies in our industry; |
| • | global, national or local economic, legal and regulatory factors unrelated to our performance; |
| • | announcements by us or our competitors of new products, services, strategic investments or acquisitions; |
| • | actual or anticipated variations in our or our competitors’ operating results, and our and our competitors’ growth rates; |
| • | failure by us or our competitors to meet analysts’ projections or guidance that we or our competitors may give the market; |
| • | changes in laws or regulations, or new interpretations or applications of laws and regulations, that are applicable to our business; |
| • | changes in accounting standards, policies, guidance, interpretations or principles; |
| • | the arrival or departure of key personnel; |
| • | the number of shares to be publicly traded after this offering; |
| • | future sales or issuances of our Class A common stock, including sales or issuances by us, our officers or directors and our significant stockholders, including BKHI; and |
| • | other developments affecting us, our industry or our competitors. |
In addition, in recent years the stock market has experienced significant price and volume fluctuations that have affected and continue to affect the market prices of equity securities of many companies. These fluctuations have often been unrelated or disproportionate to the operating performance of those companies. These broad market fluctuations, as well as general economic, political and market conditions such as recessions or interest rate changes, may cause declines in the market price of our Class A common stock. If the market price of our Class A common stock after this offering does not exceed the initial public offering price, you may not realize any return on your investment in us and may lose some or all of your investment.
42
Table of Contents
As we operate in a single industry, we are especially vulnerable to these factors to the extent that they affect our industry or our products. In the past, securities class action litigation has often been initiated against companies following periods of volatility in their stock price. This type of litigation could result in substantial costs and divert our management’s attention and resources, and could also require us to make substantial payments to satisfy judgments or to settle litigation.
Future sales of our Class A common stock in the public market could cause the market price of our Class A common stock to decrease significantly.
Sales of substantial amounts of our Class A common stock in the public market following this offering by our existing stockholders, by persons who acquire shares in this offering or by persons that acquire shares or our Class A common stock upon the exchange of Units (together with an equal number of shares of our Class B common stock) may cause the market price of our Class A common stock to decrease significantly. These issuances, or the possibility that these issuances may occur, may also make it more difficult for us to raise additional capital by selling equity securities in the future, at a time and price that we deem appropriate.
In connection with this offering, we expect that our officers, directors and holders of substantially % of our outstanding common stock will enter into lock-up agreements with the underwriters of this offering that, subject to certain exceptions, prohibit the signing party from selling, contracting to sell or otherwise disposing of any Class A common stock or securities that are convertible or exchangeable for Class A common stock, including Units, or entering into any arrangement that transfers the economic consequences of ownership of our Class A common stock for at least 180 days from the date of this prospectus filed in connection with this offering, although the representatives of the underwriters may, in their sole discretion and at any time without notice, release all or any portion of the securities subject to these lock-up agreements. Upon a request to release any shares subject to a lock-up, the representatives of the underwriters would consider the particular circumstances surrounding the request including, but not limited to, the length of time before the lock-up expires, the number of shares requested to be released, reasons for the request, the possible impact on the market for our Class A common stock and whether the holder of our shares requesting the release is an officer, director or other affiliate of ours. As a result of these lock-up agreements, notwithstanding earlier eligibility for sale under the provisions of Rule 144 under the Securities Act of 1933, as amended, or the Securities Act, none of these shares would be allowed to be sold until at least 180 days after the date of this prospectus. See “Shares Eligible for Future Sale” and “Underwriting.”
Additional shares of Class A common stock may be issued in the future upon the exchange of Units and the conversion and exchange of vested Grant Units. We also may adopt an equity incentive plan pursuant to which stock options to purchase shares of Class A common stock and other stock-based awards are anticipated to be issued in the future from time to time to our officers, directors and employees. Upon an adoption of this equity incentive plan, we would file a registration statement registering under the Securities Act the shares of Class A common stock that are reserved for issuance under our equity incentive plan.
As restrictions on resale expire or as shares are registered, our share price could drop significantly if the holders of these restricted or newly registered shares sell them or are perceived by the market as intending to sell them. These sales might also make it more difficult for us to raise capital through the sale of equity securities in the future at a time and at a price that we deem appropriate.
See “Shares Eligible for Future Sale” for a more detailed description of the shares that will be available for future sales upon completion of this offering.
If you purchase shares of our Class A common stock sold in this offering, you will incur immediate and substantial dilution and may incur additional dilution in the future.
If you purchase shares of our Class A common stock in this offering, you will incur immediate and substantial dilution in the amount of $ per share because the initial public offering price of $ , which represents
43
Table of Contents
the midpoint of the estimated offering price range set forth on the cover page of this prospectus, is substantially higher than the pro forma as adjusted net tangible book value per share of our outstanding Class A common stock. See “Dilution.”
If we elect to issue shares of Class A common stock upon exchange or conversion of Units, in lieu of making a cash payment, such issuance of Class A common stock may dilute your ownership of Class A common stock.
Each outstanding Unit, together with one share of our Class B common stock, is exchangeable for, at the issuer’s option, either one share of Class A common stock or a cash payment, as described under “Our Corporate Structure—The Amended and Restated Operating Agreement.” In addition, we expect that the Amended and Restated Operating Agreement will provide that vested Grant Units may be converted, at the election of a Grant Unit holder, into the right to receive a number of Units based upon the value of BKFS Operating LLC above a specific hurdle amount in respect of such Grant Units, which can then be immediately exchanged for, at the issuer’s option, either shares of our Class A common stock or a cash payment, as described under “Our Corporate Structure—The Amended and Restated Operating Agreement.” If the issuer elects to issue Class A common stock in respect of these exchanges, your ownership of Class A common stock will be diluted.
If securities or industry analysts do not publish research or publish inaccurate or unfavorable research about our business, our stock price and trading volume could decline.
The trading market for our Class A common stock will be influenced in part on the research and reports that securities or industry analysts publish about us or our business. We do not currently have and may never obtain research coverage by securities and industry analysts. If no or few securities or industry analysts commence coverage of us, the trading price for our Class A common stock would be negatively impacted. If we obtain securities or industry analyst coverage and if one or more of the analysts who cover us downgrades our Class A common stock or publishes inaccurate or unfavorable research about our business, our stock price would likely decline. If one or more of these analysts ceases coverage of us or fails to publish reports on us regularly, demand for our Class A common stock could decrease, which could cause our stock price and trading volume to decline.
We do not intend to pay dividends for the foreseeable future.
We may retain future earnings, if any, for future operations, expansion and debt repayment and have no current plans to pay any cash dividends for the foreseeable future. Any future determination to declare and pay cash dividends will be at the discretion of our board of directors and will depend on, among other things, our financial condition, results of operations, cash requirements, contractual restrictions and such other factors as our board of directors deems relevant. In addition, our current credit facility restricts our ability to pay dividends. Our ability to pay dividends may also be limited by covenants of any future outstanding indebtedness we or our subsidiaries incur. As a result, you may not receive any return on an investment in our Class A common stock unless you sell our Class A common stock for a price greater than that which you paid for it. See “Dividend Policy.”
If we are unable to implement and maintain the effectiveness of our internal control over financial reporting, our investors may lose confidence in the accuracy and completeness of our financial reports, which could adversely affect our stock price.
Pursuant to Section 404 of the Sarbanes-Oxley Act of 2002 and the related rules adopted by the SEC and the PCAOB, starting with the second annual report that we file with the SEC after the consummation of this offering, our management will be required to report on the effectiveness of our internal control over financial reporting. We may encounter problems or delays in completing the implementation of any changes necessary to our internal control over financial reporting to conclude such controls are effective. If we identify material weaknesses in our internal control over financial reporting, if we are unable to comply with the requirements of Section 404 in a timely manner or assert that our internal control over financial reporting is effective, or if our independent registered public accounting firm is unable to express an opinion as to the effectiveness of our internal control over financial reporting, investor confidence and our stock price could decline.
44
Table of Contents
Matters impacting our internal controls may cause us to be unable to report our financial information on a timely basis and thereby subject us to adverse regulatory consequences, including sanctions by the SEC or violations of NYSE rules, and result in a breach of the covenants under our financing arrangements. There also could be a negative reaction in the financial markets due to a loss of investor confidence in us and the reliability of our financial statements. Confidence in the reliability of our financial statements also could suffer if we were to report a material weakness in our internal controls over financial reporting. This could materially adversely affect us and lead to a decline in the price of our Class A common stock.
Claims for indemnification by our directors and officers may reduce our available funds to satisfy successful third-party claims against us and may reduce the amount of money available to us.
Our charter and bylaws that will be in effect immediately prior to the completion of this offering provide that we will indemnify our directors and officers, in each case to the fullest extent permitted by Delaware law. In addition, we have entered and expect to continue to enter into agreements to indemnify our directors, executive officers and other employees as determined by our board of directors. Upon the consummation of this offering, we expect to enter into indemnification agreements with our director nominees and amended indemnification agreements with each of our directors and officers. Under the terms of such indemnification agreements, we are required to indemnify each of our directors and officers, to the fullest extent permitted by the laws of the State of Delaware, if the basis of the indemnitee’s involvement was by reason of the fact that the indemnitee is or was a director or officer of the company or any of its subsidiaries or was serving at the company’s request in an official capacity for another entity. We must indemnify our officers and directors against all reasonable fees, expenses, charges and other costs of any type or nature whatsoever, including any and all expenses and obligations paid or incurred in connection with investigating, defending, being a witness in, participating in (including on appeal), or preparing to defend, be a witness or participate in any completed, actual, pending or threatened action, suit, claim or proceeding, whether civil, criminal, administrative or investigative, or establishing or enforcing a right to indemnification under the indemnification agreement. The indemnification agreements also require us, if so requested, to advance within 30 days of such request all reasonable fees, expenses, charges and other costs that such director or officer incurred, provided that such person will return any such advance if it is ultimately determined that such person is not entitled to indemnification by us. Any claims for indemnification by our directors and officers may reduce our available funds to satisfy successful third-party claims against us and may reduce the amount of money available to us.
Future offerings of debt securities, which would rank senior to our Class A common stock upon our bankruptcy or liquidation, and future offerings of equity securities that may be senior to our Class A common stock for the purposes of dividend and liquidating distributions, may adversely affect the market price of our Class A common stock.
In the future, we may attempt to increase our capital resources by making offerings of debt securities or additional offerings of equity securities. Upon bankruptcy or liquidation, holders of our debt securities and shares of preferred stock and lenders with respect to other borrowings will receive a distribution of our available assets prior to the holders of our Class A common stock. Additional equity offerings may dilute the holdings of our existing stockholders or reduce the market price of our Class A common stock, or both, and may result in future limitations under the tax code that could reduce the rate at which we utilize any net operating loss carryforwards to reduce our taxable income. Preferred stock, if issued, could have a preference on liquidating distributions or a preference on dividend payments or both that could limit our ability to make a dividend distribution to the holders of our Class A common stock. Our decision to issue securities in any future offering will depend on market conditions and other factors beyond our control. As a result, we cannot predict or estimate the amount, timing or nature of our future offerings, and purchasers of our Class A common stock in this offering bear the risk of our future offerings reducing the market price of our Class A common stock and diluting their ownership interest in our company.
45
Table of Contents
We have broad discretion to use the proceeds from this offering and our investment of those proceeds may not yield favorable returns.
Our management will have broad discretion over the use of proceeds from this offering, and we could spend the proceeds from this offering in ways with which you may not agree or that do not yield a favorable return. We intend to contribute all of the net proceeds from this offering to acquire Units from BKFS Operating LLC. We intend that BKFS Operating LLC will use a portion of the net proceeds contributed to it to repay $ principal amount of outstanding debt. The remaining net proceeds received by BKFS Operating LLC will be used to continue to support its growth and for working capital and general corporate purposes. We may also use a portion of the net proceeds to acquire or invest in complementary businesses, products and technologies, although we have no current plans, commitments or agreements with respect to any such acquisitions or investments, and we have not allocated the net proceeds from this offering for any specific purposes. If we do not invest or apply the proceeds of this offering in ways that improve our operating results, we may fail to achieve expected financial results, which could cause our stock price to decline.
46
Table of Contents
This prospectus contains forward-looking statements that are subject to risks and uncertainties. All statements other than statements of historical fact included in this prospectus are forward-looking statements. Forward-looking statements give our current expectations and projections relating to our financial condition, results of operations, plans, objectives, future performance and business. You can identify forward-looking statements by the fact that they do not relate strictly to historical or current facts. These statements may include words such as “anticipate,” “estimate,” “expect,” “project,” “aim to,” “plan,” “intend,” “believe,” “may,” “should,” “can have,” “likely” and other words and terms of similar meaning in connection with any discussion of the timing or nature of future operating or financial performance or other events.
The forward-looking statements contained in this prospectus are based on assumptions that we have made in light of our industry experience and our perceptions of historical trends, current conditions, expected future developments and other factors we believe are appropriate under the circumstances. As you read and consider this prospectus, you should understand that these statements are not guarantees of performance or results. They involve risks, uncertainties (many of which are beyond our control) and assumptions. Although we believe that these forward-looking statements are based on reasonable assumptions, you should be aware that many factors could affect our actual operating and financial performance and cause our performance to differ materially from the performance anticipated in the forward-looking statements. We believe these factors include, but are not limited to, those described under “Risk Factors” and “Management’s Discussion and Analysis of Financial Condition and Results of Operations.” Should one or more of these risks or uncertainties materialize, or should any of these assumptions prove incorrect, our actual operating and financial performance may vary in material respects from the performance projected in these forward-looking statements.
Any forward-looking statement made by us in this prospectus speaks only as of the date on which we make it. Factors or events that could cause our actual operating and financial performance to differ may emerge from time to time, and it is not possible for us to predict all of them. We undertake no obligation to publicly update any forward-looking statement, whether as a result of new information, future developments or otherwise, except as may be required by law.
47
Table of Contents
BKFS was incorporated in the State of Delaware on October 27, 2014 for the purpose of undertaking this offering and the transactions contemplated by this offering and to date has engaged only in activities in contemplation of this offering. Prior to the completion of this offering, all of our business operations are being conducted through BKFS Operating LLC and its subsidiaries.
FNF Acquisition of LPS
On January 2, 2014, FNF acquired LPS, and as a result, LPS became an indirect, wholly-owned subsidiary of FNF. Upon the closing of the transaction, the shares of LPS common stock, which previously traded under the ticker symbol “LPS” on the NYSE, ceased trading on, and were delisted from, the NYSE.
On January 3, 2014, pursuant to the Internal Reorganization, substantially all of the former Technology, Data and Analytics segment of LPS was transferred to us and the former Transaction Services businesses of LPS were transferred by BKIS to BKHI and contributed by BKHI to another of its then wholly-owned subsidiaries or to another subsidiary of FNF.
Also, on January 3, 2014, BKHI contributed Commerce Velocity, a former indirect subsidiary of FNF that had been contributed to BKHI in December 2013, to BKFS Operating LLC, which contributed it to BKIS. Thereafter, we issued 35.0% of the membership interests of BKFS Operating LLC to certain THL Affiliates and THL Intermediaries.
Following the Internal Reorganization, we are majority owned by FNF through its wholly-owned subsidiary, BKHI, and minority owned by THL through certain THL Affiliates and THL Intermediaries. FNF and THL Managers LLC also provide us with management and consulting services. The agreements under which FNF and THL Managers LLC provide these services will be terminated in connection with the closing of this offering.
Contribution of Property Insight, LLC
On June 2, 2014, as part of an additional internal reorganization, two wholly-owned subsidiaries of FNF contributed to us their respective interests in Property Insight, a company that provides property information used by title insurance underwriters, title agents and closing attorneys to underwrite title insurance policies for real property sales and transfers. As a result, we are now the sole member of Property Insight. In connection with the Property Insight Contribution, BKFS Operating LLC issued an additional 6.4 million of its Units to BKHI. As a result of this issuance, THL Affiliates’ and THL Intermediaries’ combined percentage ownership in BKFS Operating LLC was reduced from 35.0% to 32.9%.
48
Table of Contents
Structure Prior to the Offering Reorganization
Prior to the completion of this offering, we will effect the Offering Reorganization described in “—The Offering Reorganization.” The diagram below depicts our organizational structure immediately prior to the completion of the offering:
| (1) | FNF owns 100% of the equity interests of BKHI. |
| (2) | BKHI owns 67.1% of the Units and 100% of the shares of common stock of BKFS. |
| (3) | THL, through THL Intermediaries and certain THL Affiliates, owns 32.9% of the Units. |
| (4) | Members of the BKFS Management team and other key employees of BKFS or FNF or its subsidiaries will hold Grant Units. |
The Offering Reorganization
Prior to the closing of this offering, we will complete transactions that will result in the following:
| • | the amendment and restatement of the issuer’s certificate of incorporation to authorize the issuance of two classes of common stock, Class A common stock and Class B common stock, which we collectively refer to herein as our common stock, and which will generally vote together as a single class on all matters submitted for a vote to stockholders; |
| • | the issuance of shares of Class B common stock by the issuer to BKHI and certain THL Affiliates, the holders of Units prior to the offering (Class B common stock will not entitle the holders thereof to any |
49
Table of Contents
| of the economic rights including rights to dividends and distributions upon liquidation that will be provided to holders of Class A common stock, and the total voting power of the Class B common stock will be equal to the percentage of Units not held by the issuer); and |
| • | the issuance of shares of Class A common stock to certain THL Affiliates, in connection with the merger of the THL Intermediaries with and into the issuer, pursuant to which the issuer will acquire Units. |
In connection with this offering, the following transactions will occur:
| • | the issuance of shares of Class A common stock by the issuer to the investors in this offering (the total voting power of Class A common stock outstanding will be proportional to the percentage of Units that will be held by the issuer); |
| • | the contribution by the issuer of the net cash proceeds received in this offering to BKFS Operating LLC in exchange for % of the Units and a managing member’s membership interest in BKFS Operating LLC; and |
| • | the restatement of the Amended and Restated Operating Agreement to provide for the governance and control of BKFS Operating LLC by the issuer as its managing member and to establish the terms upon which other holders of Units may exchange those Units, and a corresponding number of shares of Class B common stock, for, at the issuer’s option, either shares of Class A common stock on a one-for-one basis or a cash payment. |
Following the consummation of the Offering Reorganization, this offering and the application of the net proceeds therefrom, the issuer will be a holding company and through its managing member interest, will control the business and affairs of BKFS Operating LLC and its subsidiaries. The sole asset of the issuer will be its interest in BKFS Operating LLC.
50
Table of Contents
Structure Following the Offering Reorganization
The diagram below summarizes our anticipated organizational structure immediately after completion of the Offering Reorganization, including this offering and the application of the net proceeds from this offering (assuming an initial public offering price of $ per share, which is the mid-point of the estimated public offering range set forth on the cover page of this prospectus, and no exercise of the underwriters’ option to purchase additional shares).
| (1) | FNF will own 100% of the equity interests of BKHI. |
| (2) | BKHI will own no shares of Class A common stock and % of the outstanding shares of Class B common Stock of BKFS, representing no economic interest and % voting interest in BKFS and % of the Units of BKFS Operating LLC. |
| (3) | The public shareholders (excluding FNF and THL Affiliates) will own % of the outstanding shares of Class A common stock and no shares of Class B common stock of BKFS, representing a % economic and voting interest in BKFS. |
| (4) | THL, through certain THL Affiliates, will beneficially own % of the outstanding shares of Class A common stock and shares of Class B common stock of BKFS, representing a % economic and voting interest in BKFS and % of the Units of BKFS Operating LLC. |
| (5) | BKFS will own % of the Units and a managing member interest of BKFS Operating LLC. |
| (6) | Members of the BKFS management team and other key employees of BKFS or FNF or its other subsidiaries will hold Grant Units. |
51
Table of Contents
The Amended and Restated Operating Agreement
Following the Offering Reorganization and this offering, we will operate our business through BKFS Operating LLC and its subsidiaries. The operations of BKFS Operating LLC and the rights and obligations of its members will be governed by the Amended and Restated Operating Agreement, which we expect to enter into in connection with the consummation of this offering. The following is a description of material terms that we expect will be contained in the Amended and Restated Operating Agreement.
Governance
BKFS will serve as managing member and will control the business and affairs of BKFS Operating LLC. No other members of BKFS Operating LLC, in their capacity as such, will have any authority or right to control the management of BKFS Operating LLC or to bind it in connection with any matter. BKFS will exercise control of the business of BKFS Operating LLC through BKFS’s executive officers, who will manage the day-to-day activities of BKFS Operating LLC and its subsidiaries, subject to the direction of the board of directors of BKFS. The executive officers of BKFS will also be officers of BKFS Operating LLC and will be authorized to act on behalf of each such entity, subject to the ultimate direction of the board of directors of BKFS.
Voting and Economic Rights of Members
BKFS Operating LLC has authorized the issuance of three series of equity: (i) Units, (ii) Preferred Units and (iii) Grant Units. As of the date of the offering, no Preferred Units will have been issued or be outstanding. The Units will be held by BKHI, a wholly-owned subsidiary of FNF, certain THL Affiliates and BKFS. The Units will entitle their holders to a pro rata share in the profits and losses of, and distributions from, BKFS Operating LLC. Grant Units will entitle their holders to a pro rata share in the profits and losses of, and distributions from, BKFS Operating LLC, but only following such time as a specified dollar hurdle amount has been previously distributed to holders of Units. Holders of Units other than BKFS will have no voting rights, except in respect of amendments to the Amended and Restated Operating Agreement that adversely affect such holder, the dissolution of BKFS Operating LLC, and other matters adversely affecting such holders.
Net profits and losses of BKFS Operating LLC generally will be allocated, and distributions made, to its members pro rata in accordance with the number of Units owned by each member. Holders of Grant Units will participate in allocations and distributions by BKFS Operating LLC in accordance with the Amended and Restated Operating Agreement.
Subject to the availability of net cash flow at the BKFS Operating LLC level and to applicable legal and contractual restrictions, we intend to cause BKFS Operating LLC to distribute to us, and to the other holders of Units or Grant Units, cash payments for the purposes of funding tax obligations in respect of any net taxable income that is allocated to us and the other holders of Units or Grant Units as members of BKFS Operating LLC, to fund dividends, if any, declared by us and to make any payments due under the tax receivable agreement, as described below. See “Dividend Policy” and “Risk Factors—Risks Related to Our Structure.” If BKFS Operating LLC makes distributions to its members in any given year, the determination to pay the proceeds of such distributions received by the issuer, if any, to holders of our Class A common stock will be made by our board of directors. We do not, however, expect to declare or pay any cash or other dividends in the foreseeable future on our Class A common stock, as we intend to reinvest any cash flow generated by operations in our business. Holders of our Class B common stock will not be entitled to any dividend payments. We may enter into credit agreements or other borrowing arrangements in the future that prohibit or restrict our ability to declare or pay dividends on our Class A common stock.
Exchange of Units
Pursuant to and subject to the terms of the Amended and Restated Operating Agreement, holders of Units (other than the issuer), at any time and from time to time, may exchange one or more Units, together with an equal
52
Table of Contents
number of shares of our Class B common stock, for, at the issuer’s option, either shares of our Class A common stock on a one-for-one basis or a cash payment.
The determination to issue shares of Class A common stock or to pay cash in exchange for Units and corresponding shares of Class B common stock, and other related issuer determinations discussed below, will be made by the audit committee of our board of directors, pursuant to its responsibility and authority to review and approve any potential conflict of interest transaction involving our directors or executive officers, director nominees, any person known by us to be the beneficial owner of more than five percent of any class of our voting securities, or any family member of or related party to such persons.
Holders will not have the right to exchange Units if we determine that such exchange would be prohibited by law or regulation or would violate other agreements to which we may be subject. We may impose additional restrictions on exchange that we determine necessary or advisable so that BKFS Operating LLC is not treated as a “publicly traded partnership” for U.S. federal income tax purposes. If the IRS were to contend successfully that BKFS Operating LLC should be treated as a “publicly traded partnership” for U.S. federal income tax purposes, BKFS Operating LLC would be treated as a corporation for U.S. federal income tax purposes and thus would be subject to entity-level tax on its taxable income.
In connection with each exchange for a cash payment, the exchanged Units and shares of Class B common stock will automatically be deemed cancelled concurrently with such payment. The Amended and Restated Operating Agreement also provides that, at the election of a Grant Unit holder, vested Grant Units may be converted into the right to receive a number of Units based on the value of BKFS Operating LLC above a specified hurdle amount in respect of such Grant Units, which can then be immediately exchanged for, at the issuer’s option, either shares of our Class A common stock on a one-for-one basis, according to the terms of the Amended and Restated Operating Agreement, or a cash payment.
Thus, as holders exchange their Units and Class B common stock for Class A common stock, our economic interest in BKFS Operating LLC will increase. We and the exchanging holder will each generally bear our own expenses in connection with an exchange.
In lieu of the issuance of shares of Class A common stock in such exchange, the Amended and Restated Operating Agreement provides that the issuer may elect to cause BKFS Operating LLC to pay to the exchanging holder of Units or Grant Units an amount in cash per Unit equal to the then market value per share of our Class A common stock or the fair value of each Grant Unit, respectively. Upon the exchange of Units, any corresponding share of Class B common stock will be automatically cancelled.
We have reserved for issuance shares of our Class A common stock for potential issuance in respect of future exchanges of Units, including the aggregate number of Units anticipated to be outstanding after completion of the Offering Reorganization and this offering.
Coordination of BKFS and BKFS Operating LLC
Whenever we issue one share of Class A common stock for cash (other than pursuant to exchanges of Units under the Amended and Restated Operating Agreement), the net proceeds of such issuance will be transferred promptly to BKFS Operating LLC, and BKFS Operating LLC will issue to us one additional Unit. If we issue other classes or series of equity securities, we will contribute to BKFS Operating LLC the net proceeds we receive in connection with such issuance, and BKFS Operating LLC will issue to us an equal number of equity securities with designations, preferences and other rights and terms that are substantially the same as our newly issued equity securities. Conversely, if we repurchase any shares of Class A common stock (or equity securities of other classes or series) for cash, BKFS Operating LLC will, immediately prior to our repurchase, redeem an equal number of Units (or its equity securities of the corresponding classes or series), upon the same terms and for the same price, as the shares of our Class A common stock (or our equity securities of such other classes or
53
Table of Contents
series) that are repurchased. Units, Grant Units and shares of our common stock will be subject to equivalent stock splits, dividends and reclassifications.
We will not conduct any business other than the management and ownership of BKFS Operating LLC and its subsidiaries, or own any other assets (other than on a temporary basis), although we may take such actions and own such assets as are necessary to comply with applicable law, including compliance with our responsibilities as a public company under the U.S. federal securities laws, and may incur indebtedness and may take other actions if we determine that doing so is in the best interest of BKFS Operating LLC. To the extent the issuer incurs expenses in connection with its operations, including this offering, BKFS Operating LLC will reimburse the issuer pursuant to an advancement agreement between BKFS Operating LLC and the issuer. See “Certain Relationships and Related Party Transactions—Advancement Agreement.”
Exculpation and Indemnification
The Amended and Restated Operating Agreement contains provisions limiting the liability of its managing member, members, officers and their respective affiliates to BKFS Operating LLC or any of its members and contains broad indemnification provisions for BKFS Operating LLC’s managing member, members, officers and their respective affiliates. Because BKFS Operating LLC is a limited liability company, these provisions are not subject to the limitations on exculpation and indemnification contained in the DGCL with respect to the indemnification that may be provided by a Delaware corporation to its directors and officers. The amended and restated charter of the issuer will include similar exculpation provisions and indemnification obligations of the issuer for the benefit of the issuer’s directors and officers, and permissive indemnification obligations of the issuer for employees and other agents of the issuer.
Voting Rights of Class A Stockholders and Class B Stockholders
Each share of our Class A common stock and our Class B common stock will entitle its holder to one vote. Immediately after this offering, our Class B shareholders will collectively hold approximately % of the total voting power of the outstanding common stock of the issuer, and, through an equal number of Units, an equivalent economic interest in BKFS Operating LLC (or % if the underwriters exercise in full their option to purchase additional shares).
Tax Consequences
Holders of Units and Grant Units, including the issuer, generally will incur U.S. federal, state and local income taxes on their share of any taxable income of BKFS Operating LLC. Although net profits and net losses of BKFS Operating LLC generally will be allocated to the holders in proportion to the Units or Grant Units they hold, certain items of deduction will be allocated disproportionately to us and to THL Affiliates. We expect that the Amended and Restated Operating Agreement will provide for cash distributions to the holders of Units or Grant Units in an amount at least equal to the holders’ assumed tax liability attributable to BKFS Operating LLC. Generally, distributions in respect of the holders’ assumed tax liability will be computed based on our estimate of the taxable income of BKFS Operating LLC allocable to the Unit or Grant Unit multiplied by an assumed tax rate. In accordance with the Amended and Restated Operating Agreement, BKFS Operating LLC intends to make distributions to the holders in respect of such assumed tax liability and to fund dividends, if any, declared by the issuer.
BKFS Operating LLC intends to make an election under Section 754 of the Internal Revenue Code of 1986, as amended (the “Code”), which is effective for the 2015 tax year and for each taxable year in which there occurs an exchange of Units, together with an equal number of shares of Class B common stock, for shares of our Class A common stock or cash from BKFS Operating LLC. We expect that, as a result of this election, the acquisition of Units, together with an equal number of shares of Class B common stock, in exchange for shares of our Class A common stock or cash from BKFS Operating LLC will result in increases in the tax basis in our share of the tangible and intangible assets of BKFS Operating LLC at the time of such acquisition or exchange, which will
54
Table of Contents
increase the tax depreciation and amortization deductions available to us and which could create other tax benefits. Any such increases in tax basis and tax depreciation and amortization deductions or other tax benefits could reduce the amount of tax that we would otherwise be required to pay in the future. We may be required to pay a fixed percentage of the cash savings in U.S. federal, state and local income tax we actually realize from such increase to certain holders of Units pursuant to the tax receivable agreement we expect to enter into with such holders.
Tax Receivable Agreement
In connection with this offering, we expect to enter into a tax receivable agreement with certain existing holders of Units. The agreement will require us to pay to such holders a fixed percentage of the cash savings, if any, in U.S. federal, state and local income tax we realize as a result of certain tax benefits to which we may become entitled. This will be the issuer’s obligation and not an obligation of BKFS Operating LLC. Estimating the amount of payments to be made under the tax receivable agreement cannot be done reliably at this time. The payments that we make under the tax receivable agreement could be substantial.
Registration Rights Agreement
In connection with this offering, we expect to enter into a registration rights agreement with certain holders of the outstanding Units. This agreement will provide these holders (and their permitted transferees) with the right to require us, at our expense, to register shares of our Class A common stock that are issuable to them upon exchange of Units (and an equal number of shares of our Class B common stock) in accordance with the terms of the Amended and Restated Operating Agreement. The agreement will also provide that we will pay certain expenses of these electing holders relating to such registrations and indemnify them against certain liabilities that may arise under the Securities Act. For a detailed description of the registration rights agreement, see “Certain Relationships and Related Party Transactions—Registration Rights Agreement.”
55
Table of Contents
We estimate that the net proceeds to us from this offering will be approximately $ million, or approximately $ million if the underwriters exercise in full their option to purchase additional shares, assuming an initial public offering price of $ per share (the midpoint of the range set forth on the cover page of this prospectus), after deducting the underwriting discount and estimated offering expenses payable by us.
We intend to contribute all of the net proceeds of this offering, including any proceeds received from the underwriters’ option to purchase additional shares, if exercised, to BKFS Operating LLC in exchange for Units (or Units if the underwriters exercise in full their option to purchase additional shares) from BKFS Operating LLC, at a purchase price per Unit equal to the initial public offering price per share of Class A common stock in this offering.
We intend that BKFS Operating LLC will use a portion of the net proceeds contributed to it to repay $ principal amount of our outstanding debt. The remaining net proceeds received by BKFS Operating LLC will be used to continue to support its growth and for working capital and general corporate purposes.
Each $1.00 increase or decrease in the public offering price per share would increase or decrease , as applicable, our net proceeds, after deducting the underwriting discount and estimated offering expenses payable by us, by $ million (assuming no exercise of the underwriters’ option to purchase additional shares). Similarly, an increase or decrease of one million shares of Class A common stock sold in this offering by us would increase or decrease, as applicable, our net proceeds, after deducting the underwriting discount and estimated offering expenses payable by us, by $ , based on an assumed initial public offering price of $ per share, which is the midpoint of the estimated offering price range set forth on the cover page of this prospectus.
56
Table of Contents
We do not intend to pay cash dividends on our Class A common stock in the foreseeable future. We are a holding company that does not conduct any business operations of our own. As a result, our ability to pay cash dividends on our Class A common stock, if any, will be dependent upon cash dividends and distributions and other transfers from BKFS Operating LLC. The amounts available to us to pay cash dividends may be restricted by our debt instruments. The declaration and payment of dividends also is subject to the discretion of our board of directors and depends on various factors, including our net income, financial condition, cash requirements, future prospects and other factors deemed relevant by our board of directors.
If dividends are declared, holders of shares of our Class A common stock could be eligible to receive dividends in respect of such shares, however, holders of shares of our Class B common stock would not be entitled to any dividend payments in respect of such shares.
Any future determination to pay dividends will be at the discretion of our board of directors and will take into account:
| • | restrictions in our debt instruments; |
| • | general economic business conditions; |
| • | our financial condition and results of operations; |
| • | the ability of our operating subsidiaries to pay dividends and make distributions to us; and |
| • | such other factors as our board of directors may deem relevant. |
Accordingly, you may need to sell your shares of our common stock to realize a return on your investment, and you may not be able to sell your shares at or above the price you paid for them. See “Risk Factors—Risks Related to this Offering—We do not intend to pay dividends for the foreseeable future.”
57
Table of Contents
The following table sets forth our cash and cash equivalents and our capitalization as of September 30, 2014:
| • | on an actual basis; |
| • | on a pro forma basis to give effect to the Offering Reorganization as more fully described in “Our Corporate Structure;” and |
| • | on a pro forma as adjusted basis to give effect to the sale of shares of our Class A common stock in this offering and the application of the net proceeds received by us from this offering as described under “Use of Proceeds.” |
This table should be read in conjunction with “Our Corporate Structure,” “Use of Proceeds,” “Selected Historical Consolidated Financial Data,” “Unaudited Pro Forma Condensed Combined Financial Data,” “Management’s Discussion and Analysis of Financial Condition and Results of Operations,” “Description of Capital Stock” and the financial statements and notes thereto appearing elsewhere in this prospectus.
| As of September 30, 2014 | ||||||||||||
| BKFS Actual(1) | Pro Forma | Pro Forma As Adjusted(2) |
||||||||||
| (In millions) |
||||||||||||
| Cash and cash equivalents |
$ | 52.4 | $ | $ | ||||||||
|
|
|
|
|
|
|
|||||||
| Debt: |
||||||||||||
| Intercompany Notes |
$ | 718.4 | $ | $ | ||||||||
| Mirror Note Tranche “T” |
644.0 | |||||||||||
| Mirror Note Tranche “R” |
176.0 | |||||||||||
| Senior Unsecured Notes(3) |
594.9 | |||||||||||
|
|
|
|
|
|
|
|||||||
| Total debt |
2,133.3 | |||||||||||
|
|
|
|
|
|
|
|||||||
| Redeemable members’ interest |
353.1 | |||||||||||
| Member’s/stockholders’ equity: |
||||||||||||
| Member’s equity |
925.4 | |||||||||||
| Class A common stock, $0.0001 par value per share, shares authorized, no shares outstanding actual and shares outstanding pro forma as adjusted |
— | |||||||||||
| Class B common stock, $0.0001 par value per share, shares authorized, no shares outstanding actual and shares outstanding pro forma as adjusted |
— | |||||||||||
|
|
|
|
|
|
|
|||||||
| Total member’s/stockholders’ equity |
925.4 | |||||||||||
|
|
|
|
|
|
|
|||||||
| Total capitalization |
$ | 3,464.2 | $ | $ | ||||||||
|
|
|
|
|
|
|
|||||||
| (1) | As of September 30, 2014, BKFS Operating LLC directly or indirectly held all of our assets and liabilities, and BKFS, which was incorporated on October 27, 2014, did not exist. Accordingly, the actual capitalization as of September 30, 2014 presents that of BKFS Operating LLC. |
| (2) | Each $1.00 increase or decrease in the public offering price per share would increase or decrease , as applicable, our net proceeds, after deducting the underwriting discount and estimated offering expenses payable by us, by $ million (assuming no exercise of the underwriters’ option to purchase additional shares). Similarly, an increase or decrease of one million shares of Class A common stock sold in this offering by us would increase or decrease, as applicable, our net proceeds, after deducting the underwriting discount and estimated offering expenses payable by us, by $ , based on an assumed initial public offering price of $ per share, which is the midpoint of the estimated offering price range set forth on the cover page of this prospectus. |
| (3) | Excludes the unamortized bond premium of $21.7 million. |
58
Table of Contents
If you invest in our Class A common stock, your interest will be diluted to the extent of the difference between the initial public offering price per share of our Class A common stock and the pro forma net tangible book value per share of our Class A common stock after the Offering Reorganization described in “Our Corporate Structure” and this offering. Dilution results from the fact that the per share offering price of the Class A common stock is substantially in excess of the book value per share attributable to our existing investors.
Our pro forma net tangible book value as of September 30, 2014 would have been approximately $ , or $ per share of our Class A common stock. Pro forma net tangible book value represents the amount of total tangible assets less total liabilities, and pro forma net tangible book value per share represents pro forma net tangible book value divided by the number of shares of Class A common stock outstanding, in each case, after giving effect to the Offering Reorganization but not this offering.
After giving effect to (i) the completion of the Offering Reorganization as more fully described in “Our Corporate Structure,” (ii) the sale of shares of Class A common stock in this offering at the assumed initial public offering price of $ per share (the midpoint of the range set forth on the cover of this prospectus) after deducting the underwriting discount and estimated offering expenses payable by us and (iii) the application of the net proceeds from this offering and assuming all Units, together with an equal number of shares of our Class B common stock, are exchanged for an equal number of shares of Class A common stock, our pro forma net tangible book value would have been $ , or $ per share. This represents an immediate increase in pro forma net tangible book value of $ per share to our existing investors and an immediate dilution in pro forma net tangible book value of $ per share to new investors.
The following table illustrates this dilution on a per share of Class A common stock basis:
| Assumed initial public offering price per share |
$ | |||
| Pro forma net tangible book value per share as of , 2014 |
||||
| Increase in pro forma net tangible book value per share attributable to new investors |
||||
| Pro forma net tangible book value per share after this offering |
||||
| Dilution per share to new investors in this offering |
$ |
The following table summarizes, on a pro forma basis as of September 30, 2014 after giving effect to the Offering Reorganization and this offering, the total number of shares of Class A common stock purchased from us, the total cash consideration paid to us and the average price per share paid by our existing investors and by new investors purchasing shares in this offering.
| Shares Purchased | Total Consideration | Average Price Per Share |
||||||||||||||||
| Number | Percent | Amount | Percent | |||||||||||||||
| Existing stockholders |
% | $ | % | $ | ||||||||||||||
| New investors |
||||||||||||||||||
|
|
|
|
|
|
|
|
|
|
||||||||||
| Total |
100.0 | % | $ | 100.0 | % | $ | ||||||||||||
|
|
|
|
|
|
|
|
|
|
||||||||||
If the underwriters were to fully exercise their option to purchase additional shares of our Class A common stock, the percentage of shares of our common stock held by existing investors would be %, and the percentage of shares of our common stock held by new investors would be %.
59
Table of Contents
The above discussion and tables are based on the number of shares outstanding at September 30, 2014 on a pro forma basis and excludes an aggregate of additional shares of our Class A common stock that will be issuable upon exchange of Units or reserved for future awards pursuant to our equity incentive plans. In addition, we may choose to raise additional capital due to market conditions or strategic considerations even if we believe we have sufficient funds for our current or future operating plans. To the extent that additional capital is raised through the sale of equity or convertible debt securities, the issuance of such securities could result in further dilution to our stockholders.
60
Table of Contents
SELECTED HISTORICAL CONSOLIDATED FINANCIAL DATA
The following table presents our selected historical financial data and should be read in conjunction with “Unaudited Pro Forma Condensed Combined Financial Data,” “Management’s Discussion and Analysis of Financial Condition and Results of Operations” and our financial statements and the related footnotes thereto, included elsewhere in this prospectus. The periods presented below prior to January 2, 2014, the date of the Acquisition, are referred to as Predecessor periods and the periods presented after and including January 2, 2014 are referred to as Successor periods. The financial data for the Predecessor periods reflect the financial position and results of operations of our predecessor, LPS, which include the Transaction Services segment of LPS that was distributed by us to ServiceLink in connection with the Internal Reorganization on January 3, 2014. The financial data for the Successor periods do not include the financial position and results of operations of the Transaction Services segment of LPS. As a result, the financial data included in the Successor periods are not comparable to the financial data included in the Predecessor periods. See “Risk Factors” and “Management’s Discussion and Analysis of Financial Condition and Results of Operations.”
The consolidated statements of operations data for the years ended December 31, 2013, December 31, 2012 and December 31, 2011 and the consolidated balance sheet data as of December 31, 2013 and December 31, 2012 are derived from the audited financial statements from our predecessor, LPS, included in this prospectus. The consolidated statement of earnings for the years ended December 31, 2010 and 2009, and consolidated balance sheet data as of December 31, 2011, December 31, 2010 and December 31, 2009 are derived from the audited financial statements from our predecessor, LPS, not included in this prospectus.
61
Table of Contents
| Successor | Predecessor | |||||||||||||||||||||||||||
| Period January 2, 2014 through September 30, 2014 |
One day ended January 1, 2014 |
Year Ended December 31, | ||||||||||||||||||||||||||
| 2013 | 2012 | 2011 | 2010 | 2009 | ||||||||||||||||||||||||
| (In millions, except per share amounts) |
||||||||||||||||||||||||||||
| Statements of Earnings Data: |
||||||||||||||||||||||||||||
| Revenues |
$ | 631.8 | $ | — | $ | 1,716.2 | $ | 1,991.3 | $ | 1,980.0 | $ | 2,196.6 | $ | 2,094.8 | ||||||||||||||
| Net (loss) earnings from continuing operations |
$ | (117.1 | ) | $ | (50.1 | ) | $ | 104.2 | $ | 79.6 | $ | 135.3 | $ | 305.1 | $ | 280.4 | ||||||||||||
| Net (loss) earnings |
$ | (117.8 | ) | $ | (39.0 | ) | $ | 102.7 | $ | 70.4 | $ | 96.5 | $ | 302.3 | $ | 275.7 | ||||||||||||
| Net earnings per share—basic from continuing operations |
$ | 1.22 | $ | 0.94 | $ | 1.58 | $ | 3.28 | $ | 2.93 | ||||||||||||||||||
| Net earnings per share—basic |
$ | 1.20 | $ | 0.83 | $ | 1.13 | $ | 3.25 | $ | 2.88 | ||||||||||||||||||
| Weighted average shares—basic |
85.4 | 84.6 | 85.6 | 93.1 | 95.6 | |||||||||||||||||||||||
| Net earnings per share—diluted from continuing operations |
$ | 1.21 | $ | 0.94 | $ | 1.58 | $ | 3.26 | $ | 2.91 | ||||||||||||||||||
| Net earnings per share—diluted |
$ | 1.19 | $ | 0.83 | $ | 1.13 | $ | 3.23 | $ | 2.87 | ||||||||||||||||||
| Weighted average shares—diluted |
85.9 | 84.9 | 85.7 | 93.6 | 96.2 | |||||||||||||||||||||||
| Balance Sheet Data: |
||||||||||||||||||||||||||||
| Cash and cash equivalents |
$ | 52.4 | $ | — | $ | 329.6 | $ | 236.2 | $ | 77.4 | $ | 52.3 | $ | 70.5 | ||||||||||||||
| Total assets |
$ | 3,608.3 | $ | — | $ | 2,486.7 | $ | 2,445.8 | $ | 2,245.4 | $ | 2,251.8 | $ | 2,197.3 | ||||||||||||||
| Total debt (current and long-term) |
$ | 2,155.0 | $ | — | $ | 1,068.1 | $ | 1,068.1 | $ | 1,149.2 | $ | 1,249.4 | $ | 1,289.4 | ||||||||||||||
| Cash dividends per share |
$ | 0.40 | $ | 0.40 | $ | 0.40 | $ | 0.40 | $ | 0.40 | ||||||||||||||||||
62
Table of Contents
Quarterly Financial Data (Unaudited)
| Predecessor | ||||||||||||||||
| 2013 Quarter Ended | ||||||||||||||||
| March 31, | June 30, | September 30, | December 31, | |||||||||||||
| (In millions, except per share data) | ||||||||||||||||
| Revenues |
$ | 469.7 | $ | 466.9 | $ | 417.2 | $ | 362.4 | ||||||||
| Net earnings (loss) from continuing operations(1) |
$ | 54.3 | $ | 20.5 | $ | 34.8 | $ | (5.4 | ) | |||||||
| Net earnings (loss)(1) |
$ | 53.9 | $ | 19.1 | $ | 35.5 | $ | (5.8 | ) | |||||||
| Net earnings (loss) per share—basic from continuing operations |
$ | 0.64 | $ | 0.24 | $ | 0.41 | $ | (0.06 | ) | |||||||
| Net earnings (loss) per share—basic |
$ | 0.63 | $ | 0.22 | $ | 0.42 | $ | 0.07 | ) | |||||||
| Weighted average shares—basic |
84.9 | 85.1 | 85.3 | 86.3 | ||||||||||||
| Net earnings (loss) per share—diluted from continuing operations |
$ | 0.64 | $ | 0.24 | $ | 0.40 | $ | (0.07 | ) | |||||||
| Net earnings (loss) per share—diluted |
$ | 0.63 | $ | 0.22 | $ | 0.41 | $ | (0.07 | ) | |||||||
| Weighted average shares—diluted |
85.1 | 85.6 | 86.0 | 86.9 | ||||||||||||
| 2012 Quarter Ended | ||||||||||||||||
| March 31, | June 30, | September 30, | December 31, | |||||||||||||
| (In millions, except per share data) | ||||||||||||||||
| Revenues |
$ | 484.6 | $ | 511.7 | $ | 495.7 | $ | 499.3 | ||||||||
| Net earnings (loss) from continuing operations(2) |
$ | 48.7 | $ | (35.2 | ) | $ | 60.2 | $ | 5.9 | |||||||
| Net earnings (loss)(2) |
$ | 47.1 | $ | (37.9 | ) | $ | 58.3 | $ | 2.9 | |||||||
| Net earnings (loss) per share—basic from continuing operations |
$ | 0.58 | $ | (0.42 | ) | $ | 0.71 | $ | 0.07 | |||||||
| Net earnings (loss) per share—basic |
$ | 0.56 | $ | (0.45 | ) | $ | 0.69 | $ | 0.03 | |||||||
| Weighted average shares—basic |
84.4 | 84.6 | 84.7 | 84.9 | ||||||||||||
| Net earnings (loss) per share—diluted from continuing operations |
$ | 0.58 | $ | (0.42 | ) | $ | 0.71 | $ | 0.07 | |||||||
| Net earnings (loss) per share—diluted |
$ | 0.56 | $ | (0.45 | ) | $ | 0.69 | $ | 0.03 | |||||||
| Weighted average shares—diluted |
84.6 | 84.6 | 84.9 | 85.1 | ||||||||||||
| (1) | During the fourth quarter of 2013, the company’s net earnings (loss) and net earnings (loss) from continuing operations included an asset impairment charge of $28.6 million and an addition to the legal and regulatory accrual of $20.4 million, as discussed in notes 8 and 15, respectively, to the audited consolidated financial statements of LPS’s included elsewhere in this prospectus. In addition, results for the fourth quarter of 2013 included expenses related to the Acquisition by FNF (see note 2 of LPS’s audited consolidated financial statements included elsewhere in this prospectus) of $8.1 million. |
| (2) | During the second and fourth quarters of 2012, the company’s net earnings (loss) and net earnings (loss) from continuing operations included an addition to the legal and regulatory accrual of $144.5 million and $47.9 million, respectively, as discussed in note 14 to LPS’s consolidated financial statements included elsewhere in this prospectus. |
63
Table of Contents
SELECTED HISTORICAL COMBINED FINANCIAL DATA OF COMMERCE
VELOCITY AND PROPERTY INSIGHT
The following selected unaudited historical combined financial information has been derived from the unaudited financial information of Commerce Velocity and Property Insight which are not included or incorporated by reference into this prospectus. Certain financial information for Commerce Velocity and Property Insight has been included in the audited Black Knight Financial Services, LLC combined financial statements as of December 31, 2013 and for the period from October 16, 2013 through December 31, 2013 included elsewhere in this prospectus and in the unaudited Pro Forma Condensed Consolidated Financial Information for BKFS subsequent to the Acquisition.
The selected unaudited financial information as of and for each of the three years ending December 31, 2013 is derived from the historical financial records of FNF and includes all material adjustments, consisting of normal recurring adjustments, necessary for a fair presentation of the results of the unaudited periods. You should not rely on these results as being indicative of the results of Commerce Velocity and Property Insight after their contribution to BKFS Operating LLC or in the future.
| Year Ended December 31, | ||||||||||||
| 2013 | 2012 | 2011 | ||||||||||
| (In millions) | ||||||||||||
| Statement of Operations Data: |
||||||||||||
| Revenues |
$ | 71.9 | $ | 73.5 | $ | 64.5 | ||||||
| (Loss) earnings |
$ | (14.4 | ) | $ | 4.1 | $ | 4.6 | |||||
| Balance Sheet Data: |
||||||||||||
| Total assets |
$ | 88.1 | $ | 90.4 | $ | 79.6 | ||||||
64
Table of Contents
UNAUDITED PRO FORMA CONDENSED COMBINED FINANCIAL DATA
The following table presents selected unaudited pro forma condensed combined financial information about our combined balance sheet and statements of operations, after giving effect to the Internal Reorganization Transactions, the Acquisition Related Refinancing, as described below, and the Offering Reorganization. The information under “Unaudited Pro Forma Condensed Combined Balance Sheet Data” in the table below gives effect to the Internal Reorganization Transactions, the Acquisition Related Refinancing and the offering and Offering Reorganization, as if all had been consummated on September 30, 2014. The information under “Unaudited Pro Forma Condensed Combined Statement of Operations Data” in the table below gives effect to the Internal Reorganization Transactions, the Acquisition Related Refinancing and the offering and Offering Reorganization as if all had been consummated on January 1, 2013, the beginning of the earliest time period presented. This unaudited pro forma condensed combined financial information was prepared using the acquisition method of accounting under U.S. generally accepted accounting principles, or GAAP, which is subject to change and interpretation, as pertaining to the Acquisition. FNF has been treated as the acquirer of LPS for accounting purposes. This unaudited pro forma condensed combined financial information was prepared using the accounting for transactions between entities under common control under GAAP as pertaining to the Commerce Velocity Contribution and the Property Insight Contribution.
BKFS was incorporated in the State of Delaware on October 27, 2014 for the purpose of completing this offering of Class A common stock of BKFS. To date BKFS has engaged only in activities in contemplation of this offering. Prior to the completion of this offering, all of our business operations will have been conducted through BKFS Operating LLC and its subsidiaries.
Beginning January 2, 2014, pursuant to the Acquisition, the Internal Reorganization and the Acquisition Related Refinancing the following transactions occurred:
On January 2, 2014, FNF completed the Acquisition, pursuant to the Agreement and Plan of Merger (the “Merger Agreement, dated as of May 28, 2013, among FNF, BKHI, and Lion Merger Sub, Inc., a Delaware corporation and a subsidiary of BKHI, or Merger Sub, and LPS. Pursuant to the Merger Agreement, Merger Sub merged with and into LPS, with LPS surviving as a subsidiary of BKHI. The purchase consideration paid by FNF was $3.4 billion, which consisted of $2,535 million in cash and $839 million in FNF common stock, or approximately 25.9 million shares. Upon the closing of the Acquisition, the shares of LPS common stock, which previously traded under the ticker symbol “LPS” on the NYSE, ceased trading on, and were delisted from, the NYSE.
In connection with the Acquisition, all LPS assets and liabilities were set to their fair value on January 2, 2014 as part of FNF’s allocation of the LPS purchase price to the identifiable assets and liabilities acquired. The purchase price has been initially allocated to the LPS assets acquired and liabilities assumed based on our best estimates of their fair values as of the acquisition date. Goodwill has been recorded based on the amount that the purchase price exceeds the fair value of the net assets acquired. The estimate is still preliminary and subject to adjustments as we complete our valuation process, which we expect to complete by the end of 2014.
On January 3, 2014, LPS was converted into a Delaware limited liability company and was renamed BKIS, a member managed limited liability company. Also on that date, pursuant to the Internal Reorganization, BKIS distributed all of its limited liability company membership interests and equity interests in its subsidiaries engaged in the Transaction Services business (the “TS subs”) to BKHI, which we refer to as the Distribution. Following the Distribution, Black Knight contributed the Transaction Services subsidiaries to its wholly-owned subsidiary Black Knight Financial Services II, LLC, which has been renamed ServiceLink Holdings, LLC and contributed BKIS to its subsidiary BKFS Operating LLC. BKFS Operating LLC is considered the successor to LPS.
On January 3, 2014, BKFS Operating LLC undertook certain refinancing and other debt related activities, known as the Acquisition Related Refinancing. The Acquisition Related Refinancing is described further in Note 2 below.
65
Table of Contents
Also on January 3, 2014, FNF, through BKHI, contributed its subsidiary, Commerce Velocity to BKFS Operating LLC, which then contributed Commerce Velocity to BKIS. In addition, BKIS sold its interest in National Title Insurance of New York, Inc. to a wholly owned subsidiary of FNF on this date. Subsequent to the contribution of Commerce Velocity, 35% of the membership interest of BKFS was issued to certain THL Affiliates and THL Intermediaries.
As part of the Amended and Restated Operating Agreement, certain THL Affiliates and THL Intermediaries have an option to put their ownership interest of BKFS Operating LLC to BKFS Operating LLC or FNF if no public offering of BKFS Operating LLC has been consummated after four years. The units owned by certain THL Affiliates and THL Intermediaries may be settled in cash or common stock of FNF, or a combination of both, at the election of FNF in an amount equivalent. The units owned by certain THL Affiliates and THL Intermediaries will be settled at the current fair value at the time FNF receives notice of certain THL Affiliates and THL Intermediaries put election as determined by the parties or by a third party appraisal. As this redeemable interest provides for redemption features not solely within the control of BKFS Operating LLC or FNF, it is classified outside of permanent equity in accordance with accounting standards on distinguishing liabilities from equity.
As part of the Acquisition, all of the LPS outstanding equity awards as of December 31, 2013 were accelerated and vested and subsequently converted to a mix of FNF common stock and cash in accordance with the Merger Agreement. In addition, certain other incentive compensation plans for senior executives were also accelerated due to change in control provisions triggered by the Acquisition. As a result, approximately $24.6 million in unrecognized compensation costs were not included within these unaudited pro forma condensed combined statements of operations.
On June 2, 2014, as a result of the Property Insight Contribution, BKFS Operating LLC issued 6.4 million Units to FNF. As a result of the additional shares issued, certain THL Affiliates and THL Intermediaries now collectively own 32.9% of the outstanding member interests of BKFS Operating LLC, while FNF and its subsidiaries collectively own 67.1% of the outstanding member interests of BKFS Operating LLC.
In accordance with GAAP requirements for transactions between entities under common control the Commerce Velocity Contribution and the Property Insight Contribution were recorded at their respective historical FNF book values on the date of contribution in the BKFS Operating LLC financial statements as of and for the period from January 2, 2014 to September 30, 2014.
The events on January 3, 2014 and June 2, 2014 are reflected in the pro forma unaudited condensed combined financial statements as if all had occurred as of the earliest date presented.
The historical consolidated financial information has been adjusted in the unaudited pro forma condensed combined financial statements to give effect to pro forma events that are (1) directly attributable to the Internal Reorganization Transactions, the Acquisition Related Refinancing and this offering and the Offering Reorganization, (2) factually supportable, and (3) with respect to the statements of operations, expected to have a continuing impact on the combined results. The unaudited pro forma condensed combined financial information should be read in conjunction with the accompanying notes to the unaudited pro forma condensed combined financial statements and the “Management’s Discussion and Analysis of Financial Condition and Results of Operations” included elsewhere in this prospectus. See the section entitled “Where You Can Find More Information.” In addition, the unaudited pro forma condensed combined financial information was based on and should be read in conjunction with the following, which are included elsewhere in this prospectus:
| • | separate audited financial statements of LPS as of December 31, 2013 and 2012, and for each year in the three-year period ended December 31, 2013, and the related notes included elsewhere in this prospectus, |
| • | separate audited financial statements of Black Knight Financial Services, LLC, a legal entity formed by FNF prior to the Acquisition, to which LPS was contributed after the Acquisition, (BKFS, LLC) as of December 31, 2013 and for the period from October 16, 2013 through December 31, 2013 and the related notes included elsewhere in this prospectus, |
66
Table of Contents
| • | separate unaudited interim condensed consolidated financial statements of BKFS Operating LLC as of September 30, 2014 (Successor period) and for the three month period ended September 30, 2014 and for the period from January 2, 2014 through September 30, 2014 (Successor periods), and for the one day period January 1, 2014 and the three and nine months ended September 30, 2013 (Predecessor periods) and the related notes included elsewhere in this prospectus, and |
| • | separate audited balance sheet of BKFS as of October 27, 2014 and the related notes included elsewhere in this prospectus. |
The unaudited pro forma condensed combined financial information has been presented for informational purposes only. The pro forma information is not necessarily indicative of what our financial position or results of operations actually would have been had the Internal Reorganization Transactions, the Acquisition Related Refinancing and this offering and Offering Reorganization been completed as of the dates indicated. In addition, the unaudited pro forma condensed combined financial information does not purport to project our future financial position or operating results. Transactions among the entities included in the unaudited pro forma condensed combined financial statements during the periods presented have been eliminated. In addition, the unaudited pro forma condensed combined financial information includes adjustments which are preliminary and may be revised. There can be no assurance that such revisions will not result in material changes.
The acquisition accounting applied to the Acquisition was prepared in accordance with GAAP and is dependent upon certain valuations and other studies that are substantially complete, but ongoing. Accordingly, the pro forma adjustments are subject to change. Differences between these preliminary estimates and the final acquisition accounting may occur and these differences could have a material impact on the accompanying unaudited pro forma condensed combined financial statements and our future results of operations and financial position.
The unaudited pro forma condensed combined financial information may not reflect all cost savings, operating synergies or revenue enhancements that we may achieve as a result of the Internal Reorganization Transactions, the costs to integrate the operations of FNF and LPS or the costs necessary to achieve these cost savings, operating synergies and revenue enhancements. These activities are ongoing. The unaudited pro forma condensed combined financial information does not reflect future costs which may be incurred in the future as a result of this offering and becoming a publicly traded company.
67
Table of Contents
Unaudited Pro Forma Condensed Combined Balance Sheet Data
As of September 30, 2014
(In millions)
| BKFS Operating LLC |
Pro Forma Adjustments |
Pro Forma BKFS | ||||||||||
| Assets |
||||||||||||
| Current assets: |
||||||||||||
| Cash and cash equivalents |
$ | 52.4 | ||||||||||
| Trade receivables, net |
128.1 | — | 128.1 | |||||||||
| Prepaid expenses and other current assets |
30.5 | (a) | ||||||||||
| Receivables from related parties |
11.7 | — | 11.7 | |||||||||
|
|
|
|
|
|
|
|||||||
| Total current assets |
222.7 | |||||||||||
| Property and equipment, net |
131.5 | — | 131.5 | |||||||||
| Computer software, net |
505.8 | — | 505.8 | |||||||||
| Other intangible assets, net |
438.3 | — | 438.3 | |||||||||
| Goodwill |
2,209.7 | — | 2,209.7 | |||||||||
| Other non-current assets |
100.3 | (a) | ||||||||||
|
|
|
|
|
|
|
|||||||
| Total assets |
$ | 3,608.3 | ||||||||||
|
|
|
|
|
|
|
|||||||
| Liabilities, Redeemable Members’ Interest and Equity |
||||||||||||
| Liabilities: |
||||||||||||
| Current liabilities: |
||||||||||||
| Trade accounts payable and other accrued liabilities |
$ | 37.0 | (a) | $ | ||||||||
| Accrued salaries and benefits |
47.0 | — | 47.0 | |||||||||
| Legal and regulatory accrual |
3.9 | — | 3.9 | |||||||||
| Current portion of long-term debt |
48.3 | |||||||||||
| Accrued interest |
15.9 | — | 15.9 | |||||||||
| Payable to related parties |
6.6 | — | 6.6 | |||||||||
| Deferred revenues |
23.8 | — | 23.8 | |||||||||
|
|
|
|
|
|
|
|||||||
| Total current liabilities |
182.5 | |||||||||||
| Deferred revenues |
26.0 | — | 26.0 | |||||||||
| Long-term debt, net of current portion |
2,106.7 | |||||||||||
| Other non-current liabilities |
14.6 | (a) | ||||||||||
|
|
|
|
|
|
|
|||||||
| Total liabilities |
2,329.8 | |||||||||||
|
|
|
|
|
|
|
|||||||
| Redeemable members’ interest |
353.1 | |||||||||||
| Equity: |
||||||||||||
| Common stock |
— | |||||||||||
| Additional paid-in capital |
— | |||||||||||
| Contributed member capital |
1,079.1 | |||||||||||
| (Accumulated loss) retained earnings |
(153.6 | ) | — | (153.6 | ) | |||||||
| Accumulated other comprehensive loss |
(0.1 | ) | — | (0.1 | ) | |||||||
|
|
|
|
|
|
|
|||||||
| Total equity attributable to BKFS, Inc. |
925.4 | |||||||||||
| Noncontrolling interest |
— | |||||||||||
|
|
|
|
|
|
|
|||||||
| Total equity |
925.4 | |||||||||||
|
|
|
|
|
|
|
|||||||
| Total liabilities, redeemable members’ interest and equity |
$ | 3,608.3 | ||||||||||
|
|
|
|
|
|
|
|||||||
See the accompanying notes to the unaudited pro forma condensed combined financial statements, which are an integral part of these statements. The pro forma adjustments are explained in Note 2. Pro Forma Adjustments.
68
Table of Contents
Unaudited Pro Forma Condensed Combined Statement of Operations Data
For the Nine Months Ended September 30, 2014
(In millions)
| BKFS Operating LLC for the period from January 2, 2014 through September 30, 2014 |
Pro Forma Adjustments |
Pro Forma BKFS |
||||||||||
| Revenue |
$ | 631.8 | $ | 2.7 | (c) | $ | 634.5 | |||||
| Operating expenses |
392.3 | — | 392.3 | |||||||||
| Depreciation and amortization |
143.1 | (5.4 | )(i) | 137.7 | ||||||||
| Legal and regulatory charges |
— | — | — | |||||||||
| Exit costs, impairments and other |
— | — | — | |||||||||
| Transition and integration costs |
111.1 | (111.1 | )(f)(h) | — | ||||||||
|
|
|
|
|
|
|
|||||||
| Total expenses |
646.5 | (116.5 | ) | 530.0 | ||||||||
|
|
|
|
|
|
|
|||||||
| Operating income |
(14.7 | ) | 119.2 | 104.5 | ||||||||
|
|
|
|
|
|
|
|||||||
| Interest income |
— | — | — | |||||||||
| Interest expense |
(96.8 | ) | (3.5 | )(j) | (93.3 | ) | ||||||
| Other expense/income (net) |
(11.1 | ) | (11.0 | )(f) | (0.1 | ) | ||||||
|
|
|
|
|
|
|
|||||||
| Total other income (expense) |
(107.9 | ) | 14.5 | (93.4 | ) | |||||||
|
|
|
|
|
|
|
|||||||
| (Loss) Earnings from continuing operations before taxes |
(122.6 | ) | 133.7 | 11.1 | ||||||||
| (Benefit) provision for income taxes |
(5.5 | ) | 6.1 | (k) | 0.6 | |||||||
|
|
|
|
|
|
|
|||||||
| Net (loss) earnings from continuing operations |
(117.1 | ) | 127.6 | 10.5 | ||||||||
| Loss from discontinued operations, net |
(0.7 | ) | — | (0.7 | ) | |||||||
|
|
|
|
|
|
|
|||||||
| Net (loss) earnings |
$ | (117.8 | ) | $ | 127.6 | $ | 9.8 | |||||
|
|
|
|
|
|
|
|||||||
See the accompanying notes to the unaudited pro forma condensed combined financial statements, which are an integral part of these statements. The pro forma adjustments are explained in Note 2. Pro Forma Adjustments.
69
Table of Contents
Unaudited Pro Forma Condensed Combined Statement of Operations Data
For the Year Ended December 31, 2013
(In millions)
| LPS | Period October 16, 2013 - through December 31, 2013 BKFS, LLC |
Subtotal | Less: TS Subs & Other |
Add: Period January 1, 2013 – through October 15 2013 BKFS, LLC |
Other Pro Forma Adjustments |
Pro Forma BKFS |
||||||||||||||||||||||
| Revenue |
$ | 1,716.2 | $ | 15.0 | $ | 1,731.2 | $ | 971.4 | $ | 56.9 | $ | (7.7 | )(b)(c)(g) | $ | 809.0 | |||||||||||||
| Operating expenses |
1,280.6 | 16.9 | 1,297.5 | 814.1 | 64.3 | (1.0 | )(b)(e)(g) | 546.7 | ||||||||||||||||||||
| Depreciation and amortization |
104.0 | 1.1 | 105.1 | 20.4 | 4.0 | 100.7 | (i) | 189.4 | ||||||||||||||||||||
| Legal and regulatory charges |
74.4 | — | 74.4 | 71.9 | — | (2.5 | )(f) | — | ||||||||||||||||||||
| Exit costs, impairments and other |
49.4 | — | 49.4 | 41.3 | — | (7.4 | )(d)(f) | 0.7 | ||||||||||||||||||||
| Transition and integration costs |
— | — | — | — | — | — | — | |||||||||||||||||||||
|
|
|
|
|
|
|
|
|
|
|
|
|
|
|
|||||||||||||||
| Total expenses |
1,508.4 | 18.0 | 1,526.4 | 947.7 | 68.3 | 89.8 | 736.8 | |||||||||||||||||||||
|
|
|
|
|
|
|
|
|
|
|
|
|
|
|
|||||||||||||||
| Operating income |
207.8 | (3.0 | ) | 204.8 | 23.7 | (11.4 | ) | (97.5 | ) | 72.2 | ||||||||||||||||||
|
|
|
|
|
|
|
|
|
|
|
|
|
|
|
|||||||||||||||
| Interest income |
2.3 | — | 2.3 | 2.2 | — | — | 0.1 | |||||||||||||||||||||
| Interest expense |
(52.4 | ) | — | (52.4 | ) | 1.2 | — | 74.4 | (j) | (128.0 | ) | |||||||||||||||||
| Other expense/income (net) |
0.1 | — | 0.1 | (0.1 | ) | — | — | 0.2 | ||||||||||||||||||||
|
|
|
|
|
|
|
|
|
|
|
|
|
|
|
|||||||||||||||
| Total other income (expense) |
(50.0 | ) | — | (50.0 | ) | 3.3 | — | (74.4 | ) | (127.7 | ) | |||||||||||||||||
|
|
|
|
|
|
|
|
|
|
|
|
|
|
|
|||||||||||||||
| Earnings (loss) from continuing operations before taxes |
157.8 | (3.0 | ) | 154.8 | 27.0 | (11.4 | ) | (171.9 | ) | (55.5 | ) | |||||||||||||||||
| Provision (benefit) for income taxes |
53.6 | — | 53.6 | 7.9 | — | (48.9 | )(k) | (3.2 | ) | |||||||||||||||||||
|
|
|
|
|
|
|
|
|
|
|
|
|
|
|
|||||||||||||||
| Net earnings (loss) from continuing operations |
104.2 | (3.0 | ) | 101.2 | 19.1 | (11.4 | ) | (123.0 | ) | (52.3 | ) | |||||||||||||||||
| Loss from discontinued operations, net |
(1.5 | ) | — | (1.5 | ) | — | — | — | (1.5 | ) | ||||||||||||||||||
|
|
|
|
|
|
|
|
|
|
|
|
|
|
|
|||||||||||||||
| Net earnings (loss) |
$ | 102.7 | ($ | 3.0 | ) | $ | 99.7 | $ | 19.1 | ($ | 11.4 | ) | ($ | 123.0 | ) | ($ | 53.8 | ) | ||||||||||
|
|
|
|
|
|
|
|
|
|
|
|
|
|
|
|||||||||||||||
See the accompanying notes to the unaudited pro forma condensed combined financial statements, which are an integral part of these statements. The pro forma adjustments are explained in Note 2. Pro Forma Adjustments.
70
Table of Contents
Unaudited Comparative Per Share Data
Presented below is BKFS’s unaudited pro forma combined per share data for the nine months ended September 30, 2014 and for the year ended December 31, 2013. This information should be read together with the consolidated financial statements and related notes of LPS, BKFS and BKFS Operating LLC as well as the “Management’s Discussion and Analysis of Financial Condition and Results of Operations” included herein and with the unaudited pro forma combined financial data included under “—Selected Unaudited Pro Forma Condensed Combined Financial Information of BKFS.” The pro forma information is presented for illustrative purposes only and is not necessarily indicative of the operating results or financial position that would have occurred if the Internal Reorganization Transactions, the Acquisition Related Refinancing and the Offering Reorganization had been completed on January 1, 2013, the beginning of the earliest period presented, nor is it necessarily indicative of the future operating results or financial position of the Combined Company. The pro forma earnings per share of the Combined Company is computed by dividing the pro forma net earnings attributable to BKFS Class A common shareholders by the pro forma weighted average number of shares outstanding.
Unaudited Pro Forma Per Share Data
For the Nine Months Ended September 30, 2014
(In millions, except per share data)
| BKFS Operating LLC for the period from January 2, 2014 through September 30, 2014 |
Pro Forma Adjustments |
Pro Forma BKFS Combined | ||||
| Net earnings per share—basic, attributable to BKFS Class A common shareholders |
||||||
|
|
|
| ||||
| Weighted average shares outstanding—basic |
||||||
|
|
|
| ||||
| Net earnings per share—diluted, attributable to BKFS Class A common shareholders |
||||||
|
|
|
| ||||
| Weighted average shares outstanding—diluted |
||||||
|
|
|
|
71
Table of Contents
Unaudited Pro Forma Per Share Data
For the Year Ended December 31, 2013
(In millions, except per share data)
| BKFS Operating LLC | Pro Forma Adjustments |
Pro Forma BKFS Combined | ||||
| Net earnings per share—basic, attributable to BKFS Class A common shareholders |
||||||
|
|
|
| ||||
| Weighted average shares outstanding—basic |
||||||
|
|
|
| ||||
| Net earnings per share—diluted, attributable to BKFS Class A common shareholders |
||||||
|
|
|
| ||||
| Weighted average shares outstanding—diluted |
||||||
|
|
|
|
See the accompanying notes to the unaudited pro forma condensed combined financial statements, which are an integral part of these statements. The pro forma adjustments are explained in Note 2. Pro Forma Adjustments.
72
Table of Contents
NOTES TO THE UNAUDITED PRO FORMA CONDENSED
COMBINED FINANCIAL STATEMENTS
| (1) | Basis of Presentation |
The unaudited pro forma condensed combined financial information was prepared using the acquisition method of accounting and is based on the historical financial statements of LPS. The acquisition method of accounting is based on Accounting Standard Code, or ASC, Topic 805, Business Combinations, or ASC 805, and uses the fair value concepts defined in ASC Topic 820, Fair Value Measurements, or ASC 820. Certain reclassifications have been made to the historical financial statements of LPS to conform to the BKFS Operating LLC presentation.
ASC 805 requires that most assets acquired and liabilities assumed be recognized at their fair values as of the date of a merger. In addition, ASC 805 establishes that the consideration transferred be measured at the closing date of a merger at the then-current market price. ASC 820 defines the term “fair value” and sets forth the valuation requirements for any asset or liability measured at fair value, expands related disclosure requirements and specifies a hierarchy of valuation techniques based on the nature of the inputs used to develop the fair value measures. Fair value is defined in ASC 820 as “the price that would be received to sell an asset or paid to transfer a liability in an orderly transaction between market participants at the measurement date.” This is an exit price concept for the valuation of the asset or liability. In addition, market participants are assumed to be buyers and sellers in the principal (or the most advantageous) market for the asset or liability. Fair value measurements for an asset assume the highest and best use by these market participants. As a result of these standards, the acquiring company may be required to record assets which are not intended to be used or sold and/or to value assets at fair value measures that do not reflect the future intended use of those assets. Many of these fair value measurements can be highly subjective and it is also possible that others applying reasonable judgment to the same facts and circumstances could develop and support a range of alternative estimated amounts.
Under the acquisition method of accounting, the LPS assets acquired and liabilities assumed were recorded as of the closing of the Acquisition at their respective fair values and added to those of FNF. The acquisition accounting applied to the Acquisition was prepared in accordance with GAAP and is dependent upon certain valuations and other studies that are substantially complete but ongoing. Accordingly, the pro forma adjustments are subject to change. Differences between these preliminary estimates and the final acquisition accounting may occur and these differences could have a material impact on the accompanying unaudited pro forma condensed combined financial statements and the Combined Company’s future results of operations and financial position.
Financial statements and reported results of operations of BKFS Operating LLC issued after the closing of the Internal Reorganization Transactions and the Acquisition Related Refinancing will reflect these values, but will not be retroactively restated to reflect the historical financial position or results of operations of LPS. The condensed combined financial information presents the acquired assets and liabilities assumed of LPS at the acquisition date fair value as determined by FNF.
Pursuant to ASC 805, the unaudited pro forma condensed combined financials have been adjusted for costs related to the Internal Reorganization Transactions and the Acquisition Related Refinancing, which we collectively refer to herein as the Transaction Costs. The Transaction Costs include legal fees, integration and restructuring costs, professional fees, severance payments, acquisition related incentive bonuses, retention bonuses, bank fees and others. Total Transaction Costs incurred by BKFS Operating LLC during the period from January 2, 2014 through September 30, 2014 and the year ending December 31, 2013 were $104.4 million and $7.0 million, respectively. The Transaction Costs and costs associated with the Offering Reorganization have been eliminated in the pro forma condensed combined statements of earnings (Note (2), item (f)) as prescribed by Article 11 of Regulation S-X. Certain transactions costs related to the Acquisition were incurred by LPS on January 1, 2014, prior to being converted to an LLC. These transactions costs were excluded from the unaudited pro forma condensed combined financial statements for the nine months ending September 30, 2014. There was no other activity in the January 1, 2014 period.
73
Table of Contents
| (2) | Pro Forma Adjustment |
This note should be read in conjunction with other notes in the unaudited pro forma condensed combined financial statements. Adjustments included in the column under the heading “Pro Forma Adjustments” represent the following:
| (a) | To record $ million of estimated income taxes receivable (payable) and to record $ million of estimated deferred income taxes as of September 30, 2014 as a result of our being a taxable entity as a result of this offering. Our future taxes will depend on the proportion of BKFS Operating LLC owned by the public company. For the purposes of the unaudited pro forma condensed combined financial information, we have assumed that we will own 15% of BKFS Operating LLC after this offering and an effective tax rate of 38%. |
| (b) | To eliminate $2.4 million of revenue earned by Property Insight on transactions with LPS and corresponding expense to LPS for the year ending December 31, 2013. |
| (c) | To adjust deferred revenue recognition as a result of fair value accounting associated with the Acquisition. Certain revenues are deferred for accounting purposes but require minimal or no future incremental direct costs in order to be recognized. The net effect was a change to pro forma BKFS deferred revenues recognized of $2.7 million and $(15.1) million for the nine months ending September 30, 2014 and the year ending December 31, 2013, respectively. |
| (d) | To reverse $0.4 million charge for discontinuation of a computer software project recorded by LPS during the year ended December 31, 2013. |
| (e) | To record the following adjustments to personnel cost: |
| Year Ended December 31, 2013 |
||||
| Reverse share-based compensation recorded by LPS |
$ | (15.7 | ) | |
| Record estimated stock-based compensation related to profits interests on BKFS Operating LLC issued to certain employees and directors during 2014, subsequent to the Acquisition |
7.3 | |||
|
|
|
|||
| $ | 8.4 | |||
|
|
|
|||
| (f) | To reverse the Transaction Costs incurred by LPS and BKFS Operating LLC of $104.4 million and $7.0 million incurred during the nine months ending September 30, 2014 and the year ending December 31, 2013, respectively. Also, to reverse $11.0 and $2.5 million in legal costs associated with shareholder litigation incurred in the nine months ending September 30, 2014 and the year ending December 31, 2013, respectively. |
| (g) | To reclassify $9.8 million of intercompany Revenues from the TS subs netted in Operating expenses. |
| (h) | To reverse the member management fees of $6.7 million for nine months ending September 30, 2014 which were payable to FNF and THL annually in accordance with the Amended and Restated Operating Agreement. |
74
Table of Contents
| (i) | To record adjustments to amortization pertaining to deferred costs, which are included in Other assets in the unaudited pro forma condensed combined financial statements, Computer software and Intangible assets as a result of fair value accounting. |
| Nine Months Ended September 30, 2014 |
Year Ended December 31, 2013 |
|||||||
| (In millions) | ||||||||
| Reverse historical depreciation and amortization of LPS Property and equipment, Computer software and Intangible assets |
$ | — | $ | (71.6 | ) | |||
| Record incremental BKFS Operating LLC depreciation and amortization on Property and equipment, Computer software and Intangible assets as a result of fair value accounting |
(7.4 | ) | 183.3 | |||||
| Reverse historical amortization of LPS Deferred costs |
— | (12.0 | ) | |||||
| Record incremental deferred cost amortization on BKFS Operating LLC as a result of fair value accounting |
2.0 | 1.0 | ||||||
|
|
|
|
|
|||||
| $ | (5.4 | ) | $ | 100.7 | ||||
|
|
|
|
|
|||||
Purchased software is recorded at cost and amortized using the straight-line method over its estimated useful life. Software acquired in business combinations is recorded at its fair value and amortized using straight-line or accelerated methods over its estimated useful life, ranging from 5 years to 10 years. Internally developed software costs are amortized using the straight-line method over its estimated useful life. Useful lives of computer software range from 3 years to 10 years. The resulting estimated amortization is $68.2 million per year.
The assumed life for the other intangible assets is 2-15 years and is determined based on the expected future cash flows of the intangible asset. Intangible asset amortization is estimated using the accelerated, pattern-of-benefit amortization method, resulting in amortization for the next 5 years as follows:
| (In millions) | ||||
| 2015 |
$ | 82.2 | ||
| 2016 |
76.4 | |||
| 2017 |
65.5 | |||
| 2018 |
55.3 | |||
| 2019 |
45.2 | |||
| (j) | To record adjustments to interest expense as a result of fair value accounting and certain refinancing and debt related activity which occurred simultaneously with the Internal Reorganization Transactions, the Acquisition Related Refinancing and the Offering Reorganization. These activities are described in further detail below. The pro forma condensed combined statements of operations reflect this activity as if it had occurred on January 1, 2013, the beginning of the earliest period presented. |
75
Table of Contents
The following are adjustments to interest expense on debt as a result of the Internal Reorganization Transactions and the Acquisition Related Refinancing:
| Nine Months Ended September 30, 2014 |
Year Ended December 31, 2013 |
|||||||
| (In millions) | ||||||||
| Eliminate amortization of debt issuance costs and fees recorded by LPS |
$ | — | $ | (5.9 | ) | |||
| Eliminate interest expense related to LPS interest rate swap terminated as part of the Acquisition |
— | (4.2 | ) | |||||
| Eliminate interest expense related to change of control offering of LPS’s unsecured Senior Notes in February 2014 |
— | (0.3 | ) | |||||
| Eliminate interest on LPS’s outstanding Term A Loan that was repaid as part of the Acquisition |
— | (10.8 | ) | |||||
| Amortization of $23.3 million bond premium recognized on LPS unsecured Senior Notes as a result of fair value accounting |
— | (2.1 | ) | |||||
| Adjustments for estimated interest on BKFS Operating LLC Intercompany Notes and Mirror Notes with FNF |
(3.5 | ) | 97.7 | |||||
|
|
|
|
|
|||||
| $ | (3.5 | ) | $ | 74.4 | ||||
|
|
|
|
|
|||||
On January 2, 2014, BKHI issued (i) a Mirror Note, or the Original Mirror Note, in the original principal amount of $1,400.0 million and (ii) an Intercompany Note, or the Original Intercompany Note, in the original principal amount of $1,175.0 million to FNF. BKFS Operating LLC entered into an assumption agreement, dated as of January 3, 2014, among BKFS Operating LLC, BKHI and FNF pursuant to which it assumed $820.0 million of the debt issued under the Original Mirror Note and $688.0 million of the debt issued under the Original Intercompany Note and FNF released BKHI of its obligations with respect to the debt assumed by BKFS Operating LLC from BKHI under the Original Mirror Note and Original Intercompany Note. Subsequently, on January 6, 2014, BKFS Operating LLC borrowed an additional sum of $63.0 million pursuant to an intercompany note issued by BKFS Operating LLC to FNF, or the Second Intercompany Note, and on March 31, 2014, BKFS Operating LLC borrowed an additional sum of $25.0 million pursuant to the Second Intercompany Note. The Original Intercompany Note and the Second Intercompany Note are collectively known as the Intercompany Notes.
The amount assumed by BKFS Operating LLC on the Original Mirror Note is divided into two tranches known as Tranche “T” and Tranche “R”, collectively, the “Mirror Notes”. The Tranche “T” in the original amount of $644.0 million bears interest at the rate or rates of interest charged on borrowings under FNF’s Term Loan Credit Agreement, plus 100 basis points. The Tranche “R” in the original amount of $176.0 million bears interest at the rate or rates of interest charged on borrowings under FNF’s Revolving Credit Agreement, plus 100 basis points. As of September 30, 2014, BKFS Operating LLC was paying 2.75% plus LIBOR on Tranche “T” and 2.45%, plus LIBOR on Tranche “R”. The interest rates in effect for Tranche “T” and Tranche “R” Loans at September 30, 2014 were 2.98% and 2.60%, respectively.
The Original Mirror Note agreement requires BKFS Operating LLC to repay the outstanding principal amount of Tranche “T” in equal quarterly installments on the last day of each fiscal quarter as follows, with the first such
76
Table of Contents
payment to be made on the last day of the fifth full fiscal quarter after January 2, 2014, or the Funding Date: (1) 0.0% in the first year after the Funding Date, (2) 10.0% in the second year after the Funding Date, (3) 15.0% in the third year after the Funding Date, (4) 20.0% in the fourth year after the Funding Date and (5) 20.0% in the fifth year after the Funding Date, in each case of the original aggregate principal amount of Tranche “T” made on the Funding Date. The remaining balance of the original amount shall be repaid on January 2, 2019. Tranche “R” has no scheduled principal payments, but will be due and payable in full on July 15, 2018.
The Intercompany Notes bear interest at a fixed rate of 10% per annum. Such interest shall be calculated and payable quarterly on the last day of each March, June, September and December of each fiscal year. The Intercompany Notes agreements originally required BKFS Operating LLC to repay the outstanding principal amounts in equal quarterly installments of 2.5% of the original principal sum on the last day of each March, June, September and December of each fiscal year prior to the maturity date, which is January 2, 2024 in the case of the $688.0 million Intercompany Note and January 6, 2024 in the case of the $63.0 million and $25.0 million Intercompany Notes. On May 30, 2014, BKFS Operating LLC entered into an amended and restated intercompany note agreement to eliminate the requirement to make scheduled principal payments prior to the maturity dates.
BKFS Operating LLC has the right to prepay, at any time and from time to time, all or any portion of the outstanding principal amount of the Mirror Notes and the Intercompany Notes without premium or penalty.
At the date of the Acquisition, LPS had outstanding $600.0 million in 5.75% Senior Notes due 2023 (the “Senior Notes”). The Senior Notes were registered under the Securities Act, and carry an interest rate of 5.75% and will mature on April 15, 2023. Interest is paid semi-annually on the 15th day of April and October. The Senior Notes are senior unsecured obligations. At any time and from time to time, prior to October 15, 2015, BKFS Operating LLC may redeem up to a maximum of 35% of the original aggregate principal amount of the Senior Notes with the proceeds of one or more equity offerings, at a redemption price equal to 105.75% of the principal amount thereof, plus accrued and unpaid interest thereon, if any, to the redemption date. Prior to October 15, 2017, BKFS Operating LLC may redeem some or all of the Senior Notes by paying a “make-whole” premium based on U.S. Treasury rates. On or after October 15, 2017, BKFS Operating LLC may redeem some or all of the Senior Notes at the redemption prices described in the indenture governing the Senior Notes, plus accrued and unpaid interest. In addition, if a change of control occurs, BKFS Operating LLC is required to offer to purchase all outstanding Senior Notes at a price equal to 101% of the principal amount plus accrued and unpaid interest, if any, to the date of purchase. Pursuant to these change of control provisions, on January 16, 2014, BKFS Operating LLC, as the successor to LPS, issued an offer to purchase the Senior Notes at a purchase price of 101% of the principal amount plus accrued interest to the purchase date. As a result of the offer, bondholders tendered $5.2 million in principal of the Senior Notes, which were subsequently purchased by BKFS Operating LLC on February 24, 2014. In connection with this tender offer, BKFS Operating LLC paid $0.3 million of interest to these bondholders. On February 7, 2014, BKIS, FNF, Black Knight Lending Solutions, Inc., a Delaware corporation and wholly-owned subsidiary of BKIS, or BKLS, and the Trustee entered into a second supplemental indenture, or the Second Supplemental Indenture, to the indenture governing the Senior Notes. Under the Second Supplemental Indenture, the financial reporting covenant under the Indenture was amended to substitute reporting of FNF for that of BKIS and BKLS. In connection with the consent to remove the financial reporting covenant, BKFS Operating LLC paid $0.7 million to the holders of the Senior Notes in February 2014.
As a result of the Acquisition, the Senior Notes were adjusted to fair market value, resulting in BKFS Operating LLC recording a premium on the Senior Notes of approximately $23.3 million. The premium is amortized over the remaining term of the Senior Notes using the effective interest method.
Prior to the Acquisition, LPS’s debt included a Term A Loan outstanding of $468.1 million, which was issued pursuant to an Amended and Restated Credit Agreement dated August 18, 2011, or the Term A Loan, with JPMorgan Chase Bank, N.A., as Administrative Agent, Swing Line Lender and Letters of Credit Issuer, and various other lenders. Voluntary prepayments were generally permitted at any time without fee upon proper notice and subject to minimum dollar requirements. The Term A Loan was subject to a variable interest rate
77
Table of Contents
equal to LIBOR plus an annual margin percentage determined in accordance with a leverage ratio-based pricing grid. At December 31, 2013, the Term A Loan carried an interest rate of 2.17%. Upon consummation of the Acquisition, the Term A Loan was fully repaid.
Prior to the Acquisition, LPS entered into interest rate swap transactions in order to convert a portion of its interest rate exposure on its floating rate debt from variable to fixed. These interest rate swaps were designated as cash flow hedges. The interest rate swap outstanding at the time of the Acquisition was terminated subsequent to payment of the Term A Loan on January 2, 2014.
The debt transactions described above are referred to as the “Acquisition Related Refinancing”.
The following are expected changes to the BKFS outstanding debt and related interest expense as a result of this offering:
| Nine Months Ended September 30, 2014 |
Year Ended December 31, 2013 |
|||||||
| (In millions) | ||||||||
| Eliminate amortization of premium on unsecured notes recorded by BKFS Operating LLC |
$ | $ | — | |||||
| Eliminate interest expense on BKFS Operating LLC debt repaid with proceeds from this offering |
— | |||||||
|
|
|
|
|
|||||
| $ | $ | — | ||||||
|
|
|
|
|
|||||
| (k) | To record $6.1 million and $(48.9) million of corporate income tax expense (benefit) to the nine months ending September 30, 2014 and the year ending December 31, 2013, respectively, in order to reflect our expected tax structure. Our future taxes will depend on the proportion of BKFS Operating LLC owned by the public company. For the purposes of the unaudited pro forma condensed consolidated financial information, we have assumed that we will own 15% of BKFS Operating LLC after this offering and an effective tax rate of 38%. This 15% ownership assumption is for the purposes of these pro forma results and may not reflect the future ownership of BKFS Operating LLC by the new public company. |
78
Table of Contents
| (l) | To record the adjustments to member capital, additional paid in capital, redeemable member interest, noncontrolling interest and net earnings attributable to noncontrolling interest ownership subsequent as a result of this offering and the Offering Reogranization, as follows: |
| September 30, 2014 | ||||
| Increase to Additional paid in capital as a result of the Offering |
$ | |||
| Reclass of Contributed member capital to Additional paid in capital |
||||
| Decrease to Redeemable members’ interest due to the elimination of THL’s put option on the BKFS Operating LLC member interests |
||||
| Decrease to Redeemable members’ interest due to the elimination of profits interest holder’s put option on the BKFS Operating LLC profits interests |
||||
| Increase in Noncontrolling interest due to THL’s pro forma minority ownership of BKFS |
||||
|
|
|
|||
| Total adjustment to equity and redeemable members’ interest |
$ | |||
|
|
|
|||
| Nine Months Ended September 30, 2014 |
Year Ended December 31, 2013 |
|||||||
| Adjustment to Net earnings attributable to noncontrolling interests on historical net earnings, based on THL’s pro forma ownership of BKFS after the Offering Reorganziation |
$ | $ | ||||||
| Adjustment to Net earnings attributable to noncontrolling interests on pro forma revenue and expense adjustments, net of tax, based on THL’s minority ownership of BKFS Operating LLC |
$ | $ | ||||||
|
|
|
|
|
|||||
| Total adjustment to noncontrolling interest expense |
$ | $ | ||||||
|
|
|
|
|
|||||
The unaudited pro forma combined basic and diluted earnings per share for the periods presented are based on the combined basic and diluted weighted-average shares outstanding to be issued by BKFS in this offering.
The unaudited pro forma condensed combined financial statements, for the nine months ending September 30, 2014, reflect certain realized savings from cost reduction initiatives implemented by management subsequent to the Acquisition but do not reflect anticipated savings that may be realized in future periods. There can be no assurance that any additional cost savings will be achieved or the extent to which they will impact BKFS results of operations in the future. The unaudited pro forma condensed combined financial information does not reflect future costs that may be incurred in the future as a result of becoming a publicly traded company.
The unaudited pro forma condensed combined financial statements do not present a combined dividend per share amount.
79
Table of Contents
MANAGEMENT’S DISCUSSION AND ANALYSIS OF FINANCIAL CONDITION AND
RESULTS OF OPERATIONS
The following discussion and analysis of our historical combined financial statements includes periods before the Internal Reorganization Transactions. Accordingly, the discussion and analysis of such periods does not reflect the significant impact the Internal Reorganization Transactions have had and will have on our results of operations. As a result, our historical results of operations are not comparable and may not be indicative of our future results of operations. In addition, the statements in the discussion and analysis regarding industry outlook, our expectations regarding the performance of our business, our liquidity and capital resources and the other non-historical statements are forward-looking statements. These forward-looking statements are subject to numerous risks and uncertainties, including, but not limited to, the risks and uncertainties described in “Risk Factors” and “Forward-Looking Statements.” Our actual results may differ materially from those contained in or implied by the forward-looking statements. You should read the following discussion together with the sections entitled “Risk Factors,” “Selected Historical Financial Data,” “Unaudited Pro Forma Condensed Combined Financial Data,” “—Liquidity and Capital Resources” and the financial statements and the related notes thereto included elsewhere in this prospectus.
Overview
We are a leading provider of integrated technology, workflow automation and data and analytics to the mortgage industry. Our solutions facilitate and automate many of the mission-critical business processes across the entire mortgage loan life cycle, from origination until asset disposition. We believe we differentiate ourselves by the breadth and depth of comprehensive, integrated solutions and the insight we provide to our clients.
We have market leading positions in mortgage processing and technology solutions combined with comprehensive real estate data and extensive analytic capabilities. Our solutions are utilized by 21 of the 25 largest U.S. mortgage originators and all of the 25 largest U.S. mortgage servicers, as well as other financial institutions, investors and real estate professionals, to support mortgage lending and servicing operations, analyze portfolios and properties, operate more efficiently, meet regulatory compliance requirements and mitigate risk.
The U.S. mortgage market is a large market. According to the Fed, U.S. total mortgage debt outstanding is approximately $9.9 trillion as of September 2014, while total U.S. mortgage originations are expected to exceed $1.1 trillion in 2014, according to the MBA.
The U.S. mortgage market is undergoing significant change and mortgage market participants have been subjected to more stringent oversight in recent years. Regulators have increasingly focused on better disclosure, improved risk mitigation and enhanced oversight. Mortgage lenders large and small have experienced higher costs in order to comply with this higher level of regulation. Despite these new regulatory burdens, the mortgage industry remains a competitive marketplace with numerous large lenders and smaller institutions competing for new loan originations. In order to comply with this increased regulatory burden and compete more effectively, mortgage market participants have continued to outsource mission-critical functions to third-party technology providers that can offer economical solutions due to their economies of scale.
We believe our comprehensive end-to-end, integrated solutions differentiate us from other technology providers serving the mortgage industry and positions us particularly well for evolving opportunities in this market. We have exclusively served the mortgage and real estate industries for over 50 years and utilize this experience to design and develop solutions that fit our clients’ ever-evolving needs. Our proprietary technology platforms and data and analytics capabilities reduce manual processes, improve compliance and quality, mitigate risk and deliver significant cost savings to our clients. Our scale allows us to continually and cost-effectively invest in our business in order to meet evolving industry requirements and maintain our position as an industry-standard platform for mortgage market participants. Our proprietary technology platform services more than 50% of all U.S. first lien mortgages based on the number of U.S. first lien mortgages according to the BKFS Mortgage Monitor Report, reflecting our leadership in the mortgage servicing market, and our market share has grown by more than four percentage points over the last five years.
80
Table of Contents
Capitalizing on our leadership position, we launched LoanSphere, an innovative product and delivery strategy, which provides a workflow management application designed to streamline and automate business processes across the mortgage loan life cycle. Some solutions have already been delivered under LoanSphere, and we are focused on providing integration and automation in all of the solutions we offer.
Our business is organized into two segments:
| • | Technology—offers software and hosting solutions that support loan servicing, which includes the core mortgage servicing, specialty mortgage servicing including loss mitigation and default workflow management, loan origination and settlement services. |
| • | Data and Analytics—offers solutions to enhance and support our technology products in the mortgage, real estate and capital markets industries. These solutions include property ownership data, lien data, servicing data, automated valuation models, collateral risk scores, prepayment and default models, lead generation and other data solutions. |
We offer our solutions to a wide range of clients across the mortgage industry. The quality and breadth of our solutions contributes to the long-standing nature of our relationships with our clients, the majority of whom enter into long-term contracts across multiple products that are embedded in their mission critical workflow and decision processes. Given the contractual nature of our revenues and stickiness of our client relationships, our revenues are highly visible and recurring in nature. Due to our integrated suite of solutions and our scale in the mortgage market, we are able to drive significant operating leverage, which we believe enables our clients to operate more efficiently while allowing us to generate strong margins and cash flow.
Our History
Our business generally represents a reorganization of the former Technology, Data and Analytics segment of LPS, a former provider of integrated technology, data and services to the mortgage lending industry in the United States. Our business also includes the businesses of Commerce Velocity and Property Insight, two companies that were contributed to us by our majority owner, FNF.
Acquisition of LPS by FNF and Subsequent Reorganization
On January 2, 2014, FNF acquired LPS, and as a result, LPS became an indirect, wholly-owned subsidiary of FNF. Upon the closing of the transaction, the shares of LPS common stock, which previously traded under the ticker symbol “LPS” on the NYSE, ceased trading on, and were delisted from, the NYSE.
On January 3, 2014, pursuant to the Internal Reorganization, substantially all of the former Technology, Data and Analytics segment of LPS was transferred to us and the former Transaction Services businesses of LPS were transferred by BKIS to BKHI and contributed by BKHI to another of its then wholly-owned subsidiaries or to another subsidiary of FNF.
Also, on January 3, 2014, BKHI contributed Commerce Velocity, a former indirect subsidiary of FNF that had been contributed to BKHI in December 2013, to BKFS Operating LLC, which contributed it to BKIS. Thereafter, we issued 35.0% of the membership interests of BKFS Operating LLC to certain THL Affiliates and THL Intermediaries.
Following the Internal Reorganization, we are majority owned by FNF through its wholly-owned subsidiary, BKHI, and minority owned by THL through certain THL Affiliates and THL Intermediaries. FNF and THL Managers LLC also provide us with management and consulting services. The agreements under which FNF and THL Managers LLC provide these services will be terminated in connection with the closing of this offering.
81
Table of Contents
Contribution of Property Insight, LLC
On June 2, 2014, as part of an additional internal reorganization, two wholly-owned subsidiaries of FNF contributed to us their respective interests in Property Insight, a company that provides property information used by title insurance underwriters, title agents and closing attorneys to underwrite title insurance policies for real property sales and transfers. As a result, we are now the sole member of Property Insight. In connection with the Property Insight Contribution, BKFS Operating LLC issued an additional 6.4 million of its Units to BKHI. As a result of this issuance, THL Affiliates’ and THL Intermediaries’ combined percentage ownership in BKFS Operating LLC was reduced from 35.0% to 32.9%.
In accordance with GAAP requirements for transactions between entities under common control, assets and liabilities contributed in the Commerce Velocity Contribution and the Property Insight Contribution were recorded at their respective historical FNF book values and our consolidated financial statements have been adjusted to reflect the combined entity as if the contribution occurred on January 2, 2014.
Basis of Presentation
As a result of the Internal Reorganization Transactions, our financial position, results of operations and cash flows include:
| • | the consolidated financial position, results of operations and cash flows of LPS for all periods prior to January 2, 2014; and |
| • | the consolidated financial position, results of operations and cash flows of BKFS Operating LLC following the Acquisition, including the results of operations and cash flows of the businesses of Commerce Velocity and Property Insight for the time period beginning on January 2, 2014. |
Accordingly, in the following discussion and analysis:
| • | the results of operations and cash flows for the periods from January 1, 2011 to January 1, 2014 are referred to herein as the Predecessor Period; |
| • | the results of operations and cash flows for January 1, 2014 are referred to herein as the Predecessor 2014 Interim Day; |
| • | the results of operations and cash flows for the period from January 1, 2013 to September 30, 2013 are referred to herein as the Predecessor 2013 Interim Period; |
| • | the results of operations and cash flows for the period from January 1, 2013 to December 31, 2013 are referred to herein as the Predecessor 2013 Annual Period; |
| • | the results of operations and cash flows for the period from January 1, 2012 to December 31, 2012 are referred to herein as the Predecessor 2012 Annual Period; |
| • | the results of operations and cash flows for the period from January 1, 2011 to December 31, 2011 are referred to herein as the Predecessor 2011 Annual Period; |
| • | the results of operations and cash flows for the periods from January 2, 2014 to September 30, 2014 are referred to herein as the Successor 2014 Interim Period or Successor Period; |
| • | the Successor 2014 Interim Period and Predecessor 2013 Interim Period are collectively referred to herein as the Interim Periods; and |
| • | the Predecessor 2013 Annual Period, Predecessor 2012 Annual Period and Predecessor 2011 Annual Period are collectively referred to herein as the Annual Periods. |
In this discussion and analysis, the results of operations and cash flows we report for the nine months ended September 30, 2014 do not include the financial data from the Predecessor 2014 Interim Day, during which we did not conduct significant operations but to which $50.1 million of transaction costs related to the Acquisition are attributed.
82
Table of Contents
Our Reporting Segments
We have two reporting segments, Technology and Data and Analytics. Our Technology segment offers leading software and hosting solutions that facilitate and automate many of the business processes across the life cycle of a mortgage. Our Data and Analytics segment provides data and analytics solutions that are used to support and enhance our technology solutions, and help lenders and servicers make more informed decisions, improve performance, identify and predict risk and generate more qualified leads. In addition to our two reporting segments, we have a corporate organization that consists primarily of general and administrative expenses that are not included in the other segments, legal and regulatory charges, and transition and integration costs.
The following table sets forth our revenues from continuing operations for our operating segments and our corporate organization for the Interim Periods and Annual Periods:
| Successor | Predecessor | |||||||||||||||||||
| Period from January 1, 2014 through September 30, 2014 |
Nine Months Ended September 30, 2013 |
Year Ended December 31, | ||||||||||||||||||
| 2013 | 2012 | 2011 | ||||||||||||||||||
| (in millions) | ||||||||||||||||||||
| Technology |
$ | 518.5 | $ | 499.0 | $ | 663.6 | $ | 640.3 | $ | 594.2 | ||||||||||
| Data and Analytics |
113.2 | 61.4 | 80.8 | 79.1 | 76.1 | |||||||||||||||
| Corporate/Other |
0.1 | 0.1 | 0.4 | (0.5 | ) | 0.1 | ||||||||||||||
|
|
|
|
|
|
|
|
|
|
|
|||||||||||
| Total |
$ | 631.8 | $ | 560.5 | $ | 744.8 | $ | 718.9 | $ | 670.4 | ||||||||||
|
|
|
|
|
|
|
|
|
|
|
|||||||||||
Factors Affecting Comparability of Our Results of Operations
As a result of a number of factors, our results of operations for the Predecessor Period are not comparable to the Successor Period, and our historical results of operations may not be comparable to our results of operations in future periods and our results of operations may vary from period to period. Set forth below is a brief discussion of the key factors impacting the comparability of our results of operations.
Transfer of the Transaction Services Businesses of LPS. Our results of operations for the Predecessor Period include the former Transaction Services segment of LPS that is not a part of our business following the Internal Reorganization and, therefore, is not and will not be reflected in the results of operations for the Successor Period or future periods.
Contributions of Commerce Velocity and Property Insight. Commerce Velocity and Property Insight were contributed to us on January 3, 2014 and June 2, 2014, respectively. Therefore, our results of operations for the Predecessor Period do not include the results of operations of the businesses of Commerce Velocity and Property Insight. In accordance with GAAP, the results of operations of Commerce Velocity and Property Insight are included in our results of operations for the period beginning on January 2, 2014.
Expenses Associated with the Internal Reorganization Transactions. In connection with the Internal Reorganization Transactions, we incurred significant transaction costs and transition and integration expenses, including employee severance, bonuses under our Synergy Incentive Program, a short-term compensation program that rewards our executive officers for maximizing cost-reductions relating to the Acquisition and certain other non-recurring professional fees and other costs.
Related Party Transactions. We are party to certain transactions with entities that became our related parties on January 2, 2014 as part of the Acquisition. For example, we have a management agreement with each of THL Managers and FNF pursuant to which services are provided and we pay a fee for such services in the annual amount of $3.2 million to THL Managers and $5.9 million to FNF. We did not have similar agreements in place prior to the Acquisition. In addition, prior to the Acquisition, the Technology and Data and Analytics businesses
83
Table of Contents
provided software and services to certain of LPS’s former Transaction Services businesses. For financial reporting purposes, those transactions were accounted for as cost transfers with no effect on revenue. Following the Acquisition, those transactions are accounted for as revenue with a corresponding amount of operating expenses. The effect of this change was to record incremental revenue for the period of January 2, 2014 to September 30, 2014 in the amount of approximately $3.2 million for the Technology segment and approximately $5.2 million for the Data and Analytics segment. There is no effect on operating (loss) income or (loss) income from continuing operations from this change. The other related party transactions with FNF, THL, THL Managers, THL Affiliates and ServiceLink do not have a material effect on the comparability of our results of operations.
Increased Interest Expense. In connection with the Acquisition, our total long-term debt outstanding increased from $1,068.1 million at December 31, 2013 to $2,155.0 million at September 30, 2014. Specifically, our term loans of $468.1 million at December 31, 2013 were repaid and replaced with intercompany loans payable to FNF. The amount payable to FNF at September 30, 2014 under the intercompany loans was $1,538.4 million. As a result of the increase in total long-term debt outstanding and higher interest rates on the intercompany loans when compared to our former term loans, our annual interest expense is significantly higher following the Internal Reorganization Transactions.
Increased Depreciation and Amortization Expense. In connection with the Acquisition, all assets and liabilities contributed to BKFS were set to their fair value on January 2, 2014 as part of the allocation of FNF’s purchase price to identifiable assets acquired and liabilities assumed. The result of the purchase price allocation was a significant increase to intangible assets, including developed technology and client relationships. As a result, our depreciation and amortization is significantly higher following the Acquisition.
Decreased Income Taxes. Our effective tax rate for the Successor 2014 Interim Period and the Predecessor 2013 Interim Period was (4.5%) and 35%, respectively. The decrease in the effective rate is primarily due to the change in taxable status from a corporation to a partnership under federal and state income tax laws. The tax benefit we recognized during the Successor 2014 Interim Period is primarily a result of the deductible transaction costs incurred by LPS prior to the change in taxable status. We will again be taxed as a corporation following the offering.
Legal and Regulatory Matters. During the Successor 2014 Interim Period we recorded $11.0 million in expenses, including interest, relating to an appraisal proceeding filed by Merion Capital in connection with the Acquisition seeking a judicial determination of the “fair value” of Merion Capital’s shares of LPS common stock under Delaware law, together with statutory interest. On September 18, 2014, we reached an agreement with Merion Capital to resolve an interest motion and FNF paid Merion Capital the merger consideration (cash and stock) and BKFS paid interest of $9.0 million accrued through the date of payment. The parties will continue the appraisal proceeding. For periods prior to the Acquisition, the legal and regulatory charges primarily related to the former Transaction Services businesses of LPS, which have been transferred to ServiceLink and another FNF Subsidiary in connection with the Internal Reorganization.
Deferred Revenue. In connection with the Acquisition, we recorded an adjustment to reflect deferred revenue at its fair value in accordance with GAAP. The result is that we will not recognize revenue of approximately $13.9 million in 2014, $10.2 million in 2015 and $8.1 million in 2016.
Cost Reduction Actions. In connection with the Acquisition, we put action plans in place to reduce operating costs and increase our profitability. We also put a compensation plan in place, referred to herein as the “Synergy Incentive Program,” to incentivize our management team to accomplish planned cost reductions. As a result of the actions taken during 2014, we have reduced our operating expenses as a percent of revenue as compared to periods prior to 2014. Substantially all of our planned cost reduction actions were complete as of September 30, 2014.
84
Table of Contents
Factors Affecting Our Results of Operations
Mortgage Originations
Our various businesses are impacted differently by the level of mortgage originations including refinancing transactions. MSP is generally less affected by varying levels of mortgage originations because it earns revenues based on the total number of mortgage loans it processes, which tend to stay more constant than the market for originations. Our origination technology and some of our data businesses are directly affected by the volume of real estate transactions and mortgage originations, but many of our client contracts for origination technology contain minimum charges.
Changing Mortgage Market
Our various businesses are also impacted by an evolving mortgage market. Some of the changes we are seeing in the mortgage industry that may affect our results of operations are as follows:
| • | mortgage originators and servicers have seen volatility in their earnings as a result of significant changes in mortgage origination and default volumes and increasing regulatory compliance costs. As a result of increased volatility in originations, greater regulatory scrutiny and the higher cost of doing business, lenders have become increasingly focused on their core operations and customers. We believe lenders are increasingly shifting from affiliate business models and in-house technologies to solutions with third-party providers who can provide better technology and services more efficiently; |
| • | the complexity of the mortgage origination and servicing processes have led some banks, lenders and servicers to become increasingly focused on technology automation and workflow management to operate more efficiently and meet their regulatory guidelines; and |
| • | industry participants are working to minimize risk in lending, servicing and capital markets and increasingly rely on data and analytics to integrate with technologies and enhance the decision making process. |
Economic Conditions
Our various businesses are also impacted by general economic conditions. For example, in the event that a difficult economy or other factors lead to a decline in levels of home ownership and a reduction in the number of mortgage loans outstanding and we are not able to counter the impact of those events with increased market share or higher fees, it could have a material adverse effect on our mortgage processing revenues. In contrast, we believe that a weaker economy tends to increase the volume of consumer mortgage defaults, which can increase the revenues in our specialty servicing technology business that is used to service residential mortgage loans in default. Also, interest rates tend to decline in a weaker economy driving higher than normal refinance transactions that provide potential volume increases to our origination technology offerings, most specifically the RealEC Exchange platform.
Regulatory Requirements
In recent years, there has been an increased legislative and regulatory focus on consumer protection practices. As a result, federal and state governments have enacted various new laws, rules and regulations. One example of such legislation is the Dodd-Frank Act, which was signed into law in July 2010. The Dodd-Frank Act contains broad changes for many sectors of the financial services and lending industries and established the CFPB, a new federal regulatory agency responsible for regulating consumer financial protection within the U.S. This has led banks and other lenders to seek technology solutions that assist them in satisfying their regulatory compliance obligations in the face of a changing regulatory environment. We have developed solutions that target this need, which has resulted in additional revenue.
85
Table of Contents
The CFPB has issued guidance that applies to “supervised service providers,” which the CFPB has defined to include service providers, like us, to CFPB-supervised banks and non-banks. In addition, the Dodd-Frank Act contains the Mortgage Reform and Anti-Predatory Lending Act that imposes a number of additional requirements on lenders and servicers of residential mortgage loans. It is difficult to predict the form that new rules or regulations implemented by the CFPB or other regulations implemented under other requirements of the Dodd-Frank Act may take, what additional legislative or regulatory changes may be approved in the future, or whether those changes may require us to change our business practices or incur increased costs of compliance.
Key Components of Results of Operations
Revenue
We generate revenue primarily through contractual arrangements that we enter into with clients to provide services, software and software-related services either individually or as part of an integrated offering of multiple services. These arrangements occasionally include offerings from more than one business unit to the same client.
The following is a description of our revenues by segment:
Technology
Our Technology segment revenues are primarily derived from mortgage processing, outsourced business processing services, and software and software-related services. In some cases, these services are offered in combination with one another, and in other cases we offer them individually. Revenues from mortgage processing and outsourced business processing services are typically volume-based and depend on factors such as the number of accounts processed, transactions processed and computer resources utilized.
The majority of the revenues in our Technology segment are from outsourced data processing and application hosting, and outsourced business processing services.
Data and Analytics
Our Data and Analytics segment revenues are primarily derived from data and valuation-related services. Our Data and Analytics segment owns or licenses data assets that primarily include loan information and property sales and characteristic information. We both license our data directly to our clients and provide our clients with analytical products and workflow solutions for risk management, multiple listing services, insurance underwriting, collateral assessment and loan quality reviews.
Expenses
The following is a brief description of the components of our expenses:
| • | Operating expenses include payroll, employee benefits, occupancy costs, data processing costs, program design and development costs and professional services. |
| • | Depreciation and amortization expense consists of our depreciation related to investments in property and equipment, including information technology hardware, as well as amortization of purchased and developed software and other intangible assets, principally client relationships recorded in connection with the Acquisition. It also includes the amortization of previously deferred implementation-related expenses. Depreciation and amortization expense increased significantly in 2014 compared to 2013 as a result of fair value adjustments recorded in connection with the Acquisition. |
| • | Transition and integration costs consist of incremental costs associated with executing the Acquisition, as well as the related transitioning costs including employee severance, expenses associated with our Synergy Incentive Program, certain other non-recurring professional and other costs as well as member management fees paid to FNF and THL Managers LLC. |
86
Table of Contents
| • | Exit costs, impairments and other charges consist of certain lease exit charges, employee severance, stock compensation acceleration charges, impairments of long-lived assets and other non-recurring charges. In 2014, costs incurred of this nature were directly the result of the Acquisition and are included in transition and integration costs. |
| • | Legal and regulatory charges consist of either actual or estimated costs of settlement, damages and associated legal and professional fees with respect to legal and regulatory matters. For periods prior to the Acquisition, the legal and regulatory charges primarily related to the former Transaction Services businesses that are now part of ServiceLink and another FNF Subsidiary. |
| • | Interest expense for 2014 consists of interest on our senior notes and interest on our intercompany loans that are payable to FNF. Following the Acquisition, our annual interest expense is significantly higher, as a result of the increase in total long-term debt outstanding and higher interest rates on the intercompany loans when compared to our former term loans. |
| • | Other expense for 2014 consists of costs associated with the Merion Capital legal matter that resulted from the Acquisition, including interest and estimated costs to defend ourselves in this matter. On September 18, 2014, we reached an agreement with Merion Capital to resolve an interest motion and FNF paid Merion Capital the merger consideration (cash and stock). As of September 30, 2014 BKFS has incurred expenses of $11.0 million in connection with this matter, including a payment of $9.0 million for interest accrued through the settlement date and a $2.0 million accrual for legal defense expenses. |
| • | Provision for income tax expense (benefit) represents federal, state and local taxes based on income in multiple jurisdictions for our corporate subsidiaries. In connection with the Acquisition and Internal Reorganization, we elected to change our taxable status to a partnership under federal and state income tax laws. |
Key Metrics
We evaluate the performance of our business using a variety of operating and performance metrics. The following is a description of our key performance metrics.
Adjusted Revenues
We define Adjusted Revenues as reported Revenues adjusted to include the revenues that were not recorded by the company during the period presented due to the deferred revenue purchase accounting adjustment recorded in accordance with GAAP.
We believe Adjusted Revenues is useful to investors and management as a supplemental measure to evaluate the performance of the company on a consistent basis. For a reconciliation of Adjusted Revenues to Revenues, the most directly comparable GAAP measure, see “Prospectus Summary—Summary Historical Financial Data.”
Adjusted EBITDA and Adjusted EBITDA Margin
We define Adjusted EBITDA as Operating income (loss) before depreciation and amortization, with further adjustments to reflect the addition or elimination of certain income statement items including, but not limited to (i) the deferred revenue purchase accounting adjustment recorded in accordance with GAAP; (ii) equity-based compensation; (iii) acquisition-related costs; (iv) non-recurring costs associated with the achievement of synergies; (v) charges associated with material legal matters; (vi) member management fees paid to FNF and THL Managers LLC; (vii) exit costs, impairments and other charges; and (viii) other significant, non-recurring items. Adjusted EBITDA margin is calculated by dividing Adjusted EBITDA by Revenue for periods prior to the Acquisition or Adjusted revenue for periods after the Acquisition.
87
Table of Contents
We believe Adjusted EBITDA is useful to investors as a supplemental measure to evaluate the overall operating performance of companies in our industry. Management uses Adjusted EBITDA as a measurement used to compare our operating performance to our peers and competitors. For a reconciliation of Adjusted EBITDA to Operating income (loss), the most directly comparable GAAP measure, see “Prospectus Summary—Summary Historical Financial Data.”
Results of Operations
The following table sets forth our consolidated statements of operations for the periods presented:
Interim Periods
| Successor | Predecessor | |||||||||||
| Period January 2, 2014 through September 30, 2014 |
One Day Ended January 1 2014 |
Nine Months Ended September 30, 2013 |
||||||||||
| (In millions) | ||||||||||||
| Revenues: |
||||||||||||
| Technology and Data and Analytics |
$ | 631.8 | $ | — | $ | 560.5 | ||||||
| Transaction Services(1) |
— | — | 793.3 | |||||||||
|
|
|
|
|
|||||||||
| Total Revenues |
631.8 | — | 1,353.8 | |||||||||
| Operating expenses |
392.3 | — | 1,003.8 | |||||||||
| Depreciation and amortization |
143.1 | — | 77.8 | |||||||||
| Legal and regulatory charges |
— | — | 54.0 | |||||||||
| Exit costs, impairment and other charges |
— | — | 12.0 | |||||||||
| Transition and integration costs |
111.1 | 50.1 | — | |||||||||
|
|
|
|
|
|
|
|||||||
| Total expenses |
646.5 | 50.1 | 1,147.6 | |||||||||
|
|
|
|
|
|
|
|||||||
| Operating (loss) income |
(14.7 | ) | (50.1 | ) | 206.2 | |||||||
| Operating margin |
-2.3 | % | N/A | 15.2 | % | |||||||
| Interest expense, net |
(96.8 | ) | — | (37.9 | ) | |||||||
| Other (expense) income |
(11.1 | ) | — | 0.2 | ||||||||
|
|
|
|
|
|
|
|||||||
| (Loss) income from continuing operations before income taxes |
(122.6 | ) | (50.1 | ) | 168.5 | |||||||
| Provision for income tax (benefit) expense |
(5.5 | ) | (11.1 | ) | 59.0 | |||||||
|
|
|
|
|
|
|
|||||||
| Net (loss) earnings from continuing operations |
(117.1 | ) | (39.0 | ) | 109.5 | |||||||
| Loss from discontinued operations |
(0.7 | ) | — | (1.0 | ) | |||||||
|
|
|
|
|
|
|
|||||||
| Net (loss) earnings |
$ | (117.8 | ) | $ | (39.0 | ) | $ | 108.5 | ||||
|
|
|
|
|
|
|
|||||||
| (1) | As described in “Factors Affecting Comparability of Our Results of Operations” above, the former Transaction Services segment of LPS was transferred to ServiceLink in January 2014. As a result, there are no revenues or expenses of the former Transaction Services segment in the Successor 2014 Interim Period. |
Revenues
Revenues were $631.8 million for the Successor 2014 Interim Period as compared to $1,353.8 million for the Predecessor 2013 Interim Period. The decline resulted from the transfer of the former Transaction Services
88
Table of Contents
segment to ServiceLink in January 2014 and reflected the impact of purchase accounting on our deferred revenue, which was partially offset by revenues generated by the Property Insight and Commerce Velocity businesses that were contributed by FNF to BKFS during 2014 and included in our results of operations from January 2, 2014 and growth in our Technology segment.
The following table sets forth our revenues by segment for the periods presented:
| Successor | Predecessor | |||||||||||
| Period January 2, 2014 through September 30, 2014 |
One Day Ended January 1, 2014 |
Nine Months Ended September 30, 2013 |
||||||||||
| (In millions) | ||||||||||||
| Technology |
$ | 518.5 | $ | — | $ | 499.0 | ||||||
| Data and Analytics |
113.2 | — | 61.4 | |||||||||
| Corporate and Other |
0.1 | — | 0.1 | |||||||||
|
|
|
|
|
|
|
|||||||
| BKFS Subtotal |
631.8 | — | 560.5 | |||||||||
| Transaction Services |
— | — | 793.3 | |||||||||
|
|
|
|
|
|
|
|||||||
| Total |
$ | 631.8 | $ | — | $ | 1,353.8 | ||||||
|
|
|
|
|
|
|
|||||||
Technology segment revenues were $518.5 million for the Successor 2014 Interim Period as compared to $499.0 million for the Predecessor 2013 Interim Period, an increase of $19.5 million, or 4%. This increase was driven by growth in our servicing technology business from loan growth on our mortgage servicing platform and annual price increases; higher professional services, new clients and a contract termination fee in our loan origination technology business; and the Commerce Velocity Contribution. The aforementioned increases were partially offset by the effect of purchase accounting on our deferred revenue that reduced our revenues in the Successor 2014 Interim Period by approximately $10.4 million.
Data and Analytics segment revenues were $113.2 million for the Successor 2014 Interim Period as compared to $61.4 million for the Predecessor 2013 Interim Period, an increase of $51.8 million, or 84%. This increase was driven by the Property Insight Contribution, which accounted for an increase of $49.7 million, and the effect of reclassifying sales to LPS’s former Transaction Services segment as revenue in 2014. Prior to the Acquisition, sales to LPS’s former Transaction Services segment were treated as cost transfers with no effect on revenue.
Operating Expenses
Operating expenses were $392.3 million for the Successor 2014 Interim Period as compared to $1,003.8 million for the Predecessor 2013 Interim Period. The decline resulted from the transfer of the former Transaction Services segment of LPS to ServiceLink in January 2014 and cost reduction actions taken following the Acquisition, which were partially offset by expenses from the Property Insight business that was contributed by FNF to BKFS during 2014 and operating expenses associated with the revenue growth in our businesses. As a percent of revenue, operating expenses were 62% for the Successor 2014 Interim Period compared to 74% for the Predecessor 2013 Interim Period. The decrease in operating expenses as a percent of revenue was primarily due to the transfer of the former Transaction Services segment, which had higher operating expenses as a percentage of revenue than the BKFS businesses and the benefit of the cost reduction actions.
89
Table of Contents
The following table sets forth our operating expenses by segment for the periods presented:
| Successor | Predecessor | |||||||||||
| Period January 2, 2014 through September 30, 2014 |
One Day Ended January 1, 2014 |
Nine Months Ended September 30, 2013 |
||||||||||
| (In millions) | ||||||||||||
| Technology |
$ | 255.6 | $ | — | $ | 254.3 | ||||||
| Data and Analytics |
107.1 | — | 58.8 | |||||||||
| Corporate and Other |
29.6 | — | 34.9 | |||||||||
|
|
|
|
|
|
|
|||||||
| BKFS Subtotal |
392.3 | — | 348.0 | |||||||||
| Transaction Services |
— | — | 655.8 | |||||||||
|
|
|
|
|
|
|
|||||||
| Total |
$ | 392.3 | $ | — | $ | 1,003.8 | ||||||
|
|
|
|
|
|
|
|||||||
Technology segment operating expenses were $255.6 million for the Successor 2014 Interim Period as compared to $254.3 million for the Predecessor 2013 Interim Period, an increase of $1.3 million or 1%. As a percent of revenue, operating expenses for the Successor 2014 Interim Period were 49% compared to 51% for the Predecessor 2013 Interim Period. The decrease was the result of cost reduction actions taken following the Acquisition and revenue growth.
Data and Analytics segment operating expenses were $107.1 million for the Successor 2014 Interim Period as compared to $58.8 million for the Predecessor 2013 Interim Period, an increase of $48.3 million or 82%. This increase was driven by the contribution of Property Insight by FNF to BKFS in 2014, the effect of the reclassification as revenue of our sales to LPS’s former Transaction Services segment, and maintenance costs associated with our property records database.
Corporate and Other operating expenses were $29.6 million for the Successor 2014 Interim Period as compared to $34.9 million for the Predecessor 2013 Interim Period, a decrease of $5.3 million or 15%. This decrease was driven by cost reduction actions taken following the LPS Acquisition.
Depreciation and Amortization
Depreciation and amortization was $143.1 million for the Successor 2014 Interim Period as compared to $77.8 million for the Predecessor 2013 Interim Period. The increase was primarily driven by the amortization of intangible assets recorded in connection with the Acquisition, partially offset by the effect of the transfer of the former Transaction Services segment to ServiceLink in January 2014.
The following table sets forth our depreciation and amortization by segment for the Interim Periods:
| Successor | Predecessor | |||||||||||
| Period January 2, 2014 through September 30, 2014 |
One Day Ended January 1, 2014 |
Nine Months Ended September 30, 2013 |
||||||||||
| (In millions) | ||||||||||||
| Technology |
$ | 130.6 | — | $ | 56.3 | |||||||
| Data and Analytics |
10.4 | — | 3.5 | |||||||||
| Corporate and Other |
2.1 | — | 2.4 | |||||||||
|
|
|
|
|
|
|
|||||||
| BKFS Subtotal |
143.1 | — | 62.2 | |||||||||
| Transaction Services |
— | — | 15.6 | |||||||||
|
|
|
|
|
|
|
|||||||
| Total |
$ | 143.1 | $ | — | $ | 77.8 | ||||||
|
|
|
|
|
|
|
|||||||
90
Table of Contents
Technology segment depreciation and amortization was $130.6 million for the Successor 2014 Interim Period as compared to $56.3 million for the Predecessor 2013 Interim Period, an increase of $74.3 million. This increase was driven by the amortization of intangible assets and the impact of fair value adjustments recorded in connection with the Acquisition as a result of purchase accounting and investments in key technology platforms and IT infrastructure.
Data and Analytics segment depreciation and amortization was $10.4 million for the Successor 2014 Interim Period as compared to $3.5 million for the Predecessor 2013 Interim Period. The increase was driven by the amortization of intangible assets and the impact of fair value adjustments recorded in connection with the Acquisition as a result of purchase accounting and the contribution of the Property Insight business by FNF to BKFS in 2014.
Corporate and Other depreciation and amortization was $2.1 million for the Successor 2014 Interim Period as compared to $2.4 million for the Predecessor 2013 Interim Period.
Legal and Regulatory Charges
During the Predecessor 2013 Interim Period, we increased our legal and regulatory accrual by $54.0 million to reflect management’s assessment of legal matters, of which $53.2 million related to the Transaction Services segment of LPS that has been distributed to ServiceLink in connection with the Internal Reorganization. In 2014, adjustments to the legal and regulatory accrual for matters that existed on January 2, 2014 were recorded as a result of purchase accounting, with the exception of the Merion Capital legal matter. The accrual for costs associated with the Merion Capital legal matter, including interest and estimated costs to defend ourselves, were recorded in other expense.
Exit Costs, Impairments and Other Charges
Exit costs, impairments and other charges were $12.0 million for the Predecessor 2013 Interim Period and related to employment matters and severance costs resulting from various cost reduction initiatives and transaction costs associated with the Acquisition. Costs of this nature during the Successor 2014 Interim Period were directly the result of the Acquisition and are included in transition and integration costs.
The following table sets forth our exit costs, impairments and other charges by segment for the periods indicated:
| Successor | Predecessor | |||||||||||
| Period January 2, 2014 through September 30, 2014 |
One Day Ended January 1, 2014 |
Nine Months Ended September 30, 2013 |
||||||||||
| (In millions) | ||||||||||||
| Technology |
$ | — | $ | — | $ | 0.4 | ||||||
| Data and Analytics |
— | — | 0.1 | |||||||||
| Corporate and Other |
— | — | 3.6 | |||||||||
|
|
|
|
|
|
|
|||||||
| BKFS Subtotal |
— | — | 4.1 | |||||||||
| Transaction Services |
— | — | 7.9 | |||||||||
|
|
|
|
|
|
|
|||||||
| Total |
$ | — | $ | — | $ | 12.0 | ||||||
|
|
|
|
|
|
|
|||||||
Transition and Integration Costs
Transition and integration costs represent non-recurring expenses incurred as a result of the Acquisition. The transition and integration costs for the Predecessor 2014 Interim Day represent transaction costs paid on behalf of FNF and THL on January 2, 2014. The transition and integration costs for the Successor 2014 Interim Period
91
Table of Contents
primarily represent legal and professional fees related to the Acquisition, severance, transaction-related bonuses and management fees paid to FNF and THL Managers LLC and other costs directly resulting from the Acquisition.
Operating (Loss) Income
Operating (loss) income was ($14.7) million for the Successor 2014 Interim Period as compared to $206.2 million for the Predecessor 2013 Interim Period.
The following table sets forth our operating (loss) income by segment for the Interim Periods:
| Successor | Predecessor | |||||||||||
| Period January 2, 2014 through September 30, 2014 |
One Day Ended January 1, 2014 |
Nine Months Ended September 30, 2013 |
||||||||||
| (In millions) | ||||||||||||
| Technology |
$ | 128.9 | $ | — | $ | 188.0 | ||||||
| Data and Analytics |
(4.8 | ) | — | (1.0 | ) | |||||||
| Corporate and Other |
(138.8 | ) | (50.1 | ) | (41.6 | ) | ||||||
|
|
|
|
|
|
|
|||||||
| BKFS Subtotal |
(14.7 | ) | (50.1 | ) | 145.4 | |||||||
| Transaction Services |
— | — | 60.8 | |||||||||
|
|
|
|
|
|
|
|||||||
| Total |
$ | (14.7 | ) | $ | (50.1 | ) | 206.2 | |||||
|
|
|
|
|
|
|
|||||||
Technology segment operating income was $128.9 million for the Successor 2014 Interim Period as compared to $188.0 million for the Predecessor 2013 Interim Period, a decrease of $59.1 million, or 31%. Operating margin was 25% for the Successor 2014 Interim Period compared to 38% for the Predecessor 2013 Interim Period.
Data and Analytics segment operating loss was $4.8 million for the Successor 2014 Interim Period as compared to $1.0 million for the Predecessor 2013 Interim Period.
Corporate and Other operating loss was $138.8 million for the Successor 2014 Interim Period as compared to $41.6 million for the Predecessor 2013 Interim Period. The increase in operating loss was driven by $107.3 million of transition and integration costs in the Successor 2014 Interim Period.
Interest Expense, Net
Interest expense, net was $96.8 million for the Successor 2014 Interim Period compared to $37.9 million for the Predecessor 2013 Interim Period. The increase was a result of the increase in total debt outstanding and a higher weighted average interest rate in the Successor 2014 Interim Period than in the Predecessor 2013 Interim Period.
Other (Expense) Income
Other (expense) income was ($11.1) million for the Successor 2014 Interim Period compared to $0.2 million for the Predecessor 2013 Interim Period. The increase is a result of the interest and estimated defense costs in 2014 associated with the Merion Capital litigation.
Provision of Income Tax (Benefit) Expense
The provision for income tax (benefit) expense for the Successor 2014 Interim Period was a benefit of ($5.5) million compared to a provision of $59.0 million for the Predecessor 2013 Interim Period. The variance is principally due to the conversion of LPS into a Delaware limited liability company on January 3, 2014 in
92
Table of Contents
connection with the Acquisition and the election to be treated as a partnership under applicable federal and state income tax laws. The tax benefit recognized in 2014 is primarily due to the tax impact of certain fees and expenses recognized immediately following the acquisition by FNF prior to BKFS’ conversion to a limited liability company.
Predecessor Annual Periods
| Predecessor(1) | ||||||||||||
| Years Ended December 31, | ||||||||||||
| 2013 | 2012 | 2011 | ||||||||||
| (In millions, except per share amounts) | ||||||||||||
| Revenues: |
||||||||||||
| Technology and Data and Analytics |
$ | 744.8 | $ | 718.9 | $ | 670.4 | ||||||
| Transaction Services(2) |
971.4 | 1,272.4 | 1,309.6 | |||||||||
|
|
|
|
|
|
|
|||||||
| Total Revenues |
1,716.2 | 1,991.3 | 1,980.0 | |||||||||
| Operating expenses |
1,280.5 | 1,459.6 | 1,477.7 | |||||||||
| Depreciation and amortization |
104.0 | 95.7 | 88.2 | |||||||||
| Legal and regulatory charges |
74.4 | 192.4 | 78.5 | |||||||||
| Exit costs, impairment and other charges |
49.4 | 10.5 | 56.9 | |||||||||
|
|
|
|
|
|
|
|||||||
| Total expenses |
1,508.3 | 1,758.2 | 1,701.3 | |||||||||
|
|
|
|
|
|
|
|||||||
| Operating income |
207.9 | 233.1 | 278.7 | |||||||||
| Operating margin |
12.1 | % | 11.7 | % | 14.1 | % | ||||||
| Interest expense, net |
(50.2 | ) | (86.1 | ) | (66.1 | ) | ||||||
| Other income (expense) |
0.1 | 0.2 | (0.2 | ) | ||||||||
|
|
|
|
|
|
|
|||||||
| Earnings from continuing operations before income taxes |
157.8 | 147.2 | 212.4 | |||||||||
| Provision for income taxes |
53.6 | 67.6 | 77.2 | |||||||||
|
|
|
|
|
|
|
|||||||
| Net earnings from continuing operations |
104.2 | 79.6 | 135.2 | |||||||||
| Loss from discontinued operations |
(1.5 | ) | (9.2 | ) | (38.7 | ) | ||||||
|
|
|
|
|
|
|
|||||||
| Net earnings |
$ | 102.7 | $ | 70.4 | $ | 96.5 | ||||||
|
|
|
|
|
|
|
|||||||
| Net earnings per share—diluted |
$ | 1.19 | $ | 0.83 | $ | 1.13 | ||||||
|
|
|
|
|
|
|
|||||||
| (1) | The results of operations for the Predecessor Annual Periods have been restated to reflect PCLender.com Inc., a former wholly-owned, consolidated subsidiary, or PCLender, as a discontinued operation. PCLender was sold during the Successor 2014 Interim Period. |
| (2) | As described above, the former Transaction Services segment was transferred to ServiceLink in January 2014. As a result, there are no revenues or expenses of the former Transaction Services segment subsequent to the Predecessor 2013 Annual Period. |
Predecessor 2013 Annual Period Compared to Predecessor 2012 Annual Period
Revenues
Revenues decreased $275.1 million, or 14%, during the Predecessor 2013 Annual Period when compared to the Predecessor 2012 Annual Period due to a $301.0 million, or 24%, decrease in Transaction Services partially offset by a $25.9 million, or 4% increase in Technology, Data and Analytics.
93
Table of Contents
The following table sets forth our revenues by segment for the Predecessor 2013 Annual Period and Predecessor 2012 Annual Period (in millions):
| Predecessor | ||||||||
| Year Ended December 31, | ||||||||
| 2013 | 2012 | |||||||
| (In millions) | ||||||||
| Technology |
$ | 663.6 | $ | 640.3 | ||||
| Data and Analytics |
80.8 | 79.1 | ||||||
| Corporate and Other |
0.4 | (0.5 | ) | |||||
|
|
|
|
|
|||||
| BKFS Subtotal |
744.8 | 718.9 | ||||||
| Transaction Services |
971.4 | 1,272.4 | ||||||
|
|
|
|
|
|||||
| Total |
$ | 1,716.2 | $ | 1,991.3 | ||||
|
|
|
|
|
|||||
Technology segment revenues were $663.6 million during the Predecessor 2013 Annual Period as compared to $640.3 million during the Predecessor 2012 Annual Period, an increase of $23.3 million, or 4%. The increase was driven by growth in servicing technology primarily due to higher loan counts, new client implementations, continued strong data access and professional services revenue and from incremental revenue from LendingSpace, our loan origination software company that was acquired in July 2012.
Data and Analytics segment revenues were $80.8 million during the Predecessor 2013 Annual Period as compared to $79.1 million during the Predecessor 2012 Annual Period, an increase of $1.7 million, or 2%. The increase was driven by new contract wins that were partially offset by lower MLS revenues.
Revenues of LPS’s former Transaction Services segment declined by $301.0 million, or 24%, due to continued delays in foreclosure volumes from new federal and state regulations and requirements, such as the California Homeowner Bill of Rights, and from a decrease in foreclosure volumes resulting from (i) continued improvements in macro-economic conditions, including the rate of unemployment and interest rates, (ii) the impact of various governmental programs that allowed borrowers who may not otherwise have been able to qualify to refinance their loans, (iii) the availability of alternatives to foreclosure such as short-sales and deeds-in-lieu, and (iv) a more rigorous discipline around aligning risk and return within our default operations, which resulted in the non-renewal of certain contracts. In addition, the former Transaction Services segment experienced a decrease in origination services primarily from declining revenues from its appraisal business due to the impact of an increase in Home Affordable Refinance Program loans, which do not require an appraisal, and exiting certain low-margin contracts.
Operating Expenses
Operating expenses decreased $179.1 million, or 12%, during the Predecessor 2013 Annual Period when compared to the Predecessor 2012 Annual Period. Operating expenses as a percentage of revenues increased to 75% during the Predecessor 2013 Annual Period as compared to 73% during the Predecessor 2012 Annual Period. The increase as a percent of revenue is primarily attributable to the effect of the revenue decline in the former Transaction Services segment.
94
Table of Contents
The following table sets forth our operating expenses by segment for the Predecessor 2013 Annual Period and Predecessor 2012 Annual Period:
| Predecessor | ||||||||
| Year Ended December 31, | ||||||||
| 2013 | 2012 | |||||||
| (In millions) | ||||||||
| Technology |
$ | 340.5 | $ | 329.6 | ||||
| Data and Analytics |
80.4 | 69.4 | ||||||
| Corporate and Other |
45.5 | 47.8 | ||||||
|
|
|
|
|
|||||
| BKFS Subtotal |
466.4 | 446.8 | ||||||
| Transaction Services |
814.1 | 1,012.8 | ||||||
|
|
|
|
|
|||||
| Total |
$ | 1,280.5 | $ | 1,459.6 | ||||
|
|
|
|
|
|||||
Technology segment operating expenses were $340.5 million during the Predecessor 2013 Annual Period as compared to $329.6 million during the Predecessor 2012 Annual Period, an increase of $10.9 million, or 3%. As a percent of revenue, operating expenses were 51% in both the Predecessor 2013 Annual Period and the Predecessor 2012 Annual Period. The higher marginal contributions from the revenue growth described above were offset by continued investments in our loan origination technology.
Data and Analytics segment operating expenses were $80.4 million during the Predecessor 2013 Annual Period, an increase of $11.0 million, or 16% compared to the Predecessor 2012 Annual Period. The increase in operating expenses was primarily due to maintenance expenses for our property records database.
Transaction Services segment operating expenses were $814.1 million during the Predecessor 2013 Annual Period as compared to $1,012.8 million during the Predecessor 2013 Annual Period. As a percent of revenue, operating expenses were 84% the Predecessor 2013 Annual Period compared to 80% in the Predecessor 2012 Annual Period. The increase as a percent of revenue is primarily attributable to reduced operating leverage in default services resulting from the continued slowdown in foreclosure volumes and an elongation of foreclosure timelines that extends servicing obligations.
Depreciation and Amortization
Depreciation and amortization increased $8.3 million, or 9%, during the Predecessor 2013 Annual Period when compared to the Predecessor 2012 Annual Period. The increase is primarily due to increased investments in infrastructure and key technology platforms during the Predecessor 2012 Annual Period.
The following table sets forth our depreciation and amortization by segment for the Predecessor 2013 Annual Period and Predecessor 2012 Annual Period:
| Predecessor | ||||||||
| Year Ended December 31, | ||||||||
| 2013 | 2012 | |||||||
| (In millions) | ||||||||
| Technology |
$ | 75.8 | $ | 67.1 | ||||
| Data and Analytics |
4.6 | 5.4 | ||||||
| Corporate and Other |
3.2 | 3.3 | ||||||
|
|
|
|
|
|||||
| BKFS Subtotal |
83.6 | 75.8 | ||||||
| Transaction Services |
20.4 | 19.9 | ||||||
|
|
|
|
|
|||||
| Total |
$ | 104.0 | $ | 95.7 | ||||
|
|
|
|
|
|||||
95
Table of Contents
Legal and Regulatory Charges
During the Predecessor 2013 Annual Period and the Predecessor 2012 Annual Period, we increased our legal and regulatory accrual by $74.4 million and $192.4 million, respectively, to reflect management’s assessment of legal matters primarily related to the businesses that have been distributed to ServiceLink, but for which LPS as the former public company was named as a party to these legal matters, in connection with the Internal Reorganization Transactions.
Exit Costs, Impairments and Other Charges
During the Predecessor 2013 Annual Period, we recorded charges totaling $49.4 million related to the impairment of computer software projects that were no longer recoverable, employment matters and severance costs resulting from various cost reduction initiatives and transaction costs associated with the pending acquisition by FNF. During the Predecessor 2012 Period, we recorded charges totaling $10.5 million related to employment matters and severance costs and the impairment of computer software projects that were no longer recoverable.
The following table sets forth our exit costs, impairments and other charges by segment for the Predecessor 2013 Annual Period and Predecessor 2012 Annual Period:
| Predecessor | ||||||||
| Year Ended December 31, | ||||||||
| 2013 | 2012 | |||||||
| (In millions) | ||||||||
| Technology |
$ | 0.4 | $ | 1.5 | ||||
| Data and Analytics |
0.3 | 1.3 | ||||||
| Corporate and Other |
7.4 | 3.1 | ||||||
|
|
|
|
|
|||||
| BKFS Subtotal |
8.1 | 5.9 | ||||||
| Transaction Services |
41.3 | 4.6 | ||||||
|
|
|
|
|
|||||
| Total |
$ | 49.4 | $ | 10.5 | ||||
|
|
|
|
|
|||||
Corporate/Other exit costs, impairments and other charges were $7.4 million during the Predecessor 2013 Annual Period compared to $3.1 million during the Predecessor 2012 Annual Period. The 2013 amount primarily reflects transaction fees related to the pending acquisition by FNF, and costs associated with employment matters. The 2012 amount is comprised of severance charges.
Transaction Services exit costs, impairments and other charges were $41.3 million in the Predecessor 2013 Annual Period compared to $4.6 million in the Predecessor 2012 Annual Period. The 2013 amount includes $28.6 million of impairment charges related to computer software projects that were no longer recoverable; an allocation of transaction fees related to the pending acquisition by FNF and costs associated with employment matters. The 2012 amount primarily relates to severance benefits resulting from various employment matters.
Operating Income
Operating income decreased $25.2 million during the Predecessor 2013 Annual Period when compared to the Predecessor 2012 Annual Period. Operating margin was 12% during the Predecessor 2013 Annual Period and the Predecessor 2012 Annual Period.
96
Table of Contents
The following table sets forth our operating income by segment for the Predecessor 2013 Annual Period and Predecessor 2012 Annual Period:
| Predecessor | ||||||||
| Year Ended December 31, | ||||||||
| 2013 | 2012 | |||||||
| (In millions) | ||||||||
| Technology |
$ | 246.9 | $ | 242.1 | ||||
| Data and Analytics |
(4.5 | ) | 3.0 | |||||
| Corporate and Other |
(58.2 | ) | (69.0 | ) | ||||
|
|
|
|
|
|||||
| BKFS Subtotal |
184.2 | 176.1 | ||||||
| Transaction Services |
23.7 | 57.0 | ||||||
|
|
|
|
|
|||||
| Total |
$ | 207.9 | $ | 233.1 | ||||
|
|
|
|
|
|||||
Interest Expense, Net
Interest expense, net decreased $35.9 million during the Predecessor 2013 Annual Period when compared to the Predecessor 2012 Annual Period, primarily due to the impact of lower interest rates and reduced principal balances on our long-term debt. During the fourth quarter of 2012, we refinanced our senior notes to take advantage of the favorable interest rate environment by retiring our Term Loan B and 2016 senior notes with the proceeds from an offering of our 2023 senior notes that have an interest rate of 5.75%. In connection with the retirement of the 2016 senior notes, we incurred a call premium of $15.8 million that was reflected in interest expense in the Predecessor 2012 Annual Period.
Provision for Income Taxes
Income taxes on continuing operations were $53.6 million and $67.6 million during the Predecessor 2013 Annual Period and the Predecessor 2012 Annual Period, respectively, which resulted in an effective tax rate of 34.0% and 45.9%, respectively. The decrease in the effective rate during the Predecessor 2013 Annual Period is due to an increase in federal and state deductions and credits related to the development and licensing of our technology platforms partially offset by the prior year impact of the assumed non-deductibility of certain components of the legal and regulatory charges recognized.
Loss from Discontinued Operations, net
During the Successor 2014 Interim Period and the Predecessor 2012 Annual Period, we sold or disposed of certain non-core or underperforming business units. Loss from discontinued operations, net of tax, was $1.5 million and $9.2 million during the Predecessor 2013 Annual Period and the Predecessor 2012 Annual Period, respectively.
Net Earnings and Net Earnings Per Share—Diluted
Net earnings increased $32.3 million during the Predecessor 2013 Annual Period when compared to the Predecessor 2012 Annual Period. Net earnings per diluted share increased to $1.19 during the Predecessor 2013 Annual Period as compared to $0.83 during the Predecessor 2012 Annual Period. The increases in net earnings and net earnings per diluted share were a result of the factors described above.
97
Table of Contents
Predecessor 2012 Annual Period Compared With Predecessor 2011 Annual Period
Revenues
Revenues increased $11.3 million, or 1% during the Predecessor 2012 Annual Period when compared to the Predecessor 2011 Annual Period. This increase was primarily due to $46.1 million, or 8%, increase in our Technology segment, partially offset by a $37.2 million, or 3% decrease in revenues in LPS’s former Transaction Services segment.
The following table sets forth our revenues by segment for the Predecessor 2012 Annual Period and Predecessor 2011 Annual Period:
| Predecessor | ||||||||
| Year Ended December 31, | ||||||||
| 2012 | 2011 | |||||||
| (In millions) | ||||||||
| Technology |
$ | 640.3 | $ | 594.2 | ||||
| Data and Analytics |
79.1 | 76.1 | ||||||
| Corporate and Other |
(0.5 | ) | 0.1 | |||||
|
|
|
|
|
|||||
| BKFS Subtotal |
718.9 | 670.4 | ||||||
| Transaction Services |
1,272.4 | 1,309.6 | ||||||
|
|
|
|
|
|||||
| Total |
$ | 1,991.3 | $ | 1,980.0 | ||||
|
|
|
|
|
|||||
Technology segment revenues were $640.3 million during the Predecessor 2012 Annual Period, an increase of $46.1 million, or 8% compared to the Predecessor 2011 Annual Period. The increase is primarily due to growth in servicing technology due to loan growth from new and existing clients on our mortgage servicing platform as well as higher transactional fees, growth in origination technology due to higher refinancing activity which drives incremental transactional fees, and from growth in workflow technology from the annualization of new client implementations in the Predecessor 2011 Annual Period.
Data and Analytics segment revenues were $79.1 million during the Predecessor 2012 Annual Period, an increase of 4% compared to the Predecessor 2011 Annual Period. The increase was driven by new clients in our multiple listing service business and higher volumes in our tax data business.
Revenues of LPS’s former Transaction Services segment declined by $37.2 million, or 3%, largely driven by a decline in default services as a result of continued delays in the foreclosure process causing reduced volumes, and from an increase in the sales allowance reserve of $5.2 million during the Predecessor 2012 Annual Period based on management’s ongoing assessment of the impact of these delays on the realizability of our recorded revenues. The decrease in default services was largely offset by an increase in origination services as a result of higher loan origination volumes due to the continued low interest rate environment, the impact of Home Affordable Refinance Program 2.0 and from market share gains.
Operating Expenses
Operating expenses decreased $18.1 million, or 1%, during the Predecessor 2012 Annual Period when compared to the Predecessor 2011 Annual Period. Operating expenses as a percentage of revenues were 73% during the Predecessor 2012 Annual Period and 75% during the Predecessor 2011 Annual Period. The factors contributing to this decrease include favorable revenue mix and related operating leverage in our higher margin origination services resulting from increased loan origination volumes, partially offset by near-term investments in our loan origination technology in order to extend our services from a software licensing model to a SaaS model.
98
Table of Contents
The following table sets forth our operating expenses by segment for the Predecessor 2012 Annual Period and Predecessor 2011 Annual Period:
| Predecessor | ||||||||
| Year Ended December 31, | ||||||||
| 2012 | 2011 | |||||||
| (In millions) | ||||||||
| Technology |
$ | 329.6 | $ | 287.0 | ||||
| Data and Analytics |
69.4 | 65.7 | ||||||
| Corporate and Other |
47.8 | 48.5 | ||||||
|
|
|
|
|
|||||
| BKFS Subtotal |
446.8 | 401.2 | ||||||
| Transaction Services |
1,012.8 | 1,076.5 | ||||||
|
|
|
|
|
|||||
| Total |
$ | 1,459.6 | $ | 1,477.7 | ||||
|
|
|
|
|
|||||
Technology segment operating expenses were $329.6 million during the Predecessor 2012 Annual Period compared to $287.0 million during the Predecessor 2011 Annual Period. As a percent of revenue, operating expenses were 51% in the Predecessor 2012 Annual Period compared to 48% in the Predecessor 2011 Annual Period. The increase as a percent of revenue was driven by near-term investments in our loan origination technology to extend our services from a software licensing model to a SaaS model.
Data and Analytics segment operating expenses were $69.4 million during the Predecessor 2012 Annual Period compared to $65.7 million during the Predecessor 2011 Annual Period. As a percent of revenue, operating expenses were 88% in the Predecessor 2012 Annual Period compared to 86% in the Predecessor 2011 Annual Period. The increase as a percent of revenue was due to investments in management and sales infrastructure.
Corporate and Other segment operating expenses were $47.8 million during the Predecessor 2012 Annual Period compared to $48.5 million during the Predecessor 2011 Annual Period.
Transaction Services segment operating expenses were $1,012.8 million during the Predecessor 2012 Annual Period compared to $1,076.5 million during the Predecessor 2011 Annual Period. As a percent of revenue, operating expenses were 80% in the Predecessor 2012 Annual Period compared to 82% in the Predecessor 2011 Annual Period. This decrease is primarily attributable to a favorable revenue mix and related operating leverage in our higher margin origination operations resulting from increased loan origination volumes.
Depreciation and Amortization
Depreciation and amortization increased $7.5 million, or 9%, during the Predecessor 2012 Annual Period when compared to the Predecessor 2011 Annual Period.
99
Table of Contents
The following table sets forth our depreciation and amortization by segment for the Predecessor 2012 Annual Period and Predecessor 2011 Annual Period:
| Predecessor | ||||||||
| Year Ended December 31, |
||||||||
| 2012 | 2011 | |||||||
| (In millions) | ||||||||
| Technology |
$ | 67.1 | $ | 60.8 | ||||
| Data and Analytics |
5.4 | 4.2 | ||||||
| Corporate and Other |
3.3 | 3.4 | ||||||
|
|
|
|
|
|||||
| BKFS Subtotal |
75.8 | 68.4 | ||||||
| Transaction Services |
19.9 | 19.8 | ||||||
|
|
|
|
|
|||||
| Total |
$ | 95.7 | $ | 88.2 | ||||
|
|
|
|
|
|||||
Technology segment depreciation and amortization was $67.1 million during the Predecessor 2012 Annual Period compared to $60.8 million during the Predecessor 2011 Annual Period. This increase was driven by investments in key technology platforms and IT infrastructure.
Legal and Regulatory Charges
We recorded a $192.4 million increase to our legal and regulatory accrual during the Predecessor 2012 Annual Period, which was previously established in the fourth quarter of 2011. These legal and regulatory charges were primarily related to the businesses that have been distributed to ServiceLink in connection with the Internal Reorganization Transactions.
Exit Costs, Impairments and Other Charges
We recorded charges totaling $10.5 million and $56.9 million during the Predecessor 2012 Annual Period and the Predecessor 2011 Annual Period, respectively, primarily related to severance charges resulting from various cost reduction initiatives and impairment charges related to the write-down of computer software projects.
The following table sets forth our exit costs, impairments and other charges by segment for the Predecessor 2012 Annual Period and Predecessor 2011 Annual Period:
| Predecessor | ||||||||
| Year Ended December 31, | ||||||||
| 2012 | 2011 | |||||||
| (In millions) | ||||||||
| Technology |
$ | 1.5 | $ | 10.5 | ||||
| Data and Analytics |
1.3 | 2.2 | ||||||
| Corporate and Other |
3.1 | 25.0 | ||||||
|
|
|
|
|
|||||
| BKFS Subtotal |
5.9 | 37.7 | ||||||
| Transaction Services |
4.6 | 19.2 | ||||||
|
|
|
|
|
|||||
| Total |
$ | 10.5 | $ | 56.9 | ||||
|
|
|
|
|
|||||
Technology segment exit costs, impairments and other charges were $1.5 million during the Predecessor 2012 Annual Period and $10.5 million during the Predecessor 2011 Annual Period. The charges related to severance resulting from our various cost reduction initiatives and impairment charges related to the write-down of computer software projects.
100
Table of Contents
Corporate and Other exit costs, impairments and other charges were $3.1 million during the Predecessor 2012 Annual Period compared to $25.0 million during the Predecessor 2011 Annual Period. The charges related to severance, restructuring and other charges resulting from cost reduction initiatives.
Transaction Services segment exit costs, impairments and other charges were $4.6 million during the Predecessor 2012 Annual Period compared to $19.2 million during the Predecessor 2011 Annual Period. The charges related to severance, restructuring and other charges resulting from cost reduction initiatives.
Operating Income
Operating income decreased $45.6 million, or 16% during the Predecessor 2012 Annual Period when compared to the Predecessor 2011 Annual Period. Operating margin decreased to 12% during the Predecessor 2012 Annual Period from 14% during the Predecessor 2011 Annual Period as a result of the factors described above.
The following table sets forth our operating income by segment for the Predecessor 2012 Annual Period and Predecessor 2011 Annual Period:
| Predecessor | ||||||||
| Year Ended December 31, |
||||||||
| 2012 | 2011 | |||||||
| (In millions) | ||||||||
| Technology |
$ | 242.1 | $ | 235.9 | ||||
| Data and Analytics |
3.0 | 4.0 | ||||||
| Corporate and Other |
(69.0 | ) | (87.3 | ) | ||||
|
|
|
|
|
|||||
| BKFS Subtotal |
176.1 | 152.6 | ||||||
| Transaction Services |
57.0 | 126.1 | ||||||
|
|
|
|
|
|||||
| Total |
$ | 233.1 | $ | 278.7 | ||||
|
|
|
|
|
|||||
Interest Expense, Net
Interest expense, net increased $20.0 million during the Predecessor 2012 Annual Period when compared to the Predecessor 2011 Annual Period. The increase was primarily related to a $15.8 million call premium paid to retire our old senior notes in connection with our 2012 debt refinancing.
Provision for Income Taxes
The provision for income taxes decreased $9.6 million in the Predecessor 2012 Annual Period when compared to the Predecessor 2011 Annual Period. The effective tax rate increased to 45.9% in the Predecessor 2012 Annual Period from 36.3% during the Predecessor 2011 Annual Period, primarily due to assumptions regarding the deductibility of the legal and regulatory accrual and a non-cash tax charge related to stock option forfeitures during the Predecessor 2012 Annual Period.
Loss from Discontinued Operations, net
During the Predecessor 2012 Annual Period and the Predecessor 2011 Annual Period, management made the decision to sell or dispose of certain non-core or underperforming business units including Verification Bureau, SoftPro, Rising Tide Auction, True Automation, Aptitude Solutions, IRMS and certain operations previously included in our Real Estate group. Management also made the decision to shut down our Asset Management Solutions business and sell our Tax Services business (other than our tax data services that provide lenders with information about the tax status of a property). As of December 31, 2012, all of these businesses were sold or disposed of. Loss from discontinued operations, net of tax, decreased to $9.2 million in the Predecessor 2012
101
Table of Contents
Annual Period from $38.7 million in the Predecessor 2011 Annual Period due to the disposal of certain loss generating businesses and from a decrease in impairments related to the net assets of the discontinued operations during the Predecessor 2012 Annual Period, partially offset by realized gains on disposal, net of tax, totaling $2.0 million.
Net Earnings and Net Earnings Per Share—Diluted
Net earnings and net earnings per diluted share totaled $70.4 million and $0.83, respectively, during the Predecessor 2012 Annual Period and $96.5 million and $1.13, respectively, during the Predecessor 2011 Annual Period. The decreases in the Predecessor 2012 Annual Period were a result of the factors described above.
Liquidity and Capital Resources
Cash Requirements
Our primary sources of liquidity are, and after the completion of this offering are expected to continue to be, our existing cash balances and cash flows from operations.
Our primary cash requirements include operating expenses, debt service payments (principal and interest), capital expenditures and systems development expenditures and may include business acquisitions.
Our capital expenditures primarily consist of computer software (purchased and internally developed) and additions to property and equipment. Our capital expenditures for the Successor 2014 Interim Period and Predecessor 2013 Interim Period were $44.1 million and $86.1 million, respectively, and for the Predecessor 2013 Annual Period, Predecessor 2012 Annual Period and Predecessor 2011 Annual Period were $113.8 million, $113.3 million, and $104.9 million, respectively. As of September 30, 2014, we had cash on hand of $52.4 million and debt of $2,133.3 million (excluding the unamortized premium associated with our senior unsecured notes). We believe that our cash flow from operations and available cash and cash equivalents will be sufficient to meet our liquidity needs. We anticipate that to the extent that we require additional liquidity, it will be funded through the incurrence of other indebtedness, equity issuance or a combination. We cannot assure you that we will be able to obtain this additional liquidity on reasonable terms, or at all. Additionally, our liquidity and our ability to meet our obligations and fund our capital requirements are also dependent on our future financial performance, which is subject to general economic, financial and other factors that are beyond our control. Accordingly, we cannot assure you that our business will generate sufficient cash flow from operations or that future borrowings will be available from additional indebtedness or otherwise to meet our liquidity needs. Although we have no specific current plans to do so, if we decide to pursue one or more significant acquisitions, we may incur additional debt or sell additional equity to finance such acquisitions.
Cash Flows
The following tables provide a summary of cash flows from operating, investing and financing activities for the periods presented:
| Successor | Pred\ecessor | |||||||||||
| Period January 2, 2014 through September 30, 2014 |
One Day Ended January 1, 2014 |
Nine Months Ended September 30, 2013 |
||||||||||
| (In millions) | ||||||||||||
| Cash flows from operating activities |
$ | (20.9 | ) | $ | (51.2 | ) | $ | 107.6 | ||||
| Cash flows from investing activities |
(42.6 | ) | — | (112.7 | ) | |||||||
| Cash flows from financing activities |
(162.5 | ) | — | (27.9 | ) | |||||||
|
|
|
|
|
|
|
|||||||
| Net decrease in cash and cash equivalents |
$ | (226.0 | ) | $ | (51.2 | ) | $ | (33.0 | ) | |||
|
|
|
|
|
|
|
|||||||
102
Table of Contents
| Predecessor | ||||||||||||
| Year Ended December 31, | ||||||||||||
| 2013 | 2012 | 2011 | ||||||||||
| (In millions) | ||||||||||||
| Cash flows from operating activities |
$ | 201.0 | $ | 434.4 | $ | 477.9 | ||||||
| Cash flows from investing activities |
(140.8 | ) | (146.3 | ) | (155.7 | ) | ||||||
| Cash flows from financing activities |
33.2 | (129.2 | ) | (297.1 | ) | |||||||
|
|
|
|
|
|
|
|||||||
| Net increase in cash and cash equivalents |
$ | 93.4 | $ | 158.9 | $ | 25.1 | ||||||
|
|
|
|
|
|
|
|||||||
Operating Activities
Cash flows from operating activities reflect net earnings (loss) adjusted for certain non-cash items and changes in certain assets and liabilities.
Interim Periods
Cash used in operating activities was $20.9 million for the Successor 2014 Interim Period reflecting the effect of non-recurring costs incurred resulting from the Acquisition, the transfer of LPS’s former Transaction Services segment to ServiceLink in January 2014 and working capital timing. The net cash outflows for the Predecessor 2014 Interim Day reflects certain transaction costs paid related to the Acquisition.
Annual Periods
Cash provided by operating activities was $201.0 million, $434.4 million and $477.9 million during the Predecessor 2013 Annual Period, the Predecessor 2012 Annual Period and the Predecessor 2011 Annual Period, respectively. The decline in cash provided by operating activities during the Predecessor 2013 Annual Period compared to the Predecessor 2012 Annual Period was primarily due to $196.4 million of payments related to certain legal and regulatory matters, substantially all of which related to the Transaction Services segment of LPS, and a decline in profitability in Transaction Services, partially offset by lower tax and interest payments. The decline in cash provided by operating activities during the Predecessor 2012 Annual Period when compared to the Predecessor 2011 Annual Period was primarily related to an increase in cash paid for taxes, an increase in interest primarily related to a $15.8 million call premium on our then outstanding notes, as well as a decrease in working capital contributions mainly from lower accounts receivable collections from default services, which carries a higher “days sales outstanding” ratio due to the lag between revenue recognition and collection.
Investing Activities
Investing cash flows consist primarily of capital expenditures and acquisitions and dispositions. Our principal capital expenditures are for computer software (purchased and internally developed) and additions to property and equipment.
Interim Periods
Cash used in investing activities was $42.6 million for the Successor 2014 Interim Period compared to $112.7 million for the Predecessor 2013 Interim Period. The decrease is the result of lower capital expenditures, along with the absence of purchases of investments and acquisition costs for title plants and property records data in the Successor Period. Following the completion of our property records database in the Predecessor 2013 Annual Period, the maintenance costs associated with that database are expensed as incurred. Capital expenditures were $44.1 million during the Successor 2014 Interim Period compared to $86.1 million in the Predecessor 2013 Interim Period. The decrease is due to heightened investment discipline, project timing and the transfer of our former Transaction Services segment to ServiceLink.
There were no investing activities during the Predecessor 2014 Interim Day.
103
Table of Contents
Annual Periods
Cash used in investing activities was $140.8 million, $146.3 million and $155.7 million during the Predecessor 2013 Annual Period, the Predecessor 2012 Annual Period and the Predecessor 2011 Annual Period, respectively. Capital expenditures were approximately $113.8 million, $113.3 million and $104.9 million during the Predecessor 2013 Annual Period, the Predecessor 2012 Annual Period and the Predecessor 2011 Annual Period, respectively. Cash used in investing activities in the Predecessor 2013 Annual Period was less than 2012 as the absence of proceeds from the sale of businesses was offset by the absence of cash paid for acquisitions, a decrease in the acquisition of title plants and property data and lower net purchases of investments. The decrease in cash used in investing activities during the Predecessor 2012 Annual Period as compared to the Predecessor 2011 Annual Period was primarily due to the net impact of our disposition activities, as we disposed of Tax Services, SoftPro, True Automation, Aptitude Solutions and IRMS business units during the Predecessor 2012 Annual Period for net cash proceeds of $42.6 million. This cash inflow was partially offset by a $20.8 million increase in the acquisition of title plants and property records data and an $8.4 million increase in capital expenditures.
We acquired LendingSpace in the Predecessor 2012 Annual Period and PCLender in the Predecessor 2011 Annual Period. We spent (net of cash acquired) approximately $12.3 million and $9.8 million on these acquisitions during the Predecessor 2012 Annual Period and the Predecessor 2011 Annual Period, respectively.
Financing Activities
Financing cash flows consist primarily of our borrowings, related debt issuance costs and principal payments, proceeds from the sale of shares through our employee equity incentive plans, repurchase of treasury shares and payment of dividends to stockholders.
Interim Periods
Cash used in financing activities for the Successor 2014 Interim Period was approximately $162.5 million and related to cash flows associated with the Internal Reorganization Transactions in January 2014 as well as $62.7 million of debt principal payments that we made during the period.
Cash used in financing activities for the Predecessor 2013 Interim Period was $27.9 million and was primarily related to dividends paid to LPS common shareholders.
There were no financing activities during the Predecessor 2014 Interim Day.
Annual Periods
Cash provided by (used in) financing activities was $33.2 million, $(129.2) million and $(297.1) million during the Predecessor 2013 Annual Period, the Predecessor 2012 Annual Period and the Predecessor 2011 Annual Period, respectively. Cash provided by financing activities in the Predecessor 2013 Annual Period resulted from proceeds from the exercise of stock options partially offset by dividends paid to LPS common shareholders. The decrease in cash used in financing activities during the Predecessor 2012 Annual Period when compared to the Predecessor 2011 Annual Period was primarily due to treasury stock repurchases of $136.9 million made in the Predecessor 2011 Annual Period as well as a decrease in our net debt service payments of approximately $30.6 million, including debt issuance costs paid, during the Predecessor 2012 Annual Period as compared to the Predecessor 2011 Annual Period.
Financing
On January 2, 2014, BKHI issued (i) the Original Mirror Note in the original principal amount of $1,400.0 million and (ii) the Original Intercompany Note in the original principal amount of $1,175.0 million to FNF.
104
Table of Contents
BKFS Operating LLC entered into an assumption agreement, dated as of January 3, 2014, among BKFS Operating LLC, BKHI and FNF pursuant to which BKFS Operating LLC assumed $820.0 million of the debt issued under the Original Mirror Note and $688.0 million of the debt issued under the Original Intercompany Note, releasing BKHI of its obligations with respect to such amounts. Subsequently, on January 6, 2014, BKFS Operating LLC borrowed an additional sum of $63.0 million pursuant to the Second Intercompany Note and on March 31, 2014, BKFS Operating LLC borrowed an incremental loan of $25.0 million pursuant to the Second Intercompany Note. The Original Intercompany Note and the Second Intercompany Note are collectively referred to as the Intercompany Notes. We amended each of the Intercompany Notes on May 30, 2014, and the descriptions below describe the Intercompany Notes as amended.
The amount assumed by BKFS on the Original Mirror Note is divided into two tranches known as Tranche T and Tranche R, which we refer to collectively as the Mirror Notes. Tranche T, in the original assumed amount of $644.0 million, bears interest at the rate or rates of interest charged on borrowings under FNF’s Term Loan Credit Agreement plus 100 basis points. Tranche R, in the original assumed amount of $176.0 million, bears interest at the rate or rates of interest charged on borrowings under FNF’s Revolving Credit Agreement plus 100 basis points. As of September 30, 2014, we were paying 2.75% plus LIBOR on Tranche T and 2.45%, plus LIBOR on Tranche R. The interest rates in effect for Tranche T and Tranche R Loans as of September 30, 2014 were 2.98% and 2.60%, respectively.
The Original Mirror Note agreement requires us to repay the outstanding principal amount of Tranche T in equal quarterly installments on the last day of each fiscal quarter as follows, with the first such payment to be made on the Funding Date: (i) 0.0% in the first year after the Funding Date, (ii) 10.0% in the second year after the Funding Date, (iii) 15.0% in the third year after the Funding Date, (iv) 20.0% in the fourth year after the Funding Date and (v) 20.0% in the fifth year after the Funding Date, in each case of the original aggregate principal amount of Tranche T made on the Funding Date. The remaining balance of the original amount shall be repaid on January 2, 2019. Tranche R has no scheduled principal payments, but will be due and payable in full on July 15, 2018.
The Intercompany Notes bear interest at a fixed rate of 10% per annum. Such interest is calculated and payable quarterly on the last day of each March, June, September and December of each fiscal year. We are not required to make scheduled principal payments prior to the maturity dates of the Intercompany Notes.
We have the right to prepay, at any time and from time to time, all or any portion of the outstanding principal amount of the Mirror Notes and the Intercompany Notes without premium or penalty.
On January 2, 2014, upon consummation of the Acquisition, LPS entered into a supplemental indenture, or the Supplemental Indenture, with FNF, BKLS and U.S. Bank National Association, as trustee, or the Trustee, to an indenture dated as of October 12, 2012, among LPS, the subsidiary guarantors party thereto and the Trustee, as supplemented by the Supplemental Indenture and the Second Supplemental Indenture, the Indenture, relating to the Senior Notes. Pursuant to the terms of the Supplemental Indenture, (i) FNF became a guarantor of LPS’s obligations under the Senior Notes and agreed to fully and unconditionally guarantee the Senior Notes, on a joint and several basis with the guarantors named in the Indenture and (ii) BKLS became a “co-issuer” of the Senior Notes and agreed to become a co-obligor of LPS’ obligations under the Indenture and the Senior Notes, on the same terms and subject to the same conditions as LPS, on a joint and several basis. As a result of FNF’s guarantee of the Senior Notes, the Senior Notes were rated as investment grade, which resulted in the suspension of most of the restrictive covenants in the Indenture.
The Senior Notes were registered under the Securities Act carry an interest rate of 5.75% and will mature on April 15, 2023. Interest is paid semi-annually on the 15th day of April and October. The Senior Notes are senior unsecured obligations. At any time and from time to time, prior to October 15, 2015, we
105
Table of Contents
may redeem up to a maximum of 35% of the original aggregate principal amount of the Senior Notes with the proceeds of one or more equity offerings, at a redemption price equal to 105.75% of the principal amount thereof, plus accrued and unpaid interest thereon, if any, to the redemption date. Prior to October 15, 2017, we may redeem some or all of the Senior Notes by paying a “make-whole” premium based on U.S. Treasury rates. On or after October 15, 2017, we may redeem some or all of the Senior Notes at the redemption prices described in the Indenture, plus accrued and unpaid interest. In addition, if a change of control occurs, we are required to offer to purchase all outstanding Senior Notes at a price equal to 101% of the principal amount plus accrued and unpaid interest, if any, to the date of purchase.
The Senior Notes contain covenants that, among other things, limit our ability (a) to incur or guarantee additional indebtedness or issue preferred stock, (b) to make certain restricted payments, including dividends or distributions on equity interests held by persons other than us or certain subsidiaries, in excess of an amount generally equal to 50% of consolidated net income generated since July 1, 2008, (c) to create or incur certain liens, (d) to engage in sale and leaseback transactions, (e) to create restrictions that would prevent or limit the ability of certain subsidiaries to (i) pay dividends or other distributions to us or certain other subsidiaries, (ii) repay any debt or make any loans or advances to us or certain other subsidiaries or (iii) transfer any property or assets to us or certain other subsidiaries, (f) to sell or dispose of our assets or any restricted subsidiary or enter into merger or consolidation transactions and (g) to engage in certain transactions with affiliates. As a result of FNF’s guarantee of the Senior Notes on January 2, 2014, and the Senior Notes becoming rated investment grade, certain covenants were suspended. As of September 30, 2014, covenants (a), (b), (e), (f) and (g) outlined above are suspended. These covenants will continue to be suspended as long as the Senior Notes are rated investment grade, as defined in the Indenture. These covenants are subject to a number of exceptions, limitations and qualifications in the Indenture. We have no independent assets or operations and our guarantees are full and unconditional and joint and several. There are no significant restrictions on our ability to obtain funds from any of our subsidiaries. The Senior Notes contain customary events of default, including failure (i) to pay principal and interest when due and payable and breach of certain other covenants and (ii) to accept and pay for the Senior Notes tendered as required by the Indenture. Events of default also include cross defaults, with respect to any other of our debt or debt of certain subsidiaries having an outstanding principal amount of $80.0 million or more in the aggregate for all such debt, arising from (i) failure to make a principal payment when due and such defaulted payment is not made, waived or extended within the applicable grace period or (ii) the occurrence of an event which results in such debt being due and payable prior to its scheduled maturity. Upon the occurrence of an event of default (other than a bankruptcy default), the trustee or holders of at least 25% of the Senior Notes then outstanding may accelerate the Senior Notes by giving us appropriate notice. If, however, a bankruptcy default occurs, then the principal of and accrued interest on the Senior Notes then outstanding will accelerate immediately without any declaration or other act on the part of the trustee or any holder.
On January 16, 2014, we issued an offer to purchase our Senior Notes pursuant to the change of control provisions under the related Indenture at a purchase price of 101% of the principal amount plus accrued interest to the purchase date. The offer expired on February 18, 2014. As a result of the offer, bondholders tendered $5.2 million in principal of the Senior Notes, which were subsequently purchased by us on February 24, 2014. On February 7, 2014, BKIS, BKLS and the Trustee entered into a second Supplemental Indenture to the Indenture, pursuant to which the financial reporting covenant under the Indenture was amended to substitute reporting of FNF for that of BKIS. In connection with the consent to remove the financial reporting covenant, we paid $0.7 million to the holders of the Senior Notes in February 2014.
Fair Value of Long-Term Debt
The fair value of our Senior Notes as of September 30, 2014 was $621.6 million. The fair value of our Intercompany Notes and Mirror Notes approximates carrying value, as the agreements were entered into during the first quarter of 2014.
106
Table of Contents
Contractual Obligations
Our long-term contractual obligations generally include our debt, data processing and maintenance commitments and operating lease payments on certain of our property and equipment. As of December 31, 2014, our required annual payments relating to these contractual obligations were as follows:
| Payments Due by Period | ||||||||||||||||||||
| Total | 2015 | 2016-2017 | 2018-2019 | Thereafter | ||||||||||||||||
| (In millions) | ||||||||||||||||||||
| Long-term debt |
$ | $ | $ | $ | $ | |||||||||||||||
| Interest on long-term debt |
||||||||||||||||||||
| Data processing and maintenance commitments |
||||||||||||||||||||
| Operating lease payments |
||||||||||||||||||||
|
|
|
|
|
|
|
|
|
|
|
|||||||||||
| Total |
$ | $ | $ | $ | $ | |||||||||||||||
|
|
|
|
|
|
|
|
|
|
|
|||||||||||
Indemnifications and Warranties
We often indemnify our clients against damages and costs resulting from claims of patent, copyright, trademark infringement or breaches of confidentiality associated with use of our software through software licensing agreements. Historically, we have not made any payments under such indemnifications, but continue to monitor the conditions that are subject to the indemnifications to identify whether a loss has occurred that is both probable and estimable that would require recognition. In addition, we warrant to clients that our software operates substantially in accordance with the software specifications. Historically, no costs have been incurred related to software warranties and none are expected in the future, and as such no accruals for warranty costs have been made.
Off-Balance Sheet Arrangements
We do not have any material off-balance sheet arrangements other than operating leases.
Critical Accounting Policies
Our discussion and analysis of our financial condition and results of operations is based upon our financial statements, which have been prepared in accordance with GAAP. The preparation of these financial statements requires management to make estimates, judgments and assumptions that affect the reported amounts of assets and liabilities and disclosures with respect to contingent liabilities and assets at the date of the consolidated financial statements and the reported amounts of revenues and expenses during the reporting periods. Certain of our accounting policies require the application of significant judgment by management in selecting the appropriate assumptions for calculating financial estimates. By their nature, these judgments are subject to an inherent degree of uncertainty. These judgments are based on our historical experience, terms of our existing contracts, our evaluation of trends in the industry, information provided by our clients and information available from outside sources as appropriate. Our actual results may differ from those estimates. The accounting policies described below are the ones that we consider to be the most critical to an understanding of our financial condition and results of operations and that require the most complex and subjective management judgment.
Revenue Recognition
We recognize revenues in accordance with Financial Accounting Standards Board, or FASB, ASC Topic 605, Revenue Recognition, or ASC 605. Recording revenues requires judgment, including determining whether an arrangement includes multiple elements, whether any of the elements are essential to the functionality of any other elements, and the allocation of the consideration based on each element’s relative selling price. Clients receive certain contract elements over time and changes to the elements in an arrangement, or in our determination of the relative selling price for these elements, could materially impact the amount of earned and unearned revenue reflected in our financial statements.
107
Table of Contents
The primary judgments relating to our revenue recognition are determining when all of the following criteria are met: (i) persuasive evidence of an arrangement exists; (ii) delivery has occurred or services have been rendered; (iii) the seller’s price to the buyer is fixed or determinable; and (iv) collectability is reasonably assured. Judgment is also required to determine whether an arrangement involving more than one deliverable contains more than one unit of accounting and how the arrangement consideration should be measured and allocated to the separate units of accounting.
If the deliverables under a contract are software related, we determine the appropriate units of accounting and how the arrangement consideration should be measured and allocated to the separate units. This determination, as well as management’s ability to establish vendor specific objective evidence, or VSOE, for the individual deliverables, can impact both the amount and the timing of revenue recognition under these agreements. The inability to establish VSOE for each contract deliverable results in having to record deferred revenues and/or applying the residual method. For arrangements where we determine VSOE for software maintenance using a stated renewal rate within the contract, we use judgment to determine whether the renewal rate represents fair value for that element as if it had been sold on a stand-alone basis. For a small percentage of revenues, we use contract accounting when the arrangement with the client includes significant customization, modification, or production of software. For elements accounted for under contract accounting, revenue is recognized using the percentage-of-completion method since reasonably dependable estimates of revenues and contract hours applicable to various elements of a contract can be made.
We are often party to multiple concurrent contracts with the same client. These situations require judgment to determine whether the individual contracts should be aggregated or evaluated separately for purposes of revenue recognition. In making this determination we consider the timing of negotiating and executing the contracts, whether the different elements of the contracts are interdependent and whether any of the payment terms of the contracts are interrelated.
Due to the large number, broad nature and average size of individual contracts we are a party to, the impact of judgments and assumptions that we apply in recognizing revenue for any single contract is not likely to have a material effect on our consolidated operations. However, the broader accounting policy assumptions that we apply across similar arrangements or classes of clients could significantly influence the timing and amount of revenue recognized in our results of operations.
Goodwill and Other Intangible Assets
We have significant intangible assets that were acquired through business acquisitions. These assets consist of purchased client relationships, contracts, intellectual property and the excess of purchase price over the fair value of identifiable net assets acquired (goodwill).
As of September 30, 2014, goodwill was $2,209.7 million. Goodwill is not amortized, but is tested for impairment annually or more frequently if circumstances indicate potential impairment. The process of determining whether or not an asset, such as goodwill, is impaired or recoverable relies on projections of future cash flows, operating results and market conditions. Such projections are inherently uncertain and, accordingly, actual future cash flows may differ materially from projected cash flows. In evaluating the recoverability of goodwill, we perform an annual goodwill impairment test on our reporting units based on an analysis of the discounted future net cash flows generated by the reporting units’ underlying assets. Such analyses are particularly sensitive to changes in estimates of future net cash flows and discount rates. Changes to these estimates might result in material changes in the fair value of the reporting units and determination of the recoverability of goodwill that may result in charges against earnings and a reduction in the carrying value of our goodwill.
108
Table of Contents
As of September 30, 2014, intangible assets, net of accumulated amortization, were $438.3 million, which consists primarily of client relationships and client contracts. Long-lived assets and intangible assets with definite useful lives are reviewed for impairment whenever events or changes in circumstances indicate that the carrying amount of an asset may not be recoverable. The valuation of these assets involves significant estimates and assumptions concerning matters such as client retention, future cash flows and discount rates. If any of these assumptions change, it could affect the recoverability of the carrying value of these assets. Client relationships are amortized over their estimated useful lives using an accelerated method that takes into consideration expected client attrition rates over a period of up to 10 years. All intangible assets that have been determined to have indefinite lives are not amortized, but are reviewed for impairment at least annually in accordance with ASC Topic 350, Intangibles-Goodwill and Other, or ASC 350. The determination of estimated useful lives and the allocation of the purchase price to the fair values of the intangible assets other than goodwill require significant judgment and may affect the amount of future amortization of such intangible assets.
Definite-lived intangible assets are amortized over their estimated useful lives ranging from 5 to 10 years using accelerated methods. There is an inherent uncertainty in determining the expected useful life of or cash flows to be generated from intangible assets. We have not historically experienced material changes in these estimates but could be subject to them in the future.
Computer Software
Computer software includes the fair value of software acquired in business combinations, purchased software and capitalized software development costs. As of September 30, 2014, computer software, net of accumulated amortization, was $505.8 million. Purchased software is recorded at cost and amortized using the straight-line method over its estimated useful life. Software acquired in business combinations is recorded at its fair value and amortized using straight-line or accelerated methods over its estimated useful life, ranging from 3 to 10 years. Internally developed software costs are amortized using straight-line or accelerated methods over the estimated useful life. Useful lives of computer software range from 3 to 10 years. Capitalized software development costs are accounted for in accordance with either ASC Topic 985, Software, Subtopic 20, Costs of Software to Be Sold, Leased, or Marketed, or ASC 350, Subtopic 40, Internal-Use Software. For computer software products to be sold, leased, or otherwise marketed (ASC 985-20 software), all costs incurred to establish the technological feasibility are research and development costs, and are expensed as they are incurred. Costs incurred subsequent to establishing technological feasibility, such as programmers’ salaries and related payroll costs and costs of independent contractors, are capitalized and amortized on a product by product basis commencing on the date of general release to clients. We do not capitalize any costs once the product is available for general release to clients. For internal-use computer software products (ASC 350-40 software), internal and external costs incurred during the preliminary project stage are expensed as they are incurred. Internal and external costs incurred during the application development stage are capitalized and amortized on a product by product basis commencing on the date the software is ready for its intended use. We do not capitalize any costs once the software is ready for its intended use.
We also assess the recorded value of computer software for impairment on a regular basis by comparing the carrying value to the estimated future cash flows to be generated by the underlying software asset. There is an inherent uncertainty in determining the expected useful life of or cash flows to be generated from computer software. We have not historically experienced material changes in these estimates but could be subject to them in the future.
Accounting for Income Taxes
For the periods prior to January 2, 2014 and following the offering, we are required to determine income taxes in each of the jurisdictions in which we operate as a part of the process of preparing the consolidated financial statements. This process involves estimating actual current tax expense together with assessing temporary differences resulting from differing recognition of items for income tax and accounting purposes. These
109
Table of Contents
differences result in deferred income tax assets and liabilities, which are included within the consolidated balance sheets. We must then assess the likelihood that deferred income tax assets will be recovered from future taxable income and, to the extent we believe that recovery is not likely, establish a valuation allowance. To the extent we establish a valuation allowance or increase this allowance in a period, we must reflect this increase as expense within Income tax expense in the consolidated statements of operations. Determination of income tax expense requires estimates and can involve complex issues that may require an extended period to resolve. Further, the estimated level of annual pre-tax income can cause the overall effective income tax rate to vary from period to period. We believe that our tax positions comply with applicable tax law and that we adequately provide for any known tax contingencies. We believe the estimates and assumptions used to support our evaluation of tax benefit realization are reasonable. Final determination of prior-year tax liabilities, either by settlement with tax authorities or expiration of statutes of limitations, could be materially different than estimates reflected in assets and liabilities and historical income tax provisions. The outcome of these final determinations could have a material effect on our income tax provision, net income or cash flows in the period that determination is made.
Qualitative and Quantitative Disclosures about Market Risk
We are exposed to interest rate risk in connection with our Mirror Notes payable to FNF, which are subject to variable interest rates. Based on the amount outstanding under our Mirror Notes as of September 30, 2014, a change in one percentage point in the applicable interest rate would cause an increase or decrease in interest expense of approximately $8.2 million on an annual basis based on the principal outstanding at September 30, 2014.
Recently Issued Accounting Pronouncements
In May 2014, the FASB issued Accounting Standards Update, or ASU, No. 2014-09, Revenue from Contracts with Customers (Topic 606). This ASU provides a new comprehensive revenue recognition model that requires companies to recognize revenue to depict the transfer of goods or services to a customer at an amount that reflects the consideration it expects to receive in exchange for those goods or services. This update also requires additional disclosure about the nature, amount, timing and uncertainty of revenue and cash flows arising from customer contracts. This update permits the use of either the retrospective or cumulative effect transition method. We are evaluating the effect this new guidance will have on our consolidated financial statements and related disclosures. We have not yet selected a transition method nor have we determined the effect of the standard on our ongoing financial reporting. This update is effective for annual and interim periods beginning on or after December 15, 2016, with early application not permitted.
In April 2014, the FASB issued ASU No. 2014-08, Presentation of Financial Statements (Topic 205) and Property, Plant, and Equipment (Topic 360): Reporting Discontinued Operations and Disclosures of Disposals of Components of an Entity. This ASU raises the threshold for a disposal to qualify as a discontinued operation and requires new disclosures of both discontinued operations and certain other disposals that do not meet the definition of a discontinued operation. This ASU is effective for annual periods beginning after December 15, 2014, and interim periods within annual periods beginning on or after December 15, 2015, with early adoption permitted. We early adopted this ASU beginning the quarter ended September 30, 2014, and do not expect this update to have a material impact on our financial statements.
110
Table of Contents
Overview
We are a leading provider of integrated technology, workflow automation and data and analytics to the mortgage industry. Our solutions facilitate and automate many of the mission-critical business processes across the entire mortgage loan life cycle, from origination until asset disposition. We believe we differentiate ourselves by the breadth and depth of comprehensive, integrated solutions and the insight we provide to our clients.
We have market leading positions in mortgage processing and technology solutions combined with comprehensive real estate data and extensive analytic capabilities. Our solutions are utilized by 21 of the 25 largest U.S. mortgage originators and all of the 25 largest U.S. mortgage servicers, as well as other financial institutions, investors and real estate professionals, to support mortgage lending and servicing operations, analyze portfolios and properties, operate more efficiently, meet regulatory compliance requirements and mitigate risk.
The U.S. mortgage market is a large market. According to the Fed, U.S. total mortgage debt outstanding is approximately $9.9 trillion as of September 2014, while total U.S. mortgage originations are expected to exceed $1.1 trillion in 2014, according to the MBA.
The U.S. Mortgage market is undergoing significant change and mortgage market participants have been subjected to more stringent oversight in recent years. Regulators have increasingly focused on better disclosure, improved risk mitigation and enhanced oversight. Mortgage lenders large and small have experienced higher costs in order to comply with this higher level of regulation. Despite these new regulatory burdens, the mortgage industry remains a competitive marketplace with numerous large lenders and smaller institutions competing for new loan originations. In order to comply with this increased regulatory burden and compete more effectively, mortgage market participants have continued to outsource mission-critical functions to third-party technology providers that can offer economical solutions due to their economies of scale.
We believe our comprehensive end-to-end, integrated solutions differentiate us from other technology providers serving the mortgage industry and positions us particularly well for evolving opportunities in this market. We have exclusively served the mortgage and real estate industries for over 50 years and utilize this experience to design and develop solutions that fit our clients’ ever-evolving needs. Our proprietary technology platforms and data and analytics capabilities reduce manual processes, improve compliance and quality, mitigate risk and deliver significant cost savings to our clients. Our scale allows us to continually and cost-effectively invest in our business in order to meet evolving industry requirements and maintain our position as an industry-standard platform for mortgage market participants. Our proprietary technology platform services more than 50% of all U.S. first lien mortgages based on the number of U.S. first lien mortgages according to the BKFS Mortgage Monitor Report, reflecting our leadership in the mortgage servicing market, and our market share has grown by more than four percentage points over the last five years.
Capitalizing on our leadership position, we launched LoanSphere, an innovative product and delivery strategy, which provides a workflow management application designed to streamline and automate business processes across the mortgage loan life cycle. Some solutions have already been delivered under LoanSphere, and we are focused on providing integration and automation in all of the solutions we offer.
Our business is organized into two segments:
| • | Technology—offers software and hosting solutions that support loan servicing, which includes the core mortgage servicing, specialty mortgage servicing including loss mitigation and default workflow management, loan origination and settlement services. |
| • | Data and Analytics—offers solutions to enhance and support our technology products in the mortgage, real estate and capital markets industries. These solutions include property ownership data, lien data, servicing data, automated valuation models, collateral risk scores, prepayment and default models, lead generation and other data solutions. |
111
Table of Contents
We offer our solutions to a wide range of clients across the mortgage industry. The quality and breadth of our solutions contributes to the long-standing nature of our relationships with our clients, the majority of whom enter into long-term contracts across multiple products that are embedded in their mission critical workflow and decision processes. Given the contractual nature of our revenues and stickiness of our client relationships, our revenues are highly visible and recurring in nature. Due to our integrated suite of solutions and our scale in the mortgage market, we are able to drive significant operating leverage, which we believe enables our clients to operate more efficiently while allowing us to generate strong margins and cash flow.
For the period from January 2, 2014 to September 30, 2014, we have Adjusted Revenue of $642.2 million and Adjusted EBITDA of $255.2 million reflecting increases of 14% for each metric compared to the 9 months ended September 30, 2013. For additional information regarding our non-GAAP financial measures, including a reconciliation of Adjusted Revenue to revenue and Adjusted EBITDA to operating income, see “Prospectus Summary—Summary Historical Financial Data.”
Our History
Our business generally represents a reorganization of the former Technology, Data and Analytics segment of LPS, a former provider of integrated technology, data and services to the mortgage lending industry in the United States. Our business also includes the businesses of Commerce Velocity and Property Insight, two companies that were contributed to us by our majority owner, FNF.
Acquisition of LPS by FNF and Subsequent Reorganization
On January 2, 2014, FNF acquired LPS, and as a result, LPS became an indirect, wholly-owned subsidiary of FNF. Upon the closing of the transaction, the shares of LPS common stock, which previously traded under the ticker symbol “LPS” on the NYSE, ceased trading on, and were delisted from, the NYSE.
On January 3, 2014, pursuant to the Internal Reorganization, substantially all of the former Technology, Data and Analytics segment of LPS was transferred to us and the former Transaction Services businesses of LPS were transferred by BKIS to BKHI and contributed by BKHI to another of its then wholly-owned subsidiaries or to another subsidiary of FNF.
Also, on January 3, 2014, BKHI contributed Commerce Velocity, a former indirect subsidiary of FNF that had been contributed to BKHI in December 2013, to BKFS Operating LLC, which contributed it to BKIS. Thereafter, we issued 35.0% of the membership interests of BKFS Operating LLC to certain THL Affiliates and THL Intermediaries.
Following the Internal Reorganization, we are majority owned by FNF through its wholly-owned subsidiary, BKHI, and minority owned by THL through certain THL Affiliates and THL Intermediaries. FNF and THL Managers LLC also provide us with management and consulting services. The agreements under which FNF and THL Managers LLC provide these services will be terminated in connection with the closing of this offering.
Contribution of Property Insight, LLC
On June 2, 2014, as part of an additional internal reorganization, two wholly-owned subsidiaries of FNF contributed to us their respective interests in Property Insight, a company that provides property information used by title insurance underwriters, title agents and closing attorneys to underwrite title insurance policies for real property sales and transfers. As a result, we are now the sole member of Property Insight. In connection with the Property Insight Contribution, BKFS Operating LLC issued an additional 6.4 million of its Units (as defined below) to BKHI. As a result of this issuance, THL Affiliates’ and THL Intermediaries’ combined percentage ownership in BKFS Operating LLC was reduced from 35.0% to 32.9%.
112
Table of Contents
Our Industry
The U.S. mortgage market is large and the loan life cycle is complex and consists of several stages. The total U.S. mortgage debt outstanding is approximately $9.9 trillion as of September 2014 according to the Fed. The mortgage loan life cycle includes origination, servicing and default. Mortgages are originated through home purchases or refinancings of existing mortgages. Once the mortgage is originated, it is serviced on a periodic basis by mortgage servicers, which may not be the lenders that originated the mortgage. Furthermore, if a mortgage goes into default, it triggers a set of multifaceted processes with an assortment of potential outcomes depending on a mix of variables.
Underlying the three major components of the mortgage loan life cycle is the technology and data and analytics support behind each process, which has become increasingly critical to industry participants. As the industry has grown in complexity, participants have responded by outsourcing to large scale specialty providers, automating manual processes and seeking end-to-end solutions that support the processes required to manage the entire mortgage loan life cycle.
Overview of the Mortgage Origination Market
The U.S. mortgage origination market consists of both purchase and refinance originations. According to the MBA Mortgage Finance Forecast as of November 19, 2014, the U.S. mortgage origination market is expected to be approximately $1.1 trillion in 2014. Factors that impact this market include unemployment, house prices, interest rates and other general economic factors. The mortgage origination process is complex and involves multiple parties, significant data exchange and significant regulatory oversight, which requires scale and substantial industry experience. As a result, the ten largest originators are expected to represent approximately 53% of the annual origination volume in 2014 according to National Mortgage News.
Overview of the Mortgage Servicing Market
The U.S. mortgage servicing market is comprised of first and second lien mortgage loans. The first lien mortgage market represents approximately 50 million mortgage loans according to the BKFS Mortgage Monitor with an outstanding balance of approximately $9.2 trillion. According to the Fed, the second lien mortgage market represents approximately 18 million mortgage loans with an outstanding balance of approximately $0.7 trillion. Many of these second lien mortgages were historically originated and serviced by banks. It is our experience that the factors that impact the mortgage servicing market include population, housing inventory stock, health of the overall economy and availability of credit.
Since 1990, the first lien mortgage servicing market has grown from 18 million loans to 50 million loans, representing a compound annual growth rate of more than four percent according to the MBA. Even through previous downturns, the mortgage servicing market has generally remained stable, as the total number of mortgage loans outstanding tends to stay more constant than mortgage originations. For example, despite the most recent housing downturn, the total number of first lien mortgages outstanding today is approximately 10% higher than at the end of 2004. The mortgage servicing market is concentrated, with the ten largest servicers representing approximately 70% of the total market as of June 30, 2014 according to National Mortgage News.
While delinquent mortgages typically represent a small portion of the overall loan servicing market, the mortgage default process is long and complex and involves multiple parties, a significant exchange of data and documentation and extensive regulatory requirements. Providers to the default process must be able to meet strict regulatory guidelines, which are best met through the use of technology.
113
Table of Contents
Recent Trends in the Mortgage Industry
The U.S. mortgage market has seen significant change over the past few years and is expected to continue to evolve going forward. Increased origination volatility and key regulatory actions arising from the recent financial crisis, such as the Dodd-Frank Act and the establishment of the CFPB, impose new and evolving standards for market participants. These regulatory changes have spurred lenders and servicers to seek technology solutions that facilitate compliance obligations in the face of a changing regulatory environment while remaining efficient and profitable.
| • | Increased regulation. Most U.S. mortgage market participants have become subject to increasing regulatory oversight and regulatory requirements as federal and state governments have enacted various new laws, rules and regulations. One example of such legislation is the Dodd-Frank Act, which contains broad changes for many sectors of the financial services and lending industries and established the CFPB, a new federal regulatory agency responsible for regulating consumer financial protection within the United States. It is our experience that mortgage lenders have become more focused on the risk of non-compliance with these evolving regulations and are focused on technologies and solutions that help them to comply with the increased regulatory oversight and burdens. |
| • | Lenders increasingly focused on core operations. As a result of increased volatility in originations, greater regulatory scrutiny and the higher cost of doing business, we believe lenders have become increasingly focused on their core operations and customers. We believe lenders are increasingly shifting from affiliate business models and in-house technologies to solutions with third-party providers who can provide better technology and services more efficiently. Lenders require these vendors to provide best-in-class technology and management teams and to assist them in maintaining regulatory compliance. We believe that very few of these providers have the scale and regulatory infrastructure to meet both the technological efficiency and high regulatory standards that lenders require. |
| • | Growing role of technology in the U.S. mortgage industry. Banks and other lenders and servicers have become increasingly focused on technology automation and workflow management to operate more efficiently and meet their regulatory guidelines. We believe that vendors must be able to support the complexity in the market, display extensive industry knowledge and possess the financial resources to make the necessary investments in technology to support lenders. |
| • | Increased demand for enhanced transparency and analytic insight. As U.S. mortgage market participants work to minimize the risk in lending, servicing and capital markets, they increasingly rely on data and analytics to integrate with technologies that enhance the decision making process. These industry participants rely on large historical databases coupled with enhanced analytics to achieve these goals. |
Our Solutions
Our solutions provide U.S. mortgage industry participants with a comprehensive integrated technology and work flow management solution set that is supported by what we believe is industry-leading data and analytics to enhance capabilities and drive efficiencies while assisting our clients in maintaining regulatory compliance.
Technology Solutions
Our Technology segment offers leading software and hosting solutions that facilitate and automate many of the business processes across the life cycle of a mortgage. These solutions primarily consist of mortgage origination, processing and workflow management software applications coupled with related support and services.
Our clients in this segment are primarily mortgage lenders and servicers. We believe they use our technology and services to reduce their operating costs, improve their ability to provide superior customer service and enhance the quality and consistency of various aspects of their mortgage operations. We continually work with our clients to enhance and integrate our software and services in order to assist them in gaining the greatest value from the solutions we provide.
114
Table of Contents
The primary applications and services within our Technology segment are as follows:
| • | Servicing Technology. Our mortgage servicing platform, MSP, is a SaaS application that automates loan servicing, including loan setup and ongoing processing, customer service, accounting and reporting to the secondary mortgage market, and investor reporting. MSP serves as a core application and database of record for non-delinquent first and second lien mortgages. |
When a bank hires us to process its mortgage portfolio, we provide a hosted software solution and system support personnel whose role is to ensure our system remains up and running 24 hours a day, seven days a week; to monitor our programs and interfaces effectively; to make system and application changes as necessary; and to assist our clients in becoming or remaining compliant with applicable regulations.
LoanSphere Foreclosure and LoanSphere Bankruptcy are solutions that optimize default service processes. These applications leverage a workflow engine that utilizes sophisticated rules based functionality, can be configured to conform to existing servicer business practices and initiate tasks based on servicer milestones for foreclosure and bankruptcy. We also offer LoanSphere Invoicing, a sophisticated web-based solution designed to enhance the efficiency of processing default-related invoices by incorporating leading-edge technology to standardize and streamline every aspect of the billing and invoice process.
| • | Origination Technology. We offer two solutions that automate and facilitate the origination of mortgage loans in the United States: Empower, which supports retail and wholesale loan originations, and LendingSpace, which supports correspondent loan originations, which are originations that are funded by one lender, who sells the loan to another lender to service the loan or sell it on the secondary market. Our loan origination technologies are continuously enhanced to meet changing regulatory requirements, and are used to improve loan quality and store documents and images. |
We also offer the RealEC Exchange and the Insight suite of solutions. The RealEC Exchange is a platform that provides a fully interconnected network of originators, agents, settlement services providers and investors in the United States. This secure and integrated one-to-many platform allows lenders and their service providers to connect and do business electronically. Our Insight suite of solutions is integrated with the RealEC Exchange and is designed to help lenders meet loan quality and disclosure requirements established by the GSEs, CFPB, and FHFA.
We build all of our technology platforms to be scalable, secure, flexible, standards-based, and web connected for easy use by our clients. Further, we have a history of being able to bring solutions to market quickly due to investments that we have made in integrating our technology and development processes.
Data and Analytics Solutions
Our Data and Analytics segment supports and enhances our technology solutions, and is designed to help lenders and servicers make more informed decisions, improve performance, identify and predict risk and generate more qualified leads. We believe that we have aggregated the largest residential real estate data set in the United States that is derived from both proprietary and public data sources. Our data set is comprised of data from servicers, our core first lien portfolio, home equity data, public records, and MLS listings. Utilizing this data, subject to any applicable use restrictions, and our deep history and understanding of the mortgage market, we have created detailed real estate data solutions that assist in portfolio management, valuations, property records, lead generation and improved risk analysis for all aspects of origination, servicing, default and capital markets/investing.
115
Table of Contents
Our primary data and analytics services are as follows:
| • | Property, Mortgage Performance Data and MLS. We make our real estate database available to our clients in a standard, normalized format. We also provide tax status data on properties and offer a number of value-added analytic services designed to enable our clients to utilize our data to assess and mitigate risk, determine property values, track market performance and generate leads. We also provide a MLS system to large MLS groups in the U.S. |
| • | Mortgage and Real Estate Analytics. We offer a broad range of property valuation services that allow our clients to analyze the value of underlying properties. These include, among others, automated valuation models, collateral risk scores, appraisal review services and valuation reconciliation services. To deliver these services, we utilize proprietary algorithms, detailed real estate statistical analysis and modified physical property inspections. These offerings are designed to reduce risk in origination, servicing and default transactions as well as aid investors in analysis of property and real estate assets. The offering can be tailored depending upon client needs and any regulatory requirements. |
Integrated Platform
We have launched an innovative product and delivery strategy, called LoanSphere, which we believe is the mortgage industry’s only end-to-end integrated technology platform. LoanSphere will deliver business process automation, workflow, rules, integration, data and a common user experience across technologies that support the entire lending life cycle from prospecting until asset disposition.
We believe the innovative LoanSphere platform will seamlessly integrate our industry-leading applications for originations, servicing, default and data and analytics. In the future LoanSphere will also feature a centralized database for client’s loan data and documents, as well as client-selected industry data and analytics to enable powerful decision-making, improved loan and portfolio analysis and reduced risk.
116
Table of Contents
Delivered in phases, with many capabilities currently available, we believe LoanSphere enables clients to realize greater efficiencies, better manage risk and achieve greater financial results.
Our Competitive Strengths
We believe that our competitive strengths include the following:
| • | Market leadership with comprehensive and integrated solutions. We are a leading provider of comprehensive and integrated solutions to the mortgage industry. We have significant relationships with 21 of the top 25 largest mortgage originators and all of the top 25 largest U.S. mortgage servicers, service over 50% of all U.S. first lien mortgages and operate one of the industry’s largest exchanges connecting originators, agents, settlement services providers and investors. We believe our leadership position is, in part, the result of our unique expertise and insight developed from over 50 years serving the needs of customers in the mortgage industry. We have used this insight to develop an integrated and comprehensive suite of proprietary technology, data, and analytics solutions to automate many of the mission-critical business processes across the entire mortgage loan life cycle. These integrated solutions are designed to reduce manual processes, assist in improving organizational compliance and mitigating risk, and ultimately deliver significant cost savings to our clients. |
| • | Broad and deep client relationships with significant recurring revenue. We have deep and long-standing relationships with our largest clients. Our average relationship with our top 10 servicer clients is over 25 years, and these clients utilize an average of 6 products across our comprehensive solutions. We typically enter into long-term contracts with our clients and our products are typically embedded within our clients’ mission-critical workflow and decision processes across various parts of their organizations. As a result, we have developed recurring and sticky relationships with our clients. For example, the clients representing 95% of our 2013 revenue continued to be our clients in 2014. Given these deep relationships, we believe that we are well-positioned to continue to develop and cross-sell new products and services that will meet the evolving needs of the mortgage industry. |
117
Table of Contents
| • | Extensive data assets and analytics capabilities. We develop and maintain large, accurate and comprehensive data sets on the mortgage and housing industry that we believe are competitively differentiated. Our unique data sets provide a combination of public and proprietary data in real-time and each of our data records feature a large number of attributes. Our data scientists utilize our data sets, subject to any applicable use restrictions, and comprehensive analytical capabilities to create highly customized reports, including models of customer behavior for originators and servicers, portfolio analytics for capital markets and government agencies and proprietary market insights for real estate agencies. Our data and analytics capabilities are also embedded into our technology platform and workflow products, providing our clients with integrated and comprehensive solutions. |
| • | Scalable and cost effective operating model. We believe we have a highly attractive and scalable operating model derived from our market leadership, hosted technology platforms and the large number of clients we serve across the mortgage industry. Our scalable operating model provides us with significant benefits. Our scale and operating leverage allows us to add incremental clients to our existing platforms with limited incremental cost. As a result, our operating model drives attractive margins and generates significant cash flow. Also, by leveraging our scale and leading market position, we are able to make cost effective investments in our technology platform to meet evolving regulatory and compliance requirements, further increasing our value proposition to clients. |
| • | World class management team with depth of experience and track record of success. Our management team has an average of over 20 years of experience in the banking technology and mortgage processing industries and a proven track record of strong execution capabilities. Following the Acquisition, we have significantly improved our operations and enhanced our go-to-market strategy, further integrated our technology platforms, expanded our data and analytics capabilities and introduced several new innovative products. We executed all of these projects while delivering attractive revenue growth and strong profitability. |
Our Growth Strategy
Our comprehensive and integrated technology platforms, robust data and analytic capabilities, differentiated business model and other competitive strengths enable us to pursue multiple growth opportunities. We intend to continue to expand our business and grow through the following key strategies:
| • | Further penetration of our solutions with existing clients. We believe our established client base presents a substantial opportunity for growth. We seek to capitalize on the trend of standardization and increased adoption of leading third-party solutions and increase the number of solutions provided to our existing client base. We intend to broaden and deepen our client relationships by cross-selling our suite of end-to-end technology solutions, as well as our robust data and analytics. We have established incentives within our sales force, as well as a core team of account managers, to encourage cross-selling of our full range of solutions to our existing clients. By helping our clients understand the full extent of our comprehensive solutions and the value of leveraging the multiple solutions that we offer, we believe we can expand our existing relationships by freeing our clients to focus on their core businesses and their customers. |
| • | Win new clients in existing markets. We intend to attract new clients in the mortgage industry by leveraging the value proposition provided by our technology platform and comprehensive solutions offering. In particular, we believe there is a significant opportunity to penetrate the underserved mid-tier mortgage originators and servicers market. We believe that these institutions can benefit from our proven solutions suite in order to address increasingly complex regulatory requirements and compete more effectively in the evolving mortgage market. We intend to continue to pursue this channel and benefit from the low incremental cost of adding new customers to our scaled technology infrastructure. |
| • | Continued innovation and expansion of new solutions. Our long-term vision is to be the industry leading provider for participants of the mortgage industry for their platform, data, and analytic needs. |
118
Table of Contents
| We intend to enhance what we believe is a leadership position in the industry by continuing to innovate our solutions and refine the insight we provide to our clients. We have a strong track record of introducing and developing new solutions that span the mortgage loan life cycle, are tailored to specific industry trends and that enhance our clients’ core operating functions. By working in partnership with key clients, we have been able to develop and market new and advanced solutions to our client base that meet the evolving demands of the mortgage industry. In addition, we will continue to develop and leverage insights from our large public and proprietary data assets to further improve our customer value proposition. |
| • | Powerful focus and dedication to staying up-to-date with regulatory requirements. We have dedicated significant technological and management resources to build and maintain a regulatory infrastructure and human capital base to assist our clients with increased regulatory oversight and requirements. We are able to leverage our consistent investment in this area through our SaaS technology solutions and our market-leading scale. We intend to continue our strategy of building and investing in solutions that help our clients with the regulatory environment. |
| • | Selectively pursue strategic acquisitions. The core focus of our strategy is to grow organically. However, we may selectively evaluate strategic acquisition opportunities that may allow us to expand our footprint, broaden our client base and deepen our product and service offerings. We believe that there are meaningful synergies that result from acquiring small companies that provide best-of-breed single point solutions. The potential revenue synergies would result from integrating and cross-selling these point solutions into our broader client base and cost synergies would result from integrating acquisitions into our efficient operating environment. |
Our Clients
We have numerous clients in each category of service that we offer across the mortgage continuum. A significant focus of our marketing efforts is on the top U.S. mortgage originators and servicers, although we also provide our solutions to a number of other financial institutions, investors, attorneys, trustees and real estate professionals.
The U.S. mortgage industry is concentrated among the top 25 mortgage institutions and our most significant and long-term relationships tend to follow the industry landscape. We typically provide an extensive number of solutions to each client. Because of the depth of these relationships, we derive a significant portion of our aggregate revenue from our largest clients.
During the period from January 2, 2014 to September 30, 2014, the clients that contributed more than 10% of our consolidated revenue were as follows:
| Client |
Percent of Technology |
Percent of Data and Analytics Segment Revenues |
Percent of Consolidated Revenue | |||
| Wells Fargo | 16% | 1% | 14% | |||
| JP Morgan Chase | 14% | 1% | 13% |
During the period from January 2, 2014 to September 30, 2014, our five largest clients accounted for approximately 40% of our consolidated revenues, approximately 42% of our Technology segment revenues and approximately 27% of our Data and Analytics segment revenues. However, the revenues in each case are spread across a range of services, and are subject to multiple separate contracts. Although the diversity of the services we provide to each of these clients reduces the risk that we would lose all of the revenues associated with any of these clients, a significant deterioration in our relationships with or the loss of any one or more of these clients could have a significant impact on our results of operations. See “Risk Factors—We rely on our top clients for a significant portion of our revenue and profit, which makes us susceptible to the same macro-economic and regulatory factors that impact our clients.”
119
Table of Contents
Our Solutions and Services
Technology Solutions
Servicing Solutions
| Solution Type: | Description: | |
| MSP |
• Servicing platform that provides automation to service a wide range of loan products, including fixed- and adjustable-rate mortgages, construction loans, consumer loans, biweekly loans, daily simple-interest loans and more:
• Automates all areas of loan servicing
• Offers cash controls and balancing functionality, as well as investor reporting, escrow and default functionalities on one, comprehensive system
• Backed by a team of experienced consultants, trainers and customer service that offers support 24/7
• By servicing a wide variety of loans on a single system (i.e., first lien mortgages, second lien mortgages, etc.), servicers benefit from insight across their portfolio, improved risk mitigation and reduced expenses
| |
| LoanSphere Bankruptcy and LoanSphere Foreclosure |
• Work flow engine that utilizes sophisticated rule based functionality; can be configured to conform to existing servicer business practices and initiates tasks based on servicer milestones for foreclosure and bankruptcy | |
| LoanSphere Invoicing |
• Sophisticated web-based solutions that enhances the efficiency of processing default related invoices by incorporating our leading-edge technology to standardize and streamline every aspect of the billing and invoice process | |
Origination Solutions
| Solution Type: | Description: | |
| Empower |
• Enterprise-wide loan origination system that provides functionality for every facet of the origination process, including consumer, retail and wholesale point-of-sale channels; first and second mortgage products support; loan fulfillment and closing; pre- and post-closing audit and compliance functions; product and pricing; electronic document management and industry-standard interfaces | |
| LendingSpace |
• Complete, end-to-end correspondent lending platform that supports the entire review, audit and approval of correspondent loans. A correspondent loan is a loan that is originated and funded by one lender and sold to another lender who services the loan or sells it on the secondary market | |
| Sales Edge | • Feature-rich management and customer relationship solution in one complete system
• Helps lenders manage leads, and develop and retain customer relationships that will ultimately convert more leads to closed loans and boost productivity | |
| Closing Insight | • Web-based solution designed to support lender and service provider efforts to comply with the CFPB’s Integrated Mortgage Disclosure rule that will go into effect on August 1, 2015
• Streamlines the complex, multi-party closing process, and helps lenders collaborate with their settlement agents to generate mortgage disclosures and negotiate closing fees within required timelines
• Provides storage for origination documents | |
120
Table of Contents
| Quality Insight | • Robust workflow solution that assesses loan quality by evaluating loan data against lender and investor criteria for adherence to compliance requirements, helping to reduce repurchase risk and save lenders time and resources | |
| Valuation Insight | • Appraisal evaluation reporting solution that confirms completeness, assesses appraisal quality, and provides valuation transparency through the valuation review process | |
| Exchange | • Provides a fully interconnected network of originators, agents, settlement services providers and investors in the U.S.
• Enables subscribers to connect and do business electronically through an online, dual-sided, standards-based exchange | |
Data and Analytics
| Solution Type: | Description: | |
| Lead Generation | • Includes Black Knight SiteXData, which helps clients pinpoint prospects for more efficient, effective marketing results, giving them access to what we believe is the most up-to-date and comprehensive property data in the industry, including: | |
| Mortgage Performance Data and Analytics |
• Mortgage performance data, providing clients with the broadest breadth and depth in any single loan-level data source
• Extensive repository of information spans the entire credit spectrum of agency, non-agency and portfolio products, and includes data from the nation’s top servicers
• Historical loan assets
• Proven analytics models—based on borrower behavioral patterns, projected market trends and national servicing data dating back to the early 1990s—provide the insight clients need to make more informed decisions to meet regulatory requirements, increase profitability, optimize staffing and resources, reduce collection expenses, meet investor guidelines for borrower outreach and validate loan-level decision making | |
| Portfolio Management and Diligence |
• Portfolio management and due diligence solutions includes a full suite of products such as AFT Prepayment and Credit Model, Black Knight Home Price Index, Lien Alert, mortgage scores, RentRange and ValueRisk
• Solutions help monitor liens on loan collateral, manage risk, maximize loss mitigation strategy and perform due diligence assessments on portfolios for acquisition | |
| Real Estate | • Comprehensive datasets from tax assessor, deed, mortgage, pre-foreclosure, foreclosure, assignments and releases records. We believe our database delivers unmatched depth, breadth and quality | |
| Valuations and Collateral Risk |
• Valuation solutions combine data, propriety information, proven methodologies and advanced user and performance testing to help clients validate appraisal values for pre-funding quality control, minimize valuation costs for second mortgages and second mortgage origination | |
| Property Tax Reporting |
• Property tax solutions provide a solution for our clients’ property tax data needs with a broad coverage across the nation and standardized reporting formats.
• Available on demand, 24/7 and at any point during the loan life cycle and include fast, accurate, complete and up-to-date information available
• PTD Plus PTD Shield, PTD Tax Payment Calculator, National TaxNet help clients research tax status during the loan modification process, reduce the risk of losing collateral due to delinquent property taxes and quickly identify delinquent property taxes at loan origination and obtain current tax amounts and escrow deposit estimates for GFE reporting | |
121
Table of Contents
| Property Insight | • Provides title plant production and data services through Connection Point, Insight Title Point, Vantage Point and Insight Xpress Services | |
| Advisory | • Experienced consultants deliver powerful, actionable solutions to mortgage lenders, servicers and investors
• Relying on unparalleled data analytics and deep industry experience, consultants discuss objectives with clients and create custom solutions for decision making tools, optimal modifications, loan segmentation, dashboards, property valuation, benchmarking, loss reserving, model validation, economic capital and more | |
| LoanSphere Data Hub |
• The LoanSphere Data Hub provides the ability to aggregate customer data with third party data to enable in-depth analytics and customized models that facilitate enhanced decision-making and process reengineering. | |
Sales and Marketing
Our sales and marketing efforts are focused on both generating new clients as well as cross-selling our broad service offerings to existing clients.
We have teams of experienced sales personnel with subject matter expertise in particular services and in the needs of particular types of clients. A significant portion of our potential clients in each of our business lines is targeted via direct and/or indirect field sales, as well as inbound and outbound telemarketing efforts. Marketing activities include direct marketing, print and electronic advertising, media relations, web-based activities, thought leadership, client meetings and conferences, tradeshow and convention activities and other targeted initiatives.
Given the broad range of solutions we offer and the concentration and scale of many of our existing clients, we have the opportunity to expand our sales to our existing client base through cross-selling efforts. We have established a core team of account managers that cross-sell the full range of our services to existing and potential clients at the top U.S. mortgage originators and servicers, as well as a number of other financial institutions, investors and real estate professionals. The individuals who participate in this effort spend a significant amount of their time on sales and marketing efforts.
We engage in strategic account reviews, during which our executives share their knowledge of clients and the market in order to determine the best sales approach on a client-by-client basis. As a result, we have created an effective cross-sell culture within our organization.
Research and Development
Our research and development activities relate primarily to the design, development and enhancement of our processing systems and related software applications. We expect to continue our practice of investing an appropriate level of resources to maintain, enhance and extend the functionality of our proprietary systems and existing software applications, to develop new and innovative software applications and systems in response to the needs of our clients, and to enhance the capabilities surrounding our infrastructure. We work with our clients to determine the appropriate timing and approach to introducing technology or infrastructure changes to our applications and services.
Patents, Trademarks and Other Intellectual Property
We rely on a combination of contractual restrictions, internal security practices, and copyright and trade secret laws to establish and protect our software, technology, data and expertise. Further, we have developed a number of brands that have accumulated goodwill in the marketplace, and we rely on trademark law to protect our rights in that area. We intend to continue our policy of taking all measures we deem necessary to protect our copyright, trade secret and trademark rights.
122
Table of Contents
Competition
A number of the businesses in which we engage are highly competitive. Competitive factors in processing businesses include the quality of the technology-based application or service, application features and functions, ease of delivery and integration, ability of the provider to maintain, enhance and support the applications or services, and pricing. We believe that our integrated technology and economies of scale in the mortgage processing business provide us with a competitive advantage in each of these categories. We also believe that no single competitor offers the depth and breadth of solutions that we are able to offer.
Technology. With respect to our Technology segment, we compete with our customers’ internal technology departments and other providers of similar systems, such as Fiserv, Inc., Fidelity National Information Services, Inc., or FIS, WiPro Gallagher Solutions, and Ellie Mae, Inc. Competitive factors include the quality of the technology-based application or service, application features and functions, ease of delivery and integration, ability of the provider to maintain, enhance and support the applications or services, and pricing. We believe that our integrated technology and economies of scale in the mortgage processing business provide us with a competitive advantage in each of these categories.
Data and Analytics. In our Data and Analytics businesses, we primarily compete with CoreLogic, Inc., First American Financial Corporation, in-house capabilities and certain niche providers. We compete based on the breadth and depth of our data, the exclusive nature of some of our key data sets and the capabilities to create highly customized reports. We believe that the quality of the data we offer is distinguished by the broad range of our data sources, including non-public sources, the volume of records we maintain, our ability to integrate our data and analytics with our technology solutions and the ability to leverage our market leading position in the mortgage origination and servicing industries.
Government Regulation
Various aspects of our businesses are subject to federal and state regulation. Our failure to comply with any applicable laws and regulations could result in restrictions on our ability to provide certain services, as well as the possible imposition of civil fines and criminal penalties.
As a provider of electronic data processing to financial institutions, such as banks and credit unions, we are subject to regulatory oversight and examination by the Federal Financial Institutions Examination Council, an interagency body of the Federal Reserve Board, the OCC, the FDIC and various other federal and state regulatory authorities. In addition, independent auditors annually review several of our operations to provide reports on internal controls for our clients’ auditors and regulators. We also may be subject to possible review by state agencies that regulate banks in each state in which we conduct our electronic processing activities.
Our financial institution clients are required to comply with various privacy regulations imposed under state and federal law, including the Gramm-Leach-Bliley Act. These regulations place restrictions on the use of non-public personal information. All financial institutions must disclose detailed privacy policies to their customers and offer them the opportunity to direct the financial institution not to share information with third parties. The regulations, however, permit financial institutions to share information with non-affiliated parties who perform services for the financial institutions. As a provider of services to financial institutions, we are required to comply with the same privacy regulations and are generally bound by the same limitations on disclosure of the information received from our clients as those that apply to the financial institutions themselves.
The current environment and troubled housing market have resulted in increased scrutiny of all parties involved in the mortgage industry by governmental authorities with the most recent focus being on those involved in the foreclosure process. This scrutiny has included federal and state governmental review of all aspects of the mortgage lending business, including an increased legislative and regulatory focus on consumer protection practices. The Dodd-Frank Act is one example of such legislation. It is too early to predict the final form that regulations or other rule-makings to implement the various requirements of the Dodd-Frank Act may take, what
123
Table of Contents
additional legislative or regulatory changes may be approved in the future, or whether those changes may require us to change our business practices, incur increased costs of compliance or adversely affect our results of operations.
Employees
As of November 2014, we had approximately 4,000 employees and approximately 500 independent contractors. None of our workforce currently is unionized. We have not experienced any work stoppages, and we consider our relations with employees to be good.
Corporate
In addition to our two reporting segments, we have a corporate organization that consists primarily of general and administrative expenses that are not included in the other segments.
Properties
Our corporate headquarters is located at 601 Riverside Avenue, Jacksonville, Florida 32204, in an owned facility. We also own facilities in Sharon, Pennsylvania. We lease office space as follows:
| Location |
Number of Locations |
|||
| California |
8 | |||
| Florida |
4 | |||
| Illinois |
2 | |||
| Maryland |
5 | |||
| Minnesota |
7 | |||
| Texas |
4 | |||
| Other states(1) |
11 | |||
| Hyderabad, India |
1 | |||
| (1) | Represents one location in each of 11 states. |
Legal Proceedings
Following a review by the Fed, the FDIC, the OCC and the Office of Thrift Supervision, which we collectively refer to herein as the Banking Agencies, our predecessor, LPS, entered into the Consent Order, dated April 13, 2011, with the Banking Agencies. The Banking Agencies’ review of LPS’ services included the services provided by its default operations to mortgage servicers regulated by the Banking Agencies, including document execution services. The Consent Order does not make any findings of fact or conclusions of wrongdoing, nor does LPS admit any fault or liability. Under the Consent Order, LPS agreed to further study the issues identified in the review and to enhance its compliance, internal audit, risk management and board oversight plans with respect to those businesses. LPS also agreed to engage an independent third party to conduct a risk assessment and review of its default management businesses and document execution services provided to servicers from January 1, 2008 through December 31, 2010.
The document execution review by the independent third party has been on indefinite hold since June 30, 2013 while the Banking Agencies consider what, if any, additional review work they would like the independent third party to undertake. Accordingly, the document execution review has taken, and is likely to continue to take longer to complete than previously anticipated. In addition, the LPS default operations that were subject to the Consent Order were contributed to ServiceLink in connection with the Internal Reorganization. To the extent such third party review, once completed, requires additional remediation of mortgage documents, ServiceLink has agreed to implement an appropriate plan to address the issues. The Consent Order contains various deadlines to accomplish the undertakings set forth therein, including the preparation of a remediation plan following the completion of the document execution review. We or the LPS default operations contributed to ServiceLink will continue to make periodic reports to the Banking Agencies on the progress with respect to each of the undertakings in the Consent Order. The Consent Order does not include any fine or other monetary penalty, although the Banking Agencies have not yet concluded their assessment of whether any civil monetary penalties should be imposed. Although LPS, which was converted to BKIS, is a party to the Consent Order, any potential resulting liability is expected to be borne by the underlying LPS default operations, which are now part of ServiceLink.
124
Table of Contents
Directors and Executive Officers
The following table sets forth certain information regarding the current members of our board of directors and executive officers.
| Name |
Age | Position | ||
| William P. Foley, II |
69 | Executive Chairman | ||
| Thomas J. Sanzone |
54 | President and Chief Executive Officer | ||
| Kevin D. Coop |
50 | President, Data and Analytics | ||
| Michael L. Gravelle |
52 | Executive Vice President, General Counsel and Corporate Secretary | ||
| Jerry L. Halbrook |
53 | President, Origination Technology | ||
| Kirk T. Larsen |
43 | Executive Vice President and Chief Financial Officer | ||
| Joseph M. Nackashi |
51 | Chief Information Officer and President, Servicing Technology | ||
| Anthony Orefice |
54 | Chief Operating Officer | ||
| Daniel Sogorka |
42 | President, RealEC Technologies | ||
| Thomas M. Hagerty |
52 | Director | ||
| David K. Hunt |
68 | Director | ||
| Richard N. Massey |
58 | Director | ||
| Ganesh B. Rao |
38 | Director | ||
| John D. Rood |
59 | Director | ||
| Cary H. Thompson |
58 | Director |
| (1) | Age as of December 15, 2014. |
William P. Foley, II. William P. Foley, II has served as our Executive Chairman since December 2014 and as Executive Chairman of BKFS Operating LLC since January 2014. In addition, Mr. Foley has served as the Executive Chairman of FNF since October 2006 and, prior to that, as Chairman of FNF’s board of directors since 1984. Mr. Foley also served as Chief Executive Officer of FNF from 1984 until May 2007 and as President of FNF from 1984 until December 1994. Since March 2012, Mr. Foley has been the Vice Chairman of the board of directors of FIS. Prior to that, he served as Executive Chairman of FIS from February 2006 through February 2011 and as non-executive Chairman of FIS from February 2011 to March 2012. Mr. Foley served as the Chairman of the board of directors of LPS from July 2008 until March 2009, and, within the past five years, has served as a director of Florida Rock Industries, Inc. Mr. Foley also serves on the board of directors of ServiceLink, the Foley Family Charitable Foundation, Cummer Museum of Arts and Gardens and Remy International, Inc., and is a founder, trustee and director of The Folded Flag Foundation. Mr. Foley also is Chairman, CEO and President of Foley Family Wines Holdings, Inc., which is the holding company of numerous vineyards and wineries located in the U.S. and in New Zealand. After receiving his B.S. degree in engineering from the United States Military Academy at West Point, Mr. Foley served in the U.S. Air Force, where he attained the rank of captain.
Mr. Foley’s qualifications to serve on the BKFS board of directors include his 30 years as a director and executive officer of FNF, his experience as a board member and executive officer of public and private companies in a wide variety of industries, and his strong track record of building and maintaining stockholder value and successfully negotiating and implementing mergers and acquisitions.
Thomas J. Sanzone. Thomas J. Sanzone has served as our President and Chief Executive Officer since December 2014 and served as the Chief Executive Officer of BKFS Operating LLC since January 2014. Mr. Sanzone has more than 25 years of experience in the financial services industry; and has served as chief information officer and chief administration officer at some of the world’s largest global financial institutions. Prior to joining BKFS Operating LLC, Mr. Sanzone was executive vice president at Booz Allen Hamilton from 2011 to 2013.
125
Table of Contents
Mr. Sanzone also served as chief administrative officer at Merrill Lynch from 2007 to 2009. Prior to Merrill Lynch, Mr. Sanzone served as Chief Information Officer and a member of the Executive Board at Credit Suisse, and in various roles at Citigroup and Salomon Brothers. Mr. Sanzone serves on the board of trustees of Hofstra University.
Kevin Coop. Kevin Coop has served as our President of Data and Analytics since December 2014, and as President of Data and Analytics at BKFS Operating LLC since January 2014. Prior to that, Mr. Coop served as Executive Vice President of ServiceLink. Before joining ServiceLink, Mr. Coop served as a director and as President of Interthinx, the financial services division of Verisk Analytics, now a wholly-owned subsidiary of First American Financial Corporation. Prior to that, Mr. Coop served as President of Sysdome since 2001, which was merged with AppIntelligence in 2005 to form Interthinx. Prior to that, Mr. Coop served as Senior Vice President and General Manager of the Realtor and Retail divisions of Move.com from 1998 to 2001.
Michael L. Gravelle. Michael L. Gravelle has served as our Executive Vice President, General Counsel and Corporate Secretary since December 2014 and as the Executive Vice President, General Counsel and Corporate Secretary of BKFS Operating LLC since January 2014. Mr. Gravelle has also served as Executive Vice President, General Counsel and Corporate Secretary of FNF since January 2010. Mr. Gravelle served in the capacity of Executive Vice President, Legal of FNF since May 2006 and Corporate Secretary of FNF since April 2008. Mr. Gravelle joined FNF in 2003, serving as Senior Vice President. Mr. Gravelle joined a subsidiary of FNF in 1993, where he served as Vice President, General Counsel and Secretary beginning in 1996 and as Senior Vice President, General Counsel and Corporate Secretary beginning in 2000. Mr. Gravelle also served as Executive Vice President, Chief Legal Officer and Corporate Secretary of FIS from January 2010 through January 2013, and is serving as Senior Vice President, General Counsel and Corporate Secretary of Remy Internation, Inc. since February 2013.
Jerry Halbrook. Jerry Halbrook has served as our President of Origination Technology since December 2014, and as President of the Origination Technologies division for BKFS Operating LLC since January 2014. Previously, he was Senior Managing Director of the Origination Technology Solutions division for LPS from August 2011 until the Acquisition. Prior to his position at LPS, Mr. Halbrook served as a Senior Managing Director for NexSpring Group, LLC from August 2008 to August 2011. Before joining NexSpring, Mr. Halbrook served as the Chief Information Officer for Bank of America’s Consumer Real Estate and Insurance Services division from August 2006 to August 2008. Prior to joining Bank of America, Mr. Halbrook co-founded Nexstar Financial, a BPO company specializing in end-to-end residential lending, technology and operations management, where he served as Chief Operating Officer and Chief Information Officer until it was acquired by Bank of America. Prior to Nexstar, Mr. Halbrook served in various roles at CitiMortgage, Prudential Home Mortgage and Deloitte & Touche.
Kirk T. Larsen. Kirk T. Larsen has served as our Executive Vice President and Chief Financial Officer since December 2014 and served as the Chief Financial Officer of BKFS Operating LLC since January 2014. Mr. Larsen has also served as the Chief Financial Officer of ServiceLink since January 2014. Prior to joining BKFS Operating LLC, Mr. Larsen served as the Corporate Executive Vice President, Finance and Treasurer of FIS from July 2013 until December 2014 and as Senior Vice President and Treasurer from October 2009 until July 2013. Mr. Larsen joined FIS with the acquisition of Metavante Technologies, Inc. He served as Treasurer and Vice President of Investor Relations of Metavante Corporation from February 2008 to October 2009 and as its Vice President, Financial Planning, Analysis and Investor Relations from August 2007 to February 2008. Prior to joining Metavante Corporation, Mr. Larsen was the Director, Investor Relations and Investments of Rockwell Automation, Inc. and held roles of increasing responsibility with Rockwell Automation, Inc. since 1999. Prior to joining Rockwell Automation, Inc., Mr. Larsen was an audit manager at Ernst & Young LLP.
Joseph M. Nackashi. Joseph M. Nackashi has served as our Chief Information Officer and President of Servicing Technology since December 2014 and as the Chief Information Officer and President of the Servicing & Default Technologies of BKFS Operating LLC since January 2014. Prior to joining BKFS Operating LLC, he served as Executive Vice President and Chief Information Officer of LPS from its spin-off in 2008 until the Acquisition in January 2014. Prior to that, Mr. Nackashi served as Senior Vice President and Chief Technology Officer of FIS and various predecessor entities since 2000.
126
Table of Contents
Anthony Orefice. Anthony Orefice has served as our Chief Operating Officer since December 2014 and as Chief Operating Officer for BKFS Operating LLC since January 2014. Prior to that, Mr. Orefice served as an associate partner at the technology consulting firm Booz Allen Hamilton from 2011 to 2013. Prior to that, Mr. Orefice served as Managing Director and Chief Operating Officer for Global Markets Technology at Bank of America Merrill Lynch, where he was responsible for Merrill Lynch’s Corporate Technology platform from 2007 to 2009; and as Managing Director and Global Head of Prime Finance Technology at Citigroup, where he joined as Director of Fixed Income Sales and Ecommerce Technology
Daniel Sogorka. Daniel Sogorka has served as our President of the RealEC Technologies since December 2014. Mr. Sogorka has served as President of the RealEC Technologies, now a division of BKFS Operating LLC and previously as a division of LPS, since July 2007. Mr. Sogorka joined RealEC Technologies in 2002 and has served as an executive officer since January 2006. Prior to his role as President, Mr. Sogorka served as Vice President from October 2002 to January 2006, as Senior Vice President of Sales from January 2006 to October 2006, and as Co-Chief Operating Officer from October 2006 to July 2007. Before joining RealEC Technologies, Mr. Sogorka held management positions with FNF, Remedial Technologies Network, LLC, and Thermo Electron.
Thomas M. Hagerty. Thomas M. Hagerty has served on our board of directors since December 2014 and served on the board of managers of BKFS Operating LLC since January 2014. In addition, Mr. Hagerty has served as a director of FNF since 2005. Mr. Hagerty is a Managing Director of THL, which he joined in 1988. Mr. Hagerty also serves as a director of Ceridian Holding LLC, Fleetcor Technologies Inc., MoneyGram International, Inc., FIS, First Bancorp and ServiceLink.
Mr. Hagerty’s qualifications to serve on the BKFS board of directors include his managerial and strategic expertise working with large growth-oriented companies as a Managing Director of THL, and his experience in enhancing value at such companies, along with his expertise in corporate finance.
David K. Hunt. David K. Hunt has served on our board of directors since December 2014 and served on the board of managers of BKFS Operating LLC since April 2014. In addition, Mr. Hunt has served as a director of FIS since June 2001 and as a director of LPS from February 2010 until January 2014, when LPS was acquired by FNF. Since December 2005, Mr. Hunt has been a private investor. He previously served as the non-executive Chairman of the Board of OnVantage, Inc. from October 2004 until December 2005. From May 1999 to October 2004, he served as the Chairman and Chief Executive Officer of PlanSoft Corporation, an internet-based business-to-business solutions provider in the meeting and convention industry.
Mr. Hunt’s qualifications to serve on the BKFS board of directors include his long familiarity with our business and industry that he acquired as a director of LPS and FIS, as well as Mr. Hunt’s prior services as chairman of LPS’s risk and compliance committee and his deep understanding of the regulatory environment and other challenges facing our industry.
Richard N. Massey. Richard N. Massey has served on our board of directors since December 2014 and served on the board of managers of BKFS Operating LLC since January 2014. In addition, Mr. Massey has served as a director of FNF since February 2006. Mr. Massey has been a partner of Westrock Capital, LLC, a private investment partnership, since January 2009. Mr. Massey was Chief Strategy Officer and General Counsel of Alltel Corporation from January 2006 to January 2009. From 2000 until 2006, Mr. Massey served as Managing Director of Stephens Inc., a private investment bank, during which time his financial advisory practice focused on software and information technology companies. Mr. Massey also serves as a director of FIS and ServiceLink, as Chairman of the board of directors of Bear State Financial, Inc., and as a director of Oxford American Literary Project and the Arkansas Razorback Foundation.
Mr. Massey’s qualifications to serve on the BKFS board of directors include his experience in corporate finance and investment banking and as a financial and legal advisor to public and private businesses, as well as his expertise in identifying, negotiating and consummating mergers and acquisitions.
127
Table of Contents
Ganesh B. Rao. Ganesh B. Rao has served on our board of directors since December 2014 and served on the board of managers of BKFS Operating LLC since January 2014. Mr. Rao is a Managing Director of THL, which he joined in 2000. Prior to joining THL, Mr. Rao worked at Morgan Stanley & Co. Incorporated in the Mergers & Acquisitions Department. Mr. Rao also worked at Greenlight Capital, a hedge fund. Mr. Rao is currently a director of Ceridian HCM Holding Inc., MoneyGram International, Prime Risk Partners and ServiceLink. Mr. Rao is a former director of The Nielsen Company and Comdata Inc.
Mr. Rao’s qualifications to serve on the BKFS board of directors include his managerial and strategic expertise working with large growth-oriented companies as a Managing Director of THL, a leading private equity firm, and his experience in enhancing value at such companies, along with his expertise in corporate finance.
John D. Rood. John D. Rood has served on our board of directors since December 2014 and served on the board of managers of BKFS Operating LLC since January 2014. In addition, Mr. Rood has served as a director of FNF since April 2013. Mr. Rood is the founder and Chairman of The Vestcor Companies, Inc., a real estate firm with 30 years of experience in multifamily development and investment. From 2004 through 2007, Mr. Rood served as the United States Ambassador to the Commonwealth of the Bahamas. Mr. Rood previously served on the board of directors of Alico, Inc, and currently serves on several private boards, including ServiceLink. He was appointed by Governor Jeb Bush to serve on the Florida Fish and Wildlife Conservation Commission, where he served until 2004, and was appointed by Governor Charlie Crist to the Florida Board of Governors which oversees the State of Florida University System, where he served until 2013.
Mr. Rood’s qualifications to serve on the BKFS board of directors include his experience in the real estate industry, his leadership experience as a United States Ambassador, and his experience as a director on boards of both public and private companies.
Cary H. Thompson. Cary H. Thompson has served on our board of directors since December 2014 and served on the board of managers of BKFS Operating LLC since January 2014. In addition, Mr. Thompson has served as a director of FNF since 1992. Mr. Thompson currently is Vice Chairman of Global Corporate and Investment Banking, Bank of America Merrill Lynch, having joined that firm in May 2008. From 1999 to May 2008, Mr. Thompson was Senior Managing Director and Head of West Coast Investment Banking at Bear Stearns & Co., Inc. Mr. Thompson also serves on the board of directors of SonicWall Corporation and ServiceLink. He served as a director of FIS from February 2006 to July 2008 and as a director of LPS from July 2008 to March 2009.
Mr. Thompson’s qualifications to serve on the BKFS board of directors include his experience in corporate finance and investment banking, his knowledge of financial markets and his expertise in negotiating and consummating financial transactions.
The following is a description of our anticipated governance structure to be adopted and effective upon the completion of this offering:
Board Governance and Independence
Following our initial public offering, FNF, through its wholly-owned subsidiary BKHI, will continue to beneficially own more than 50% of the voting power of our common stock. As a result, we are considered a “controlled company” under the NYSE listing standards. “Controlled companies” under those rules are companies of which more than 50% of the voting power is held by an individual, a group or another company. On this basis, we may avail ourselves of the “controlled company” exception under the NYSE listing standards and we are not subject to the NYSE listing requirements that would otherwise require us to have: (i) a board of directors comprised of a majority of independent directors and (ii) compensation and nominating and corporate governance committees composed entirely of independent directors.
While these exemptions will apply to us as long as we remain a controlled company, we expect that our board of directors will nonetheless consist of a majority of independent directors within the meaning of the NYSE listing
128
Table of Contents
standards currently in effect immediately following the offering. However, we intend to utilize the independence exemption provided for compensation and nominating and corporate governance committees. As a result, immediately following this offering we will not have a compensation or nominating and corporate governance committee composed entirely of independent directors.
Our corporate governance guidelines will provide that after we cease to be a controlled company and following any phase-in period permitted under the NYSE listing standards, our board of directors will comply with all of the NYSE listing standards. Our nominating and corporate governance committee will evaluate our relationships with each director and nominee and make a recommendation to our board of directors as to whether to make an affirmative determination that such director or nominee is independent. Under our corporate governance guidelines, an “independent” director will be one who meets the qualification requirements for being independent under applicable laws and the corporate governance listing standards of the NYSE.
Role of the Board in Risk Oversight
One of the key functions of our board of directors is informed oversight of our risk management process. Our board of directors will administer this oversight function with support from our audit committee, compensation committee and nominating and corporate governance committee, each of which addresses risks specific to its respective areas of oversight, and our risk and compliance committee. Our audit committee will have the responsibility to consider and discuss our major financial risk exposures and the steps our management has taken to monitor and control these exposures, including guidelines and policies to govern the process by which risk assessment and management is undertaken. The audit committee also will monitor compliance with legal and regulatory requirements. Our risk and compliance committee will have the responsibility to assist our board of directors in its oversight of our enterprise-wide risk management framework and review and approve our risk governance policies and procedures. See “—Board Committees—Risk and Compliance Committee” for more information. Our compensation committee will assess and monitor whether any of our compensation policies and programs has the potential to encourage excessive risk-taking.
Board Committees
Prior to the completion of this offering, our board of directors will establish an audit committee, compensation committee, nominating and corporate governance committee and risk and compliance committee. Each committee will operate under a charter approved by our board of directors. Following this offering, copies of each committee’s charter will be posted on the Corporate Governance section of our website, www.bkfs.com.
Audit Committee. The audit committee is currently required to consist of only one director who satisfies the independence requirements under the NYSE listing requirements and Rule 10A-3 under the Exchange Act until the date that is ninety days after the date of this public offering, after which time the audit committee must consist of a majority of directors who satisfy the independence requirements under the NYSE listing requirements and Rule 10A-3 under the Exchange Act. The audit committee is required to consist solely of independent directors by the first anniversary of our initial public offering. Our board of directors has affirmatively determined that Messrs. Hunt and Rood are independent directors under the applicable rules of the NYSE and Rule 10A-3(b)(1) under the Exchange Act. Each member of our audit committee meets the financial literacy requirements under the NYSE listing standards and each member qualifies as an “audit committee financial expert” within the meaning of SEC rules and regulations. The functions of this committee will include, among other things:
| • | evaluating the performance, independence and qualifications of our independent auditors and determining whether to retain our existing independent auditors or engage new independent auditors; |
| • | reviewing and approving the engagement of our independent auditors to perform audit services and any permissible non-audit services; |
| • | reviewing our annual and quarterly financial statements and reports and discussing the statements and reports with our independent auditors and management; |
129
Table of Contents
| • | reviewing with our independent auditors and management significant issues that arise regarding accounting principles and financial statement presentation, and matters concerning the scope, adequacy and effectiveness of our financial controls; |
| • | reviewing with management any earnings announcements before they are issued and reviewing generally with management the nature of the financial information and earnings guidance provided to analysts and ratings agencies and other public announcements regarding material developments; |
| • | establishing procedures for the receipt, retention and treatment of complaints received by us regarding accounting, internal accounting controls or auditing matters and other matters; |
| • | preparing the report of the audit committee that the SEC requires in our annual proxy statement; |
| • | overseeing risks associated with financial matters such as accounting, internal controls over financial reporting and financial policies; |
| • | reviewing and providing oversight with respect to any related party transactions and monitoring compliance with our code of ethics; |
| • | reviewing the adequacy of its charter on an annual basis; |
| • | reviewing and evaluating, at least annually, the performance of the audit committee, including compliance of the audit committee with its charter; |
| • | determining whether to issue shares of Class A common stock or to pay cash in exchange for Units and corresponding shares of Class B common stock; and |
| • | reviewing and approving any potential conflict of interest transactions involving our directors or executive officers, director nominees, any person known by us to be the beneficial owner of more than five percent of any class of our voting securities, or any family member of or related party to such transactions. |
Our audit committee consists of Messrs. Hunt, Rao and Rood. Following this offering, both our independent registered public accounting firm and management personnel will periodically meet privately with our audit committee.
Compensation Committee. Our compensation committee’s functions will include, among other things:
| • | setting salaries and approving incentive compensation awards and equity compensation plan awards; |
| • | reviewing and recommending to our board of directors the compensation and other terms of employment of our executive officers; |
| • | reviewing and approving the corporate goals and objectives relevant to compensation of the company’s CEO, evaluating the CEO’s performance in light of those goals and objectives and determining and approving the CEO’s compensation level based on this evaluation; |
| • | reviewing and recommending to our board of directors performance goals and objectives relevant to the compensation of our executive officers; |
| • | evaluating and approving the equity incentive plans, compensation plans and similar programs advisable for us, as well as modification or termination of existing plans and programs; |
| • | evaluating and recommending to our board of directors the type and amount of compensation to be paid or awarded to board members; |
| • | administering our equity incentive plans; |
| • | reviewing and recommending to our board of directors policies with respect to incentive compensation and equity compensation arrangements that are subject to board approval; |
130
Table of Contents
| • | reviewing the competitiveness of our executive compensation programs and evaluating the effectiveness of our compensation policy and strategy in achieving expected benefits to us; |
| • | evaluating and overseeing risks associated with compensation policies and practices; |
| • | reviewing and recommending to our board of directors the terms of any employment agreements, severance arrangements, change of control protections and any other compensatory arrangements for our executive officers and other members of senior management; |
| • | preparing the report of the compensation committee that the SEC requires in our annual proxy statement; |
| • | reviewing the adequacy of its charter on an annual basis; and |
| • | reviewing and evaluating, at least annually, the performance of the compensation committee, including compliance of the compensation committee with its charter. |
Our compensation committee consists of Messrs. Hagerty, Massey and Thompson.
Nominating and Corporate Governance Committee. Our nominating and corporate governance committee’s functions will include, among other things:
| • | making recommendations to our board directors as to changes to the size of the Board or any committee thereof; |
| • | developing and recommending to the our board directors standards to be applied in making determinations as to the absence of material relationships between the company and a director; |
| • | evaluating, nominating and recommending individuals for membership on our board of directors; |
| • | considering nominations by stockholders of candidates for election to our board of directors; |
| • | establishing procedures to exercise oversight of the evaluation of the board of directors and management; and |
| • | developing a set of corporate governance guidelines, and at least annually review and make any changes to such principles. |
Our nominating and governance committee consists of Messrs. Foley and Hagerty.
Risk and Compliance Committee. The primary functions of the risk and compliance committee include providing oversight of our risk management and compliance efforts, as well as oversight of our material risks. Our risk and compliance committee’s functions include, among other things:
| • | oversight of our enterprise risk management program; |
| • | oversight of our compliance program; |
| • | oversight of the enterprise risk management and compliance functions; |
| • | oversight of our compliance with the requirements of the Consent Order entered into with various federal banking agencies; and |
| • | reporting of risks and compliance matters. |
Our risk and compliance committee consists of Messrs. Hunt, Rao and Rood.
Compensation Committee Interlocks and Insider Participation
The compensation committee is currently composed of Richard N. Massey, Thomas M. Hagerty and Cary H. Thompson. During 2014, no member of the compensation committee was a former or current officer or employee
131
Table of Contents
of the company or any of its subsidiaries. In addition, during 2014, none of our executive officers served (i) as a member of the compensation committee or board of directors of another entity, one of whose executive officers served on our compensation committee, or (ii) as a member of the compensation committee of another entity, one of whose executive officers served on our board.
Code of Business Conduct and Ethics
Prior to the completion of this offering, we will adopt a written code of business conduct and ethics that will apply to our directors, officers and employees, including our principal executive officer, principal financial officer, principal accounting officer or controller, and persons performing similar functions. A copy of the code will be posted on our corporate website, which will be located at www.bkfs.com. Any amendments to our code of conduct will be disclosed on our Internet website promptly following the date of such amendment or waiver.
Corporate Governance Guidelines
Our board of directors will adopt corporate governance guidelines in accordance with the corporate governance rules of the NYSE that serve as a flexible framework within which our board of directors and its committees operate. These guidelines will cover a number of areas including the size and composition of the board, board membership criteria and director qualifications, director responsibilities, board agenda, roles of the Executive Chairman of the Board, Chief Executive Officer and presiding director, meetings of independent directors, committee responsibilities and assignments, board member access to management and independent advisors, director communications with third parties, director compensation, director orientation and continuing education, evaluation of senior management and management succession planning. A copy of our corporate governance guidelines will be posted on our website.
132
Table of Contents
EXECUTIVE AND DIRECTOR COMPENSATION
The following discussion and analysis of compensation arrangements should be read with the compensation tables and related disclosures set forth below. This discussion contains forward-looking statements that are based on our current plans and expectations regarding future compensation programs. Actual compensation programs that we adopt may differ materially from the programs summarized in this discussion.
Compensation Discussion and Analysis
In this compensation discussion and analysis, we provide an overview of our approach to compensating our named executive officers in 2014, including the objectives of our compensation programs and the principles upon which our compensation programs and decisions are based. In 2014, our named executive officers were:
| • | William P. Foley, II, Executive Chairman |
| • | Thomas J. Sanzone, President and Chief Executive Officer |
| • | Kirk T. Larsen, Executive Vice President and Chief Financial Officer |
| • |
| • |
In 2014, Mr. Foley served in a similar capacity for, and received compensation from, each of FNF and ServiceLink, and Mr. Larsen served in similar capacity for, and received compensation from, ServiceLink. During 2014, the compensation committee of our board of directors met in joint sessions with the compensation committees of FNF and ServiceLink and approached compensation-related decisions with respect to Messrs. Foley and Larsen by considering, in the aggregate, Mr. Foley’s service to us, FNF and ServiceLink and Mr. Larsen’s service to us and ServiceLink. The compensation information provided below, and the discussion and analysis thereof, relates only to the services that our named executive officers provided to us in 2014. However, our committee may meet in joint session with the compensation committees of FNF and ServiceLink and may take into account responsibilities our executives have for, and compensation received from, FNF and ServiceLink in making BKFS compensation decisions.
Executive Summary
Prior to our initial public offering, the compensation committee of our board of directors was responsible for reviewing our executive compensation program and determining the compensation of our Executive Chairman, Chief Executive Officer and Chief Financial Officer. Additionally, the compensation committee was responsible for approving grants of any profits interest awards. Following our initial public offering, the compensation committee will be responsible for approving corporate goals and objectives relating to the compensation of our Chief Executive Officer, evaluating our Chief Executive Officer’s performance in light of those objectives, and determining and approving his compensation, as well as setting the salaries and approving the incentive compensation awards and equity compensation awards, as well as compensation policies, for our other executive officers. Although we currently do not intend to alter our compensation objectives, other than as described herein, our compensation committee intends to develop and maintain a compensation framework that is appropriate and competitive for a public company and may establish executive compensation objectives and programs that are different from those currently in place.
Our compensation program for our named executive officers is generally structured to drive performance within our core operations, with a particular focus on long-term results. We have utilized traditional elements of compensation that reflect our company’s overall success, including base salary, annual cash incentives and equity-based incentives. Additionally, we have developed a short-term compensation program that rewards our executive officers for maximizing cost-reductions relating to the Acquisition, which we refer to herein as the Synergy Incentive Program. We believe that our compensation programs promote the success of our company and lead to better financial results, which, in turn, results in better returns for our stockholders.
133
Table of Contents
Our Business Environment
We are a leading provider of integrated technology, workflow automation and data and analytics to the mortgage industry. Our solutions facilitate and automate many of the mission-critical business processes across the entire mortgage loan life cycle, from origination until asset disposition. We believe we differentiate ourselves by the breadth and depth of comprehensive, integrated solutions and the insight we provide to our clients.
We have market leading positions in mortgage processing and technology solutions combined with comprehensive real estate data and extensive analytic capabilities. Our solutions are utilized by 21 of the 25 largest U.S. mortgage originators and all of the 25 largest U.S. mortgage servicers, as well as other financial institutions, investors and real estate professionals, to support mortgage lending and servicing operations, analyze portfolios and properties, operate more efficiently, meet regulatory compliance requirements and mitigate risk.
The U.S. mortgage market is undergoing significant change and mortgage market participants have been subjected to more stringent oversight in recent years. Regulators have increasingly focused on better disclosure, improved risk mitigation and enhanced oversight. Mortgage lenders large and small have experienced higher costs in order to comply with this higher level of regulation. Despite these new regulatory burdens, the mortgage industry remains a competitive marketplace with numerous large lenders and smaller institutions competing for new originations.
Our management team is focused on expanding our business and pursuing growth opportunities. Our strategies for growth include:
| • | Growing revenue by broadening the number of solutions we sell to our existing client base; |
| • | Attracting new clients by leveraging the value proposition provided by our technology platform and comprehensive solutions offering; |
| • | Enhancing what we believe is our leadership position in the industry by continuing to innovate our solutions and refine the insight we provide to our clients; and |
| • | Selectively pursuing strategic acquisitions. |
Our compensation committee believes it is important to reward our executives for strong performance in an industry with significant operational and regulatory challenges, and to incentivize them to continue to take actions to deliver strong results for our investors by expanding our client relationships, continuing to innovate our solutions set and pursuing new market opportunities. At the same time, our compensation committee believes it is important to disincentivize our executives from taking unnecessary risks. The compensation committee believes that our compensation programs are structured to foster these goals.
Our Compensation Programs are Driven by Our Business Objectives
We believe that our executive compensation programs are structured in a manner to support our company and to achieve our business objectives. For 2014, our executive compensation approach was designed with the following goals:
| • | Sound Program Design. We design our compensation programs to fit with our company, our strategy and our culture. There are many facets and considerations that enter into this equation, some of which are discussed below in “—Compensation Best Practices.” Consequently, we aim to deliver a sound compensation program, reflecting a comprehensive set of data points and supporting our success. |
| • | Pay for Performance. We designed our compensation programs so that a substantial portion of our executives’ compensation is tied to our performance. We used pre-defined performance goals for our cash-based annual incentive plan, or the Annual Incentive Plan, and our Synergy Incentive Program to make pay-for-performance the key driver of the cash compensation levels paid to our named executive officers. For 2014, the corporate performance measures for our Annual Incentive Plan included |
134
Table of Contents
| Adjusted Revenue and Adjusted EBITDA. For our Synergy Incentive Program, our objective was to achieve substantial cost savings (that is, reduce operating expenses and increase profitability). These performance measures are key components in the way we and our investors view our operating success and are highly transparent and objectively determinable. In addition, our equity incentives are based upon a material increase in the value of our company. |
| • | Long-term Focus. Long-term incentives, in the form of profits interests, are the largest component of our named executive officers’ total compensation and are designed to drive our long-term strategic business objectives and increase investor value over the long term. In the future, we plan to continue to use long-term incentives as the largest component of our named executive officers’ compensation by granting shares of common stock, restricted stock and/or stock options of the issuer. |
| • | Competitiveness. Total compensation is intended to be competitive in order to attract, motivate, and retain highly qualified and effective executives who can build shareholder value over the long term. The level of pay our compensation committee sets for each named executive officer is influenced by the executive’s leadership abilities, scope of responsibilities, experience, effectiveness and individual performance achievements. |
| • | Incentive Pay Balance. We believe the portion of total compensation contingent on performance should increase with an executive’s level of responsibility. Annual and long-term incentive compensation opportunities should reward the appropriate balance of short- and long-term financial and strategic business results. Long-term incentive compensation opportunities should significantly outweigh short-term cash-based opportunities. Annual objectives should be compatible with sustainable long-term performance. |
| • | Investor Alignment and Risk Assumption. We place a strong emphasis on delivering long-term results for our investors and clients and discourage excessive risk-taking by our executive officers. |
We think the most effective way of accomplishing these objectives is to provide our named executive officers with enough fixed compensation in the form of base salary to disincentivize excessive risk-taking, while providing them with sufficient opportunities in the form of variable compensation that is linked to our annual and long-term strategic goals to align their interests with those of our investors. We believe it is important to deliver strong results for our investors and clients, and we believe our practice of linking compensation with corporate performance will help us to accomplish that goal.
Compensation Best Practices
Our company takes a proactive approach to compensation governance. The compensation committee regularly reviews our compensation programs and makes adjustments that it believes are in the best interests of the company and our investors. As part of this process, our compensation committee reviews compensation trends and considers what is thought to be current best practice with groups such as the proxy advisory firms Institutional Stockholder Services and Glass Lewis, and makes changes in our compensation programs when the committee deems it appropriate, all with the goal of continually improving our approach to executive compensation. Notable best practices that we have adopted include the following:
| • | We set a high ratio of performance-based compensation to total compensation, and a low ratio of non-performance-based compensation, including fixed benefits, perquisites and salary, to total compensation. |
| • | The number and amount of perquisites provided to our named executive officers are minimal. |
| • | We do not provide income tax reimbursements on executive perquisites or other payments. |
| • | We have a policy to clawback any overpayments of incentive-based or equity-based compensation that were attributable to restated financial results. |
135
Table of Contents
| • | Our compensation committee sets maximum levels of awards payable under our cash incentive plan and our equity incentive plan has a limited award pool. |
| • | The re-pricing of profits interests, stock options or any equivalent form of equity incentive is not allowed. |
| • | Our long-term equity incentive awards utilize a vesting schedule of at least two years. |
| • | Our named executive officers’ employment agreements do not contain multi-year guarantees for salary increases, non-performance-based bonuses or guaranteed equity compensation. |
| • | Employment agreements do not allow tax gross-ups for compensation paid due to a change of control and do not contain single trigger severance payment arrangements related to a change of control. |
| • | We have separated the positions of Chief Executive Officer and Executive Chairman. |
| • | Our compensation committee uses an independent compensation consultant who reports solely to the compensation committee and does not provide separate services to management. |
Principal Components of Compensation
We link a significant portion of each named executive officer’s total annual compensation to performance goals that are intended to deliver measurable results. Executives are generally rewarded only when and if the pre-established performance goals are met or exceeded. We also believe that material ownership stakes for executives assists in aligning executives’ interests with those of stockholders and strongly motivates executives to build long-term value. We structure our compensation programs to assist in creating this link.
The following chart illustrates the elements of our named executive officer compensation program in 2014:
| Fixed Compensation |
Short-Term Incentives |
Long-Term Incentive |
Benefits | |||||
| Base Salary |
Short-Term |
Synergy Incentive Program |
Long-Term Equity Incentives |
|||||
| Fixed cash component with annual merit increase opportunity based on individual performance results. Generally represents from % to % of total compensation for the named executive officers. | Annual cash award for profitability, growth and operating strength during the year. | Cash award designed to encourage operating synergies related to the Acquisition, reduce overall operating costs, improve profitability and margins and increase earnings. Participants earn cash incentives if certain cost reduction goals are achieved between July 15, 2013 and December 31, 2015. Achievement of synergy goals is evaluated and incentives are paid on a quarterly basis. | Equity award for significant increase in equity value of the company. Participants share in the equity gain of the company over the fair market value equity valuation at the time of grant. Profits interest awards also support our retention goals, since 50% of the awards vest after two years and the remaining 50% vests after three years. | 401(k) plan; employee stock purchase plan; deferred compensation plan; and limited perquisites. | ||||
|
|
|
Link To Performance |
|
|||||
| Individual performance | Adjusted Revenue and Adjusted EBITDA | Cost savings | Future growth in equity value | |||||
136
Table of Contents
The principal components of our executive compensation program were base salaries, annual cash incentives, which include cash awards under the Black Knight Financial Services, LLC Incentive Plan dated January 1, 2014, or the Cash Incentive Plan, and Grant Units under the 2013 Management Incentive Plan, or the Equity Incentive Plan. We refer to the Equity Incentive Plan and the Cash Incentive Plan collectively as the Plans. In 2014, our compensation committee placed heavy emphasis on the at-risk, performance-based components of performance-based cash incentives and long-term equity incentives. The compensation committee determined the appropriate value of each of these components of compensation after considering each executive’s level of responsibility, the individual skills, experience and potential contribution of each executive, and the ability of each executive to impact company-wide performance and create long-term value. As shown in the table below, more than % of total compensation was based on performance-based incentives. Benefits comprised less than % of total compensation.
The compensation committee believes a significant portion of an executive officer’s compensation should be allocated to compensation that effectively aligns the interests of our executives with the long-term interests of our investors. The committee also believed it was extremely important for our executives to take actions to achieve the cost savings goals associated with the Acquisition. Consequently, for 2014, a significant majority of our named executive officers’ total compensation was provided in the form of long-term equity incentives and cash incentives under the Synergy Incentive Program.
The following table shows the allocation of 2014 Total Compensation for our named executive officers, as reported in the Summary Compensation Table below, among the various components. The compensation committee believed this allocation to be appropriate after consideration of the factors described above.
| Salary |
Cash Incentive Award |
Synergy |
Profits Interest |
Benefits & |
Performance- Based |
Total | ||||||||
| William P. Foley, II |
||||||||||||||
| Thomas J. Sanzone |
||||||||||||||
| Kirk T. Larsen |
Base Salary
Base salaries reflect the fixed component of the compensation for an executive officer’s ongoing contribution to the operating performance of his or her area of responsibility. We provide our named executive officers with base salaries that are intended to provide them with a level of assured, regularly paid cash compensation that is competitive and reasonable. Our compensation committee reviews salary levels annually as part of our performance review process, as well as in the event of promotions or other changes in our named executive officers’ positions or responsibilities. When establishing base salary levels, our compensation committee considers the peer compensation data provided by our compensation consultant, Strategic Compensation Group, or SCG, as well as a number of qualitative factors, including the named executive officer’s experience, knowledge, skills, level of responsibility and performance.
Annual Performance-Based Cash Incentive
In 2014, we awarded annual cash incentive opportunities to our named executive officers under our Cash Incentive Plan. We use the Cash Incentive Plan to provide a form of at-risk, performance-based pay that is focused on achievement of critical, objectively measureable, annual financial objectives. The 2014 annual cash incentives were conditioned upon the achievement of pre-defined financial objectives, which were determined by our compensation committee. The Annual Incentive Plan plays an important role in our approach to total compensation. It motivates participants to work hard and proficiently toward improving our operating performance for a fiscal year, and it requires that we achieve defined annual financial performance goals before participants become eligible for an incentive payout. We believe that achieving our financial objectives is important to executing our business strategy, strengthening our services and solutions, improving client
137
Table of Contents
satisfaction and gaining new clients and delivering long term value to our stockholders. In addition, the cash incentive program helps to attract and retain a highly qualified workforce and to maintain a market competitive compensation program.
In the second quarter of 2014, our compensation committee approved the 2014 fiscal year financial performance objectives and a target incentive opportunity for Messrs. Foley, Sanzone and Larsen, as well as the potential incentive opportunity range for maximum and threshold performance. No annual incentive payments are payable to an executive officer if the pre-established, minimum performance levels are not met, and payments are capped at the maximum performance payout level. Award targets under the Annual Incentive Plan were established by our compensation committee as described above for our executive officers as a percentage of each individual’s base salary.
The amount of the annual incentives actually paid depends on the level of achievement of the pre-established goals as follows:
| • | If threshold performance is not achieved, no incentive will be paid. |
| • | If threshold performance is achieved, the incentive payout will equal 50% of the executive officer’s target incentive opportunity. |
| • | If target performance is achieved, the incentive payout will equal 100% of the executive officer’s target incentive opportunity. |
| • | If maximum performance is achieved, the incentive payout will equal 200% of the executive officer’s target incentive opportunity, except for Mr. Foley, whose maximum incentive payout is equal to 300% of his target incentive opportunity. |
| • | Between these levels, the payout is prorated. |
Threshold performance levels were established to challenge our executive officers. Maximum performance levels were established to limit short-term incentive awards so as to avoid excessive compensation while encouraging executives to reach for performance beyond the target levels. An important tenet of our pay for performance philosophy is to utilize our compensation programs to motivate our executives to achieve performance levels that reach beyond what is expected of us as a company.
Target performance levels are intended to be difficult to achieve, but not unrealistic. The performance targets were based on discussions between management and our compensation committee. In setting 2014 performance metrics, our compensation committee considered the following:
| • | consistency among the 2014 performance targets and the 2014 business plan; |
| • | the planned effect of cost reductions in connection with the Acquisition; and |
| • | the effect that reaching performance targets would have on our growth and margins. |
The 2014 performance metrics were Adjusted Revenue and Adjusted EBITDA. These performance metrics are among the most important measures in evaluating the financial performance of our business, and they can have a significant impact on long-term value creation and the investing community’s expectations. These annual incentive performance goals are synchronized with our annual budget, our long-term financial plan, and our
138
Table of Contents
board of managers’ expectations. In the following table, we explain how we calculate the performance measures and why we use them
| Performance Measure |
How Calculated |
Reason for Use | ||
| Adjusted Revenue |
Based on GAAP Revenue reported in the annual financial statements, adjusted for the effect of acquisitions, divestitures and purchase accounting. | Adjusted Revenue is an important measure of the growth of the company, our ability to satisfy our clients and gain new clients and the effectiveness of our services and solutions. Adjusted Revenue is widely followed by investors. | ||
| Adjusted EBITDA |
GAAP Operating Income, excluding depreciation and amortization from continuing operations, adjusted for certain other non-recurring revenue and expense items, including those related to or resulting from the Acquisition. | Adjusted EBITDA reflects our operating strength and efficiency. It also reflects our ability to convert our revenue into operating profits for stockholders. Adjusted EBITDA is a common basis for enterprise valuation by investment analysts and is widely followed by investors. | ||
Final calculations are subject to adjustment for acquisitions, divestitures, major restructuring charges and non-budgeted discontinued operations. The performance targets for 2014 have been adjusted to include the contribution of Property Insight, LLC from FNF to BKFS on June 2, 2014. This adjustment affected the 2014 performance metrics by increasing the Adjusted Revenue target by $37.7 million and the Adjusted EBITDA target by $4.7 million.
Set forth below are the relative percentage weights of the 2014 performance metrics, the threshold, target and maximum performance levels for each performance metric and 2014 performance results. For information on the ranges of possible payments under our Cash Incentive Plan, see “—Grants of Plan-Based Awards” under the column Estimated Possible Payouts Under Non-Equity Incentive Plan Awards.
| Performance Metric |
Weight |
Threshold |
Target |
Maximum |
Results | |||||
| Adjusted Revenue |
40% | $803.7 million | $828.6 million | $853.5 million | ||||||
| Adjusted EBITDA |
60% | $328.0 million | $338.1 million | $348.2 million |
For 2014, we assigned a relative percentage weight of 40% to the Adjusted Revenue performance metric and 60% to the Adjusted EBITDA performance metric. The percentage weight of each performance metric equates to the maximum percentage of incentive awards payable upon achieving the threshold, target or maximum performance level determined for such performance metric. The relative percentage weights for the performance metrics sum to 100%, and therefore 100% of the annual incentive awards would potentially be payable if target performance levels were achieved for both of the 2014 performance metrics. For illustrative purposes, if 2014 Adjusted Revenue was less than $803.7 million and we missed our 2014 threshold Adjusted Revenue performance level and 2014 Adjusted EBITDA was $338.1 million and we achieved our 2014 target Adjusted EBITDA performance level, our executive officers entitled to 2014 incentive awards would have potentially received a maximum of 60% of their target award, since the 2014 Adjusted EBITDA performance metric was assigned a relative percentage weight of 60%.
Messrs. Foley’s and Larsen’s annual cash incentives under the Cash Incentive Plan are subject to reduction if the amounts they receive in a calendar year under long-term incentive awards that were awarded by FNF for services they performed for other FNF affiliates, which we refer to herein as LTIP Awards, exceed their annual cash
139
Table of Contents
incentives under the Cash Incentive Plan. If so exceeded, Mr. Foley’s annual incentive under the Cash Incentive Plan is reduced to zero and Mr. Larsen’s is reduced by 50%. Messrs. Sanzone, and did not receive LTIP Awards in 2014.
The table below shows each named executive officer’s 2014 target incentive opportunity, the initial calculation of their 2014 incentive awards based on the 2014 performance results, and the amounts actually paid under the Cash Incentive Plan after applying the reduction under the LTIP Awards.
| Name |
2014 Base Salary |
2014 Annual Incentive Target |
2014 Incentive Pay Target |
Actual Performance Multiplier |
2014 Total Incentive Earned |
2014 Reduced Incentive Paid | ||||||
| William P. Foley, II |
||||||||||||
| Thomas J. Sanzone |
||||||||||||
| Kirk T. Larsen |
Under certain of our executive officers’ employment agreements, we may recoup all or a portion of any bonus paid if, after payment, there is a finding of fraud, a restatement of financial results, or errors or omissions that our compensation committee determines negatively affects or calls into question the business results on which the bonus was based.
Long-Term Equity Incentives
In 2014, we used our Equity Incentive Plan to grant long-term incentive awards in the form of Grant Units. The underlying principles of our 2014 equity incentive program were to motivate, incentivize and reward management for building towards our long-term financial goals and delivering significant financial return to our stockholders. As an LLC taxed as a partnership under U.S. federal income tax laws, our approach to long-term equity incentives in 2014 involved delivering to our employees and managers Grant Units in BKFS Operating LLC that were intended to qualify as “profits interests” for U.S. federal income tax purposes. Similar to a stock option, the Grant Units only have value to the extent the equity value of BKFS Operating LLC increases after issuance.
The Grant Units generally vest over a period of three years, with 50% vesting on the second anniversary of grant and the remaining 50% vesting on the third anniversary of grant, subject to the continued service of the awardee, and are subject to the terms and conditions of the Equity Incentive Plan and the Amended and Restated Limited Liability Company Agreement of BKFS Operating LLC. At the election of a Grant Unit holder, vested Grant Units may be converted into the right to receive a number of Units based on the value of BKFS Operating LLC above the specified hurdle amount in respect of such Grant Units, which can then be immediately exchanged for, at the issuer’s option, either shares of our Class A common stock on a one-for-one basis, according to the terms of BKFS Operating LLC’s Limited Liability Company Agreement, or a cash payment.
Our compensation committee considers several qualitative and quantitative factors when determining equity incentive award levels, and ultimately uses its judgment when determining the terms of individual awards. The factors the committee considers include the following:
| • | an analysis of competitive marketplace compensation data provided to our compensation committee by our compensation consultant; |
| • | the executive officer’s level of responsibility and ability to influence our performance; |
| • | the executive officer’s level of experience, skills and knowledge; |
| • | the need to retain and motivate highly talented executive officers; |
| • | corporate governance considerations related to executive officer compensation; and |
| • | our current business environment, objectives and strategy. |
140
Table of Contents
While our compensation committee considered each of the factors set forth above in arriving at the specific awards granted to each of our named executive officers in 2014, its determination was not formulaic; rather, our compensation committee exercised its discretion to make decisions based on the totality of the factors, including the significant financial return that our officers returned to our stockholders.
For information about the grant date fair values of the Grant Units granted to our named executive officers in 2014, see “—Summary Compensation Table.” The grant date fair values reflect the potential future value of the Grant Units. The actual amounts realized by our named executive officers with respect to the Grant Units may be greater or less than the fair value estimates. Further details concerning the Grant Units made to our named executive officers in 2014, including the number of Grant Units awarded, are provided in the table and related footnotes under “—Grants of Plan-Based Awards” below.
Synergy Incentive Program
In January 2014, we adopted the Synergy Incentive Program under our Cash Incentive Plan pursuant to which employees and other individuals, including our named executive officers, were provided the opportunity to earn cash incentives if certain cost reduction goals were achieved between July 15, 2013 and December 31, 2015. The Synergy Incentive Program was implemented in order to help us achieve operating synergies related to the Acquisition, reduce overall operating costs, improve profitability and margins, increase earnings, meet or exceed investor expectations, and possibly have a positive impact on our valuation. The Synergy Incentive Program operates in tandem with an identical program adopted in January 2014 by ServiceLink. The following discussion, including the discussion of the incentive pool formula and individual incentive opportunities, relates collectively to our Synergy Incentive Program and ServiceLink’s. However, the incentive opportunities and amounts earned in 2014 by our named executive officers and set forth in the Grants of Plan-Based Awards table and the Summary Compensation Table only include the amounts earned under our Synergy Incentive Program.
Under the combined programs, no incentive is earned until combined annualized cost savings at BKFS and ServiceLink equal at least $100 million. After reaching the $100 million threshold, an incentive pool is funded at 20% of the cost savings between $100 million and $150 million, at 30% of the cost savings between $150 and $200 million, at 40% of the cost savings between $200 and $250 million, and at 50% of the cost savings between $250 and $350 million. No incentive is paid for cost savings above $350 million. Incentives under the Synergy Incentive Program are earned and paid on a quarterly basis, starting with the quarter ending on March 31, 2014. Participants have to be employed at the time of payment in order to receive a payment.
Our compensation committee approved the following allocations of the combined incentive pools under the programs: Mr. Foley %; Mr. Sanzone %; Mr. Larsen %; Mr. %; and Mr. %. These allocations were selected by our compensation committee based on its judgment of each named executive officer’s ability to impact the achievement of the programs’ objectives. As of September 30, 2014, our compensation committee determined that cost savings of $295.7 million had been achieved under the combined programs, and a total of $ million in incentives had been earned by our named executive officers under our Synergy Incentive Program. The achieved savings as of September 30, 2014 were validated by the FNF internal audit services division and an independent accounting firm. For further information on bonuses earned by each of our named executive officers in 2014 under the Synergy Incentive Program, see “—Summary Compensation Table.”
Our compensation committee has the final authority to determine whether a specific cost reduction qualifies as cost savings under the Synergy Incentive Program. We have a right to recoup, or clawback, from participants of the Synergy Incentive Program any payments made if cost savings are recalculated to an amount that is less than the cost savings used for the calculation of the prior bonus payments.
We expect that the Synergy Incentive Program will be terminated prior to the offering, effective December 31, 2014.
141
Table of Contents
Benefit Plans
We provide retirement and other benefits to our U.S. employees under a number of compensation and benefit plans. Our named executive officers generally participate in the same compensation and benefit plans as our other executives and employees. In addition, our named executive officers are eligible to participate in broad-based health and welfare plans. We do not offer pensions or supplemental executive retirement plans for our named executive officers.
401(k) Plan. FNF sponsors a defined contribution savings plan that is intended to be qualified under Section 401(a) of the Internal Revenue Code, which all of our employees in the United States, including our named executive officers, are eligible to participate in. The plan contains a cash or deferred arrangement under Section 401(k) of the Internal Revenue Code. Participating employees may contribute up to 40% of their eligible compensation, but not more than statutory limits, generally $17,500 in 2014. We made matching contributions for the benefit of our named executive officers in 2014 of approximately $ thousand.
A participant may receive the value of his or her vested account balance upon termination of employment. A participant is always 100% vested in his or her voluntary contributions. Vesting in matching contributions, if any, occurs proportionally each year over three years based on continued employment with us.
ESPP. In 2014, our employees, including our named executive officers, had the opportunity to participate in FNF’s Employee Stock Purchase Plan, or FNF ESPP, a program through which our executives and employees can purchase shares of FNF Group common stock through payroll deductions and through matching employer contributions. Participants may elect to contribute between 3% and 15% of their salary into the FNF ESPP through payroll deduction. At the end of each calendar quarter, we make a matching contribution to the account of each participant who has been continuously employed by us or a participating subsidiary for the last four calendar quarters. For most employees, matching contributions are equal to 1/3 of the amount contributed during the quarter that is one year earlier than the quarter in which the matching contribution is made. For certain officers, including our named executive officers, and for employees who have completed at least ten consecutive years of employment with us, the matching contribution is 1/2 of such amount. In 2014, the matching contributions, together with the employee deferrals, were used to purchase shares of FNF common stock on the open market.
Deferred Compensation Plan. We provide our named executive officers, as well as other key employees, with the opportunity to defer receipt of their compensation under a nonqualified deferred compensation plan. None of our named executive officers elected to defer 2014 compensation into the plan.
Health and Welfare Benefits. We sponsor various broad-based health and welfare benefit plans for our employees. We provide all our employees, including our named executive officers, with basic life insurance and the option for additional life insurance. The taxable portion of the premiums on this additional life insurance for our named executive officers is reflected below under “—Summary Compensation Table” under the column “All Other Compensation” and related footnote.
Other Benefits. We provide few perquisites to our executives. In general, the perquisites provided are intended to help our executives be more productive and efficient and to protect us and the executive from certain business risks and potential threats. The compensation committee regularly reviews the perquisites provided to our executive officers. Further detail regarding executive perquisites in 2014 can be found in the “—Summary Compensation Table” under the column “All Other Compensation” and the related footnote.
Establishing Executive Compensation Levels
We operate in a highly competitive industry and compete with our peers and competitors to attract and retain highly skilled executives within that industry. To attract and retain talented executives with the leadership
142
Table of Contents
abilities and skills necessary for building long-term value, motivate our executives to perform at a high level and reward outstanding achievement, our executives’ compensation levels are set at levels that our compensation committee believes to be competitive in our market.
In 2014, our named executive officers’ base salaries and annual cash incentive target payout levels were set in accordance with the terms of their employment agreements. The employment agreements were negotiated documents between each executive and the company and our new investors, and are described further under “—Employment Agreements” below.
When determining the value of the base salary and cash and equity incentives under the Plans, each of our named executive officers would receive, our compensation committee considered a number of important qualitative and quantitative factors including:
| • | the executive officer’s experience, knowledge, skills, level of responsibility and potential to influence our company’s performance; |
| • | the business environment and our business objectives and strategy; |
| • | the executive’s ability to impact the company’s achievement of the goals for which the compensation program was designed, including achieving the company’s long-term financial goals, increasing investor value and achieving cost savings and efficiencies following the Acquisition; and |
| • | whether corporate governance and regulatory factors related to executive compensation, including discouraging our name executive officers from taking unnecessary risks. |
Our compensation decisions are not formulaic, and the members of our compensation committee did not assign precise weights to the factors listed above. Our compensation committee utilized their individual and collective business judgment to review, assess, and approve compensation for our named executive officers.
The Use of a Peer Group
In connection with our compensation committee’s consideration of the long-term equity incentives and cash bonus opportunities for our executives in 2014, the compensation committee received a report from PricewaterhouseCoopers LLP, or PwC, analyzing Mr. Foley’s, Mr. Sanzone’s and Mr. Larsen’s overall compensation levels relative to the peer group of LPS, our predecessor company. Although PwC looked at the overall compensation for these executives, including base salary, annual cash incentive, long-term equity incentive and cash incentive under the Synergy Incentive Program, we did not target total compensation or individual components to a particular level relative to the market or our peers. The compensation committee used the peer group data only as a point of reference to assess the competitiveness of our executives’ compensation levels. Compensation data for the peer group companies were gathered from public filings. PwC’s analysis indicated that our executive officers’ overall compensation generally fell within the 50th to 75th percentiles of the peer group companies.
143
Table of Contents
The peer group consisted of the following companies:
| Fiserv, Inc. |
Adobe Systems Incorporated | |
| Intuit Inc. |
Unisys Corporation | |
| CACI International, Inc. |
Alliance Data Systems Corp. | |
| Citrix Systems, Inc. |
ManTech International Corporation | |
| DST Systems, Inc. |
Broadridge Financial Solutions, Inc. | |
| Global Payments Inc. |
Paychex, Inc. | |
| Equifax Inc. |
Heartland Payment Systems, Inc. | |
| Convergys Corporation |
Total System Services, Inc. | |
| CoreLogic, Inc. |
Autodesk, Inc. | |
| Fidelity National Information Services, Inc. |
||
Employment Agreements and Post-Termination Compensation and Benefits
We have entered into employment agreements with each of our named executive officers. These agreements provide us and the executives with certain rights and obligations following a termination of employment, and in some instances, following a change of control. We believe these agreements are necessary to protect our legitimate business interests, as well as to protect the executives in the event of certain termination events.
Role of Compensation Committee, Compensation Consultant and Executive Officers
Prior to the offering, our compensation committee was responsible for:
| • | Approving corporate goals and objectives relevant to the compensation of the Executive Chairman, Chief Executive Officer and Chief Financial Officer, evaluating the Executive Chairman’s, Chief Executive Officer’s and Chief Financial Officer’s performance in light of those goals and objectives and approving the Executive Chairman’s, Chief Executives Officer’s and Chief Financial Officer’s compensation based on such evaluation; |
| • | Approving grants of any profits interest awards under our Plans, as well as any new or amended Plans, and repurchases of any equity under the terms of BKFS Operating LLC’s Limited Liability Company Agreement and/or our Equity Incentive Plan; and |
| • | Approving any new or amended employment agreements (including change of control and severance agreements) with the Executive Chairman, Chief Executive Officer and/or Chief Financial Officer. |
To further the objectives of our compensation program, our compensation committee engaged SCG, an independent compensation consultant, to assist the committee with reviewing our compensation programs for our named executive officers and other key executives and our board of directors. The consultant is engaged to evaluate our compensation programs, and to suggest changes to our existing compensation programs or new programs, with alternatives for the committee to consider. The consultant also evaluates the compensation levels and pay mix for our executives, and makes recommendations with respect to target compensation values for the various components of our executive compensation programs. SCG was selected by our compensation committee, reported directly to the committee, received compensation only for services related to executive compensation issues, and neither it nor any affiliated company provided any other services to us.
Our Executive Chairman participated in the 2014 executive compensation process by making recommendations with respect to equity-based incentive compensation awards. Our Chief Executive Officer, Mr. Sanzone, made
144
Table of Contents
recommendations with respect to his direct reports. In addition, Mr. Gravelle, our Executive Vice President, General Counsel and Corporate Secretary, coordinated with our compensation committee members and the consultant in preparing the committee’s meeting agendas and, at the direction of the committee, assisted SCG in gathering our financial information and information on our executives’ existing compensation arrangements for inclusion in SCG’s reports to our compensation committee. Our executive officers do not make recommendations to our compensation committee with respect to their own compensation.
While our compensation committee carefully considers the information provided by, and the recommendations of, SCG and the individuals who participate in the compensation process, our compensation committee retains complete discretion to accept, reject or modify any compensation recommendations.
Tax and Accounting Considerations
Our compensation committee considers the impact of tax and accounting treatments when determining executive compensation.
Section 162(m) of the Internal Revenue Code places a limit of $1,000,000 on the amount that can be deducted in any one year for compensation paid to certain executive officers. There is, however, an exception for certain performance-based compensation. Our compensation committee takes the deduction limitation under Section 162(m) into account when structuring and approving awards under the Plans. However, our compensation committee may approve compensation that will not meet these requirements.
Our compensation committee also considers the accounting impact when structuring and approving awards. We account for share-based payments, including long-term incentive grants, in accordance with ASC Topic 718, which governs the appropriate accounting treatment of share-based payments under GAAP.
Summary Compensation Table
The following table sets forth certain information with respect to compensation awarded to, earned by or paid to our Chief Executive Officer, our Chief Financial Officer and our three other most highly compensated executive officers for the year ended December 31, 2014.
| Name and Principal Position |
Year | Salary ($) |
Bonus ($) |
Awards of Grant Units ($) |
Non-Equity Incentive Plan Compensation ($) |
All Other Compensation ($) |
Total ($) | |||||||||
| Thomas J. Sanzone |
2014 | |||||||||||||||
| Kirk T. Larsen |
2014 | |||||||||||||||
| William P. Foley, II |
2014 | |||||||||||||||
145
Table of Contents
Grants of Plan-Based Awards
The following table sets forth information concerning awards granted to the named executive officers during the fiscal year ended December 31, 2014.
|
Estimated Future Payouts |
Estimated Future Payouts Under Equity Incentive Plan Awards (#) |
Exercise or Base Price of Grant Unit Awards ($/Unit) |
Grant Date Fair Value of Grant Unit Awards ($) | |||||||||||
| Name |
Grant Date | Threshold ($) |
Target ($) |
Maximum ($) |
||||||||||
| Thomas J. Sanzone |
||||||||||||||
| Kirk T. Larsen |
||||||||||||||
| William P. Foley, II |
||||||||||||||
Salary and Bonus in Proportion to Total Compensation
The “Compensation Discussion and Analysis” section contains a table showing the proportion of our named executive officers’ salary to total compensation for 2014.
Outstanding Equity Awards at Fiscal year End
The following table sets forth certain information with respect to outstanding equity awards held by our named executive officers at December 31, 2014.
| Grant Unit Awards | ||||||||
| Name |
Number of Grant Units That Have Not Vested (#) |
Market Value of Grant Units That Have Not Vested ($) |
Equity Incentive Plan Awards: Number of Grant Units That Have Not Vested (#) |
Equity Incentive Plan Awards: Market Value or Payout Value of Unearned Grant Units That Have Not Vested (#) | ||||
| Thomas J. Sanzone |
||||||||
| Kirk T. Larsen |
||||||||
| William P. Foley, II |
||||||||
Nonqualified Deferred Compensation
In the year ended December 31, 2014, our named executive officers received no nonqualified deferred compensation and had no deferred compensation balances.
Employment Agreements
We have entered into employment agreements with all of our named executive officers. Additional information regarding post-termination benefits provided under these employment agreements can be found under “—Potential Payments Upon Termination or Change of Control” below.
146
Table of Contents
William P. Foley, II
We entered into a three-year employment agreement with Mr. Foley, effective January 10, 2014, to serve as our Executive Chairman, with a provision for automatic annual extensions beginning on the first anniversary of the effective date and continuing thereafter unless either party provides timely notice that the term should not be extended. The employment agreement provides that we will pay Mr. Foley a base salary of no less than $ per year, and that Mr. Foley is eligible for an annual incentive bonus opportunity under the Annual Incentive Plan. Under the agreement, Mr. Foley’s annual cash incentive target shall be no less than % of his annual base salary, with amounts payable depending on performance relative to targeted results. Mr. Foley is entitled to the benefits we provide to our other employees generally except medical benefits, which he receives from FNF.
In addition, Mr. Foley’s employment agreement provides that he is eligible to participate in our synergy and profits interest incentive plans. On January 9, 2014, 2014, Mr. Foley received Grant Units with a hurdle amount of $1.0 billion, which is based upon the equity value of BKFS at the time of issuance. The Grant Units entitle Mr. Foley to a proportionate share, together with other common unit holders, of any value in excess of the $1.0 billion hurdle amount, subject to adjustment if additional capital contributions are made by the other stockholders of BKFS. Mr. Foley received these Grant Units on the same other general terms provided to our other senior management. The Grant Units vest 50% on the second anniversary and 100% on the third anniversary of the applicable grant date and fully accelerate upon a change in control. Mr. Foley is also participating in the Synergy Incentive Program.
Mr. Foley’s employment agreement also provides that, if any payments or benefits to be paid to Mr. Foley pursuant to the terms of the employment agreement would be subject to the excise tax imposed by Section 4999 of the Internal Revenue Code, then Mr. Foley may elect for such payments to be reduced to one dollar less than the amount that would constitute a “parachute payment” under Section 280G of the Internal Revenue Code; and that if Mr. Foley does not elect to have such payments so reduced, Mr. Foley is responsible for payment of any excise tax resulting from such payments and shall not be entitled to a gross-up payment under his employment agreement
Mr. Foley’s employment agreement contains provisions related to the payment of benefits upon certain termination events. The details of these provisions are set forth under “—Potential Payments Upon Termination or Change of Control” below.
Thomas J. Sanzone
We entered into a three-year amended and restated employment agreement with Mr. Sanzone, effective January 3, 2014, to serve as our Chief Executive Officer and President, with a provision for automatic annual extensions on the second anniversary of the effective date and for an additional year each anniversary thereafter unless either party gives written notice to the other not to extend the employment term at least 90 days prior to the conclusion of the then-current employment term. The employment agreement provides that we will pay Mr. Sanzone a base salary of no less than $ per year, and that Mr. Sanzone is eligible for an annual incentive bonus opportunity under the Annual Incentive Plan, with amounts payable depending on performance relative to targeted results. For the period from January 3, 2014 through the remainder of his employment term, Mr. Sanzone’s target bonus is set at % of his base salary, with a maximum of up to % of his base salary. Mr. Sanzone is entitled to the benefits we provide to our other employees generally.
In addition, Mr. Sanzone’s employment agreement provides that he is eligible to participate in our synergy and profits interest incentive plans. On January 9, 2014, Mr. Sanzone received Grant Units with a hurdle amount of $1.0 billion, and on October 29, 2014, Mr. Sanzone received an additional Grant Units with a hurdle amount of $1,522,358,000. The hurdle amounts are based upon the equity value of BKFS at the time of issuance. The Grant Units entitle Mr. Sanzone to a proportionate share, together with other common unit holders, of any value in excess of the respective hurdle amounts, subject to adjustment if additional capital contributions are made by the other stockholders of BKFS. Mr. Sanzone received these Grant Units on the same other general
147
Table of Contents
terms provided to our other senior management. The Grant Units vest 50% on the second anniversary and 100% on the third anniversary of the applicable grant date and fully accelerate upon a change in control. Mr. Sanzone is also participating in the Synergy Incentive Program.
Mr. Sanzone’s employment agreement also provides that, if any payments or benefits to be paid to Mr. Sanzone pursuant to the terms of the employment agreement would be subject to the excise tax imposed by Section 4999 of the Internal Revenue Code, then Mr. Sanzone may elect for such payments to be reduced to one dollar less than the amount that would constitute a “parachute payment” under Section 280G of the Internal Revenue Code; and that if Mr. Sanzone does not elect to have such payments so reduced, Mr. Sanzone is responsible for payment of any excise tax resulting from such payments and shall not be entitled to a gross-up payment under his employment agreement.
Mr. Sanzone’s employment agreement contains provisions related to the payment of benefits upon certain termination events. The details of these provisions are set forth under “—Potential Payments Upon Termination or Change of Control” below.
Kirk T. Larsen
We entered into a two-year amended and restated employment agreement with Mr. Larsen, effective January 3, 2014, to serve as our Chief Financial Officer. Under the terms of the agreement, Mr. Larsen’s minimum annual base salary is $ and Mr. Larsen is eligible for an annual incentive bonus opportunity under the Annual Incentive Plan, with amounts payable depending on performance relative to targeted results. For the period from January 3, 2014 through the remainder of his employment term, Mr. Larsen’s target bonus is set at % of his base salary, with a maximum of up to % of his base salary. Mr. Larsen is entitled to the benefits we provide to our other employees generally.
In addition, Mr. Larsen’s employment agreement provides that he is eligible to participate in our synergy and profits interest incentive plans. On January 9, 2014, Mr. Larsen received Grant Units with a hurdle amount of $1.0 billion, which is based upon the equity value of BKFS at the time of issuance. The Grant Units entitle Mr. Larsen to a proportionate share, together with other common unit holders, of any value in excess of the $1.0 billion hurdle amount, subject to adjustment if additional capital contributions are made by the other stockholders of BKFS. Mr. Larsen received these Grant Units on the same other general terms provided to our other senior management. The Grant Units vest 50% on the second anniversary and 100% on the third anniversary of the applicable grant date. Mr. Larsen is also participating in the Synergy Incentive Program.
Mr. Larsen’s employment agreement also provides that, if any payments or benefits to be paid to Mr. Larsen pursuant to the terms of the employment agreement would be subject to the excise tax imposed by Section 4999 of the Internal Revenue Code, then Mr. Larsen may elect for such payments to be reduced to one dollar less than the amount that would constitute a “parachute payment” under Section 280G of the Internal Revenue Code; and that if Mr. Larsen does not elect to have such payments so reduced, Mr. Larsen is responsible for payment of any excise tax resulting from such payments and shall not be entitled to a gross-up payment under his employment agreement.
Mr. Larsen’s employment agreement contains provisions related to the payment of benefits upon certain termination events. The details of these provisions are set forth under “—Potential Payments Upon Termination or Change of Control” below.
Potential Payments Upon Termination or Change of Control
In this section, we discuss the nature and estimated value of payments and benefits we would provide to our named executive officers in the event of termination of employment or a change of control. The amounts described in this section reflect amounts that would have been payable under (i) our plans, and (ii) where
148
Table of Contents
applicable, with respect to the named executive officers, their employment agreements if their employment had terminated on December 31, 2014.
For the named executive officers, the types of termination situations include a voluntary termination by the executive, with or without good reason, a termination by us either for cause or not for cause and termination in the event of disability or death. We also describe the estimated payments and benefits that would be provided upon a change of control without a termination of employment. The actual payments and benefits that would be provided upon a termination of employment would be based on the named executive officers’ compensation and benefit levels at the time of the termination of employment and the value of accelerated vesting of equity awards would be dependent on the value of the underlying Grant Units.
For each type of employment termination, the named executive officers would be entitled to benefits that are available generally to our domestic salaried employees, such as distributions under our 401(k) savings plan, certain disability benefits and accrued vacation. We have not described or provided an estimate of the value of any payments or benefits under plans or arrangements that do not discriminate in scope, terms or operation in favor of a named executive officer and that are generally available to all salaried employees.
Potential Payments under Employment Agreements
As discussed above, we have entered into employment agreements with our named executive officers. The agreements contain provisions for the payment of severance benefits following certain termination events. Below is a summary of the payments and benefits that the named executive officers would receive in connection with various employment termination scenarios.
Termination without Cause or by the Executive for Good Reason
Under the terms of each employment agreement, if the executive’s employment is terminated by us for any reason other than for cause and not due to death or disability, or by the executive for good reason then the executive is entitled to receive:
| • | any accrued obligations; |
| • | a prorated annual bonus based on the actual incentive the named executive officer would have earned for the year of termination; |
| • | a lump-sum payment equal to a percentage ( % in the case of Mr. Foley, % in the case of Mr. Larsen, % in the case of Mr. Sanzone, % in the case of , and % in the case of ), of the sum of the executive’s (a) annual base salary and (b) the target bonus opportunity in the year in which the termination of employment occurs or, in the case of Mr. Foley, the highest annual bonus paid to Mr. Foley within the preceding three years if such amount is higher than his target annual bonus opportunity; |
| • | the right to convert any life insurance provided by us into an individual policy, plus a lump sum cash payment equal to thirty-six months of premiums; |
| • | other COBRA coverage (so long as the executive pays the premiums) for a period of three years or, if earlier, until eligible for comparable benefits from another employer, plus a lump sum cash payment equal to the sum of thirty-six monthly COBRA premium payments; and |
| • | in the case of Mr. Foley, all stock option, restricted stock, profits interest and other equity-based incentive awards granted by us that were outstanding but not vested as of the date of termination shall become immediately vested and/or payable, as the case may be, unless the equity incentive awards are based upon satisfaction of performance criteria and not based solely on the passage of time. |
149
Table of Contents
Termination Due to Death or Disability
If the executive’s employment terminates due to death or disability, we will pay him, or his estate:
| • | any accrued obligations, and |
| • | a prorated annual bonus based on (a) the target annual bonus opportunity in the year in which the termination occurs or the prior year if no target annual bonus opportunity has yet been determined and (b) the fraction of the year the executive was employed, or in the case of Mr. Larsen, based on the amount of Mr. Larsen’s accrued annual bonus as contained on the internal books of the company for the month in which the termination occurs. |
Termination for Cause or by the Executive without Good Reason
If the executive’s employment is terminated by us for cause or by the executive without good reason our only obligation is the payment of any accrued obligations.
Definitions of Certain Terms Used in the Employment Agreements
For purposes of each employment agreement, “cause” means the executive’s:
| • | persistent failure to perform duties consistent with a commercially reasonable standard of care; |
| • | willful neglect of duties; |
| • | conviction of, or pleading nolo contendere to, criminal or other illegal activities involving dishonesty; |
| • | material breach of the employment agreement; or |
| • | impeding or failing to materially cooperate with an investigation authorized by our board. |
For purposes of Messrs. Sanzone and Larsen’s employment agreements, “cause” shall also mean the executive’s:
| • | material breach of the company’s business policies, accounting practices or standards of ethics; or |
| • | material breach of any applicable non-competition, non-solicitation, trade secrets, confidentiality or similar restrictive covenant. |
For purposes of each employment agreement, other than Mr. Foley’s employment agreement, “good reason” includes:
| • | a material change in the geographic location of the executive’s principal working location; |
| • | a material diminution of the executive’s title, base salary or annual bonus opportunity; or |
| • | our material breach of any of our obligations under the employment agreement. |
For purposes of Mr. Foley’s employment agreement, “good reason” includes:
| • | a material diminution in the executive’s position or title or the assignment of duties to the executive that are materially inconsistent with the executive’s position or title; |
| • | a material diminution of the executive’s base salary or annual bonus opportunity; |
| • | within six months immediately preceding or within two years immediately following a change of control, (1) a material adverse change in the executive’s status, authority or responsibility, (2) a material adverse change in the position to whom the executive reports or to the executive’s service relationship as a result of such reporting structure change, or a material diminution in the authority, duties or responsibilities of the position to whom the executive reports, (3) a material diminution in the budget over which the executive has managing authority, or (4) a material change in the geographic location of the executive’s place of employment; |
150
Table of Contents
| • | our material breach of any of our obligations under the employment agreement; or |
| • | the election of a new director to our board of director who Mr. Foley did not consent to or vote for. |
For purposes of Mr. Foley’s employment agreement, a “change of control” includes:
| • | an acquisition by an individual, entity or group of more than 50% of our voting power; |
| • | a merger in which we are not the surviving entity, unless our stockholders immediately prior to the merger hold more than 50% of the combined voting power of the resulting corporation after the merger; |
| • | a reverse merger in which we are the surviving entity but in which more than 50% of the combined voting power is transferred to persons different from those holding the securities immediately prior to such merger; |
| • | during any period of 2 consecutive years during the employment term, a change in the majority of our board, unless the changes are approved by 2/3 of the directors then in office; |
| • | a sale, transfer or other disposition of our assets that have a total fair market value equal to or more than 1/3 of the total fair market value of all of our assets immediately before the sale, transfer or disposition, other than a sale, transfer or disposition to an entity (i) which immediately after the sale, transfer or disposition owns 50% of our voting stock or (ii) 50% of the voting stock of which is owned by us after the sale, transfer or disposition; or |
| • | our stockholders approve a plan or proposal for the liquidation or dissolution of our company. |
Potential Payments under Change of Control
None of Messrs. Foley’s, Sanzone’s, Larsen’s or ’s employment agreements provide for a payment or a benefit upon a change of control without termination.
Potential Payments under the Synergy Incentive Program
We expect that the Synergy Incentive Program will be terminated effective December 31, 2014 and no payments will be made under the program in the event of a change of control.
Estimated Cash Severance Payments
Our estimate of the cash severance amounts that would be provided to the named executive officers assumes that their employment terminated on December 31, 2014. The severance amounts do not include a prorated 2014 annual incentive since the named executive officers would have been paid based on their service through the end of the year and therefore would have received the amount whether or not the termination occurred.
For a termination of employment by us not for cause or a termination by the executive for good reason, the following payments would have been made under the employment agreements: Mr. Foley $ ; Mr. Sanzone $ ; and Mr. Larsen $ . Upon a termination of the executives’ employment due to death or disability, the executives would receive any accrued obligations.
Estimated Equity Values
As disclosed in the Outstanding Equity Awards at Fiscal year End table, each named executive officer, other than , had outstanding unvested Grant Unit awards on December 31, 2014.
Unvested Grant Unit awards will vest upon a change of control and if we do not consummate a public offering by November 3, 2017, holders of Grant Units will be entitled to sell vested Grant Units back to us. Upon termination
151
Table of Contents
of a Grant Unit holder’s employment with us, we may purchase such Grant Unit holder’s vested Grant Units. In addition, under Mr. Foley’s employment agreement, the portion of his Grant Unit awards that vest based solely on the passage of time would vest upon any termination of his employment by us not for cause or a termination by Mr. Foley for good reason. For all of our executive officers other than Mr. Foley, all unvested Grant Unit awards will expire at such officer’s employment termination date.
The following estimates are based on a Grant Unit price of $ per unit, which was the fair value of our Grant Units on December 31, 2014, as determined using the fair value method of accounting under GAAP. The Grant Unit amounts reflect the excess of this Grant Unit price over the respective hurdle amounts of the unvested Grant Units for each of our named executive officers. Our estimate of the value of Grant Units that would vest assumes that a change of control and, as applicable, a termination of employment occurred on December 31, 2014.
The estimated value of the Grant Units held by the named executive officers, other than , that would vest upon a change of control would be as follows: Mr. Foley $ ; Mr. Sanzone $ ; Mr. Larsen $ ; and Mr. $ . The estimated value of Grant Unit awards held by the named executive officers, other than , that would vest upon a termination of the named executive officers’ employment by us not for cause or a termination by the executives for good reason would be as follows: Mr. Foley $ ; Mr. Sanzone $ ; Mr. Larsen $ ; and Mr. $ .
Director Compensation
Directors who are our salaried employees receive no additional compensation for services as a director or as a member of a committee of our board. In 2014, our compensation committee approved an annual stipend for John Rood of $10,000 and an annual stipend for David Hunt of $5,000, in each case payable quarterly, in consideration of the significant time and effort they spend in connection with their service on our Audit and Risk and Compliance Committees. In addition, in 2014, all of our non-employee directors received a long-term incentive award of 55,556 Grant Units for their service on our board of directors. We also reimburse each of our directors for all reasonable out-of-pocket expenses incurred in connection with attendance at board and committee meetings, as well as with any director education programs they attend relating to their service on our board.
The following table sets forth information concerning the compensation of our directors for the fiscal year ending December 31, 2014:
| Director Compensation | ||||||||||
| Name |
Fees Earned or Paid in Cash ($) |
Grant Unit Awards ($) |
Non-Equity Incentive Compensation ($) |
All Other Compensation ($) |
Total ($) | |||||
| Thomas M. Hagerty |
||||||||||
| David K. Hunt |
||||||||||
| Richard N. Massey |
||||||||||
| Ganesh B. Rao |
||||||||||
| John D. Rood |
||||||||||
| Cary H. Thompson |
||||||||||
152
Table of Contents
The following table shows information regarding the beneficial ownership of our Class A and Class B common stock (i) immediately following the Offering Reorganization, but prior to this offering and (ii) as adjusted to give effect to the Offering Reorganization and this offering, by:
| • | each person whom we know to own beneficially more than 5% of our Class A and Class B common stock; |
| • | each of our directors, nominees for director, and named executive officers individually; and |
| • | all directors and executive officers as a group. |
Beneficial ownership of shares is determined under rules of the SEC and generally includes any shares over which a person exercises sole or shared voting or investment power. Except as indicated by footnote, and subject to community property laws where applicable, we believe based on the information provided to us that the persons and entities named in the table below have sole voting and investment power with respect to all shares of our Class A and Class B common stock shown as beneficially owned by them. Percentage of beneficial ownership is based on shares of Class A and shares of Class B common stock outstanding after the Offering Reorganization but prior to the offering and shares of Class A and shares of Class B common stock to be outstanding after the completion of the Offering Reorganization and this offering, assuming no exercise of the underwriters’ option to purchase additional shares or shares of Class A common stock, assuming full exercise of the underwriters’ option to purchase additional shares. Except as otherwise indicated, the persons named in the table below have sole voting and investment power with respect to all shares of capital stock held by them. Unless otherwise indicated, the address for each holder listed below is Black Knight Financial Services, Inc., 601 Riverside Avenue, Jacksonville, Florida 32204.
| Shares of common stock beneficially owned before this offering |
Shares of common stock beneficially owned after this offering (assuming no exercise of the option to purchase additional shares) |
Shares of common stock beneficially owned after this offering assuming full exercise of the option to purchase additional shares |
||||||||||||||||||||||||||||
| Class A(1)(2) | Class B(1) | Class A(1)(2) | Class B(1) | Class A(1)(2) | Class B(1) | |||||||||||||||||||||||||
| Name and address of beneficial owner |
Number of shares |
Percentage of shares |
Number of shares |
Percentage of shares |
Total voting percentage(3) |
Number of shares |
Percentage of shares |
Number of shares |
Percentage of shares |
Total voting percentage(3) |
Number of shares |
Percentage of shares |
Number of shares |
Percentage of shares |
Total voting percentage(3) | |||||||||||||||
| 5% stockholders: |
||||||||||||||||||||||||||||||
| Fidelity National Financial, Inc.(4) |
||||||||||||||||||||||||||||||
| Thomas H. Lee Partners(5) |
||||||||||||||||||||||||||||||
| Named executive officers and directors: |
||||||||||||||||||||||||||||||
| William P. Foley, II |
||||||||||||||||||||||||||||||
| Thomas J. Sanzone |
||||||||||||||||||||||||||||||
| Kirk T. Larsen |
||||||||||||||||||||||||||||||
| Thomas M. Hagerty(6) |
||||||||||||||||||||||||||||||
| David K. Hunt |
||||||||||||||||||||||||||||||
| Richard N. Massey |
||||||||||||||||||||||||||||||
| Ganesh B. Rao |
||||||||||||||||||||||||||||||
| John D. Rood |
||||||||||||||||||||||||||||||
| Cary H. Thompson |
||||||||||||||||||||||||||||||
| All board of director members and named executive officers as a group (11 persons) |
||||||||||||||||||||||||||||||
| (1) | Subject to the terms of the Amended and Restated Operating Agreement, shares of our Class B common stock (together with the corresponding number of Units) are exchangeable for our Class A common stock on a one-for-one basis. See “Our Corporate Structure—The Amended and Restated Operating Agreement.” |
| (2) | Beneficial ownership of Class A common stock reflected in this table do not reflect beneficial ownership of Units of shares of Class B common stock for which such shares of Class A common stock may be exchanged. |
| (3) | Percentage of total voting power represents voting power with respect to all shares of our Class A common stock and Class B common stock, voting together as a single class. Our Class B common stock does not have any of the economic rights (including rights to dividends and distributions upon liquidation) associated with our Class A common stock. See “Description of Capital Stock.” |
| (4) | Refers to shares of Class A common stock and shares of Class B common stock held directly by Black Knight Holdings, Inc., which we refer to herein as BKHI. Fidelity National Financial, Inc., as sole shareholder of BKHI, ultimately exercises voting and dispositive power over the shares held by BKHI. |
| (5) | Includes shares of Class A common stock held by Thomas H. Lee Equity Fund VI, L.P., shares of Class A common stock held by Thomas H. Lee Parallel Fund VI, L.P., shares of Class A common stock held by Thomas H. Lee Parallel (DT) Fund VI, L.P., shares of Class A common stock held by THL Equity Fund VI Investors (BKFS), L.P., shares of Class A common stock held by THL Equity Fund VI Investors (BKFS) II, L.P., shares of Class A common stock held by THL Coinvestment Partners, L.P., shares of Class A |
153
Table of Contents
| common stock held by THL Operating Partners, L.P., shares of Class A common stock held by Great-West Investors LP, and shares of Class A common stock held by Putnam Investments Employees’ Securities Company III LLC. THL Equity Advisors VI, LLC is the general partner of Thomas H. Lee Equity Fund VI, L.P., Thomas H. Lee Parallel Fund VI, L.P., Thomas H. Lee Parallel (DT) Fund VI, L.P., THL Equity Fund VI Investors (BKFS), L.P. and THL Equity Fund VI Investors (BKFS) II, L.P. Thomas H. Lee Partners, L.P. is the managing member of THL Equity Advisors VI, LLC and is also the general partner of THL Coinvestment Partners, L.P. and THL Operating Partners, L.P. Thomas H. Lee Advisors, LLC, is the general partner of Thomas H. Lee Partners, L.P. Thomas H. Lee Advisors, LLC is attorney in fact for Great-West Investors LP and Putnam Investments LLC, which is the managing member of Putnam Investments Employees’ Securities Company III LLC, with respect to the shares of Class A common stock they hold. THL Holdco, LLC is the managing member of Thomas H. Lee Advisors, LLC and all investment decisions at THL Holdco, LLC are taken by its management committee, which is comprised of Mr. Anthony J. DiNovi and Mr. Scott M. Sperling. Therefore, each of THL Holdco, LLC and Messrs. DiNovi and Sperling may be deemed to beneficially own all shares referred to above. Each of Messrs. DiNovi, Sperling, THL Holdco, LLC, Thomas H. Lee Advisors, LLC, Thomas H. Lee Partners, L.P. and THL Equity Advisors VI, LLC, disclaims beneficial ownership of such shares, except to the extent of their pecuniary interest therein. The address of Great-West Investors LP is 8515 East Orchard Road, Greenwood Village, CO 80111; the address of Putnam Investments Employees’ Securities Company III LLC is c/o Putnam Investment, Inc., 1 Post Office Square, Boston, Massachusetts 02109; the address of Mr. DiNovi, Mr. Sperling and all other entities referred to above is c/o Thomas H. Lee Partners, L.P., 100 Federal Street, 35th Floor, Boston, Massachusetts 02110. |
| (6) | Mr. Hagerty is a member of the board of members of THL Holdco, LLC. The total shares represented for Mr. Hagerty includes shares of common stock held by THL Affiliates. Mr. Hagerty disclaims beneficial ownership of such shares except to the extent of his pecuniary interest therein. Please see footnote (5) to this table for more information regarding the shares of common stock held by the THL Affiliates. |
154
Table of Contents
CERTAIN RELATIONSHIPS AND RELATED PARTY TRANSACTIONS
In addition to the compensation arrangements, including employment, termination of employment and change of control arrangements and indemnification arrangements, discussed in the sections titled “Management” and “Executive and Director Compensation,” the following is a description of each transaction since January 1, 2012 and each currently proposed transaction in which:
| • | we, BKFS Operating LLC or any subsidiaries thereof have been or will be a participant; |
| • | the amount involved exceeded or exceeds $120,000; and |
| • | any of our directors, executive officers or beneficial owners of more than 5% of our capital stock, or any immediate family member of, or person sharing the household with, any of these individuals, had or will have a direct or indirect material interest. |
Offering Reorganization
Prior to the consummation of this offering, we will consummate the transactions relating to the Offering Reorganization described under “Our Corporate Structure.”
BKFS Operating LLC Amended and Restated Operating Agreement
Following the Offering Reorganization, we will operate our business through BKFS Operating LLC and its consolidated subsidiaries. The operations of BKFS Operating LLC, and the rights and obligations of its members, will be governed by the Amended and Restated Operating Agreement. We will serve as managing member of BKFS Operating LLC and, as such, will control the business and affairs and will be responsible for the management of BKFS Operating LLC and its consolidated subsidiaries. BKHI, a subsidiary of FNF, and certain THL Affiliates will also be members of BKFS Operating LLC and parties to the Amended and Restated Operating Agreement. For a description of the Amended and Restated Operating Agreement and the rights provided to the members of BKFS Operating LLC, including us as the managing member, see “Our Corporate Structure—The Amended and Restated Operating Agreement.”
Tax Receivable Agreement
Upon the closing of this offering, we expect to enter into a tax receivable agreement with BKHI and certain THL Affiliates. See “Our Corporate Structure—Tax Receivable Agreement.”
Registration Rights Agreement
Concurrent with the closing of this offering, we expect to enter into a registration rights agreement with certain holders of the outstanding Units. This agreement will provide these holders, and their permitted transferees, with the right to require us, at our expense, to register shares of our Class A common stock that are issuable by BKFS to them upon exchange of Units (and an equal number of shares of our Class B common stock) in accordance with the terms of the Amended and Restated Operating Agreement. The agreement will also provide that we will pay certain expenses of these electing holders relating to such registrations and indemnify them against certain liabilities that may arise under the Securities Act. The following description summarizes such rights and circumstances.
Demand Rights
Subject to certain limitations, beginning 180 days following the effectiveness of this prospectus, existing holders of our Units (and their permitted transferees) will have the right, by delivering written notice to us, to require us to register the number of our shares of Class A common stock requested to be so registered in accordance with
155
Table of Contents
the registration rights agreement. Within a specified period following receipt of notice of a demand registration, we will be required to give written notice to all other beneficial holders of registrable shares of Class A common stock (including holders of Units and corresponding shares of Class B common stock that have the right to exchange them for shares of Class A common stock). Subject to certain limitations as described below, we will include in the registration all securities with respect to which we receive a written request for inclusion in the registration within a specified period after we give our notice. Following the demand request, we are required to use our commercially reasonable efforts to have the applicable registration statement filed with the SEC within a specified period following the demand and are required to use our commercially reasonable efforts to cause the registration statement to be declared effective. Any demand registration must be reasonably expected by the demanding stockholder to result in aggregate gross cash proceeds to such demanding stockholder in excess of a specified value, and a limited number of demand registrations can be made under the registration rights agreement, none of which may be made within a specified period following a prior demand.
Shelf Registration Rights on Form S-3
If we are eligible to file a shelf registration statement on Form S-3, holders of registrable securities with registration rights under the registration rights agreement can request that we register their shares for resale. Within a specified period following receipt of notice of a Form S-3 registration request, we will be required to give written notice to all other beneficial holders of registrable shares of Class A common stock (including holders of Units and corresponding shares of Class B common stock that have the right to exchange them for shares of Class A common stock). Subject to certain limitations as described below, we will include in the Form S-3 registration all securities with respect to which we receive a written request for inclusion in the registration within a specified period after we give our notice. Following such request, we are required to use our commercially reasonable efforts to have the shelf registration statement declared effective. No Form S-3 registration request may be made within a specified period following a prior demand or request.
In addition, once a shelf registration statement has been declared effective by the SEC pursuant to the forgoing, thereafter, from time to time, any holder of registrable securities may, by notice to us, require us to register such holder’s registrable securities pursuant to the shelf registration statement.
Piggyback Rights
Holders of registrable shares of Class A common stock under the registration rights agreement will be entitled to request to participate in, or “piggyback” on, registrations of certain securities for sale by us at any time after this offering. This piggyback right will apply to any registration following this offering other than to a demand for shelf registration statement on Form S-3 described above or a registration on Forms S-4 or S-8.
Conditions and Limitations
The registration rights outlined above will be subject to conditions and limitations, including the right of the underwriters to limit the number of shares to be included in a registration statement and our right to delay, suspend or withdraw a registration statement under specified circumstances. For example, our board of directors may in its good faith judgment delay the filing or effectiveness of any registration statement (for periods not to exceed 90 days in any 12-month period). Additionally, in certain circumstances we may withdraw a registration upon request by the holder of registrable securities.
If requested by the managing underwriter or underwriters of an underwritten demand offering or a requested shelf registration on Form S-3, holders of securities with registration rights will not be able to make any sale of our equity securities (including sales under Rule 144 as promulgated under the Securities Act) or give any demand notice during a period commencing on the date of the request and continuing for a period not to exceed a specified period as may be requested by the underwriters.
156
Table of Contents
Reimbursement Agreement
In connection with this offering, we intend to enter into a reimbursement agreement with FNF whereby we will agree to reimburse FNF and its affiliates, at cost, for certain limited administrative services provided from time to time and related expenses incurred by FNF and its affiliated employees to or on behalf of us.
Advancement Agreement
We intend to enter into an Advancement Agreement with BKFS Operating LLC whereby BKFS Operating LLC will agree to advance, or pay on our behalf, third-party expenses incurred by us, including (i) reasonable expenses incident to an offering of shares and the registration of shares on any national securities exchange by the issuer, including expenses incurred in connection with this offering, (ii) reasonable customary corporate, securities and administrative expenses incurred by the issuer, including fees related to investment bankers, financial advisers, legal counsel, independent certified public accountants, consultants or other persons retained by the board of directors of the issuer, (iii) losses, damages, liabilities, costs, fees and expenses incurred in connection with any indemnification or expense advancement provided by any organizational document of the issuer or indemnification agreement entered into by and between the issuer and any director, officer or employee of the issuer, (iv) losses, damages, liabilities, costs, fees and expenses incurred in connection with indemnification obligations of the issuer under the Registration Rights Agreement, (v) any franchise taxes payable by the issuer and any income taxes payable as a result of the Advancement Agreement and (vi) any costs, fees and expenses payable or reimbursable to any member of the board of directors of the issuer in accordance with the terms of any resolutions or policies approved by the issuer’s board of directors. The Advancement Agreement will remain in effect for an unspecified term and is terminable by the issuer at-will.
Management Agreements
FNF
On January 3, 2014, in connection with the Internal Reorganization, we entered into a management agreement with FNF pursuant to which FNF provides us advice on, among other things, the negotiation and consummation of agreements, contracts, documents and instruments related to our finances and the development and implementation of strategies for improving our operating, marketing and financial performance. Under the management agreement, FNF was paid a one-time fee of $8.5 million on January 3, 2014, and is paid an additional annual fee in the amount of $5.9 million per year, paid in semiannual installments in January and July, plus reimbursement for certain expenses. As of September 30, 2014, we have paid FNF management fees in the amount of $5.9 million.
The management agreement with FNF will terminate automatically in connection with the consummation of this offering.
THL
On January 3, 2014, in connection with the Internal Reorganization, we entered into a management agreement with THL Managers LLC pursuant to which THL Managers LLC provided advisory services to us in connection with the Internal Reorganization and continues to provide us advice on, among other things, the negotiation and consummation of agreements, contracts, documents and instruments related to our finances and the development and implementation of strategies for improving our operating, marketing and financial performance. Under the management agreement, THL Managers LLC was paid a one-time fee of $6.6 million on January 3, 2014, and is paid an additional annual fee in the amount of $3.2 million per year, paid in semiannual installments in January and July, plus reimbursement for certain expenses. As of September 30, 2014, we have paid THL Managers LLC management fees in the amount of $3.2 million.
The management agreement with THL Managers LLC will terminate automatically in connection with the consummation of this offering.
157
Table of Contents
Services and Other Agreements
FNF
We have various agreements with FNF, including certain of its subsidiaries, pursuant to which we provide technology, data and analytics services. In addition, FNF provides certain corporate services to us, including communications, investor relations, portfolio management and real estate management services. Pursuant to these arrangements, during the nine months ended September 30, 2014, we received $36.9 million in revenues from, and allocated $15.7 in operating expenses to, FNF and its subsidiaries, excluding ServiceLink.
ServiceLink
We have various agreements with ServiceLink, pursuant to which we provide technology, data and analytics services. In addition, we provide certain corporate services to ServiceLink, including shared corporate services, information technology and facilities management. ServiceLink also rents space in our headquarters building in Jacksonville, Florida. Pursuant to these arrangements, during the nine months ended September 30, 2014, we received $18.3 million in revenues from, and allocated $20.1 million in operating expenses to, ServiceLink.
THL
We receive software and systems services from certain entities over which THL exercises control. We purchased $1.5 million in software and maintenance services and recorded $1.2 million in operating expenses from these entities during the time period of January 2, 2014 to September 30, 2014.
Indemnification Agreements
Prior to the completion of this offering, we expect to enter into indemnification agreements with each of our directors and executive officers. These indemnification agreements will require us, among other things, to indemnify our directors and executive officers against liabilities that may arise by reason of their status or service. These indemnification agreements will also require us to advance all expenses incurred by the directors and executive officers in investigating or defending any such action, suit, or proceeding.
We have entered into a cross-indemnity agreement with ServiceLink. Pursuant to the cross-indemnity agreement, ServiceLink indemnifies us for liabilities relating to, arising out of or resulting from the conduct of ServiceLink’s business or any action, suit or proceeding in which we or any of our subsidiaries are named by reason of being a successor to the business of LPS and the cause of such action, suit or proceeding relates to the business of ServiceLink. In return, we indemnify ServiceLink for liabilities relating to, arising out of, or resulting from the conduct of our business.
Review, Approval or Ratification of Transactions with Related Persons
Our code of business conduct and ethics states that a “conflict of interest” occurs when an individual’s private interests interfere in any way, or appear from the perspective of a reasonable person to interfere in any way, with our interests as a whole, and provides further that a conflict situation can arise when an employee or director takes actions or has interests that may make it difficult to perform his or her responsibilities objectively and effectively. We believe that a conflict exists whenever an outside interest could actually or potentially influence the judgment or actions of an individual in the conduct of our business and that conflicts of interest may arise when an employee or director, or a member of his or her family, receives improper personal benefits as a result of his or her position.
Our code of business conduct and ethics provides that directors and employees must avoid conflicts or the appearance of conflicts, and that employees should avoid any outside financial interests that might conflict with our interests. Such outside interests could include, among other things:
| • | Personal or family financial interests in, or indebtedness to, enterprises that have business relations with us, such as relatives who are employed by or own an interest in consultants or suppliers. |
| • | Acquiring any interest in outside entities, properties, etc., in which we have an interest or potential interest. |
158
Table of Contents
| • | Conduct of any business not on our behalf with any consultant, contractor, supplier, or distributor doing business with us or any of their officers or employees, including service as a director or officer of, or employment or retention as a consultant by, such persons. |
| • | Serving on the board of directors of an outside entity whose business competes with our business. |
Under our code of business conduct and ethics, employees are required to report any material transaction or relationship that could result in a conflict of interest to our compliance officer.
Our audit committee will be responsible for the review, approval, or ratification of any potential conflict of interest transaction involving any of our directors or executive officers, director nominees, any person known by us to be the beneficial owner of more than five percent of any class of our voting securities, or any family member of or related party to such persons, including any transaction required to be reported under Item 404(a) of Regulation S-K promulgated by the SEC.
In reviewing any such proposed transaction, our audit committee will be tasked to consider all relevant facts and circumstances, including the commercial reasonableness of the terms, the benefit or perceived benefit, or lack thereof, to us, opportunity costs of alternate transactions, the materiality and character of the related person’s direct or indirect interest and the actual or apparent conflict of interest of the related person.
The transactions described above under “—Management Agreements” and “—Service and Other Agreements” were not approved by our audit committee but were approved by our board of directors as a whole, as constituted at the time of such approval.
159
Table of Contents
The following is a description of the material terms of our amended and restated certificate of incorporation and amended and restated bylaws as we expect them to be in effect following the Offering Reorganization and at the time of this offering. We refer you to our amended and restated certificate of incorporation and amended and restated bylaws, copies of which will be filed as exhibits to the registration statement of which this prospectus is a part.
Authorized Capitalization
Following this offering, our authorized capital stock will consist of shares of Class A common stock, par value $0.0001 per share, shares of Class B common stock, par value $0.0001 per share, and shares of preferred stock, par value $0.0001 per share.
Class A Common Stock
Voting Rights
The holders of Class A common stock are entitled to one vote per share on all matters to be voted upon by the stockholders.
Dividend Rights
Subject to preferences that may be applicable to any outstanding preferred stock, the holders of shares of Class A common stock are entitled to receive ratably such dividends, if any, as may be declared from time to time by the board of directors out of funds legally available therefor. However, we do not intend to pay dividends for the foreseeable future. Holders of shares of Class B common stock are not entitled to receive dividends in respect of such shares. See “Dividend Policy.”
Rights upon Liquidation
In the event of any voluntary or involuntary liquidation, dissolution or winding up of our affairs, the holders of Class A common stock are entitled to share ratably in all assets remaining after payment of our debts and other liabilities, subject to prior distribution rights of preferred stock, then outstanding, if any.
Other Rights
The holders of our Class A common stock have no preemptive or conversion rights or other subscription rights. There are no redemption or sinking fund provisions applicable to the Class A common stock. The rights, preferences and privileges of holders of our Class A common stock will be subject to those of the holders of any shares of our preferred stock we may issue in the future.
Class B Common Stock
Issuance of Class B Common Stock with Units
Upon completion of the Offering Reorganization, shares of Class B common stock will be issued to BKHI and certain other holders of Units in amounts corresponding one-for-one to the number of Units held by them. Following this offering, shares of our Class B common stock are issuable only in connection with the issuance of Units. When Units are issued by BKFS Operating LLC, we will simultaneously issue the holder an equal number of shares of our Class B common stock. Each share of our Class B common stock will be redeemed and cancelled by us if the holder exchanges one Unit and such share of Class B common stock for, at the issuer’s option, either one share of
160
Table of Contents
Class A common stock or a cash payment pursuant to the terms of the Amended and Restated Operating Agreement, the form of which is filed as an exhibit to the registration statement of which this prospectus forms a part. See “Our Corporate Structure—The Amended and Restated Operating Agreement.”
Voting Rights
Holders of our Class B common stock will be entitled to one vote for each share held of record on all matters submitted to a vote of our stockholders. Holders of our Class A common stock and holders of our Class B common stock will vote together as a single class on all matters (including the election of directors) submitted to a vote of stockholders, unless otherwise required by law. Delaware law may require the holders of our Class A common stock and the holders of our Class B common stock to vote as separate voting groups in the event of certain amendments to our amended and restated certificate of incorporation affecting the relative rights, preferences or other aspects of the Class A common stock or Class B common stock, respectively, or business combinations under certain circumstances.
Dividend Rights
The holders of our Class B common stock will not participate in any dividends declared by our board of directors.
Rights upon Liquidation
In the event of any dissolution, liquidation, or winding up of our affairs, whether voluntary or involuntary, after payment of our debts and other liabilities and making provision for any holders of our preferred stock who have a liquidation preference, the holders of Class B common stock will not be entitled to receive any of our assets.
Other Rights
In the event of a reclassification or other similar transaction as a result of which the shares of Class A common stock are converted into another security, then a holder of shares of Class B common stock will be entitled to receive upon exchange of such shares (together with a commensurate number of Units) the amount of such security that such holder would have received if such exchange had occurred immediately prior to the record date of such reclassification or other similar transaction, taking into account any adjustment as a result of any subdivision (by any stock split or dividend, reclassification or otherwise) or combination (by reverse stock split, reclassification or otherwise) of such security that occurs after the effective time of such reclassification or other similar transaction. No shares of Class B common stock will have preemptive rights to purchase additional shares of Class B common stock.
Registration Rights
In connection with this offering, we expect to enter into a registration rights agreement with the holders of the outstanding Units. This agreement will provide these holders (and their permitted transferees) with the right to require us, at our expense, to register shares of our Class A common stock that are issuable to them upon exchange of Units (and an equal number of shares of our Class B common stock). The agreement will also provide that we will pay certain expenses of these electing holders relating to such registrations and indemnify them against certain liabilities that may arise under the Securities Act. For a detailed description of the registration rights agreement, see “Certain Relationships and Related Party Transactions—Registration Rights Agreement.”
Preferred Stock
Our board of directors has the authority to issue shares of preferred stock in one or more series and to fix the rights, preferences and limitations thereof, including dividend rights, specification of par value, conversion
161
Table of Contents
rights, voting rights, terms of redemption, specification of par value, liquidation preferences and the number of shares constituting any series or the designation of such series, without further vote or action by the stockholders.
The issuance of preferred stock may have the effect of delaying, deferring or preventing a change of control of us without further action by the stockholders and may adversely affect the voting and other rights of the holders of Class A common stock. At present, we have no shares of preferred stock issued and outstanding and we have no plans to issue any preferred stock.
Election and Removal of Directors; Vacancies
Our amended and restated certificate of incorporation will provide that our board of directors will consist of between three and 15 directors. The exact number of directors will be fixed from time to time by a majority of our board of directors. In accordance with our amended and restated certificate of incorporation, our board of directors will be divided into three classes of directors, with each class constituting, as nearly as possible, one-third of the total number of directors. Each class of directors will be elected for a three-year term. As a result, approximately one-third of our board of directors will be elected each year. There will be no limit on the number of terms a director may serve on our board of directors.
Our amended and restated certificate of incorporation will provide that, subject to any rights of any voting group, any director may be removed from office at any time but only for cause and only by (i) the affirmative vote of the holders of 66 2/3% of the voting power of the shares entitled to vote for the election of directors, considered for this purpose as one class, or (ii) the affirmative vote of a majority of the entire board of directors then in office. In addition, our amended and restated certificate of incorporation will provide that any vacancy on the board of directors, including a vacancy that results from an increase in the number of directors or a vacancy that results from the removal of a director with cause, may be filled only by a majority of the directors then in office.
Anti-takeover Effects of our Amended and Restated Certificate of Incorporation and Amended and Restated Bylaws
Upon the closing of this offering, our amended and restated certificate of incorporation and amended and restated bylaws will contain provisions that may delay, defer or discourage another party from acquiring control of us. We expect that these provisions, which are summarized below, will discourage coercive takeover practices or inadequate takeover bids. These provisions are also designed to encourage persons seeking to acquire control of us to first negotiate with our board of directors, which we believe may result in an improvement of the terms of any such acquisition in favor of our stockholders. However, they also give our board of directors the power to discourage acquisitions that some stockholders may favor.
Our amended and restated certificate of incorporation will provide that directors may be removed only for cause by the affirmative vote of a majority of the remaining members of the board of directors or the holders of at least 66 2/3% of the voting power of all shares of capital stock then entitled to vote on the election of directors, voting together as a single class. Furthermore, any vacancy on our board of directors, however occurring, including a vacancy resulting from an increase in the size of our board of directors, may only be filled by the affirmative vote of a majority of our directors then in office even if less than a quorum and in accordance with the stockholders’ agreement.
No Stockholder Action by Written Consent
Our amended and restated certificate of incorporation will provide that, subject to the rights of any holders of preferred stock to act by written consent instead of a meeting, stockholder action may be taken only at an annual meeting or special meeting of stockholders and may not be taken by written consent instead of a meeting. Failure to satisfy any of the requirements for a stockholder meeting could delay, prevent or invalidate stockholder action.
162
Table of Contents
Requirements for Advance Notification of Stockholder Meetings, Nominations and Proposals
Our amended and restated bylaws will provide that special meetings of the stockholders may be called only upon the request of a majority of our board of directors or by our Chief Executive Officer. Our amended and restated bylaws will prohibit the conduct of any business at a special meeting other than as specified in the notice for such meeting. These provisions may have the effect of deferring, delaying or discouraging hostile takeovers or changes in control or management of our company.
Our amended and restated bylaws will establish advance notice procedures with respect to stockholder proposals and the nomination of candidates for election as directors, other than nominations made by or at the direction of our board of directors or a committee of the board of directors. In order for any matter to be “properly brought” before a meeting, a stockholder will have to comply with the advance notice requirements of directors, which may be filled only by a vote of a majority of directors then in office, even though less than a quorum, and not by the stockholders. Our amended and restated bylaws will allow the presiding officer at a meeting of the stockholders to adopt rules and regulations for the conduct of meetings which may have the effect of precluding the conduct of certain business at a meeting if the rules and regulations are not followed. These provisions may also defer, delay or discourage a potential acquirer from conducting a solicitation of proxies to elect the acquirer’s own slate of directors or otherwise attempting to obtain control of our company.
Amendment to Amended and Restated Bylaws and Amended and Restated Certificate of Incorporation
Any amendment to our amended and restated certificate of incorporation must first be approved by a majority of our board of directors and (i) if required by law, thereafter be approved by a majority of the outstanding shares entitled to vote on the amendment or (ii) if related to provisions regarding the classification of the board of directors, the removal of directors, indemnification, corporate opportunities, business combinations, forum, severability, the provision opting-out of Section 203 of the DGCL, or the amendment of our amended and restated bylaws or amended and restated certificate of incorporation, thereafter be approved by 66 2/3% of the outstanding shares entitled to vote on the amendment. Our amended and restated bylaws may be amended subject to any limitations set forth in the bylaws (x) by the affirmative vote of a majority of the directors then in office, without further stockholder action or (y) by the affirmative vote of at least 66 2/3% of the outstanding shares entitled to vote generally in the election of directors.
Authorized but Unissued Shares
The authorized but unissued shares of our common stock and our preferred stock will be available for future issuance without any further vote or action by our stockholders. These additional shares may be utilized for a variety of corporate purposes, including future public offerings to raise additional capital, corporate acquisitions and employee benefit plans. The existence of authorized but unissued shares of our common stock and our preferred stock could render more difficult or discourage an attempt to obtain control over us by means of a proxy contest, tender offer, merger or otherwise.
Exclusive Forum
Our amended and restated certificate of incorporation will provide that, subject to certain exceptions, the Court of Chancery of the State of Delaware shall be the sole and exclusive forum for certain stockholder litigation matters. However, it is possible that a court could rule that this provision is unenforceable or inapplicable.
Delaware Anti-Takeover Statute
Our amended and restated certificate of incorporation expressly states that we have elected not to be governed by Section 203 of the DGCL, which prohibits a publicly held Delaware corporation from engaging in a “business combination” with an “interested stockholder” for a period of three years after the time the stockholder became
163
Table of Contents
an interested stockholder, subject to certain exceptions, including if, prior to such time, the board of directors approved the business combination or the transaction which resulted in the stockholder becoming an interested stockholder. “Business combinations” include mergers, asset sales and other transactions resulting in a financial benefit to the “interested stockholder.” If the underwriters were to fully exercise the underwriters’ option to purchase additional shares of our common stock, the percentage of shares of our common stock held by existing stockholders who are directors, officers or affiliated persons would be %, and the percentage of shares of our common stock held by new investors would be %. Subject to various exceptions, an “interested stockholder” is a person who, together with his or her affiliates and associates, owns, or within three years did own, 15% or more of the corporation’s outstanding voting stock. These restrictions generally prohibit or delay the accomplishment of mergers or other takeover or change of control attempts that are not approved by a company’s board of directors. Although we have elected to opt out of the statute’s provisions, we could elect to be subject to Section 203 in the future.
Corporate Opportunities
Our amended and restated certificate of incorporation and the stockholders’ agreement will provide that FNF and its affiliates have no obligation to offer us an opportunity to participate in business opportunities presented to FNF or their respective affiliates even if the opportunity is one that we might reasonably have pursued (and therefore may be free to compete with us in the same business or similar businesses), and that neither FNF nor their respective affiliates will be liable to us or our stockholders for breach of any duty by reason of any such activities unless, in the case of any person who is a director or officer of our company, such business opportunity is expressly offered to such director or officer in writing solely in his or her capacity as an officer or director of our company.
Listing on the New York Stock Exchange
We intend to list the Class A common stock on the NYSE under the symbol “BKFS.” We have not yet filed an application to have our Class A common stock approved for listing. We intend to file such application following the filing of this registration statement.
Transfer Agent and Registrar
The transfer agent and registrar for the Class A common stock is Continental Stock Transfer & Trust.
164
Table of Contents
SHARES ELIGIBLE FOR FUTURE SALE
Prior to this offering, there has been no market for our Class A common stock. Future sales of substantial amounts of our Class A common stock in the public market or the perception that such sales might occur could adversely affect market prices prevailing from time to time. Furthermore, because only a limited number of shares will be available for sale shortly after this offering due to existing contractual and legal restrictions on resale as described below, there may be sales of substantial amounts of our Class A common stock in the public market after the restrictions lapse. This may adversely affect the prevailing market price and our ability to raise equity capital in the future.
After completion of this offering and after giving effect to the Offering Reorganization, we will have shares of Class A common stock outstanding (or a maximum of shares of Class A common stock if the underwriters exercise in full their option to purchase additional shares), shares of Class B common stock outstanding, and Units outstanding (which may in the future be exchanged for Class A common stock as described below), and Grant Units outstanding (which may in the future, upon vesting, be exchanged for Class A common stock as described below).
All of the shares of Class A common stock sold in this offering will be freely tradable without restrictions or further registration under the Securities Act, unless the shares are purchased by our “affiliates” as that term is defined in Rule 144 and except certain shares that may be subject to the lock-up period described in the next succeeding paragraph after completion of this offering. Any shares owned by our affiliates may not be resold except in compliance with Rule 144 volume limitations, manner of sale and notice requirements, pursuant to another applicable exemption from registration or pursuant to an effective registration statement. The shares of Class A common stock issuable to our Class B stockholders will be “restricted securities” as that term is defined in Rule 144. These restricted securities may be sold in the public market only if they are registered or if they qualify for an exemption from registration under Rule 144. This rule is summarized below.
In addition, at our request, the underwriters may reserve up to shares of Class A common stock offered for sale pursuant to this prospectus for some of our directors, executive officers, employees and business associates in a directed shares program. We expect that any of these directed shares purchased by our executive officers and business associates will be subject to the 180-day lock-up restriction described under “Underwriting.” Accordingly, the number of shares freely transferable upon completion of this offering will be reduced by the number of directed shares purchased by our directors, executive officers, employees and business associates, and there will be a corresponding increase in the number of shares that become eligible for sale after 180 days from the date of this prospectus.
Rule 144
In general, under Rule 144 as currently in effect, a person who has beneficially owned restricted shares of our Class The shares of our Class A common stock sold in this offering will generally be freely transferable without restriction or further registration under the Securities Act, except that any shares of our Class A common stock held by an “affiliate” of ours may not be resold publicly except in compliance with the registration requirements of the Securities Act or under an exemption under Rule 144 or otherwise. Rule 144 permits our Class A common stock that has been acquired by a person who is an affiliate of ours, or has been an affiliate of ours within the past three months, to be sold into the market in an amount that does not exceed, during any three-month period, the greater of:
| • | one percent of the total number of shares of our Class A common stock outstanding; or |
| • | the average weekly reported trading volume of our Class A common stock for the four calendar weeks prior to the sale. |
Such sales are also subject to specific manner of sale provisions, a one-year holding period requirement, notice requirements and the availability of current public information about us.
165
Table of Contents
Approximately shares of our Class A common stock that are not subject to lock-up arrangements described above will be eligible for sale under Rule 144 immediately upon the closing of this offering.
Rule 144 also provides that a person who is not deemed to have been an affiliate of ours at any time during the three months preceding a sale, and who has for at least six months beneficially owned shares of our Class A common stock that are restricted securities, will be entitled to freely sell such shares of our Class A common stock subject only to the availability of current public information regarding us. A person who is not deemed to have been an affiliate of ours at any time during the three months preceding a sale, and who has beneficially owned for at least one year shares of our Class A common stock that are restricted securities, will be entitled to freely sell such shares of our Class A common stock under Rule 144 without regard to the current public information requirements of Rule 144.
Lock-up Agreements
In connection with this offering, we expect that, each of our directors, executive officers as well as certain other stockholders, will enter into lock-up agreements as further described under “Underwriting,” that restrict the sale of our securities for up to 180 days after the date of this prospectus, subject to an extension in certain circumstances.
In addition, following the expiration of the lock-up period, certain stockholders may have the right, subject to certain conditions, to require us to register the sale of their shares of our Class A common stock under federal securities laws. If these stockholders exercise this right, our other existing stockholders may require us to register their registrable securities. By exercising their registration rights, and selling a large number of shares, these selling stockholders could cause the prevailing market price of our Class A common stock to decline.
Following the lock-up periods described above, all of the shares of our Class A common stock that are restricted securities or are held by our affiliates as of the date of this prospectus would be eligible for sale in the public market in compliance with Rule 144 under the Securities Act.
Registration Rights Agreement
In connection with this offering, we intend to enter into a registration rights agreement with holders of Units, including BKHI and certain THL Affiliates, to provide them with certain customary demand, piggyback and shelf registration rights. See “Certain Relationships and Related Party Transactions—Registration Rights Agreement.”
166
Table of Contents
MATERIAL U.S. FEDERAL INCOME TAX CONSIDERATIONS FOR NON-U.S. HOLDERS
The following is a general discussion of the material U.S. federal income and estate tax consequences to non-U.S. holders (as defined below) of the purchase, ownership and disposition of our Class A common stock. This discussion does not provide a complete analysis of all potential U.S. federal income tax and estate tax considerations relating thereto. This description is based on the Internal Revenue Code of 1986, as amended, or the Code, existing and proposed U.S. Treasury regulations promulgated thereunder, administrative pronouncements, judicial decisions, and interpretations of the foregoing, all as of the date hereof and all of which are subject to change, possibly with retroactive effect. This discussion is limited to non-U.S. Holders who hold shares of our Class A common stock as capital assets within the meaning of Section 1221 of the Code. Moreover, this discussion is for general information only and does not address all of the tax consequences that may be relevant to you in light of your particular circumstances, nor does it discuss special tax provisions, which may apply to you if you are subject to special treatment under U.S. federal income tax laws, such as for certain financial institutions or financial services entities, insurance companies, tax-exempt entities, dealers in securities or currencies, entities that are treated as partnerships for U.S. federal income tax purposes, “controlled foreign corporations,” “passive foreign investment companies,” former U.S. citizens or long-term residents, persons deemed to sell Class A common stock under the constructive sale provisions of the Code, and persons that hold Class A common stock as part of a straddle, hedge, conversion transaction, or other integrated investment. In addition, this summary does not address the Medicare tax on certain investment income or any state, local or foreign taxes or any U.S. federal tax laws other than U.S. federal income tax laws and estate tax laws.
You are urged to consult with your own tax advisor concerning the U.S. federal income tax and estate tax consequences of acquiring, owning and disposing of our Class A common stock, as well as the application of any state, local, and foreign income and other tax laws.
As used in this section, a “non-U.S. holder” is a beneficial owner of our Class A common stock that is not, for U.S. federal income tax purposes:
| • | an individual who is a citizen or resident of the United States, |
| • | a corporation (or other entity taxable as a corporation) that is created or organized in or under the laws of the United States, any state thereof or the District of Columbia, |
| • | an estate the income of which is subject to U.S. federal income taxation regardless of its source, or |
| • | a trust if (i) a court within the United States is able to exercise primary supervision over the administration of the trust and one or more U.S. persons have the authority to control all substantial decisions of the trust or (ii) it has a valid election in effect under applicable U.S. Treasury regulations to be treated as a domestic trust. |
If you are an individual, you are a resident alien if you are a lawful permanent resident of the United States (e.g., a green card holder) and you may, in many cases, be deemed to be a resident alien, as opposed to a nonresident alien, by virtue of being present in the United States for at least 31 days in the calendar year and for an aggregate of at least 183 days during a three-year period ending in the current calendar year. For these purposes, all the days present in the current year, one-third of the days present in the immediately preceding year, and one-sixth of the days present in the second preceding year are counted. Resident aliens are subject to U.S. federal income tax as if they were U.S. citizens. Such an individual is urged to consult his or her own tax advisor regarding the U.S. federal income tax consequences of the purchase, ownership or disposition of our Class A common stock.
If a partnership or other pass-through entity is a beneficial owner of our Class A common stock, the tax treatment of a partner in the partnership or an owner of the other pass-through entity will depend upon the status of the partner or owner and the activities of the partnership or other pass-through entity. Any partner in a partnership or owner of a pass-through entity holding shares of our Class A common stock should consult its own tax advisor.
167
Table of Contents
INVESTORS CONSIDERING THE PURCHASE OF OUR CLASS A COMMON STOCK SHOULD CONSULT THEIR OWN TAX ADVISORS REGARDING THE APPLICATION OF THE U.S. FEDERAL INCOME AND ESTATE TAX LAWS TO THEIR PARTICULAR SITUATIONS AND THE CONSEQUENCES OF OTHER FEDERAL, STATE, LOCAL AND FOREIGN TAX LAWS, AND APPLICABLE TAX TREATIES.
Distributions on Class A Common Stock
If we pay distributions on shares of our Class A common stock, such distributions will constitute dividends for U.S. federal income tax purposes to the extent paid from our current or accumulated earnings and profits, as determined under U.S. federal income tax principles. Distributions in excess of our current and accumulated earnings and profits will constitute a return of capital that is applied against and reduces, but not below zero, a non-U.S. holder’s adjusted tax basis in shares of our Class A common stock. Any remaining excess will be treated as gain realized on the sale or other disposition of our Class A common stock. See “—Dispositions of Class A Common Stock.”
Any dividend paid to a non-U.S. holder on our Class A common stock will generally be subject to U.S. federal withholding tax at a 30% rate. The withholding tax might not apply, however, or might apply at a reduced rate, under the terms of an applicable income tax treaty between the United States and the non-U.S. holder’s country of residence. You should consult your tax advisors regarding your entitlement to benefits under a relevant income tax treaty. Generally, in order for us or our paying agent to withhold tax at a lower treaty rate, a non-U.S. holder must certify its entitlement to treaty benefits. A non-U.S. holder generally can meet this certification requirement by providing an Internal Revenue Service, or IRS, Form W-8BEN or IRS Form W-8BEN-E, as applicable, to us or our paying agent. If the non-U.S. holder holds the stock through a financial institution or other agent acting on the holder’s behalf, the holder will be required to provide appropriate documentation to the agent. The holder’s agent will then be required to provide certification to us or our paying agent, either directly or through other intermediaries. A non-U.S. holder that does not timely furnish the required documentation, but that qualifies for a reduced treaty rate, may obtain a refund of any excess amounts withheld by timely filing an appropriate claim for refund with the IRS.
Dividends received by a non-U.S. holder that are effectively connected with a U.S. trade or business conducted by the non-U.S. holder and, if required by an applicable income tax treaty between the United States and the non-U.S. holder’s country of residence, are attributable to a permanent establishment (or, in certain cases involving individual holders, a fixed base) maintained by the non-U.S. holder in the United States, are not subject to such withholding tax. To obtain this exemption, a non-U.S. holder must provide us with an IRS Form W-8ECI properly certifying such exemption. Such effectively connected dividends, although not subject to withholding tax, are taxed at the same graduated rates applicable to U.S. persons, net of certain deductions and credits. In addition to the graduated tax described above, such effectively connected dividends received by corporate non-U.S. holders may also be subject to a branch profits tax at a rate of 30% or such lower rate as may be specified by an applicable income tax treaty.
Dispositions of Class A Common Stock
Subject to the discussion below on backup withholding and other withholding requirements, gain realized by a non-U.S. holder on a sale, exchange or other disposition of our Class A common stock generally will not be subject to U.S. federal income or withholding tax, unless:
| • | the gain (i) is effectively connected with the conduct by the non-U.S. holder of a U.S. trade or business and (ii) if required by an applicable income tax treaty between the United States and the non-U.S. holder’s country of residence, is attributable to a permanent establishment (or, in certain cases involving individual holders, a fixed base) maintained by the non-U.S. holder in the United States (in which case the special rules described below apply), |
| • | the non-U.S. holder is an individual who is present in the United States for 183 or more days in the taxable year of such disposition and certain other conditions are met (in which case the gain would be |
168
Table of Contents
| subject to a flat 30% tax, or such reduced rate as may be specified by an applicable income tax treaty, which may be offset by certain U.S. source capital losses), or |
| • | we are, or have been, a U.S. real property holding corporation, or a USRPHC, for U.S. federal income tax purposes at any time during the shorter of the five-year period ending on the date of disposition of our Class A common stock and the non-U.S. holder’s holding period for our Class A common stock. |
Generally, a corporation is a USRPHC if the fair market value of its “United States real property interests” equals 50% or more of the sum of the fair market value of (a) its worldwide real property interests and (b) its other assets used or held for use in a trade or business. The tax relating to stock in a USRPHC does not apply to a non-U.S. holder whose holdings, actual and constructive, amount to 5% or less of our Class A common stock at all times during the applicable period, provided that our Class A common stock is regularly traded on an established securities market. We believe we have not been and are not currently a USRPHC, and do not anticipate being a USRPHC in the future.
If any gain from the sale, exchange or other disposition of our Class A common stock, (1) is effectively connected with a U.S. trade or business conducted by a non-U.S. holder and (2) if required by an applicable income tax treaty between the United States and the non-U.S. holder’s country of residence, is attributable to a permanent establishment (or, in certain cases involving individuals, a fixed base) maintained by such non-U.S. holder in the United States, then the gain generally will be subject to U.S. federal income tax at the same graduated rates applicable to U.S. persons, net of certain deductions and credits. If the non-U.S. holder is a corporation, under certain circumstances, that portion of its earnings and profits that is effectively connected with its U.S. trade or business, subject to certain adjustments, generally would also be subject to a “branch profits tax.” The branch profits tax rate is generally 30%, although an applicable income tax treaty between the United States and the non-U.S. holder’s country of residence might provide for a lower rate.
U.S. Federal Estate Tax
Individuals, or an entity the property of which is includable in an individual’s gross estate for U.S. federal estate tax purposes, should note that any of our Class A common stock held at the time of such individual’s death will be included in such individual’s gross estate for U.S. federal estate tax purposes, and may be subject to U.S. federal estate tax, unless an applicable estate tax treaty provides otherwise.
Backup Withholding and Information Reporting
Any dividends that are paid to a non-U.S. holder must be reported annually to the IRS and to the non-U.S. holder. Copies of these information returns also may be made available to the tax authorities of the country in which the non-U.S. holder resides under the provisions of various treaties or agreements for the exchange of information. Unless the non-U.S. holder is an exempt recipient, dividends paid on our Class A common stock and the gross proceeds from a taxable disposition of our Class A common stock may be subject to additional information reporting and may also be subject to U.S. federal backup withholding if such non-U.S. holder fails to comply with applicable U.S. information reporting and certification requirements. Provision of any IRS Form W-8 appropriate to the non-U.S. holder’s circumstances will generally satisfy the certification requirements necessary to avoid the backup withholding.
Backup withholding is not an additional tax. Any amounts so withheld under the backup withholding rules will be refunded by the IRS or credited against the non-U.S. holder’s U.S. federal income tax liability, provided that the required information is timely furnished to the IRS.
Other Withholding Taxes
Provisions commonly referred to as “FATCA” impose withholding of 30% on payments of U.S.-source dividends and, beginning in 2017, on sales or other disposition proceeds, paid to “foreign financial institutions”
169
Table of Contents
(which is broadly defined for this purpose and in general includes investment vehicles) and certain other non-U.S. entities unless various U.S. information reporting and due diligence requirements (generally relating to ownership by U.S. persons of interests in or accounts with those entities) have been satisfied, or an exemption applies. An intergovernmental agreement between the United States and the entity’s jurisdiction may modify these requirements. If FATCA withholding is imposed, a beneficial owner that is not a foreign financial institution generally will be entitled to a refund of any amounts withheld by filing a U.S. federal income tax return (which may entail significant administrative burden). Non-U.S. holders should consult their tax advisors regarding the effects of FATCA on their investment in our Class A common stock.
THE PRECEDING DISCUSSION OF U.S. FEDERAL INCOME TAX AND ESTATE TAX CONSIDERATIONS IS FOR GENERAL INFORMATION ONLY. IT IS NOT TAX ADVICE. EACH PROSPECTIVE INVESTOR SHOULD CONSULT ITS OWN TAX ADVISOR REGARDING THE PARTICULAR U.S. FEDERAL, STATE, LOCAL AND FOREIGN TAX CONSEQUENCES OF PURCHASING, HOLDING AND DISPOSING OF OUR CLASS A COMMON STOCK, INCLUDING THE CONSEQUENCES OF ANY PROPOSED CHANGE IN APPLICABLE LAWS.
170
Table of Contents
and are acting as representatives of each of the underwriters named below. Subject to the terms and conditions set forth in an underwriting agreement among us and the underwriters, we have agreed to sell to the underwriters, and each of the underwriters has agreed, severally and not jointly, to purchase from us, the number of shares of Class A common stock set forth opposite its name below.
| Underwriter |
Number of Shares | |
|
| ||
| Total |
||
|
|
Subject to the terms and conditions set forth in the underwriting agreement, the underwriters have agreed, severally and not jointly, to purchase all of the shares of Class A common stock sold under the underwriting agreement if any of these shares are purchased. If an underwriter defaults, the underwriting agreement provides that the purchase commitments of the nondefaulting underwriters may be increased or the underwriting agreement may be terminated.
We have agreed to indemnify the underwriters against certain liabilities, including liabilities under the Securities Act, or to contribute to payments the underwriters may be required to make in respect of those liabilities.
The underwriters are offering the shares, subject to prior sale, when, as and if issued to and accepted by them, subject to approval of legal matters by their counsel, including the validity of the shares, and other conditions contained in the underwriting agreement, such as the receipt by the underwriters of officer’s certificates and legal opinions. The underwriters reserve the right to withdraw, cancel or modify offers to the public and to reject orders in whole or in part.
Prior to the offering, there has been no public market for the shares. The initial public offering price has been negotiated among us and the representatives. Among the factors to be considered in determining the initial public offering price of the shares, in addition to prevailing market conditions, will be our historical performance, estimates of our business potential and earnings prospects, an assessment of our management and the consideration of the above factors in relation to market valuation of companies in related businesses.
Commissions and Discounts
The representatives have advised us that the underwriters propose initially to offer the shares to the public at the public offering price set forth on the cover page of this prospectus and to dealers at that price less a concession not in excess of $ per share. After the initial offering, the public offering price, concession or any other term of the offering may be changed.
The following table shows the public offering price, underwriting discount and proceeds before expenses to us. The information assumes either no exercise or full exercise by the underwriters of their option to purchase additional shares.
| Per Share | Without Option | With Option | ||||||||||
| Initial public offering price |
$ | $ | $ | |||||||||
| Underwriting discount |
$ | $ | $ | |||||||||
| Proceeds, before expenses, to BKFS |
$ | $ | $ | |||||||||
171
Table of Contents
The expenses of the offering, not including the underwriting discount, are estimated at $ and are payable by us.
Option to Purchase Additional Shares
We have granted an option to the underwriters, exercisable for 30 days after the date of this prospectus, to purchase up to additional shares at the public offering price, less the underwriting discount, solely to cover overallotments. If the underwriters exercise this option, each will be obligated, subject to conditions contained in the underwriting agreement, to purchase a number of additional shares proportionate to that underwriter’s initial amount reflected in the above table.
No Sales of Similar Securities
In connection with this offering, we expect that our officers, directors and holders of substantially % of our outstanding common stock will enter into lock-up agreements with the underwriters of this offering that, subject to certain exceptions, prohibit the signing party from selling, contracting to sell or otherwise disposing of any Class A common stock or securities that are convertible or exchangeable for Class A common stock, including Units, or entering into any arrangement that transfers the economic consequences of ownership of our Class A common stock for at least 180 days from the date of this prospectus filed in connection with this offering, although the representatives may, in their sole discretion and at any time without notice, release all or any portion of the securities subject to these lock-up agreements. Upon a request to release any shares subject to a lock-up, the representatives would consider the particular circumstances surrounding the request including, but not limited to, the length of time before the lock-up expires, the number of shares requested to be released, reasons for the request, the possible impact on the market for our Class A common stock and whether the holder of our shares requesting the release is an officer, director or other affiliate of ours. As a result of these lock-up agreements, notwithstanding earlier eligibility for sale under the provisions of Rule 144 under the Securities Act, none of these shares would be allowed to be sold until at least 180 days after the date of this prospectus.
New York Stock Exchange Listing
We intend to file an application to list the Class A common stock on the NYSE under the symbol “BKFS.” In order to meet one of the requirements for listing the common stock on the NYSE, the underwriters have undertaken to sell lots of 100 or more shares to a minimum of 400 beneficial owners.
Price Stabilization, Short Positions
Until the distribution of the shares is completed, SEC rules may limit underwriters and selling group members from bidding for and purchasing our Class A common stock. However, the representatives may engage in transactions that stabilize the price of the common stock, such as bids or purchases to peg, fix or maintain that price.
In connection with the offering, the underwriters may purchase and sell our Class A common stock in the open market. These transactions may include short sales, purchases on the open market to cover positions created by short sales and stabilizing transactions. Short sales involve the sale by the underwriters of a greater number of shares than they are required to purchase in the offering. “Covered” short sales are sales made in an amount not greater than the underwriters’ option to purchase additional shares described above. The underwriters may close out any covered short position by either exercising their option to purchase additional shares or purchasing shares in the open market. In determining the source of shares to close out the covered short position, the underwriters will consider, among other things, the price of shares available for purchase in the open market as compared to the price at which they may purchase shares through the option granted to them. “Naked” short sales are sales in excess of such option. The underwriters must close out any naked short position by purchasing shares in the open market. A naked short position is more likely to be created if the underwriters are concerned that there may be downward pressure on the price of our Class A common stock in the open market after pricing that could adversely affect investors who purchase in the offering. Stabilizing transactions consist of various bids for or purchases of shares of common stock made by the underwriters in the open market prior to the completion of the offering.
172
Table of Contents
Similar to other purchase transactions, the underwriters’ purchases to cover the syndicate short sales may have the effect of raising or maintaining the market price of our Class A common stock or preventing or retarding a decline in the market price of our Class A common stock. As a result, the price of our Class A common stock may be higher than the price that might otherwise exist in the open market. The underwriters may conduct these transactions on the NYSE, in the over-the-counter market or otherwise.
Neither we nor any of the underwriters make any representation or prediction as to the direction or magnitude of any effect that the transactions described above may have on the price of our Class A common stock. In addition, neither we nor any of the underwriters make any representation that the representatives will engage in these transactions or that these transactions, once commenced, will not be discontinued without notice.
Electronic Distribution
In connection with the offering, certain of the underwriters or securities dealers may distribute prospectuses by electronic means, such as e-mail.
Other Relationships
Some of the underwriters and their affiliates have engaged in, and may in the future engage in, investment banking and other commercial dealings in the ordinary course of business with us or our affiliates. They have received, or may in the future receive, customary fees and commissions for these transactions.
In addition, in the ordinary course of their business activities, the underwriters and their affiliates may make or hold a broad array of investments and actively trade debt and equity securities (or related derivative securities) and financial instruments (including bank loans) for their own account and for the accounts of their customers. Such investments and securities activities may involve securities and/or instruments of ours or our affiliates. The underwriters and their affiliates may also make investment recommendations and/or publish or express independent research views in respect of such securities or financial instruments and may hold, or recommend to clients that they acquire, long and/or short positions in such securities and instruments.
Notice to Prospective Investors in the European Economic Area
In relation to each Member State of the European Economic Area (each, a “Relevant Member State”), no offer of shares may be made to the public in that Relevant Member State other than:
| (a) | to any legal entity which is a qualified investor as defined in the Prospectus Directive; |
| (b) | to fewer than 100 or, if the Relevant Member State has implemented the relevant provision of the 2010 PD Amending Directive, 150, natural or legal persons (other than qualified investors as defined in the Prospectus Directive), as permitted under the Prospectus Directive, subject to obtaining the prior consent of the representatives; or |
| (c) | in any other circumstances falling within Article 3(2) of the Prospectus Directive, |
provided that no such offer of shares shall require us or the representatives to publish a prospectus pursuant to Article 3 of the Prospectus Directive or supplement a prospectus pursuant to Article 16 of the Prospectus Directive.
Each person in a Relevant Member State who initially acquires any shares or to whom any offer is made will be deemed to have represented, acknowledged and agreed that it is a “qualified investor” within the meaning of the law in that Relevant Member State implementing Article 2(1)(e) of the Prospectus Directive. In the case of any shares being offered to a financial intermediary as that term is used in Article 3(2) of the Prospectus Directive, each such financial intermediary will be deemed to have represented, acknowledged and agreed that the shares
173
Table of Contents
acquired by it in the offer have not been acquired on a non-discretionary basis on behalf of, nor have they been acquired with a view to their offer or resale to, persons in circumstances which may give rise to an offer of any shares to the public other than their offer or resale in a Relevant Member State to qualified investors as so defined or in circumstances in which the prior consent of the representatives has been obtained to each such proposed offer or resale.
We, the representatives and their affiliates will rely upon the truth and accuracy of the foregoing representations, acknowledgements and agreements.
This prospectus has been prepared on the basis that any offer of shares in any Relevant Member State will be made pursuant to an exemption under the Prospectus Directive from the requirement to publish a prospectus for offers of shares. Accordingly any person making or intending to make an offer in that Relevant Member State of shares which are the subject of the offering contemplated in this prospectus may only do so in circumstances in which no obligation arises for us or any of the underwriters to publish a prospectus pursuant to Article 3 of the Prospectus Directive in relation to such offer. Neither we nor the underwriters have authorized, nor do they authorize, the making of any offer of shares in circumstances in which an obligation arises for us or the underwriters to publish a prospectus for such offer.
For the purpose of the above provisions, the expression “an offer to the public” in relation to any shares in any Relevant Member State means the communication in any form and by any means of sufficient information on the terms of the offer and the shares to be offered so as to enable an investor to decide to purchase or subscribe the shares, as the same may be varied in the Relevant Member State by any measure implementing the Prospectus Directive in the Relevant Member State and the expression “Prospectus Directive” means Directive 2003/71/EC (including the 2010 PD Amending Directive, to the extent implemented in the Relevant Member States) and includes any relevant implementing measure in the Relevant Member State and the expression “2010 PD Amending Directive” means Directive 2010/73/EU.
Notice to Prospective Investors in the United Kingdom
In addition, in the United Kingdom, this document is being distributed only to, and is directed only at, and any offer subsequently made may only be directed at persons who are “qualified investors” (as defined in the Prospectus Directive) (i) who have professional experience in matters relating to investments falling within Article 19 (5) of the Financial Services and Markets Act 2000 (Financial Promotion) Order 2005, as amended (the “Order”) and/or (ii) who are high net worth companies (or persons to whom it may otherwise be lawfully communicated) falling within Article 49(2)
(a) to (d) of the Order (all such persons together being referred to as “relevant persons”). This document must not be acted on or relied on in the United Kingdom by persons who are not relevant persons. In the United Kingdom, any investment or investment activity to which this document relates is only available to, and will be engaged in with, relevant persons.
Notice to Prospective Investors in Switzerland
The shares may not be publicly offered in Switzerland and will not be listed on the SIX Swiss Exchange (“SIX”) or on any other stock exchange or regulated trading facility in Switzerland. This document has been prepared without regard to the disclosure standards for issuance prospectuses under art. 652a or art. 1156 of the Swiss Code of Obligations or the disclosure standards for listing prospectuses under art. 27 ff. of the SIX Listing Rules or the listing rules of any other stock exchange or regulated trading facility in Switzerland. Neither this document nor any other offering or marketing material relating to the shares or the offering may be publicly distributed or otherwise made publicly available in Switzerland.
Neither this document nor any other offering or marketing material relating to the offering, us or the shares have been or will be filed with or approved by any Swiss regulatory authority. In particular, this document will not be
174
Table of Contents
filed with, and the offer of shares will not be supervised by, the Swiss Financial Market Supervisory Authority FINMA (FINMA), and the offer of shares has not been and will not be authorized under the Swiss Federal Act on Collective Investment Schemes (“CISA”). The investor protection afforded to acquirers of interests in collective investment schemes under the CISA does not extend to acquirers of shares.
Notice to Prospective Investors in the Dubai International Financial Centre
This prospectus relates to an Exempt Offer in accordance with the Offered Securities Rules of the Dubai Financial Services Authority (“DFSA”). This prospectus is intended for distribution only to persons of a type specified in the Offered Securities Rules of the DFSA. It must not be delivered to, or relied on by, any other person. The DFSA has no responsibility for reviewing or verifying any documents in connection with Exempt Offers. The DFSA has not approved this prospectus nor taken steps to verify the information set forth herein and has no responsibility for the prospectus. The shares to which this prospectus relates may be illiquid and/or subject to restrictions on their resale. Prospective purchasers of the shares offered should conduct their own due diligence on the shares. If you do not understand the contents of this prospectus you should consult an authorized financial advisor.
Notice to Prospective Investors in Australia
No placement document, prospectus, product disclosure statement or other disclosure document has been lodged with the Australian Securities and Investments Commission (“ASIC”), in relation to the offering. This prospectus does not constitute a prospectus, product disclosure statement or other disclosure document under the Corporations Act 2001 (the “Corporations Act”), and does not purport to include the information required for a prospectus, product disclosure statement or other disclosure document under the Corporations Act.
Any offer in Australia of the shares may only be made to persons (the “Exempt Investors”) who are “sophisticated investors” (within the meaning of section 708(8) of the Corporations Act), “professional investors” (within the meaning of section 708(11) of the Corporations Act) or otherwise pursuant to one or more exemptions contained in section 708 of the Corporations Act so that it is lawful to offer the shares without disclosure to investors under Chapter 6D of the Corporations Act.
The shares applied for by Exempt Investors in Australia must not be offered for sale in Australia in the period of 12 months after the date of allotment under the offering, except in circumstances where disclosure to investors under Chapter 6D of the Corporations Act would not be required pursuant to an exemption under section 708 of the Corporations Act or otherwise or where the offer is pursuant to a disclosure document which complies with Chapter 6D of the Corporations Act. Any person acquiring shares must observe such Australian on-sale restrictions.
This prospectus contains general information only and does not take account of the investment objectives, financial situation or particular needs of any particular person. It does not contain any securities recommendations or financial product advice. Before making an investment decision, investors need to consider whether the information in this prospectus is appropriate to their needs, objectives and circumstances, and, if necessary, seek expert advice on those matters.
Notice to Prospective Investors in Hong Kong
The shares have not been offered or sold and will not be offered or sold in Hong Kong, by means of any document, other than (a) to “professional investors” as defined in the Securities and Futures Ordinance (Cap. 571) of Hong Kong and any rules made under that Ordinance; or (b) in other circumstances which do not result in the document being a “prospectus” as defined in the Companies Ordinance (Cap. 32) of Hong Kong or which do not constitute an offer to the public within the meaning of that Ordinance. No advertisement, invitation or document relating to the shares has been or may be issued or has been or may be in the possession of any
175
Table of Contents
person for the purposes of issue, whether in Hong Kong or elsewhere, which is directed at, or the contents of which are likely to be accessed or read by, the public of Hong Kong (except if permitted to do so under the securities laws of Hong Kong) other than with respect to shares which are or are intended to be disposed of only to persons outside Hong Kong or only to “professional investors” as defined in the Securities and Futures Ordinance and any rules made under that Ordinance.
Notice to Prospective Investors in Japan
The shares have not been and will not be registered under the Financial Instruments and Exchange Law of Japan (Law No. 25 of 1948, as amended) and, accordingly, will not be offered or sold, directly or indirectly, in Japan, or for the benefit of any Japanese Person or to others for re-offering or resale, directly or indirectly, in Japan or to any Japanese Person, except in compliance with all applicable laws, regulations and ministerial guidelines promulgated by relevant Japanese governmental or regulatory authorities in effect at the relevant time. For the purposes of this paragraph, “Japanese Person” shall mean any person resident in Japan, including any corporation or other entity organized under the laws of Japan.
Notice to Prospective Investors in Singapore
This prospectus has not been registered as a prospectus with the Monetary Authority of Singapore. Accordingly, this prospectus and any other document or material in connection with the offer or sale, or invitation for subscription or purchase, of Non-CIS Securities may not be circulated or distributed, nor may the Non-CIS Securities be offered or sold, or be made the subject of an invitation for subscription or purchase, whether directly or indirectly, to persons in Singapore other than (i) to an institutional investor under Section 274 of the Securities and Futures Act, Chapter 289 of Singapore (the “SFA”), (ii) to a relevant person pursuant to Section 275(1), or any person pursuant to Section 275(1A), and in accordance with the conditions specified in Section 275, of the SFA, or (iii) otherwise pursuant to, and in accordance with the conditions of, any other applicable provision of the SFA.
Where the Non-CIS Securities are subscribed or purchased under Section 275 of the SFA by a relevant person which is:
| (a) | a corporation (which is not an accredited investor (as defined in Section 4A of the SFA)) the sole business of which is to hold investments and the entire share capital of which is owned by one or more individuals, each of whom is an accredited investor; or |
| (b) | a trust (where the trustee is not an accredited investor) whose sole purpose is to hold investments and each beneficiary of the trust is an individual who is an accredited investor, |
securities (as defined in Section 239(1) of the SFA) of that corporation or the beneficiaries’ rights and interest (howsoever described) in that trust shall not be transferred within six months after that corporation or that trust has acquired the Non-CIS Securities pursuant to an offer made under Section 275 of the SFA except:
| (a) | to an institutional investor or to a relevant person defined in Section 275(2) of the SFA, or to any person arising from an offer referred to in Section 275(1A) or Section 276(4)(i)(B) of the SFA; |
| (b) | where no consideration is or will be given for the transfer; |
| (c) | where the transfer is by operation of law; |
| (d) | as specified in Section 276(7) of the SFA; or |
| (e) | as specified in Regulation 32 of the Securities and Futures (Offers of Investments) (Shares and Debentures) Regulations 2005 of Singapore. |
176
Table of Contents
Weil, Gotshal & Manges LLP, New York, New York, has passed upon the validity of the Class A common stock offered hereby on behalf of us. The validity of the shares of Class A common stock offered hereby will be passed upon on behalf of the underwriters by Sullivan & Cromwell LLP, Los Angeles, California.
The consolidated financial statements of Lender Processing Services, Inc. as of December 31, 2013 and 2012 and for each of the years in the three-year period ended December 31, 2013 have been included herein and in the registration statement in reliance upon the report of KPMG LLP, an independent registered public accounting firm, appearing elsewhere herein, and upon the authority of said firm as experts in accounting and auditing.
The combined financial statements of Black Knight Financial Services, LLC as of December 31, 2013 and for the period from October 16, 2013 (date of inception) through December 31, 2013 have been included herein and in the registration statement in reliance upon the report of KPMG LLP, an independent registered public accounting firm, appearing elsewhere herein, and upon the authority of said firm as experts in accounting and auditing.
The balance sheet of Black Knight Financial Services, Inc. as of October 27, 2014 (date of inception) has been included herein and in the registration statement in reliance upon the report of KPMG LLP, an independent registered public accounting firm, appearing elsewhere herein, and upon the authority of said firm as experts in accounting and auditing.
WHERE YOU CAN FIND MORE INFORMATION
We have filed with the SEC a registration statement on Form S-1 under the Securities Act with respect to the shares of our Class A common stock offered by this prospectus. For purposes of this section, the term registration statement means the original registration statement and any and all amendments including the schedules and exhibits to the original registration statement or any amendment. This prospectus, filed as part of the registration statement, does not contain all of the information set forth in the registration statement or the exhibits and schedules thereto as permitted by the rules and regulations of the SEC. For further information about us and our Class A common stock, you should refer to the registration statement, including the exhibits. This prospectus summarizes provisions that we consider material of certain contracts and other documents to which we refer you. Because the summaries may not contain all of the information that you may find important, you should review the full text of those documents.
The registration statement, including its exhibits and schedules, may be inspected and copied at the public reference facilities maintained by the SEC at 100 F Street, N.E., Room 1580, Washington, D.C. 20549. You may obtain information on the operation of the public reference room by calling 1-202-551-8909. Copies of such materials are also available by mail from the Public Reference Branch of the SEC at 100 F Street, N.E., Room 1580, Washington, D.C. 20549 at prescribed rates. In addition, the SEC maintains a website at (http://www.sec.gov) from which interested persons can electronically access the registration statement, including the exhibits and schedules to the registration statement.
We have not authorized anyone to give you any information or to make any representations about us or the transactions we discuss in this prospectus other than those contained in this prospectus. If you are given any information or representations about these matters that is not discussed in this prospectus, you must not rely on that information. This prospectus is not an offer to sell or a solicitation of an offer to buy securities anywhere or to anyone where or to whom we are not permitted to offer or sell securities under applicable law.
177
Table of Contents
INDEX TO CONSOLIDATED FINANCIAL STATEMENTS
| Page | ||||
| BLACK KNIGHT FINANCIAL SERVICES, LLC |
||||
| Unaudited Condensed Consolidated Financial Statements |
||||
| F-2 | ||||
| F-3 | ||||
| F-4 | ||||
| Unaudited Consolidated Statement of Members’ Equity for the nine months ended September 30, 2014 |
F-5 | |||
| F-6 | ||||
| Notes to Unaudited Condensed Consolidated Financial Statements |
F-7 | |||
| LENDER PROCESSING SERVICES, INC. AND SUBSIDIARIES (Predecessor) |
||||
| Audited Consolidated Financial Statements |
||||
| F-26 | ||||
| Consolidated Balance Sheets as of December 31, 2013 and 2012 |
F-27 | |||
| Consolidated Statements of Earnings for the years ended December 31, 2013, 2012, and 2011 |
F-28 | |||
| F-29 | ||||
| F-30 | ||||
| Consolidated Statements of Cash Flows for the years ended December 31, 2013, 2012, and 2011 |
F-31 | |||
| F-32 | ||||
| BLACK KNIGHT FINANCIAL SERVICES, LLC (FIDELITY NATIONAL COMMERCE VELOCITY, LLC AND PROPERTY INSIGHT, LLC) |
||||
| Audited Combined Financial Statements |
||||
| F-66 | ||||
| F-67 | ||||
| F-68 | ||||
| F-69 | ||||
| F-70 | ||||
| F-71 | ||||
| BLACK KNIGHT FINANCIAL SERVICES, INC |
||||
| Audited Financial Statement |
||||
| F-80 | ||||
| F-81 | ||||
| F-82 | ||||
F-1
Table of Contents
BLACK KNIGHT FINANCIAL SERVICES, LLC
Condensed Consolidated Balance Sheets
(In millions)
| Successor | Predecessor | |||||||
| September 30, 2014 (Unaudited) |
December 31, 2013 (Audited) |
|||||||
| ASSETS |
| |||||||
| Current assets: |
||||||||
| Cash and cash equivalents |
$ | 52.4 | $ | 329.6 | ||||
| Trade receivables, net |
128.1 | 204.8 | ||||||
| Prepaid expenses and other current assets (inclusive of $2.9 of related party prepaid fees as of September 30, 2014) |
30.5 | 66.4 | ||||||
| Deferred income taxes, net |
— | 102.1 | ||||||
| Receivables from related parties |
11.7 | — | ||||||
|
|
|
|
|
|||||
| Total current assets |
222.7 | 702.9 | ||||||
| Property and equipment, net |
131.5 | 119.8 | ||||||
| Computer software, net |
505.8 | 252.2 | ||||||
| Other intangible assets, net |
438.3 | 17.8 | ||||||
| Goodwill |
2,209.7 | 1,109.3 | ||||||
| Other non-current assets (inclusive of investments carried at fair value as of December 31, 2013)—see note 4 |
100.3 | 284.7 | ||||||
|
|
|
|
|
|||||
| Total assets |
$ | 3,608.3 | $ | 2,486.7 | ||||
|
|
|
|
|
|||||
| LIABILITIES, REDEEMABLE MEMBER’S INTEREST AND EQUITY |
| |||||||
| Current liabilities: |
||||||||
| Trade accounts payable and other accrued liabilities |
$ | 37.0 | $ | 104.3 | ||||
| Accrued salaries and benefits |
47.0 | 89.6 | ||||||
| Legal and regulatory accrual |
3.9 | 99.3 | ||||||
| Current portion of long-term debt (all due to related party as of September 30, 2014) |
48.3 | 60.2 | ||||||
| Accrued interest (inclusive of $0.1 due to related party as of September 30, 2014) |
15.9 | 7.7 | ||||||
| Payable to related parties |
6.6 | — | ||||||
| Deferred revenues |
23.8 | 54.7 | ||||||
| Title claims reserve |
— | 66.3 | ||||||
|
|
|
|
|
|||||
| Total current liabilities |
182.5 | 482.1 | ||||||
| Deferred revenues |
26.0 | 34.7 | ||||||
| Deferred income taxes, net |
— | 226.1 | ||||||
| Long-term debt, net of current portion (inclusive of $1,490.1 due to related party as of September 30, 2014) |
2,106.7 | 1,007.9 | ||||||
| Other non-current liabilities |
14.6 | 32.9 | ||||||
|
|
|
|
|
|||||
| Total liabilities |
2,329.8 | 1,783.7 | ||||||
|
|
|
|
|
|||||
| Commitments and contingencies (note 7) |
||||||||
| Redeemable members’ interest (note 1 and note 2) |
353.1 | — | ||||||
| Equity: |
||||||||
| Preferred stock $0.0001 par value; 50 million shares authorized, none issued as of December 31, 2013 |
— | — | ||||||
| Common stock $0.0001 par value; 500 million shares authorized, 97.4 million shares issued as of December 31, 2013 |
— | — | ||||||
| Additional paid-in capital |
— | 229.4 | ||||||
| Contributed member capital |
1,079.1 | — | ||||||
| (Accumulated loss) retained earnings |
(153.6 | ) | 762.0 | |||||
| Accumulated other comprehensive loss |
(0.1 | ) | (2.8 | ) | ||||
| Treasury stock at cost; 9.5 million shares as of December 31, 2013 |
— | (285.6 | ) | |||||
|
|
|
|
|
|||||
| Total equity |
925.4 | 703.0 | ||||||
|
|
|
|
|
|||||
| Total liabilities, redeemable member’s interest and equity |
$ | 3,608.3 | $ | 2,486.7 | ||||
|
|
|
|
|
|||||
See accompanying notes to condensed consolidated financial statements (unaudited).
F-2
Table of Contents
BLACK KNIGHT FINANCIAL SERVICES, LLC
Condensed Consolidated Statements of Operations
(Unaudited, in millions, except per share data)
| Successor | Predecessor | |||||||||||||||||||
| Three Months Ended September 30, 2014 |
Period January 2, 2014 through September 30, 2014 |
One Day Ended January 1, 2014 |
Three Months Ended September 30, 2013 |
Nine Months Ended September 30, 2013 |
||||||||||||||||
| Revenues—see note 5 for related party activity |
$ | 215.0 | $ | 631.8 | $ | — | $ | 417.2 | $ | 1,353.8 | ||||||||||
| Expenses: |
||||||||||||||||||||
| Operating expenses—see note 5 for related party activity |
124.8 | 392.3 | — | 316.5 | 1,003.8 | |||||||||||||||
| Depreciation and amortization |
47.9 | 143.1 | — | 25.6 | 77.8 | |||||||||||||||
| Legal and regulatory charges |
— | — | — | 2.4 | 54.0 | |||||||||||||||
| Exit costs, impairments and other charges |
— | — | — | 10.3 | 12.0 | |||||||||||||||
| Transition and integration costs—see note 5 for related party activity |
8.2 | 111.1 | 50.1 | — | — | |||||||||||||||
|
|
|
|
|
|
|
|
|
|
|
|||||||||||
| Total expenses |
180.9 | 646.5 | 50.1 | 354.8 | 1,147.6 | |||||||||||||||
|
|
|
|
|
|
|
|
|
|
|
|||||||||||
| Operating income (expense) |
34.1 | (14.7 | ) | (50.1 | ) | 62.4 | 206.2 | |||||||||||||
|
|
|
|
|
|
|
|
|
|
|
|||||||||||
| Other income and expense: |
||||||||||||||||||||
| Interest income |
— | — | — | 0.6 | 1.7 | |||||||||||||||
| Interest expense—see note 5 for related party activity |
(32.6 | ) | (96.8 | ) | — | (13.0 | ) | (39.6 | ) | |||||||||||
| Other (expense) income, net |
(3.1 | ) | (11.1 | ) | — | (0.1 | ) | 0.2 | ||||||||||||
|
|
|
|
|
|
|
|
|
|
|
|||||||||||
| Total other expense, net |
(35.7 | ) | (107.9 | ) | — | (12.5 | ) | (37.7 | ) | |||||||||||
|
|
|
|
|
|
|
|
|
|
|
|||||||||||
| (Loss) income from continuing operations before income taxes |
(1.6 | ) | (122.6 | ) | (50.1 | ) | 49.9 | 168.5 | ||||||||||||
| Provision for income tax expense (benefit) |
0.2 | (5.5 | ) | (11.1 | ) | 15.1 | 59.0 | |||||||||||||
|
|
|
|
|
|
|
|
|
|
|
|||||||||||
| Net (loss) earnings from continuing operations |
(1.8 | ) | (117.1 | ) | (39.0 | ) | 34.8 | 109.5 | ||||||||||||
| (Loss) earnings from discontinued operations |
(0.7 | ) | (0.7 | ) | — | 0.7 | (1.0 | ) | ||||||||||||
|
|
|
|
|
|
|
|
|
|
|
|||||||||||
| Net (loss) earnings |
$ | (2.5 | ) | $ | (117.8 | ) | $ | (39.0 | ) | $ | 35.5 | $ | 108.5 | |||||||
|
|
|
|
|
|
|
|
|
|
|
|||||||||||
| Net earnings per share—basic from continuing operations |
$ | 0.41 | $ | 1.29 | ||||||||||||||||
| Net earnings (loss) per share—basic from discontinued operations |
0.01 | (0.01 | ) | |||||||||||||||||
|
|
|
|
|
|||||||||||||||||
| Net earnings per share—basic |
$ | 0.42 | $ | 1.28 | ||||||||||||||||
|
|
|
|
|
|||||||||||||||||
| Weighted average shares outstanding—basic |
85.3 | 85.1 | ||||||||||||||||||
|
|
|
|
|
|||||||||||||||||
| Net earnings per share—diluted from continuing operations |
$ | 0.40 | $ | 1.28 | ||||||||||||||||
| Net earnings (loss) per share—diluted from discontinued operations |
0.01 | (0.01 | ) | |||||||||||||||||
|
|
|
|
|
|||||||||||||||||
| Net earnings per share—diluted |
$ | 0.41 | $ | 1.27 | ||||||||||||||||
|
|
|
|
|
|||||||||||||||||
| Weighted average shares outstanding—diluted |
86.0 | 85.6 | ||||||||||||||||||
|
|
|
|
|
|||||||||||||||||
| Cash dividends declared per share |
$ | 0.10 | $ | 0.30 | ||||||||||||||||
|
|
|
|
|
|||||||||||||||||
See accompanying notes to condensed consolidated financial statements (unaudited).
F-3
Table of Contents
BLACK KNIGHT FINANCIAL SERVICES, LLC
Condensed Consolidated Statements of Comprehensive Earnings (Loss)
(Unaudited, in millions)
| Successor | Predecessor | |||||||||||||||||||
| Three Months Ended September 30, 2014 |
Period January 2, 2014 through September 30, 2014 |
One Day Ended January 1, 2014 |
Three Months Ended September 30, 2013 |
Nine Months Ended September 30, 2013 |
||||||||||||||||
| Net (loss) earnings |
$ | (2.5 | ) | $ | (117.8 | ) | $ | (39.0 | ) | $ | 35.5 | $ | 108.5 | |||||||
| Other comprehensive loss: |
||||||||||||||||||||
| Unrealized gain (loss) on investments, net of tax(1) |
— | — | — | 0.1 | (2.0 | ) | ||||||||||||||
|
|
|
|
|
|
|
|
|
|
|
|||||||||||
| Unrealized (loss) gain on interest rate swaps, net of tax(2): |
||||||||||||||||||||
| Unrealized holding (losses) gains |
— | — | — | (0.8 | ) | 0.3 | ||||||||||||||
| Reclassification adjustments for losses included in net earnings |
— | — | — | 0.7 | 1.9 | |||||||||||||||
|
|
|
|
|
|
|
|
|
|
|
|||||||||||
| Total unrealized (loss) gain on interest rate swaps, net of tax(2) |
— | — | — | (0.1 | ) | 2.2 | ||||||||||||||
|
|
|
|
|
|
|
|
|
|
|
|||||||||||
| Currency translation adjustment |
(0.1 | ) | (0.1 | ) | — | (0.1 | ) | (0.2 | ) | |||||||||||
|
|
|
|
|
|
|
|
|
|
|
|||||||||||
| Other comprehensive loss |
(0.1 | ) | (0.1 | ) | — | (0.1 | ) | — | ||||||||||||
|
|
|
|
|
|
|
|
|
|
|
|||||||||||
| Comprehensive (loss) earnings |
$ | (2.6 | ) | $ | (117.9 | ) | $ | (39.0 | ) | $ | 35.4 | $ | 108.5 | |||||||
|
|
|
|
|
|
|
|
|
|
|
|||||||||||
| (1) | Net of income tax benefit of $1.3 million for the nine months ended September 30, 2013. |
| (2) | Net of income tax benefit (expense) of $0.1 million and $(1.3) million for the three and nine months ended September 30, 2013, respectively. |
See accompanying notes to condensed consolidated financial statements (unaudited).
F-4
Table of Contents
BLACK KNIGHT FINANCIAL SERVICES, LLC
Condensed Consolidated Statement of Members’ Equity
(Unaudited, in millions)
| For the Nine Months Ended September 30, 2014 | ||||||||||||||||||||||||||||||||||||||||
| Common Shares |
Common Stock |
Additional Paid-In Capital |
Contributed Member Capital |
Retained Earnings (Accumulated Loss) |
Accumulated Other Comprehensive Loss |
Treasury Shares |
Treasury Stock |
Total Equity |
Redeemable Member’s Interest |
|||||||||||||||||||||||||||||||
| Predecessor | ||||||||||||||||||||||||||||||||||||||||
| Balances, December 31, 2013 |
97.4 | $ | — | $ | 229.4 | $ | — | $ | 762.0 | $ | (2.8 | ) | (9.5 | ) | $ | (285.6 | ) | $ | 703.0 | $ | — | |||||||||||||||||||
| Net loss |
— | — | — | — | (39.0 | ) | — | — | — | (39.0 | ) | — | ||||||||||||||||||||||||||||
|
|
|
|
|
|
|
|
|
|
|
|
|
|
|
|
|
|
|
|
|
|||||||||||||||||||||
| Balances, January 1, 2014 |
97.4 | $ | — | $ | 229.4 | $ | — | $ | 723.0 | $ | (2.8 | ) | (9.5 | ) | $ | (285.6 | ) | $ | 664.0 | $ | — | |||||||||||||||||||
|
|
|
|
|
|
|
|
|
|
|
|
|
|
|
|
|
|
|
|
|
|||||||||||||||||||||
| Successor | ||||||||||||||||||||||||||||||||||||||||
| Balances, January 1, 2014 |
97.4 | $ | — | $ | 229.4 | $ | — | $ | 723.0 | $ | (2.8 | ) | (9.5 | ) | $ | (285.6 | ) | $ | 664.0 | $ | — | |||||||||||||||||||
| Acquisition of Lender Processing Services, Inc. by Fidelity National Financial, Inc. (“FNF”) |
(97.4 | ) | — | $ | 3,144.4 | — | (723.0 | ) | 2.8 | 9.5 | 285.6 | 2,709.8 | — | |||||||||||||||||||||||||||
| Assumption of debt from FNF |
— | — | (1,858.0 | ) | — | — | — | — | — | (1,858.0 | ) | — | ||||||||||||||||||||||||||||
| Conversion to Limited Liability Company |
— | — | (1,515.8 | ) | 1,515.8 | — | — | — | — | — | — | |||||||||||||||||||||||||||||
| Distribution of Transaction Services businesses to ServiceLink Holdings, LLC |
— | — | — | (1,344.8 | ) | — | — | — | — | (1,344.8 | ) | — | ||||||||||||||||||||||||||||
| Distribution of deferred tax liability to FNF |
— | — | — | 422.5 | — | — | — | — | 422.5 | — | ||||||||||||||||||||||||||||||
| Contribution from FNF |
— | — | — | 348.9 | — | — | — | — | 348.9 | — | ||||||||||||||||||||||||||||||
| Contribution of Fidelity National Commerce Velocity, LLC from FNF |
— | — | — | 62.2 | (26.0 | ) | — | — | — | 36.2 | — | |||||||||||||||||||||||||||||
| Contribution from Member (Thomas H. Lee Partners, L.P.) |
— | — | — | — | — | — | — | — | — | 350.0 | ||||||||||||||||||||||||||||||
| Return of capital to Members |
— | — | — | (9.5 | ) | — | — | — | — | (9.5 | ) | (7.4 | ) | |||||||||||||||||||||||||||
| Contribution of Property Insight, LLC from FNF |
— | — | — | 95.0 | 3.2 | — | — | — | 98.2 | — | ||||||||||||||||||||||||||||||
| Dividend of Property Insight assets to FNF |
— | — | — | — | (9.8 | ) | — | — | — | (9.8 | ) | — | ||||||||||||||||||||||||||||
| Distribution to Member |
— | — | — | (8.2 | ) | — | — | — | — | (8.2 | ) | — | ||||||||||||||||||||||||||||
| Profits interest |
— | — | — | (4.5 | ) | — | — | — | — | (4.5 | ) | 9.0 | ||||||||||||||||||||||||||||
| Dividend profits interest to FNF for awards granted to non-employees |
— | — | — | 1.7 | (3.2 | ) | — | — | — | (1.5 | ) | 1.5 | ||||||||||||||||||||||||||||
| Net loss |
— | — | — | — | (117.8 | ) | — | — | — | (117.8 | ) | — | ||||||||||||||||||||||||||||
| Currency translation adjustment |
— | — | — | — | — | (0.1 | ) | — | — | (0.1 | ) | — | ||||||||||||||||||||||||||||
|
|
|
|
|
|
|
|
|
|
|
|
|
|
|
|
|
|
|
|
|
|||||||||||||||||||||
| Balances, September 30, 2014 |
— | — | $ | — | $ | 1,079.1 | $ | (153.6 | ) | $ | (0.1 | ) | — | — | $ | 925.4 | $ | 353.1 | ||||||||||||||||||||||
|
|
|
|
|
|
|
|
|
|
|
|
|
|
|
|
|
|
|
|
|
|||||||||||||||||||||
See accompanying notes to condensed consolidated financial statements (unaudited).
F-5
Table of Contents
BLACK KNIGHT FINANCIAL SERVICES, LLC
Condensed Consolidated Statements of Cash Flows
(Unaudited, in millions)
| Successor | Predecessor | |||||||||||
| Period January 2, 2014 through September 30, 2014 |
On Day Ended January 1, 2014 |
Nine Months Ended September 30, 2013 |
||||||||||
| Cash flows from operating activities: |
||||||||||||
| Net (loss) earnings |
$ | (117.8 | ) | $ | (39.0 | ) | $ | 108.5 | ||||
| Adjustments to reconcile net (loss) earnings to net cash (used in) provided by operating activities: |
||||||||||||
| Depreciation and amortization |
143.2 | — | 78.6 | |||||||||
| Amortization of bond premium |
(1.6 | ) | — | — | ||||||||
| Amortization of debt issuance costs |
— | — | 3.1 | |||||||||
| Asset impairment charges |
— | — | 0.8 | |||||||||
| Equity based compensation |
5.3 | — | 20.8 | |||||||||
| Income tax effect of equity compensation |
— | — | (0.9 | ) | ||||||||
| Changes in assets and liabilities: |
||||||||||||
| Trade receivables |
(22.4 | ) | — | 41.3 | ||||||||
| Other receivables, including receivables from related parties |
5.2 | — | (2.5 | ) | ||||||||
| Income tax receivable |
24.6 | (11.1 | ) | — | ||||||||
| Prepaid expenses and other assets |
(29.4 | ) | — | (11.2 | ) | |||||||
| Deferred revenues |
13.6 | — | 1.8 | |||||||||
| Accounts payable and other accrued liabilities |
(41.6 | ) | (1.1 | ) | (187.3 | ) | ||||||
| Deferred income taxes, net |
— | — | 54.6 | |||||||||
|
|
|
|
|
|
|
|||||||
| Net cash (used in) provided by operating activities |
(20.9 | ) | (51.2 | ) | 107.6 | |||||||
|
|
|
|
|
|
|
|||||||
| Cash flows from investing activities: |
||||||||||||
| Additions to property and equipment |
(10.9 | ) | — | (20.2 | ) | |||||||
| Additions to computer software |
(33.2 | ) | — | (65.9 | ) | |||||||
| Purchases of investments, net of proceeds from sales |
— | — | (8.1 | ) | ||||||||
| Acquisition of title plants and property records data |
— | — | (18.5 | ) | ||||||||
| Proceeds from sale of PCLender |
1.5 | — | — | |||||||||
|
|
|
|
|
|
|
|||||||
| Net cash used in investing activities |
(42.6 | ) | — | (112.7 | ) | |||||||
|
|
|
|
|
|
|
|||||||
| Cash flows from financing activities: |
||||||||||||
| Borrowings |
88.0 | — | — | |||||||||
| Debt service payments (including $57.6 to related parties) |
(880.8 | ) | — | — | ||||||||
| Contribution from THL |
350.0 | — | — | |||||||||
| Termination payment of interest rate swaps |
(4.5 | ) | — | — | ||||||||
| Exercise of stock options |
— | — | (2.2 | ) | ||||||||
| Income tax effect of equity compensation |
— | — | 0.9 | |||||||||
| Contribution from member |
348.9 | — | — | |||||||||
| Net proceeds from sale of National Title Insurance of New York to FNF |
50.2 | — | — | |||||||||
| Contribution of Fidelity National Commerce Velocity, LLC from FNF |
0.7 | — | — | |||||||||
| Contribution of Property Insight from FNF |
6.7 | — | — | |||||||||
| Distribution of Transaction Services businesses to ServiceLink Holdings, LLC |
(96.6 | ) | — | — | ||||||||
| Distributions to members |
(25.1 | ) | — | — | ||||||||
| Dividends paid to Lender Processing Services, Inc. common shareholders |
— | — | (25.7 | ) | ||||||||
| Payment of contingent consideration related to acquisitions |
— | — | (0.9 | ) | ||||||||
|
|
|
|
|
|
|
|||||||
| Net cash used in financing activities |
(162.5 | ) | — | (27.9 | ) | |||||||
|
|
|
|
|
|
|
|||||||
| Net decrease in cash and cash equivalents |
(226.0 | ) | (51.2 | ) | (33.0 | ) | ||||||
| Cash and cash equivalents, beginning of period |
278.4 | 329.6 | 236.2 | |||||||||
|
|
|
|
|
|
|
|||||||
| Cash and cash equivalents, end of period |
$ | 52.4 | $ | 278.4 | $ | 203.2 | ||||||
|
|
|
|
|
|
|
|||||||
| Supplemental disclosures of cash flow information: |
||||||||||||
| Cash paid for interest |
$ | (90.7 | ) | $ | — | $ | (30.4 | ) | ||||
|
|
|
|
|
|
|
|||||||
| Net cash tax refunds (payments) |
$ | 30.9 | $ | — | $ | (7.0 | ) | |||||
|
|
|
|
|
|
|
|||||||
See accompanying notes to condensed consolidated financial statements (unaudited).
F-6
Table of Contents
BLACK KNIGHT FINANCIAL SERVICES, LLC
NOTES TO CONDENSED CONSOLIDATED FINANCIAL STATEMENTS (Unaudited)
Except as otherwise indicated or unless the context otherwise requires, all references to “BKFS, “the Company” or “we “ are to Black Knight Financial Services, LLC, a Delaware limited liability company.
| (1) | Basis of Presentation |
The accompanying unaudited condensed consolidated financial statements were prepared in accordance with U.S. generally accepted accounting principles (“GAAP”), and all adjustments considered necessary for a fair presentation have been included. All significant intercompany accounts and transactions have been eliminated. The preparation of these condensed consolidated financial statements in conformity with GAAP requires management to make estimates and assumptions that affect the reported amounts of assets and liabilities and disclosure of contingent assets and liabilities at the date of the condensed consolidated financial statements as well as the reported amounts of revenues and expenses during the reporting periods. Actual results could differ from those estimates. These statements should be read in conjunction with the Lender Processing Services, Inc. (“LPS”) audited financial statements as of and for the three years ending December 31, 2013. Certain legacy LPS accounting policies are no longer relevant to BKFS due to factors discussed elsewhere in notes 1 and 2.
Organization
The periods presented have been segregated and labeled in accordance with the following:
| • | Successor—Represents the consolidated financial position and results of operations of Black Knight Financial Services, LLC (“BKFS”). BKFS is the remaining successor entity to LPS following the acquisition of LPS by Fidelity National Financial, Inc. (“FNF”) on January 2, 2014 and after certain internal reorganizations and distributions, as more fully described in note 2 below. Year-to-date results of the Successor have been defined to be the time period starting on January 2, 2014. Successor-related transactions occurring on January 2, 2014, including transaction related costs of $42.7 million, are included in Successor results. |
| • | Predecessor—Represents the consolidated financial position and results of operations of LPS for periods prior to January 2, 2014. This presentation is on the historical basis of accounting without the application of purchase accounting related to FNF’s acquisition of LPS. Predecessor related transactions occurring on January 2, 2014, including transaction related costs of $50.1 million, are included in Predecessor results. |
Description of the Business
We are a provider of integrated technology, data and services to the mortgage lending industry in the United States. Our primary products and services include:
| • | our mortgage servicing platform (“MSP”) is a software as a service (“SaaS”) application that automates loan servicing, including loan setup and ongoing processing, customer service, accounting and reporting to the secondary mortgage market, and federal regulatory reporting; |
| • | our LoanSphere application, a workflow system that assists customers in managing and automating business processes; |
| • | our mortgage origination software automates and facilitates the origination of mortgage loans, |
| • | our collaborative electronic vendor network and our Insight suite of products, which help lenders to meet loan quality and transparency requirements; |
| • | our data and analytics businesses, the most significant of which are our alternative property valuations business, which provides a range of valuations other than traditional appraisals, and our aggregated property, loan and tax data services. |
F-7
Table of Contents
BLACK KNIGHT FINANCIAL SERVICES, LLC
NOTES TO CONDENSED CONSOLIDATED FINANCIAL STATEMENTS (Unaudited) (continued)
Reporting Segments
We conduct our operations through two reporting segments, (1) Technology and (2) Data and Analytics. LPS conducted operations through two reporting segments, (1) Technology, Data and Analytics and (2) Transaction Services. See further discussion in note 9.
Reclassification
Certain prior period information has been reclassified to conform with current period presentation. These reclassifications have not changed net earnings or total equity, as previously reported.
Transition and integration costs
Transition and integration costs contain incremental costs associated with executing the acquisition of LPS and completing the reorganization as described in note 2, as well as the related transitioning costs including employee severance, an accrual for expected bonuses under our synergy bonus program, certain other non-recurring professional and other costs as well as member management fees.
Allowance for Doubtful Accounts
Trade receivables, net includes allowance for doubtful accounts of $0.8 million and $39.9 million as of September 30, 2014 and December 31, 2013, respectively.
Accumulated Depreciation and Amortization
Accumulated depreciation included in Property and equipment, net totaled $23.2 million and $216.1 million as of September 30, 2014 and December 31, 2013, respectively. Accumulated amortization included in Computer software, net totaled $66.3 million and $247.2 million as of September 30, 2014 and December 31, 2013, respectively. Accumulated amortization included in Other intangible assets, net totaled $84.3 million and $293.1 million as of September 30, 2014 and December 31, 2013, respectively.
Net Earnings per Share
For the 2013 periods, the basic weighted average shares and common stock equivalents of LPS were computed using the treasury stock method. Options to purchase approximately 2.2 million and 3.3 million shares of our common stock for the three and nine months ended September 30, 2013, respectively, were not included in the computation of diluted earnings per share because they were antidilutive. In addition, approximately 1.7 million shares of restricted stock were not included in our weighted average shares outstanding due to vesting restrictions that contain forfeitable rights to dividends as of September 30, 2013.
Discontinued Operations
Results for asset groups qualifying as discontinued operations under (“ASC”) Topic 205-20, Presentation of Financial Statements—Discontinued Operations, are presented net of tax, as a separate component in the Condensed Consolidated Statements of Operations. Total revenues for discontinued operations included in (Loss) earnings from discontinued operations totaled $0.0 million and $1.8 million for the three months ended September 30, 2014 and 2013, respectively, and totaled $2.4 million and $10.5 million for the period January 2, 2014 through September 30, 2014 and the nine months ended September 30, 2013, respectively. Pre-tax earnings (loss) from discontinued operations totaled ($0.7) million and $1.1 million for the three months ended September 30, 2014 and 2013, respectively, and totaled ($0.7) million and ($1.7) million for the period January 2, 2014 through September 30, 2014 and the nine months ended September 30, 2013, respectively.
F-8
Table of Contents
BLACK KNIGHT FINANCIAL SERVICES, LLC
NOTES TO CONDENSED CONSOLIDATED FINANCIAL STATEMENTS (Unaudited) (continued)
Profits Interests Plan
Under the Black Knight Financial Services, LLC 2013 Management Incentive Plan (the “Incentive Plan”), we are authorized to issue up to 11,111,111 Class B units of BKFS, known as “BKFS profits interests,” to eligible members of management and directors. During the nine months ended September 30, 2014, we issued BKFS profits interests to certain members of BKFS management, BKFS directors, and certain employees of our affiliate, ServiceLink Holdings, LLC (“ServiceLink”), which vest over 3 years, with 50% vesting after the second year and 50% vesting after the third year. The terms of the profits interest grants provide for the grantees to participate in any incremental value of BKFS in excess of its fair value at the date of grant in proportion to the Class A member unit holders participation in the same. The fair value of BKFS at the date of grant is otherwise known as the hurdle amount. Profits interests granted are determined and approved by the Compensation Committee of the Board of Managers. Once vested, Class B units are not subject to expiration. The Class B units may be settled under various scenarios. According to the terms of the Incentive Plan and depending on the scenario, the Class B units may be settled in shares of FNF stock or cash at the election of FNF. We account for the BKFS profits interests granted to employees and directors in accordance with the GAAP for share-based payments, which requires that compensation cost relating to share-based payments made to employees and directors be recognized in the condensed consolidated financial statements based on the fair value of each award. BKFS profits interests granted to BKFS employees and directors are equity-classified in accordance with GAAP. Using the fair value method of accounting, compensation cost is measured based on the fair value of the award at the grant date and recognized over the service period. We utilized the Black-Scholes model to calculate the fair value of the profits interests awards on the date of grant (“Calculation”).
There were 9.5 million BKFS profits interests granted to BKFS employees and directors during the period January 2, 2014 to September 30, 2014. The hurdle rate as of the date of grant was used to determine the per unit strike price for the Calculation. The risk free interest rates used in the calculation of the fair value of the BKFS profits interests are the rates that correspond to the weighted average expected life of the profits interests. The volatility was estimated based on the historical volatility of BKFS peers and of the historical LPS stock price over a term equal to the weighted average expected life of the profits interests. We used a weighted average risk free interest rate of 1.06%, a volatility factor for the expected market price of the member units of 33.5% and a weighted average expected life of 3.5 years with a discount of 22.2% for lack of marketability resulting in a weighted average fair value of $2.09 per BKFS profits interests unit granted.
During the time period January 2, 2014 to September 30, 2014, 1.6 million BKFS profits interests grants were made to certain ServiceLink employees. In accordance with GAAP for accounting for share based payments, these awards were recorded as a dividend from BKFS to FNF at the fair value on the date of grant. The amount of this dividend was $3.2 million and is reflected in (Accumulated loss) retained earnings with an offsetting amount in Contributed member capital.
Certain employees of BKFS were also granted profits interests of our affiliate ServiceLink (“ServiceLink profits interests”). In accordance with GAAP, BKFS is required to account for these ServiceLink profits interests because the grants are to BKFS employees. The ServiceLink profits interests are liability-classified and must be revalued each quarter based on their current fair value with compensation costs recognized over the service period (“Updated Calculation”).
There were 2.6 million ServiceLink profits interests granted to BKFS employees during the period January 2, 2014 to September 30, 2014. The hurdle rate as of September 30, 2014 was used to determine the per unit strike price for the Updated Calculation. The risk free interest rates used in the calculation of the fair value of the ServiceLink profits interests are the rates that correspond to the weighted average expected life of the profits interests. The volatility was estimated based on the historical volatility of ServiceLink peers and of the historical LPS stock price over a term equal to the weighted average expected life of the profits interests. As of September 30, 2014, we used a weighted average risk free interest rate of 0.86%, a volatility factor for the expected market price of the member units of 33.0% and a weighted average expected life of 3.0 years with a
F-9
Table of Contents
BLACK KNIGHT FINANCIAL SERVICES, LLC
NOTES TO CONDENSED CONSOLIDATED FINANCIAL STATEMENTS (Unaudited) (continued)
discount of 21.0% for lack of marketability resulting in a weighted average fair value of $1.84 per profits interests unit granted.
Profits interest expense is included in Operating expenses in the condensed consolidated statements of operations. Net (loss) earnings from continuing operations reflects profits interests expense of $2.2 million and $5.3 million for the three months ending September 30, 2014 and the period January 2, 2014 to September 30, 2014, respectively. The redemption value of the BKFS profits interests granted to BKFS management and directors and ServiceLink employees is recorded to Redeemable members’ interests and is $9.0 million and $1.5 million, respectively, as of September 30, 2014. The difference between the amount recorded as profits interest expense for the period January 2, 2014 to September 30, 2014 and the redemption value as of September 30, 2014 is recorded as Contributed member capital. As of September 30, 2014, we have a liability of $0.9 million included on the condensed consolidated balance sheet related to the ServiceLink profits interests awards granted to BKFS employees and directors.
As of September 30, 2014, the total unrecognized compensation cost related to non-vested profits interests granted to BKFS employees and directors is $19.4 million, which is expected to be recognized over a weighted average period of approximately 2.4 years.
Recent Accounting Pronouncements
In May 2014, FASB issued ASU No. 2014-09, Revenue from Contracts with Customers (Topic 606). This ASU provides a new comprehensive revenue recognition model that requires companies to recognize revenue to depict the transfer of goods or services to a customer at an amount that reflects the consideration it expects to receive in exchange for those goods or services. This update also requires additional disclosure about the nature, amount, timing and uncertainty of revenue and cash flows arising from customer contracts. This update permits the use of either the retrospective or cumulative effect transition method. We are evaluating the effect this new guidance will have on our consolidated financial statements and related disclosures. We have not yet selected a transition method nor have we determined the effect of the standard on our ongoing financial reporting. This update is effective for annual and interim periods beginning on or after December 15, 2016, with early application not permitted.
In April 2014, the Financial Accounting Standards Board (“FASB”) issued Accounting Standards Update (“ASU”) No. 2014-08, Presentation of Financial Statements (Topic 205) and Property, Plant, and Equipment (Topic 360): Reporting Discontinued Operations and Disclosures of Disposals of Components of an Entity. This ASU raises the threshold for a disposal to qualify as a discontinued operation and requires new disclosures of both discontinued operations and certain other disposals that do not meet the definition of a discontinued operation. This ASU is effective for annual periods beginning after December 15, 2014, and interim periods within annual periods beginning on or after December 15, 2015, with early adoption permitted. We early adopted this ASU beginning the quarter ended September 30, 2014, and do not expect this update to have a material impact on our financial statements.
| (2) | Acquisition and Reorganization by Fidelity National Financial, Inc. and Other Transactions |
On January 2, 2014, FNF completed the acquisition of LPS, pursuant to the Agreement and Plan of Merger (the “Merger Agreement”), dated as of May 28, 2013, among FNF, Black Knight Holdings, Inc. (“Black Knight”), and Lion Merger Sub, Inc., a Delaware corporation and a subsidiary of Black Knight (“Merger Sub”), and LPS. Pursuant to the Merger Agreement, Merger Sub merged with and into LPS (the “Merger”), with LPS surviving as a subsidiary of Black Knight, and each outstanding share of common stock, par value $0.0001 per share, of LPS (the “LPS Common Stock”) (other than shares owned by LPS, its subsidiaries, FNF, Black Knight or Merger Sub and shares in respect of which appraisal rights had been properly exercised and perfected under Delaware law) was automatically converted into the right to receive (i) $28.102 in cash and (ii) 0.28742 of a share of Class A common stock, par value $0.0001 per share, of FNF (“FNF Common Stock”) (the “Merger Consideration”). The
F-10
Table of Contents
BLACK KNIGHT FINANCIAL SERVICES, LLC
NOTES TO CONDENSED CONSOLIDATED FINANCIAL STATEMENTS (Unaudited) (continued)
Merger was effective on January 2, 2014. In connection with the Merger, FNF issued approximately 25.9 million shares of FNF Common Stock and paid approximately $2.5 billion in cash to former stockholders and equity award holders of LPS. Upon the closing of the Merger, the shares of LPS Common Stock, which previously traded under the ticker symbol “LPS” on the New York Stock Exchange (the “NYSE”), ceased trading on, and were delisted from, the NYSE.
On January 3, 2014, LPS was converted into a Delaware limited liability company and was renamed Black Knight InfoServ, LLC (“BKIS”), a member managed limited liability company. Also on that date, pursuant to an internal reorganization, BKIS distributed all of its limited liability company membership interests and equity interests in its subsidiaries engaged in the Transaction Services business to Black Knight (the “Distribution”). Following the Distribution, Black Knight contributed the Transaction Services subsidiaries to its wholly owned subsidiary Black Knight Financial Services II, LLC, which has been renamed ServiceLink Holdings, LLC (“ServiceLink”) and contributed BKIS to its subsidiary Black Knight Financial Services I, LLC (now known as BKFS), which has been renamed Black Knight Financial Services, LLC. Also on January 3, 2014, Black Knight contributed its subsidiary, Fidelity National Commerce Velocity, LLC (“Commerce Velocity”) to Black Knight Financial Services I, LLC, which then contributed Commerce Velocity to BKIS. In addition, BKIS sold its interest in National Title Insurance of New York, Inc. (“NTNY”) to Chicago Title Insurance Company (a wholly owned subsidiary of FNF) on this date. Thereafter, 35% of the membership interest of BKFS was issued to certain funds affiliated with Thomas H. Lee Partners, L.P. (“THL”).
As part of the Amended and Restated Limited Liability Company Agreement of Black Knight Financial Services, LLC, THL has an option to put their ownership interest of BKFS to BKFS or FNF if no public offering of the corresponding business has been consummated after four years. The units owned by THL may be settled in cash or common stock of FNF, or a combination of both, at the election of FNF in an amount equivalent. The units owned by THL will be settled at the current fair value at the time FNF receives notice of THL’s put election as determined by the parties or by a third party appraisal under the terms of the Unit Purchase Agreement. As this redeemable interest provides for redemption features not solely within the control of BKFS or FNF, we classify the redeemable interest outside of permanent equity in accordance with Accounting Standards Codification (“ASC”) Topic 480-10, Distinguishing Liabilities from Equity.
In connection with the acquisition of LPS by FNF and the subsequent formation of BKFS, all LPS assets and liabilities contributed to BKFS were set to their fair value on January 2, 2014 as part of FNF’s allocation of the LPS purchase price to the identifiable assets and liabilities acquired. The purchase price has been initially allocated to the BKFS assets acquired and liabilities assumed based on our best estimates of their fair values as of the acquisition date. Goodwill has been recorded based on the amount that the purchase price exceeds the fair value of the net assets acquired. The estimate is preliminary and subject to adjustments as we complete our valuation process over computer software, intangible assets, legal contingencies, taxes and goodwill, which we expect to complete by the end of 2014.
As part of the Merger, all of our outstanding equity awards as of December 31, 2013 were accelerated and vested and subsequently converted to a mix of FNF common stock and cash in accordance with the Merger Agreement. In addition, certain other incentive compensation plans for senior executives were also accelerated due to change in control provisions triggered by the Merger. As a result, approximately $24.6 million in unrecognized compensation costs were not included within these condensed consolidated statements of operations.
F-11
Table of Contents
BLACK KNIGHT FINANCIAL SERVICES, LLC
NOTES TO CONDENSED CONSOLIDATED FINANCIAL STATEMENTS (Unaudited) (continued)
The opening balance sheet of LPS on January 2, 2014, as ultimately allocated between BKFS and ServiceLink on January 3, 2014, and based on the initial purchase price allocation of the acquired assets and liabilities by FNF, is as follows as of September 30, 2014 (in millions):
| Black Knight Financial Services, LLC |
ServiceLink Holdings, LLC |
Total | ||||||||||
| Cash and cash equivalents |
$ | 185.4 | $ | 96.6 | $ | 282.0 | ||||||
| Trade receivables |
99.2 | 85.0 | 184.2 | |||||||||
| Income tax receivable |
26.9 | 33.9 | 60.8 | |||||||||
| Prepaid expenses and other assets, including non-amortizing intangible assets |
190.3 | 26.0 | 216.3 | |||||||||
| Property and equipment |
140.4 | 8.9 | 149.3 | |||||||||
| Computer software |
506.4 | 45.8 | 552.2 | |||||||||
| Other intangible assets |
503.4 | 428.3 | 931.7 | |||||||||
| Goodwill |
2,135.2 | 876.6 | 3,011.8 | |||||||||
|
|
|
|
|
|
|
|||||||
| Total assets |
3,787.2 | 1,601.1 | 5,388.3 | |||||||||
|
|
|
|
|
|
|
|||||||
| Long-term debt |
1,091.5 | — | 1,091.5 | |||||||||
| Deferred revenues |
35.8 | 10.2 | 46.0 | |||||||||
| Deferred income taxes, net |
318.4 | 117.0 | 435.4 | |||||||||
| Legal and regulatory accrual |
4.2 | 114.0 | 118.2 | |||||||||
| Other liabilities |
204.2 | 119.2 | 323.4 | |||||||||
|
|
|
|
|
|
|
|||||||
| Total liabilities |
1,654.1 | 360.4 | 2,014.5 | |||||||||
|
|
|
|
|
|
|
|||||||
| Net assets |
$ | 2,133.1 | $ | 1,240.7 | $ | 3,373.8 | ||||||
|
|
|
|
|
|
|
|||||||
During the quarter ended September 30, 2014, the Company continued its valuation process over the opening balance sheet and recorded a $25.3 million decrease in the provisional goodwill balance, $1.6 million reduction in Other intangibles, $6.3 million decrease in Deferred income taxes, $5.8 million decrease in Other liabilities, $8.9 million increase to Cash and cash equivalents, $5.1 million increase to Income taxes receivable, $1.0 million decrease to Legal and regulatory reserve, as well as other insignificant adjustments. These adjustments were given retrospective application to January 2, 2014.
During the period January 2, 2014 through September 30, 2014, we recorded a $133.3 million increase in the provisional Goodwill balance, $317.2 million reduction in Other intangible assets, $158.4 million reduction in Deferred income taxes, $8.9 million increase in Cash and cash equivalents, $6.6 million increase in Income tax receivable, $4.3 million increase in Computer software, $3.0 million decrease in Legal and regulatory accrual, $2.7 million decrease in Prepaid and other assets, $2.4 million increase in proprietary database included in other assets, $1.2 million decrease in Other liabilities, $1.2 million decrease in Deferred revenues and $0.6 million increase in Property and equipment.
The acquisition included the purchase of Trade receivables with a contract value of $102.8 million for which we expect to collect $99.2 million.
F-12
Table of Contents
BLACK KNIGHT FINANCIAL SERVICES, LLC
NOTES TO CONDENSED CONSOLIDATED FINANCIAL STATEMENTS (Unaudited) (continued)
The following table summarizes the intangible assets acquired by BKFS (in millions, except for useful life):
| Fair Value at Acquisition |
Weighted Average Useful Life in Years as of Consolidation |
Residual Value as of September 30, 2014 |
||||||||||
| Amortizing intangible assets: |
||||||||||||
| Computer Software |
$ | 506.4 | $ | 458.3 | ||||||||
| Developed technology |
485.7 | 9 | 443.0 | |||||||||
| Purchased technology |
20.7 | 4 | 15.3 | |||||||||
| Trade names |
5.3 | 10 | 4.7 | |||||||||
| Customer relationships |
494.7 | 10 | 427.9 | |||||||||
| Non-compete agreements |
3.4 | 3 | 2.6 | |||||||||
| Non-amortizing intangible assets: |
||||||||||||
| Developed technology |
54.3 | 54.3 | ||||||||||
|
|
|
|
|
|||||||||
| Total intangible assets and capitalized software |
$ | 1,064.1 | $ | 947.8 | ||||||||
|
|
|
|
|
|||||||||
On January 3, 2014, Black Knight contributed Commerce Velocity into BKFS at its historical basis since the reorganization was accomplished by a transaction between entities under common control. BKFS includes assets of $38.4 million and liabilities of $2.1 million as a result of the contribution as of January 2, 2014.
Recent Developments
On June 2, 2014, as part of an internal reorganization, two wholly owned subsidiaries of FNF contributed their respective interests in Property Insight, LLC (“Property Insight”), a business that provides property information used by title insurance underwriters, title agents and closing attorneys to underwrite title insurance policies for real property sales and transfer, to BKFS in exchange for 6.4 million BKFS Class A Units. As a result, BKFS now owns 100% of Property Insight. In accordance with GAAP requirements for transactions between entities under common control, assets and liabilities contributed in the transaction were recorded at their respective historical FNF book values on the date of contribution. Net assets recorded at the contribution date totaled $90.5 million. The consolidated financial statements as of and for the three months ended September 30, 2014 and the time period from January 2, 2014 to September 30, 2014 have been adjusted to reflect the combined entity as if the contribution occurred on January 2, 2014.
In connection with the contribution of Property Insight, the Limited Liability Company Agreement of BKFS was amended to increase the number of Class A Units issued from 100 million to 106.4 million. The amendment also provides FNF with the option, but not the obligation, to repurchase all interest in Property Insight from BKFS at fair market value in the event of a sale of BKFS. As a result of the additional shares issued, THL now owns 32.9% of the outstanding member interests of BKFS, while FNF and its subsidiaries collectively own 67.1 % of the outstanding member interests of BKFS.
On June 30, 2014, we completed the sale of PCLender for $1.5 million. No gain or loss was recognized on the disposal. Results of PCLender are included in discontinued operations for all periods presented.
| (3) | Fair Value |
Fair Value of Financial Assets and Liabilities
The fair values of financial assets and liabilities are determined using the following fair value hierarchy:
| • | Level 1 Inputs to the valuation methodology are unadjusted quoted prices for identical assets or liabilities in active markets that we have the ability to access. |
F-13
Table of Contents
BLACK KNIGHT FINANCIAL SERVICES, LLC
NOTES TO CONDENSED CONSOLIDATED FINANCIAL STATEMENTS (Unaudited) (continued)
| • | Level 2 Inputs to the valuation methodology include: |
| • | quoted prices for similar assets or liabilities in active markets; |
| • | quoted prices for identical or similar assets or liabilities in inactive markets; |
| • | inputs other than quoted prices that are observable for the asset or liability; and |
| • | inputs that are derived principally from or corroborated by observable market data by correlation or other means. |
| • | Level 3 Inputs to the valuation methodology are unobservable and significant to the fair value measurement. |
Assets are classified in their entirety based on the lowest level of input that is significant to the fair value measurement. We believe our valuation methods are appropriate and consistent with other market participants. The use of different methodologies or assumptions to determine the fair value of certain financial instruments could result in a different fair value measurement at the reporting date.
The following tables set forth, by level within the fair value hierarchy, our assets and liabilities measured at fair value on a recurring basis. The fair values of other financial instruments, which primarily includes long-term debt, are estimated as of period-end and disclosed elsewhere in these notes.
As of December 31, 2013 (in millions) (Predecessor):
| Fair Value | ||||||||||||||||||||||
| Classification |
Carrying Value |
Level 1 | Level 2 | Level 3 | Total | |||||||||||||||||
| Investments (note 4) |
Asset | $ | 77.0 | $ | 4.6 | $ | 72.4 | $ | — | $ | 77.0 | |||||||||||
| Interest rate swaps |
Liability | $ | 4.3 | $ | — | $ | 4.3 | $ | — | $ | 4.3 | |||||||||||
Our Level 1 financial instruments included U.S. government bonds, for which there are quoted prices in active markets. Our Level 2 financial instruments consisted of corporate bonds, U.S. government agency bonds, municipal bonds and derivatives, for which there are parallel markets or alternative means to estimate fair value using observable information inputs. The estimates used are subjective in nature and involve uncertainties and significant judgment in the interpretation of current market data. Therefore, the values presented are not necessarily indicative of amounts we could realize or settle currently.
BKFS (Successor) held no investments and was not party to any interest rate swaps at September 30, 2014.
Fair Value of Assets Acquired and Liabilities Assumed
The fair values of assets acquired and liabilities assumed in business combinations are estimated using various assumptions. The most significant assumptions, and those requiring the most judgment, involve the estimated fair values of intangible assets and software, with the remaining value, if any, attributable to goodwill. We utilize third-party specialists to assist with determining the fair values of intangible assets and software purchased in business combinations. These estimates are based on Level 2 and Level 3 Inputs.
| (4) | Investments |
Our former title insurance subsidiary, NTNY, which was sold to a wholly owned subsidiary of FNF on January 3, 2014 as part of our internal reorganization (see note 2), is statutorily required to maintain assets backing its reserves for settling losses on the policies it issues. These investments, which consist of treasury bonds, municipal bonds, government agency bonds and corporate bonds, are classified as available for sale securities, and are included in the accompanying consolidated balance sheets at fair value within prepaid expenses and other
F-14
Table of Contents
BLACK KNIGHT FINANCIAL SERVICES, LLC
NOTES TO CONDENSED CONSOLIDATED FINANCIAL STATEMENTS (Unaudited) (continued)
current assets and other non-current assets. Any unrealized gains or losses on these investments are recognized in other comprehensive earnings (loss) until the investment maturity or sale date. Since we did not intend to sell and would more-likely-than-not have maintained each debt security until its anticipated recovery, and no significant credit risk was deemed to exist, these investments were not considered other than temporarily impaired.
The carrying amount and fair value of our available for sale securities at December 31, 2013 was as follows (in millions):
| Adjusted Cost |
Gross Unrealized Gains |
Gross Unrealized Losses |
Fair Value | |||||||||||||
| As of December 31, 2013 (Predecessor) |
$ | 77.1 | $ | 1.5 | $ | (1.6 | ) | $ | 77.0 | |||||||
BKFS (Successor) held no such investments at September 30, 2014.
| (5) | Transactions with Related Parties |
We are party to certain related party agreements. These parties became related parties of BKFS on January 2, 2014, as of the acquisition of LPS by FNF and subsequent reorganization. Transactions with these related parties since that date are described below.
ServiceLink Holdings, LLC
ServiceLink is a consolidated subsidiary of FNF. We have various agreements with ServiceLink to provide technology, data, and analytics services. In addition, we provide certain corporate services to ServiceLink, including corporate shared services, information technology, and facilities management. ServiceLink also rents space in our headquarters building at our Jacksonville, Florida campus. We are also party to certain other agreements under which we incur other expenses to, or receive revenues from, ServiceLink. During the three months ended September 30, 2014 and the time period from January 2, 2014 to September 30, 2014, we received $6.5 million and $18.3 million in revenues from and allocated $5.3 million and $20.1 million in operating expenses, net, to ServiceLink, respectively.
Fidelity National Financial, Inc.
In addition to the agreements with ServiceLink discussed above, we have various agreements with FNF, our majority member, with a 67.1% ownership interest, and certain other FNF subsidiaries.
We provide technology, data, and analytics services to several FNF subsidiaries. In addition, FNF provides certain corporate services to us, including management and consulting services. We are also party to certain other agreements under which we incur other expenses to, or receive revenues from, FNF. During the three months ended September 30, 2014 and the time period from January 2, 2014 to September 30, 2014, we received $10.7 million and $36.9 million in revenues from FNF, respectively, and recognized $4.4 million and $15.7 million in operating expenses and $1.5 million and $4.4 million in management fees from FNF, respectively, which are included in transition and integration costs.
We are party to intercompany note obligations with FNF and recognized $24.7 million and $73.5 million in related interest expense for the three months ended September 30, 2014 and the time period from January 2, 2014 to September 30, 2014, respectively. As of September 30, 2014, approximately $1,538.4 million of the intercompany notes remain outstanding. See note 6 for further information on Long-term debt.
F-15
Table of Contents
BLACK KNIGHT FINANCIAL SERVICES, LLC
NOTES TO CONDENSED CONSOLIDATED FINANCIAL STATEMENTS (Unaudited) (continued)
Thomas H. Lee Partners, L.P.
THL is a Member with a 32.9% ownership interest. Two directors of THL currently serve on our Board of Managers. We receive management and consulting services from THL and software and systems services from certain entities over which THL exercises control. During the three months ended September 30, 2014 and the time period from January 2, 2014 to September 30, 2014, we recognized $0.8 million and $2.4 million, respectively, in management fees paid to THL, which are included in transition and integration costs. We also purchased $0.3 million and $1.5 million in software and maintenance and recognized $0.3 million and $1.2 million in operating expenses from certain THL controlled entities during the three months ended September 30, 2014 and the time period from January 2, 2014 to September 30, 2014, respectively.
Revenues and Expenses
A detail of related party items included in Revenues for the three months ended September 30, 2014 and the time period from January 2, 2014 to September 30, 2014 is as follows (in millions):
| Successor | ||||||||
| Three Months Ended September 30, 2014 |
Period January 2, 2014 through September 30, 2014 |
|||||||
| Data and analytic services |
$ | 12.8 | $ | 43.3 | ||||
| Servicing, origination and default technology |
4.4 | 11.9 | ||||||
|
|
|
|
|
|||||
| Total related party revenues |
$ | 17.2 | $ | 55.2 | ||||
|
|
|
|
|
|||||
A detail of related party items included in Operating expenses (net of expense reimbursements) for the three months ended September 30, 2014 and the time period from January 2, 2014 to September 30, 2014 is as follows (in millions):
| Successor | ||||||||
| Three Months Ended September 30, 2014 |
Period January 2, 2014 through September 30, 2014 |
|||||||
| Data entry, indexing services, and other operating expenses |
$ | 1.9 | $ | 9.9 | ||||
| Corporate services received from related party |
3.0 | 8.7 | ||||||
| Corporate services provided to related party |
(5.5 | ) | (21.8 | ) | ||||
|
|
|
|
|
|||||
| Total related party revenues |
$ | (0.6 | ) | $ | (3.2 | ) | ||
|
|
|
|
|
|||||
We believe the amounts earned from or charged by us under each of the foregoing arrangements are fair and reasonable. We believe our service arrangements are priced within the range of prices we offer to third parties, except for certain corporate services provided to ServiceLink and certain corporate services provided by FNF, which are at cost. However, the amounts we earned or that were charged under these arrangements were not negotiated at arm’s-length, and may not represent the terms that we might have obtained from an unrelated third party.
We had no related party transactions as of and during the three and nine months ended September 30, 2013.
F-16
Table of Contents
BLACK KNIGHT FINANCIAL SERVICES, LLC
NOTES TO CONDENSED CONSOLIDATED FINANCIAL STATEMENTS (Unaudited) (continued)
| (6) | Long-Term Debt |
Long-term debt as of September 30, 2014 and December 31, 2013 consists of the following (in millions):
| Successor | Predecessor | |||||||||
| September 30, 2014 | December 31, 2013 | |||||||||
| Term A Loan |
$ | — | $ | 468.1 | ||||||
| Intercompany Notes |
718.4 | — | ||||||||
| Mirror Note Tranche “T” |
644.0 | — | ||||||||
| Mirror Note Tranche “R” |
176.0 | — | ||||||||
| Senior Notes, issued at par, inclusive of bond premium of $21.7 (Successor period only) |
616.6 | 600.0 | ||||||||
|
|
|
|
|
|||||||
| Total long-term debt |
2,155.0 | 1,068.1 | ||||||||
| Less: current portion of long-term debt |
48.3 | 60.2 | ||||||||
|
|
|
|
|
|||||||
| Long-term debt, net of current portion |
2,106.7 | 1,007.9 | ||||||||
|
|
|
|
|
|||||||
On January 2, 2014, Black Knight issued (i) a Mirror Note (the “Original Mirror Note”), in the original principal amount of $1,400.0 million and (ii) an Intercompany Note (the “Original Intercompany Note”), in the original principal amount of $1,175.0 million to FNF. BKFS entered into an assumption agreement, dated as of January 3, 2014, among BKFS, Black Knight and FNF pursuant to which we assumed $820.0 million of the debt issued under the Original Mirror Note and $688.0 million of the debt issued under the Original Intercompany Note (such amounts, the “BKFS Assumed Amounts”) and FNF released Black Knight of its obligations with respect to the BKFS Assumed Amounts. Subsequently, on January 6, 2014, we borrowed an additional sum of $63.0 million pursuant to an Intercompany Note issued by us to FNF, and on March 31, 2014, we borrowed an additional sum of $25.0 million pursuant to the Intercompany Note. The original Intercompany Note, the Intercompany Note on January 6, 2014 and the Intercompany Note on March 31, 2014 are collectively known as the “Intercompany Notes”.
The amount assumed by BKFS on the Original Mirror Note is divided into two tranches known as Tranche “T” and Tranche “R,” collectively, the “Mirror Notes”. The Tranche “T” in the original amount of $644.0 million bears interest at the rate or rates of interest charged on borrowings under FNF’s Term Loan Credit Agreement, currently 1.98% plus 100 basis points. The Tranche “R” in the original amount of $176.0 million bears interest at the rate or rates of interest charged on borrowings under FNF’s Revolving Credit Agreement, currently 1.60%, plus 100 basis points. As of September 30, 2014, we were paying 2.75% plus LIBOR on Tranche “T” and 2.45%, plus LIBOR on Tranche “R”. The interest rates in effect for Tranche “T” and Tranche “R” Loans at September 30, 2014 were 2.98% and 2.60%, respectively.
The Original Mirror Note agreement requires us to repay the outstanding principal amount of Tranche “T” in equal quarterly installments on the last day of each fiscal quarter as follows, with the first such payment to be made on the last day of the fifth full fiscal quarter after January 2, 2014 (the “Funding Date”): (1) 0.0% in the first year after the Funding Date, (2) 10.0% in the second year after the Funding Date, (3) 15.0% in the third year after the Funding Date, (4) 20.0% in the fourth year after the Funding Date and (5) 20.0% in the fifth year after the Funding Date, in each case of the original aggregate principal amount of Tranche “T” made on the Funding Date. The remaining balance of the original amount shall be repaid on January 2, 2019. Tranche “R” has no scheduled principal payments, but will be due and payable in full on July 15, 2018.
The Intercompany Notes bear interest at a fixed rate of 10% per annum. Such interest shall be calculated and payable quarterly on the last day of each March, June, September and December of each fiscal year. The Intercompany Notes agreements originally required us to repay the outstanding principal amounts in equal
F-17
Table of Contents
BLACK KNIGHT FINANCIAL SERVICES, LLC
NOTES TO CONDENSED CONSOLIDATED FINANCIAL STATEMENTS (Unaudited) (continued)
quarterly installments of 2.5% of the original principal sum on the last day of each March, June, September and December of each fiscal year prior to the maturity date, which is January 2, 2024 in the case of the $688.0 million Intercompany Note and January 6, 2024 in the case of the $63.0 million and $25.0 million Intercompany Notes. On May 30, 2014, we entered into an amended and restated Intercompany Note agreement to eliminate the requirement to make scheduled principal payments prior to the maturity dates.
We have the right to prepay, at any time and from time to time, all or any portion of the outstanding principal amount of the Mirror Notes and the Intercompany Notes without premium or penalty.
On January 2, 2014, upon consummation of the Merger, LPS entered into a Supplemental Indenture (the “Supplemental Indenture”) with FNF, Black Knight Lending Solutions, Inc., a Delaware corporation and wholly owned subsidiary of BKIS (“BKLS”), and U.S. Bank National Association , as trustee (the “Trustee”), to the Indenture (as supplemented by the Supplemental Indenture, the “Indenture”), dated as of October 12, 2012, among LPS, the subsidiary guarantors party thereto and the Trustee, related to LPS’s 5.75% Senior Notes due 2023 (the “Senior Notes”). Pursuant to the terms of the Supplemental Indenture, (i) FNF became a guarantor of LPS’s obligations under the Senior Notes and agreed to fully and unconditionally guarantee the Senior Notes, on a joint and several basis with the guarantors named in the Indenture, and (ii) BKLS became a “co-issuer” of the Senior Notes and agreed to become a co-obligor of LPS’s obligations under the Indenture and the Senior Notes, on the same terms and subject to the same conditions as LPS, on a joint and several basis. As a result of FNF’s guarantee of the Senior Notes, the Senior Notes were rated as investment grade, which resulted in the suspension of most of the restrictive covenants in the Indenture.
The Senior Notes were registered under the Securities Act of 1933, as amended, carry an interest rate of 5.75% and will mature on April 15, 2023. Interest is paid semi-annually on the 15th day of April and October. The Senior Notes are senior unsecured obligations. At any time and from time to time, prior to October 15, 2015, we may redeem up to a maximum of 35% of the original aggregate principal amount of the Senior Notes with the proceeds of one or more equity offerings, at a redemption price equal to 105.75% of the principal amount thereof, plus accrued and unpaid interest thereon, if any, to the redemption date. Prior to October 15, 2017, we may redeem some or all of the Senior Notes by paying a “make-whole” premium based on U.S. Treasury rates. On or after October 15, 2017, we may redeem some or all of the Senior Notes at the redemption prices described in the Indenture, plus accrued and unpaid interest. In addition, if a change of control occurs, we are required to offer to purchase all outstanding Senior Notes at a price equal to 101% of the principal amount plus accrued and unpaid interest, if any, to the date of purchase.
The Senior Notes contain covenants that, among other things, limit our ability (a) to incur or guarantee additional indebtedness or issue preferred stock, (b) to make certain restricted payments, including dividends or distributions on equity interests held by persons other than us or certain subsidiaries, in excess of an amount generally equal to 50% of consolidated net income generated since July 1, 2008, (c) to create or incur certain liens, (d) to engage in sale and leaseback transactions, (e) to create restrictions that would prevent or limit the ability of certain subsidiaries to (i) pay dividends or other distributions to us or certain other subsidiaries, (ii) repay any debt or make any loans or advances to us or certain other subsidiaries or (iii) transfer any property or assets to us or certain other subsidiaries, (f) to sell or dispose of our assets or any restricted subsidiary or enter into merger or consolidation transactions and (g) to engage in certain transactions with affiliates. As a result of FNF’s guarantee of the Senior Notes on January 2, 2014, and the Senior Notes becoming rated investment grade, certain covenants were suspended. Currently covenants (a), (b), (e), (f) and (g) outlined above are suspended. These covenants will continue to be suspended as long as the Senior Notes are rated investment grade, as defined in the Indenture. These covenants are subject to a number of exceptions, limitations and qualifications in the Indenture. We have no independent assets or operations and our guarantees are full and unconditional and joint and several. There are no significant restrictions on our ability to obtain funds from any of our subsidiaries. The
F-18
Table of Contents
BLACK KNIGHT FINANCIAL SERVICES, LLC
NOTES TO CONDENSED CONSOLIDATED FINANCIAL STATEMENTS (Unaudited) (continued)
Senior Notes contain customary events of default, including failure (i) to pay principal and interest when due and payable and breach of certain other covenants and (ii) to make an offer to purchase and pay for the Senior Notes tendered as required by the Indenture. Events of default also include cross defaults, with respect to any other of our debt or debt of certain subsidiaries having an outstanding principal amount of $80.0 million or more in the aggregate for all such debt, arising from (i) failure to make a principal payment when due and such defaulted payment is not made, waived or extended within the applicable grace period or (ii) the occurrence of an event which results in such debt being due and payable prior to its scheduled maturity. Upon the occurrence of an event of default (other than a bankruptcy default), the trustee or holders of at least 25% of the Senior Notes then outstanding may accelerate the Senior Notes by giving us appropriate notice. If, however, a bankruptcy default occurs, then the principal of and accrued interest on the Senior Notes then outstanding will accelerate immediately without any declaration or other act on the part of the trustee or any holder.
On January 16, 2014, we issued an offer to purchase our Senior Notes pursuant to the change of control provisions under the related Indenture at a purchase price of 101 % of the principal amount plus accrued interest to the purchase date. The offer expired on February 18, 2014. As a result of the offer, bondholders tendered $5.2 million in principal of the Senior Notes, which were subsequently purchased by us on February 24, 2014. On February 7, 2014, BKIS, FNF, BKLS and the Trustee entered into a second Supplemental Indenture (the “Second Supplemental Indenture”) to the Indenture. Under the Second Supplemental Indenture, the financial reporting covenant under the Indenture was amended to substitute reporting of FNF for that of BKIS and BKLS. In connection with the consent to remove the financial reporting covenant, we paid $0.7 million to the holders of the Senior Notes in February 2014.
As a result of the acquisition of LPS, the Senior Notes were adjusted to fair market value, resulting in our recording a premium on Senior Notes of approximately $23.3 million. The premium is amortized over the remaining term of the Senior Notes using the effective interest method. During the three months ended September 30, 2014 and the time period from January 2, 2014 to September 30, 2014, we recognized $0.5 million and $1.6 million of amortization, respectively, which is included as a component of interest expense. As of September 30, 2014, the unamortized portion of the premium was $21.7 million.
The Term A Loan outstanding as of December 31, 2013 was issued pursuant to an Amended and Restated Credit Agreement dated August 18, 2011 (the “2011 Credit Agreement”) with JPMorgan Chase Bank, N.A., as Administrative Agent, Swing Line Lender and Letters of Credit Issuer, and various other lenders. At December 31, 2013, the Credit Agreement consisted of a 5-year revolving credit facility in an aggregate principal amount outstanding at any time not to exceed $400 million (with a $25 million sub-facility for Letters of Credit) and the 5-year Term A Loan in an initial aggregate principal amount of $535 million. Obligations under the 2011 Credit Agreement were fully and unconditionally guaranteed, jointly and severally, by certain of our domestic subsidiaries. Additionally, we and such subsidiary guarantors pledged substantially all of our respective assets as collateral security for the obligations under the Credit Agreement and our respective guarantees.
The 2011 Credit Agreement required us to repay the outstanding principal amount of the Term A Loan in quarterly installments of $6.7 million beginning on December 31, 2011. These quarterly installment payments increased to $13.4 million beginning on December 31, 2013 and then to $20.1 million beginning on December 31, 2014 through March 31, 2016, with all remaining outstanding principal amounts due at maturity on August 16, 2016. Voluntary prepayments were generally permitted at any time without fee upon proper notice and subject to minimum dollar requirements.
The Term A Loan was subject to a variable interest rate equal to LIBOR plus an annual margin percentage determined in accordance with a leverage ratio-based pricing grid. At December 31, 2013, the Term A Loan carried an interest rate of 2.17%. No amounts were outstanding on the revolving credit facility.
Upon consummation of the Merger, the Term A Loan was fully repaid (see note 2 for further discussion).
F-19
Table of Contents
BLACK KNIGHT FINANCIAL SERVICES, LLC
NOTES TO CONDENSED CONSOLIDATED FINANCIAL STATEMENTS (Unaudited) (continued)
Fair Value of Long-Term Debt
The fair value of our Senior Notes as of September 30, 2014 was $621.6 million, based upon established market prices for the securities using Level 2 Inputs. The fair value of our Intercompany Notes and Mirror Notes approximates carrying value, as the agreements were entered into during the first quarter of 2014. We are developing a valuation model to estimate the fair value of these instruments in future periods, which is expected to be subject to Level 3 Inputs.
Interest Rate Swaps
On August 26, 2011, we entered into an interest rate swap to hedge forecasted monthly interest rate payments on $250 million of our floating rate debt (“the 2011 Interest Rate Swap”), in which the bank pays a variable rate equal to 1 Month LIBOR (equal to 0.17% as of December 31, 2013) and we pay a fixed rate of 1.265%. The effective date of the swap was August 31, 2011 and the maturity date was July 31, 2016.
On August 4, 2010, we entered into an interest rate swap to hedge forecasted monthly interest rate payments on $75 million of our floating rate debt (“the 2010 Interest Rate Swap”), in which the bank pays a variable rate equal to 1 Month LIBOR (equal to 0.17% as of December 31, 2013) and we pay a fixed rate of 2.080%. The effective date of the swap was December 31, 2012 and it matured on December 31, 2013. No gain or loss was recognized in connection with the maturity.
We entered into interest rate swap transactions in order to convert a portion of our interest rate exposure on our floating rate debt from variable to fixed. We designated these interest rate swaps as cash flow hedges. A portion of the amount included in accumulated other comprehensive loss is reclassified into interest expense as a yield adjustment as interest payments are made on the Term Loan. The inputs used to determine the estimated fair value of our interest rate swaps are Level 2-type measurements. We considered our own credit risk when determining the fair value of our interest rate swaps.
The 2011 Interest Rate Swap was terminated subsequent to payment of the Term A Loan on January 2, 2014. See note 2 for further discussion.
Estimated fair values of interest rate swaps in the consolidated balance sheets were as follows (in millions):
| Predecessor | ||||
| Balance Sheet Account |
December 31, 2013 | |||
| Other long-term liabilities |
$ | 4.3 | ||
A cumulative loss of $2.6 million is reflected in accumulated other comprehensive loss as of December 31, 2013. A summary of the effect of derivative instruments on amounts recognized in other comprehensive earnings (“OCE”) and on the accompanying condensed consolidated statement of earnings for the three and nine months ended September 30, 2013 is as follows (in millions):
| Predecessor | ||||||||
| Interest Rate Swap contract |
Amount of Loss Recognized in OCE on Interest Rate Hedges |
Amount of Loss Reclassified from Accumulated OCE into Earnings (included within interest expense) |
||||||
| Three months ended September 30, 2013 |
$ | 1.3 | $ | 1.1 | ||||
| Nine months ended September 30, 2013 |
$ | 0.4 | $ | 3.1 | ||||
It is our policy to execute such instruments with credit-worthy banks and not to enter into derivative financial instruments for speculative purposes. As of December 31, 2013, we believed our interest rate swap counterparty would be able to fulfill its obligations under our agreements, and we believed we would have debt outstanding through the expiration date of the swap such that the occurrence of future hedge cash flow remained probable.
F-20
Table of Contents
BLACK KNIGHT FINANCIAL SERVICES, LLC
NOTES TO CONDENSED CONSOLIDATED FINANCIAL STATEMENTS (Unaudited) (continued)
BKFS held no such interest rate swaps or other derivative instruments at September 30, 2014 or during the three months ending September 30, 2014 and the time period from January 2, 2014 to September 30, 2014.
Principal Maturities of Debt
Principal maturities as of September 30, 2014 for each of the next five years and thereafter are as follows:
| 2014 (remaining) |
$ | — | ||
| 2015 |
64.4 | |||
| 2016 |
96.6 | |||
| 2017 |
128.8 | |||
| 2018 |
304.8 | |||
| Thereafter |
1,538.7 | |||
|
|
|
|||
| Total |
2,133.3 | |||
|
|
|
Scheduled maturities noted above exclude the impact of $21.7 million bond premium.
| (7) | Commitments and Contingencies |
In the ordinary course of business, we are involved in various pending and threatened litigation and regulatory matters related to our operations, some of which include claims for punitive or exemplary damages. Our ordinary course litigation includes purported class action lawsuits, which make allegations related to various aspects of our business. From time to time, we also receive requests for information from various state and federal regulatory authorities, some of which take the form of civil investigative demands or subpoenas. Some of these regulatory inquiries may result in the assessment of fines for violations of regulations or settlements with such authorities requiring a variety of remedies. We believe that no actions, other than those discussed below, depart from customary litigation or regulatory inquiries incidental to our business.
We review lawsuits and other legal and regulatory matters (collectively “legal proceedings”) on an ongoing basis when making accrual and disclosure decisions. When assessing reasonably possible and probable outcomes, management bases its decision on its assessment of the ultimate outcome assuming all appeals have been exhausted. For legal proceedings where it has been determined that a loss is both probable and reasonably estimable, a liability based on known facts and which represents our best estimate has been recorded. Actual losses may materially differ from the amounts recorded and the ultimate outcome of our pending cases is generally not yet determinable. Our accrual for legal and regulatory matters was $3.9 million as of September 30, 2014. While some of these matters could be material to our operating results or cash flows for any particular period if an unfavorable outcome results, at present we do not believe that the ultimate resolution of currently pending legal proceedings, either individually or in the aggregate, will have a material adverse effect on our financial condition.
Litigation Matters
On December 16, 2013, LPS received notice that Merion Capital, L.P. and Merion Capital II, L.P. (together “Merion Capital”) were asserting their appraisal right relative to their ownership of 5,682,276 shares of LPS stock in connection with FNF’s acquisition of LPS. On February 6, 2014, Merion Capital filed an appraisal proceeding, captioned Merion Capital LP and Merion Capital II, LP v. Lender Processing Services, Inc., C.A. No. 9320-VCL, in the Delaware Court of Chancery seeking a judicial determination of the “fair” value of Merion Capital’s 5,682,276 shares of LPS common stock under Delaware law (the “Appraisal Shares”), together with statutory interest. We filed an answer to this suit on March 3, 2014, and discovery is ongoing. On
F-21
Table of Contents
BLACK KNIGHT FINANCIAL SERVICES, LLC
NOTES TO CONDENSED CONSOLIDATED FINANCIAL STATEMENTS (Unaudited) (continued)
August 26, 2014, we filed a motion to pay the merger consideration to Merion Capital and stop the accrual of additional statutory interest during the pendency of the appraisal proceeding. On September 18, 2014, we reached an agreement with Merion Capital to resolve the interest motion and FNF paid Merion Capital the merger consideration (cash and stock), which was previously held in escrow for Merion Capital, in respect of the Merion Appraisal Shares, and BKFS paid interest of $9.0 million through the date of payment. The parties will continue the appraisal proceedings, however, we do not believe the case will result in a material negative outcome to the Company.
In March 2013, LPS was named as a defendant in a wrongful death case, Benavides-Mejia v. Lender Processing Services, Inc. n/k/a Black Knight InfoServ, LLC. The case was filed as a result of a fire on December 30, 2010 in a four unit rent controlled apartment building located in Oakland, CA (“the Property”) in which three people died. Additionally, there were two other injured plaintiffs and property damage. By way of background, the Property was foreclosed on by Bank of New York (“BONY”), as trustee in 2009. The Property was assigned to certain subsidiaries of LPS for asset management and preservation. The purported heirs or dependents of the decedents and those injured have filed a complaint against BONY, Bank of America, LPS and Security Pacific Brokerage. The complaint alleges negligence and violation of various statutes and regulations and asserts damages for wrongful death, personal injury, property damage and a host of habitability violations. Punitive damages are also sought, but are unlikely against LPS, Field Services or LPS-AMS. Discovery in this matter is on-going. The trial has been set for October 2015. The businesses associated with this case were contributed to ServiceLink in connection with the acquisition and reorganization of LPS by FNF (see note 2). Although LPS is named in the case, any resulting liability is expected to be borne by the underlying businesses at ServiceLink.
In 2002, TCF National Bank (“TCF”), which is headquartered in Minneapolis, Minnesota, entered into a contract with our former subsidiary Market Intelligence, Inc. (“MI”) to purchase evaluation products that TCF used in the process of originating residential mortgage loans. The primary evaluation product TCF purchased from MI was a Field Asset Verification (“FAV”) that consisted of a summary of public information (e.g., tax assessments and past sales of the relevant property), analysis of a single sales comparable, and a “drive-by” exterior inspection by a real estate professional. In 2008, TCF sent MI a demand letter asserting that approximately three dozen of the FAVs provided by MI between mid-2002 and mid-2005 had improperly overestimated the values of those properties as collateral, resulting in losses to TCF when it foreclosed on those properties or otherwise charged off the relevant loans. MI rejected TCF’s demand. In September 2011 TCF filed suit in the U.S. District Court for the District of Minnesota, TCF National Bank v. Market Intelligence, Inc., Fidelity National Information Services, Inc., LSI Appraisal, LLC and Lender Processing Services, Inc., alleging various common law, contractual and statutory claims. The U.S. District Court dismissed several of TCF’s legal claims in July 2012, in response to an initial motion by the Defendants. After TCF amended its complaint, TCF survived a second motion to dismiss. As a result of the U.S. District Court’s opinion and order on January 3, 2013, TCF was allowed to proceed with claims for fraudulent inducement, negligent appraisal, breach of contract, breach of the covenant of good faith, common law fraud and consumer fraud under a Minnesota statute. TCF’s amended complaint alleged damages of at least $3.3 million, but asserted that it would seek to recover additional damages as a result of loan charge-offs and foreclosures after September 2011. In mid-January 2014, as part of its discovery responses, TCF asserted that it had suffered additional losses of more than $15.0 million since September 2011, resulting in a new total damages claim of $18.5 million. In addition to compensatory damages TCF also seeks attorney’s fees, under certain claims, and costs. Discovery closed and dispositive motions were filed by May 1, 2014. Counsel filed a motion for summary judgment on that date. The court heard the summary judgment motions on July 28, 2014. On October 14, 2014, the court entered a Memorandum Opinion and Order granting the Company’s Motion for Summary Judgment on all causes of action. TCF filed an appeal on November 4, 2014, and the Company will continue to vigorously defend the action. The businesses associated with this case were contributed to ServiceLink in connection with the acquisition and reorganization of LPS by FNF (see note 2). Although LPS is named in the case, any potential resulting liability is expected to be borne by the underlying businesses of ServiceLink.
F-22
Table of Contents
BLACK KNIGHT FINANCIAL SERVICES, LLC
NOTES TO CONDENSED CONSOLIDATED FINANCIAL STATEMENTS (Unaudited) (continued)
Regulatory Matters
Following a review by the Board of Governors of the Federal Reserve System, the Federal Deposit Insurance Corporation, the Office of the Comptroller of the Currency and the Office of Thrift Supervision (collectively, the “banking agencies”), LPS entered into a consent order (the “Order”) dated April 13, 2011 with the banking agencies. The banking agencies’ review of LPS’s services included the services provided by its default operations to mortgage servicers regulated by the banking agencies, including document execution services. The Order does not make any findings of fact or conclusions of wrongdoing, nor does LPS admit any fault or liability. Under the Order, LPS agreed to further study the issues identified in the review and to enhance its compliance, internal audit, risk management and board oversight plans with respect to those businesses. LPS also agreed to engage an independent third party to conduct a risk assessment and review of its default management businesses and document execution services provided to servicers from January 1, 2008 through December 31, 2010.
The document execution review by the independent third party has been on indefinite hold since June 30, 2013 while the banking agencies consider what, if any, additional review work they would like the independent third party to undertake. Accordingly, the document execution review has taken, and is likely to continue to take longer to complete than previously anticipated. In addition, the LPS default operations that were subject to the Order were contributed to ServiceLink in connection with the January 2014 acquisition and reorganization of LPS by FNF (see note 2). To the extent such third party review, once completed, requires additional remediation of mortgage documents, ServiceLink (as a result of the contribution of the underlying LPS businesses) has agreed to implement an appropriate plan to address the issues. The Order contains various deadlines to accomplish the undertakings set forth therein, including the preparation of a remediation plan following the completion of the document execution review. We or the LPS default operations contributed to ServiceLink will continue to make periodic reports to the banking agencies on the progress with respect to each of the undertakings in the Order. The Order does not include any fine or other monetary penalty, although the banking agencies have not yet concluded their assessment of whether any civil monetary penalties should be imposed. Although LPS (which was converted to BKIS), is a party to the Order, any potential resulting liability is expected to be borne by the underlying LPS default operations, which are now part of ServiceLink.
| (8) | Income Taxes |
The effective tax rate for the time period from January 2, 2014 to September 30, 2014 and the nine months ended September 30, 2013 was 4.5% and 35%, respectively. The decrease in the effective rate is primarily due to the change in taxable status of the Company to a partnership under federal and state income tax laws. The tax benefit recognized during the time period from January 2, 2014 to September 30, 2014 is primarily due to the deductible transaction costs incurred by LPS prior to the change in taxable status, partially offset by an insignificant provision related to the Company’s corporate subsidiary.
In connection with purchasing accounting described in note 2, BKIS established a $422.5 million deferred tax liability at the opening balance sheet date. This liability became the responsibility of Black Knight as part of the conversion of LPS into a Delaware limited liability company and internal reorganization as further described in note 2. The Condensed Consolidated Statement of Members’ Equity reflects the treatment of this deferred tax liability as a Distribution to FNF from Contributed Member Capital.
| (9) | Segment Information |
Summarized unaudited financial information concerning our segments is shown in the tables below. Following the acquisition of LPS by FNF and subsequent reorganization described in note 2, we have two reporting segments: (1) Technology and (2) Data and Analytics. For periods prior to 2014, the unaudited financial information includes LPS’s former Transaction Services segment that was transferred to ServiceLink on January 3, 2014.
F-23
Table of Contents
BLACK KNIGHT FINANCIAL SERVICES, LLC
NOTES TO CONDENSED CONSOLIDATED FINANCIAL STATEMENTS (Unaudited) (continued)
Effective January 2, 2014, the Technology segment includes the results of Commerce Velocity and the Data and Analytics segment includes the results of Property Insight which were contributed into BKFS by FNF in transactions between entities under common control. See note 2 for further discussion.
As of and for the three months ended September 30, 2014 (in millions):
| Successor | ||||||||||||||||
| Technology | Data and Analytics |
Corporate and Other |
Total | |||||||||||||
| Revenues |
$ | 178.7 | $ | 36.3 | $ | — | $ | 215.0 | ||||||||
| Operating expenses(1) |
81.4 | 32.5 | 10.9 | 124.8 | ||||||||||||
| Depreciation and amortization |
44.2 | 3.4 | 0.3 | 47.9 | ||||||||||||
| Transition and integration costs |
0.4 | — | 7.8 | 8.2 | ||||||||||||
|
|
|
|
|
|
|
|
|
|||||||||
| Operating income (loss) |
52.7 | 0.4 | (19.0 | ) | 34.1 | |||||||||||
| Total other income (expense) |
0.1 | (0.1 | ) | (35.7 | ) | (35.7 | ) | |||||||||
|
|
|
|
|
|
|
|
|
|||||||||
| Income (loss) from continuing operations before income taxes |
$ | 52.8 | $ | 0.3 | $ | (54.7 | ) | $ | (1.6 | ) | ||||||
|
|
|
|
|
|
|
|
|
|||||||||
| Balance sheet data: |
||||||||||||||||
| Total assets |
$ | 3,142.1 | $ | 304.8 | $ | 161.4 | $ | 3,608.3 | ||||||||
|
|
|
|
|
|
|
|
|
|||||||||
| Goodwill |
$ | 2,035.6 | $ | 174.1 | $ | — | $ | 2,209.7 | ||||||||
|
|
|
|
|
|
|
|
|
|||||||||
As of and for the three months ended September 30, 2013 (in millions):
| Predecessor(2) | ||||||||||||||||||||||||
| Technology | Data and Analytics |
Technology and Data and Analytics Corporate and Other |
Total Technology and Data And Analytics |
Transaction Services |
Total | |||||||||||||||||||
| Revenues |
$ | 161.2 | $ | 19.3 | $ | 0.1 | $ | 180.6 | $ | 236.6 | $ | 417.2 | ||||||||||||
| Operating expenses(1) |
85.1 | 20.6 | 10.9 | 116.6 | 199.9 | 316.5 | ||||||||||||||||||
| Depreciation and amortization |
18.6 | 1.2 | 0.8 | 20.6 | 5.0 | 25.6 | ||||||||||||||||||
| Legal and regulatory charges |
— | — | 0.6 | 0.6 | 1.8 | 2.4 | ||||||||||||||||||
| Exit costs, impairments and other charges |
0.4 | — | 3.1 | 3.5 | 6.8 | 10.3 | ||||||||||||||||||
|
|
|
|
|
|
|
|
|
|
|
|
|
|||||||||||||
| Operating income (loss) |
57.1 | (2.5 | ) | (15.3 | ) | 39.3 | 23.1 | 62.4 | ||||||||||||||||
| Total other income (expense) |
0.2 | 0.3 | (13.7 | ) | (13.2 | ) | 0.7 | (12.5 | ) | |||||||||||||||
|
|
|
|
|
|
|
|
|
|
|
|
|
|||||||||||||
| Income (loss) from continuing operations before income taxes |
$ | 57.3 | $ | (2.2 | ) | $ | (29.0 | ) | $ | 26.1 | $ | 23.8 | $ | 49.9 | ||||||||||
|
|
|
|
|
|
|
|
|
|
|
|
|
|||||||||||||
| Balance sheet data: |
||||||||||||||||||||||||
| Total assets |
$ | 1,136.7 | $ | 174.9 | $ | 346.8 | $ | 1,658.4 | $ | 714.1 | $ | 2,372.5 | ||||||||||||
|
|
|
|
|
|
|
|
|
|
|
|
|
|||||||||||||
| Goodwill |
$ | 688.6 | $ | 36.2 | $ | — | $ | 724.8 | $ | 384.5 | $ | 1,109.3 | ||||||||||||
|
|
|
|
|
|
|
|
|
|
|
|
|
|||||||||||||
F-24
Table of Contents
BLACK KNIGHT FINANCIAL SERVICES, LLC
NOTES TO CONDENSED CONSOLIDATED FINANCIAL STATEMENTS (Unaudited) (continued)
As of and for the time period from January 2, 2014 to September 30, 2014 (in millions):
| Successor | ||||||||||||||||
| Technology | Data and Analytics |
Corporate and Other |
Total | |||||||||||||
| Revenues |
$ | 518.5 | $ | 113.2 | $ | 0.1 | $ | 631.8 | ||||||||
| Operating expenses(1) |
255.6 | 107.1 | 29.6 | 392.3 | ||||||||||||
| Depreciation and amortization |
130.6 | 10.4 | 2.1 | 143.1 | ||||||||||||
| Transition and integration costs |
3.4 | 0.5 | 107.2 | 111.1 | ||||||||||||
|
|
|
|
|
|
|
|
|
|||||||||
| Operating income (loss) |
128.9 | (4.8 | ) | (138.8 | ) | (14.7 | ) | |||||||||
| Total other income (expense) |
0.6 | 0.1 | (108.6 | ) | (107.9 | ) | ||||||||||
|
|
|
|
|
|
|
|
|
|||||||||
| Income (loss) from continuing operations before income taxes |
$ | 129.5 | $ | (4.7 | ) | $ | (247.4 | ) | $ | (122.6 | ) | |||||
|
|
|
|
|
|
|
|
|
|||||||||
As of and for the nine months ended September 30, 2013 (in millions):
| Predecessor(2) | ||||||||||||||||||||||||
| Technology | Data and Analytics |
Technology and Data and Analytics Corporate and Other |
Total Technology and Data And Analytics |
Transaction Services |
Total | |||||||||||||||||||
| Revenues |
$ | 499.0 | $ | 61.4 | $ | 0.1 | $ | 560.5 | $ | 793.3 | $ | 1,353.8 | ||||||||||||
| Operating expenses(1) |
254.3 | 58.8 | 34.9 | 348.0 | 655.8 | 1,003.8 | ||||||||||||||||||
| Depreciation and amortization |
56.3 | 3.5 | 2.4 | 62.2 | 15.6 | 77.8 | ||||||||||||||||||
| Legal and regulatory charges |
— | — | 0.8 | 0.8 | 53.2 | 54.0 | ||||||||||||||||||
| Exit costs, impairments and other charges |
0.4 | 0.1 | 3.6 | 4.1 | 7.9 | 12.0 | ||||||||||||||||||
|
|
|
|
|
|
|
|
|
|
|
|
|
|||||||||||||
| Operating income (loss) |
188.0 | (1.0 | ) | (41.6 | ) | 145.4 | 60.8 | 206.2 | ||||||||||||||||
| Total other income (expense) |
0.6 | 0.7 | (41.4 | ) | (40.1 | ) | 2.4 | (37.7 | ) | |||||||||||||||
|
|
|
|
|
|
|
|
|
|
|
|
|
|||||||||||||
| Income (loss) from continuing operations before income taxes |
$ | 188.6 | $ | (0.3 | ) | $ | (83.0 | ) | $ | 105.3 | $ | 63.2 | $ | 168.5 | ||||||||||
|
|
|
|
|
|
|
|
|
|
|
|
|
|||||||||||||
| (1) | Operating expenses within the “Corporate and Other” (Successor) and “Technology and Data and Analytics Corporate and Other” (Predecessor) columns are attributable to unallocated general and administrative expenses. |
| (2) | Predecessor segment results have been restated to conform with current period presentation. Most significantly, the LPS Technology, Data and Analytics (“TD&A”) segment has been divided into separate (1) Technology and (2) Data and Analytics segments. In addition, the previously reported Corporate and Other column has been partially allocated to the Transaction Services segment, while the remaining portion has been combined with other corporate amounts previously allocated to the TD&A segment, the total of which comprises the Technology and Data and Analytics Corporate and Other column. |
| (10) | Subsequent Events |
We considered events or transactions that occurred after the date of the consolidated balance sheet, but before the financial statements were issued, to provide additional evidence relative to certain estimates or to identify matters that require additional disclosure. Subsequent events have been evaluated through November 14, 2014, the date on which the condensed consolidated financial statements were issued. There were no subsequent events other than those described elsewhere in the notes to condensed consolidated financial statements herein.
F-25
Table of Contents
Report of Independent Registered Public Accounting Firm
The Board of Managers and Members
Black Knight Financial Services, LLC:
We have audited the accompanying consolidated balance sheets of Lender Processing Services, Inc. and subsidiaries (the “Company”) as of December 31, 2013 and 2012, and the related consolidated statements of earnings, comprehensive earnings, stockholders’ equity, and cash flows for each of the years in the three-year period ended December 31, 2013. These consolidated financial statements are the responsibility of the Company’s management. Our responsibility is to express an opinion on these consolidated financial statements based on our audits.
We conducted our audits in accordance with the standards of the Public Company Accounting Oversight Board (United States). Those standards require that we plan and perform the audit to obtain reasonable assurance about whether the financial statements are free of material misstatement. An audit includes examining, on a test basis, evidence supporting the amounts and disclosures in the financial statements. An audit also includes assessing the accounting principles used and significant estimates made by management, as well as evaluating the overall financial statement presentation. We believe that our audits provide a reasonable basis for our opinion.
In our opinion, the consolidated financial statements referred to above present fairly, in all material respects, the financial position of Lender Processing Services, Inc. and subsidiaries as of December 31, 2013 and 2012, and the results of their operations and their cash flows for each of the years in the three-year period ended December 31, 2013, in conformity with U.S. generally accepted accounting principles.
As discussed in note 2 to the consolidated financial statements, the Company merged with and into Lion Merger Sub, Inc., and became a wholly owned subsidiary of Fidelity National Financial, Inc., on January 2, 2014.
/s/ KPMG LLP
March 31, 2014
Jacksonville, Florida
Certified Public Accountants
F-26
Table of Contents
LENDER PROCESSING SERVICES, INC.
AND SUBSIDIARIES
(In millions)
| December 31, | ||||||||
| 2013 | 2012 | |||||||
| ASSETS |
| |||||||
| Current assets: |
||||||||
| Cash and cash equivalents |
$ | 329.6 | $ | 236.2 | ||||
| Trade receivables, net |
204.8 | 274.8 | ||||||
| Other receivables |
7.6 | 3.8 | ||||||
| Income tax receivable |
23.8 | — | ||||||
| Prepaid expenses and other current assets |
35.0 | 41.6 | ||||||
| Deferred income taxes, net |
102.1 | 127.7 | ||||||
|
|
|
|
|
|||||
| Total current assets |
702.9 | 684.1 | ||||||
| Property and equipment, net |
119.8 | 126.6 | ||||||
| Computer software, net |
252.2 | 245.3 | ||||||
| Other intangible assets, net |
17.8 | 23.7 | ||||||
| Goodwill |
1,109.3 | 1,109.3 | ||||||
| Other non-current assets (inclusive of investments carried at fair value)—note 6 |
284.7 | 256.8 | ||||||
|
|
|
|
|
|||||
| Total assets |
$ | 2,486.7 | $ | 2,445.8 | ||||
|
|
|
|
|
|||||
| LIABILITIES AND STOCKHOLDERS’ EQUITY |
| |||||||
| Current liabilities: |
||||||||
| Current portion of long-term debt |
$ | 60.2 | $ | — | ||||
| Trade accounts payable |
46.5 | 38.9 | ||||||
| Accrued salaries and benefits |
89.6 | 108.0 | ||||||
| Legal and regulatory accrual |
99.3 | 223.1 | ||||||
| Other accrued liabilities |
131.8 | 169.5 | ||||||
| Deferred revenues |
54.7 | 58.9 | ||||||
|
|
|
|
|
|||||
| Total current liabilities |
482.1 | 598.4 | ||||||
| Deferred revenues |
34.7 | 25.0 | ||||||
| Deferred income taxes, net |
226.1 | 174.3 | ||||||
| Long-term debt, net of current portion |
1,007.9 | 1,068.1 | ||||||
| Other non-current liabilities |
32.9 | 37.2 | ||||||
|
|
|
|
|
|||||
| Total liabilities |
1,783.7 | 1,903.0 | ||||||
|
|
|
|
|
|||||
| Commitments and contingencies (note 15) |
||||||||
| Stockholders’ equity: |
||||||||
| Preferred stock $0.0001 par value; 50 million shares authorized, none issued at December 31, 2013 and 2012 |
— | — | ||||||
| Common stock $0.0001 par value; 500 million shares authorized, 97.4 million shares issued at December 31, 2013 and 2012 |
— | — | ||||||
| Additional paid-in capital |
229.4 | 250.0 | ||||||
| Retained earnings |
762.0 | 694.1 | ||||||
| Accumulated other comprehensive loss |
(2.8 | ) | (3.1 | ) | ||||
| Treasury stock at cost; 9.5 million and 12.5 million shares at December 31, 2013 and 2012, |
(285.6 | ) | (398.2 | ) | ||||
|
|
|
|
|
|||||
| Total stockholders’ equity |
703.0 | 542.8 | ||||||
|
|
|
|
|
|||||
| Total liabilities and stockholders’ equity |
$ | 2,486.7 | $ | 2,445.8 | ||||
|
|
|
|
|
|||||
See accompanying notes to consolidated financial statements
F-27
Table of Contents
LENDER PROCESSING SERVICES, INC.
AND SUBSIDIARIES
Consolidated Statements of Earnings
(In millions, except per share amounts)
| Year Ended December 31, | ||||||||||||
| 2013 | 2012 | 2011 | ||||||||||
| Revenues |
$ | 1,723.5 | $ | 1,997.6 | $ | 1,983.4 | ||||||
| Expenses: |
||||||||||||
| Operating expenses |
1,285.1 | 1,465.1 | 1,480.4 | |||||||||
| Depreciation and amortization |
105.4 | 96.7 | 88.9 | |||||||||
| Legal and regulatory charges |
74.4 | 192.4 | 78.5 | |||||||||
| Exit costs, impairments and other charges |
49.4 | 10.5 | 56.9 | |||||||||
|
|
|
|
|
|
|
|||||||
| Total expenses |
1,514.3 | 1,764.7 | 1,704.7 | |||||||||
|
|
|
|
|
|
|
|||||||
| Operating income |
209.2 | 232.9 | 278.7 | |||||||||
|
|
|
|
|
|
|
|||||||
| Other income (expense): |
||||||||||||
| Interest income |
2.3 | 1.9 | 1.5 | |||||||||
| Interest expense |
(52.4 | ) | (88.0 | ) | (67.6 | ) | ||||||
| Other income (expense), net |
0.1 | 0.2 | (0.2 | ) | ||||||||
|
|
|
|
|
|
|
|||||||
| Total other income (expense) |
(50.0 | ) | (85.9 | ) | (66.3 | ) | ||||||
|
|
|
|
|
|
|
|||||||
| Earnings from continuing operations before income taxes |
159.2 | 147.0 | 212.4 | |||||||||
| Provision for income taxes |
54.1 | 67.5 | 77.2 | |||||||||
|
|
|
|
|
|
|
|||||||
| Net earnings from continuing operations |
105.1 | 79.5 | 135.2 | |||||||||
| Loss from discontinued operations, net of fax |
(2.4 | ) | (9.1 | ) | (38.7 | ) | ||||||
|
|
|
|
|
|
|
|||||||
| Net earnings |
$ | 102.7 | $ | 70.4 | $ | 96.5 | ||||||
|
|
|
|
|
|
|
|||||||
| Net earnings per share—basic from continuing operations |
$ | 1.23 | $ | 0.94 | $ | 1.58 | ||||||
| Net loss per share—basic from discontinued operations |
(0.03 | ) | (0.11 | ) | (0.45 | ) | ||||||
|
|
|
|
|
|
|
|||||||
| Net earnings per share—basic |
$ | 1.20 | $ | 0.83 | $ | 1.13 | ||||||
|
|
|
|
|
|
|
|||||||
| Weighted average shares outstanding—basic |
85.4 | 84.6 | 85.6 | |||||||||
|
|
|
|
|
|
|
|||||||
| Net earnings per share—diluted from continuing operations |
$ | 1.22 | $ | 0.93 | $ | 1.58 | ||||||
| Net loss per share—diluted from discontinued operations |
(0.03 | ) | (0.10 | ) | (0.45 | ) | ||||||
|
|
|
|
|
|
|
|||||||
| Net earnings per share—diluted |
$ | 1.19 | $ | 0.83 | $ | 1.13 | ||||||
|
|
|
|
|
|
|
|||||||
| Weighted average shares outstanding—diluted |
85.9 | 84.9 | 85.7 | |||||||||
|
|
|
|
|
|
|
|||||||
See accompanying notes to consolidated financial statements.
F-28
Table of Contents
LENDER PROCESSING SERVICES, INC.
AND SUBSIDIARIES
Consolidated Statements of Comprehensive Earnings
(In millions)
| Year Ended December 31, | ||||||||||||
| 2013 | 2012 | 2011 | ||||||||||
| Net earnings |
$ | 102.7 | $ | 70.4 | $ | 96.5 | ||||||
| Other comprehensive earnings (loss): |
||||||||||||
| Unrealized gain (loss) on investments, net of tax(1): |
||||||||||||
| Unrealized holding gains (losses) |
(2.3 | ) | 0.8 | 1.3 | ||||||||
| Reclassification adjustments for gains on sold investments included in net earnings |
— | (0.1 | ) | — | ||||||||
|
|
|
|
|
|
|
|||||||
| Total unrealized gain (loss) on investments, net of tax(1) |
(2.3 | ) | 0.7 | 1.3 | ||||||||
|
|
|
|
|
|
|
|||||||
| Unrealized gain (loss) on interest rate swaps, net of tax(2): |
||||||||||||
| Unrealized holding gains (losses) |
0.1 | (4.6 | ) | (3.8 | ) | |||||||
| Reclassification adjustments for losses included in net earnings |
2.6 | 2.6 | 1.0 | |||||||||
|
|
|
|
|
|
|
|||||||
| Total unrealized gain (loss) on interest rate swaps, net of tax(2) |
2.7 | (2.0 | ) | (2.8 | ) | |||||||
|
|
|
|
|
|
|
|||||||
| Currency translation adjustment |
(0.1 | ) | — | — | ||||||||
|
|
|
|
|
|
|
|||||||
| Other comprehensive earnings (loss) |
0.3 | (1.3 | ) | (1.5 | ) | |||||||
|
|
|
|
|
|
|
|||||||
| Comprehensive earnings |
$ | 103.0 | $ | 69.1 | $ | 95.0 | ||||||
|
|
|
|
|
|
|
|||||||
| (1) | Net of income tax expense (benefit) of $(1.4) million , $0.4 million and $0.8 million for the years ended December 31, 2013, 2012 and 2011, respectively. |
| (2) | Net of income tax expense (benefit) of $1.6 million, $(1.2) million and $(1.7) million for the years ended December 31, 2013, 2012 and 2011, respectively. |
See accompanying notes to consolidated financial statements.
F-29
Table of Contents
LENDER PROCESSING SERVICES, INC.
AND SUBSIDIARIES
Consolidated Statements of Stockholders’ Equity
(In millions)
| Common Shares |
Common Stock |
Additional Paid-In Capital |
Retained Earnings |
Accumulated Other Comprehensive Loss |
Treasury Shares |
Treasury Stock |
Total Stockholders’ Equity |
|||||||||||||||||||||||||
| Balances, December 31, 2010 |
97.4 | $ | — | $ | 216.9 | $ | 596.2 | $ | (0.3 | ) | (8.6 | ) | $ | (286.5 | ) | $ | 526.3 | |||||||||||||||
| Net earnings |
— | — | — | 96.5 | — | — | — | 96.5 | ||||||||||||||||||||||||
| Cash dividends declared(1)(2) |
— | — | — | (34.6 | ) | — | — | — | (34.6 | ) | ||||||||||||||||||||||
| Exercise of stock options and restricted stock vesting |
— | — | (7.2 | ) | — | — | 0.1 | 4.5 | (2.7 | ) | ||||||||||||||||||||||
| Income tax expense associated with equity compensation |
— | — | (0.9 | ) | — | — | — | — | (0.9 | ) | ||||||||||||||||||||||
| Stock-based compensation |
— | — | 41.7 | — | — | — | — | 41.7 | ||||||||||||||||||||||||
| Treasury stock repurchases |
— | — | — | — | — | (4.5 | ) | (136.9 | (136.9 | ) | ||||||||||||||||||||||
| Unrealized gain on investments, net |
— | — | — | — | 1.3 | — | — | 1.3 | ||||||||||||||||||||||||
| Unrealized loss on interest rate swaps, net |
— | — | — | — | (2.8 | ) | — | — | (2.8 | ) | ||||||||||||||||||||||
|
|
|
|
|
|
|
|
|
|
|
|
|
|
|
|
|
|||||||||||||||||
| Balances, December 31, 2011 |
97.4 | — | 250.5 | 658.1 | (1.8 | ) | (13.0 | ) | (418.9 | ) | 487.9 | |||||||||||||||||||||
|
|
|
|
|
|
|
|
|
|
|
|
|
|
|
|
|
|||||||||||||||||
| Net earnings |
— | — | — | 70.4 | — | — | — | 70.4 | ||||||||||||||||||||||||
| Cash dividends declared(1)(2) |
— | — | — | (34.4 | ) | — | — | — | (34.4 | ) | ||||||||||||||||||||||
| Exercise of stock options and restricted stock vesting |
— | — | (23.4 | ) | — | — | 0.5 | 20.7 | (2.7 | ) | ||||||||||||||||||||||
| Income tax expense associated with equity compensation |
— | — | (2.8 | ) | — | — | — | — | (2.8 | ) | ||||||||||||||||||||||
| Stock-based compensation |
— | — | 25.7 | — | — | — | — | 25.7 | ||||||||||||||||||||||||
| Unrealized gain on investments, net |
— | — | — | — | 0.7 | — | — | 0.7 | ||||||||||||||||||||||||
| Unrealized loss on interest rate swaps, net |
— | — | — | — | (2.0 | ) | — | — | (2.0 | ) | ||||||||||||||||||||||
|
|
|
|
|
|
|
|
|
|
|
|
|
|
|
|
|
|||||||||||||||||
| Balances, December 31, 2012 |
97.4 | — | 250.0 | 694.1 | (3.1 | ) | (12.5 | ) | (398.2 | ) | 542.8 | |||||||||||||||||||||
|
|
|
|
|
|
|
|
|
|
|
|
|
|
|
|
|
|||||||||||||||||
| Net earnings |
— | — | — | 102.7 | — | — | — | 102.7 | ||||||||||||||||||||||||
| Cash dividends declared(1)(2) |
— | — | — | (34.8 | ) | — | — | — | (34.8 | ) | ||||||||||||||||||||||
| Exercise of stock options and restricted stock vesting |
— | — | (48.2 | ) | — | 3.0 | 112.6 | 64.4 | ||||||||||||||||||||||||
| Stock-based compensation |
— | — | 27.6 | — | — | — | — | 27.6 | ||||||||||||||||||||||||
| Unrealized loss on investments, net |
— | — | — | — | (2.3 | ) | — | — | (2.3 | ) | ||||||||||||||||||||||
| Unrealized gain on interest rate swaps, net |
— | — | — | — | 2.7 | — | — | 2.7 | ||||||||||||||||||||||||
| Currency translation adjustment |
— | — | — | — | (0.1 | ) | — | — | (0.1 | ) | ||||||||||||||||||||||
|
|
|
|
|
|
|
|
|
|
|
|
|
|
|
|
|
|||||||||||||||||
| Balances, December 31, 2013 |
97.4 | $ | — | $ | 229.4 | $ | 762.0 | $ | (2.8 | ) | (9.5 | ) | $ | (285.6 | ) | $ | 703.0 | |||||||||||||||
|
|
|
|
|
|
|
|
|
|
|
|
|
|
|
|
|
|||||||||||||||||
| (1) | Dividends were paid at $0.10 per common share per quarter. |
| (2) | Dividends declared includes dividends accrued on restricted stock that are not paid until a vesting occurs. See note 16. |
See accompanying notes to consolidated financial statements
F-30
Table of Contents
LENDER PROCESSING SERVICES, INC.
AND SUBSIDIARIES
Consolidated Statements of Cash Flows
(In millions)
| Years Ended December 31, | ||||||||||||
| 2013 | 2012 | 2011 | ||||||||||
| Cash flows from operating activities: |
||||||||||||
| Net earnings |
$ | 102.7 | $ | 70.4 | $ | 96.5 | ||||||
| Adjustments to reconcile net earnings to net cash provided by operating activities: |
||||||||||||
| Depreciation and amortization |
105.4 | 98.8 | 98.8 | |||||||||
| Amortization of debt issuance costs |
4.2 | 12.3 | 10.0 | |||||||||
| (Gain) loss on sale of discontinued operations |
— | (20.2 | ) | 0.9 | ||||||||
| Asset impairment charges |
29.4 | 6.6 | 72.0 | |||||||||
| Deferred income taxes, net |
76.8 | (3.7 | ) | (4.8 | ) | |||||||
| Stock-based compensation cost |
27.6 | 25.7 | 41.7 | |||||||||
| Income tax effect of equity compensation |
(4.3 | ) | (0.9 | ) | 0.9 | |||||||
| Changes in assets and liabilities, net of effects of acquisitions and divestitures: |
||||||||||||
| Trade receivables |
69.8 | 62.6 | 72.5 | |||||||||
| Other receivables |
(3.8 | ) | (0.9 | ) | 3.3 | |||||||
| Income tax receivable |
(23.8 | ) | — | — | ||||||||
| Prepaid expenses and other assets |
(17.1 | ) | (27.2 | ) | (6.3 | ) | ||||||
| Deferred revenues |
5.5 | 18.0 | 4.0 | |||||||||
| Accounts payable, accrued liabilities and other liabilities |
(171.4 | ) | 192.9 | 88.4 | ||||||||
|
|
|
|
|
|
|
|||||||
| Net cash provided by operating activities |
201.0 | 434.4 | 477.9 | |||||||||
|
|
|
|
|
|
|
|||||||
| Cash flows from investing activities: |
||||||||||||
| Additions to property and equipment |
(27.0 | ) | (38.9 | ) | (32.8 | ) | ||||||
| Additions to capitalized software |
(86.8 | ) | (74.4 | ) | (72.1 | ) | ||||||
| Purchases of investments |
(13.1 | ) | (24.5 | ) | (25.2 | ) | ||||||
| Proceeds from sale of investments |
5.9 | 5.9 | 3.7 | |||||||||
| Acquisition of title plants and property records data |
(19.8 | ) | (44.8 | ) | (24.0 | ) | ||||||
| Acquisitions, net of cash acquired |
— | (12.2 | ) | (9.8 | ) | |||||||
| Proceeds from sale of discontinued operations, net of cash distributed |
— | 42.6 | 4.5 | |||||||||
|
|
|
|
|
|
|
|||||||
| Net cash used in investing activities |
(140.8 | ) | (146.3 | ) | (155.7 | ) | ||||||
|
|
|
|
|
|
|
|||||||
| Cash flows from financing activities: |
||||||||||||
| Borrowings |
— | 600.0 | 1,005.0 | |||||||||
| Debt service payments |
— | (319.0 | ) | (1,100.2 | ) | |||||||
| Debt issuance costs paid |
— | (10.6 | ) | (22.1 | ) | |||||||
| Exercise of stock options and restricted stock vesting |
64.4 | (2.7 | ) | (2.7 | ) | |||||||
| Income tax effect of equity compensation |
4.3 | 0.9 | (0.9 | ) | ||||||||
| Dividends paid |
(34.5 | ) | (33.9 | ) | (34.4 | ) | ||||||
| Treasury stock repurchases |
— | — | (136.9 | ) | ||||||||
| Bond repurchases |
— | (362.0 | ) | (4.9 | ) | |||||||
| Payment of contingent consideration related to acquisitions |
(1.0 | ) | (2.0 | ) | — | |||||||
|
|
|
|
|
|
|
|||||||
| Net cash provided by (used in) financing activities |
33.2 | (129.3 | ) | (297.1 | ) | |||||||
|
|
|
|
|
|
|
|||||||
| Net increase in cash and cash equivalents |
93.4 | 158.8 | 25.1 | |||||||||
| Cash and cash equivalents, beginning of year |
236.2 | 77.4 | 52.3 | |||||||||
|
|
|
|
|
|
|
|||||||
| Cash and cash equivalents, end of year |
$ | 329.6 | $ | 236.2 | $ | 77.4 | ||||||
|
|
|
|
|
|
|
|||||||
| Supplemental disclosures of cash flow information: |
||||||||||||
| Cash paid for interest |
$ | 51.7 | $ | 68.8 | $ | 57.0 | ||||||
|
|
|
|
|
|
|
|||||||
| Cash paid for taxes |
$ | 4.9 | $ | 74.7 | $ | 56.5 | ||||||
|
|
|
|
|
|
|
|||||||
See accompanying notes to consolidated financial statements.
F-31
Table of Contents
LENDER PROCESSING SERVICES, INC.
AND SUBSIDIARIES
NOTES TO CONSOLIDATED FINANCIAL STATEMENTS
Except as otherwise indicated or unless the context otherwise requires, all references to “LPS,” or “we,” are to Lender Processing Services, Inc., a Delaware corporation that was incorporated in December 2007 as a wholly-owned subsidiary of Fidelity National Information Services, Inc. (“FIS”), a Georgia corporation, and its subsidiaries. FIS owned all of our shares until they were distributed to the shareholders of FIS in a tax-free spin-off on July 2, 2008. On January 2, 2014, we were merged with and into a subsidiary of Fidelity National Financial, Inc. (“FNF”), with LPS surviving as a subsidiary of FNF, and on January 3, 2014, we were converted into a Delaware limited liability company and renamed Black Knight InfoServ, LLC (“BKIS”), as further described in note 2 below.
| (1) | Description of Business |
Reporting Segments
We provided integrated technology, data and services to the mortgage lending industry. We conducted our operations through two reporting segments, Technology, Data and Analytics and Transaction Services.
The Technology, Data and Analytics (“TD&A”) segment principally included:
| • | mortgage processing services conducted using our mortgage servicing platform (“MSP”) and our team of experienced support personnel; |
| • | the Desktop application, a workflow system that assists customers in managing business processes, which is primarily used in connection with mortgage loan default management; |
| • | other software and related service offerings, including our mortgage origination software and our collaborative electronic vendor network, which provides connectivity among mortgage industry participants; and |
| • | data and analytics businesses, the most significant of which are our alternative property valuations business, which provides a range of valuations other than traditional appraisals, and our aggregated property, loan and tax data services. |
The Transaction Services segment offered a range of services used mainly in the production of a mortgage loan, which are referred to as origination services, and in the management of mortgage loans that go into default, which are referred to as default services.
Origination services included:
| • | settlement and title agency services, including acting as an agent for title insurers or as an underwriter, and closing services, which include assisting in the closing of real estate transactions; |
| • | appraisal services, which consist of traditional property appraisals provided through our appraisal management company; and |
| • | flood zone determination services, which assist lenders in determining whether a property is in a federally designated flood zone. |
Default services included, among others:
| • | property inspection and preservation services designed to preserve the value of properties securing defaulted loans; and |
| • | foreclosure administrative services, including administrative services and support provided to independent attorneys and trustees, mandatory title searches, posting and publishing, and other services. |
F-32
Table of Contents
LENDER PROCESSING SERVICES, INC.
AND SUBSIDIARIES
NOTES TO CONSOLIDATED FINANCIAL STATEMENTS (continued)
In addition to our two reporting segments, our corporate segment primarily consists of general and administrative expenses that are not included in the other segments and legal and regulatory charges.
| (2) | Acquisition by FNF |
On January 2, 2014, FNF completed the acquisition of LPS pursuant to the Agreement and Plan of Merger (the “Merger Agreement”), dated as of May 28, 2013, among FNF, Lion Merger Sub, Inc., a Delaware corporation and a subsidiary of FNF (“Merger Sub”), and LPS. Pursuant to the Merger Agreement, Merger Sub merged with and into LPS (the “Merger”), with LPS surviving as a subsidiary of FNF, and each outstanding share of common stock, par value $0.0001 per share, of LPS (the “LPS Common Stock”) (other than shares owned by LPS, its subsidiaries, FNF or Merger Sub and shares in respect of which appraisal rights had been properly exercised and perfected under Delaware law) was automatically converted into the right to receive (i) $28.102 in cash and (ii) 0.28742 of a share of Class A common stock, par value $0.0001 per share, of FNF (“FNF Common Stock”) (the “Merger Consideration”). The Merger was effective on January 2, 2014. In connection with the Merger, FNF issued approximately 25.9 million shares of FNF Common Stock and paid approximately $2.5 billion in cash to former stockholders and equity award holders of LPS. Upon the closing of the Merger, the shares of LPS Common Stock, which previously traded under the ticker symbol “LPS” on the New York Stock Exchange (the “NYSE”), ceased trading on, and were delisted from, the NYSE.
On January 2, 2014, upon consummation of the Merger, LPS entered into a Supplemental Indenture (the “Supplemental Indenture”) with FNF, Black Knight Lending Solutions, Inc., a Delaware corporation (“BKLS”), and U.S. Bank National Association , as trustee (the “Trustee”) to the Indenture (as supplemented by the Supplemental Indenture, the “Indenture”), dated as of October 12, 2012, among LPS, the subsidiary guarantors party thereto and U.S. Bank National Association, as trustee, related to LPS’s 5.75% Senior Notes due 2023 (the “Notes”). Pursuant to the terms of the Supplemental Indenture, (i) FNF became a guarantor of LPS’ obligations under the Notes and agreed to fully and unconditionally guarantee the Notes, on a joint and several basis with the guarantors named in the Indenture, and (ii) BKLS became a “co-issuer” of the Notes and agreed to become a co-obligor of LPS’ obligations under the Indenture and the Notes, on the same terms and subject to the same conditions as LPS, on a joint and several basis. As a result of FNF’s guarantee of the Notes, the Notes were rated as investment grade, which resulted in the suspension of most of the restrictive covenants in the Indenture.
Also upon consummation of the Merger, other financing activities included full repayment of our Term A Loan with an aggregate principal amount outstanding of $468.1 million, as well as termination of our $250.0 million 2011 Interest Rate Swap. See note 14 for further description of the Term A Loan and the 2011 Interest Rate Swap.
On January 3, 2014, LPS was converted into a Delaware limited liability company and was renamed BKIS, a member managed limited liability company. Also on that date, pursuant to an internal reorganization, ownership of BKIS was transferred to Black Knight Financial Services, Inc. (now known as Black Knight Holdings, Inc. or “Black Knight”), and BKIS distributed all of its limited liability company membership interests and equity interests in its subsidiaries engaged in the Transaction Services business to Black Knight (the “Distribution”). Following the Distribution, Black Knight contributed the Transaction Services subsidiaries to its wholly-owned subsidiary Black Knight Financial Services II, LLC, which has been renamed ServiceLink Holdings, LLC.
Subsequent to year-end, on January 16, 2014, we issued an offer to purchase our Senior unsecured notes due October 2023 (the “Senior Notes”) pursuant to the change of control provisions under the related indenture at a purchase price of 101% of the principal amount plus accrued interest to the purchase date. The offer expired on February 18, 2014. As a result of the offer, bondholders tendered $5.2 million in principal of the Senior Notes, which were subsequently purchased by us on February 24, 2014. On February 7, 2014, BKIS, FNF, BKLS and
F-33
Table of Contents
LENDER PROCESSING SERVICES, INC.
AND SUBSIDIARIES
NOTES TO CONSOLIDATED FINANCIAL STATEMENTS (continued)
the Trustee entered into a second Supplemental Indenture (the “Second Supplemental Indenture”) to the Indenture. Under the Second Supplemental Indenture, the financial reporting covenant under the Indenture was amended to substitute reporting of FNF for that of BKIS and BKLS. In connection with the consent to remove the financial reporting covenant, we paid $0.7 million to the holders of the notes in February 2014.
| (3) | Significant Accounting Policies |
The following describes our significant accounting policies that have been followed in preparing the accompanying consolidated financial statements.
| (a) | Principles of Consolidation and Basis of Presentation |
The accompanying consolidated financial statements were prepared in accordance with U.S. generally accepted accounting principles (“GAAP”) and all adjustments considered necessary for a fair presentation have been included. All significant intercompany accounts and transactions have been eliminated.
Certain amounts have been reclassified to conform with current year presentation.
| (b) | Fair Value |
Fair Value of Financial Assets and Liabilities
The fair values of financial assets and liabilities are determined using the following fair value hierarchy:
| • | Level 1 Inputs to the valuation methodology are unadjusted quoted prices for identical assets or liabilities in active markets that we have the ability to access. |
| • | Level 2 Inputs to the valuation methodology include: |
| • | quoted prices for similar assets or liabilities in active markets; |
| • | quoted prices for identical or similar assets or liabilities in inactive markets; |
| • | inputs other than quoted prices that are observable for the asset or liability; and |
| • | inputs that are derived principally from or corroborated by observable market data by correlation or other means. |
| • | Level 3 Inputs to the valuation methodology are unobservable and significant to the fair value measurement. |
Assets are classified in their entirety based on the lowest level of input that is significant to the fair value measurement. We believe our valuation methods are appropriate and consistent with other market participants. The use of different methodologies or assumptions to determine the fair value of certain financial instruments could result in a different fair value measurement at the reporting date.
The following tables set forth by level within the fair value hierarchy our assets and liabilities measured at fair value on a recurring basis. The fair values of other financial instruments, which primarily include short-term financial assets and liabilities and long-term debt, are estimated as of year-end and disclosed elsewhere in these notes.
As of December 31, 2013 (in millions):
| Fair Value | ||||||||||||||||||||||
| Classification | Carrying Value |
Level 1 | Level 2 | Level 3 | Total | |||||||||||||||||
| Investments (note 6) |
Asset | $ | 77.0 | $ | 4.6 | $ | 72.4 | $ | — | $ | 77.0 | |||||||||||
| Interest rate swaps (note 14) |
Liability | $ | 4.3 | $ | — | $ | 4.3 | $ | — | $ | 4.3 | |||||||||||
F-34
Table of Contents
LENDER PROCESSING SERVICES, INC.
AND SUBSIDIARIES
NOTES TO CONSOLIDATED FINANCIAL STATEMENTS (continued)
As of December 31, 2012 (in millions):
| Fair Value | ||||||||||||||||||||||
| Classification | Carrying Value |
Level 1 | Level 2 | Level 3 | Total | |||||||||||||||||
| Investments (note 6) |
Asset | $ | 74.6 | $ | 5.1 | $ | 69.5 | $ | — | $ | 74.6 | |||||||||||
| Interest rate swaps (note 14) |
Liability | $ | 8.6 | $ | — | $ | 8.6 | $ | — | $ | 8.6 | |||||||||||
Our Level 1 financial instruments include U.S. government bonds, for which there are quoted prices in active markets. Our Level 2 financial instruments consist of corporate bonds, U.S. government agency bonds, municipal bonds and derivatives, for which there are parallel markets or alternative means to estimate fair value using observable information inputs. The estimates used are subjective in nature and involve uncertainties and significant judgment in the interpretation of current market data. Therefore, the values presented are not necessarily indicative of amounts we could realize or settle currently.
Fair Value of Assets Acquired and Liabilities Assumed
The fair values of assets acquired and liabilities assumed in business combinations are estimated using various assumptions. The most significant assumptions, and those requiring the most judgment, involve the estimated fair values of intangible assets and software, with the remaining value, if any, attributable to goodwill. We utilize third-party specialists to assist with determining the fair values of intangible assets and software purchased in business combinations.
| (c) | Management Estimates |
The preparation of these consolidated financial statements in conformity with U.S. GAAP requires management to make estimates and assumptions that affect the reported amounts of assets and liabilities and disclosure of contingent assets and liabilities at the date of the consolidated financial statements and the reported amounts of revenues and expenses during the reporting periods. The accounting estimates that require our most significant, difficult and subjective judgments include the recoverability of long-lived assets and goodwill, allowance for doubtful accounts, the assessment of loss contingencies and income tax reserves. Actual results that we experience could differ from our estimates.
| (d) | Cash and Cash Equivalents |
Highly liquid instruments purchased with original maturities of three months or less are considered cash equivalents. Cash equivalents are predominantly invested with high credit quality financial institutions and consist of short-term investments, such as demand deposit accounts, money market accounts, money market funds and time deposits. The carrying amounts of these instruments reported in the consolidated balance sheets approximate their fair value because of their immediate or short-term maturities.
| (e) | Trade Receivables, Net |
The carrying amounts reported in the consolidated balance sheets for trade receivables approximate their fair value because of their immediate or short-term maturities.
F-35
Table of Contents
LENDER PROCESSING SERVICES, INC.
AND SUBSIDIARIES
NOTES TO CONSOLIDATED FINANCIAL STATEMENTS (continued)
A summary of trade receivables, net of an allowance for doubtful accounts, at December 31, 2013 and 2012 is as follows (in millions):
| 2013 | 2012 | |||||||
| Trade receivables—billed |
$ | 216.6 | $ | 288.5 | ||||
| Trade receivables—unbilled |
28.1 | 31.8 | ||||||
|
|
|
|
|
|||||
| Total trade receivables |
244.7 | 320.3 | ||||||
| Allowance for doubtful accounts |
(39.9 | ) | (45.5 | ) | ||||
|
|
|
|
|
|||||
| Total trade receivables, net |
$ | 204.8 | $ | 274.8 | ||||
|
|
|
|
|
|||||
The allowance for doubtful accounts represents management’s estimate of those balances that are uncollectible as of the consolidated balance sheet dates. We write off accounts receivable when the likelihood of collection of a trade receivable balance is considered remote.
A summary of the roll forward of allowance for doubtful accounts for the years ended December 31, 2013, 2012 and 2011 is as follows (in millions):
| Balance at Beginning of Period |
Bad Debt Expense |
Write-offs, Net of Recoveries |
Transfers and Acquisitions |
Balance at End of Period |
||||||||||||||||
| Year ended December 31, 2011 |
$ | (33.5 | ) | (22.8 | ) | 20.3 | — | $ | (36.0 | ) | ||||||||||
| Year ended December 31, 2012 |
$ | (36.0 | ) | (23.5 | ) | 13.5 | 0.5 | $ | (45.5 | ) | ||||||||||
| Year ended December 31, 2013 |
$ | (45.5 | ) | (8.2 | ) | 13.7 | 0.1 | $ | (39.9 | ) | ||||||||||
| (f) | Deferred Contract Costs |
Cost of software sales, outsourced data processing and application management arrangements, including costs incurred for bid and proposal activities, are generally expensed as incurred. However, certain costs incurred upon initiation of a contract are deferred and expensed over the contract life. These costs represent incremental external costs or certain specific internal costs that are directly related to the contract acquisition or transition activities and are primarily associated with installation of systems/processes and data conversion.
In the event indications exist that a deferred contract cost balance related to a particular contract may be impaired, undiscounted estimated cash flows of the contract are projected over its remaining term and compared to the unamortized deferred contract cost balance. If the projected cash flows are not adequate to recover the unamortized cost balance, the balance would be adjusted to equal the contract’s net realizable value, including any termination fees provided for under the contract, in the period such a determination is made.
As of December 31, 2013 and 2012, we had approximately $47.9 million and $37.1 million, respectively, recorded as deferred contract costs that were classified in prepaid expenses and other current assets and other non-current assets in our consolidated balance sheets. Amortization expense for deferred contract costs was $14.0 million, $9.3 million and $7.1 million for the years ended December 31, 2013, 2012 and 2011, respectively, and is included in depreciation and amortization in the accompanying consolidated statements of earnings.
| (g) | Long-Lived Assets |
Long-lived assets and intangible assets with definite useful lives are reviewed for impairment whenever events or changes in circumstances indicate that the carrying amount of an asset may not be recoverable. Recoverability of assets to be held and used is measured by comparison of the carrying amount of an asset to estimated undiscounted future cash flows expected to be generated by the asset. If the carrying amount of an asset exceeds its estimated future cash flows, an impairment charge is recognized in the amount by which the carrying amount of the asset exceeds the fair value of the asset.
F-36
Table of Contents
LENDER PROCESSING SERVICES, INC.
AND SUBSIDIARIES
NOTES TO CONSOLIDATED FINANCIAL STATEMENTS (continued)
| (h) | Property and Equipment |
Property and equipment is recorded at cost, less accumulated depreciation and amortization. Depreciation and amortization are computed primarily using the straight-line method based on the estimated useful lives of the related assets: 30 years for buildings and 3 to 7 years for furniture, fixtures and computer equipment. Leasehold improvements are amortized using the straight-line method over the lesser of the initial term of the respective leases or the estimated useful lives of such assets.
| (i) | Computer Software |
Computer software includes the fair value of software acquired in business combinations, purchased software and capitalized software development costs. Purchased software is recorded at cost and amortized using the straight-line method over its estimated useful life. Software acquired in business combinations is recorded at its fair value and amortized using straight-line or accelerated methods over its estimated useful life, ranging from 5 years to 10 years.
Internally developed software costs are amortized using the straight-line method over its estimated useful life. Useful lives of computer software range from 3 years to 10 years. Capitalized software development costs are accounted for in accordance with either Accounting Standards Codification (“ASC”) Topic 985, Software, Subtopic 20, Costs of Software to Be Sold, Leased, or Marketed (“ASC 985-20”), or ASC Topic 350, Intangibles—Goodwill and Other (“ASC 350”), Subtopic 40, Internal-Use Software (“ASC 350-40”). For computer software products to be sold, leased, or otherwise marketed (ASC 985-20), all costs incurred to establish the technological feasibility are research and development costs, and are expensed as they are incurred. Costs incurred subsequent to establishing technological feasibility, such as programmers salaries and related payroll costs and costs of independent contractors, are capitalized and amortized on a product by product basis commencing on the date of general release to customers. We do not capitalize any costs once the product is available for general release to customers. For internal-use computer software products (ASC 350-40), internal and external costs incurred during the preliminary project stage are expensed as they are incurred. Internal and external costs incurred during the application development stage are capitalized and amortized on a product by product basis commencing on the date the software is ready for its intended use. We do not capitalize any costs once the software is ready for its intended use. We also assess the recorded value of computer software for impairment on a regular basis by comparing the carrying value to the estimated future cash flows to be generated by the underlying software asset.
| (j) | Intangible Assets |
We have intangible assets that consist primarily of customer relationships and trademarks that are recorded in connection with acquisitions at their fair value based on the results of a valuation analysis. Customer relationships are amortized over their estimated useful lives using an accelerated method which takes into consideration expected customer attrition rates over a period of up to 10 years. Certain trademarks determined to have indefinite lives are reviewed for impairment at least annually.
| (k) | Goodwill |
Goodwill represents the excess of cost over the fair value of identifiable assets acquired and liabilities assumed in business combinations. Goodwill is not amortized, and is tested for impairment annually, or more frequently if circumstances indicate potential impairment. We test goodwill for impairment using a fair value approach at the reporting unit level. We have four reporting units that carry goodwill as of the balance sheet date—Technology, Data and Analytics, Origination Services, and Default Services. We measure for impairment on an annual basis during the fourth quarter using a September 30th measurement date. Other than impairments recorded to discontinued operations, which are described in note 10 and 11 herein, we have not recorded impairments to goodwill during the years ended December 31, 2013, 2012 and 2011.
F-37
Table of Contents
LENDER PROCESSING SERVICES, INC.
AND SUBSIDIARIES
NOTES TO CONSOLIDATED FINANCIAL STATEMENTS (continued)
| (l) | Trade Accounts Payable |
The carrying amounts reported in the consolidated balance sheets for trade accounts payable approximate their fair value because of their immediate or short-term maturities.
| (m) | Loss Contingencies |
ASC Topic 450, Contingencies (“ASC 450”) requires that we accrue for loss contingencies associated with outstanding litigation, claims and assessments, as well as unasserted claims, for which management has determined it is probable that a loss contingency exists and the amount of loss can be reasonably estimated. We accrue estimated legal fees associated with loss contingencies for which we believe a loss is probable and can be reasonably estimated.
| (n) | Restructuring Activities |
We apply the provisions of ASC Topic 420, Exit or Disposal Cost Obligations (“ASC 420”) and ASC Topic 712, Nonretirement Postemployment Benefits (“ASC 712”) in the recording of severance costs. Severance costs accounted for under ASC 420 are recognized when management with the proper level of authority has committed to a restructuring plan and communicated those actions to employees. Severance costs accounted for under ASC 712 are recognized when it is probable that employees will be entitled to benefits and the amount can be reasonably estimated. At each reporting date, we evaluate our accruals for restructuring costs to ensure they are still appropriate.
| (o) | Deferred Compensation Plan |
We maintain a deferred compensation plan (the “Plan”) that is available to certain of our management level employees and directors. The Plan permits participants to defer receipt of part of their current compensation. Participant benefits for the Plan are provided by a funded rabbi trust.
The compensation withheld from Plan participants, together with investment income on the Plan, is recorded as a deferred compensation obligation to participants and is included as a long-term liability in the accompanying consolidated balance sheets. The related plan assets are classified within other non-current assets in the accompanying consolidated balance sheets and are reported at market value. The deferred compensation liability totaled $22.7 million and $21.4 million as of December 31, 2013 and 2012, respectively, and approximates the fair value of the corresponding asset.
| (p) | Derivative Instruments |
We account for derivative financial instruments in accordance with ASC Topic 815, Derivatives and Hedging (“ASC 815”). We engage in hedging activities relating to our variable rate debt through the use of interest rate swaps. We have designated these interest rate swaps as cash flow hedges. Gains and losses on cash flow hedges are included, to the extent they are effective, in other comprehensive earnings, until the underlying transactions are recognized as gains or losses and included in our consolidated statement of earnings.
| (q) | Revenue Recognition |
The following describes our primary types of revenues and our revenue recognition policies as they pertain to the types of contractual arrangements we enter into with our customers to provide services, software licenses, and software-related services either individually or as part of an integrated offering of multiple services. These arrangements occasionally include offerings from more than one segment to the same customer. The revenues associated with these multiple-element arrangements are recognized in accordance with the applicable revenue recognition accounting principles as further described below.
F-38
Table of Contents
LENDER PROCESSING SERVICES, INC.
AND SUBSIDIARIES
NOTES TO CONSOLIDATED FINANCIAL STATEMENTS (continued)
In our Technology, Data and Analytics segment, we recognize revenues relating to mortgage processing, outsourced business processing services, data and analytics services, along with software licensing and software-related services. In some cases, these services are offered in combination with one another, and in other cases we offer them individually. Revenues from processing services are typically volume-based depending on factors such as the number of accounts processed, transactions processed and computer resources utilized.
The majority of the revenues in our Technology, Data and Analytics segment are from outsourced data processing and application hosting, data and valuation related services, and outsourced business processing services. Revenue is realized or realizable and earned when all of the following criteria are met: (1) persuasive evidence of an arrangement exists; (2) delivery has occurred or services have been rendered; (3) the seller’s price to the buyer is fixed or determinable; and (4) collectibility is reasonably assured. For hosting arrangements, revenues and costs related to implementation, conversion and programming services are deferred and subsequently recognized using the straight-line method over the term of the related services agreement. We evaluate these deferred contract costs for impairment in the event any indications of impairment exist.
In the event that our arrangements with our customers include more than one element, we determine whether the individual revenue elements can be recognized separately. We determine whether an arrangement involving more than one deliverable contains more than one unit of accounting, as well as how the arrangement consideration should be allocated to the separate units of accounting.
For multiple element software arrangements, we determine the appropriate units of accounting and how the arrangement consideration should be measured and allocated to the separate units. Initial license fees are recognized when a contract exists, the fee is fixed or determinable, software delivery has occurred and collection of the receivable is deemed probable, provided that vendor-specific objective evidence (“VSOE”) has been established for each element or for any undelivered elements. We determine the fair value of each element or the undelivered elements in multi-element software arrangements based on VSOE. VSOE for each element is based on the price charged when the same element is sold separately, or in the case of post-contract customer support, when a stated renewal rate is provided to the customer. If evidence of fair value of all undelivered elements exists but evidence does not exist for one or more delivered elements, then revenue is recognized using the residual method. Under the residual method, the fair value of the undelivered elements is deferred and the remaining portion of the arrangement fee is recognized as revenue. If evidence of fair value does not exist for one or more undelivered elements of a contract, then all revenue is deferred until all elements are delivered or fair value is determined for all remaining undelivered elements. Revenue from post-contract customer support is recognized ratably over the term of the agreement. We record deferred revenue for all billings invoiced prior to revenue recognition.
In our Transaction Services segment, we recognize revenues relating to origination services and default services. Origination services primarily consist of centralized title agency services for various types of lenders. Revenues relating to origination services are typically recognized at the time of closing of the related real estate transaction. Ancillary service fees are recognized when the service is provided. Default services assist customers through the default and foreclosure process, including property preservation and maintenance services (such as lock changes, window replacement, debris removal and lawn service), posting and publication of foreclosure and auction notices, title searches, document preparation and recording services, and referrals for legal and property brokerage services. Property data or data-related services principally include appraisal and valuation services, property records information, and flood zone information. Revenues derived from these services are recognized as the services are performed as described above.
| (r) | Expenses |
Operating expenses includes all costs, excluding depreciation and amortization, incurred by us to produce revenues. Operating expenses includes payroll, employee benefits, occupancy costs, data processing costs, program design and development costs, and professional services. Depreciation and amortization includes
F-39
Table of Contents
LENDER PROCESSING SERVICES, INC.
AND SUBSIDIARIES
NOTES TO CONSOLIDATED FINANCIAL STATEMENTS (continued)
amortization of software, deferred contract costs and intangible assets and depreciation of operating assets. Exit costs, impairments and other charges includes certain lease exit charges, employee severance, stock compensation acceleration charges, impairments of long-lived assets, and other non-recurring charges.
General and administrative expenses, which are only included in our corporate segment within operating expenses, include payroll, employee benefits, occupancy and other costs associated with personnel employed in marketing, human resources and finance roles. General and administrative expenses also include depreciation of non-operating assets, professional and legal fees not related to matters determined to be probable and estimable, and costs of advertising and other marketing-related programs.
| (s) | Stock-Based Compensation Plans |
We account for stock-based compensation in accordance with ASC Topic 718, Compensation—Stock Compensation. Compensation cost on stock awards is measured based on the fair value of the award at the grant date. Compensation cost on stock options and restricted stock awards without a performance criteria are generally recognized on a straight-line vesting basis over the vesting period. Compensation cost on restricted stock awards with a performance criteria are generally recognized using a graded vesting basis over the vesting period.
| (t) | Income Taxes |
We recognize deferred income tax assets and liabilities for temporary differences between the financial reporting basis and the income tax basis of our assets and liabilities and expected benefits of utilizing tax net operating loss and credit carryforwards. Deferred income tax assets and liabilities are measured using enacted tax rates expected to apply to taxable income in the years in which those temporary differences are expected to be recovered or settled. A valuation allowance is established, if necessary, for the amount of any tax benefits that, based on available evidence, are not expected to be realized. The impact on deferred income taxes of changes in tax rates and laws, if any, is reflected in the consolidated financial statements in the period enacted.
| (u) | Net Earnings Per Share and Equity |
The basic weighted average shares and common stock equivalents are computed using the treasury stock method.
Options to purchase approximately 1.7 million, 6.4 million and 8.8 million shares of our common stock for the years ended December 31, 2013, 2012 and 2011, respectively, were not included in the computation of diluted earnings per share because they were antidilutive. In addition, as of December 31, 2013, 2012 and 2011, 1.6 million, 1.3 million and 1.4 million shares, respectively, of restricted stock were not included in our weighted average shares outstanding due to vesting restrictions that contain forfeitable rights to dividends.
Our ability to repurchase shares of common stock or senior notes is subject to restrictions contained in our senior secured credit agreement and in the indenture governing our senior unsecured notes. On October 28, 2010, our Board of Directors approved an authorization for us to repurchase up to $250.0 million of our common stock and/or our senior notes, effective through December 31, 2011. Subsequently, on June 16, 2011 our Board of Directors approved an authorization for us to repurchase up to $100.0 million of our common stock and/or our senior notes, effective through December 31, 2012. During the year ended December 31, 2011, we repurchased 4.6 million shares of our stock for $136.9 million, at an average price of $29.98 per share, and $5.0 million face value of our senior notes for $4.9 million. During 2012, we did not repurchase any shares of stock or senior notes, and our repurchase authorization expired on December 31, 2012. Subsequently, on February 6, 2013, our Board of Directors approved an authorization to repurchase up to $100.0 million of our common stock, effective through June 30, 2014. As of December 31, 2013, we have not utilized any of the available repurchase authority and, pursuant to the Merger Agreement, we were prohibited from doing so without obtaining the prior written consent of FNF.
F-40
Table of Contents
LENDER PROCESSING SERVICES, INC.
AND SUBSIDIARIES
NOTES TO CONSOLIDATED FINANCIAL STATEMENTS (continued)
| (v) | Recent Accounting Pronouncements |
In July 2012, the FASB issued an amended standard, ASU No. 2012-02, Intangibles—Goodwill and Other (Topic 350): Testing Indefinite-Lived Intangible Assets for Impairment, to simplify how entities test indefinite-lived intangible assets for impairment, which improves consistency in impairment testing requirements among long-lived asset categories. The amended standard permits an assessment of qualitative factors to determine whether it is more likely than not (more than 50%) that the fair value of an indefinite-lived intangible asset is less than its carrying value. For assets in which this assessment concludes it is more likely than not that the fair value is more than its carrying value, the standard eliminates the requirement to perform quantitative impairment testing. The amended standard is effective for annual and interim impairment tests performed for fiscal years beginning after September 15, 2012, and early adoption is permitted. We adopted the amended standard on January 1, 2013, which did not have an impact on our consolidated financial position or results of operations, but did impact how we perform and evaluate our assessment.
In February 2013, the FASB issued ASU No. 2013-02, Reporting Amounts Reclassified out of Accumulated Other Comprehensive Income (Topic 220), which adds new disclosure requirements for items reclassified out of accumulated other comprehensive income (AOCI). The ASU requires an entity to disaggregate the total change of each component of other comprehensive earnings (loss) (OCE) and separately present reclassification adjustments and current period OCE. Under the ASU, both before-tax and net-of-tax presentations of the information are acceptable, as long as an entity presents the income tax benefit or expense attributed to each component of OCE in either the financial statement or the notes to the financial statements. The standard is effective for annual reporting periods beginning after December 15, 2012 and interim periods within those years. We adopted ASU No. 2013-02 on January 1, 2013, and have presented the required changes discussed above in our consolidated statements of comprehensive earnings.
| (4) | Transactions with Related Parties |
We did not have any related party transactions as of and during the year ended December 31, 2013.
Lee A. Kennedy has served as a director since our spin-off from FIS and as Chairman of the Board since March 2009. Mr. Kennedy served as Executive Chairman from September 15, 2009 until January 4, 2013. He also served as our interim President and Chief Executive Officer from July 6, 2011 to October 6, 2011. Historically, Mr. Kennedy also served as Chairman of Ceridian Corporation (“Ceridian”) from January 25, 2010 until July 28, 2011, and as Chief Executive Officer of Ceridian from January 25, 2010 until August 19, 2010. Therefore, Ceridian was a related party of ours for periods from January 25, 2010 until July 28, 2011. During those periods we were (and we continue to be) party to certain agreements with Ceridian under which we incurred expenses. A summary of the Ceridian related party agreements is as follows:
FMLA Administrative Services. Ceridian provides certain administrative services to our human resources group, including Family and Medical Leave Act (“FMLA”) administrative services, military leave administrative services, flexible spending account services and tax processing services. Each of the administrative services agreements has an initial term of one year and is automatically renewable for successive one year terms unless either party gives 90 days prior written notice. Each agreement may be terminated upon 30 days written notice in the event of a breach.
COBRA Health Benefit Services. Ceridian also provides us with Consolidated Omnibus Budget Reconciliation Act (“COBRA”) health benefit services. The COBRA agreement had an initial term of one year and is automatically renewable for successive one year terms unless either party gives 90 days prior written notice. This agreement may be terminated upon 30 days written notice in the event of a breach.
We incurred approximately $0.2 million of expenses during the year ended December 31, 2011 related to the Ceridian related party agreements listed above, which is included in operating expenses within the accompanying consolidated statements of earnings.
F-41
Table of Contents
LENDER PROCESSING SERVICES, INC.
AND SUBSIDIARIES
NOTES TO CONSOLIDATED FINANCIAL STATEMENTS (continued)
| (5) | Acquisitions |
No entities were acquired during the year ended December 31, 2013. The results of operations and financial position of entities acquired during the years ended December 31, 2012 and 2011 are included in the consolidated financial statements from and after the date of acquisition. The purchase price of each acquisition was allocated to the assets acquired and liabilities assumed based on a valuation performed with any excess cost over fair value being allocated to goodwill. The valuation of each acquisition was determined utilizing the income approach using a combination of Level 2 and Level 3-type inputs. The impact of the acquisitions made from January 1, 2011 through December 31, 2012 was not significant individually or in the aggregate to our historical financial results.
LendingSpace
On July 24, 2012, we completed the purchase of the assets of LendingSpace, a business that provides mortgage loan origination software solutions, for approximately $12.3 million. The acquisition resulted in the recognition of $6.7 million of goodwill, based on the amount that the purchase price exceeded the fair value of the net assets acquired. All of the acquired goodwill is deductible for tax purposes. As part of the acquisition, we also recognized $4.8 million of other intangible assets and software, which have a weighted average amortization period of approximately 6 years. LendingSpace is now a part of the Technology, Data and Analytics segment and will further strengthen our origination technology solutions.
PCLender
On March 14, 2011, our subsidiary, LPS Mortgage Processing Solutions, Inc., acquired PCLender.com, Inc. (“PCLender”) for $9.8 million (net of cash acquired). As a result of the transaction, we recognized a liability for contingent consideration totaling $3.0 million, of which $2.2 million was remaining as of December 31, 2012, and no amounts were remaining as of December 31, 2013. The acquisition resulted in the recognition of $8.2 million of goodwill and $6.1 million of other intangible assets and software. PCLender is now a part of the Technology, Data and Analytics segment and further expands our loan origination offerings and market by complementing our Empower origination technology.
| (6) | Investments |
Our title insurance subsidiary, National Title Insurance of New York, Inc. (“NTNY”), is statutorily required to maintain assets backing its reserves for settling losses on the policies it issues. These investments, which consist of treasury bonds, municipal bonds, government agency bonds and corporate bonds, are classified as available for sale securities, and are included in the accompanying consolidated balance sheets at fair value within prepaid expenses and other current assets and other non-current assets. Any unrealized gains or losses on these investments are recognized in other comprehensive earnings (loss) until the investment maturity or sale date. Since we do not intend to sell and will more-likely-than-not maintain each debt security until its anticipated recovery, and no significant credit risk is deemed to exist, these investments are not considered other than temporarily impaired.
The carrying amount and fair value of our available for sale securities at December 31, 2013 and December 31, 2012 are as follows (in millions):
| Adjusted Cost |
Gross Unrealized Gains |
Gross Unrealized Losses |
Fair Value | |||||||||||||
| As of December 31, 2013 |
$ | 77.0 | $ | 1.5 | $ | (1.6 | ) | $ | 76.9 | |||||||
| As of December 31, 2012 |
$ | 71.0 | $ | 3.7 | $ | (0.1 | ) | $ | 74.6 | |||||||
F-42
Table of Contents
LENDER PROCESSING SERVICES, INC.
AND SUBSIDIARIES
NOTES TO CONSOLIDATED FINANCIAL STATEMENTS (continued)
The following table summarizes the amortized cost and fair value of our investments, classified by stated maturity as of December 31, 2013 (in millions):
| Adjusted Cost |
Fair Value |
|||||||
| 2014-2018 |
$ | 27.3 | $ | 28.0 | ||||
| 2019-2023 |
28.3 | 28.0 | ||||||
| 2024-2028 |
14.0 | 13.3 | ||||||
| 2029-2033 |
4.9 | 5.1 | ||||||
| Thereafter |
2.5 | 2.6 | ||||||
|
|
|
|
|
|||||
| Total |
$ | 77.0 | $ | 77.0 | ||||
|
|
|
|
|
|||||
| (7) | Property and Equipment |
Property and equipment as of December 31, 2013 and 2012 consists of the following (in millions):
| 2013 | 2012 | |||||||
| Land |
$ | 4.9 | $ | 4.8 | ||||
| Buildings |
81.3 | 80.2 | ||||||
| Leasehold improvements |
16.8 | 16.6 | ||||||
| Computer equipment |
196.2 | 170.3 | ||||||
| Furniture, fixtures, and other equipment |
36.7 | 50.4 | ||||||
|
|
|
|
|
|||||
| Property and equipment |
335.9 | 322.3 | ||||||
| Accumulated depreciation and amortization |
(216.1 | ) | (195.7 | ) | ||||
|
|
|
|
|
|||||
| Property and equipment, net of depreciation and amortization |
$ | 119.8 | $ | 126.6 | ||||
|
|
|
|
|
|||||
Depreciation and amortization expense on property and equipment related to continuing operations amounted to $33.8 million, $31.1 million and $30.4 million for the years ended December 31, 2013, 2012 and 2011, respectively. Depreciation and amortization expense on property and equipment related to discontinued operations is classified in the accompanying consolidated statements of earnings within loss from discontinued operations, net of tax, and amounted to $0.9 million and $2.3 million for the years ended December 31, 2012 and 2011, respectively. No such expense is included within loss from discontinued operations for the year ended December 31, 2013.
For the years ended December 31, 2012 and 2011, we recognized impairments on property and equipment of $0.4 million and $2.7 million, respectively, related to certain underperforming operations and asset groups that management has decided to dispose of or wind down. The impairment charges are classified in the accompanying consolidated statements of earnings within loss from discontinued operations, net of tax. No such impairments were recognized during the year ended December 31, 2013.
The fair value of each of the impaired assets or asset groups was determined under the income approach using Level 3 unobservable inputs of the fair value hierarchy by calculating the present value of the future cash flows associated with continuing to operate the business units.
F-43
Table of Contents
LENDER PROCESSING SERVICES, INC.
AND SUBSIDIARIES
NOTES TO CONSOLIDATED FINANCIAL STATEMENTS (continued)
| (8) | Computer Software |
Computer software as of December 31, 2013 and 2012 consists of the following (in millions):
| 2013 | 2012 | |||||||
| Software from business acquisitions |
$ | 85.2 | $ | 85.2 | ||||
| Capitalized software development costs |
372.0 | 328.4 | ||||||
| Purchased software |
42.2 | 36.7 | ||||||
|
|
|
|
|
|||||
| Computer software |
499.4 | 450.3 | ||||||
| Accumulated amortization |
(247.2 | ) | (205.0 | ) | ||||
|
|
|
|
|
|||||
| Computer software, net of accumulated amortization |
$ | 252.2 | $ | 245.3 | ||||
|
|
|
|
|
|||||
Amortization expense on computer software related to continuing operations amounted to $50.8 million, $44.5 million and $35.6 million for the years ended December 31, 2013, 2012 and 2011, respectively. Amortization expense on computer software related to discontinued operations, which is classified in the accompanying consolidated statements of earnings within loss from discontinued operations, net of tax, amounted to $0.8 million and $6.0 million for the years ended December 31, 2012 and 2011, respectively. No such expense is included within loss from discontinued operations for the year ended December 31, 2013.
For the years ended December 31, 2012 and 2011, we disposed of certain operations resulting in impairment charges totaling $0.6 million and $12.9 million, respectively, which are classified within the accompanying consolidated statements of earnings as part of loss from discontinued operations, net of tax. For the years ended December 31, 2013, 2012 and 2011, respectively, we also recorded $29.4 million, $2.6 million and $8.4 million of asset impairments in continuing operations related to computer software projects that are no longer recoverable, which are classified in exit costs, impairments and other charges in the accompanying consolidated statements of earnings. Substantially all of the 2013 impairments were the result of an internal review of certain in-process development projects, the result of which was the termination of the underlying development efforts.
During 2013, of the $29.4 million in asset impairment charges included within continuing operations, $28.6 million and $0.8 million relates to the Transaction Services and Corporate segments, respectively. During 2012, of the $2.6 million in asset impairment charges included within continuing operations, $1.8 million and $0.8 million relates to the TD&A and Corporate segments, respectively. During 2011, of the $8.4 million in asset impairment charges included within continuing operations, $2.0 million, $1.6 million and $4.8 million relate to the Corporate, Transaction Services, and TD&A segments, respectively.
The fair value of each of the impaired assets or asset groups was determined under the income approach using Level 3 unobservable inputs of the fair value hierarchy by calculating the present value of the future cash flows associated with continuing to operate the business units.
| (9) | Intangible Assets |
Intangible assets as of December 31, 2013 and 2012 consist of the following (in millions):
| December 31, 2013 | December 31, 2012 | |||||||||||||||||||||||
| Gross Carrying Amount |
Accumulated Amortization |
Net Carrying Amount |
Gross Carrying Amount |
Accumulated Amortization |
Net Carrying Amount |
|||||||||||||||||||
| Customer relationships |
$ | 251.2 | $ | (242.4 | ) | $ | 8.8 | $ | 251.2 | $ | (239.1 | ) | $ | 12.1 | ||||||||||
| Customer contracts |
40.6 | (40.6 | ) | — | 40.6 | (38.8 | ) | 1.8 | ||||||||||||||||
| Purchase data files |
11.3 | (4.9 | ) | 6.4 | 10.4 | (3.6 | ) | 6.8 | ||||||||||||||||
| Other |
7.8 | (5.2 | ) | 2.6 | 7.8 | (4.8 | ) | 3.0 | ||||||||||||||||
|
|
|
|
|
|
|
|
|
|
|
|
|
|||||||||||||
| Total Intangible Assets |
$ | 310.9 | $ | (293.1 | ) | $ | 17.8 | $ | 310.0 | $ | (286.3 | ) | $ | 23.7 | ||||||||||
|
|
|
|
|
|
|
|
|
|
|
|
|
|||||||||||||
F-44
Table of Contents
LENDER PROCESSING SERVICES, INC.
AND SUBSIDIARIES
NOTES TO CONSOLIDATED FINANCIAL STATEMENTS (continued)
Intangible assets, other than those with indefinite lives, are amortized over their estimated useful lives ranging from 5 to 10 years using accelerated methods. Amortization expense on intangible assets with definite lives related to continuing operations is included in depreciation and amortization in the accompanying consolidated statements of earnings and amounted to $6.8 million, $11.7 million and $16.0 million for the years ended December 31, 2013, 2012 and 2011, respectively. Amortization expense on intangible assets related to discontinued operations is classified in the accompanying statements of earnings within discontinued operations, net of tax, and amounted to $0.3 million and $1.5 million for the years ended December 31, 2012 and 2011, respectively. No such expense is included within loss from discontinued operations for the year ended December 31, 2013.
For the years ended December 31, 2012 and 2011, we recognized impairments on intangible assets of $0.2 million and $4.5 million, respectively, related to certain underperforming operations and asset groups that management decided to dispose of or wind down. The impairments are classified in the accompanying consolidated statements of earnings within loss from discontinued operations, net of tax. No such impairments were recognized during the year ended December 31, 2013.
The fair value of each of the impaired assets or asset groups was determined under the income approach using Level 3 unobservable inputs of the fair value hierarchy by calculating the present value of the future cash flows associated with continuing to operate the business units.
Estimated amortization expense on intangible assets for the next five fiscal years is as follows (in millions):
| 2014 |
$ | 3.9 | ||
| 2015 |
3.6 | |||
| 2016 |
2.9 | |||
| 2017 |
2.3 | |||
| 2018 |
1.8 |
| (10) | Goodwill |
Changes in goodwill during the years ended December 31, 2013 and 2012 are summarized as follows (in millions):
| Technology, Data and Analytics |
Transaction Services |
Total | ||||||||||
| Balance, December 31, 2011 |
$ | 748.3 | $ | 384.5 | $ | 1,132.8 | ||||||
| Increases to goodwill related to acquisitions(1) |
6.7 | — | 6.7 | |||||||||
| Decreases to goodwill related to disposals and impairments(2) |
(30.2 | ) | — | (30.2 | ) | |||||||
|
|
|
|
|
|
|
|||||||
| Balance, December 31, 2012 |
724.8 | 384.5 | 1,109.3 | |||||||||
| Increases to goodwill related to acquisitions |
— | — | — | |||||||||
| Decreases to goodwill related to disposals and impairments |
— | — | — | |||||||||
|
|
|
|
|
|
|
|||||||
| Balance, December 31, 2013 |
$ | 724.8 | $ | 384.5 | $ | 1,109.3 | ||||||
|
|
|
|
|
|
|
|||||||
| (1) | On July 24, 2012, we completed the purchase of the assets of LendingSpace, and recorded $6.7 million of goodwill related to the acquisition. |
| (2) | We recorded $27.9 million in disposals of goodwill during 2012 related to the sale of SoftPro, True Automation, Aptitude Solutions, and IRMS, all previously included within our TD&A segment. We also |
F-45
Table of Contents
LENDER PROCESSING SERVICES, INC.
AND SUBSIDIARIES
NOTES TO CONSOLIDATED FINANCIAL STATEMENTS (continued)
| recorded a $2.3 million impairment of goodwill related to a revision of the fair value of the remaining net assets of the True Automation business unit prior to its disposal. |
| (11) | Discontinued Operations |
During the year ended December 31, 2012, we sold or disposed of certain non-core or underperforming business units including SoftPro, True Automation, Aptitude Solutions and Insurance Risk Management Services, all of which were previously included as part of the TD&A segment. Also during 2012, we sold our Tax Services business (other than our tax data services, which are now included in our TD&A segment) and discontinued our Asset Management Solutions business unit, both of which were previously included within the Transaction Services segment. During the year ended December 31, 2011, we also sold or disposed of certain non-core or underperforming business units including Verification Bureau, Rising Tide Auction, and certain operations previously included in our Real Estate group, all of which were previously included as part of the TD&A segment. No business units were discontinued during the year ended December 31, 2013.
Each of these business units qualify as discontinued operations under ASC Topic 205-20 Presentation of Financial Statements- Discontinued Operations. Under that guidance, the results of operations of a component of an entity that either has been disposed of or is classified as held for sale shall be reported as discontinued operations if the entity will not have significant continuing involvement in the operations of the component after the disposal transaction and the operations and cash flows of the component have been (or will be) eliminated from the ongoing operations of the entity as a result of the disposal. The results of discontinued operations are presented net of tax, as a separate component in the consolidated statements of earnings.
The table below illustrates the revenues, loss from operations and impairment charges related to discontinued operations for the years ended December 31, 2013, 2012 and 2011 (in millions):
| 2013 | 2012 | 2011 | ||||||||||
| Revenues |
$ | 4.8 | $ | 72.2 | $ | 176.8 | ||||||
|
|
|
|
|
|
|
|||||||
| Pretax loss from discontinued operations before impairment charges |
$ | (3.6 | ) | $ | (15.5 | ) | $ | (10.9 | ) | |||
| Impairment charges(1): |
||||||||||||
| Intangible assets |
— | (0.2 | ) | (4.5 | ) | |||||||
| Computer software |
— | (0.6 | ) | (12.9 | ) | |||||||
| Property and equipment |
— | (0.4 | ) | (2.7 | ) | |||||||
| Goodwill |
— | (2.3 | ) | (35.4 | ) | |||||||
| Other |
— | (0.5 | ) | 0.5 | ||||||||
|
|
|
|
|
|
|
|||||||
| Total impairment charges |
— | (4.0 | ) | (55.0 | ) | |||||||
| Pretax loss from discontinued operations |
(3.6 | ) | (19.5 | ) | (65.9 | ) | ||||||
| Other income (expense)(2) |
— | 20.2 | (0.4 | ) | ||||||||
| Income tax benefit (expense) on discontinued operations |
1.2 | (9.8 | ) | 27.6 | ||||||||
|
|
|
|
|
|
|
|||||||
| Loss from discontinued operations, net of tax |
$ | (2.4 | ) | $ | (9.1 | ) | $ | (38.7 | ) | |||
|
|
|
|
|
|
|
|||||||
| (1) | 2012 and 2011 impairments related to discontinued operations are further described in note 7, Property and Equipment, note 8, Computer Software, note 9, Intangible Assets and note 10, Goodwill. |
| (2) | Other income (expense) includes interest income (expense) related to discontinued operations as well as gains (losses) related to the disposal of discontinued operations of $20.2 million and $(0.9) million for the years ended December 31, 2012 and December 31, 2011, respectively. |
F-46
Table of Contents
LENDER PROCESSING SERVICES, INC.
AND SUBSIDIARIES
NOTES TO CONSOLIDATED FINANCIAL STATEMENTS (continued)
The assets held for sale and related liabilities summarized below are included in the following captions of the accompanying consolidated balance sheets (in millions):
| 2013 | 2012 | |||||||
| Assets: |
||||||||
| Trade receivables, net |
$ | — | $ | 4.1 | ||||
| Prepaid expenses and other current assets |
— | 0.1 | ||||||
| Property and equipment, computer software and other intangibles assets, net |
— | — | ||||||
|
|
|
|
|
|||||
| Total assets held for sale |
— | $ | 4.2 | |||||
|
|
|
|
|
|||||
| Liabilities: |
||||||||
| Trade accounts payable, accrued salaries and benefits and other accrued liabilities |
$ | 3.0 | $ | 3.5 | ||||
| Other long-term liabilities |
0.5 | 0.7 | ||||||
|
|
|
|
|
|||||
| Total liabilities related to assets held for sale |
$ | 3.5 | $ | 4.2 | ||||
|
|
|
|
|
|||||
| (12) | Other Accrued Liabilities |
Other accrued liabilities as of December 31, 2013 and 2012 consisted of the following (in millions):
| 2013 | 2012 | |||||||
| Other operating expense accruals |
$ | 49.1 | $ | 75.3 | ||||
| Title claims reserve |
66.3 | 69.4 | ||||||
| Recording and transfer tax liabilities |
8.7 | 15.3 | ||||||
| Interest accrual on debt and swap obligations |
7.7 | 9.5 | ||||||
|
|
|
|
|
|||||
| Total other accrued liabilities |
$ | 131.8 | $ | 169.5 | ||||
|
|
|
|
|
|||||
| (13) | Restructuring |
During 2012, management committed to a restructuring plan (the “Fourth Quarter 2012 Restructuring Plan”) in order to remove duplicate headcount, reduce future operating expenses, and improve operational performance and profitability. The total restructuring costs related to these efforts amounted to $2.1 million of employee termination costs.
The following table sets forth our accrued liabilities for our Fourth Quarter 2012 Restructuring Plan, as of and for the year ended December 31, 2013 (in millions):
| Fourth Quarter 2012 Restructuring Plan |
Other Accrued Other Accrued Liabilities December 31, 2012 |
Cash Paid | Other | Other Liabilities December 31, 2013 |
||||||||||||
| Ongoing termination arrangement |
$ | 1.1 | $ | (0.7 | ) | $ | — | $ | 0.4 | |||||||
All payouts related to our Fourth Quarter 2012 Restructuring Plan are expected to be made by June 30, 2014.
During 2011, management committed to three separate restructuring plans (the “First Quarter 2011 Restructuring Plan,” the “Second Quarter 2011 Restructuring Plan,” and the “Fourth Quarter 2011 Restructuring Plan”). For the year ended December 31, 2011, the total restructuring costs related to these efforts amounted to $35.3 million of employee termination costs, of which $24.8 million related to severance benefits and $10.5 million related to the acceleration of stock compensation expense included as part of the change in additional-paid-in capital in the
F-47
Table of Contents
LENDER PROCESSING SERVICES, INC.
AND SUBSIDIARIES
NOTES TO CONSOLIDATED FINANCIAL STATEMENTS (continued)
accompanying 2011 consolidated statement of stockholders’ equity. Restructuring costs from continuing operations are included in the accompanying consolidated statements of earnings as part of exit costs, impairments and other charges. Restructuring costs included as part of business units that have been sold or disposed of are included in the accompanying consolidated statements of earnings within loss from discontinued operations, net of tax.
All payouts related to the First Quarter 2011 and Second Quarter 2011 Restructuring Plans were made by June 30, 2011 and June 30, 2012, respectively. All payouts related to the Fourth Quarter 2011 Restructuring Plan were made by December 31, 2012.
| (14) | Long-Term Debt |
Long-term debt as of December 31, 2013 and 2012 consisted of the following (in millions):
| 2013 | 2012 | |||||||
| Term A Loan, secured, interest payable at LIBOR plus 2.00% (2.17% at December 31,2013) quarterly principal amortization, maturing August 2016 |
$ | 468.1 | $ | 468.1 | ||||
| Revolving Loan, secured, interest payable at LIBOR plus 2.00% (Eurocurrency Borrowings) (2.17% at December 31, 2013), Fed-funds plus 2.00% (Swingline borrowings) (2.08% at December 31, 2013), or the highest of (a) Fed-funds plus 0.50%, (b) Prime or (c) LIBOR plus 1%, plus the Applicable Margin for Base Rate borrowings of1.50% (Base Rate Borrowings) (2.08%, 4.75% or 2.67% respectively at December 31, 2013), maturing August 2016. Total of $398.1 million unused (net of outstanding letters of credit) as of December 31, 2013 |
— | — | ||||||
| Senior unsecured notes, issued at par, interest payable semiannually at 5.75%, due October 2023 |
600.0 | 600.0 | ||||||
|
|
|
|
|
|||||
| Total debt |
1,068.1 | 1,068.1 | ||||||
| Less current portion |
60.2 | — | ||||||
|
|
|
|
|
|||||
| Long-term debt, excluding current portion |
$ | 1,007.9 | $ | 1,068.1 | ||||
|
|
|
|
|
|||||
Financing
On August 18, 2011, we entered into an Amended and Restated Credit Agreement (the “2011 Credit Agreement”) with JPMorgan Chase Bank, N.A., as Administrative Agent, Swing Line Lender and Letters of Credit Issuer, and various other lenders who are parties to the 2011 Credit Agreement. On October 19, 2012, we entered into Amendment No. 1 (the “Amendment”) to the 2011 Credit Agreement, which (i) gives us additional flexibility under the 2011 Credit Agreement with respect to charges incurred for accruals for litigation and regulatory matters, and (ii) extends the period with respect to which mandatory prepayments using excess cash flow must be made to the fiscal year ending December 31, 2013.
The 2011 Credit Agreement currently consists of: (i) a 5-year revolving credit facility in an aggregate principal amount outstanding at any time not to exceed $400 million (with a $25 million sub-facility for Letters of Credit); and (ii) a 5-year Term A Loan in an initial aggregate principal amount of $535 million. It also included a Term B Loan with a maturity date of August 14, 2018 in an initial aggregate principal amount of $250 million. However, on October 12, 2012, we used a portion of the proceeds from the 2023 Notes described below to prepay the Term B Loan in full.
F-48
Table of Contents
LENDER PROCESSING SERVICES, INC.
AND SUBSIDIARIES
NOTES TO CONSOLIDATED FINANCIAL STATEMENTS (continued)
The loans under the 2011 Credit Agreement bear interest at a floating rate, which is an applicable margin plus, at our option, either (a) the Eurodollar (LIBOR) rate or (b) the highest of (i) the prime rate, (ii) the federal funds rate plus 0.50% and (iii) the one Month LIBOR rate plus 1.00% (the highest of clauses (i), (ii) and (iii), the “Base rate”). The annual margin on the Term A Loan and the revolving credit facility until the first business day following delivery of the compliance certificate relating to the first fiscal quarter ending following the closing and funding of the amended and restated facility was 2.25% in the case of LIBOR loans and 1.25% in the case of the Base rate loans, and after that time is a percentage determined in accordance with a leverage ratio-based pricing grid. As of December 31, 2013, we were paying an annual margin on the Term Loan A of 2.0%.
The 2011 Credit Agreement requires us to repay the outstanding principal amount of the Term A Loan in quarterly installments of $6.7 million beginning on December 31, 2011. These quarterly installment payments increase to $13.4 million beginning on December 31, 2013 and then to $20.1 million beginning on December 31, 2014 through March 31, 2016. All remaining outstanding principal amounts of the Term A Loan shall be repaid at the applicable maturity dates.
In addition to scheduled principal payments, the Term A Loan is (with certain exceptions) subject to mandatory prepayment upon issuances of debt, casualty and condemnation events, and sales of assets, as well as from up to 50% of excess cash flow (as defined in the 2011 Credit Agreement) in excess of an agreed threshold commencing with the cash flow for the year ended December 31, 2013. Voluntary prepayments of the loans are generally permitted at any time without fee upon proper notice and subject to a minimum dollar requirement. Commitment reductions of the revolving credit facility are also permitted at any time without fee upon proper notice. The revolving credit facility has no scheduled principal payments, but it will be due and payable in full on August 18, 2016.
We are allowed to raise additional term loans and/or increase commitments under the revolving credit facility in an aggregate principal amount of up to $250.0 million (the “Incremental Facilities”). The Incremental Facilities are subject to restrictions on pricing and tenor of any new term loan, pro-forma compliance with financial covenants, a pro-forma leverage ratio not to exceed 2.00:1.00, and other usual and customary conditions.
The obligations under the 2011 Credit Agreement are fully and unconditionally guaranteed, jointly and severally, by certain of our domestic subsidiaries. Additionally, we and such subsidiary guarantors pledged substantially all of our respective assets as collateral security for the obligations under the Credit Agreement and our respective guarantees.
The 2011 Credit Agreement contains customary affirmative, negative and financial covenants including, among other things, limits on the creation of liens, limits on the incurrence of indebtedness, restrictions on investments, dispositions and sale and leaseback transactions, limits on the payment of dividends and other restricted payments, a minimum interest coverage ratio and a maximum leverage ratio. Upon an event of default, the administrative agent can accelerate the maturity of the loan. Events of default include events customary for such an agreement, including failure to pay principal and interest in a timely manner, breach of covenants and a change of control of LPS. These events of default include a cross-default provision that permits the lenders to declare the 2011 Credit Agreement in default if (i) we fail to make any payment after the applicable grace period under any indebtedness with a principal amount in excess of $70 million or (ii) we fail to perform any other term under any such indebtedness, as a result of which the holders thereof may cause it to become due and payable prior to its maturity.
Upon consummation of the Merger, the Term A Loan was fully repaid (see note 2 for further discussion).
F-49
Table of Contents
LENDER PROCESSING SERVICES, INC.
AND SUBSIDIARIES
NOTES TO CONSOLIDATED FINANCIAL STATEMENTS (continued)
Old Senior Notes
On July 2, 2008, we issued senior notes (the “2016 Notes”) in an initial aggregate principal amount of $375.0 million. The Notes were issued pursuant to an Indenture dated July 2, 2008 (the “Indenture”) among us, the guarantor parties thereto and U.S. Bank Corporate Trust Services, as Trustee. Subsequently, in October and November 2012, we used a portion of the proceeds from the 2023 Notes described below to accept for payment approximately $362.0 million aggregate principal amount of the 2016 Notes that were tendered in the tender offer described below.
Refinancing Transactions
On September 27, 2012, we announced our plans to offer $600 million in aggregate principal amount of Senior Notes and commenced a tender offer and consent solicitation for all of the 2016 Notes. On October 12, 2012, we closed the offering of $600 million aggregate principal amount (the “Offering”) of 5.75% Senior Notes due 2023 (the “2023 Notes”). The 2023 Notes have been registered under the Securities Act of 1933, as amended, carry an interest rate of 5.75% and will mature on April 15, 2023. Interest is paid semi-annually on the 15th day of April and October beginning April 15, 2013. The 2023 Notes are our unsecured, unsubordinated obligations and are guaranteed on an unsecured basis by the same subsidiaries that guarantee our obligations under the 2011 Credit Agreement. The net proceeds of the Offering, along with cash on hand, were used to purchase and redeem $362.0 million aggregate principal amount of our 2016 Notes, to prepay in full the Term Loan B under the 2011 Credit Agreement and to pay fees and expenses in connection with these transactions.
As part of the tender offer, we solicited consents from the holders of the 2016 Notes for certain proposed amendments that would eliminate or modify certain covenants and events of default as well as other provisions contained in the Indenture. Adoption of the proposed amendments required consents from holders of at least a majority in aggregate principal amount outstanding of the 2016 Notes. On October 12, 2012, we announced that we had received the requisite consents to execute a supplemental indenture to implement the proposed amendments to the Indenture, and delivered notice that it had called for redemption all 2016 Notes that remain outstanding following completion of the tender offer at a price equal to 104.06% of their face amount, plus accrued and unpaid interest to, but not including, the date of redemption. Payment for the redemption of the remaining 2016 Notes was made on November 13, 2012 (with interest accruing on the 2016 Notes to November 11, 2012).
The 2023 Notes were issued pursuant to an Indenture dated as of October 12, 2012, among us, the subsidiary guarantors and U.S. Bank National Association, as trustee (the “Indenture”). At any time and from time to time, prior to October 15, 2015, we may redeem up to a maximum of 35% of the original aggregate principal amount of the 2023 Notes with the proceeds of one or more equity offerings, at a redemption price equal to 105.75% of the principal amount thereof, plus accrued and unpaid interest thereon, if any, to the redemption date (subject to the right of holders of record on the relevant record date to receive interest due on the relevant interest payment date). Prior to October 15, 2017, we may redeem some or all of the 2023 Notes by paying a “make-whole” premium based on U.S. Treasury rates. On or after October 15, 2017, we may redeem some or all of the 2023 Notes at the redemption prices described in the Indenture, plus accrued and unpaid interest. In addition, if a change of control occurs, we are required to offer to purchase all outstanding 2023 Notes at a price equal to 101% of the principal amount plus accrued and unpaid interest, if any, to the date of purchase (subject to the right of holders of record on the relevant record date to receive interest due on the relevant interest payment date).
The Indenture contains covenants that, among other things, limit our ability and the ability of certain of our subsidiaries (a) to incur or guarantee additional indebtedness or issue preferred stock, (b) to make certain restricted payments, including dividends or distributions on equity interests held by persons other than LPS or
F-50
Table of Contents
LENDER PROCESSING SERVICES, INC.
AND SUBSIDIARIES
NOTES TO CONSOLIDATED FINANCIAL STATEMENTS (continued)
certain subsidiaries, as further described below, (c) to create or incur certain liens, (d) to engage in sale and
leaseback transactions, (e) to create restrictions that would prevent or limit the ability of certain subsidiaries to (i) pay dividends or other distributions to us or certain other subsidiaries, (ii) repay any debt or make any loans or advances to us or certain other subsidiaries or (iii) transfer any property or assets to us or certain other subsidiaries, (f) to sell or dispose of assets of ours or any restricted subsidiary or enter into merger or consolidation transactions and (g) to engage in certain transactions with affiliates. These covenants are subject to a number of exceptions, limitations and qualifications in the Indenture.
We have no independent assets or operations and our subsidiaries’ guarantees are full and unconditional and joint and several. There are no significant restrictions on the ability of LPS or any of the subsidiary guarantors to obtain funds from any of our subsidiaries other than National Title Insurance of New York, Inc. (“NTNY”), our title insurance underwriter subsidiary, by dividend or loan. NTNY is statutorily required to maintain investment assets backing its reserves for settling losses on the policies it issues, and its ability to pay dividends or make loans is limited by regulatory requirements. As of December 31, 2013 and 2012, NTNY had statutory capital and surplus of $51.8 million and $38.8 million, respectively, and it had the statutory ability to pay dividends to us of up to $19.3 million and $11.3 million, respectively. On January 3, 2014, NTNY was sold to Chicago Title Insurance Company, a wholly owned subsidiary of FNF for $85.0 million.
The Indenture contains customary events of default, including failure of LPS (i) to pay principal and interest when due and payable and breach of certain other covenants and (ii) to make an offer to purchase and pay for 2023 Notes tendered as required by the Indenture. Events of default also include cross defaults, with respect to any other debt of ours or debt of certain subsidiaries having an outstanding principal amount of $80.0 million or more in the aggregate for all such debt, arising from (i) failure to make a principal payment when due and such defaulted payment is not made, waived or extended within the applicable grace period or (ii) the occurrence of an event which results in such debt being due and payable prior to its scheduled maturity. Upon the occurrence of an event of default (other than a bankruptcy default with respect to us or certain subsidiaries), the trustee or holders of at least 25% of the 2023 Notes then outstanding may accelerate the 2023 Notes by giving us appropriate notice. If, however, a bankruptcy default occurs with respect to us or certain subsidiaries, then the principal of and accrued interest on the 2023 Notes then outstanding will accelerate immediately without any declaration or other act on the part of the trustee or any holder.
In connection with these refinancing transactions, we paid fees of $25.7 million during the year ended December 31, 2012, including a call premium on our 2016 Notes of approximately $15.8 million. Of the $25.7 million of total fees paid, we capitalized approximately $9.7 million and expensed $16.0 million. We also recorded a write-off of the remaining debt issuance costs on our 2016 Notes of $1.5 million and on our Term B Loan of $6.4 million.
The amount of dividends we are able to declare and pay to its stockholders is restricted by certain covenants contained in the Indenture. Under the Indenture, we may not make certain restricted payments, including payments of dividends or distributions on our common stock, in excess of an amount generally equal to the sum of (i) 50% of consolidated net income generated since July 1, 2008, plus (ii) a $40 million annual exclusion, plus (iii) an additional aggregate $75 million exclusion over the life of the 2023 Notes. As a result of this restriction, as of December 31, 2013 and 2012, approximately $310 million and $221 million, respectively, of our consolidated retained earnings balance, which totaled $762.0 million and $694.1 million respectively, was available for the payment of dividends. Our Credit Agreement also contains a limit on the payment of dividends, the amount of which is significantly in excess of the amount available under the Indenture. Under the terms of the Merger Agreement with FNF, as of December 31, 2013 we were prohibited from paying dividends other than our regular quarterly cash dividend of $0.10 per share without obtaining the prior written consent of FNF.
F-51
Table of Contents
LENDER PROCESSING SERVICES, INC.
AND SUBSIDIARIES
NOTES TO CONSOLIDATED FINANCIAL STATEMENTS (continued)
Fair Value of Long-Term Debt
The fair value of our long-term debt at December 31, 2013 is estimated to be approximately 102% of the carrying value. We have estimated the fair value of our debt using Level 2 Inputs, based on values of recent quoted market prices on our term loans and values of recent trades on our senior notes.
Interest Rate Swaps
On August 26, 2011, we entered into an interest rate swap to hedge forecasted monthly interest rate payments on $250 million of our floating rate debt (“the 2011 Interest Rate Swap”), in which the bank pays a variable rate equal to 1 Month LIBOR (equal to 0.17% as of December 31, 2013) and we pay a fixed rate of 1.265%. The effective date of the swap is August 31, 2011 and the maturity date is July 31, 2016. The 2011 Interest Rate Swap was terminated subsequent to payment of the Term A Loan on January 2, 2014. See note 2 for further discussion.
On August 4, 2010, we entered into an interest rate swap to hedge forecasted monthly interest rate payments on $75 million of our floating rate debt (“the 2010 Interest Rate Swap”), in which the bank pays a variable rate equal to 1 Month LIBOR (equal to 0.17% as of December 31, 2013) and we pay a fixed rate of 2.080%. The effective date of the swap is December 31, 2012 and it matured on December 31, 2013. No gain or loss was recognized in connection with the maturity.
We have entered into interest rate swap transactions in order to convert a portion of our interest rate exposure on our floating rate debt from variable to fixed. We have designated these interest rate swaps as cash flow hedges. A portion of the amount included in accumulated other comprehensive loss will be reclassified into interest expense as a yield adjustment as interest payments are made on the Term Loan. The inputs used to determine the estimated fair value of our interest rate swaps are Level 2-type measurements. We have considered our own credit risk when determining the fair value of our interest rate swaps.
Estimated fair values of interest rate swaps in the consolidated balance sheets were as follows (in millions):
| Balance Sheet Account |
December 31, 2013 | December 31, 2012 | ||||||
| Other accrued liabilities |
$ | — | $ | 1.4 | ||||
| Other long-term liabilities |
$ | 4.3 | $ | 7.2 | ||||
A cumulative loss of $2.6 million and $5.3 million is reflected in accumulated other comprehensive loss as of December 31, 2013 and December 31, 2012, respectively. A summary of the effect of derivative instruments on amounts recognized in other comprehensive earnings (loss) (“OCE”) and on the accompanying consolidated statements of earnings for the years ended December 31, 2013, 2012 and 2011 is as follows (in millions):
| Amount of Loss Recognized in OCE on Derivatives |
Amount of Loss Reclassified from Accumulated OCE into Interest Expense |
|||||||||||||||||||||||
| Interest Rate Swap Contract |
2013 | 2012 | 2011 | 2013 | 2012 | 2011 | ||||||||||||||||||
| Year ended December 31 |
$ | 0.1 | $ | 7.4 | $ | 6.2 | $ | 4.2 | $ | 4.2 | $ | 1.7 | ||||||||||||
Approximately $1.4 million (net of tax) of the balance in accumulated other comprehensive loss as of December 31, 2013 is expected to be reclassified into interest expense over the next twelve months.
It is our policy to execute such instruments with credit-worthy banks and not to enter into derivative financial instruments for speculative purposes. As of December 31, 2013, we believed our interest rate swap counterparty would be able to fulfill its obligations under our agreements, and we believed we would have debt outstanding through the expiration date of the swap such that the occurrence of future hedge cash flows remained probable.
F-52
Table of Contents
LENDER PROCESSING SERVICES, INC.
AND SUBSIDIARIES
NOTES TO CONSOLIDATED FINANCIAL STATEMENTS (continued)
Principal Maturities of Debt
Principal maturities at December 31, 2013 for the next five years and thereafter are as follows (in millions):
| 2014 |
$ | 60.2 | ||
| 2015 |
80.2 | |||
| 2016 |
327.7 | |||
| 2017 |
— | |||
| 2018 |
— | |||
| Thereafter |
600.0 | |||
|
|
|
|||
| Total |
$ | 1,068.1 | ||
|
|
|
See Acquisition by FNF, note 2, for changes to long-term debt subsequent to year-end.
| (15) | Commitments and Contingencies |
We are involved in various pending and threatened litigation and regulatory matters related to our operations, some of which include claims for punitive or exemplary damages. Our ordinary course litigation includes purported class action lawsuits, which make allegations related to various aspects of our operations. From time to time, we also receive requests for information from various state and federal regulatory authorities, some of which take the form of civil investigative demands or subpoenas. Some of these regulatory inquiries may result in the assessment of fines for violations of regulations or settlements with such authorities requiring a variety of remedies. We believe that no actions, other than those matters discussed below, depart from customary litigation or regulatory inquiries incidental to our business.
In accordance with applicable accounting guidance, we establish accruals for litigation and regulatory matters when those matters present loss contingencies that are both probable and reasonably estimable. Our accrual for legal and regulatory matters totaled $99.3 million and $223.1 million as of December 31, 2013 and 2012, respectively. The accrual, which was adjusted during the year to reflect changes in the estimated costs and payments made to resolve certain of the matters described below, represents management’s best estimate of future costs of settlement, damages and associated legal and professional fees with respect to matters that remain pending and assumes no third party recoveries. For the reasons described below, we are unable to estimate a range of loss for pending matters in excess of the amount accrued or for any potential losses related to any other reasonably possible claims. We continually evaluate the accrual for legal and regulatory matters as those matters progress.
Set forth below are descriptions of our material pending legal and regulatory proceedings. As background to the disclosure below, please note the following:
| • | These matters raise difficult and complicated factual and legal issues and are subject to many uncertainties and complexities. |
| • | In the litigation matters, plaintiffs seek a variety of remedies including equitable relief in the form of injunctive and other remedies and monetary relief in the form of compensatory damages. In some cases, the monetary damages sought include punitive or treble damages. Unless otherwise specified, none of the cases described below includes a specific statement as to the dollar amount of damages demanded. Instead, each of the cases includes a demand in an amount to be proved at trial. Regulatory authorities also may seek a variety of remedies and in general do not make specific demands during the course of an investigation or inquiry. |
F-53
Table of Contents
LENDER PROCESSING SERVICES, INC.
AND SUBSIDIARIES
NOTES TO CONSOLIDATED FINANCIAL STATEMENTS (continued)
Based on our current knowledge, we believe that the outcome of all pending or threatened legal and regulatory matters, including those described below, will not have a material adverse impact on our business operations, consolidated financial condition or liquidity. However, it is difficult to predict the final outcome of these matters due, among other things, to the early stage of certain of these matters and the factors described above. As a result, there can be no assurance that we will not incur costs and expenses in the future in excess of the amount of our current accrual that would be material, including but not limited to settlements, damages, fines or penalties and legal costs, or be subject to other remedies, as a result of the matters described below or other legal or regulatory matters. Therefore, it is reasonably possible that the accrual for legal and regulatory matters will change and that the change could be material to our consolidated financial statements.
Litigation Matters
Securities Fraud Litigation
On December 1, 2010, a consolidated securities disclosure class action lawsuit entitled St. Clair Shores General Employees’ Retirement System v. Lender Processing Services, Inc., et al was filed against the Company and certain of its former officers and directors in the United States District Court for the Middle District of Florida. On January 28, 2013, the Company entered into a Stipulation and Agreement of Settlement (the “Settlement Agreement”) resolving all claims asserted in the action. In connection with the settlement, the Company has agreed to pay the affected class of plaintiffs approximately $13.1 million. The settlement was approved by the United States District Court for the Middle District of Florida on March 4, 2014.
On August 9, 2013, a lawsuit entitled Maverick Fund, L.D.C. et al v. Lender Processing Services, Inc. was filed against the Company in the United States District Court for the Southern District of New York. The plaintiffs are a family of investment funds that opted out of the St. Claire Shores settlement and brought a separate lawsuit based on materially similar allegations. On December 20, 2013, the court granted defendant’s motion to transfer venue in the case to the United States District Court for the Middle District of Florida. The plaintiffs filed an Amended Complaint in that court on February 11, 2014 and we filed a Motion to Dismiss on March 17, 2014. We intend to vigorously defend this matter.
Shareholder Derivative Litigation
On January 21, 2011, a shareholder derivative lawsuit entitled Michael Wheatley, Derivatively on Behalf of Lender Processing Services, Inc. v. Jeffrey S. Carbiener, et al., was filed against us and certain of our current and former officers and directors in the Circuit Court of the 4th Judicial Circuit in and for Duval County, Florida (the “Florida Circuit Court”). The complaint was filed by a shareholder of ours, and seeks damages for alleged breaches of fiduciary duties and alleged mismanagement. The complaint alleges, among other things, that we failed to implement sufficient internal controls to prevent fraudulent activity in connection with our default management services; that we, in public filings and other statements, failed to disclose material information, including information regarding our exposure to legal claims concerning allegedly improper foreclosure activity; and that we had an improper relationship with certain attorneys who provided services to our clients. The complaint seeks an unspecified amount of damages, as well as other forms of relief. The parties agreed to a voluntary stay in this matter. On February 12, 2013, a shareholder derivative lawsuit entitled Steven Hill, Derivatively on Behalf of Lender Processing Services, Inc. v. Lee A. Kennedy, et al., was filed against us and certain of our current and former officers and directors in the Court of Chancery of the State of Delaware. The complaint was filed by a shareholder of ours, and alleges breaches of fiduciary duties based on the same alleged conduct as in the Wheatley case, as well as other allegations related to our handling of foreclosure documentation and use of an attorney network. On September 27, 2013, the Hill case was voluntarily dismissed without prejudice. On May 31, 2013, the Wheatley case was amended as described below.
F-54
Table of Contents
LENDER PROCESSING SERVICES, INC.
AND SUBSIDIARIES
NOTES TO CONSOLIDATED FINANCIAL STATEMENTS (continued)
Merger Litigation
On May 31, 2013, the plaintiff in Wheatley amended its complaint to further allege that our directors breached their fiduciary duties of care and loyalty to our shareholders by voting in favor of the Merger. The new claims allege that our directors breached their fiduciary obligations by (i) failing to adequately value LPS, (ii) preventing a competitive bidding process for us, and (iii) ignoring conflicts of interest stemming from the directors’ interrelationships or connections with the Proposed Merger. The complaint also alleges that FNF and Thomas H. Lee Partners, L.P. aided and abetted the directors’ breach of their fiduciary obligations. The new counts in the Wheatley complaint seek to preliminarily and permanently enjoin the parties from proceeding with and consummating the Proposed Merger or, in the event the Proposed Merger is consummated, to rescind or set it aside and/or award the plaintiff class an unspecified amount of rescissory or compensatory damages. On June 3, 2013, an individual plaintiff, on behalf of herself and other similarly situated plaintiffs, filed a complaint titled Pruitt v. Lender Processing Services, et al, in the Court of Chancery of the State of Delaware against us, our directors, FNF and Merger Subsidiary alleging that our directors breached their fiduciary duties in connection with the Proposed Merger based on the same conduct alleged in the new counts of the Wheatley case. Pruitt also alleges that we, FNF and Merger Subsidiary aided and abetted such misconduct. On June 4, 2013, the Orlando Police Pension Fund, on behalf of itself and other similarly situated plaintiffs, filed a complaint in the Circuit Court of the Fourth Judicial Circuit in and for Duval County, Florida against us, our directors, FNF and Merger Subsidiary. The Orlando Police Pension Fund v. Lender Processing Services, Inc. case alleges that our directors engaged in conduct similar to that alleged in Pruitt, and thereby breached their fiduciary duties in connection with the Proposed Merger. The complaint also alleges that we, FNF and Merger Subsidiary aided and abetted such misconduct. The complaint in each of Pruitt and Orlando Police Pension Fund sought to preliminarily and permanently enjoin the parties from proceeding with and consummating the Proposed Merger or, in the event the Merger is consummated, to rescind or set it aside and/or award the plaintiff class an unspecified amount of rescissory or compensatory damages. On August 26, 2013, the Wheatley case and the Orlando Police Pension Fund case were consolidated. On September 23, 2013, a second amended complaint was filed in this consolidated action. On September 27, 2013, the Pruitt case was voluntarily dismissed without prejudice. On December 12, 2013, we entered into a memorandum of understanding (“MOU”) with the plaintiff in Wheatley, providing for the settlement of all claims relating to the Proposed Merger, subject to approval of the Florida Circuit Court. Pursuant to the settlement, we agreed to and did make certain supplemental disclosures with the Securities and Exchange Commission on Form 8-K, and agreed to pay attorneys’ fees to plaintiffs’ counsel if and to the extent awarded by the Florida Circuit Court. The settlement does not provide for the payment of any financial consideration to the plaintiffs or other members of the class. The settlement provides for the dismissal, with prejudice of all claims related to the Proposed Merger, and the release by all class members of all such claims against all defendants and any of their present or former affiliates, directors, officers or employees. The MOU expressly provides that the claims to be released pursuant to the settlement do not include any claims or demands that have been or could have been asserted by or on behalf of us relating to conduct that was the subject of the derivative claims that were asserted in the Wheatley and Hill matters. If and to the extent that any derivative claims remain or are reasserted following the settlement, we intend to vigorously defend those claims.
Washington Mutual Receivership Proceedings
The Federal Deposit Insurance Corporation (“FDIC”), in its capacity as Receiver for Washington Mutual Bank (“WAMU”), filed a complaint against us and certain of our subsidiaries on May 9, 2011 in the U.S. District Court for the Central District of California to recover alleged losses of approximately $154.5 million. On February 12, 2014, we entered into a Settlement and Release Agreement with the FDIC resolving the outstanding claims made by the FDIC for $30.0 million.
F-55
Table of Contents
LENDER PROCESSING SERVICES, INC.
AND SUBSIDIARIES
NOTES TO CONSOLIDATED FINANCIAL STATEMENTS (continued)
Regulatory Matters
Nevada Attorney General
On December 15, 2011, the Nevada Attorney General filed a civil complaint in the District Court for Clark County alleging that certain document execution practices and administrative services provided to attorneys violated the Nevada Deceptive Trade Practices Act. The complaint sought an unspecified amount of damages. On February 14, 2014, we entered into a Settlement Agreement and Mutual Release with the State of Nevada. Pursuant to the settlement, we received a release of claims the attorney general could make with respect to the subject conduct, agreed to continue strengthening our ongoing compliance, oversight and remediation efforts, and paid an aggregate amount, inclusive of reimbursement of attorney fees and costs, of approximately $6.1 million.
Consent Order
Following a review by the Board of Governors of the Federal Reserve System, the Federal Deposit Insurance Corporation, the Office of the Comptroller of the Currency and the Office of Thrift Supervision (collectively, the “banking agencies”), we entered into a consent order (the “Order”) dated April 13, 2011 with the banking agencies. The banking agencies’ review of our services included the services provided by our default operations to mortgage servicers regulated by the banking agencies, including document execution services. The Order does not make any findings of fact or conclusions of wrongdoing, nor do we admit any fault or liability. Under the Order, we agreed to further study the issues identified in the review and to enhance our compliance, internal audit, risk management and board oversight plans with respect to those businesses. We also agreed to engage an independent third party to conduct a risk assessment and review of our default management businesses and the document execution services we provided to mortgage servicers from January 1, 2008 through December 31, 2010.
The document execution review by the independent third party has been on indefinite hold since June 30, 2013 while the banking agencies consider what, if any, additional review work they would like the independent third party to undertake. Accordingly, the document execution review has taken, and likely will continue to take, longer to complete than we previously anticipated. To the extent such review, once completed, requires additional remediation of mortgage documents or identifies any financial injury from the document execution services we provided, we have agreed to implement an appropriate plan to address the issues. The Order contains various deadlines by which we have agreed to accomplish the undertakings set forth therein, including the preparation of a remediation plan following the completion of the document execution review. We have also agreed to make periodic reports to the banking agencies on our progress with respect to each of the undertakings in the Order. The Order does not include any fine or other monetary penalty, although the banking agencies have not yet concluded their assessment of whether any civil monetary penalties may be imposed.
California Escrow Review
As part of its regular review of title agents, the California Department of Insurance (the “Department”) conducted an audit of one of our subsidiaries’ escrow rate application. On March 26, 2013, our subsidiary was notified of discrepancies between rates filed by the subsidiary and the rates charged to its customers. We are working with the Department on a possible plan of restitution, which may include payment of a fine if it is determined that the correct filed rate for escrow and related services was not charged. Due to the ongoing nature of this matter, we are unable to estimate our ultimate loss or range of loss on this matter.
F-56
Table of Contents
LENDER PROCESSING SERVICES, INC.
AND SUBSIDIARIES
NOTES TO CONSOLIDATED FINANCIAL STATEMENTS (continued)
Leases
We lease certain of our property under leases which expire at various dates. Several of these agreements include escalation clauses and provide for purchases and renewal options for periods ranging from one to five years.
Future minimum operating lease payments for leases with initial or remaining terms greater than one year for each of the next five years and thereafter are as follows (in millions):
| 2014 |
$ | 16.2 | ||
| 2015 |
10.5 | |||
| 2016 |
5.9 | |||
| 2017 |
5.3 | |||
| 2018 |
2.8 | |||
| Thereafter |
3.3 | |||
|
|
|
|||
| Total |
$ | 44.0 | ||
|
|
|
Rent expense incurred pertaining to continuing operations under all operating leases during the years ended December 31, 2013, 2012 and 2011 was $21.8 million, $21.4 million and $20.5 million, respectively.
Data Processing and Maintenance Services Agreements
We have various data processing and maintenance services agreements with vendors, which expire through 2016, for portions of our computer data processing operations and related functions. Our estimated aggregate contractual obligation remaining under these agreements was approximately $52.6 million as of December 31, 2013. However, this amount could be more or less depending on various factors such as the inflation rate, the introduction of significant new technologies, or changes in our data processing needs.
Indemnifications and Warranties
We often indemnify our customers against damages and costs resulting from claims of patent, copyright, or trademark infringement associated with use of our software through software licensing agreements. Historically, we have not made any payments under such indemnifications, but continue to monitor the conditions that are subject to the indemnifications to identify whether a loss has occurred that is both probable and estimable that would require recognition. In addition, we warrant to customers that our software operates substantially in accordance with the software specifications. Historically, no costs have been incurred related to software warranties and none are expected in the future, and as such no accruals for warranty costs have been made.
Off-Balance Sheet Arrangements
We do not have any material off-balance sheet arrangements other than operating leases and the escrow arrangements described below.
Escrow Arrangements
In conducting our title agency and closing services, we routinely hold customers’ assets in escrow accounts, pending completion of real estate related transactions. Certain of these amounts are maintained in segregated accounts, and these amounts have not been included in the accompanying consolidated balance sheets. As an incentive for holding deposits at certain banks, we periodically have programs for realizing economic benefits through favorable arrangements with these banks. As of December 31, 2013, the aggregate value of all amounts held in escrow in our title agency and closing services operations totaled $91.2 million.
F-57
Table of Contents
LENDER PROCESSING SERVICES, INC.
AND SUBSIDIARIES
NOTES TO CONSOLIDATED FINANCIAL STATEMENTS (continued)
| (16) | Employee Benefit Plans |
Stock Purchase Plan
Our employees participate in the LPS Employee Stock Purchase Plan (the “ESPP Plan”). Under the terms of the ESPP Plan and subsequent amendments, eligible employees may voluntarily purchase, at current market prices, shares of common stock through payroll deductions. We have registered 10 million shares for issuance under the ESPP Plan. Pursuant to the ESPP Plan, employees may contribute an amount between 3% and 15% of their base salary and certain commissions. Shares purchased are allocated to employees, based upon their contributions. We contribute varying matching amounts as specified in the ESPP Plan. In April 2013, our matching contribution was suspended. We recorded expenses of $3.6 million, $6.6 million and $6.5 million for the years ended December 31, 2013, 2012 and 2011, respectively, relating to the participation of our employees in the ESPP Plan.
Upon consummation of the Merger (see note 2), our employees became eligible to participate in the FNF ESPP Plan that allows employees to make after-tax contributions ranging from 3% to 15% of eligible earnings.
401(k) Profit Sharing Plan
Our employees participate in a qualified 401(k) plan sponsored by LPS. Under the terms of the plan and subsequent amendments, eligible employees may contribute up to 40% of their pretax annual compensation, which is the amount allowed pursuant to the Internal Revenue Code. We generally match 50% of each dollar of employee contribution up to 6% of the employee’s total eligible compensation. In April 2013, our matching contribution was suspended. We recorded expenses of $3.6 million, $10.8 million and $11.3 million for the years ended December 31, 2013, 2012 and 2011, respectively, relating to the participation of our employees in the 401(k) plan.
Upon consummation of the Merger (see note 2), our employees became eligible to participate in the FNF 401(k) Plan, which generally provides for matching of 37.5% of each dollar of employee contribution up to 6% of the employee’s eligible earnings.
Stock Option Plans
Prior to spin-off
At the time of the spin-off, all options and awards held by our employees were issuable in the common stock of FIS. On July 2, 2008, in connection with the spin-off, all FIS options and FIS restricted stock awards held by our employees prior to the spin-off were converted into options and awards issuable in our common stock, authorized by our new stock option plan. The exercise price and number of shares subject to each FIS option and FIS restricted stock award were adjusted to reflect the differences in FIS’s and our common stock prices, which resulted in an equal fair value of the options before and after the exchange. Therefore, no compensation charge was recorded in connection with the conversion. Since July 2, 2008, all options and awards held by our employees are issuable in LPS common stock.
Post spin-off
Our employees participate in our 2008 Omnibus Incentive Plan (the “Plan”). Under the Plan, we may grant up to 14.0 million share-based awards to officers, directors and key employees. As of December 31, 2013, 6.5 million share-based awards were available for future grant under the Plan. Awards of restricted stock and shares issued as a result of exercises of stock options will be issued from treasury shares. Expired and forfeited awards are available for re-issuance. Vesting and exercise of share-based awards are generally contingent on continued employment. Under the Plan, options and restricted stock awards have a maximum contractual term of 7 years.
F-58
Table of Contents
LENDER PROCESSING SERVICES, INC.
AND SUBSIDIARIES
NOTES TO CONSOLIDATED FINANCIAL STATEMENTS (continued)
We recognize compensation expense on a straight-line or graded vesting basis over the vesting period of share-based awards. We recorded stock compensation expense of $27.6 million, $25.7 million and $41.7 million during 2013, 2012 and 2011, respectively, and related income tax expense of $2.9 million and $0.9 million for the years ended December 31, 2012 and 2011, respectively (no tax expense was recorded in 2013). For the year ended December 31, 2011, $10.5 million of stock compensation expense was related to accelerations recorded as a result of restructuring activities. This charge is included in the accompanying consolidated statements of earnings as part of exit costs, impairments and other charges. All other compensation expense is included within operating expenses in the accompanying consolidated statements of earnings.
As of December 31, 2013, we had $24.1 million of unrecognized compensation cost related to share-based payments.
Subsequent to year-end, as part of the Merger, all of our outstanding equity awards were accelerated and vested and subsequently converted to a mix of FNF common stock and cash in accordance with the Merger Agreement. This resulted in an acceleration of our remaining unrecognized stock compensation cost, which was recorded in January 2014. See Acquisition by FNF, note 2.
Options
The following table summarizes stock option activity under the Plan:
| Number of Shares |
Weighted Average Exercise Price |
|||||||
| Outstanding as of December 31, 2010 |
7.7 | $ | 33.06 | |||||
| Granted |
2.0 | 22.23 | ||||||
| Exercised(1) |
(0.1 | ) | 12.76 | |||||
| Cancelled |
(0.5 | ) | 33.46 | |||||
|
|
|
|
|
|||||
| Outstanding as of December 31, 2011 |
9.1 | 30.85 | ||||||
| Granted |
1.1 | 24.07 | ||||||
| Exercised(1) |
(0.1 | ) | 18.08 | |||||
| Cancelled |
(2.9 | ) | 33.91 | |||||
|
|
|
|
|
|||||
| Outstanding as of December 31, 2012 |
7.2 | 28.80 | ||||||
| Granted |
— | — | ||||||
| Exercised(1) |
(2.7 | ) | 26.62 | |||||
| Cancelled |
(1.3 | ) | 31.82 | |||||
|
|
|
|
|
|||||
| Outstanding as of December 31, 2013 |
3.2 | $ | 29.37 | |||||
|
|
|
|
|
|||||
| (1) | The total intrinsic value of stock options exercised during the years ended December 31, 2013, 2012 and 2011 was $23.1 million, $1.4 million and $0.9 million, respectively. |
We measured the fair value of the awards at the date of grant using a Black-Scholes option pricing model with various assumptions. The risk-free interest rate is based on the rate in effect for the expected term of the option at the grant date. The dividend yield is based on historical dividends. The volatility assumptions are based on a blend of our historical volatility and the historical volatilities of comparable publicly traded companies using daily closing prices for the historical period commensurate with the expected term of the option. The expected life of the options is determined based on the Securities and Exchange Commission’s simplified method for companies without sufficient historical data to support a specific average expected option life.
F-59
Table of Contents
LENDER PROCESSING SERVICES, INC.
AND SUBSIDIARIES
NOTES TO CONSOLIDATED FINANCIAL STATEMENTS (continued)
The following table summarizes weighted average assumptions used to estimate fair values for awards granted during the periods presented in the consolidated financial statements:
| Year |
Weighted Average Fair Value |
Risk Free Interest Rate |
Volatility Factor |
Expected Dividend Yield |
Weighted Expected Life (In Years) |
|||||||||||||||
| 2012 |
$ | 7.50 | 0.7 | % | 43 | % | 1.7 | % | 4.5 | |||||||||||
| 2011 |
$ | 6.19 | 1.5 | % | 37 | % | 2.0 | % | 4.5 | |||||||||||
No options were awarded during the year ended December 31, 2013.
The following table summarizes stock options held by our employees that were outstanding and those that were exercisable as of December 31, 2013:
| Options Outstanding | Options Exercisable | |||||||||||||||||||||||||||||||
| Range of Exercise Prices |
Number of Options |
Weighted Average Remaining Contractual Life |
Weighted Average Exercise Price |
Intrinsic Value at December 31, 2013 |
Number of Options |
Weighted Average Remaining Contractual Life |
Weighted Average Exercise Price |
Intrinsic Value at December 31, 2013 |
||||||||||||||||||||||||
| 13.67-23.66 |
328,072 | 4.57 | $ | 14.37 | $ | 7,549,680 | 43,765 | 3.33 | $ | 14.22 | $ | 1,013,386 | ||||||||||||||||||||
| 23.67-28.35 |
756,729 | 5.38 | 23.67 | 10,374,755 | 118,476 | 5.38 | 23.67 | 1,624,306 | ||||||||||||||||||||||||
| 28.36-31.95 |
601,746 | 3.97 | 28.42 | 5,391,393 | 285,639 | 3.25 | 28.37 | 2,574,854 | ||||||||||||||||||||||||
| 31.96-35.17 |
393,932 | 1.64 | 34.56 | 1,109,848 | 391,332 | 1.62 | 34.58 | 1,095,730 | ||||||||||||||||||||||||
| 35.18-42.74 |
1,084,610 | 1.69 | 36.54 | 911,321 | 1,084,610 | 1.69 | 36.54 | 911,321 | ||||||||||||||||||||||||
|
|
|
|
|
|
|
|
|
|
|
|
|
|
|
|
|
|||||||||||||||||
| 13.67-42.74 |
3,165,089 | 3.30 | $ | 29.37 | $ | 25,336,997 | 1,923,822 | 2.17 | $ | 33.63 | $ | 7,219,597 | ||||||||||||||||||||
Restricted Stock
During the year ended December 31, 2013 we granted approximately 0.9 million shares of restricted stock with a weighted average grant date fair value of $26.92. Almost all of these restricted shares are subject to both a service and performance-based vesting condition. If the performance objective is not achieved, the restricted stock is subject to automatic forfeiture to us for no consideration. Dividends on the unvested restricted stock are accrued until the vest date, at which time the dividends are paid in full to the participants. Additionally, all of our executive officers who were granted restricted stock in 2013 and 2012 are required to hold a portion of their vested shares for a period of six months following the vesting of each tranche.
F-60
Table of Contents
LENDER PROCESSING SERVICES, INC.
AND SUBSIDIARIES
NOTES TO CONSOLIDATED FINANCIAL STATEMENTS (continued)
The following table summarizes restricted stock activity for the years ended December 31, 2013, 2012 and 2011:
| Restricted Shares |
Weighted Average Grant Date Fair Value |
|||||||
| Outstanding as of December 31, 2010 |
0.9 | $ | 32.37 | |||||
| Granted |
1.0 | 23.98 | ||||||
| Vested |
(0.4 | ) | 32.53 | |||||
| Cancelled |
— | — | ||||||
|
|
|
|
|
|||||
| Outstanding as of December 31, 2011 |
1.5 | 26.73 | ||||||
| Granted |
0.7 | 24.07 | ||||||
| Vested |
(0.7 | ) | 27.77 | |||||
| Cancelled |
(0.2 | ) | 32.01 | |||||
|
|
|
|
|
|||||
| Outstanding as of December 31, 2012 |
1.3 | 24.19 | ||||||
| Granted |
0.9 | 26.92 | ||||||
| Vested |
(0.6 | ) | 24.86 | |||||
| Cancelled |
(0.1 | ) | 26.31 | |||||
|
|
|
|
|
|||||
| Outstanding as of December 31, 2013 |
1.5 | $ | 25.40 | |||||
|
|
|
|
|
|||||
| (17) | Income Taxes |
Income tax expense (benefit) attributable to continuing operations for the years ended December 31, 2013, 2012 and 2011 consists of the following (in millions):
| 2013 | 2012 | 2011 | ||||||||||
| Current provision: |
||||||||||||
| Federal |
$ | (20.6 | ) | $ | 76.6 | $ | 61.4 | |||||
| State |
(1.0 | ) | 9.5 | 10.3 | ||||||||
|
|
|
|
|
|
|
|||||||
| Total current provision |
(21.6 | ) | 86.1 | 71.7 | ||||||||
|
|
|
|
|
|
|
|||||||
| Deferred provision: |
||||||||||||
| Federal |
70.1 | (17.0 | ) | 5.5 | ||||||||
| State |
5.6 | (1.6 | ) | — | ||||||||
|
|
|
|
|
|
|
|||||||
| Total deferred provision |
75.7 | (18.6 | ) | 5.5 | ||||||||
|
|
|
|
|
|
|
|||||||
| Total provision for income taxes |
$ | 54.1 | $ | 67.5 | $ | 77.2 | ||||||
|
|
|
|
|
|
|
|||||||
F-61
Table of Contents
LENDER PROCESSING SERVICES, INC.
AND SUBSIDIARIES
NOTES TO CONSOLIDATED FINANCIAL STATEMENTS (continued)
A reconciliation of the federal statutory income tax rate to our effective income tax rate for the years ended December 31, 2013, 2012 and 2011 is as follows:
| 2013 | 2012 | 2011 | ||||||||||
| Federal statutory income tax rate |
35.0 | % | 35.0 | % | 35.0 | % | ||||||
| State income taxes, net of federal benefit |
3.0 | 2.0 | 3.2 | |||||||||
| Legal and regulatory accrual |
0.2 | 6.0 | 2.3 | |||||||||
| Non cash stock option forfeitures |
1.2 | 6.3 | — | |||||||||
| Uncertain tax positions |
— | 0.5 | — | |||||||||
| Domestic production deduction |
(0.4 | ) | (2.0 | ) | (2.9 | ) | ||||||
| Research and development credit |
(4.1 | ) | (1.3 | ) | (1.2 | ) | ||||||
| Other |
(0.9 | ) | (0.5 | ) | (0.1 | ) | ||||||
|
|
|
|
|
|
|
|||||||
| Effective income tax rate |
34.0 | % | 46.0 | % | 36.3 | % | ||||||
|
|
|
|
|
|
|
|||||||
The significant components of deferred income tax assets and liabilities at December 31, 2013 and 2012 consist of the following (in millions):
| 2013 | 2012 | |||||||
| Deferred income tax assets: |
||||||||
| Accruals and reserves |
$ | 49.0 | $ | 85.6 | ||||
| Employee benefit accruals |
30.5 | 38.0 | ||||||
| Deferred revenue |
30.1 | 21.2 | ||||||
| Allowance for doubtful accounts |
15.2 | 17.3 | ||||||
| Net operating losses |
8.6 | 8.6 | ||||||
| State taxes |
— | 3.9 | ||||||
| Investments |
1.7 | 1.9 | ||||||
|
|
|
|
|
|||||
| Total gross deferred income tax assets |
135.1 | 176.5 | ||||||
| Less: valuation allowance |
— | — | ||||||
|
|
|
|
|
|||||
| Total deferred income tax assets |
135.1 | 176.5 | ||||||
|
|
|
|
|
|||||
| Deferred income tax liabilities: |
||||||||
| Amortization of goodwill and intangible assets |
(225.4 | ) | (193.0 | ) | ||||
| Depreciation |
(15.1 | ) | (16.0 | ) | ||||
| Deferred contract costs |
(18.2 | ) | (14.1 | ) | ||||
| State taxes |
(0.4 | ) | — | |||||
|
|
|
|
|
|||||
| Total deferred income tax liabilities |
(259.1 | ) | (223.1 | ) | ||||
|
|
|
|
|
|||||
| Net deferred income tax liabilities |
$ | (124.0 | ) | $ | (46.6 | ) | ||
|
|
|
|
|
|||||
Deferred income taxes have been classified in the consolidated balance sheets as of December 31, 2013 and 2012 as follows (in millions):
| 2013 | 2012 | |||||||
| Current assets |
$ | 102.1 | $ | 127.7 | ||||
| Non-current liabilities |
(226.1 | ) | (174.3 | ) | ||||
|
|
|
|
|
|||||
| Net deferred income tax liabilities |
$ | (124.0 | ) | $ | (46.6 | ) | ||
|
|
|
|
|
|||||
F-62
Table of Contents
LENDER PROCESSING SERVICES, INC.
AND SUBSIDIARIES
NOTES TO CONSOLIDATED FINANCIAL STATEMENTS (continued)
Management believes that based on its historical pattern of taxable income, projections of future taxable income, tax planning strategies and other relevant evidence, we will produce sufficient taxable income in the future to realize our deferred income tax assets. A valuation allowance is established for any portion of a deferred income tax asset if management believes it is more likely than not that we will not be able to realize all or a portion of a deferred income tax asset.
We incurred a current tax loss for the 2013 year due primarily to the payments for certain settlements and legal expenses that were accrued in prior years for financial reporting purposes and stock options expense. We have capacity to carryback the loss to a prior tax year and fully utilize the loss.
We had federal net operating loss carryforwards at December 31, 2013 and 2012 resulting in deferred tax assets of $8.6 million and $8.6 million, respectively. These net operating losses expire between 2027 and 2029. We fully anticipate utilizing these losses prior to expiration and thus, no valuation allowance has been established.
We are a participant in the Internal Revenue Service’s Compliance Assurance Process (CAP), which is a real time audit of the income tax returns and other tax related matters. The IRS has completed its review for all tax years through 2012 resulting in no material adverse changes to any member of the LPS consolidated group. The IRS is currently reviewing the 2013 tax year and management believes the ultimate resolution of the examination will not result in a material adverse effect to our financial position or results of operations. Substantially all of the state income tax audits have been concluded through the 2008 tax year.
We provide for United States income taxes on earnings of foreign subsidiaries unless they are considered permanently reinvested outside the United States.
In January 2013, the American Taxpayer Relief Act of 2012 was signed into law which retroactively extended the research credit through the 2013 tax year. The impact of changes in the law are recorded in the period in which the laws are enacted. A $3.4 million impact of the 2012 law change regarding the research credit has been reflected in the 2013 income tax provision.
Reserves for uncertain tax positions are computed by determining a minimum recognition threshold a tax position is required to meet before being recognized in the financial statements. ASC 740-10 provides guidance on measurement and classification of amounts relating to uncertain tax positions, accounting for interest and penalties, and disclosures. Our policy is to recognize interest and penalties related to unrecognized tax benefits as a component of income tax expense.
The following table reconciles the gross amounts of unrecognized tax benefits at the beginning and end of the current period (in millions):
| Gross Amount |
||||
| Amount of unrecognized tax benefit at December 31, 2012 |
$ | 1.0 | ||
| Increases as a result of tax positions taken in the current year |
— | |||
| Increases as a result of tax positions taken in a prior period |
— | |||
|
|
|
|||
| Amount of unrecognized tax benefit as of December 31, 2013 |
$ | 1.0 | ||
|
|
|
|||
(18) Concentration of Risk
We generate a significant amount of revenue from large customers, including one customer that accounted for 20.0%, 21.2% and 21.5% of total revenue and another customer that accounted for 11.4%, 15.4% and 17.4% of total revenue, in the years ended December 31, 2013, 2012 and 2011, respectively.
F-63
Table of Contents
LENDER PROCESSING SERVICES, INC.
AND SUBSIDIARIES
NOTES TO CONSOLIDATED FINANCIAL STATEMENTS (continued)
Financial instruments that potentially subject us to concentrations of credit risk consist primarily of cash equivalents and trade receivables.
(19) Segment Information
Summarized financial information concerning our segments is shown in the following tables.
As of and for the year ended December 31, 2013 (in millions):
| Technology, Data and Analytics |
Transaction Services |
Corporate and Other |
Total | |||||||||||||
| Revenues |
$ | 757.2 | $ | 965.9 | $ | 0.4 | $ | 1,723.5 | ||||||||
| Operating expenses(1) |
456.4 | 788.5 | 40.2 | 1,285.1 | ||||||||||||
| Depreciation and amortization |
83.2 | 18.7 | 3.5 | 105.4 | ||||||||||||
| Legal and regulatory charges |
— | 1.8 | 72.6 | 74.4 | ||||||||||||
| Exit costs, impairments and other charges |
0.7 | 33.9 | 14.8 | 49.4 | ||||||||||||
|
|
|
|
|
|
|
|
|
|||||||||
| Operating income (loss) |
216.9 | 123.0 | (130.7 | ) | 209.2 | |||||||||||
| Total other income (expense) |
1.9 | 3.3 | (55.2 | ) | (50.0 | ) | ||||||||||
|
|
|
|
|
|
|
|
|
|||||||||
| Earnings (loss) from continuing operations before income tax |
218.8 | 126.3 | (185.9 | ) | 159.2 | |||||||||||
| Income tax provision (benefit) |
75.5 | 43.6 | (65.0 | ) | 54.1 | |||||||||||
|
|
|
|
|
|
|
|
|
|||||||||
| Earnings (loss) from continuing operations |
$ | 143.3 | $ | 82.7 | $ | (120.9 | ) | $ | 105.1 | |||||||
|
|
|
|
|
|
|
|
|
|||||||||
| Capital expenditures(2) |
$ | 96.6 | $ | 15.4 | $ | 1.8 | $ | 113.8 | ||||||||
|
|
|
|
|
|
|
|
|
|||||||||
| Total assets(3) |
$ | 1,314.2 | $ | 669.3 | $ | 503.2 | $ | 2,486.7 | ||||||||
|
|
|
|
|
|
|
|
|
|||||||||
| Goodwill(3) |
$ | 724.8 | $ | 384.5 | $ | — | $ | 1,109.3 | ||||||||
|
|
|
|
|
|
|
|
|
|||||||||
As of and for the year ended December 31, 2012 (in millions):
| Technology, Data and Analytics |
Transaction Services |
Corporate and Other |
Total | |||||||||||||
| Revenues |
$ | 736.9 | $ | 1,262.7 | $ | (2.0 | ) | $ | 1,997.6 | |||||||
| Operating expenses(1) |
440.7 | 983.0 | 41.4 | 1,465.1 | ||||||||||||
| Depreciation and amortization |
75.0 | 17.8 | 3.9 | 96.7 | ||||||||||||
| Legal and regulatory charges |
— | — | 192.4 | 192.4 | ||||||||||||
| Exit costs, impairments and other charges |
2.8 | 1.5 | 6.2 | 10.5 | ||||||||||||
|
|
|
|
|
|
|
|
|
|||||||||
| Operating income (loss) |
218.4 | 260.4 | (245.9 | ) | 232.9 | |||||||||||
| Total other income (expense) |
1.6 | 2.8 | (90.3 | ) | (85.9 | ) | ||||||||||
|
|
|
|
|
|
|
|
|
|||||||||
| Earnings (loss) from continuing operations before income tax |
220.0 | 263.2 | (336.2 | ) | 147.0 | |||||||||||
| Income tax provision (benefit) |
79.0 | 94.8 | (106.3 | ) | 67.5 | |||||||||||
|
|
|
|
|
|
|
|
|
|||||||||
| Earnings (loss) from continuing operations |
$ | 141.0 | $ | 168.4 | $ | (229.9 | ) | $ | 79.5 | |||||||
|
|
|
|
|
|
|
|
|
|||||||||
| Capital expenditures(2) |
$ | 88.5 | $ | 22.9 | $ | 1.4 | $ | 112.8 | ||||||||
|
|
|
|
|
|
|
|
|
|||||||||
| Total assets(3) |
$ | 1,263.4 | $ | 742.0 | $ | 440.4 | $ | 2,445.8 | ||||||||
|
|
|
|
|
|
|
|
|
|||||||||
| Goodwill(3) |
$ | 724.8 | $ | 384.5 | $ | — | $ | 1,109.3 | ||||||||
|
|
|
|
|
|
|
|
|
|||||||||
F-64
Table of Contents
LENDER PROCESSING SERVICES, INC.
AND SUBSIDIARIES
NOTES TO CONSOLIDATED FINANCIAL STATEMENTS (continued)
As of and for the year ended December 31, 2011 (in millions):
| Technology, Data and Analytics |
Transaction Services |
Corporate and Other |
Total | |||||||||||||
| Revenues |
$ | 679.6 | $ | 1,309.9 | $ | (6.1 | ) | $ | 1,983.4 | |||||||
| Operating expenses(1) |
388.8 | 1,032.5 | 59.1 | 1,480.4 | ||||||||||||
| Depreciation and amortization |
67.2 | 17.5 | 4.2 | 88.9 | ||||||||||||
| Legal and regulatory charges |
— | — | 78.5 | 78.5 | ||||||||||||
| Exit costs, impairments and other charges |
16.9 | 3.8 | 36.2 | 56.9 | ||||||||||||
|
|
|
|
|
|
|
|
|
|||||||||
| Operating income (loss) |
206.7 | 256.1 | (184.1 | ) | 278.7 | |||||||||||
| Total other income (expense) |
1.4 | 1.7 | (69.4 | ) | (66.3 | ) | ||||||||||
|
|
|
|
|
|
|
|
|
|||||||||
| Earnings (loss) from continuing operations before income tax |
208.1 | 257.8 | (253.5 | ) | 212.4 | |||||||||||
| Income tax provision (benefit) |
79.9 | 96.0 | (98.7 | ) | 77.2 | |||||||||||
|
|
|
|
|
|
|
|
|
|||||||||
| Earnings (loss) from continuing operations |
$ | 128.2 | $ | 161.8 | $ | (154.8 | ) | $ | 135.2 | |||||||
|
|
|
|
|
|
|
|
|
|||||||||
| Capital expenditures(2) |
$ | 73.4 | $ | 15.5 | $ | 5.9 | $ | 94.8 | ||||||||
|
|
|
|
|
|
|
|
|
|||||||||
| Total assets(3) |
$ | 1,223.2 | $ | 761.5 | $ | 260.7 | $ | 2,245.4 | ||||||||
|
|
|
|
|
|
|
|
|
|||||||||
| Goodwill(3) |
$ | 748.3 | $ | 384.5 | $ | — | $ | 1,132.8 | ||||||||
|
|
|
|
|
|
|
|
|
|||||||||
| (1) | Operating expenses within the “Corporate and Other” segment are attributable to unallocated general and administrative expenses. |
| (2) | Excludes the impact of discontinued operations. |
| (3) | Includes the impact of discontinued operations. |
(20) Subsequent Events
We considered events or transactions that occurred after the date of the consolidated balance sheets, but before the financial statements were issued, to provide additional evidence relative to certain estimates or to identify matters that require additional disclosure. Subsequent events have been evaluated through March 31, 2014, the date on which the consolidated financial statements were issued. On January 2, 2014, the Merger was completed. See note 2, Acquisition by FNF, for a summary of this transaction. There were no subsequent events other than those described elsewhere in the notes to consolidated financial statements herein.
F-65
Table of Contents
Report of Independent Registered Public Accounting Firm
The Board of Managers and Members
Black Knight Financial Services, LLC:
We have audited the accompanying combined balance sheet of Black Knight Financial Services, LLC (the “Company”) as of December 31, 2013, and the related combined statements of operations, member’s equity, and cash flows for the period from October 16, 2013 (date of inception) through December 31, 2013. These combined financial statements are the responsibility of the Company’s management. Our responsibility is to express an opinion on these combined financial statements based on our audit.
We conducted our audit in accordance with the standards of the Public Company Accounting Oversight Board (United States). Those standards require that we plan and perform the audit to obtain reasonable assurance about whether the financial statements are free of material misstatement. An audit includes examining, on a test basis, evidence supporting the amounts and disclosures in the financial statements. An audit also includes assessing the accounting principles used and significant estimates made by management, as well as evaluating the overall financial statement presentation. We believe that our audit provides a reasonable basis for our opinion.
In our opinion, the combined financial statements referred to above present fairly, in all material respects, the financial position of Black Knight Financial Services, LLC as of December 31, 2013, and the results of its operations and its cash flows for the period from October 16, 2013 (date of inception) through December 31, 2013, in conformity with U.S. generally accepted accounting principles.
As discussed in notes 1 and 2 to the combined financial statements, the Company was subject to an internal reorganization of its parent, Fidelity National Financial, Inc., on January 3, 2014, whereby Fidelity National Financial, Inc. contributed certain operations of Lender Processing Services, Inc., as acquired by Fidelity National Financial, Inc. on January 2, 2014, and Fidelity National Commerce Velocity, LLC, to the Company. Further, and subject to a separate reorganization that occurred on June 2, 2014, Fidelity National Financial, Inc. contributed its wholly-owned subsidiary, Property Insight, LLC, to the Company.
/s/ KPMG LLP
December 23, 2014
Jacksonville, Florida
Certified Public Accountants
F-66
Table of Contents
BLACK KNIGHT FINANCIAL SERVICES, LLC
(In thousands)
| As of December 31, 2013 |
||||
| Assets: |
||||
| Current assets |
||||
| Cash and cash equivalents |
$ | 7,395 | ||
| Trade receivables, net |
7,379 | |||
| Prepaids and other assets |
2,465 | |||
|
|
|
|||
| Total current assets |
17,239 | |||
| Property and equipment, net |
483 | |||
| Computer software, net |
15,989 | |||
| Other intangible assets |
4,752 | |||
| Goodwill |
49,025 | |||
| Other non-current assets |
595 | |||
|
|
|
|||
| Total assets |
$ | 88,083 | ||
|
|
|
|||
| Liabilities: |
||||
| Current liabilities |
||||
| Accounts payable and accrued expenses |
$ | 3,139 | ||
| Accrued salaries and bonuses |
3,607 | |||
| Deferred revenue |
790 | |||
| Amounts due to parent |
12,687 | |||
|
|
|
|||
| Total current liabilities |
20,224 | |||
| Deferred revenue |
54 | |||
|
|
|
|||
| Total liabilities |
20,277 | |||
|
|
|
|||
| Equity: |
||||
| Parent’s equity |
67,806 | |||
|
|
|
|||
| Total equity |
67,806 | |||
|
|
|
|||
| Total liabilities and equity |
$ | 88,093 | ||
|
|
|
|||
See accompanying notes to combined financial statements.
F-67
Table of Contents
BLACK KNIGHT FINANCIAL SERVICES, LLC
Combined Statement of Operations
Period from October 16, 2013 through December 31, 2013
(In thousands)
| Total revenues |
$ | 14,970 | ||
|
|
|
|||
| Personnel cost |
11,969 | |||
| Other operating expenses |
4,946 | |||
| Depreciation and amortization |
1,058 | |||
|
|
|
|||
| Total expenses |
17,973 | |||
|
|
|
|||
| Loss before income tax |
(3,003 | ) | ||
| Income taxes |
— | |||
|
|
|
|||
| Net loss |
$ | (3,003 | ) | |
|
|
|
See accompanying notes to combined financial statements.
F-68
Table of Contents
BLACK KNIGHT FINANCIAL SERVICES, LLC
Combined Statement of Members’ Equity
Period from October 16, 2013 through December 31, 2013
(In thousands)
| Parent equity, October 16, 2013 |
$ | 70,809 | ||
| Net loss |
(3,003 | ) | ||
|
|
|
|||
| Parent equity, December 31, 2013 |
$ | 67,806 | ||
|
|
|
See accompanying notes to combined financial statements.
F-69
Table of Contents
BLACK KNIGHT FINANCIAL SERVICES, LLC
Combined Statement of Cash Flows
Period from October 16, 2013 through December 31, 2013
(In thousands)
| Cash Flows From Operating Activities: |
||||
| Net loss |
$ | (3,003 | ) | |
| Adjustments to reconcile net loss to net cash used in operating activities: |
||||
| Depreciation and amortization |
1,058 | |||
| Changes in assets and liabilities: |
||||
| Net decrease in trade receivables, net |
715 | |||
| Net increase in prepaid expenses and other assets |
681 | |||
| Net decrease in accounts payable and accrued expenses |
20 | |||
|
|
|
|||
| Net cash used in operating activities |
(1,891 | ) | ||
|
|
|
|||
| Cash Flows From Investing Activities: |
||||
| Additions to property and equipment |
(249 | ) | ||
| Additions to computer software |
(5 | ) | ||
|
|
|
|||
| Net cash used in investing activities |
(254 | ) | ||
|
|
|
|||
| Net decrease in cash and cash equivalents |
(2,145 | ) | ||
| Cash and cash equivalents at beginning of period |
9,540 | |||
|
|
|
|||
| Cash and cash equivalents at end of period |
$ | 7,395 | ||
|
|
|
See accompanying notes to combined financial statements.
F-70
Table of Contents
BLACK KNIGHT FINANCIAL SERVICES, LLC
Notes to Combined Financial Statements
As of December 31, 2013 and for the period from October 16, 2013 through December 31, 2013
The information in these combined financial statements of Black Knight Financial Services, LLC (“BKFS” or the “Company”) includes the assets, liabilities and operations of BKFS, a shell company formed on October 16, 2013 in anticipation of the acquisition of Lender Processing Services, Inc. (“LPS”) by Fidelity National Financial, Inc. (“FNF”) on January 2, 2014 (the “Acquisition”). Additionally, the assets, liabilities and operations of Fidelity National Commerce Velocity, LLC (“Commerce Velocity”) and Property Insight, LLC (“Property Insight”), which were wholly owned subsidiaries of FNF prior to the Acquisition, are included in these financials from the date of the formation of BKFS. These companies were contributed to BKFS subsequent to the Acquisition but have been retroactively reflected within these financial statements on a historical cost basis since they are entities under common control of FNF.
(1) Description of Business
BKFS was formed on October 16, 2013, with FNF as its sole member, in anticipation of the Acquisition. See further description in Note 2 below. BKFS delivers technology solutions for every stage of the loan life cycle, ranging from lead management, point-of-sale, loan origination and processing, automated underwriting, closing, funding and secondary marketing. BKFS also provides solutions critical to evaluating pools of mortgage assets including loan level analytics necessary to convert defaulting loans with recommended optimal treatments. In addition, BKFS also provides electronic search products designed and engineered for the way title companies work.
(2) Formation and Organization of BKFS, LLC
On January 2, 2014, FNF acquired LPS and LPS became an indirect subsidiary of FNF. On January 3, 2014, subsequent to acquisition by FNF, LPS was converted into a Delaware limited liability company and renamed Black Knight InfoServ, LLC (“BKIS”) and pursuant to an internal reorganization (the “Reorganization”), the following related transactions occurred:
On January 2, 2014, FNF completed the Acquisition of LPS, pursuant to the Agreement and Plan of Merger (the “Merger Agreement”), dated as of May 28, 2013, among FNF, Black Knight Holdings, Inc. (formerly Black Knight Financial Services, Inc.) (“Black Knight”), and Lion Merger Sub, Inc., a Delaware corporation and a subsidiary of Black Knight (“Merger Sub”), and LPS. Pursuant to the Merger Agreement, Merger Sub merged with and into LPS, with LPS surviving as a subsidiary of Black Knight. The purchase consideration paid by FNF was $3.4 billion, which consisted of $2,535 million in cash and $839 million in FNF common stock, or approximately 25.9 million shares. Upon the closing of the Acquisition, the shares of LPS Common Stock, which previously traded under the ticker symbol “LPS” on the New York Stock Exchange (the “NYSE”), ceased trading on, and were delisted from, the NYSE.
On January 3, 2014, LPS was converted into a Delaware limited liability company and was renamed Black Knight InfoServ, LLC (“BKIS”), a member managed limited liability company. Also on that date, pursuant to an internal reorganization, BKIS distributed all of its limited liability company membership interests and equity interests in its subsidiaries engaged in the Transaction Services business to Black Knight (the “Distribution”). Following the Distribution, Black Knight contributed the Transaction Services subsidiaries to its wholly-owned subsidiary Black Knight Financial Services II, LLC, which has been renamed ServiceLink Holdings, LLC (“ServiceLink”) and contributed BKIS to its subsidiary Black Knight Financial Services I, LLC, which has been renamed Black Knight Financial Services, LLC (“BKFS”).
On January 3, 2014, FNF, through Black Knight, contributed its subsidiary, Commerce Velocity to Black Knight Financial Services I, LLC, which then contributed Commerce Velocity to BKIS. In addition, BKIS
F-71
Table of Contents
BLACK KNIGHT FINANCIAL SERVICES, LLC
Notes to Combined Financial Statements
As of December 31, 2013 and for the period from October 16, 2013 through December 31, 2013 (continued)
sold its interest in National Title Insurance of New York, Inc. (“NTNY”) to Chicago Title Insurance Company (a wholly owned subsidiary of FNF) on this date. Thereafter, 35% of the membership interest of BKFS was issued to certain funds affiliated with Thomas H. Lee Partners, L.P. (“THL”).
On June 2, 2014, as part of an internal reorganization, two wholly owned subsidiaries of FNF, Fidelity National Title Insurance Company and Chicago Title Insurance Company, contributed their respective interests in Property Insight, a provider of property information used by title insurance underwriters, title agents and closing attorneys to underwrite title insurance policies for real property sales and transfers, to BKFS, in exchange for equity interests in BKFS.
Collectively the events on January 3, 2014 and June 2, 2014 are known as the Reorganization.
(3) Significant Accounting Policies
The following describes our significant accounting policies which have been followed in preparing the accompanying combined financial statements.
(a) Principles of Combination and Basis of Presentation
The accompanying combined financial statements include those assets, liabilities, revenues and expenses related to BKFS operations as of December 31, 2013, and for the period from October 16, 2013 through December 31, 2013, and were prepared in accordance with U.S. generally accepted accounting principles (GAAP). All adjustments considered necessary for a fair presentation have been included.
In accordance with GAAP requirements for transactions between entities under common control, assets and liabilities contributed in the transaction were recorded at their respective historical FNF book values on the date of contribution. Further, as a result of the Reorganization, the operations of BKFS, Commerce Velocity and Property Insight are shown as of October 16, 2013, the earliest date that all entities included in the combined financial statements were under the common control of FNF.
The accompanying combined financial statements may not be indicative of the conditions that would have existed or results of operations if we operated as an unaffiliated entity. There are various licenses and title plant access agreements that would have to be in place for these combined entities to operate on a stand-alone basis and not as a directly owned subsidiary of FNF (Note 4).
The combined statement of operations include all revenues and expenses attributable to the Company, including a charge or allocation of the costs for support services provided by FNF as discussed in Note 5, Transactions with Related Parties. Where specific identification of expenses was not practicable, the cost of such services was proportionally allocated based on the most relevant allocation method for the service provided. The costs of these services are not necessarily indicative of the costs that would have been incurred if we had performed these functions as a stand-alone entity. However, management believes that the methods used to make such allocations are reasonable and faithfully represent the proportional costs of these services to us.
(b) Management Estimates
The preparation of these combined financial statements in conformity with GAAP requires management to make estimates and assumptions that affect the reported amounts of assets and liabilities and disclosure of contingent assets and liabilities at the date of the combined financial statements and the reported amounts of revenues and expenses during the reporting period. The accounting estimates that require our most significant and subjective judgments include the recognition
F-72
Table of Contents
BLACK KNIGHT FINANCIAL SERVICES, LLC
Notes to Combined Financial Statements
As of December 31, 2013 and for the period from October 16, 2013 through December 31, 2013 (continued)
of revenue related to our Commerce Velocity division and accruals for annual employee bonuses. Actual results that we experience could differ from our estimates.
(c) Cash and Cash Equivalents
Highly liquid instruments purchased with original maturities of three months or less are considered cash equivalents. Cash equivalents are predominantly invested with high credit quality financial institutions and consist of short-term investments, such as money market accounts, money market funds and time deposits. The carrying amounts of these instruments reported in the combined balance sheets approximate their fair value because of their immediate or short-term maturities.
(d) Trade Accounts Receivable, Net
The carrying amounts reported in the combined balance sheets for trade accounts receivable approximate their fair value because of their immediate or short-term maturities.
A summary of trade accounts receivable, net of an allowance for doubtful accounts, is as follows as of December 31, 2013 (in thousands):
| Gross trade receivables |
$ | 7,598 | ||
| Allowance for doubtful accounts |
(219 | ) | ||
|
|
|
|||
| Total trade receivables, net |
7,379 | |||
|
|
|
(e) Property and Equipment, net
Property and equipment is recorded at cost, less accumulated depreciation and amortization. Depreciation and amortization are computed primarily using the straight-line method based on the estimated useful lives of the related assets: three to seven years for furniture, fixtures and computer equipment. Leasehold improvements are amortized using the straight-line method over the lesser of the initial terms of the applicable leases or five years. Property and equipment are reviewed for impairment whenever events or circumstances indicate the carrying amount may not be recoverable. There have been no impairment charges during the period presented.
(f) Computer software, net
Computer software includes the fair value of computer software acquired in business combinations, purchased software and computer software development costs. Purchased software is recorded at cost and amortized using the straight-line method over three years or its estimated useful life. Software acquired in business combinations is recorded at its fair value and amortized using straight-line or accelerated methods over its estimated useful life, ranging from three to seven years.
Internally developed software costs are amortized using the greater of the straight-line method over the estimated useful life or based on the ratio of current revenues to total anticipated revenue over the estimated useful lives. Useful lives of internally developed computer software range from three to fifteen years. Computer software development costs are accounted for in accordance with generally accepted accounting principles for software and intangible assets including costs of software to be sold, leased, or marketed and internal use software. For computer software products to be sold, leased, or otherwise marketed, all costs incurred to establish the technological feasibility are research and development costs, and are expensed as they are incurred. Costs incurred subsequent to establishing technological feasibility, such as programmers salaries and related payroll costs and costs of independent contractors, are development costs, and are capitalized and amortized on a product by
F-73
Table of Contents
BLACK KNIGHT FINANCIAL SERVICES, LLC
Notes to Combined Financial Statements
As of December 31, 2013 and for the period from October 16, 2013 through December 31, 2013 (continued)
product basis commencing on the date of general release to customers. We do not capitalize any costs once the product is available for general release to customers. For internal-use computer software products, internal and external costs incurred during the preliminary project stage are expensed as they are incurred. Internal and external costs incurred during the application development stage are capitalized and amortized on a product by product basis commencing on the date the software is ready for its intended use. We do not capitalize any costs once the software is ready for its intended use. We also assess the recorded value of computer software for impairment on a regular basis by comparing the carrying value to the estimated future cash flows to be generated by the underlying software asset. No impairments were identified during the period presented.
(g) Intangible Assets, net
Intangible assets consist primarily of customer relationships and trade names that are recorded in connection with acquisitions at their fair value based on the results of a valuation analysis. Customer relationships are amortized over their estimated useful lives using an accelerated method which takes into consideration expected customer attrition rates and range from three to fifteen years. Intangible assets are reviewed for impairment whenever events or circumstances indicate the carrying amount may not be recoverable. There have been no impairment charges during the periods presented.
(h) Goodwill
Goodwill represents the excess of cost over the fair value of identifiable assets acquired and liabilities assumed in business combinations. Goodwill is not amortized, but is reviewed for impairment annually or more frequently if circumstances indicate potential impairment, through a comparison of fair value to the carrying amount. In evaluating the recoverability of goodwill, we perform an annual goodwill impairment analysis based on a review of qualitative factors to determine if events and circumstances exist which will lead to a determination that the fair value is greater than its carrying value, prior to performing a full fair-value assessment we complete a goodwill impairment analysis on an annual basis unless circumstances require a more frequent review. During the period from October 16, 2013 through December 31, 2013, management has determined that there were no events or circumstances which indicated that the carrying value exceeded the fair value.
(i) Accounts Payable
The carrying amounts reported in the combined balance sheets for accounts payable approximate their fair value.
(j) Revenue Recognition
The following describes our primary types of revenues and our revenue recognition policies as they pertain to the types of transactions we enter into with our customers.
Our principal lines of business relate to software and title plant services. Under a software related contract, we determine the appropriate units of accounting and how the arrangement consideration should be measured and allocated to the separate units. This determination, as well as management’s ability to establish vendor specific objective evidence (“VSOE”) for the individual deliverables, can impact both the amount and the timing of revenue recognition under these agreements. The inability to establish VSOE for each contract deliverable results in having to record deferred revenues and/or applying the residual method. For arrangements where we determine VSOE for software maintenance using a stated renewal rate within the contract, we use judgment to determine whether the renewal rate represents fair value for that element as if it had been sold on a stand-alone basis. For a small percentage of revenues, we use contract accounting when the arrangement with the customer includes
F-74
Table of Contents
BLACK KNIGHT FINANCIAL SERVICES, LLC
Notes to Combined Financial Statements
As of December 31, 2013 and for the period from October 16, 2013 through December 31, 2013 (continued)
significant customization, modification, or production of software. For elements accounted for under contract accounting, revenue is recognized using the percentage-of-completion method since reasonably dependable estimates of revenues and contract hours applicable to various elements of a contract can be made. Title plant service fees are recognized when the services are provided.
(k) Personnel Cost and Other Operating Expenses
Personnel costs include payroll, employee benefits, occupancy and other costs associated with our personnel. Other operating expenses also include supplies and postage costs, depreciation, and amortization.
(l) Income Taxes
The Company is a single-member LLC for the period from October 16, 2013 through December 31, 2013 and is treated as a partnership for accounting purposes. Commerce Velocity and Property Insight are both disregarded entities for federal and state income tax purposes.
In recent tax years prior to the acquisition, the companies were in a taxable loss position, and they were not projected to be in an income position in the future. Therefore, if the Company were a separate tax-paying entity, no tax benefit would be recognized for the period. On a consolidated level, no federal or state income tax expense or deferred income taxes will be reported for the period.
Several states impose taxes or fees on partnerships and disregarded LLCs at the entity level, based upon apportioned net worth/equity within the state, a fixed or tiered fee structure, or other methods. The Company will incur minimal state and local income tax and franchise tax expense which will be recorded as tax expense when paid.
(m) Recent Accounting Pronouncements
In May 2014, the Financial Accounting Standards Board (the “FASB”) issued Accounting Standards Update (“ASU”) No. 2014-09, Revenue from Contracts with Customers (Topic 606). This ASU provides a new comprehensive revenue recognition model that requires companies to recognize revenue to depict the transfer of goods or services to a customer at an amount that reflects the consideration it expects to receive in exchange for those goods or services. This update also requires additional disclosure about the nature, amount, timing and uncertainty of revenue and cash flows arising from customer contracts. This update permits the use of either the retrospective or cumulative effect transition method. This update is effective for annual and interim periods beginning on or after December 15, 2016, with early application not permitted. We are evaluating the effect this new guidance will have on our combined financial statements and related disclosures. We have not yet selected a transition method nor have we determined the effect of the standard on our ongoing financial reporting.
In April 2014, the FASB issued ASU No. 2014-08, Presentation of Financial Statements (Topic 205) and Property, Plant, and Equipment (Topic 360): Reporting Discontinued Operations and Disclosures of Disposals of Components of an Entity. This ASU raises the threshold for a disposal to qualify as a discontinued operation and requires new disclosures of both discontinued operations and certain other disposals that do not meet the definition of a discontinued operation. This ASU is effective for annual periods beginning after December 15, 2014, and interim periods within annual periods beginning on or after December 15, 2015, with early adoption permitted.
F-75
Table of Contents
BLACK KNIGHT FINANCIAL SERVICES, LLC
Notes to Combined Financial Statements
As of December 31, 2013 and for the period from October 16, 2013 through December 31, 2013 (continued)
(4) Transactions with Related Parties
Property Insight has historically conducted business with FNF and operated with FNF in an arrangement under which we provide title production services to FNF affiliates. Additionally, as a combined company, we receive certain corporate support services from FNF and lease certain assets from them.
A summary of the arrangements that were in effect with FNF for the time period October 16, 2013 through December 31, 2013, is as follows:
| • | Title plant access and title production services. Under these arrangements, we obtain access to FNF’s title plants for real property located in various states, including access to their online databases, physical access to title records, use of space, image system use, and use of special software, as well as other title production services. For the title plant access, we pay monthly fees (subject to certain minimum charges) based on the number of title reports or products ordered and other services received. For the title production services provided to FNF affiliates, we charge for services based on the number of properties searched, subject to certain minimum use. Amounts charged to and from FNF are at cost. As a result of related party title plant access and title production services provided to and from FNF, we recorded revenues of $7,792 thousand and expenses of $210 thousand for the period from October 16, 2013 through December 31, 2013. |
| • | Corporate support services including data processing, software development, and real estate lease and equipment lease agreements. We have received certain administrative corporate support services and referral fees from FNF. We also have received data processing services and software development services from FNF including infrastructure support and data center management. The pricing of these services is at cost. We have incurred certain expenses relating to leases of certain equipment from FNF and the sublease of certain office space, furniture and furnishings from FNF. As a result of corporate support services and real estate lease and equipment lease agreements, we recorded expenses of approximately $2,609 thousand for the period from October 16, 2013 through December 31, 2013. |
| • | FNF provides certain services for its subsidiaries, including payroll, employee benefits, and procurement. Direct expenses incurred by BKFS for these services and intercompany expense allocation such as shared allocations are recorded in the BKFS payroll and other operating expenses accounts on the statement of operations. As a result of these services, we recorded expenses of approximately $876 thousand for the period from October 16, 2013 through December 31, 2013. |
We believe the amounts we earned or were charged under each of the foregoing arrangements are fair and reasonable. However, the amounts we earned or were charged under these arrangements were not negotiated at arm’s-length, and may not represent the terms that we might have obtained from an unrelated third party.
Amounts due to and from FNF related to the services described above are captured in a non-interest bearing related party receivable (payable) account and are settled with FNF monthly. The related party payable account had a balance of $12,687 thousand as of December 31, 2013. Subsequent to December 31, 2013, and in connection with the Reorganization, the net related party balance was forgiven by FNF as a contribution from parent.
F-76
Table of Contents
BLACK KNIGHT FINANCIAL SERVICES, LLC
Notes to Combined Financial Statements
As of December 31, 2013 and for the period from October 16, 2013 through December 31, 2013 (continued)
(5) Property and Equipment, net
Property and equipment as of December 31, 2013 consists of the following (in thousands):
| Leasehold improvements |
$ | 1,150 | ||
| Furniture and equipment |
1,401 | |||
|
|
|
|||
| Property and equipment |
2,551 | |||
| Accumulated Depreciation |
(2,068 | ) | ||
|
|
|
|||
| Property and equipment, net of depreciation |
$ | 483 | ||
|
|
|
Depreciation expense on property and equipment amounted to $34 thousand for the period from October 16, 2013 through December 31, 2013.
(6) Computer Software, net
Computer software as of December 31, 2013 consists of the following (in thousands):
| Total computer software |
$ | 29,843 | ||
| Accumulated amortization |
(13,854 | ) | ||
|
|
|
|||
| Computer software, net of accumulated amortization |
$ | 15,989 | ||
|
|
|
Amortization expense for computer software was $622 thousand for the period from October 16, 2013 through December 31, 2013.
(7) Intangible Assets, net
Intangible assets, as of December 31, 2013 consists of the following (in thousands):
| Customer relationships |
$ | 20,109 | ||
| Tradenames |
423 | |||
| Other |
690 | |||
|
|
|
|||
| Total intangible assets |
21,222 | |||
| Accumulated amortization |
(16,470 | ) | ||
|
|
|
|||
| Intangible assets, net of accumulated amortization |
$ | 4,752 | ||
|
|
|
Amortization expense for intangible assets with definite lives was $402 for the period from October 16, 2013 through December 31, 2013. Estimated amortization expense for the next five years is $1,549 thousand for 2014, $1,183 thousand for 2015, $805 thousand for 2016, $427 thousand for 2017 and $166 thousand for 2018.
(8) Commitments and Contingencies
(a) Litigation
From time to time we may be involved in various pending and threatened litigation matters related to our operations, some of which include claims for punitive or exemplary damages. Often, these matters do not include a specific statement as to the dollar amount of damages demanded. Instead, they include a demand in an amount to be proved at trial. For these reasons, it is often not possible to make a meaningful estimate of the amount or range of loss that could result from these matters. Accordingly, we review matters on an ongoing basis and follow generally accepted accounting principles on accounting for contingencies when making accrual and disclosure decisions. When assessing
F-77
Table of Contents
BLACK KNIGHT FINANCIAL SERVICES, LLC
Notes to Combined Financial Statements
As of December 31, 2013 and for the period from October 16, 2013 through December 31, 2013 (continued)
reasonably possible and probable outcomes, we base our decision on our assessment of the ultimate outcome following all appeals. For legal proceedings where it has been determined that a loss is both probable and reasonably estimable, a liability based on known facts and which represents our best estimate will be recorded. None of the amounts recorded as of December 31, 2013 is considered to be individually or in the aggregate material to our financial condition. As of December 31, 2013, we do not believe that the ultimate resolution of currently pending legal proceedings, either individually or in the aggregate, will have a material adverse effect on our financial condition, results of operations or cash flows. We intend to vigorously defend all litigation matters that are brought against us.
(b) Leases
We lease certain of our property under operating leases which expire at various dates. Several of these agreements include escalation clauses and provide for purchases and renewal options for periods ranging from one to five years.
Future minimum operating lease payments for leases with remaining terms greater than one year for each of the years in the five years and thereafter are as follows (in thousands):
| 2014 |
$ | 2,165 | ||
| 2015 |
2,017 | |||
| 2016 |
1,849 | |||
| 2017 |
1,303 | |||
| 2018 |
45 | |||
| Thereafter |
11 | |||
|
|
|
|||
| Total |
$ | 7,390 | ||
|
|
|
Rent expense incurred under all operating leases during the period from October 16, 2013 through December 31, 2013 was $934 thousand. Included in rent expense for the period from October 16, 2013 through December 31, 2013 is $369 thousand of amounts paid to affiliates.
(c) Off-Balance Sheet Arrangements
We do not have any material off-balance sheet arrangements other than operating leases described above.
(9) Employee Benefit Plans
Stock Purchase Plan
Our employees participate in the FNF Employee Stock Purchase Plan (ESPP). Under the terms of the ESPP Plan, eligible employees may voluntarily purchase, at current market prices, shares of common stock through payroll deductions. Pursuant to the ESPP Plan, employees may contribute an amount between 3% and 15% of their base salary and certain commissions. Shares purchased are allocated to employees, based upon their contributions. We contribute varying matching amounts as specified in the ESPP Plan. We recorded an allocated expense of $55 thousand for the period from October 16, 2013 through December 31, 2014 relating to the participation of our employees in the ESPP Plan.
401(k) Profit Sharing Plan
Our employees participate in a qualified 401(k) plan sponsored by FNF. Under the terms of the plan eligible employees may contribute up to 40% of their pretax annual compensation, up to the amount allowed pursuant to the Internal Revenue Code. Beginning in 2012, we initiated an employer match on
F-78
Table of Contents
BLACK KNIGHT FINANCIAL SERVICES, LLC
Notes to Combined Financial Statements
As of December 31, 2013 and for the period from October 16, 2013 through December 31, 2013 (continued)
the 401(k) plan whereby we matched $0.25 on each $1.00 contributed up to the first 6% of eligible earnings contributed to the Plan. The total match for the period from October 16, 2013 through December 31, 2013 was $97 thousand. The employer match was credited to the FNF Stock Fund, in the FNF 401(k) Plan.
(10) Concentration of Risk
Financial instruments that potentially subject us to concentrations of credit risk consist primarily of cash equivalents and trade receivables. We place cash equivalents and short-term investments with high credit quality financial institutions and, by policy, limit the amount of credit exposure with any one financial institution. Investments in commercial paper of industrial firms and financial institutions are rated investment grade by nationally recognized rating agencies.
Property Insight generates the majority of its revenue from FNF, which accounted for approximately 55% of total revenue in the period from October 16, 2013 through December 31, 2013. Property Insight generates approximately 62% of its revenue in California.
(11) Subsequent Events
The Company considers events or transactions that occur after the date of the balance sheet, but before the financial statements are issued, to provide additional evidence relative to certain estimates or to identify matters that require additional disclosure. Subsequent events have been evaluated through December 23, 2014, the date that these financial statements were available to be issued. The Company has concluded that there were no material subsequent events, other than those that have been disclosed in the notes.
F-79
Table of Contents
Report of Independent Registered Public Accounting Firm
The Board of Managers and Members
Black Knight Financial Services, LLC:
We have audited the accompanying balance sheet of Black Knight Financial Services, Inc. (the “Company”) as of October 27, 2014 (date of inception) (the financial statement). This financial statement is the responsibility of the Company’s management. Our responsibility is to express an opinion on this financial statement based on our audit.
We conducted our audit in accordance with the standards of the Public Company Accounting Oversight Board (United States). Those standards require that we plan and perform the audit to obtain reasonable assurance about whether the financial statement is free of material misstatement. An audit includes examining, on a test basis, evidence supporting the amounts and disclosures in the financial statement. An audit also includes assessing the accounting principles used and significant estimates made by management, as well as evaluating the overall financial statement presentation. We believe that our audit provides a reasonable basis for our opinion.
In our opinion, the financial statement referred to above presents fairly, in all material respects, the financial position of Black Knight Financial Services, Inc. as of October 27, 2014 (date of inception), in conformity with U.S. generally accepted accounting principles.
/s/ KPMG LLP
December 23, 2014
Jacksonville, Florida
Certified Public Accountants
F-80
Table of Contents
BLACK KNIGHT FINANCIAL SERVICES, INC.
As of October 27, 2014
| Total assets |
$ | — | ||
|
|
|
|||
| Total liabilities |
$ | — | ||
| Stockholder’s equity: |
||||
| Class A common stock, $0.0001 par value, authorized 1,000 shares and none outstanding as of October 27, 2014 |
— | |||
| Additional paid-in capital |
— | |||
| Retained earnings |
— | |||
|
|
|
|||
| Total stockholder’s equity |
— | |||
|
|
|
|||
| Total liabilities and stockholder’s equity |
$ | — | ||
|
|
|
See accompanying notes to financial statement.
F-81
Table of Contents
BLACK KNIGHT FINANCIAL SERVICES, INC.
As of October 27, 2014
The information in this financial statement of Black Knight Financial Services, Inc., (“BKFS, Inc.,” the “Company” or the “Issuer”) includes the assets and liabilities of BKFS, Inc., a shell company formed on October 27, 2014 for the purpose of completing an offering of Class A common stock of BKFS, Inc. (the “Offering”).
| (1) | Description of the Business |
BKFS, Inc., was incorporated in the State of Delaware on October 27, 2014 for the purpose of the Offering and to date has engaged only in activities in contemplation of this offering. Prior to the completion of this offering, all of the business operations of BKFS, Inc. as the new public company will have been conducted through Black Knight Financial Services, LLC and its subsidiaries (“BKFS, LLC”). Both BKFS, Inc. and BKFS, LLC are majority owned subsidiaries of Fidelity National Financial, Inc.
BKFS, LLC provides integrated technology, workflow automation and data and analytics to the mortgage industry. The Company’s solutions facilitate and automate many of the mission-critical business processes across every stage of the mortgage loan life cycle, from origination to asset disposition.
| (2) | Principles of Consolidation and Basis of Presentation |
Prior to the Offering, the Company will enter into a corporate reorganization whereby holders of membership interests of BKFS, LLC will become stockholders of BKFS, Inc. (the “Corporate Reorganization”). As of October 27, 2014 and prior to the Corporate Reorganization and the Offering, BKFS, Inc. will have no assets or liabilities and will not engage in any operations. BKFS, Inc. remitted a nominal amount to the State of Delaware as the cost of incorporation.
| (3) | Commitments and Contingencies |
In the future, the Company may be involved in various litigation matters related to its operations. The Company will review matters on an ongoing basis and follow U.S. generally accepted accounting principles on accounting for contingencies when making accrual and disclosure decisions. When assessing reasonably possible and probable outcomes, the Company will base its decisions on its assessment of the ultimate outcome following all appeals. For legal proceedings where it has been determined that a loss is both probable and reasonably estimable, a liability based on known facts and which represents our best estimate will be recorded. There were no outstanding legal contingencies as of October 27, 2014.
| (4) | Subsequent Events |
The Company considers events or transactions that occur after the date of the balance sheet, but before the financial statement is issued, to provide additional evidence relative to certain matters that require additional disclosure. Subsequent events have been evaluated through December 23, 2014, the date that this financial statement was available to be issued. The Company has concluded that there were no material subsequent events to be disclosed in the notes.
F-82
Table of Contents
Shares
BLACK KNIGHT FINANCIAL SERVICES, INC.
Class A Common Stock
PRELIMINARY PROSPECTUS
Through and including , 2015 (25 days after the date of this prospectus), all dealers that effect transactions in these securities, whether or not participating in this offering, may be required to deliver a prospectus. This delivery requirement is in addition to the dealers’ obligation to deliver a prospectus when acting as underwriter and with respect to their unsold allotments or subscriptions.
, 2015
Table of Contents
PART II—INFORMATION NOT REQUIRED IN PROSPECTUS
| Item 13. | Other Expenses of Issuance and Distribution. |
The following table sets forth all costs and expenses, other than the underwriting discount, paid or payable by us in connection with the sale of the Class A common stock being registered. All amounts shown are estimates except for the SEC registration fee, the FINRA filing fee and the listing fee for the NYSE.
| Amount Paid or to be Paid |
||||
| SEC registration fee |
$ | 11,620 | ||
| FINRA filing fee |
* | |||
| NYSE listing fee |
* | |||
| Blue sky qualification fees and expenses |
* | |||
| Printing and engraving expenses |
* | |||
| Legal fees and expenses |
* | |||
| Accounting fees and expenses |
* | |||
| Transfer agent and registrar fees and expenses |
* | |||
| Miscellaneous expenses |
* | |||
|
|
|
|||
| Total |
$ | * | ||
|
|
|
|||
| * | To be provided by amendment |
| Item 14. | Indemnification of Officers and Directors. |
The Registrant is governed by the Delaware General Corporation Law, or DGCL. Section 145 of the DGCL provides that a corporation may indemnify any person, including an officer or director, who was or is, or is threatened to be made, a party to any threatened, pending or completed legal action, suit or proceeding, whether civil, criminal, administrative or investigative (other than an action by or in the right of such corporation), by reason of the fact that such person was or is an officer, director, employee or agent of such corporation or is or was serving at the request of such corporation as a director, officer, employee or agent of another corporation or enterprise. The indemnity may include expenses (including attorneys’ fees), judgments, fines and amounts paid in settlement actually and reasonably incurred by such person in connection with such action, suit or proceeding, provided such officer, director, employee or agent acted in good faith and in a manner such person reasonably believed to be in, or not opposed to, the corporation’s best interest and, for criminal proceedings, had no reasonable cause to believe that such person’s conduct was unlawful. A Delaware corporation may indemnify any person, including an officer or director, who was or is, or is threatened to be made, a party to any threatened, pending or contemplated action or suit by or in the right of such corporation, under the same conditions, except that such indemnification is limited to expenses (including attorneys’ fees) actually and reasonably incurred by such person, and except that no indemnification is permitted without judicial approval if such person is adjudged to be liable to such corporation. Where an officer or director of a corporation is successful, on the merits or otherwise, in the defense of any action, suit or proceeding referred to above, or any claim, issue or matter therein, the corporation must indemnify that person against the expenses (including attorneys’ fees) which such officer or director actually and reasonably incurred in connection therewith.
The Registrant’s amended and restated bylaws will authorize the indemnification of its officers and directors, consistent with Section 145 of the DGCL, as amended. The Registrant intends to enter into indemnification agreements with each of its directors and executive officers. These agreements, among other things, will require the Registrant to indemnify each director and executive officer to the fullest extent permitted by Delaware law, including indemnification of expenses such as attorneys’ fees, judgments, fines and settlement amounts incurred by the director or executive officer in any action or proceeding, including any action or proceeding by or in right of the Registrant, arising out of the person’s services as a director or executive officer.
II-1
Table of Contents
Reference is made to Section 102(b)(7) of the DGCL, which enables a corporation in its original certificate of incorporation or an amendment thereto to eliminate or limit the personal liability of a director for violations of the director’s fiduciary duty, except (i) for any breach of the director’s duty of loyalty to the corporation or its stockholders, (ii) for acts or omissions not in good faith or which involve intentional misconduct or a knowing violation of law, (iii) pursuant to Section 174 of the DGCL, which provides for liability of directors for unlawful payments of dividends of unlawful stock purchase or redemptions or (iv) for any transaction from which a director derived an improper personal benefit.
The Registrant expects to maintain standard policies of insurance that provide coverage (i) to its directors and officers against loss rising from claims made by reason of breach of duty or other wrongful act and (ii) to the Registrant with respect to indemnification payments that it may make to such directors and officers.
The proposed form of Underwriting Agreement to be filed as Exhibit 1.1 to this Registration Statement provides for indemnification to the Registrant’s directors and officers by the underwriters against certain liabilities.
| Item 15. | Recent Sales of Unregistered Securities |
The following sets forth information regarding all unregistered securities sold by us since our formation on October 27, 2014:
On October 27, 2014, in connection with its formation, the Registrant sold 1,000 shares of its common stock to Fidelity National Financial, Inc. for an initial contribution of $100. The issuance of these securities was deemed to be exempt from registration in reliance on Rule 4(a)(2) of the Securities Act.
| Item 16. | Exhibits |
(a) Exhibits:
| Exhibit |
Description | |
| 1.1* | Form of Underwriting Agreement | |
| 3.1 | Certificate of Incorporation of Black Knight Financial Services, Inc., as currently in effect | |
| 3.2 | Amended and Restated Bylaws of Black Knight Financial Services, Inc., as currently in effect | |
| 3.3* | Form of Amended and Restated Certificate of Incorporation of Black Knight Financial Services, Inc. to be in effect prior to the consummation of the offering made under this Registration Statement. | |
| 3.4* | Form of Amended and Restated Bylaws of Black Knight Financial Services, Inc. to be in effect prior to the consummation of the offering made under this Registration Statement. | |
| 4.1* | Form of Certificate of Class A common stock | |
| 4.2* | Form of Registration Rights Agreement | |
| 4.3 | Indenture between Lender Processing Services, Inc., dated October 12, 2012, the guarantors party thereto and U.S. Bank National Association, as Trustee, relating to the 5.75% Senior Notes due 2023 | |
| 4.4 | Supplemental Indenture, dated as of January 2, 2014, by and among Lender Processing Services, Inc., Black Knight Lending Solutions, Inc., Fidelity National Financial Inc. and U.S. Bank National Association, as Trustee, relating to the 5.75% Senior Notes due 2023 | |
| 4.5 | Second Supplemental Indenture, dated as of February 7, 2014, by and among Black Knight InfoServ, LLC, Black Knight Lending Solutions, Inc. and U.S. Bank National Association, as Trustee, relating to the 5.75% Senior Notes due 2023 | |
II-2
Table of Contents
| Exhibit |
Description | |
| 5.1* | Opinion of Weil, Gotshal & Manges, LLP | |
| 10.1* | Form of Amended and Restated Limited Liability Company Agreement of Black Knight Financial Services, LLC | |
| 10.2* | Form of Tax Receivable Agreement | |
| 10.3* | Form of Indemnification Agreement | |
| 10.4* | Form of Advancement Agreement | |
| 10.5 | Mirror Note, dated January 2, 2014, from Black Knight Financial Services, Inc. (which has subsequently been renamed Black Knight Holdings, Inc.) in favor of Fidelity National Financial, Inc. | |
| 10.6 | Assumption Agreement, dated January 3, 2014, by and among Black Knight Financial Services, Inc. (which has subsequently been renamed Black Knight Holdings, Inc.), Black Knight Financial Services I, LLC (which has been subsequently renamed Black Knight Financial Services, LLC) and Fidelity National Financial, Inc. | |
| 10.7 | Amended and Restated Intercompany Note, dated May 30, 2014, from Black Knight Financial Services, LLC in favor of Fidelity National Financial, Inc. | |
| 10.8 | Amended and Restated Intercompany Note, dated May 30, 2014, from Black Knight Financial Services, LLC and ServiceLink Holdings, LLC in favor of Fidelity National Financial, Inc. | |
| 10.9* | Employment Agreement by and between William Foley and BKFS I Management, Inc. dated January 10, 2014 | |
| 10.10* | Amended and Restated Employment Agreement by and between Thomas J. Sanzone and BKFS I Management, Inc. dated January 3, 2014 | |
| 10.11* | Amended and Restated Employment Agreement by and between Kirk Larsen and BKFS I Management, Inc. dated January 3, 2014 | |
| 10.12 | Black Knight Financial Services, LLC Incentive Plan dated January 1, 2014 | |
| 10.13 | 2013 Management Incentive Plan | |
| 21.1 | List of subsidiaries | |
| 23.1 | Consent of KPMG LLP | |
| 23.2* | Consent of Weil, Gotshal & Manges, LLP (included in Exhibit 5.1) | |
| 24.1 | Power of Attorney (included on signature page) | |
| * | To be filed by amendment. |
Item 17. Undertakings
The undersigned registrant hereby undertakes to provide to the underwriters at the closing specified in the underwriting agreements, certificates in such denominations and registered in such names as required by the underwriters to permit prompt delivery to each purchaser.
Insofar as indemnification for liabilities arising under the Securities Act may be permitted to directors, officers and controlling persons of the registrant pursuant to the provisions referenced in Item 14 of this registration
II-3
Table of Contents
statement, or otherwise, the registrant has been advised that in the opinion of the SEC such indemnification is against public policy as expressed in the Securities Act and is, therefore, unenforceable. In the event that a claim for indemnification against such liabilities (other than the payment by the registrant of expenses incurred or paid by a director, officer, or controlling person of the registrant in the successful defense of any action, suit or proceeding) is asserted by such director, officer or controlling person in connection with the securities being registered hereunder, the registrant will, unless in the opinion of its counsel the matter has been settled by controlling precedent, submit to a court of appropriate jurisdiction the question of whether such indemnification by it is against public policy as expressed in the Securities Act and will be governed by the final adjudication of such issue.
The undersigned registrant hereby undertakes that:
| (1) | For purposes of determining any liability under the Securities Act, the information omitted from the form of prospectus filed as part of this registration statement in reliance upon Rule 430A and contained in a form of prospectus filed by the registrant pursuant to Rule 424(b)(1) or (4) or 497(h) under the Securities Act shall be deemed to be part of this registration statement as of the time it was declared effective. |
| (2) | For the purpose of determining any liability under the Securities Act, each post-effective amendment that contains a form of prospectus shall be deemed to be a new registration statement relating to the securities offered therein, and the offering of such securities at that time shall be deemed to be the initial bona fide offering thereof. |
II-4
Table of Contents
SIGNATURES
Pursuant to the requirements of the Securities Act of 1933, the registrant has duly caused this registration statement to be signed on its behalf by the undersigned, thereunto duly authorized in the City of Jacksonville, State of Florida, on December 23, 2014.
| BLACK KNIGHT FINANCIAL SERVICES, INC. | ||
| By: | /s/ Michael L. Gravelle | |
| Name: | Michael L. Gravelle | |
| Title: | Executive Vice President, General Counsel and Corporate Secretary | |
POWER OF ATTORNEY
KNOW ALL MEN BY THESE PRESENTS, that each of the undersigned constitutes and appoints each of Michael L. Gravelle and Kirk T. Larsen, or any of them, each acting alone, his true and lawful attorney-in-fact and agent, with full power of substitution and resubstitution, for such person and in his name, place and stead, in any and all capacities, to sign this Registration Statement on Form S-1 (including all pre-effective and post-effective amendments and registration statements filed pursuant to Rule 462(b) under the Securities Act of 1933), and to file the same, with all exhibits thereto, and other documents in connection therewith, with the SEC, granting unto said attorneys-in-fact and agents, each acting alone, full power and authority to do and perform each and every act and thing requisite and necessary to be done in and about the premises, as fully to all intents and purposes as he might or could do in person, hereby ratifying and confirming that any such attorney-in-fact and agent, or his substitute or substitutes, may lawfully do or cause to be done by virtue hereof.
Pursuant to the requirements of the Securities Act of 1933, this registration statement has been signed by the following persons in the capacities indicated on December 23, 2014.
| Signature |
Title | |
| /s/ William P. Foley, II William P. Foley, II |
Executive Chairman | |
| /s/ Thomas J. Sanzone Thomas J. Sanzone |
President and Chief Executive Officer (Principal Executive Officer) | |
| /s/ Kirk T. Larsen Kirk T. Larsen |
Executive Vice President and Chief Financial Officer (Principal Financial Officer and Principal Accounting Officer) | |
| /s/ Thomas M. Hagerty Thomas M. Hagerty |
Director | |
| /s/ David K. Hunt David K. Hunt |
Director | |
| /s/ Richard N. Massey Richard N. Massey |
Director | |
II-5
Table of Contents
| Signature |
Title | |
| /s/ Ganesh B. Rao Ganesh B. Rao |
Director | |
| /s/ John D. Rood John D. Rood |
Director | |
| /s/ Cary H. Thompson Cary H. Thompson |
Director | |
II-6
Table of Contents
EXHIBIT INDEX
| Exhibit No. |
Description | |
| 1.1* | Form of Underwriting Agreement | |
| 3.1 | Certificate of Incorporation of Black Knight Financial Services, Inc., as currently in effect | |
| 3.2 | Amended and Restated Bylaws of Black Knight Financial Services, Inc., as currently in effect | |
| 3.3* | Form of Amended and Restated Certificate of Incorporation of Black Knight Financial Services, Inc. to be in effect prior to the consummation of the offering made under this Registration Statement. | |
| 3.4* | Form of Amended and Restated Bylaws of Black Knight Financial Services, Inc. to be in effect prior to the consummation of the offering made under this Registration Statement. | |
| 4.1* | Form of Certificate of Class A common stock | |
| 4.2* | Form of Registration Rights Agreement | |
| 4.3 | Indenture between Lender Processing Services, Inc., dated October 12, 2012, the guarantors party thereto and U.S. Bank National Association, as Trustee, relating to the 5.75% Senior Notes due 2023 | |
| 4.4 | Supplemental Indenture, dated as of January 2, 2014, by and among Lender Processing Services, Inc., Black Knight Lending Solutions, Inc., Fidelity National Financial Inc. and U.S. Bank National Association, as Trustee, relating to the 5.75% Senior Notes due 2023 | |
| 4.5 | Second Supplemental Indenture, dated as of February 7, 2014, by and among Black Knight InfoServ, LLC, Black Knight Lending Solutions, Inc. and U.S. Bank National Association, as Trustee, relating to the 5.75% Senior Notes due 2023 | |
| 5.1* | Opinion of Weil, Gotshal & Manges, LLP | |
| 10.1* | Form of Amended and Restated Limited Liability Company Agreement of Black Knight Financial Services, LLC | |
| 10.2* | Form of Tax Receivable Agreement | |
| 10.3* | Form of Indemnification Agreement | |
| 10.4* | Form of Advancement Agreement | |
| 10.5 | Mirror Note, dated January 2, 2014, from Black Knight Financial Services, Inc. (which has subsequently been renamed Black Knight Holdings, Inc.) in favor of Fidelity National Financial, Inc. | |
| 10.6 | Assumption Agreement, dated January 3, 2014, by and among Black Knight Financial Services, Inc. (which has subsequently been renamed Black Knight Holdings, Inc.), Black Knight Financial Services I, LLC (which has been subsequently renamed Black Knight Financial Services, LLC) and Fidelity National Financial, Inc. | |
| 10.7 | Amended and Restated Intercompany Note, dated May 30, 2014, from Black Knight Financial Services, LLC in favor of Fidelity National Financial, Inc. | |
| 10.8 | Amended and Restated Intercompany Note, dated May 30, 2014, from Black Knight Financial Services, LLC and ServiceLink Holdings, LLC in favor of Fidelity National Financial, Inc. | |
| 10.9* | Employment Agreement by and between William Foley and BKFS I Management, Inc. dated January 10, 2014 | |
II-7
Table of Contents
| Exhibit No. |
Description | |
| 10.10* | Amended and Restated Employment Agreement by and between Thomas J. Sanzone and BKFS I Management, Inc. dated January 3, 2014 | |
| 10.11* | Amended and Restated Employment Agreement by and between Kirk Larsen and BKFS I Management, Inc. dated January 3, 2014 | |
| 10.12 | Black Knight Financial Services, LLC Incentive Plan dated January 1, 2014 | |
| 10.13 | 2013 Management Incentive Plan | |
| 21.1 | List of subsidiaries | |
| 23.1 | Consent of KPMG LLP | |
| 23.2* | Consent of Weil, Gotshal & Manges, LLP (included in Exhibit 5.1) | |
| 24.1 | Power of Attorney (included on signature page) | |
| * | To be filed by amendment. |
II-8