Attached files
| file | filename |
|---|---|
| EX-23 - EXHIBIT 23.1 - OPTICAL CABLE CORP | ex23-1.htm |
| EX-31 - EXHIBIT 31.2 - OPTICAL CABLE CORP | ex31-2.htm |
| EX-21 - EXHIBIT 21.1 - OPTICAL CABLE CORP | ex21-1.htm |
| EX-32 - EXHIBIT 32.1 - OPTICAL CABLE CORP | ex32-1.htm |
| EXCEL - IDEA: XBRL DOCUMENT - OPTICAL CABLE CORP | Financial_Report.xls |
| 10-K - FORM 10-K - OPTICAL CABLE CORP | occ20141031_10k.htm |
| EX-32 - EXHIBIT 32.2 - OPTICAL CABLE CORP | ex32-2.htm |
| EX-31 - EXHIBIT 31.1 - OPTICAL CABLE CORP | ex31-1.htm |
Exhibit 13.1

|
TABLE OF CONTENTS | |
|
|
|
|
3 |
Selected Consolidated Financial Information |
|
|
|
|
4 |
Letter from the CEO |
|
|
|
|
7 |
Management’s Discussion and Analysis of Financial Condition and Results of Operations |
|
|
|
|
20 |
Consolidated Financial Statements |
|
|
|
|
24 |
Notes to Consolidated Financial Statements |
|
|
|
|
41 |
Report of Independent Registered Public Accounting Firm |
|
|
|
|
42 |
Corporate Information |
Page intentionally left blank.
Selected Consolidated Financial Information
(in thousands, except per share data)
|
Years ended October 31, |
||||||||||||||||||||
|
2014 |
2013 |
2012 |
2011 |
2010 |
||||||||||||||||
|
Consolidated Statement of Operations Information: |
||||||||||||||||||||
|
Net sales |
$ | 82,978 | $ | 75,266 | $ | 83,523 | $ | 73,339 | $ | 67,506 | ||||||||||
|
Cost of goods sold |
54,506 | 49,354 | 51,970 | 47,048 | 43,746 | |||||||||||||||
|
Gross profit |
28,472 | 25,912 | 31,553 | 26,291 | 23,760 | |||||||||||||||
|
Selling, general and administrative expenses |
26,989 | 24,996 | 27,300 | 25,169 | 24,268 | |||||||||||||||
|
Royalty (income) expense, net |
110 | 79 | (299 | ) | (783 | ) | (1,233 | ) | ||||||||||||
|
Amortization of intangible assets |
41 | 70 | 134 | 431 | 587 | |||||||||||||||
|
Impairment of goodwill |
― |
― |
― |
― |
5,580 | |||||||||||||||
|
Income (loss) from operations |
1,332 | 767 | 4,418 | 1,474 | (5,442 | ) | ||||||||||||||
|
Other expense, net: |
||||||||||||||||||||
|
Interest expense, net |
(414 | ) | (467 | ) | (550 | ) | (620 | ) | (542 | ) | ||||||||||
|
Other, net |
(28 | ) | (25 | ) | 16 | 1 | 65 | |||||||||||||
|
Income (loss) before income taxes |
890 | 275 | 3,884 | 855 | (5,919 | ) | ||||||||||||||
|
Income tax expense |
267 | 348 | 1,258 | 398 | 91 | |||||||||||||||
|
Net income (loss) |
$ | 623 | $ | (73 | ) | $ | 2,626 | $ | 457 | $ | (6,010 | ) | ||||||||
|
Net loss attributable to noncontrolling interest |
(61 | ) | (30 | ) | (123 | ) | (209 | ) | (277 | ) | ||||||||||
|
Net income (loss) attributable to OCC |
$ | 684 | $ | (43 | ) | $ | 2,749 | $ | 666 | $ | (5,733 | ) | ||||||||
|
Net income (loss) per share attributable to OCC |
$ | 0.10 | $ | (0.01 | ) | $ | 0.43 | $ | 0.11 | $ | (0.95 | ) | ||||||||
|
PROFORMA net loss attributable to OCC, EXCLUDING impairment of goodwill (1) |
$ | (153 | ) | |||||||||||||||||
|
PROFORMA net loss per share attributable to OCC, EXCLUDING impairment of goodwill: |
||||||||||||||||||||
|
Basic and diluted (1) |
$ | (0.03 | ) | |||||||||||||||||
|
Weighted average shares: |
||||||||||||||||||||
|
Basic and diluted |
6,764 | 5,785 | 6,456 | 6,305 | 6,015 | |||||||||||||||
|
Consolidated Balance Sheet Information: |
||||||||||||||||||||
|
Cash |
$ | 1,090 | $ | 750 | $ | 591 | $ | 1,092 | $ | 2,522 | ||||||||||
|
Working capital |
26,075 | 26,986 | 26,838 | 23,326 | 22,905 | |||||||||||||||
|
Total assets |
50,039 | 45,415 | 47,762 | 44,945 | 45,291 | |||||||||||||||
|
Bank debt |
9,997 | 10,256 | 9,003 | 8,191 | 9,069 | |||||||||||||||
|
Total shareholders’ equity attributable to OCC |
31,007 | 30,199 | 30,644 | 28,209 | 27,857 | |||||||||||||||
(1) Proforma net loss attributable to OCC and proforma net loss per share attributable to OCC are calculated by excluding the non-cash, non-recurring net impairment of goodwill charge of $5.6 million associated with the acquisition of Applied Optical Systems, Inc. ("AOS") that was recorded during fiscal year 2010 from the Company's net loss attributable to OCC as reported for the fiscal year ended October 31, 2010. There is no tax benefit associated with the goodwill impairment charge, as it is considered a non-deductible permanent item for tax purposes. Accordingly, there is no change to the tax expense as reported in the Consolidated Financial Statements for fiscal year 2010 in determining the proforma net loss and net loss per share.
Letter from the CEO
Dear Shareholders of Optical Cable Corporation:
Outstanding Growth and Performance
Optical Cable Corporation (OCC®) delivered outstanding growth and performance in fiscal year 2014, achieving 10.2% growth in net sales, 9.9% growth in gross profit, and a 26.1% increase in net cash provided by operating activities. We also delivered an impressive total investment return of 22.1% to OCC shareholders in fiscal 2014.
OCC’s key accomplishments during fiscal year 2014 included:
|
● |
Achieving record fourth quarter net sales: We increased net sales by 31.2% to $25.2 million in the fourth quarter compared to the same period last year. In fact, in the fourth quarter of fiscal 2014 we achieved the highest quarterly net sales in OCC’s history. |
|
● |
Driving double-digit increase in net sales: OCC finished fiscal year 2014 with consolidated net sales of $83.0 million—the second highest annual sales in OCC’s history and a 10.2% increase compared to fiscal year 2013. |
During the period from fiscal year 2009 to 2014, OCC increased net sales at a compound annual rate of 7.2% per year1—demonstrating a strong, positive sales trend.
|
● |
Increasing gross profit: OCC grew gross profit 9.9% to $28.5 million for fiscal year 2014, with gross profit margin (gross profit as a percentage of net sales) of 34.3%. |
|
● |
Increasing profitability: We achieved increased profitability during fiscal year 2014, reporting net income attributable to OCC of $0.10 per share. |
|
● |
Achieving double-digit increase in operating cash flow: OCC generated $4.4 million in net cash provided by operating activities in fiscal 2014—a 26.1% increase over 2013. This was a continuation of OCC’s strong record of generating annual positive cash provided by operating activities. |
|
● |
Delivering index-beating shareholder returns: Our shareholders realized a 22.1% total return on investment during fiscal year 2014, with the Company’s price per share increasing from $3.84 to $4.61 (from October 31, 2013 to October 31, 2014), plus dividends. This 22.1% return outperformed the Russell 2000® index, the Dow Jones Industrial Average and the S&P 500 index during the same period. |
|
● |
Continuing capital returns to shareholders: During fiscal year 2014, we continued to return capital to shareholders by repurchasing and retiring 44,464 shares of common stock, and declaring dividends of $0.08 per share, a 1.7% yield based on the closing price on October 31, 2014. |
Strong. Innovative. Solutions.™
OCC has created and continues to create a broad and growing suite of top-tier integrated connectivity and cabling solutions through product line expansions and innovative product designs—a key element of our long-term strategy.
Since 1983, OCC has been known for its industry-leading fiber optic expertise and innovative cable designs. Today, we are much more than a fiber optic cable company. Our customers and users depend on OCC for innovative copper and fiber optic connectivity and cabling solutions installed everywhere from buildings, campuses and datacenters to sporting venues, industrial facilities and harsh environments, including military applications.
Our new product development programs are aggressive. This past year, we launched a number of new products, including our passive optical LAN family of products, the industry’s first commercially available connector designed to meet the coming Category 8 (Cat8) copper connectivity and cabling industry standard, new fiber optic connectors designed for the harsh environments, and product line extensions of our MARS® deployable reels systems.
We believe our new products—both announced and under development—provide a foundation for future growth opportunities.
Looking Forward
As we enter 2015, OCC continues to be financially strong, and we are confident we have well positioned OCC for continued growth and success. Importantly, we believe our strong operating leverage provides an exceptional opportunity to increase shareholder value as we grow net sales.
We believe our new product development efforts, our investments in production capabilities, and the successful execution of our long-term strategies, are creating new market opportunities for OCC.
While we focus on growth, we also remain committed to operational excellence and cost control. At the end of the third quarter of fiscal year 2014, our reorganization initiative allowed us to begin realizing substantial cost savings. This effort positively impacted fourth quarter results, and we expect to see continued benefits in fiscal year 2015.
OCC’s leadership team remains committed to a strategy designed to create substantial long-term value for shareholders. Current employees and members of the Board of Directors own more than 34% of the outstanding shares of OCC as of October 31, 2014—squarely aligning the team’s interests with those of all shareholders.
Thank you for your trust, and the privilege of allowing us to lead your company.
I wish you and your family Happy Holidays, Merry Christmas, and a Happy New Year!
We look forward to a successful 2015!
|
|
/s/ Neil D. Wilkin, Jr. |
|
|
|
|
|
Neil D. Wilkin, Jr. |
|
|
Chairman of the Board, |
|
|
President and Chief Executive Officer |
|
|
|
|
|
December 19, 2014 |
1 Net sales for fiscal year 2009 were $58.6 million.
Management’s Discussion and Analysis of Financial Condition
and Results of Operations
Forward-Looking Information
This report may contain certain forward-looking information within the meaning of the federal securities laws. The forward-looking information may include, among other information, (i) statements concerning our outlook for the future, (ii) statements of belief, anticipation or expectation, (iii) future plans, strategies or anticipated events, and (iv) similar information and statements concerning matters that are not historical facts. Such forward-looking information is subject to known and unknown variables, uncertainties, contingencies and risks that may cause actual events or results to differ materially from our expectations, and such variables, uncertainties, contingencies and risks may also adversely affect Optical Cable Corporation and its subsidiaries (collectively, the “Company” or “OCC®”), the Company’s future results of operations and future financial condition, and/or the future equity value of the Company. Factors that could cause or contribute to such differences from our expectations or risks that could adversely affect the Company include, but are not limited to, the level of sales to key customers, including distributors; timing of certain projects and purchases by key customers; the economic conditions affecting network service providers; corporate and/or government spending on information technology; actions by competitors; fluctuations in the price of raw materials (including optical fiber, copper, gold and other precious metals, and plastics and other materials); fluctuations in transportation costs; our dependence on customized equipment for the manufacture of certain of our products in certain production facilities; our ability to protect our proprietary manufacturing technology; market conditions influencing prices or pricing; our dependence on a limited number of suppliers; the loss of or conflict with one or more key suppliers or customers; an adverse outcome in litigation, claims and other actions, and potential litigation, claims and other actions against us; an adverse outcome in regulatory reviews and audits and potential regulatory reviews and audits; adverse changes in state tax laws and/or positions taken by state taxing authorities affecting us; technological changes and introductions of new competing products; changes in end-user preferences for competing technologies, relative to our product offering; economic conditions that affect the telecommunications sector, the data communications sector, certain technology sectors and/or certain industry market sectors; economic conditions that affect certain geographic markets and/or the economy as a whole; changes in demand for our products from certain competitors for which we provide private label connectivity products; terrorist attacks or acts of war, and any current or potential future military conflicts; changes in the level of military spending or other spending by the United States government; ability to recruit and retain key personnel; poor labor relations; the impact of changes in accounting policies and related costs of compliance, including changes by the Securities and Exchange Commission (“SEC”), the Public Company Accounting Oversight Board (“PCAOB”), the Financial Accounting Standards Board (“FASB”), and/or the International Accounting Standards Board (“IASB”); our ability to continue to successfully comply with, and the cost of compliance with, the provisions of Section 404 of the Sarbanes-Oxley Act of 2002 or any revisions to that act which apply to us; the impact of changes and potential changes in federal laws and regulations adversely affecting our business and/or which result in increases in our direct and indirect costs, including our direct and indirect costs of compliance with such laws and regulations; the impact of the Patient Protection and Affordable Care Act of 2010, the Health Care and Education Reconciliation Act of 2010, and any revisions to those acts that apply to us and the related legislation and regulation associated with those acts, which directly or indirectly results in increases to our costs; the impact of changes in state or federal tax laws and regulations increasing our costs and/or impacting the net return to investors owning our shares; the impact of future consolidation among competitors and/or among customers adversely affecting our position with our customers and/or our market position; actions by customers adversely affecting us in reaction to the expansion of our product offering in any manner, including, but not limited to, by offering products that compete with our customers, and/or by entering into alliances with, making investments in or with, and/or acquiring parties that compete with and/or have conflicts with our customers; voluntary or involuntary delisting of the Company’s common stock from any exchange on which it is traded; the deregistration by the Company from SEC reporting requirements, as a result of the small number of holders of the Company’s common stock; adverse reactions by customers, vendors or other service providers to unsolicited proposals regarding the ownership or management of the Company; the additional costs of considering and possibly defending our position on such unsolicited proposals; impact of weather or natural disasters in the areas of the world in which we operate, market our products and/or acquire raw materials; an increase in the number of shares of the Company’s common stock issued and outstanding; economic downturns generally and/or in one or more of the markets in which we operate; changes in market demand, exchange rates, productivity, or market and economic conditions in the areas of the world in which we operate and market our products; and our success in managing the risks involved in the foregoing.
We caution readers that the foregoing list of important factors is not exclusive. Furthermore, we incorporate by reference those factors included in current reports on Form 8-K, and/or in our other filings.
Dollar amounts presented in the following discussion have been rounded to the nearest hundred thousand, except in the case of amounts less than one million and except in the case of the table set forth in the “Results of Operations” section, the amounts in which both cases have been rounded to the nearest thousand.
Overview of Optical Cable Corporation
Optical Cable Corporation (or OCC®) is a leading manufacturer of a broad range of fiber optic and copper data communication cabling and connectivity solutions primarily for the enterprise market (or non-carrier market), offering an integrated suite of high quality products which operate as a system solution or seamlessly integrate with other providers’ offerings. Our product offerings include designs for uses ranging from commercial, enterprise network, datacenter, residential and campus installations to customized products for specialty applications and harsh environments, including military, industrial, mining, petrochemical, wireless carrier and broadcast applications. Our products include fiber optic and copper cabling, fiber optic and copper connectors, specialty fiber optic and copper connectors, fiber optic and copper patch cords, pre-terminated fiber optic and copper cable assemblies, racks, cabinets, datacom enclosures, patch panels, face plates, multi-media boxes, fiber optic reels and accessories and other cable and connectivity management accessories, and are designed to meet the most demanding needs of end-users, delivering a high degree of reliability and outstanding performance characteristics.
OCC® is internationally recognized for pioneering the design and production of fiber optic cables for the most demanding military field applications, as well as of fiber optic cables suitable for both indoor and outdoor use, and creating a broad product offering built on the evolution of these fundamental technologies. OCC is also internationally recognized for its role in establishing copper connectivity data communications standards, through its innovative and patented technologies.
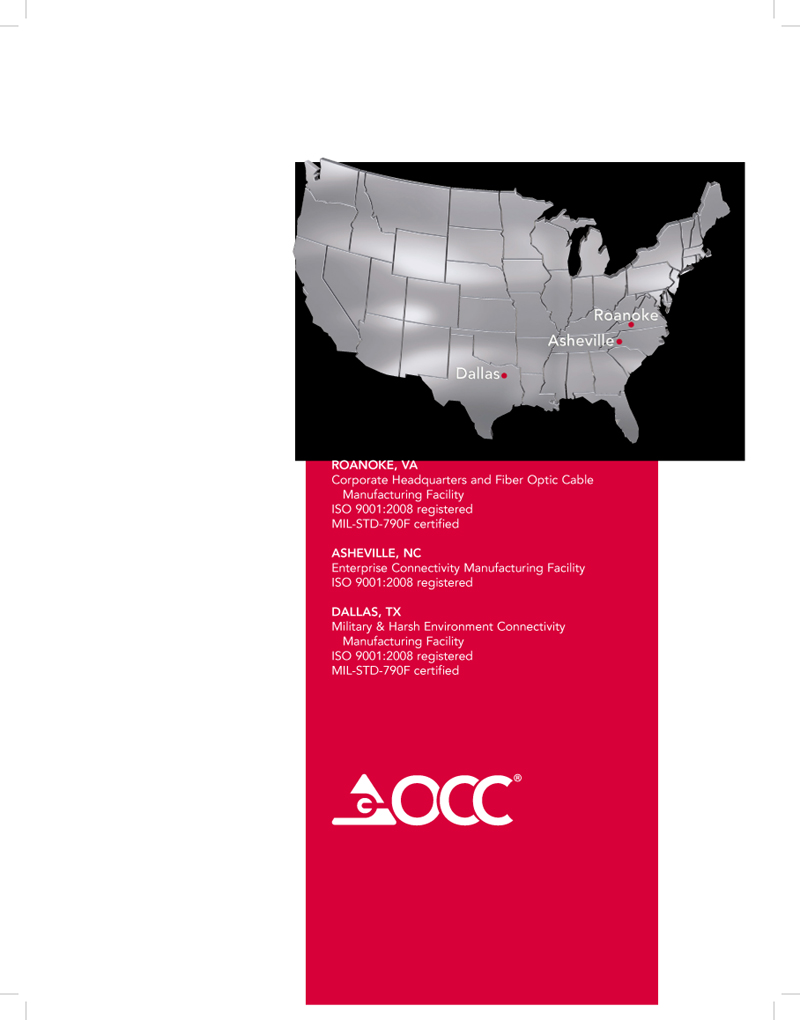
Founded in 1983, Optical Cable Corporation is headquartered in Roanoke, Virginia with offices, manufacturing and warehouse facilities located in Roanoke, Virginia, near Asheville, North Carolina and near Dallas, Texas. We primarily manufacture our fiber optic cables at our Roanoke facility which is ISO 9001:2008 registered and MIL-STD-790F certified, our enterprise connectivity products at our Asheville facility which is ISO 9001:2008 registered, and our military and harsh environment connectivity products and systems at our Dallas facility which is ISO 9001:2008 registered and MIL-STD-790F certified.
OCC designs, develops and manufactures fiber optic cables for a broad range of commercial and specialty markets and applications. We refer to these products as our fiber optic cable offering. OCC designs, develops and manufactures fiber and copper connectivity products for the commercial market, including a broad range of commercial and residential applications. We refer to these products as our enterprise connectivity product offering. OCC designs, develops and manufactures a broad range of specialty fiber optic connectors and connectivity solutions principally for use in military and other harsh environment applications. We refer to these products as our applied interconnect systems product offering.
We market and sell the products manufactured at our Dallas facility through our wholly owned subsidiary Applied Optical Systems, Inc. (“AOS”) under the names Optical Cable Corporation and OCC® by the efforts of our integrated OCC sales team.
Optical Cable Corporation owns 70% of the authorized membership interests of Centric Solutions LLC (“Centric Solutions”). Centric Solutions is a business founded in 2008 that provides turnkey cabling and connectivity solutions for the datacenter market. Centric Solutions operates and goes to market independently from Optical Cable Corporation; however, in some cases, Centric Solutions may offer products from OCC’s product offering.
Optical Cable Corporation, OCC®, Procyon®, Superior Modular Products, SMP Data Communications, Applied Optical Systems, and associated logos are trademarks of Optical Cable Corporation.
Summary of Company Performance for Fiscal Year 2014
|
● |
OCC had a strong finish to fiscal year 2014, with record quarterly consolidated net sales during the fourth quarter of fiscal 2014, which boosted OCC’s total fiscal year 2014 results. |
|
● |
OCC achieved net sales of $25.2 million during the fourth quarter, an increase of 31.2% compared to the fourth quarter of fiscal year 2013. |
|
● |
OCC finished fiscal year 2014 with consolidated net sales of $83.0 million— the second highest annual net sales in OCC’s history and a 10.2% increase compared to net sales of $75.3 million for fiscal year 2013. |
|
● |
Gross profit grew 9.9% to $28.5 million for fiscal year 2014 compared to $25.9 million for fiscal year 2013. Gross profit margin (gross profit as a percentage of net sales) was 34.3% for fiscal year 2014 compared to 34.4% for fiscal year 2013. |
|
● |
OCC reported net income attributable to OCC of $684,000, or $0.10 per share, during fiscal year 2014, compared to a net loss attributable to OCC of $43,000, or $0.01 per share, for fiscal year 2013. |
|
● |
OCC generated annual positive cash flow from operating activities again this year. Net cash provided by operating activities was $4.4 million in fiscal year 2014. |
|
● |
OCC returned a total of $741,000 to shareholders by declaring dividends and repurchasing OCC’s common stock during fiscal year 2014. |
|
o |
OCC declared quarterly cash dividends totaling $0.08 per share during fiscal year 2014, or $545,000, continuing the regular return of capital to shareholders initiated when we declared our first quarterly dividend in October 2010. |
|
o |
OCC repurchased and retired 44,464 shares of common stock during fiscal year 2014, returning $195,000 in capital to shareholders. |
|
● |
We achieved a 22.1% return during fiscal year 2014, with an increase in the price per share from $3.84 to $4.61 as of October 31, 2013 and 2014, respectively, and dividends of $0.08 per share. |
Results of Operations
We sell our products internationally and domestically through our sales force to our customers, which include major distributors, various regional and smaller distributors, original equipment manufacturers and value-added resellers. All of our sales to customers outside of the United States are denominated in U.S. dollars. We can experience fluctuations in the percentage of net sales to customers outside of the United States from period to period based on the timing of large orders, coupled with the impact of increases and decreases in sales to customers in various regions of the world.
Net sales consist of gross sales of products less discounts, refunds and returns. Revenue is recognized at the time of product shipment or delivery to the customer (including distributors) provided that the customer takes ownership and assumes risk of loss (based on shipping terms), collection of the relevant receivable is probable, persuasive evidence of an arrangement exists and the sales price is fixed or determinable. Our customers generally do not have the right of return unless a product is defective or damaged and is within the parameters of the product warranty in effect for the sale.
Cost of goods sold consists of the cost of materials, product warranty costs and compensation costs, and overhead and other costs related to our manufacturing operations. The largest percentage of costs included in cost of goods sold is attributable to costs of materials.
Our gross profit margin percentages are heavily dependent upon product mix on a quarterly basis and may vary based on changes in product mix. To the extent not negatively impacted by product mix, gross profit margins tend to be higher when we achieve higher net sales levels, as certain fixed manufacturing costs are spread over higher sales.
Selling, general and administrative expenses (“SG&A expenses”) consist of the compensation costs for sales and marketing personnel, shipping costs, trade show expenses, customer support expenses, travel expenses, advertising, bad debt expense, the compensation costs for administration and management personnel, legal, accounting, advisory and professional fees, costs incurred to settle litigation or claims and other actions against us, and other costs associated with our operations.
Royalty (income) expense, net consists of royalty and related expenses, net of royalty income earned, if any, on licenses associated with our patented products.
Amortization of intangible assets consists primarily of amortization of intellectual property and customer list acquired in the acquisition of AOS on October 31, 2009. For fiscal years prior to fiscal year 2014, amortization of intangible assets also included the amortization of developed technology acquired in the acquisition of Superior Modular Products Incorporated, doing business as SMP Data Communications (“SMP Data Communications” or “SMP”) on May 30, 2008 (these assets were fully amortized by the end of fiscal year 2013). Amortization of intangible assets is calculated using an accelerated method and the straight line method over the estimated useful lives of the intangible assets.
Other expense, net consists of interest expense and other miscellaneous income and expense items not directly attributable to our operations.
The following table sets forth and highlights fluctuations in selected line items from our consolidated statements of operations for the periods indicated:
|
Fiscal Years Ended |
Fiscal Years Ended |
|||||||||||||||||||||||
|
October 31, |
October 31, |
|||||||||||||||||||||||
|
Percent |
Percent |
|||||||||||||||||||||||
|
2014 |
2013 |
Change |
2013 |
2012 |
Change |
|||||||||||||||||||
|
Net sales |
$ | 83,000,000 | $ | 75,300,000 | 10.2 |
% |
$ | 75,300,000 | $ | 83,500,000 | (9.9 |
)% | ||||||||||||
|
Gross profit |
28,500,000 | 25,900,000 | 9.9 | 25,900,000 | 31,600,000 | (17.9 | ) | |||||||||||||||||
|
SG&A expenses |
27,000,000 | 25,000,000 | 8.0 | 25,000,000 | 27,300,000 | (8.4 | ) | |||||||||||||||||
|
Net income (loss) attributable to OCC |
684,000 | (43,000 | ) | 1,697.3 | (43,000 | ) | 2,700,000 | (101.6 | ) | |||||||||||||||
Net Sales
Consolidated net sales for fiscal 2014 were $83.0 million—the second highest annual net sales in our history. Net sales increased 10.2% in fiscal year 2014 compared to $75.3 million in fiscal year 2013. The increase in net sales when comparing fiscal years 2014 and 2013 is due primarily to the increase in net sales of our fiber optic cable products. We recognized net sales totaling approximately $14.0 million in fiscal year 2014 as the result of a number of large orders for one customer, compared to net sales of approximately $4.5 million in fiscal year 2013 for that customer.
OCC’s net sales decreased 9.9% to $75.3 million in fiscal year 2013, compared to $83.5 million in fiscal year 2012. The decrease in net sales was primarily the result of orders for two customers totaling approximately $14.9 million in fiscal year 2012 that did not recur at the same level in fiscal year 2013. Excluding the impact of sales to these two customers in fiscal year 2012, total net sales during fiscal year 2013 would have been substantially unchanged from fiscal year 2012.
Net sales to customers outside of the United States were 21%, 30% and 26% of total net sales for fiscal years 2014, 2013 and 2012, respectively. Net sales to customers in the United States increased 23.7% during fiscal year 2014 compared to fiscal year 2013, while net sales to customers outside of the United States decreased 21.6%.
We typically expect net sales to be relatively lower in the first half of each fiscal year and relatively higher in the second half of each fiscal year. We believe this historical seasonality pattern is generally indicative of an overall trend and reflective of the buying patterns and budgetary cycles of our customers. However, this pattern may be substantially altered during any quarter or year by the timing of larger projects, timing of orders from larger customers, other economic factors impacting our industry or impacting the industries of our customers and end-users and macroeconomic conditions. While we believe seasonality may be a factor that impacts our quarterly net sales results, we are not able to reliably predict net sales based on seasonality because these other factors can also substantially impact our net sales patterns during the year. We have reviewed our sales order backlog/forward load data as of the end of November 2014. At this time, we do not believe the early sales order backlog/forward load data for the first quarter of fiscal year 2015 provides any reliable indicators—positive or negative—that would enable us to provide a reasonable expectation regarding the strength of net sales during the first quarter of fiscal year 2015.
Gross Profit
Gross profit increased 9.9% to $28.5 million in fiscal year 2014 from $25.9 million in fiscal year 2013. Gross profit margin, or gross profit as a percentage of net sales, remained substantially unchanged at 34.3% for fiscal year 2014, compared to 34.4% for fiscal year 2013.
Gross profit was $25.9 million in fiscal year 2013, a 17.9% decrease from $31.6 million in fiscal year 2012. Gross profit margin was 34.4% for fiscal year 2013, compared to 37.8% for fiscal year 2012.
Our gross profit margin percentages are heavily dependent upon product mix on a quarterly basis and may vary based on changes in product mix. The slightly lower gross profit margin in fiscal 2014 when compared to fiscal year 2013 was primarily due to an increase in sales of certain products that negatively impacted our gross profit margin.
Gross profit in fiscal year 2013 was negatively impacted by lower net sales, as certain fixed manufacturing costs were spread over lower sales. Additionally, we experienced an increase in certain production costs at our Roanoke facility in fiscal year 2013 in order to further expand the breadth of our production capabilities to support future growth, as well as to accommodate potential higher levels of production from anticipated future sales opportunities.
Selling, General and Administrative Expenses
SG&A expenses increased to $27.0 million in fiscal year 2014 from $25.0 million in fiscal year 2013. SG&A expenses as a percentage of net sales decreased to 32.5% in fiscal year 2014, compared to 33.2% in fiscal year 2013.
The increase in SG&A expenses during fiscal year 2014 compared to fiscal year 2013 was primarily due to increased legal and professional fees, reorganization initiatives and employee related costs. We do not believe the increased legal and professional fees are indicative of a trend toward higher legal and professional fees generally. Compensation costs increased in fiscal year 2014 when compared to fiscal year 2013 largely as a result of increases in commissions and employee incentives due to increased net sales during fiscal year 2014.
We took steps to streamline operations by eliminating a number of positions at the end of the third quarter of fiscal year 2014. These workforce reductions, together with other positions eliminated earlier in fiscal year 2014, are expected to result in total annual cost savings of approximately $1.0 million. The Company’s reorganization initiative resulted in nonrecurring expenses totaling $364,000 in fiscal year 2014.
SG&A expenses decreased to $25.0 million in fiscal year 2013 from $27.3 million in fiscal year 2012. SG&A expenses as a percentage of net sales increased to 33.2% in fiscal year 2013 compared to 32.7% in fiscal year 2012.
The decrease in SG&A expenses during fiscal year 2013 compared to fiscal year 2012 was primarily due to decreased employee related costs. Compensation costs decreased in fiscal year 2013 as a result of decreases in commissions and employee incentives due to decreased net sales and the financial results of fiscal year 2013.
Royalty (Income) Expense, Net
We recognized royalty expense, net of royalty income, totaling $110,000 during fiscal year 2014, compared to $79,000 during fiscal year 2013. We expect the trend of royalty expense largely or completely offsetting royalty income to continue in fiscal year 2015 as a result of the decline in royalty income due to the expiration of patents for licensed products.
We recognized royalty expense, net of royalty income, totaling $79,000 during fiscal year 2013, compared to royalty income, net of royalty and related expenses, totaling $299,000 during fiscal year 2012. The change when comparing the two fiscal years is primarily due to the expiration of certain patents during fiscal year 2012, which had previously generated a large portion of our royalty income.
Amortization of Intangible Assets
We recognized $41,000 of amortization expense, associated with intangible assets, during fiscal year 2014, compared to amortization expense of $70,000 during fiscal year 2013. The decrease in amortization expense when comparing the two fiscal years is primarily due to the fact that the remaining intangible assets, acquired in connection with the acquisition of SMP Data Communications in 2008, were fully amortized during fiscal year 2013. The intangible assets acquired in connection with the acquisition of AOS in 2009 were fully amortized by the end of fiscal year 2014.
We recognized $70,000 of amortization expense, associated with intangible assets, during fiscal year 2013, compared to amortization expense of $134,000 during fiscal year 2012.
Other Expense, Net
We recognized other expense, net of $442,000 in fiscal year 2014 compared to $492,000 in fiscal year 2013. Other expense, net for fiscal year 2014 is comprised of: interest expense totaling $414,000 related primarily to monies borrowed in connection with the acquisition of SMP Data Communications in fiscal year 2008, borrowings under our revolving credit facility, and other interest incurred in the normal course of business; and other miscellaneous items which may fluctuate from period to period.
We recognized other expense, net of $492,000 in fiscal year 2013 compared to $534,000 in fiscal year 2012. Other expense, net for fiscal year 2013 is comprised of: interest expense totaling $467,000 related primarily to monies borrowed in connection with the acquisition of SMP Data Communications in fiscal year 2008, borrowings under our revolving credit facility, and other interest incurred in the normal course of business; and other miscellaneous items which may fluctuate from period to period.
Income Before Income Taxes
We reported income before income taxes of $891,000 for fiscal year 2014 compared to $275,000 for fiscal year 2013. This increase was primarily due to the increase in gross profit of $2.6 million in fiscal year 2014 compared to fiscal year 2013, partially offset by the increase in SG&A expenses of $2.0 million, compared to fiscal year 2013.
We reported income before income taxes of $275,000 for fiscal year 2013 compared to $3.9 million for fiscal year 2012. This decrease was primarily due to the decrease in gross profit of $5.6 million in fiscal year 2013, partially offset by the decrease in SG&A expenses of $2.3 million, compared to fiscal year 2012.
Income Tax Expense
Income tax expense totaled $268,000 for fiscal year 2014, compared to $348,000 for fiscal year 2013. Our effective tax rate was 30.0% in fiscal year 2014, compared to 126.3% in fiscal year 2013.
Fluctuations in our effective tax rates are primarily due to permanent differences in U.S. GAAP and tax accounting for various tax deductions and benefits, but can also be significantly different from the statutory tax rate when income or loss before taxes is at a level such that permanent differences in U.S. GAAP and tax accounting treatment have a disproportional impact on the projected effective tax rate. During fiscal year 2013, our effective tax rate was negatively impacted by both the disproportionate share of our combined permanent differences relative to pretax income and the impact of the loss of a portion of the permanent domestic manufacturing deductions taken by us in fiscal years 2011 and 2012, resulting from the anticipated carryback of our fiscal year 2013 net operating loss.
Income tax expense totaled $348,000 for fiscal year 2013, compared to $1.3 million for fiscal year 2012. Our effective tax rate was 126.3% in fiscal year 2013, compared to 32.4% in fiscal year 2012.
Net Income (Loss)
Net income attributable to OCC for fiscal year 2014 was $684,000 compared to a net loss attributable to OCC of $43,000 for fiscal year 2013. This change was primarily due to the increase in income before income taxes of $615,000 for fiscal year 2014 compared to fiscal year 2013.
Net loss attributable to OCC for fiscal year 2013 was $43,000 compared to net income attributable to OCC of $2.7 million for fiscal year 2012. This change was primarily due to the decrease in income before income taxes of $3.6 million for fiscal year 2013 compared to fiscal year 2012.
Financial Condition
Total assets increased $4.6 million, or 10.2%, to $50.0 million at October 31, 2014, from $45.4 million at October 31, 2013. This increase is primarily due to a $4.1 million increase in trade accounts receivable, net, largely resulting from the increase in net sales in the fourth quarter of fiscal year 2014 when compared to the fourth quarter of fiscal year 2013.
Total liabilities increased $3.9 million, or 24.5%, to $19.7 million at October 31, 2014, from $15.9 million at October 31, 2013. This increase is primarily due to a $3.8 million increase in accounts payable and accrued expenses, including accrued compensation and payroll taxes, largely due to the timing of certain raw material purchases when comparing the two fiscal years and the timing of certain vendor and payroll related payments.
Total shareholders’ equity attributable to OCC at October 31, 2014 increased $808,000, or 2.7%, during fiscal year 2014. The increase resulted primarily from net income attributable to OCC of $684,000 and share-based compensation, net, of $831,000, partially offset by dividends declared of $545,000 and the repurchase and retirement of 44,464 shares of our common stock for $195,000.
Liquidity and Capital Resources
Our primary capital needs during fiscal year 2014 have been to fund working capital requirements and capital expenditures, as well as the payment of cash dividends and the repurchase and retirement of our common stock. Our primary source of capital for these purposes has been existing cash, borrowings under our revolving credit facility and cash provided by operations. As of October 31, 2014 and 2013, we had an outstanding loan balance under our revolving credit facility totaling $2.5 million. As of October 31, 2014 and 2013, we had outstanding loan balances, excluding our revolving credit facility, totaling $7.5 million and $7.8 million, respectively.
Our cash totaled $1.1 million as of October 31, 2014, an increase of $339,000, compared to $750,000 as of October 31, 2013. The increase in cash for the fiscal year ended October 31, 2014 resulted from net cash provided by operating activities of $4.4 million, partially offset by net cash used in investing activities of $3.0 million (primarily related to capital expenditures) and net cash used in financing activities of $1.1 million (primarily related to cash dividends paid totaling $540,000, principal payments on our long-term debt of $259,000 and the repurchase and retirement of our common stock totaling $195,000).
On October 31, 2014, we had working capital of $26.1 million, compared to $27.0 million as of October 31, 2013. The ratio of current assets to current liabilities as of October 31, 2014, was 3.8 to 1 compared to 6.6 to 1 as of October 31, 2013. The decrease in working capital and in the current ratio as of October 31, 2014 compared to October 31, 2013 was primarily due to the $3.8 million increase in accounts payable and accrued expenses, including accrued compensation and payroll taxes, and the $716,000 decrease in inventories, partially offset by the $4.1 million increase in trade accounts receivable, net.
Net Cash
Net cash provided by operating activities was $4.4 million in fiscal year 2014 compared to $3.5 million in fiscal year 2013, and $2.0 million in fiscal year 2012.
Net cash provided by operating activities during fiscal year 2014 primarily resulted from net income of $623,000 and certain adjustments to reconcile net income to net cash provided by operating activities, including depreciation, amortization and accretion of $2.0 million, and share-based compensation expense of $957,000. Additionally, the cash flow impact of increases in accounts payable and accrued expenses, including accrued compensation and payroll taxes, of $3.8 million, and the decrease in inventories of $716,000 further contributed to net cash provided by operating activities. All of the aforementioned factors positively affecting cash provided by operating activities were partially offset by the cash flow impact of increases in trade accounts receivable, net of $4.1 million.
Net cash provided by operating activities during fiscal year 2013 primarily resulted from certain adjustments to reconcile net loss to net cash provided by operating activities, including depreciation, amortization and accretion of $2.1 million, and share-based compensation expense of $971,000. Additionally, the cash flow impact of decreases in trade accounts receivable, net of $2.6 million further contributed to net cash provided by operating activities. All of the aforementioned factors positively affecting cash provided by operating activities were partially offset by the cash flow impact of decreases in accounts payable and accrued expenses, including accrued compensation and payroll taxes, of $3.0 million and a net loss totaling $72,000.
Net cash provided by operating activities during fiscal year 2012 primarily resulted from net income of $2.6 million and certain adjustments to reconcile net income to net cash provided by operating activities, including depreciation, amortization and accretion of $2.2 million, and share-based compensation expense of $1.4 million. All of the aforementioned factors positively affecting cash provided by operating activities were partially offset by the cash flow impact of an increase in accounts receivable of $1.8 million, an increase in inventories of $2.0 million and a decrease in accounts payable and accrued expenses of $1.3 million.
Net cash used in investing activities totaled $3.0 million in fiscal year 2014 compared to $3.1 million in fiscal year 2013 and $1.6 million in fiscal year 2012. Net cash used in investing activities during fiscal years 2014, 2013 and 2012 resulted primarily from the purchases of property and equipment and deposits for the purchase of property and equipment.
Net cash used in financing activities totaled $1.1 million in fiscal year 2014 compared to $173,000 in fiscal year 2013 and $934,000 in fiscal year 2012. Net cash used in financing activities in fiscal year 2014 resulted primarily from the $540,000 payment of dividends previously declared, principal payments on our long-term debt of $259,000 and the repurchase and retirement of 44,464 shares of our common stock for $195,000. Net cash used in financing activities in fiscal year 2013 resulted primarily from the repurchase and retirement of 129,500 shares of our common stock for $543,000 and the $479,000 payment of dividends previously declared, partially offset by proceeds from a note payable to our bank under our line of credit, net of repayments, of $1.5 million. Net cash used in financing activities in fiscal year 2012 resulted primarily from the repurchase and retirement of 267,000 shares of our common stock for $1.2 million and the $357,000 payment of dividends previously declared, partially offset by proceeds from a note payable to our bank under our line of credit, net of repayments, of $1.0 million.
Credit Facilities
We have credit facilities consisting of a real estate term loan, as amended (the “Virginia Real Estate Loan”), a supplemental real estate term loan, as amended (the “North Carolina Real Estate Loan”) and a revolving credit facility, as amended (the “Commercial Loan”).
Both the Virginia Real Estate Loan and the North Carolina Real Estate Loan are with Valley Bank, have a fixed interest rate of 4.25% and are secured by a first priority lien on all of our personal property and assets, except for our inventory, accounts, general intangibles, deposit accounts, instruments, investment property, letter of credit rights, commercial tort claims, documents and chattel paper, as well as a first lien deed of trust on the Company’s real property.
The Commercial Loan provides us with a revolving line of credit for the working capital needs of the Company. Under the terms of the Commercial Loan, we may borrow an aggregate principal amount at any one time outstanding not to exceed the lesser of (i) $9.0 million, or (ii) the sum of 85% of certain receivables aged 90 days or less plus 35% of the lesser of $1.0 million or certain foreign receivables plus 25% of certain raw materials inventory.
On August 11, 2014, we entered into a commercial note of renewal (“Binding Letter of Renewal”) extending the maturity date of the Commercial Loan to August 31, 2016. The Binding Letter of Renewal only extends the maturity date of the Commercial Loan. All other terms of the Commercial Loan remain unaltered and remain in full force and effect. Within the revolving loan limit of the Commercial Loan and Binding Letter of Renewal, we may borrow, repay, and reborrow, at any time until August 31, 2016.
Advances under the Commercial Loan accrue interest at LIBOR plus 2.2% (resulting in a 2.35% rate at October 31, 2014). Accrued interest on the outstanding principal balance is due on the first day of each month, with all then outstanding principal, interest, fees and costs due at the Commercial Loan maturity of August 31, 2016, the extended maturity date of the Commercial Loan.
The Commercial Loan is secured by a first priority lien on all of our inventory, accounts, general intangibles, deposit accounts, instruments, investment property, letter of credit rights, commercial tort claims, documents and chattel paper.
As of October 31, 2014, we had $2.5 million of outstanding borrowings on our Commercial Loan and approximately $6.5 million in available credit.
Capital Expenditures
During the year ended October 31, 2014, we spent approximately $2.1 million to add new manufacturing equipment at our fiber optic cable production facility to further expand the breadth of our production capabilities and to support anticipated increased demand for our fiber optic cable products. As of October 31, 2014, we have committed an additional $2.8 million to support these efforts. We did not have any other material commitments for capital expenditures as of October 31, 2014. During our 2014 fiscal year budgeting process, we included an estimate for capital expenditures for the year of $2.8 million. We incurred capital expenditures totaling $2.8 million for items including new manufacturing equipment, improvements to existing manufacturing equipment, new information technology equipment and software, upgrades to existing information technology equipment and software, furniture and other capitalizable expenditures for property, plant and equipment for fiscal year 2014.
During our 2015 fiscal year budgeting process, we included an estimate for capital expenditures of $5.5 million for the year, including commitments as of October 31, 2014. These expenditures will be funded out of our working capital, cash provided by operations or borrowings under our credit facilities. This amount includes estimates for capital expenditures for similar types of items as those purchased in fiscal year 2014. Capital expenditures are reviewed and approved based on a variety of factors including, but not limited to, current cash flow considerations, the expected return on investment, project priorities, impact on current or future product offerings, availability of personnel necessary to implement and begin using acquired equipment, and economic conditions in general. Historically, we have spent less than our budgeted capital expenditures in most fiscal years.
Corporate acquisitions and other strategic investments are considered outside of our annual capital expenditure budgeting process.
Future Cash Flow Considerations
We believe that our cash flow from operations, our cash on hand and our existing credit facilities will be adequate to fund our operations for at least the next twelve months.
From time to time, we are involved in various claims, legal actions and regulatory reviews arising in the ordinary course of business. In the opinion of management, the ultimate disposition of these matters will not have a material adverse effect on our financial position, results of operations or liquidity.
Seasonality
Historically, net sales are relatively lower in the first half of each fiscal year and relatively higher in the second half of each fiscal year, which we believe may be partially due to construction cycles and budgetary considerations of our customers. For example, our trend for the last three fiscal years has been that an average of approximately 44%, 48% and 47% of our net sales occurred during the first half of fiscal years 2014, 2013 and 2012, respectively, and an average of approximately 56%, 52% and 53% of our net sales occurred during the second half of fiscal years 2014, 2013 and 2012, respectively. We believe net sales may not follow this pattern in periods when overall economic conditions in the industry and/or in the world are atypical.
As a result, we typically expect net sales to be relatively lower in the first half of each fiscal year and relatively higher in the second half of each fiscal year. We believe this historical seasonality pattern is generally indicative of an overall trend and reflective of the buying patterns and budgetary cycles of our customers. However, this pattern may be substantially altered during any quarter or year by the timing of larger projects, timing of orders from larger customers, other economic factors impacting our industry or impacting the industries of our customer and end-users and macroeconomic conditions. While we believe seasonality may be a factor that impacts our quarterly net sales results, we are not able to reliably predict net sales based on seasonality because these other factors can also substantially impact our net sales patterns during the year.
Critical Accounting Policies and Estimates
Our discussion and analysis of financial condition and results of operations is based on the consolidated financial statements and accompanying notes which have been prepared in accordance with U.S. generally accepted accounting principles (“U.S. GAAP”). The preparation of these consolidated financial statements requires management to make estimates and assumptions that affect the reported amounts of assets and liabilities and the disclosure of contingent assets and liabilities at the date of the consolidated financial statements and the reported amounts of revenues and expenses during the reporting period. Actual results could differ from those estimates.
Note 1 to the consolidated financial statements provides a summary of our significant accounting policies. The following are areas requiring significant judgments and estimates due to uncertainties as of the reporting date: revenue recognition, trade accounts receivable and the allowance for doubtful accounts, inventories, long-lived assets and commitments and contingencies.
Application of the critical accounting policies discussed in the section that follows requires management’s significant judgments, often as a result of the need to make estimates of matters that are inherently uncertain. If actual results were to differ materially from the estimates made, the reported results could be materially affected. We are not currently aware of any reasonably likely events or circumstances that would result in materially different results.
Revenue Recognition
Management views revenue recognition as a critical accounting estimate since we must estimate an allowance for sales returns for the reporting period. This allowance reduces net sales for the period and is based on our analysis and judgment of historical trends, identified returns and the potential for additional returns. The estimates for sales returns did not materially differ from actual results for the year ended October 31, 2014.
Trade Accounts Receivable and the Allowance for Doubtful Accounts
Management views trade accounts receivable net of the related allowance for doubtful accounts as a critical accounting estimate since the allowance for doubtful accounts is based on judgments and estimates concerning the likelihood that individual customers will pay the amounts included as receivable from them. In determining the amount of allowance for doubtful accounts to be recorded for individual customers, we consider the age of the receivable, the financial stability of the customer, discussions that may have occurred with the customer and our judgment as to the overall collectibility of the receivable from that customer. In addition, we establish an allowance for all other receivables for which no specific allowances are deemed necessary. This general allowance for doubtful accounts is based on a percentage of total trade accounts receivable with different percentages used based on different age categories of receivables. The percentages used are based on our historical experience and our current judgment regarding the state of the economy and the industry.
Inventories
Management views the determination of the net realizable value of inventories as a critical accounting estimate since it is based on judgments and estimates regarding the salability of individual items in inventory and an estimate of the ultimate selling prices for those items. Individual inventory items are reviewed and adjustments are made based on the age of the inventory and our judgment as to the salability of that inventory in order for our inventories to be valued at the lower of cost or net realizable value.
Long-lived Assets
Management views the determination of the carrying value of long-lived assets as a critical accounting estimate since we must determine an estimated economic useful life in order to properly amortize or depreciate our long-lived assets and because we must consider if the value of any of our long-lived assets have been impaired, requiring adjustment to the carrying value.
Economic useful life is the duration of time the asset is expected to be productively employed by us, which may be less than its physical life. Management’s assumptions on wear and tear, obsolescence, technological advances and other factors affect the determination of estimated economic useful life. The estimated economic useful life of an asset is monitored to determine if it continues to be appropriate in light of changes in business circumstances. For example, technological advances or excessive wear and tear may result in a shorter estimated useful life than originally anticipated. In such a case, we would depreciate the remaining net book value of an asset over the new estimated remaining life, thereby increasing depreciation expense per year on a prospective basis. We must also consider similar issues when determining whether or not an asset has been impaired to the extent that we must recognize a loss on such impairment.
The Company amortizes intangible assets over their respective finite lives up to their estimated residual values.
Commitments and Contingencies
Management views accounting for contingencies as a critical accounting estimate since loss contingencies arising from product warranties and defects, claims, assessments, litigation, fines and penalties and other sources require judgment as to any probable liabilities incurred. For example, accrued product warranty costs recorded by us are based primarily on historical experience of actual warranty claims and costs as well as current information with respect to warranty claims and costs. Actual results could differ from the expected results determined based on such estimates of loss contingencies.
Quantitative and Qualitative Disclosures About Market Risk
We do not engage in transactions in derivative financial instruments or derivative commodity instruments. As of October 31, 2014 our financial instruments were not exposed to significant market risk due to interest rate risk, foreign currency exchange risk, commodity price risk or equity price risk.
New Accounting Standards
In July 2013, the FASB issued Accounting Standards Update 2013-11, Presentation of an Unrecognized Tax Benefit When a Net Operating Loss Carryforward, a Similar Tax Loss, or a Tax Credit Carryforward Exists (“ASU 2013-11”). The amendments in ASU 2013-11 clarify that an unrecognized tax benefit, or a portion of an unrecognized tax benefit, should be presented in the financial statements as a reduction to a deferred tax asset for a net operating loss carryforward, a similar tax loss, or a tax credit carryforward if such settlement is required or expected in the event the uncertain tax position is disallowed. If a net operating loss carryforward, a similar tax loss, or a tax credit carryforward is not available at the reporting date, then the unrecognized tax benefit should be presented in the financial statements as a liability and should not be combined with deferred tax assets. ASU 2013-11 is effective for fiscal years, and interim periods within those fiscal years, beginning after December 15, 2013, with early adoption permitted. The adoption of ASU 2013-11 is not expected to have a material impact on our results of operations, financial position or liquidity or our related financial statement disclosures.
In May 2014, the FASB issued Accounting Standards Update 2014-09, Revenue from Contracts with Customers (“ASU 2014-09”). ASU 2014-09 is a comprehensive new revenue recognition model that expands disclosure requirements and requires an entity to recognize revenue when promised goods or services are transferred to a customer at an amount that reflects the consideration it expects to receive in exchange for those goods or services. This ASU is effective for annual reporting periods beginning after December 15, 2016, and interim periods therein, and early adoption is not permitted. We are currently evaluating the impact of the adoption of this guidance on our results of operations, financial position and liquidity and our related financial statement disclosures.
There are no other new accounting standards issued, but not yet adopted by us, which are expected to materially impact our financial position, operating results or financial statement disclosures.
Disagreements with Accountants
We did not have any disagreements with our accountants on any accounting matter or financial disclosure made during our fiscal year ended October 31, 2014.
Consolidated Balance Sheets
October 31, 2014 and 2013
|
October 31, |
||||||||
|
|
2014 |
2013 |
||||||
| Assets | ||||||||
|
Current assets: |
||||||||
|
Cash |
$ | 1,089,507 | $ | 750,303 | ||||
|
Trade accounts receivable, net of allowance for doubtful accounts of $92,988 in 2014 and $74,073 in 2013 |
14,076,349 | 9,951,970 | ||||||
|
Other receivables |
180,135 | 225,016 | ||||||
|
Income taxes refundable |
— | 590,569 | ||||||
|
Inventories |
17,518,119 | 18,234,279 | ||||||
|
Prepaid expenses |
578,843 | 331,141 | ||||||
|
Deferred income taxes - current |
1,933,653 | 1,726,695 | ||||||
|
Total current assets |
35,376,606 | 31,809,973 | ||||||
|
Property and equipment, net |
13,113,445 | 12,827,198 | ||||||
|
Intangible assets, net |
438,696 | 340,807 | ||||||
|
Deferred income taxes - noncurrent |
320,509 | 161,063 | ||||||
|
Other assets, net |
789,358 | 275,858 | ||||||
|
Total assets |
$ | 50,038,614 | $ | 45,414,899 | ||||
|
Liabilities and Shareholders’ Equity |
||||||||
|
Current liabilities: |
||||||||
|
Current installments of long-term debt |
$ | 269,996 | $ | 258,628 | ||||
|
Accounts payable and accrued expenses |
5,438,519 | 3,267,812 | ||||||
|
Accrued compensation and payroll taxes |
2,895,100 | 1,297,591 | ||||||
|
Income taxes payable |
698,051 | — | ||||||
|
Total current liabilities |
9,301,666 | 4,824,031 | ||||||
|
Note payable to bank |
2,500,000 | 2,500,000 | ||||||
|
Long-term debt, excluding current installments |
7,227,023 | 7,497,042 | ||||||
|
Deferred income taxes - noncurrent |
26,038 | 83,158 | ||||||
|
Other noncurrent liabilities |
677,597 | 950,952 | ||||||
|
Total liabilities |
19,732,324 | 15,855,183 | ||||||
|
Shareholders’ equity: |
||||||||
|
Preferred stock, no par value, authorized 1,000,000 shares; none issued and outstanding |
— | — | ||||||
|
Common stock, no par value, authorized 50,000,000 shares; issued and outstanding 6,839,778 shares in 2014 and 6,570,734 shares in 2013 |
9,543,686 | 8,679,435 | ||||||
|
Retained earnings |
21,462,881 | 21,519,238 | ||||||
|
Total shareholders’ equity attributable to Optical Cable Corporation |
31,006,567 | 30,198,673 | ||||||
|
Noncontrolling interest |
(700,277 | ) | (638,957 | ) | ||||
|
Total shareholders’ equity |
30,306,290 | 29,559,716 | ||||||
|
Commitments and contingencies |
||||||||
|
Total liabilities and shareholders’ equity |
$ | 50,038,614 | $ | 45,414,899 | ||||
See accompanying notes to consolidated financial statements.
Consolidated Statements of Operations
Years ended October 31, 2014, 2013 and 2012
|
Years Ended October 31, |
||||||||||||
|
2014 |
2013 |
2012 |
||||||||||
|
Net sales |
$ | 82,977,732 | $ | 75,266,038 | $ | 83,523,330 | ||||||
|
Cost of goods sold |
54,505,370 | 49,353,746 | 51,970,244 | |||||||||
|
Gross profit |
28,472,362 | 25,912,292 | 31,553,086 | |||||||||
|
Selling, general and administrative expenses |
26,989,262 | 24,996,440 | 27,300,248 | |||||||||
|
Royalty (income) expense, net |
110,193 | 78,998 | (299,174 | ) | ||||||||
|
Amortization of intangible assets |
40,612 | 69,733 | 134,201 | |||||||||
|
Income from operations |
1,332,295 | 767,121 | 4,417,811 | |||||||||
|
Other expense, net: |
||||||||||||
|
Interest income |
— | — | 8,416 | |||||||||
|
Interest expense |
(413,731 | ) | (466,601 | ) | (558,661 | ) | ||||||
|
Other, net |
(27,984 | ) | (25,210 | ) | 15,969 | |||||||
|
Other expense, net |
(441,715 | ) | (491,811 | ) | (534,276 | ) | ||||||
|
Income before income taxes |
890,580 | 275,310 | 3,883,535 | |||||||||
|
Income tax expense |
267,673 | 347,788 | 1,257,335 | |||||||||
|
Net income (loss) |
$ | 622,907 | $ | (72,478 | ) | $ | 2,626,200 | |||||
|
Net loss attributable to noncontrolling interest |
(61,320 | ) | (29,641 | ) | (123,117 | ) | ||||||
|
Net income (loss) attributable to Optical Cable Corporation |
$ | 684,227 | $ | (42,837 | ) | $ | 2,749,317 | |||||
|
Net income (loss) attributable to Optical Cable Corporation per share - basic and diluted |
$ | 0.10 | $ | (0.01 | ) | $ | 0.43 | |||||
|
Cash dividends declared per common share |
$ | 0.08 | $ | 0.08 | $ | 0.06 | ||||||
See accompanying notes to consolidated financial statements.
Consolidated Statements of Shareholders' Equity
Years ended October 31, 2014, 2013 and 2012
|
Total |
||||||||||||||||||||||||
|
Shareholders’ |
|
|||||||||||||||||||||||
|
Common Stock |
Retained |
Equity Attributable |
Noncontrolling |
Total Shareholders’ |
||||||||||||||||||||
|
Shares |
Amount |
Earnings |
to OCC |
Interest |
Equity |
|||||||||||||||||||
|
Balances at October 31, 2011 |
6,287,761 | $ | 6,771,565 | $ | 21,437,609 | $ | 28,209,174 | $ | (486,199 | ) | $ | 27,722,975 | ||||||||||||
|
Share-based compensation, net |
390,831 | 1,249,417 | — | 1,249,417 | — | 1,249,417 | ||||||||||||||||||
|
Repurchase and retirement of common stock (at cost) |
(267,000 | ) | — | (1,176,661 | ) | (1,176,661 | ) | — | (1,176,661 | ) | ||||||||||||||
|
Common stock dividends declared, $0.06 per share |
— | — | (390,451 | ) | (390,451 | ) | — | (390,451 | ) | |||||||||||||||
|
Excess tax benefits from share-based compensation |
— | 3,562 | — | 3,562 | — | 3,562 | ||||||||||||||||||
|
Net income |
— | — | 2,749,317 | 2,749,317 | (123,117 | ) | 2,626,200 | |||||||||||||||||
|
Balances at October 31, 2012 |
6,411,592 | 8,024,544 | 22,619,814 | 30,644,358 | (609,316 | ) | 30,035,042 | |||||||||||||||||
|
Share-based compensation, net |
288,642 | 613,293 | — | 613,293 | — | 613,293 | ||||||||||||||||||
|
Repurchase and retirement of common stock (at cost) |
(129,500 | ) | — | (543,420 | ) | (543,420 | ) | — | (543,420 | ) | ||||||||||||||
|
Common stock dividends declared, $0.08 per share |
— | — | (514,319 | ) | (514,319 | ) | — | (514,319 | ) | |||||||||||||||
|
Excess tax benefits from share-based compensation |
— | 41,598 | — | 41,598 | — | 41,598 | ||||||||||||||||||
|
Net loss |
— | — | (42,837 | ) | (42,837 | ) | (29,641 | ) | (72,478 | ) | ||||||||||||||
|
Balances at October 31, 2013 |
6,570,734 | 8,679,435 | 21,519,238 | 30,198,673 | (638,957 | ) | 29,559,716 | |||||||||||||||||
|
Share-based compensation, net |
313,508 | 830,789 | — | 830,789 | — | 830,789 | ||||||||||||||||||
|
Repurchase and retirement of common stock (at cost) |
(44,464 | ) | — | (195,206 | ) | (195,206 | ) | — | (195,206 | ) | ||||||||||||||
|
Common stock dividends declared, $0.08 per share |
— | — | (545,378 | ) | (545,378 | ) | — | (545,378 | ) | |||||||||||||||
|
Excess tax benefits from share-based compensation |
— | 33,462 | — | 33,462 | — | 33,462 | ||||||||||||||||||
|
Net income |
— | — | 684,227 | 684,227 | (61,320 | ) | 622,907 | |||||||||||||||||
|
Balances at October 31, 2014 |
6,839,778 | $ | 9,543,686 | $ | 21,462,881 | $ | 31,006,567 | $ | (700,277 | ) | $ | 30,306,290 | ||||||||||||
See accompanying notes to consolidated financial statements.
Consolidated Statements of Cash Flows
Years Ended October 31, 2014, 2013 and 2012
|
Years ended October 31, |
||||||||||||
|
2014 |
2013 |
2012 |
||||||||||
|
Cash flows from operating activities: |
||||||||||||
|
Net income (loss) |
$ | 622,907 | $ | (72,478 | ) | $ | 2,626,200 | |||||
|
Adjustments to reconcile net income (loss) to net cash provided by operating activities: |
||||||||||||
|
Depreciation, amortization and accretion |
2,022,648 | 2,051,433 | 2,181,100 | |||||||||
|
Bad debt expense (recovery) |
18,915 | 20,461 | (10,327 | ) | ||||||||
|
Deferred income tax expense (benefit) |
(423,524 | ) | 998,747 | (558,770 | ) | |||||||
|
Share-based compensation expense |
956,859 | 971,145 | 1,440,534 | |||||||||
|
Impact of excess tax benefits from share-based compensation |
(33,462 | ) | (41,598 | ) | (3,562 | ) | ||||||
|
Loss on sale of property and equipment |
39,137 | 12,858 | 6,974 | |||||||||
|
(Increase) decrease in: |
||||||||||||
|
Trade accounts receivable |
(4,143,294 | ) | 2,628,971 | (1,793,255 | ) | |||||||
|
Other receivables |
44,881 | (8,804 | ) | 294,502 | ||||||||
|
Income taxes refundable |
590,569 | (472,511 | ) | 316,066 | ||||||||
|
Inventories |
716,160 | 229,740 | (1,966,834 | ) | ||||||||
|
Prepaid expenses |
(247,702 | ) | 153,265 | (118,948 | ) | |||||||
|
Other assets, net |
— | — | 12,884 | |||||||||
|
Increase (decrease) in: |
||||||||||||
|
Accounts payable and accrued expenses |
2,171,801 | (800,378 | ) | (1,336,095 | ) | |||||||
|
Accrued compensation and payroll taxes |
1,597,509 | (2,166,861 | ) | 884,587 | ||||||||
|
Income taxes payable |
731,513 | 18,661 | 26,499 | |||||||||
|
Other noncurrent liabilities |
(280,599 | ) | (47,114 | ) | (16,946 | ) | ||||||
|
Net cash provided by operating activities |
4,384,318 | 3,475,537 | 1,984,609 | |||||||||
|
Cash flows from investing activities: |
||||||||||||
|
Purchase of and deposits for the purchase of property and equipment |
(2,820,183 | ) | (2,983,960 | ) | (1,467,089 | ) | ||||||
|
Investment in intangible assets |
(138,501 | ) | (164,584 | ) | (84,314 | ) | ||||||
|
Proceeds from sale of property and equipment |
— | 5,000 | 80 | |||||||||
|
Net cash used in investing activities |
(2,958,684 | ) | (3,143,544 | ) | (1,551,323 | ) | ||||||
|
Cash flows from financing activities: |
||||||||||||
|
Payroll taxes remitted on share-based payments |
(126,070 | ) | (357,852 | ) | (191,117 | ) | ||||||
|
Proceeds from note payable to bank |
1,750,000 | 4,550,000 | 6,250,000 | |||||||||
|
Principal payments on long-term debt and note payable to bank |
(2,008,651 | ) | (3,297,749 | ) | (5,437,485 | ) | ||||||
|
Payments for financing costs |
— | — | (25,000 | ) | ||||||||
|
Principal payments on related party loans |
— | (86,177 | ) | — | ||||||||
|
Repurchase of common stock |
(195,206 | ) | (543,420 | ) | (1,176,661 | ) | ||||||
|
Impact of excess tax benefits from share-based compensation |
33,462 | 41,598 | 3,562 | |||||||||
|
Common stock dividends paid |
(539,965 | ) | (479,128 | ) | (357,060 | ) | ||||||
|
Net cash used in financing activities |
(1,086,430 | ) | (172,728 | ) | (933,761 | ) | ||||||
|
Net increase (decrease) in cash |
339,204 | 159,265 | (500,475 | ) | ||||||||
|
Cash at beginning of year |
750,303 | 591,038 | 1,091,513 | |||||||||
|
Cash at end of year |
$ | 1,089,507 | $ | 750,303 | $ | 591,038 | ||||||
|
Supplemental disclosure of cash flow information: |
||||||||||||
|
Cash payment for interest |
$ | 394,241 | $ | 449,134 | $ | 524,936 | ||||||
|
Income taxes paid (refunded), net |
$ | (586,290 | ) | $ | (187,548 | ) | $ | 1,462,886 | ||||
|
Noncash investing and financing activities: |
||||||||||||
|
Capital expenditures accrued in accounts payable at year end |
$ | 12,625 | $ | 19,132 | $ | 177,766 | ||||||
|
Common stock dividends declared and included in accounts payable and accrued expenses at year end |
$ | 136,931 | $ | 131,518 | $ | 96,327 | ||||||
See accompanying notes to consolidated financial statements.
Notes to Consolidated Financial Statements
Years ended October 31, 2014, 2013 and 2012
|
(1) |
Description of Business and Summary of Significant Accounting Policies |
|
(a) |
Description of Business |
Optical Cable Corporation and its subsidiaries (collectively, the “Company” or “OCC®”) is a leading manufacturer of a broad range of fiber optic and copper data communication cabling and connectivity solutions primarily for the enterprise market, offering an integrated suite of high quality products which operate as a system solution or seamlessly integrate with other providers’ offerings. The Company’s product offerings include cabling and connectivity products designed for uses ranging from commercial, enterprise network, datacenter, residential and campus installations to customized products for specialty applications and harsh environments, including military, industrial, mining, petrochemical and broadcast applications.
Founded in 1983, OCC is headquartered in Roanoke, Virginia with offices, manufacturing and warehouse facilities located in Roanoke, Virginia; near Asheville, North Carolina; and near Dallas, Texas.
OCC acquired Superior Modular Products Incorporated, doing business as SMP Data Communications (“SMP Data Communications” or “SMP”) on May 30, 2008, and merged SMP with and into OCC on October 31, 2009.
OCC acquired Applied Optical Systems, Inc. (“AOS”) on October 31, 2009. AOS is a wholly owned subsidiary of OCC doing business as OCC and Optical Cable Corporation.
OCC owns 70% of the authorized membership interests of Centric Solutions LLC (“Centric Solutions”). Centric Solutions is a business founded in 2008 to provide cabling and connectivity solutions for the datacenter market.
The Company’s cabling and connectivity products are used for high bandwidth transmission of data, video and audio communications. The enterprise market into which the Company primarily sells its products includes local area network and premises markets. The Company’s product offering includes products well-suited for use in various other short- to moderate-distance applications as well. The Company’s products are sold worldwide. Also see note 11.
|
(b) |
Principles of Consolidation |
The accompanying consolidated financial statements include the accounts of Optical Cable Corporation and its wholly owned and majority-owned subsidiaries. All significant intercompany balances and transactions have been eliminated in consolidation.
|
(c) |
Cash and Cash Equivalents |
All of the Company’s bank accounts are insured by the Federal Deposit Insurance Corporation (FDIC). As of October 31, 2014 and 2013, the Company had bank deposits in excess of the insured limit totaling $567,547 and $405,232, respectively.
For purposes of the consolidated statements of cash flows, the Company considers all highly liquid debt instruments with original maturities of three months or less to be cash equivalents. As of October 31, 2014 and 2013, the Company had no cash equivalents.
|
(d) |
Trade Accounts Receivable and Allowance for Doubtful Accounts |
Trade accounts receivable are recorded at the invoiced amount and do not typically bear interest. The allowance for doubtful accounts is the Company’s best estimate of the amount of probable credit losses in the Company’s existing accounts receivable. The Company reviews outstanding trade accounts receivable at the end of each quarter and records allowances for doubtful accounts as deemed appropriate for (i) certain individual customers and (ii) for all other trade accounts receivable in total. In determining the amount of allowance for doubtful accounts to be recorded for individual customers, the Company considers the age of the receivable, the financial stability of the customer, discussions that may have occurred with the customer and management’s judgment as to the overall collectibility of the receivable from that customer. In addition, the Company establishes an allowance for all other receivables for which no specific allowances are deemed necessary. This portion of the allowance for doubtful accounts is based on a percentage of total trade accounts receivable with different percentages used based on different age categories of receivables. The percentages used are based on the Company’s historical experience and management’s current judgment regarding the state of the economy and the industry. Account balances are charged off against the allowance after all means of collection have been exhausted and the potential for recovery is considered remote. The Company does not have any off-balance-sheet credit exposure related to its customers.
|
(e) |
Inventories |
Inventories are stated at the lower of cost or market, or net realizable value. The determination of cost includes raw materials, direct labor and manufacturing overhead. The cost of optical fibers, included in raw materials, is determined using specific identification for optical fibers. The cost of other raw materials and production supplies is generally determined using the first-in, first-out basis. The cost of work in process and finished goods inventories is determined either as average cost or standard cost, depending upon the product type. A standard cost system is used to estimate the actual costs of inventory for certain product types. Actual costs and production cost levels may vary from the standards established and such variances are charged to cost of goods sold or capitalized to inventory. Also see note 3.
|
(f) |
Property and Equipment |
Property and equipment are stated at cost less accumulated depreciation and amortization. Depreciation and amortization are provided for using both straight-line and declining balance methods over the estimated useful lives of the assets. Estimated useful lives are thirty to thirty-nine years for buildings and three to seven years for building improvements, machinery and equipment and furniture and fixtures. Also see note 4.
|
|
(g) |
Patents and Trademarks |
The Company records legal fees associated with patent and trademark applications as intangible assets. Such intangible assets are not amortized until such time that the patent and/or trademark is granted. The Company estimates the useful life of patents and trademarks based on the period over which the intangible asset is expected to contribute directly or indirectly to future cash flows. If patents and/or trademarks are not granted, the capitalized legal fees are expensed during the period in which such notification is received. If the Company decides to abandon a patent or trademark application, the capitalized legal fees are expensed during the period in which the Company’s decision is made.
|
(h) |
Revenue Recognition |
The Company recognizes revenue when products are shipped or delivered to the customer and the customer takes ownership and assumes risk of loss (based on shipping terms), collection of the relevant receivable is probable, persuasive evidence of an arrangement exists and sales price is fixed or determinable. Customers generally do not have the right of return unless a product is defective or damaged and is within the parameters of the product warranty in effect for the sale.
The Company recognizes royalty income, net of related expenses, on an accrual basis and estimates royalty income earned based on historical experience.
|
|
(i) |
Shipping and Handling Costs |
Shipping and handling costs include the costs incurred to physically move finished goods from the Company’s warehouse to the customers’ designated location. All amounts billed to a customer in a sales transaction related to shipping and handling are classified as sales revenue. Shipping and handling costs of approximately $2.2 million, $2.2 million and $2.6 million are included in selling, general and administrative expenses for the fiscal years ended October 31, 2014, 2013 and 2012, respectively.
|
(j) |
Research and Development |
Research and development costs are expensed as incurred. Research and development costs totaled approximately $1.4 million, $1.4 million and $1.3 million for the fiscal years ended October 31, 2014, 2013 and 2012, respectively, and are included in selling, general and administrative expenses in the consolidated statements of operations.
|
(k) |
Advertising |
Advertising costs are expensed as incurred. Advertising costs totaled approximately $522,000, $546,000 and $741,000 for the fiscal years ended October 31, 2014, 2013 and 2012, respectively, and are included in selling, general and administrative expenses in the consolidated statements of operations.
|
(l) |
Income Taxes |
Income taxes are accounted for under the asset and liability method. Deferred tax assets and liabilities are recognized for the future tax consequences attributable to differences between the financial statement carrying amounts of existing assets and liabilities and their respective tax bases and operating loss, capital loss and tax credit carryforwards. Deferred tax assets and liabilities are measured using enacted tax rates expected to apply to taxable income in the years in which those temporary differences are expected to be recovered or settled. The effect on deferred tax assets and liabilities of a change in tax rates is recognized in income in the period that includes the enactment date.
The Company recognizes the effect of income tax positions only if those positions are more likely than not of being sustained. Recognized income tax positions are measured at the largest amount that is greater than 50% likely of being realized. Changes in recognition or measurement are reflected in the period in which the change in judgment occurs. The Company records interest and penalties related to unrecognized tax benefits as a component of income tax expense. Also see note 12.
|
(m) |
Long-Lived Assets |
Long-lived assets, such as property and equipment and intangible assets, are reviewed for impairment whenever events or changes in circumstances indicate that the carrying amount of an asset may not be recoverable. Recoverability of assets to be held and used is measured by a comparison of the carrying amount of an asset to future net cash flows expected to be generated by the asset. If the carrying amount of an asset exceeds its estimated future cash flows, an impairment charge is recognized in the amount by which the carrying amount of the asset exceeds the fair value of the asset. When applicable, assets to be disposed of are reported separately in the consolidated balance sheet at the lower of the carrying amount or fair value less costs to sell, and are no longer depreciated.
|
(n) |
Stock Incentive Plans and Other Share-Based Compensation |
The Company recognizes the cost of employee services received in exchange for awards of equity instruments based upon the grant-date fair value of those awards. Also see note 10.
|
(o) |
Net Income (Loss) Per Share |
Basic net income (loss) per share excludes dilution and is computed by dividing net income (loss) available to common shareholders by the weighted-average number of common shares outstanding for the period. In the case of basic net loss per share, the calculation excludes common shares outstanding issued as share-based compensation and still subject to vesting requirements, as these shares are considered dilutive. Diluted net income (loss) per share reflects the potential dilution that could occur if securities or other contracts to issue common stock were exercised or converted into common stock or resulted in the issuance of common stock that then shared in the net income (loss) of the Company, and includes all common shares outstanding issued as share-based compensation and still subject to vesting requirements in the calculation of diluted net income, but not in the calculation of diluted net loss. Also see note 14.
|
(p) |
Commitments and Contingencies |
Liabilities for loss contingencies arising from product warranties and defects, claims, assessments, litigation, fines and penalties and other sources are recorded when it is probable that a liability has been incurred and the amount of the assessment can be reasonably estimated.
|
|
(q) |
Use of Estimates |
The preparation of financial statements in conformity with U.S. generally accepted accounting principles requires management to make estimates and assumptions that affect the reported amounts of assets and liabilities and the disclosure of contingent assets and liabilities at the date of the financial statements and the reported amounts of revenues and expenses during the reporting period. Actual results could differ from those estimates.
|
|
(r) |
Reclassifications |
Certain reclassifications have been made to the prior fiscal year’s notes to the consolidated financial statements to place them on a basis comparable with the current fiscal year’s notes to the consolidated financial statements.
|
(2) |
Allowance for Doubtful Accounts for Trade Accounts Receivable |
A summary of changes in the allowance for doubtful accounts for trade accounts receivable for the years ended October 31, 2014, 2013 and 2012 follows:
|
Years ended October 31, |
||||||||||||
|
2014 |
2013 |
2012 |
||||||||||
|
Balance at beginning of year |
$ | 74,073 | $ | 92,148 | $ | 145,616 | ||||||
|
Bad debt expense (recovery) |
18,915 | 20,461 | (10,327 | ) | ||||||||
|
Losses charged to allowance |
— | (38,922 | ) | (43,141 | ) | |||||||
|
Recoveries added to allowance |
— | 386 | — | |||||||||
|
Balance at end of year |
$ | 92,988 | $ | 74,073 | $ | 92,148 | ||||||
|
(3) |
Inventories |
Inventories as of October 31, 2014 and 2013 consist of the following:
|
October 31, |
||||||||
|
2014 |
2013 |
|||||||
|
Finished goods |
$ | 5,378,114 | $ | 5,569,539 | ||||
|
Work in process |
3,210,955 | 3,160,806 | ||||||
|
Raw materials |
8,663,755 | 9,284,390 | ||||||
|
Production supplies |
265,295 | 219,544 | ||||||
|
Total |
$ | 17,518,119 | $ | 18,234,279 | ||||
|
(4) |
Property and Equipment, Net |
Property and equipment, net as of October 31, 2014 and 2013 consists of the following:
|
October 31, |
||||||||
|
2014 |
2013 |
|||||||
|
Land |
$ | 3,144,068 | $ | 3,144,068 | ||||
|
Building and improvements |
8,120,110 | 7,990,110 | ||||||
|
Machinery and equipment |
23,664,060 | 22,217,244 | ||||||
|
Furniture and fixtures |
957,032 | 950,640 | ||||||
|
Construction in progress |
493,876 | 251,727 | ||||||
|
Total property and equipment, at cost |
36,379,146 | 34,553,789 | ||||||
|
Less accumulated amortization and depreciation |
(23,265,701 | ) | (21,726,591 | ) | ||||
|
Property and equipment, net |
$ | 13,113,445 | $ | 12,827,198 | ||||
As of October 31, 2014, the Company has committed $2.8 million for new manufacturing equipment at its fiber optic cable production facility.
|
(5) |
Acquired Intangible Assets |
Following is a summary of acquired intangible assets as of October 31, 2014 and 2013, which were acquired in connection with the acquisitions of SMP Data Communications and AOS, excluding assets written-off as impaired:
|
October 31, 2014 |
||||||||||||
|
Gross carrying amount |
Weighted- average amortization period in years |
Accumulated amortization |
||||||||||
|
Amortizing intangible assets: |
||||||||||||
|
Developed technology |
$ | 2,373,447 | — | $ | (2,373,447 | ) | ||||||
|
Customer list |
96,355 | — | (96,355 | ) | ||||||||
|
Total |
$ | 2,469,802 | $ | (2,469,802 | ) | |||||||
|
October 31, 2013 |
||||||||||||
|
Gross carrying amount |
Weighted- average amortization period in years |
Accumulated amortization |
||||||||||
|
Amortizing intangible assets: |
||||||||||||
|
Developed technology |
$ | 2,373,447 | 1.0 | $ | (2,358,318 | ) | ||||||
|
Customer list |
96,355 | 1.0 | (77,084 | ) | ||||||||
|
Total |
$ | 2,469,802 | $ | (2,435,402 | ) | |||||||
Aggregate amortization expense for amortizing intangible assets was $40,612, $69,733 and $134,201 for the years ended October 31, 2014, 2013 and 2012, respectively. The acquired intangible assets were fully amortized in fiscal year 2014. Amortization of intangible assets is calculated using an accelerated method or a straight-line method over the estimated useful lives of the intangible assets.
|
(6) |
Product Warranties |
The Company generally warrants its products against certain manufacturing and other defects in material and workmanship. These product warranties are provided for specific periods of time and are applicable assuming the product has not been subjected to misuse, improper installation, negligent handling or shipping damage. As of October 31, 2014 and 2013, the Company’s accrual for estimated product warranty claims totaled $100,000 and $190,000, respectively, and is included in accounts payable and accrued expenses. Warranty claims expense includes the costs to investigate claims and potential claims, and the costs to replace and/or repair product pursuant to claims, which can include claims not deemed valid by the Company. The accrued product warranty costs are based primarily on historical experience of actual warranty claims and costs as well as current information with respect to potential warranty claims and costs. Warranty claims expense for the years ended October 31, 2014, 2013 and 2012 totaled $220,525, $224,969 and $348,947, respectively.
The following table summarizes the changes in the Company’s accrual for product warranties during the fiscal years ended October 31, 2014 and 2013:
|
Years ended October 31, |
||||||||
|
2014 |
2013 |
|||||||
|
Balance at beginning of year |
$ | 190,000 | $ | 250,000 | ||||
|
Liabilities accrued for warranties issued during the year |
323,564 | 385,272 | ||||||
|
Warranty claims paid during the period |
(310,525 | ) | (284,969 | ) | ||||
|
Changes in liability for pre-existing warranties during the year |
(103,039 | ) | (160,303 | ) | ||||
|
Balance at end of year |
$ | 100,000 | $ | 190,000 | ||||
|
(7) |
Long-term Debt and Note Payable to Bank |
The Company has credit facilities consisting of a real estate term loan, as amended (the “Virginia Real Estate Loan”), a supplemental real estate term loan, as amended (the “North Carolina Real Estate Loan”) and a revolving credit facility, as amended (the “Commercial Loan”).
Both the Virginia Real Estate Loan and the North Carolina Real Estate Loan are with Valley Bank, have a fixed interest rate of 4.25% and are secured by a first priority lien on all of the Company’s personal property and assets, except for the Company’s inventory, accounts, general intangibles, deposit accounts, instruments, investment property, letter of credit rights, commercial tort claims, documents and chattel paper, as well as a first lien deed of trust on the Company’s real property.
Long-term debt as of October 31, 2014 and 2013 consists of the following:
|
October 31, |
||||||||
|
2014 |
2013 |
|||||||
|
Virginia Real Estate Loan ($6.5 million original principal) payable in monthly installments of $36,426, including interest (at 4.25%), with final payment of $4,858,220 due April 30, 2018 |
$ | 5,575,586 | $ | 5,767,947 | ||||
|
North Carolina Real Estate Loan ($2.24 million original principal) payable in monthly installments of $12,553, including interest (at 4.25%), with final payment of $1,674,217 due April 30, 2018 |
1,921,433 | 1,987,723 | ||||||
|
Total long-term debt |
7,497,019 | 7,755,670 | ||||||
|
Less current installments |
269,996 | 258,628 | ||||||
|
Long-term debt, excluding current installments |
$ | 7,227,023 | $ | 7,497,042 | ||||
The Commercial Loan provides the Company with a revolving line of credit for the working capital needs of the Company. Under the terms of the Commercial Loan, the Company may borrow an aggregate principal amount at any one time outstanding not to exceed the lesser of (i) $9.0 million, or (ii) the sum of 85% of certain receivables aged 90 days or less plus 35% of the lesser of $1.0 million or certain foreign receivables plus 25% of certain raw materials inventory.
On August 11, 2014, the Company entered into a commercial note renewal (“Binding Letter of Renewal”) extending the maturity date of the Commercial Loan to August 31, 2016. The Binding Letter of Renewal only extends the maturity date of the Commercial Loan. All other terms of the Commercial Loan remain unaltered and remain in full force and effect. Within the revolving loan limit of the Commercial Loan and the Binding Letter of Renewal, the Company may borrow, repay, and reborrow, at any time from time to time until August 31, 2016.
Advances under the Commercial Loan accrue interest at LIBOR plus 2.2% (resulting in a 2.35% rate at October 31, 2014). Accrued interest on the outstanding principal balance is due on the first day of each month, with all then outstanding principal, interest, fees and costs due at the Commercial Loan maturity date of August 31, 2016, the extended maturity date of the Commercial Loan.
The Commercial Loan is secured by a first priority lien on all of the Company’s inventory, accounts, general intangibles, deposit accounts, instruments, investment property, letter of credit rights, commercial tort claims, documents and chattel paper.
As of October 31, 2014 and 2013, the Company had $2.5 million of outstanding borrowings on its Commercial Loan and $6.5 million in available credit.
The aggregate maturities of long-term debt for each of the four years subsequent to October 31, 2014 are: $269,996 in fiscal year 2015, $2,780,999 in fiscal year 2016, $294,213 in fiscal year 2017 and $6,651,811 in fiscal year 2018.
|
(8) |
Leases |
The Company has an operating lease agreement for approximately 34,000 square feet of office, manufacturing and warehouse space in Plano, Texas (near Dallas). The original lease of approximately 21,000 square feet became effective September 15, 2009 and had an original term of five years. Effective May 19, 2011, the Company extended the term of the lease through November 30, 2016 and agreed to lease approximately 13,000 square feet of additional space adjacent to the existing leased property. The lease term for the additional space became effective September 1, 2011 and has the same termination date, November 30, 2016, as the original leased property. The minimum rent payments, including rent holidays, are recognized on a straight-line basis over the term of the lease.
Centric Solutions entered into an operating lease agreement in August 2008 for approximately 23,000 square feet of office and manufacturing space in Coppell, Texas, with a term of approximately seven years. Optical Cable Corporation is neither a party to nor a guarantor of Centric Solutions’ operating lease. The minimum rent payments, including rent holidays, are recognized on a straight-line basis over the term of the lease.
The Company’s future minimum lease payments under noncancelable operating leases (with initial or remaining lease terms in excess of one year) as of October 31, 2014 (including the Centric Solutions’ lease) consist of the following:
|
Fiscal year |
Operating Lease |
|||
|
2015 |
$ | 342,399 | ||
|
2016 |
209,103 | |||
|
2017 |
16,413 | |||
|
Total |
$ | 567,915 | ||
Total rent expense associated with the operating leases for the fiscal years ended October 31, 2014, 2013 and 2012 was $425,084, $385,649 and $439,675, respectively.
|
(9) |
Related Party Transactions |
During fiscal year 2013, the principal and interest on related party loans, payable to one of the AOS founders and a trust for which the founder is the co-trustee, were repaid in full. Interest on the two related party loans accrued at 6% per annum for one of the loans and at a rate equal to the prime rate plus 4% per annum for the other loan. Total interest expense associated with the related party loans for the fiscal years ended October 31, 2013 and 2012 was $4,157 and $9,602, respectively.
|
(10) |
Employee Benefits |
Health Insurance Coverage
The Company contracts for health insurance coverage for employees and their dependents through third-party administrators. During the years ended October 31, 2014, 2013 and 2012, total expense of $3,957,668, $3,999,078 and $3,303,968, respectively, was incurred under the Company’s insured health care program.
401(k) Plan
The Company maintains a 401(k) retirement savings plan for the benefit of its eligible employees. Substantially all of the Company’s employees who meet certain service and age requirements are eligible to participate in the plan. The Company’s plan document provides that the Company’s matching contributions are discretionary. The Company made or accrued matching contributions to the plan of $161,836, $130,361 and $229,417 for the years ended October 31, 2014, 2013 and 2012, respectively.
Stock Incentives for Key Employees and Non-Employee Directors
Optical Cable Corporation uses stock incentives to increase the personal financial interest key employees and non-employee Directors have in the future success of the Company, thereby aligning their interests with those of the shareholders and strengthening their desire to remain with the Company.
In March 2005, the Company adopted and the Company’s shareholders approved the Optical Cable Corporation 2005 Stock Incentive Plan (the “2005 Plan”). The Company authorized and reserved 1,000,000 shares of common stock for issuance pursuant to the 2005 Plan.
In March 2011, the Company adopted and the Company’s shareholders approved the Optical Cable Corporation 2011 Stock Incentive Plan (the “2011 Plan”). The Company authorized and reserved 500,000 shares of common stock for issuance pursuant to the 2011 Plan.
In March 2013, the Company’s shareholders approved the Optical Cable Corporation Amended and Restated 2011 Stock Incentive Plan (“Amended 2011 Plan”) that was recommended for approval by the Company’s Board of Directors. The Amended 2011 Plan reserved an additional 500,000 common shares of the Company for issuance under the Amended 2011 Plan and succeeded and replaced the 2005 Plan. As of October 31, 2014, there were approximately 111,000 remaining shares available for grant under the Optical Cable Corporation Amended 2011 Plan.
In March 2004, the Company adopted and the Company’s shareholders approved the 2004 Non-employee Directors Stock Plan (the “Non-employee Directors Stock Plan”). In March 2005, the Company adopted and the Company’s shareholders approved amendments to the Non-employee Directors Stock Plan. The Non-employee Directors Stock Plan authorizes the Board of Directors to pay all or a part of director fees, in the form of stock grants, to Board members who are not full-time employees of the Company. The Company reserved 250,000 shares of common stock for issuance pursuant to awards under the Non-employee Directors Stock Plan. As of October 31, 2014, there were no remaining shares available for grant under the Non-employee Directors Stock Plan.
Share-based compensation expense for employees, a consultant and non-employee members of the Company’s Board of Directors recognized in the consolidated statements of operations for the years ended October 31, 2014, 2013 and 2012 was $956,859, $971,145 and $1,440,534, respectively.
Restricted Stock Awards
The Company has granted, and anticipates granting, from time to time, restricted stock awards to employees subject to approval by the Compensation Committee of the Board of Directors. A portion of the restricted stock awards granted under the Amended 2011 Plan vest based on the passage of time and the remainder vest over time if certain operational performance-based criteria are met. Failure to meet the criteria required for vesting will result in a portion or all of the shares being forfeited.
The Company recognizes expense on the service-based shares each quarter based on the actual number of shares vested during the quarter multiplied by the closing price of the Company’s shares of common stock on the date of grant. The Company recognizes expense on the operational performance-based shares each quarter using an estimate of the shares expected to vest multiplied by the closing price of the Company’s shares of common stock on the date of grant.
The Company recorded compensation expense related to its restricted stock awards granted to employees and a consultant totaling $844,754 during the fiscal year ended October 31, 2014. The Company recorded compensation expense related to its restricted stock awards granted to employees totaling $817,657 and $1,287,271 during the fiscal years ended October 31, 2013 and 2012, respectively.
A summary of the status of the Company’s nonvested shares granted to employees and a consultant under the Amended 2011 Plan as of October 31, 2014, and changes during the year ended October 31, 2014, is as follows:
|
Nonvested shares |
Shares |
Weighted- average grant date fair value |
||||||
|
Balance at October 31, 2013 |
594,518 | $ | 3.95 | |||||
|
Granted |
363,034 | 3.87 | ||||||
|
Vested |
(133,613 | ) | 3.96 | |||||
|
Forfeited |
(48,879 | ) | 3.91 | |||||
|
Balance at October 31, 2014 |
775,060 | $ | 3.91 | |||||
As of October 31, 2014, the estimated amount of compensation cost related to unvested equity-based compensation awards in the form of service-based and operational performance-based shares that the Company will have to recognize over a 3.7 year weighted-average period is approximately $2.6 million.
During the years ended October 31, 2014, 2013 and 2012, restricted stock awards under the Non-employee Directors Stock Plan totaling 29,424, 36,632 and 44,424, respectively, were approved by the Board of Directors of the Company. The shares vested immediately upon grant, but could not be sold, transferred, pledged, or otherwise encumbered or disposed of until six months after the date of the grant. The Company recorded compensation expense equal to the number of shares multiplied by the closing price of the Company’s shares of common stock on the date of grant. The Company recorded compensation expense totaling $112,105, $153,488 and $153,263 during the years ended October 31, 2014, 2013 and 2012, respectively.
|
(11) |
Business and Credit Concentrations, Major Customers and Geographic Information |
The Company provides credit, in the normal course of business, to various commercial enterprises, governmental entities and not-for-profit organizations. Concentration of credit risk with respect to trade receivables is limited due to the Company’s large number of customers. The Company also manages exposure to credit risk through credit approvals, credit limits and monitoring procedures. Management believes that credit risks as of October 31, 2014 and 2013 have been adequately provided for in the consolidated financial statements.
For the year ended October 31, 2014, 16.8%, or approximately $14.0 million of consolidated net sales were attributable to one customer. No other customer or distributor accounted for more than 10% of consolidated net sales for the year ended October 31, 2014.
As of October 31, 2014, one customer had an outstanding balance payable to the Company totaling 13.9% of total consolidated shareholders’ equity. No other customer or distributor had an outstanding balance payable to the Company in excess of 5% of total consolidated shareholders’ equity.
For the year ended October 31, 2013, no single customer or distributor accounted for more than 10% of consolidated net sales. As of October 31, 2013, no single customer or distributor had an outstanding balance payable to the Company in excess of 5% of total consolidated shareholders’ equity.
For the year ended October 31, 2012, 12.7%, or approximately $10.6 million of consolidated net sales were attributable to one customer. No other customer or distributor accounted for more than 10% of consolidated net sales for the year ended October 31, 2012.
For the years ended October 31, 2014, 2013 and 2012, approximately 79%, 70% and 74%, respectively, of net sales were from customers in the United States, while approximately 21%, 30% and 26%, respectively, were from customers outside of the United States.
Net sales attributable to the United States and all other countries in total for the years ended October 31, 2014, 2013 and 2012 were as follows:
|
Years ended October 31, |
||||||||||||
|
2014 |
2013 |
2012 |
||||||||||
|
United States |
$ | 65,457,787 | $ | 52,931,288 | $ | 62,010,259 | ||||||
|
Outside the United States |
17,519,945 | 22,334,750 | 21,513,071 | |||||||||
|
Total net sales |
$ | 82,977,732 | $ | 75,266,038 | $ | 83,523,330 | ||||||
No individual country outside of the United States accounted for more than 10% of total net sales in fiscal years 2014, 2013 or 2012.
The Company has a single reportable segment for purposes of segment reporting, exclusive of Centric Solutions. For the years ended October 31, 2014, 2013 and 2012, Centric Solutions generated revenues, net of intercompany sales, totaling approximately $1.4 million, $1.5 million and $1.8 million, respectively. For the years ended October 31, 2014, 2013 and 2012, Centric Solutions incurred operating losses of approximately $256,000, $124,000 and $515,000, respectively. Total assets of Centric Solutions of approximately $220,000 and $329,000 (net of intercompany amounts) are included in the total consolidated assets of the Company as of October 31, 2014 and 2013, respectively.
|
(12) |
Income Taxes |
Income tax expense (benefit) for the years ended October 31, 2014, 2013 and 2012 consists of:
|
Fiscal year ended October 31, 2014 |
Current |
Deferred |
Total |
|||||||||
|
U.S. Federal |
$ | 666,517 | $ | (370,553 | ) | $ | 295,964 | |||||
|
State |
24,680 | (52,971 | ) | (28,291 | ) | |||||||
|
Totals |
$ | 691,197 | $ | (423,524 | ) | $ | 267,673 | |||||
|
Fiscal year ended October 31, 2013 |
Current |
Deferred |
Total |
|||||||||
|
U.S. Federal |
$ | (640,652 | ) | $ | 930,956 | $ | 290,304 | |||||
|
State |
(10,307 | ) | 67,791 | 57,484 | ||||||||
|
Totals |
$ | (650,959 | ) | $ | 998,747 | $ | 347,788 | |||||
|
Fiscal year ended October 31, 2012 |
Current |
Deferred |
Total |
|||||||||
|
U.S. Federal |
$ | 1,648,945 | $ | (491,256 | ) | $ | 1,157,689 | |||||
|
State |
167,160 | (67,514 | ) | 99,646 | ||||||||
|
Totals |
$ | 1,816,105 | $ | (558,770 | ) | $ | 1,257,335 | |||||
Reported income tax expense for the years ended October 31, 2014, 2013 and 2012 differs from the “expected” tax expense, computed by applying the U.S. Federal statutory income tax rate of 34% to income before income taxes as follows:
|
Years ended October 31, |
||||||||||||
|
2014 |
2013 |
2012 |
||||||||||
|
“Expected” tax expense |
$ | 302,797 | $ | 93,605 | $ | 1,320,402 | ||||||
|
Increase (reduction) in income tax expense resulting from: |
||||||||||||
|
Benefits from domestic manufacturing deduction |
(61,024 | ) | — | (177,230 | ) | |||||||
|
Nondeductible compensation |
— | 93,886 | — | |||||||||
|
State income taxes, net of federal benefit |
(23,031 | ) | 39,331 | 62,936 | ||||||||
|
Loss of permanent deductions due to NOL carryback |
— | 54,907 | — | |||||||||
|
Other differences, net |
48,931 | 66,059 | 51,227 | |||||||||
|
Reported income tax expense |
$ | 267,673 | $ | 347,788 | $ | 1,257,335 | ||||||
The tax effects of temporary differences that give rise to significant portions of the Company’s deferred tax assets and deferred tax liabilities as of October 31, 2014 and 2013 are presented below:
|
October 31, |
||||||||
|
2014 |
2013 |
|||||||
|
Deferred tax assets: |
||||||||
|
Accounts receivable, due to allowances for doubtful accounts and sales returns |
$ | 87,381 | $ | 166,789 | ||||
|
Inventories, due to allowance for damaged and slow-moving inventories and additional costs inventoried for tax purposes pursuant to the Tax Reform Act of 1986 |
1,127,226 | 951,543 | ||||||
|
Liabilities recorded for accrued expenses, deductible for tax purposes when paid |
527,806 | 119,054 | ||||||
|
Share-based compensation expense |
163,928 | 50,541 | ||||||
|
Investment in Centric Solutions |
125,555 | 137,119 | ||||||
|
Net operating loss carryforwards |
573,926 | 960,984 | ||||||
|
Other |
75,940 | 113,579 | ||||||
|
Total gross deferred tax assets |
2,681,762 | 2,499,609 | ||||||
|
Deferred tax liabilities: |
||||||||
|
Plant and equipment, due to differences in depreciation and capital gain recognition |
(442,870 | ) | (687,090 | ) | ||||
|
Other receivables, due to accrual for financial reporting purposes |
(10,768 | ) | (7,919 | ) | ||||
|
Total gross deferred tax liabilities |
(453,638 | ) | (695,009 | ) | ||||
|
Net deferred tax asset |
$ | 2,228,124 | $ | 1,804,600 | ||||
As a result of the acquisition of AOS, the Company recorded certain deferred tax assets totaling $1,517,605 (after purchase accounting adjustments), related to net operating loss (“NOL”) carryforwards of $4,455,525, estimated to be available after considering Internal Revenue Code Section 382 limitations. As of October 31, 2014, $1,680,000 of these NOL carryforwards remain unused and may be used to reduce future taxable income. These NOL carryforwards begin to expire in fiscal year ending October 31, 2024.
The Company generated a Federal NOL and certain state NOLs during fiscal year 2013; all of which have been fully utilized as of October 31, 2014.
Based on the Company’s historical and projected pretax earnings and other relevant factors, management believes that it is more likely than not that the Company’s deferred tax assets at October 31, 2014 will be realized.
The Company estimates a liability for uncertain tax positions taken or expected to be taken in a tax return. The liability for uncertain tax positions is included in other noncurrent liabilities on the accompanying consolidated balance sheets.
A reconciliation of the unrecognized tax benefits for fiscal years 2014 and 2013 follows:
|
October 31, |
||||||||
|
2014 |
2013 |
|||||||
|
Unrecognized tax benefits balance at beginning of year |
$ | 198,307 | $ | 221,339 | ||||
|
Gross decreases for tax positions of prior years |
(41,853 | ) | (23,282 | ) | ||||
|
Gross increases for current year tax positions |
12,302 | 250 | ||||||
|
Unrecognized tax benefits balance at end of year |
$ | 168,756 | $ | 198,307 | ||||
During fiscal year 2014, the Company reduced accrued interest and penalties by $4,647 and $10,400, respectively, related to unrecognized tax benefits. During fiscal year 2013, the Company accrued interest and penalties of $7,738 and $5,735, respectively, related to unrecognized tax benefits. As of October 31, 2014 and 2013, the Company had approximately $93,709 and $108,756, respectively, of accrued interest and penalties related to uncertain tax positions. The total amount of unrecognized tax benefits that would affect the Company’s effective tax rate if recognized is $92,817 and $110,741 as of October 31, 2014 and 2013, respectively. The Company does not expect its unrecognized tax benefits to change significantly in the next 12 months.
The Company files income tax returns in the U.S. federal jurisdiction and in various state jurisdictions. The statute of limitations remains open for U.S. and certain state income tax examinations for years ended October 31, 2011 through October 31, 2013.
|
(13) |
Fair Value Measurements |
The carrying amounts reported in the consolidated balance sheets for cash, trade accounts receivable, other receivables, and accounts payable and accrued expenses, including accrued compensation and payroll taxes approximate fair value because of the short maturity of these instruments. The carrying values of the Company’s note payable to bank and long-term debt approximate fair value based on similar long-term debt issues available to the Company as of October 31, 2014 and 2013. Fair value is defined as the amount that would be received to sell an asset or paid to transfer a liability in an orderly transaction between market participants at the measurement date.
The Company uses a fair value hierarchy that prioritizes the inputs for valuation methods used to measure fair value. The three levels of the fair value hierarchy are as follows:
|
● |
Level 1 inputs are quoted prices (unadjusted) in active markets for identical assets or liabilities that the Company has the ability to access at the measurement date. |
|
● |
Level 2 inputs are inputs other than quoted prices included within Level 1 that are observable for the asset or liability, either directly or indirectly. |
|
● |
Level 3 inputs are observable inputs for the asset or liability. |
The Company utilizes the best available information in measuring fair value.
|
(14) |
Net Income (Loss) Per Share |
The following is a reconciliation of the numerators and denominators of the net income (loss) per share computations for the periods presented:
|
Years ended October 31, |
||||||||||||
|
2014 |
2013 |
2012 |
||||||||||
|
Net income (loss) attributable to OCC (numerator) |
$ | 684,227 | $ | (42,837 | ) | $ | 2,749,317 | |||||
|
Shares (denominator) |
6,764,263 | 5,784,545 | 6,455,817 | |||||||||
|
Basic and diluted net income (loss) per share |
$ | 0.10 | $ | (0.01 | ) | $ | 0.43 | |||||
Unvested shares as of October 31, 2013 totaling 594,518, were not included in the computation of basic and diluted net loss per share for the year ended October 31, 2013 (because to include such shares would have been antidilutive, or in other words, to do so would have reduced the net loss per share for that period).
|
(15) |
Shareholders’ Equity |
Share Repurchases
The Company, through plans approved by its Board of Directors, has repurchased and retired certain of its outstanding common stock. The following is a summary of the Company’s repurchase of shares and the costs associated with the repurchases, including brokerage and legal fees, for the periods presented.
|
Fiscal years ended October 31, |
Shares repurchased |
Cost |
||||||
|
2014 |
44,464 | $ | 195,206 | |||||
|
2013 |
129,500 | 543,420 | ||||||
|
2012 |
267,000 | 1,176,661 | ||||||
After the Company’s purchase and retirement of the shares of its common stock as set forth in the table above, the Company had 6,839,778 shares of its common stock issued and outstanding at October 31, 2014.
The Company has a plan, approved by its Board of Directors on September 20, 2012, to purchase and retire up to 320,000 shares of the Company’s common stock, or approximately 4.9% of the shares then outstanding. At the time the plan was approved, the Company anticipated that the purchases would be made over a 12- to 24-month period, but there is no definite time period for repurchase. As of October 31, 2014, the Company had 79,036 shares of its outstanding common stock remaining to purchase under this plan.
Stockholder Protection Rights Agreement
On October 28, 2011, the Board of Directors of the Company adopted a Stockholder Protection Rights Agreement (the “Rights Agreement”) and declared a dividend of one preferred share purchase right (a “Right”) for each outstanding share of Common Stock, no par value, of the Company (“Common Shares”), held of record at the close of business on November 2, 2011, or issued thereafter and prior to the Separation Time as defined in the Rights Agreement. Under the terms of the Rights Agreement, if a person or group who is deemed an Acquiring Person as defined in the Rights Agreement acquires 15% (or other applicable percentage, as provided in the Rights Agreement) or more of the outstanding common stock, each Right will entitle its holder (other than such person or members of such group) to purchase, at the Right’s then current exercise price, a number of shares of common stock having a market value of twice such price. In addition, if the Company is acquired in a merger or other business transaction after a person or group who is deemed an Acquiring Person has acquired such percentage of the outstanding common stock, each Right will entitle its holder (other than such person or members of such group) to purchase, at the Right’s then current exercise price, a number of the acquiring company’s common shares having a market value of twice such price.
Upon the occurrence of certain events, each Right will entitle its holder to purchase from the Company one one-thousandth of a Series A Participating Preferred Share (“Preferred Share”), no par value, at an exercise price of $25, subject to adjustment. Each Preferred Share will entitle its holder to 1,000 votes and will have an aggregate dividend rate of 1,000 times the amount, if any, paid to holders of common stock. The Rights will expire on November 2, 2021, unless the Rights are earlier redeemed or exchanged by the Company for $0.0001 per Right. The adoption of the Rights Agreement has no impact on the financial position or results of operations of the Company.
The Company has reserved 100,000 shares of its authorized preferred stock for issuance upon exercise of the Rights.
Dividends
The Company initiated a quarterly cash dividend of $0.01 per share on its common stock in October 2010. In January 2012, the quarterly cash dividend was increased to $0.015 per share and in December 2012, the quarterly cash dividend was increased to $0.02 per share.
|
(16) |
Contingencies |
From time to time, the Company is involved in various claims, legal actions and regulatory reviews arising in the ordinary course of business. In the opinion of management, the ultimate disposition of these matters will not have a material adverse effect on the Company’s financial position, results of operations or liquidity.
|
(17) |
New Accounting Standards Not Yet Adopted |
In July 2013, the Financial Accounting Standards Board ("FASB") issued Accounting Standards Update 2013-11, Presentation of an Unrecognized Tax Benefit When a Net Operating Loss Carryforward, a Similar Tax Loss, or a Tax Credit Carryforward Exists (“ASU 2013-11”). The amendments in ASU 2013-11 clarify that an unrecognized tax benefit, or a portion of an unrecognized tax benefit, should be presented in the financial statements as a reduction to a deferred tax asset for a net operating loss carryforward, a similar tax loss, or a tax credit carryforward if such settlement is required or expected in the event the uncertain tax position is disallowed. If a net operating loss carryforward, a similar tax loss, or a tax credit carryforward is not available at the reporting date, then the unrecognized tax benefit should be presented in the financial statements as a liability and should not be combined with deferred tax assets. ASU 2013-11 is effective for fiscal years, and interim periods within those fiscal years, beginning after December 15, 2013, with early adoption permitted. The adoption of ASU 2013-11 is not expected to have a material impact on the Company's results of operations, financial position or liquidity or its related financial statement disclosures.
In May 2014, the FASB issued Accounting Standards Update 2014-09, Revenue from Contracts with Customers (“ASU 2014-09”). ASU 2014-09 is a comprehensive new revenue recognition model that expands disclosure requirements and requires an entity to recognize revenue when promised goods or services are transferred to a customer at an amount that reflects the consideration it expects to receive in exchange for those goods or services. ASU 2014-09 is effective for annual reporting periods beginning after December 15, 2016, and interim periods therein, and early adoption is not permitted. The Company is currently evaluating the impact of the adoption of this guidance on the Company's results of operations, financial position and liquidity and its related financial statement disclosures.
There are no other new accounting standards issued, but not yet adopted by the Company, which are expected to materially impact the Company’s financial position, operating results or financial statement disclosures.
|
(18) |
Quarterly Results of Operations (Unaudited) |
The following is a summary of the unaudited quarterly results of operations for the years ended October 31, 2014 and 2013:
|
Quarter ended |
||||||||||||||||
|
Fiscal year ended October 31, 2014 |
January 31 |
April 30 |
July 31 |
October 31 |
||||||||||||
|
Net sales |
$ | 16,534,930 | $ | 20,190,729 | $ | 21,004,130 | $ | 25,247,943 | ||||||||
|
Gross profit |
5,407,662 | 6,659,915 | 7,338,478 | 9,066,307 | ||||||||||||
|
Income (loss) before income taxes |
(767,473 | ) | (312,583 | ) | 432,978 | 1,537,658 | ||||||||||
|
Net income (loss) attributable to Optical Cable Corporation |
(412,136 | ) | (143,277 | ) | 292,484 | 947,156 | ||||||||||
|
Basic and diluted net income (loss) per share attributable to Optical Cable Corporation |
$ | (0.07 | ) | $ | (0.02 | ) | $ | 0.04 | $ | 0.14 | ||||||
|
Cash dividends declared per common share |
$ | 0.02 | $ | 0.02 | $ | 0.02 | $ | 0.02 | ||||||||
|
Quarter ended |
||||||||||||||||
|
Fiscal year ended October 31, 2013 |
January 31 |
April 30 |
July 31 |
October 31 |
||||||||||||
|
Net sales |
$ | 17,295,453 | $ | 19,124,600 | $ | 19,601,919 | $ | 19,244,066 | ||||||||
|
Gross profit |
6,523,939 | 6,665,577 | 6,129,020 | 6,593,756 | ||||||||||||
|
Income (loss) before income taxes |
151,494 | 157,568 | (219,464 | ) | 185,712 | |||||||||||
|
Net income (loss) attributable to Optical Cable Corporation |
129,820 | 42,485 | (124,611 | ) | (90,531 | ) | ||||||||||
|
Basic and diluted net income (loss) per share attributable to Optical Cable Corporation |
$ | 0.02 | $ | 0.01 | $ | (0.02 | ) | $ | (0.02 | ) | ||||||
|
Cash dividends declared per common share |
$ | 0.02 | $ | 0.02 | $ | 0.02 | $ | 0.02 | ||||||||
Report of Independent Registered Public Accounting Firm
The Board of Directors and Shareholders
Optical Cable Corporation:
We have audited the accompanying consolidated balance sheets of Optical Cable Corporation and subsidiaries as of October 31, 2014 and 2013, and the related consolidated statements of operations, shareholders’ equity, and cash flows for each of the years in the three-year period ended October 31, 2014. These consolidated financial statements are the responsibility of the Company’s management. Our responsibility is to express an opinion on these consolidated financial statements based on our audits.
We conducted our audits in accordance with the standards of the Public Company Accounting Oversight Board (United States). Those standards require that we plan and perform the audit to obtain reasonable assurance about whether the financial statements are free of material misstatement. An audit includes examining, on a test basis, evidence supporting the amounts and disclosures in the financial statements. An audit also includes assessing the accounting principles used and significant estimates made by management, as well as evaluating the overall financial statement presentation. We believe that our audits provide a reasonable basis for our opinion.
In our opinion, the consolidated financial statements referred to above present fairly, in all material respects, the financial position of Optical Cable Corporation and subsidiaries as of October 31, 2014 and 2013, and the results of their operations and their cash flows for each of the years in the three-year period ended October 31, 2014, in conformity with U.S. generally accepted accounting principles.
/s/KPMG LLP
Roanoke, Virginia
December 19, 2014
Corporate Information
Corporate Headquarters
Optical Cable Corporation (OCC)
5290 Concourse Drive
Roanoke, VA 24019
Primary Legal Counsel
Woods Rogers PLC
10 South Jefferson Street
Suite 1400
Roanoke, VA 24011
Independent Registered Public Accounting Firm
KPMG LLP
10 South Jefferson Street
Suite 1010
Roanoke, VA 24011
Transfer Agent
American Stock Transfer & Trust Company
6201 15th Avenue
Brooklyn, NY 11219
Form 10-K Report
Shareholders may obtain, without charge, a copy of Optical Cable Corporation’s Form 10-K, including exhibits, as filed with the Securities and Exchange Commission. Write to Optical Cable Corporation, P.O. Box 11967, Roanoke, VA 24022-1967, attention Ms. Tracy G. Smith, Corporate Secretary. Additionally, our SEC filings are available to the public on the SEC Internet site (http://www.sec.gov).
Annual Meeting
The 2015 annual meeting of shareholders will be held at 10:00 a.m. on Tuesday, March 31, 2015, at the Green Ridge Recreation Center, 7415 Wood Haven Road, Roanoke, Virginia.
Corporate Information
(Continued)
Common Stock and Dividend Data
Our common stock is traded on the Nasdaq Global Market under the symbol OCC. According to the records of our transfer agent, the Company had approximately 420 shareholders of record as of December 12, 2014. Additionally, there are approximately 1,400 beneficial owners as of December 12, 2014. On December 12, 2014, our common stock closed at a price of $4.15 per share.
Employees of the Company and members of the Board of Directors owned at least 34.1% of the shares outstanding as of October 31, 2014, including shares still subject to potential forfeitures based on vesting requirements.
The following table sets forth for the fiscal periods indicated the high and low bid prices of our common stock, as reported on the Nasdaq Global Market, during the two most recent fiscal years:
|
Range of Bid Prices |
||||||||
|
Fiscal year ended October 31, 2014 |
High |
Low |
||||||
|
Fourth Quarter |
$ | 4.98 | $ | 3.98 | ||||
|
Third Quarter |
$ | 4.35 | $ | 3.62 | ||||
|
Second Quarter |
$ | 3.98 | $ | 3.61 | ||||
|
First Quarter |
$ | 4.07 | $ | 3.59 | ||||
|
Range of Bid Prices |
||||||||
|
Fiscal year ended October 31, 2013 |
High |
Low |
||||||
|
Fourth Quarter |
$ | 4.58 | $ | 3.75 | ||||
|
Third Quarter |
$ | 4.94 | $ | 4.00 | ||||
|
Second Quarter |
$ | 4.56 | $ | 3.83 | ||||
|
First Quarter |
$ | 4.45 | $ | 3.22 | ||||
Dividend Declaration
In October 2010, the Board of Directors authorized the initiation of a quarterly cash dividend and declared a cash dividend on our common stock of $0.01 per share. In fiscal year 2011, we declared dividends of $0.01 per share on a quarterly basis. In fiscal year 2012, the dividend rate was increased to $0.015 per share and we declared dividends at the increased rate on a quarterly basis. In fiscal year 2013, the dividend rate was increased to $0.02 per share and we declared dividends at the increased rate on a quarterly basis for both fiscal years 2013 and 2014. We intend to continue to declare quarterly cash dividends for the foreseeable future; however, the payment of future dividends and the amount of future dividends is at the discretion of our Board of Directors and may be dependent on future earnings, cash flow, financial condition and/or other relevant factors.
Corporate Information
(Continued)
|
Executive Officers of Optical Cable Corporation |
|
|
Neil D. Wilkin, Jr. |
Chairman of the Board, President and Chief Executive Officer |
|
Tracy G. Smith |
Senior Vice President, Chief Financial Officer and Corporate Secretary |
|
Board of Directors of Optical Cable Corporation |
|
| Neil D. Wilkin, Jr., Chairman | Chairman of the Board, President |
|
and Chief Executive Officer | |
|
Optical Cable Corporation | |
|
Randall H. Frazier |
President and Founder |
|
R. Frazier, Incorporated | |
|
John M. Holland |
President and Founder |
|
Holland Technical Services | |
|
Craig H. Weber |
Chief Executive Officer |
|
Home Care Delivered, Inc. | |
|
John B. Williamson, III |
Chairman of the Board |
|
RGC Resources, Inc. and | |
|
Roanoke Gas Company |