Attached files
| file | filename |
|---|---|
| EX-23.1 - EX-23.1 - Summit Materials, Inc. | d789569dex231.htm |
| EX-1.1 - EX-1.1 - Summit Materials, Inc. | d789569dex11.htm |
| EX-16 - EX-16 - Summit Materials, Inc. | d789569dex16.htm |
| EX-10.4 - EX-10.4 - Summit Materials, Inc. | d789569dex104.htm |
| EX-23.3 - EX-23.3 - Summit Materials, Inc. | d789569dex233.htm |
| EX-23.2 - EX-23.2 - Summit Materials, Inc. | d789569dex232.htm |
| EX-10.5 - EX-10.5 - Summit Materials, Inc. | d789569dex105.htm |
Table of Contents
As filed with the Securities and Exchange Commission on December 18, 2014.
Registration No. 333-
UNITED STATES
SECURITIES AND EXCHANGE COMMISSION
Washington, D.C. 20549
FORM S-1
REGISTRATION STATEMENT
UNDER
THE SECURITIES ACT OF 1933
Summit Materials, Inc.
(Exact Name of Registrant as Specified in its Charter)
| Delaware | 1400 | 47-1984212 | ||
| (State or other jurisdiction of incorporation or organization) |
(Primary Standard Industrial Classification Code Number) |
(I.R.S. Employer Identification No.) |
1550 Wynkoop Street, 3rd Floor
Denver, Colorado 80202
(303) 893-0012
(Address, including zip code, and telephone number, including area code, of Registrant’s principal executive offices)
Anne Lee Benedict, Esq.
Chief Legal Officer
Summit Materials, Inc.
1550 Wynkoop Street, 3rd Floor
Denver, Colorado 80202
(303) 893-0012
(Name, address, including zip code, and telephone number, including area code, of agent for service)
Copies to:
| Edgar J. Lewandowski, Esq. Edward P. Tolley III, Esq. Simpson Thacher & Bartlett LLP 425 Lexington Avenue New York, New York 10017 (212) 455-2000 |
Michael P. Kaplan, Esq. Sophia Hudson, Esq. Davis Polk & Wardwell LLP 450 Lexington Avenue New York, New York 10017 (212) 450-4000 |
Approximate date of commencement of the proposed sale of the securities to the public: As soon as practicable after the Registration Statement is declared effective.
If any of the securities being registered on this form are to be offered on a delayed or continuous basis pursuant to Rule 415 under the Securities Act of 1933, check the following box. ¨
If this form is filed to register additional securities for an offering pursuant to Rule 462(b) under the Securities Act, check the following box and list the Securities Act registration statement number of the earlier effective registration statement for the same offering. ¨
If this form is a post-effective amendment filed pursuant to Rule 462(c) under the Securities Act, check the following box and list the Securities Act registration statement number of the earlier effective registration statement for the same offering. ¨
If this form is a post-effective amendment filed pursuant to Rule 462(d) under the Securities Act, check the following box and list the Securities Act registration statement number of the earlier effective registration statement for the same offering. ¨
Indicate by check mark whether the registrant is a large accelerated filer, an accelerated filer, a non-accelerated filer, or a smaller reporting company. See the definitions of “large accelerated filer,” “accelerated filer” and “smaller reporting company” in Rule 12b-2 of the Exchange Act. (Check one):
| Large accelerated filer | ¨ | Accelerated filer | ¨ | |||
| Non-accelerated filer | x (Do not check if a smaller reporting company) | Smaller reporting company | ¨ |
CALCULATION OF REGISTRATION FEE
|
| ||||
| Title of Each Class of Securities to be Registered |
Proposed Offering Price(1)(2) |
Amount of Registration Fee | ||
| Class A common stock, par value $0.01 per share |
$100,000,000 | $11,620 | ||
|
| ||||
|
| ||||
| (1) | Estimated solely for the purpose of determining the amount of the registration fee in accordance with Rule 457(o) under the Securities Act of 1933. |
| (2) | Includes shares of Class A common stock subject to the underwriters’ option to purchase additional shares of Class A common stock. |
The Registrant hereby amends this Registration Statement on such date or dates as may be necessary to delay its effective date until the Registrant shall file a further amendment which specifically states that this Registration Statement shall thereafter become effective in accordance with Section 8(a) of the Securities Act of 1933 or until the Registration Statement shall become effective on such date as the Commission, acting pursuant to said Section 8(a), may determine.
Table of Contents
The information in this prospectus is not complete and may be changed. We may not sell these securities until the registration statement filed with the Securities and Exchange Commission is effective. This prospectus is not an offer to sell these securities and it is not soliciting an offer to buy these securities in any jurisdiction where the offer or sale is not permitted.
Subject to completion, dated December 18, 2014
Preliminary Prospectus
Shares

Summit Materials, Inc.
Class A Common Stock
This is the initial public offering of shares of Class A common stock of Summit Materials, Inc. No public market currently exists for our Class A common stock. We are offering all of the shares of Class A common stock that are being offered in this offering. We anticipate that the initial public offering price will be between $ and $ per share. We intend to apply to list our shares of Class A common stock on the New York Stock Exchange, or NYSE, under the symbol “SUM.”
After the completion of this offering, affiliates of The Blackstone Group L.P. will continue to own a majority of the voting power of shares eligible to vote in the election of our directors. As a result, we will be a “controlled company” within the meaning of the corporate governance standards of the NYSE. See “Management—Controlled Company Exception.”
We are an “emerging growth company” as defined under the federal securities laws and, as such, may elect to comply with certain reduced public company reporting requirements for future filings. See “Summary—Implications of Being an Emerging Growth Company.”
Investing in shares of our Class A common stock involves risks. See “Risk Factors” beginning on page 22 to read about factors you should consider before buying shares of our Class A common stock.
| Per Share | Total | |||||||
| Initial public offering price |
$ | $ | ||||||
| Underwriting discounts and commissions |
$ | $ | ||||||
| Proceeds, before expenses, to us(1) |
$ | $ | ||||||
| (1) | See “Underwriting (Conflicts of Interest)” for a description of compensation payable to the underwriters. |
To the extent that the underwriters sell more than shares of our Class A common stock, the underwriters have the option to purchase up to an additional shares of our Class A common stock from us at the initial public offering price less the underwriting discount, within 30 days from the date of this prospectus.
Neither the Securities and Exchange Commission nor any other regulatory body has approved or disapproved of these securities or passed upon the accuracy or adequacy of this prospectus. Any representation to the contrary is a criminal offense.
The underwriters expect to deliver the shares of our Class A common stock against payment in New York, New York on or about , 2015 (“T+2”).
| Citigroup | Goldman, Sachs & Co. |
| BofA Merrill Lynch |
Barclays |
Deutsche Bank Securities | RBC Capital Markets | |||
| Blackstone Capital Markets | ||||||||||
| BB&T Capital Markets | ||||||||||
| Stephens Inc. | ||||||||||
| Sterne Agee | ||||||||||
| Stifel |
The date of this prospectus is , 2015.
Table of Contents
Table of Contents
Neither we nor the underwriters have authorized anyone to provide you with information different from that contained in this prospectus or any free writing prospectus prepared by us or on our behalf. Neither we nor the underwriters take any responsibility for, or can provide any assurance as to the reliability of, any information other than the information in this prospectus or any free writing prospectus prepared by us or on our behalf. We and the underwriters are offering to sell, and seeking offers to buy, shares of our Class A common stock only in jurisdictions where offers and sales are permitted.
Unless indicated otherwise, the information included in this prospectus assumes no exercise by the underwriters of the option to purchase up to an additional shares of Class A common stock from us and that the shares of Class A common stock to be sold in this offering are sold at $ per share of Class A common stock, which is the midpoint of the price range indicated on the front cover of this prospectus.
ABOUT THIS PROSPECTUS
Financial Statement Presentation
This prospectus includes certain historical consolidated financial and other data for Summit Materials Holdings L.P. (“Summit Holdings”). Summit Holdings will be considered our predecessor for financial reporting purposes. Summit Materials, Inc. will be the financial reporting entity following this offering of our Class A common stock. Summit Materials, LLC, an indirect wholly-owned subsidiary of Summit Holdings, is the financial reporting entity with respect to our outstanding 10 1⁄2% senior notes due 2020 (the “senior notes”). The historical consolidated financial information of Summit Holdings as of December 28, 2013 and December 29, 2012 and for the three years ended December 28, 2013, December 29, 2012 and December 31, 2011 has been derived from the audited consolidated financial statements of Summit Holdings included elsewhere in this prospectus. We have derived the historical consolidated balance sheet data of Summit Holdings as of December 31, 2011 from Summit Holdings’ consolidated balance sheet as of December 31, 2011, which is not included in this prospectus. The historical consolidated financial information of Summit Holdings as of September 27, 2014 and for the nine months ended September 27, 2014 and September 28, 2013 was derived
Table of Contents
from the unaudited consolidated financial statements of Summit Holdings included elsewhere in this prospectus. The unaudited consolidated financial statements of Summit Holdings have been prepared on the same basis as the audited consolidated financial statements and, in our opinion, have included all adjustments, which include normal recurring adjustments necessary to present fairly in all material respects our financial position and results of operations. The results for any interim period are not necessarily indicative of the results that may be expected for the full year. Additionally, our historical results are not necessarily indicative of the results expected for any future period.
This prospectus also includes an unaudited pro forma condensed consolidated balance sheet as of September 27, 2014 and unaudited pro forma condensed consolidated statements of income for the nine months ended September 27, 2014 and the year ended December 28, 2013, which present our consolidated financial position and results of operations to give pro forma effect to the issuance of shares of our Class A common stock offered by us in this offering and the other transactions described under “Unaudited Pro Forma Condensed Consolidated Financial Information.” The unaudited pro forma financial information is presented for illustrative purposes only and is not necessarily indicative of the operating results or financial position that would have occurred if the relevant transactions had been consummated on the date indicated, nor is it indicative of future operating results.
Our fiscal year is based on a 52-53 week year with each quarter composed of 13 weeks ending on a Saturday.
You should read our selected historical consolidated financial data and unaudited pro forma condensed consolidated financial information and the accompanying notes in conjunction with, and each is qualified in their entirety by reference to, the consolidated historical financial statements and related notes included elsewhere in this prospectus and the financial and other information appearing elsewhere in this prospectus, including information contained in “Risk Factors,” “Use of Proceeds,” “Capitalization” and “Management’s Discussion and Analysis of Financial Condition and Results of Operations.”
Other than the inception balance sheet, the financial statements of Summit Materials, Inc. have not been included in this prospectus as it is a newly incorporated entity, has no business transactions or activities to date, has no capitalization, and had no assets or liabilities during the periods presented in this prospectus.
Certain Definitions
As used in this prospectus, unless otherwise noted or the context otherwise requires:
| • | “We,” “our,” “us,” “the Company” and “Summit Materials” refer (1) prior to the consummation of the Offering Transactions described under “Organizational Structure—Offering Transactions,” to Summit Materials Holdings L.P. and its consolidated subsidiaries and (2) after the Offering Transactions described under “Organizational Structure—Offering Transactions,” to Summit Materials, Inc. and its consolidated subsidiaries. “Existing owners” and “pre-IPO owners” refer to the Sponsors and the other owners of Summit Holdings immediately prior to the Offering Transactions; |
| • | “Summit Holdings” refers to Summit Materials Holdings L.P.; |
| • | “Hamm” refers to Hamm, Inc., our inaugural acquisition; |
| • | “Cornejo” refers collectively to Cornejo & Sons, L.L.C., C&S Group, Inc., Concrete Materials Company of Kansas, LLC and Cornejo Materials, Inc.; |
| • | “Harper Contracting” refers collectively to substantially all the assets of Harper Contracting, Inc., Harper Sand and Gravel, Inc., Harper Excavating, Inc., Harper Ready Mix Company, Inc. and Harper Investments, Inc.; |
| • | “Altaview Concrete” refers collectively to Altaview Concrete, LLC, Peak Construction Materials, LLC, Peak Management, L.C. and Wasatch Concrete Pumping, LLC; |
ii
Table of Contents
| • | “RK Hall” refers collectively to R.K. Hall Construction, Ltd., RHMB Capital, L.L.C., Hall Materials, Ltd., B&H Contracting, L.P., RKH Capital, L.L.C. and SCS Materials, L.P.; |
| • | “B&B” refers collectively to B&B Resources, Inc., Valley Ready Mix, Inc. and Salt Lake Sand & Gravel, Inc.; |
| • | “Industrial Asphalt” refers collectively to Industrial Asphalt, LLC, Asphalt Paving Company of Austin, LLC, KBDJ, L.P. and all the assets of Apache Materials Transport, Inc.; |
| • | “Ramming Paving” refers collectively to J.D. Ramming Paving Co., LLC, RTI Hot Mix, LLC, RTI Equipment Co., LLC and Ramming Transportation Co., LLC; |
| • | “Norris” refers to Norris Quarries, LLC; |
| • | “Kay & Kay” refers to certain assets of Kay & Kay Contracting, LLC; |
| • | “Sandco” refers to certain assets of Sandco Inc.; |
| • | “Lafarge” refers to Lafarge North America, Inc.; |
| • | “Westroc” refers to Westroc, LLC; |
| • | “Alleyton” refers collectively to Alleyton Resource Company, LLC, Alcomat, LLC and Alleyton Services Company, LLC, the surviving entities from the acquisition of Alleyton Resource Corporation, Colorado Gulf, LP and certain assets of Barten Shephard Investments, LP; |
| • | “Troy Vines” refers to Troy Vines, Incorporated; |
| • | “Buckhorn Materials” refers to Buckhorn Materials, LLC, which is the surviving entity from the acquisition of Buckhorn Materials LLC and Construction Materials Group LLC; |
| • | “Canyon Redi-Mix” refers collectively to Canyon Redi-Mix, Inc. and CRM Mixers LP; |
| • | “Mainland” refers to Mainland Sand & Gravel ULC, which is the surviving entity from the acquisition of Rock Head Holdings Ltd., B.I.M. Holdings Ltd., Carlson Ventures Ltd., Mainland Sand and Gravel Ltd. and Jamieson Quarries Ltd.; |
| • | “Southwest Ready Mix” refers to Southwest Ready Mix, LLC; |
| • | “Colorado County S&G” refers to Colorado County Sand & Gravel Co., L.L.C., which is the surviving entity from the acquisition of Colorado County Sand & Gravel Co., L.L.C, M & M Gravel Sales, Inc., Marek Materials Co. Operating, Ltd. and Marek Materials Co., L.L.C.; |
| • | “Concrete Supply” refers to Concrete Supply of Topeka, Inc., Penny’s Concrete and Ready Mix, L.L.C. and Builders Choice Concrete Company of Missouri, L.L.C.; |
| • | “Blackstone” refers to investment funds associated with or designated by The Blackstone Group L.P. and its affiliates; |
| • | “Silverhawk” refers to certain investment funds affiliated with Silverhawk Summit, L.P.; and |
| • | “Sponsors” refers to Blackstone and Silverhawk. |
Defined terms above that relate to our completed acquisitions are in chronological order. See “Business—Acquisition History” for a table of acquisitions we have completed since August 2009.
iii
Table of Contents
This summary highlights information contained elsewhere in this prospectus and does not contain all of the information you should consider before investing in shares of our Class A common stock. You should read this entire prospectus carefully, including the section entitled “Risk Factors” and the financial statements and the related notes thereto included elsewhere in this prospectus, before you decide to invest in shares of our Class A common stock.
Our Company
We are one of the fastest growing heavy-side construction materials companies in the United States, with a 126% increase in revenue between the year ended December 31, 2010 and the year ended December 28, 2013, as compared to an average increase of approximately 17% in revenue reported by our competitors over the same period. Our materials include aggregates, which we supply across the country, with a focus on Texas, Kansas, Kentucky, Missouri and Utah, and cement, which we supply primarily in Missouri, Iowa and Illinois. Within our markets, we offer customers a single-source provider for heavy-side construction materials and related downstream products through our vertical integration. In addition to supplying aggregates to customers, we use our materials internally to produce ready-mixed concrete and asphalt paving mix, which may be sold externally or used in our paving and related services businesses. Our vertical integration creates opportunities to increase aggregates volumes and optimize margin at each stage of production and enables us to provide customers with efficiency gains, convenience and reliability, which we believe gives us a competitive advantage.
Since our first acquisition five years ago, we have rapidly become a major participant in the U.S. heavy-side construction materials industry. We believe that, by volume, we are a top 10 aggregates supplier, a top 25 cement producer and a major producer of ready-mixed concrete and asphalt paving mix. Our revenue in 2013 and the first nine months of 2014 was $916.2 million and $870.1 million, respectively, with net losses for the same periods of $103.7 million and $10.8 million, respectively. Our proven and probable aggregates reserves were 2.1 billion tons as of September 27, 2014. In the twelve months ended September 27, 2014 we sold 22.1 million tons of aggregates, 1.0 million tons of cement, 2.3 million cubic yards of ready-mixed concrete and 4.2 million tons of asphalt paving mix across our more than 200 sites and plants.
The rapid growth we have achieved over the last five years has been due in large part to our acquisitions, which we funded with equity commitments that our Sponsors and certain other investors made to Summit Holdings together with debt financing. During this period, we witnessed a cyclical decline and slow recovery in the private construction market and nominal growth in public infrastructure spending. However, the private construction market is beginning to rebound, which we believe signals the outset of a strong growth period in our industry and end markets. We believe we are well positioned to capitalize on this anticipated recovery in order to grow our business and reduce our leverage over time. As of September 27, 2014, our total indebtedness was approximately $1,091.1 million, or $ million on a pro forma basis after giving effect to this offering and the application of the net proceeds.
The private construction market includes residential and nonresidential new construction and the repair and remodel market. According to the National Association of Home Builders, the number of total housing starts in the United States, a leading indicator for our residential business, is expected to grow 57% from 2013 to 2016. In addition, the Portland Cement Association (“PCA”) projects that spending in private nonresidential construction will grow 26% over the same period. The private construction market represented 53% of our revenue for the nine months ended September 27, 2014.
Public infrastructure, which includes spending by federal, state and local governments for roads, highways, bridges, airports and other public infrastructure projects, has been a relatively stable portion of government
1
Table of Contents
budgets providing consistent demand to our industry and is projected by the PCA to grow approximately 3% from 2013 to 2016. With the nation’s infrastructure aging, we expect U.S. infrastructure spending to grow over the long term, and we believe we are well positioned to capitalize on any such increase. Despite this projected growth, we do not believe it will be consistent across the United States, but will instead be concentrated in certain regions, like Texas, which represented 35% of our revenue for the nine months ended September 27, 2014 and has consistently shown more growth over the last few years than almost all other major markets. The public infrastructure market represented 47% of our revenue for the nine months ended September 27, 2014.
In addition to the anticipated growth in our end markets, we expect higher volume and pricing in our core product categories. The PCA estimates cement consumption will increase approximately 30% from 2013 to 2016, reflecting rising demand in the major end markets. At the same time, we believe that cement pricing will be driven higher by tightening production capacity in the United States, where the PCA projects consumption will exceed domestic cement capacity by 2017 driven by both increasing demand and by other capacity constraints arising from the U.S. Environmental Protection Agency’s (“EPA”) National Emission Standards for Hazardous Air Pollutants (“NESHAP”) regulation for Portland Cement Plants (“PC-MACT”), with which compliance is generally required in 2015. Favorable market dynamics can also be seen in aggregates, where volumes decreased from 3.1 billion tons in 2006 to an estimated 2.1 billion tons in 2013, a 34% decline that has been offset by growth in the average price per ton, which increased from $7.37 in 2006 to an estimated $8.94 in 2013, a 21% increase, according to the U.S. Geological Survey. Consistent with these market trends, our cement and aggregates average pricing increased 5% and 3%, respectively, from the year ended December 31, 2010 to the nine months ended September 27, 2014.
Historically, we have sought to supplement organic growth potential with acquisitions, by strategically targeting attractive, new markets or expanding in existing markets. We consider population trends, employment rates, competitive landscape, private construction outlook, public funding and various other factors prior to entering a new market. In addition to analyzing macroeconomic data, we seek to establish a top position in our local markets, which we believe supports our achieving sustainable organic growth and attractive returns. This positioning provides local economies of scale and synergies, which benefit our pricing, costs and profitability. We believe that each of our operating companies has a top three market share position in its local market.
Our acquisition strategy, to date, has helped us to achieve scale and rapid growth, and we believe that significant opportunities remain for growth through acquisition. We estimate that approximately 65% of the U.S. heavy-side construction materials market is privately owned. From this group, our senior management team maintains contact with over 300 private companies. These long-standing relationships, cultivated over decades, have been the primary source for our past acquisitions and, we believe, will be a key driver of our future growth. We believe the value proposition we offer to potential sellers has made us a buyer of choice and has enabled us to largely avoid competitive auctions and instead negotiate directly with sellers at attractive valuations.
Our Regional Platforms
We currently operate across 17 U.S. states and in Vancouver, Canada through our three regional platforms: West; Central; and East. Each of our operating businesses has its own management team that, in turn, reports to a regional president who is responsible for overseeing the operating businesses, developing growth opportunities, implementing best practices and integrating acquired businesses. Acquisitions are an important element of our strategy, as we seek to enhance value through increased scale and cost savings within local markets.
| • | West Region: Our West region includes operations in Texas, the Mountain states of Utah, Colorado, Idaho and Wyoming and in Vancouver, Canada where we supply aggregates, ready-mixed concrete, asphalt paving mix and paving and related services. As of September 27, 2014, the West region |
2
Table of Contents
| controlled approximately 0.7 billion tons of proven and probable aggregates reserves and $363.9 million of net property, plant and equipment and inventories (“hard assets”). During the year ended December 28, 2013, approximately 47% of our revenue and approximately 25% of our Adjusted EBITDA, excluding corporate charges, were generated in the West region. In 2014, we continued to expand the West region, with significant growth in Texas through key acquisitions in Houston and the Permian Basin region of West Texas as well as the establishment of a new platform in Vancouver, Canada with our September acquisition of Mainland. |
| • | Central Region: Our Central region extends across the Midwestern United States, most notably in Kansas, Missouri, Nebraska, Iowa and Illinois, where we supply aggregates, cement, ready-mixed concrete, asphalt paving mix and paving and related services. As of September 27, 2014, the Central region controlled approximately 0.9 billion tons of proven and probable aggregates reserves, approximately 0.4 billion of which serve its cement business, and $529.8 million of hard assets. During the year ended December 28, 2013, approximately 36%, of our revenue and approximately 63% of our Adjusted EBITDA, excluding corporate charges, was generated in the Central region. |
Our cement plant, commissioned in 2008, is a highly efficient, technologically advanced, integrated manufacturing and distribution system strategically located near Hannibal, Missouri, 100 miles north of St. Louis along the Mississippi River. We utilize an on-site solid and liquid waste fuel processing facility, which can reduce the plant’s fuel costs by up to 50% and is one of only 12 facilities in the United States with such capabilities. Our cement business primarily serves markets in Missouri, Iowa and Illinois.
| • | East Region: Our East region serves markets in Kentucky, South Carolina, North Carolina, Tennessee and Virginia, where we supply aggregates, asphalt paving mix and paving and related services. As of September 27, 2014, the East region controlled approximately 0.5 billion tons of proven and probable aggregates reserves and $157.8 million of hard assets. During the year ended December 28, 2013, approximately 17% of our revenue and approximately 12% of our Adjusted EBITDA, excluding corporate charges, was generated in the East region. |
Summary Regional Data
(as of October 3, 2014)
| West | Central | East | Total | |||||||||||||
| Aggregates Details: |
||||||||||||||||
| Tonnage of Reserves (thousands of tons): |
||||||||||||||||
| Hard Rock |
334,566 | 888,441 | 460,273 | 1,683,280 | ||||||||||||
| Sand and Gravel |
349,880 | 53,442 | 7,216 | 410,538 | ||||||||||||
|
|
|
|
|
|
|
|
|
|||||||||
| Total Tonnage of Reserves (thousands of tons) |
684,446 | 941,883 | 467,489 | 2,093,818 | ||||||||||||
| Annual Production Capacity (thousands of tons) |
19,683 | 5,632 | 4,878 | 30,193 | ||||||||||||
| Average Years Until Depletion(1) |
35 | 167 | 96 | 69 | ||||||||||||
| Ownership Details: |
||||||||||||||||
| Owned |
34 | % | 68 | % | 39 | % | 51 | % | ||||||||
| Leased |
66 | % | 32 | % | 61 | % | 49 | % | ||||||||
3
Table of Contents
| West | Central | East | Total | |||||||||||||
| Aggregate Producing Sites |
48 | 61 | 24 | 133 | ||||||||||||
| Ready-Mix Plants |
41 | 23 | — | 64 | ||||||||||||
| Asphalt Plants |
20 | 5 | 14 | 39 | ||||||||||||
|
|
|
|
|
|
|
|||||||||||
| Primary States: |
Texas | Kansas | Kentucky | |||||||||||||
| Utah | Missouri | South Carolina | ||||||||||||||
| Colorado | Nebraska | North Carolina | ||||||||||||||
| Idaho | Iowa | Tennessee | ||||||||||||||
| Wyoming | Illinois | Virginia | ||||||||||||||
| Vancouver | ||||||||||||||||
|
|
|
|
|
|
|
|||||||||||
| Primary Markets: |
Houston, TX | Wichita, KS | Lexington, KY | |||||||||||||
| Austin, TX | Kansas City, KS | Louisville, KY | ||||||||||||||
| San Antonio, TX | Topeka, KS | Bowling Green, KY | ||||||||||||||
| Midland, TX | Manhattan, KS | Elizabethtown, KY | ||||||||||||||
| Dallas, TX | Lawrence, KY | Charlotte, NC | ||||||||||||||
| Amarillo, TX | Columbia, MO | |||||||||||||||
| Longview, TX | St. Louis, MO | |||||||||||||||
| Texarkana, TX | Davenport, IA | |||||||||||||||
| Denison, TX | Iowa City, IA | |||||||||||||||
| Salt Lake City, UT | ||||||||||||||||
| Grand Junction, CO | ||||||||||||||||
| Vancouver, Canada | ||||||||||||||||
|
|
|
|
|
|
|
|||||||||||
| Products Produced: |
Aggregates | Aggregates | Aggregates | |||||||||||||
| Ready-Mix | Cement | Asphalt | ||||||||||||||
| Asphalt | Ready-Mix | |||||||||||||||
| Asphalt | ||||||||||||||||
|
|
|
|
|
|
|
|||||||||||
| Revenue by End Market for Nine Months ended September 27, 2014: |
||||||||||||||||
| Residential and Nonresidential |
61 | % | 55 | % | 11 | % | 53 | % | ||||||||
| Public |
39 | % | 45 | % | 89 | % | 47 | % | ||||||||
| (1) | Calculated based on total reserves divided by our average of 2012 and 2013 annual production. |
Our Competitive Strengths
Leading market positions. We believe each of our operating companies has a top three market share position in its local market area achieved through their respective, extensive operating histories, averaging over 35 years. We believe we are a top 10 supplier of aggregates, a top 25 producer of cement and a major producer of ready-mixed concrete and asphalt paving mix in the United States by volume. We focus on acquiring companies that have leading local market positions in aggregates, which we seek to enhance by building scale with other local aggregates and downstream products and services. The heavy-side construction materials industry is highly local in nature due to transportation costs from the high weight-to-value ratio of the products. Given this dynamic, we believe achieving local market scale provides a competitive advantage that drives growth and profitability for our business. We believe that our ability to prudently acquire, improve and rapidly integrate multiple businesses has enabled, and will continue to enable, us to become market leaders.
4
Table of Contents
Operations positioned to benefit from attractive industry fundamentals. We believe the heavy-side construction materials industry has attractive fundamentals, characterized by high barriers to entry and a stable competitive environment in the majority of markets. Barriers to entry are created by scarcity of raw material resources, limited efficient distribution range, asset intensity of equipment, land required for quarry operations and a time-consuming and complex regulatory and permitting process. According to the April 2014 U.S. Geological Survey, aggregates pricing in the United States had increased in 65 of the previous 70 years, with growth accelerating since 2002 as continuing resource scarcity in the industry has led companies to focus increasingly on improved pricing strategies. While aggregates volumes decreased 19% from 2.6 billion tons in 2008 to 2.1 billion tons in 2013, average price per ton of aggregates in the United States during this same time period increased 4% from $8.57 in 2008 to $8.95 in 2013. Pricing growth remained strong in 2013, despite volume declines in certain key end markets. Consistent with these market trends, our average aggregates and cement pricing increased 3% and 5%, respectively, from average prices for the year ended December 31, 2010 as compared to average prices for the nine months ended September 27, 2014.
One significant factor that allows for pricing growth in periods of volume declines is that aggregates and asphalt paving mix have significant exposure to public road construction, which has demonstrated growth over the past 30 years, even during times of broader economic weakness. The majority of public road construction spending is funded at the state level through the states’ respective departments of transportation. The five key states in which we operate (Texas, Kansas, Kentucky, Missouri and Utah) have funds with constitutionally-protected revenue sources dedicated for transportation projects. These dedicated, earmarked funding sources limit the negative effect current state deficits may have on public spending. As a result, we believe our business exhibits significantly more stability in profitability than witnessed in most other building product subsectors. We believe these business characteristics have helped mitigate the impact of the challenging economic environment on our profitability. Profits in the heavy-side construction materials industry are relatively stable throughout various economic cycles compared to other businesses in the construction industry, aided by favorable pricing dynamics with historically stable public infrastructure spending.
Vertically-integrated business model. We generate revenue across a spectrum of related products and services. We internally supply over approximately 80% of the aggregates used in the ready-mixed concrete and asphalt paving mixes that we produce and the asphalt paving mix that our paving crews lay. Our vertically-integrated business model enables us to operate as a single source provider of materials and paving and related services, creating cost, convenience and reliability advantages for our customers, while at the same time creating significant cross-marketing opportunities among our interrelated businesses. We believe this creates opportunities to increase aggregates volumes and optimize margin at each stage of production, fosters more stable demand for aggregates through a captive demand outlet, creates a competitive advantage through the efficiency gains, convenience and reliability provided to customers and enhances our acquisition strategy by allowing a greater range of target companies.
Attractive diversity, scale and product portfolio. Our three regional platforms operate across 17 U.S. states and Vancouver, Canada in 27 metropolitan statistical areas. Between the year ended December 31, 2010 and the twelve months ended September 27, 2014, we grew our revenue by 173% and brought substantial additional scale and geographic diversity to our operations. A combination of increased scale and vertical integration enabled us to improve profitability with Adjusted EBITDA margins increasing 330 basis points from 2010 to the twelve months ended September 27, 2014. In the twelve months ended September 27, 2014, 85.2% of EBITDA was derived from materials and products, with 52.5% coming from materials and 32.7% from products, and the remaining 14.8% of EBITDA being derived from services. We have approximately 2.1 billion tons of proven and probable aggregates reserves serving our aggregates and cement business. Assuming production rates in future years are equal to those in 2013, we estimate that the useful life of the proven and probable reserves for our aggregates and cement businesses are over 55 years and 300 years, respectively.
5
Table of Contents
We own a dry process cement plant that was commissioned in 2008. This large capacity plant has technologically advanced manufacturing capabilities and favorable environmental performance compared to older facilities within the industry that will require upgrades to comply with stringent EPA standards coming into effect in the near term. According to PCA forecasts, consumption of cement in the United States is expected to exceed production capacity by the year 2017, creating opportunities for existing cement plants. In addition, our plant is strategically located on the Mississippi River. The U.S. cement industry is regional in nature, with customers typically purchasing material from local sources due to transportation costs. According to the PCA 2014 United States Cement Industry Annual Yearbook, approximately 98% of cement sold in the United States was shipped to customers by truck in 2012. However, in 2013, as a result of our plant’s strategic location on the Mississippi River, we shipped approximately 15% of our cement sold by barge, which is generally more cost-effective than truck transport.
Proven ability to incorporate new acquisitions and grow businesses. Since July 2009, we have acquired 34 companies, successfully integrating the businesses into three regions through the implementation of operational improvements, industry-proven information technology systems, a comprehensive safety program and best in class management programs. A typical acquisition generally involves retaining the local management team of the acquired business, maintaining operational decisions at the local level and providing strategic insights and leadership directed by our President and Chief Executive Officer, a 30-year industry veteran. These acquisitions have helped us achieve significant revenue growth, from $405.3 million in 2010 to $916.2 million in 2013.
Experienced and proven leadership driving organic growth and acquisition strategy. Our management team, led by Tom Hill, our President and Chief Executive Officer, has a proven track record of creating value. In addition to Mr. Hill, our management team, including corporate and regional operations managers, corporate development, finance executives and other heavy side industry operators, has extensive experience in the industry. Our management team has a track record of executing and successfully integrating acquisitions in the sector. Mr. Hill and his team successfully executed a similar consolidation strategy at another company in the industry, where Mr. Hill led the integration of numerous acquisitions, taking the business from less than $0.3 billion to $7.4 billion in sales from 1992 to 2008 through 173 acquisitions worth approximately $6.3 billion in the aggregate.
Our Business Strategy
Capitalize on expected recovery in U.S. economy and construction markets. The residential and nonresidential markets are starting to show positive growth signs in varying degrees across our markets. The National Association of Home Builders forecasts total housing starts to accelerate to 1.46 million in the United States by 2016, representing a compounded annual growth rate of 16.4% from 2013 to 2016. The American Institute of Architects’ Consensus Construction Forecast projects nonresidential construction to grow 8.1% in 2015. We believe that we have sufficient exposure to the residential and nonresidential end markets to benefit from a potential recovery in all of our markets. In 2013, approximately 85% of our revenue was derived from Texas, Kansas, Kentucky, Missouri and Utah—five key states with attractive construction and growth stories. Across these states, Department of Transportation (“DOT”) budgets grew a combined 12.9% from 2013 to 2014. Given the nation’s aging infrastructure and considering longstanding historical spending trends, we expect U.S. infrastructure investment to grow over time. We believe we are well positioned to capitalize on any such increase in investment.
Of our markets, Texas is currently experiencing the most active growth. According to the PCA’s October 2014 Regional Construction InVue, total construction spending in Texas increased 20.5% from September 2013 to September 2014 and public construction and nonresidential spending increased 8.2% and 22.6%, respectively, over this same period. We are capitalizing on the growth in the Texas market by significantly increasing our investment there through acquisitions in Houston and the Permian Basin region of west Texas in 2014.
6
Table of Contents
Expand local positions in the most attractive markets through targeted capital investments and bolt-on acquisitions. We plan to expand our business through organic growth and bolt-on acquisitions in each of our local markets. Our acquisition strategy involves acquiring platforms that serve as the foundation for continued incremental and complementary growth via locally situated bolt-on acquisitions to these platforms. We believe that increased local market scale will drive profitable growth. Our existing platform of operations is expected to enable us to grow significantly as we expand in our existing markets. We believe that our balance sheet and liquidity position will support our growth strategy.
Drive profitable growth through strategic acquisitions. Our goal is to become a top-five U.S. heavy-side construction materials company through the successful execution of our acquisition strategy and implementation of best practices to drive organic growth. Based on aggregates sales, in volumes, we believe that we are currently a top-ten player, which we achieved within five years of our first acquisition. We believe that the relative fragmentation of our industry creates an environment in which we can continue to acquire companies at attractive valuations and increase scale and diversity over time through strategic acquisitions in markets adjacent to our existing markets within the states where we currently operate, as well as into additional states as market and competitive conditions support further growth.
Enhance margins and free cash flow generation through implementation of operational improvements. Our management team includes individuals with decades of experience in our industry and proven success in integrating acquired businesses and organically growing operations. This experience represents a significant source of value to us that has driven Adjusted EBITDA margins up 330 basis points from 2010 to the twelve months ended September 27, 2014. These margin improvements are accomplished through proven profit optimization plans, leveraging information technology and financial systems to control costs, managing working capital, achieving scale-driven purchasing synergies and fixed overhead control and reduction. Our regional presidents, supported by our central operations, risk management and finance and information technology teams, drive the implementation of detailed and thorough profit optimization plans for each acquisition post close, which typically includes, among other things, implementation of a systematic pricing strategy and an equipment utilization analysis that assesses repair and maintenance spending, the health of each piece of equipment and a utilization review to ensure we are maximizing productivity and selling any pieces of equipment that are not needed in the business.
Leverage vertically-integrated and strategically located operations for growth. We believe that our vertical integration of heavy-side construction materials, products and services is a significant competitive advantage that we will leverage to grow share in our existing markets and enter into new markets. A significant portion of materials used to produce our products and provide services to our customers is internally supplied, which enables us to operate as a single source provider of materials, products and paving and related services, creating cost, convenience and reliability advantages for our customers and enabling us to capture additional value throughout the supply chain, while at the same time creating significant cross-marketing opportunities among our interrelated businesses.
Our Industry
The U.S. heavy-side construction materials industry is composed of four primary sectors: aggregates; cement; ready-mixed concrete; and asphalt paving mix. Each of these materials is widely used in most forms of construction activity. Competition is constrained in part by the distance materials can be transported efficiently, resulting in predominantly local or regional operations. Participants in these sectors typically range from small, privately-held companies focused on a single material, product or market to multinational corporations that offer a wide array of construction materials, products and paving and related services. We estimate that approximately 65% of the aggregates in the United States are held by private companies.
7
Table of Contents
Transportation infrastructure projects, driven by both federal and state funding programs, represent a significant share of the U.S. heavy-side construction materials market. In addition to federal funding, highway construction and maintenance funding is available through state, county and local agencies. Our five largest states by revenue (Texas, Kansas, Kentucky, Missouri and Utah, which represented approximately 25%, 20%, 17%, 12% and 11%, respectively, of our total revenue in 2013) have funds with constitutionally-protected revenue sources dedicated for transportation projects.
Aggregates. Aggregates are key material components used in the production of cement, ready-mixed concrete and asphalt paving mixes for the residential, nonresidential and public infrastructure markets and are also widely used for various applications and products, such as road and building foundations, railroad ballast, erosion control, filtration, roofing granules and in solutions for snow and ice control. Generally extracted from the earth using surface or underground mining methods, aggregates are produced from natural deposits of various materials such as limestone, sand and gravel, granite and trap rock.
Aggregates represent an attractive market with high profit margins, high barriers to entry and increasing resource scarcity, which, as compared to construction services, leads to relatively stable profitability through economic cycles. Production is moderately capital intensive and access to well-placed reserves is important given high transport costs and environmental permitting restrictions. Markets are typically local due to high transport costs and are generally fragmented, with numerous participants operating in localized markets. The top players controlled approximately 30% of the national market in 2013. According to the March 2014 U.S. Geological Survey, the U.S. market for these products was estimated at approximately 2.1 billion tons in 2013, at a total market value of $18.6 billion. Relative to other heavy-side construction materials, such as cement, aggregates consumption is more heavily weighted towards public infrastructure and maintenance and repair. However, the mix of end uses can vary widely by geographic location, based on the nature of construction activity in each market. Typically, three to six competitors comprise the majority market share of each local market because of the constraints around the availability of natural resources and transportation. Vertically-integrated players can have an advantage versus smaller, non-integrated producers by leveraging their aggregates for downstream operations, such as ready-mixed concrete, asphalt paving mix and paving and related services.
Cement. Portland cement, an industry term for the common cement in general use around the world, is the basic ingredient of concrete and is made from a combination of limestone, shale, clay, silica and iron ore. Together with water, cement creates the paste that binds the aggregates together when making concrete. Cement is an input for ready-mixed concrete and concrete products and commands significantly higher prices relative to aggregates, reflecting the more intensive capital investment required. Cement production in the United States is distributed among 98 production facilities located across 34 states and is a capital-intensive business with variable costs dominated by raw materials and energy required to fuel the kiln. Building new plants is challenging given the extensive permitting requirements and capital investment requirements. We estimate new plant construction costs in the United States to be approximately $250-300 per ton, not including costs for property or securing raw materials and the required distribution network. Assuming construction costs of $275 per ton, a 1.25 million ton facility, comparable to our cement plant’s potential annual capacity, would cost approximately $343.8 million to construct.
Ready-mixed concrete. Ready-mixed concrete is one of the most versatile and widely used materials in construction today. It is created through the combination of coarse and fine aggregates, which make up approximately 60 to 75% of the mix by volume, with water, various chemical admixtures and cement making up the remainder. Given the high weight-to-value ratio, delivery of ready-mixed concrete is typically limited to a one-hour haul from a production plant and is further limited by a 90 minute window in which newly-mixed concrete must be poured to maintain quality and performance. As a result of the transportation constraints, the ready-mixed concrete market is highly localized, with an estimated 5,500 ready-mixed concrete plants in the
8
Table of Contents
United States, according to the National Ready Mixed Concrete Association (the “NRMCA”). We participate selectively in ready-mixed concrete markets where we provide our own aggregates for production, which we believe provides us a competitive advantage.
Asphalt paving mix. Asphalt paving mix is the most common roadway material used today, covering 93% of the more than 2.6 million miles of paved roadways in the United States, according to the National Asphalt Pavement Association (“NAPA”). Major inputs include aggregates and liquid asphalt (the refined residue from the distillation process of crude oils by refineries). Given the significant aggregates component in asphalt paving mix (up to 95% by weight), local aggregates producers often participate in the asphalt paving mix business to secure captive demand for aggregates. Asphalt and paving is highly fragmented in the United States, with end markets skewed towards new road construction and maintenance and repair of roads. Barriers to entry include permit requirements, access to aggregates (where possible, asphalt plants are typically located at quarries) and access to liquid asphalt.
Our Structure
Following this offering, Summit Materials, Inc. will be a holding company, and its sole asset will be a controlling equity interest in Summit Holdings. Summit Materials, Inc. will operate and control all of the business and affairs and consolidate the financial results of Summit Holdings and its subsidiaries. Prior to the completion of this offering, the partnership agreement of Summit Holdings will be amended and restated to, among other things, modify its capital structure by reclassifying the interests currently held by our pre-IPO owners into a single new class of units that we refer to as “LP Units.” We and our pre-IPO owners will also enter into an exchange agreement under which they (or certain permitted transferees) will have the right, from and after the first anniversary of the date of the completion of this offering (subject to the terms of the exchange agreement), to exchange their LP Units for shares of our Class A common stock on a one-for-one basis, subject to customary conversion rate adjustments for stock splits, stock dividends and reclassifications. Notwithstanding the foregoing, Blackstone is generally permitted to exchange LP Units at any time. See “Certain Relationships and Related Person Transactions—Exchange Agreement.”
Summit Owner Holdco, LLC (“Summit Owner Holdco”), a Delaware limited liability company that will be owned by our pre-IPO owners and holders of Class B Units of Continental Cement Company, L.L.C. (“Continental Cement”), will initially hold all of the shares of our Class B common stock that will be outstanding upon consummation of this offering (the “IPO Date”). The Class B common stock will entitle (x) Summit Owner Holdco, without regard to the number of shares of Class B common stock held by it, to a number of votes that is equal to the aggregate number of LP Units held by all limited partners of Summit Holdings (excluding Summit Materials, Inc.) as of the IPO Date and their respective successors and assigns on or after the IPO Date (the “Initial LP Units”) less the number of such Initial LP Units that, after the IPO Date, have been transferred to Summit Materials, Inc. in accordance with the exchange agreement or are transferred to a holder other than Summit Owner Holdco together with a share of Class B common stock (or fraction thereof) and (y) each other holder of Class B common stock, without regard to the number of shares of Class B common stock held by such other holder, to a number of votes that is equal to the number of LP Units held by such holder. At the completion of this offering, our pre-IPO owners will comprise all of the limited partners of Summit Holdings. However, Summit Holdings may in the future admit additional limited partners that would not constitute pre-IPO owners. If at any time the ratio at which LP Units are exchangeable for shares of our Class A common stock changes from one-for-one as described under “Certain Relationships and Related Person Transactions—Exchange Agreement,” for example, as a result of a conversion rate adjustment for stock splits, stock dividends or reclassifications, the number of votes to which Class B common stockholders are entitled will be adjusted accordingly. Holders of shares of our Class B common stock will vote together with holders of our Class A common stock as a single class on all matters on which stockholders are entitled to vote generally, except as otherwise required by law.
9
Table of Contents
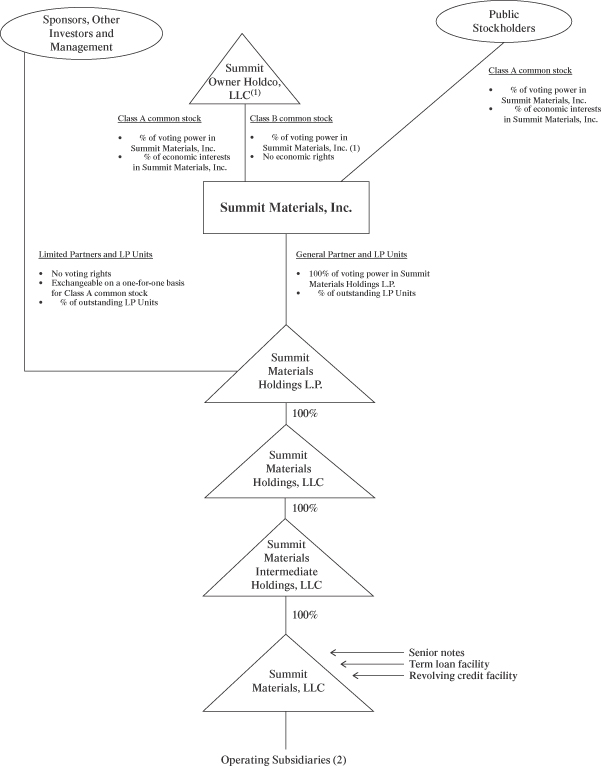
The diagram below depicts our organizational structure immediately following this offering. For additional detail, see “Organizational Structure.”
10
Table of Contents
| (1) | The Class B common stock will entitle Summit Owner Holdco, without regard to the number of shares of Class B common stock held by it, to a number of votes that is equal to the aggregate number of Initial LP Units less the number of such Initial LP Units that, after the IPO Date, have been transferred to Summit Materials, Inc. in accordance with the exchange agreement or are transferred to a holder other than Summit Owner Holdco together with a share of Class B common stock (or fraction thereof) and entitle each other holder of Class B common stock, without regard to the number of shares of Class B common stock held by such other holder, to a number of votes that is equal to the number of LP Units held by such holder. |
| (2) | Pursuant to the terms of the Amended and Restated Limited Liability Company Agreement of Continental Cement, a non-wholly-owned indirect subsidiary of Summit Holdings, the holders of 100,000,000 Class B Units of Continental Cement (the “Class B Unitholders”) have the right to elect to rollover their interests in Continental Cement in connection with an initial public offering. In lieu of the Class B Unitholders electing to rollover their interests in connection with this offering, we have entered into a contribution and purchase agreement with the Class B Unitholders whereby, concurrently with the consummation of this offering (w) the Class B Unitholders will contribute 28,571,429 of the Class B Units of Continental Cement to Summit Owner Holdco in exchange for Series A Units of Summit Owner Holdco, (x) the existing general partner of Summit Holdings will contribute to Summit Owner Holdco its right to act as the general partner of Summit Holdings in exchange for Series B Units of Summit Owner Holdco, (y) Summit Owner Holdco will in turn contribute the Class B Units of Continental Cement to Summit Materials, Inc. in exchange for shares of Class A common stock and will contribute to Summit Materials, Inc. its right to act as the general partner of Summit Holdings in exchange for shares of Class B common stock and (z) the Class B Unitholders will deliver the remaining 71,428,571 Class B Units of Continental Cement to Summit Holdings in exchange for a payment to be made by Summit Holdings in the amount of $35.0 million in cash and $15.0 million aggregate principal amount of non-interest bearing notes that will be payable in six aggregate annual installments, beginning on the first anniversary of the closing of this offering, of $2.5 million. The number of shares of Class A common stock to be held by Summit Owner Holdco as a result of the foregoing transactions will represent pro forma ownership of 1.469496% of the outstanding LP Units of Summit Holdings immediately prior to giving effect to this offering. As a result of the foregoing transactions, Continental Cement will become a wholly-owned subsidiary of Summit Holdings. Based on aggregate LP Units outstanding after the reclassification of Summit Holdings and prior to giving effect to this offering, Summit Owner Holdco would receive shares of Class A common stock and shares of Class B common stock (representing all outstanding shares of Class B common stock at the time of the consummation of this offering). As of September 27, 2014, Continental Cement had total assets of $368.9 million and for the year ended December 28, 2013 and nine months ended September 27, 2014 generated net income of $9.9 million and $2.0 million, respectively. |
Corporate Information
Summit Materials, Inc. was formed under the laws of the State of Delaware on September 23, 2014. Our principal executive office is located at 1550 Wynkoop Street, 3rd Floor, Denver, Colorado 80202. Through our predecessors, we commenced operations in 2009 when Summit Holdings was formed as an exempted limited partnership in the Cayman Islands. In December 2013, Summit Holdings was domesticated as a limited partnership in Delaware. Our telephone number is (303) 893-0012.
Our Sponsors
Blackstone. Blackstone is one of the world’s leading investment and advisory firms. Blackstone’s alternative asset management businesses include the management of corporate private equity funds, real estate funds, hedge fund solutions, credit-oriented funds and closed-end mutual funds. Blackstone also provides various financial advisory services, including financial and strategic advisory, restructuring and reorganization advisory
11
Table of Contents
and fund placement services. Through its different investment businesses, as of September 30, 2014, Blackstone had total assets under management of approximately $284.4 billion.
Silverhawk. Silverhawk Capital Partners, LLC is a private equity firm with offices in Greenwich, Connecticut and Charlotte, North Carolina. The founding partners have invested as a team and operated businesses since 1989. Founded in 2005, Silverhawk’s investments are focused in the energy, manufacturing and business service sectors. As of September 30, 2014, Silverhawk had approximately $200.0 million under management.
Investment Risks
An investment in shares of our Class A common stock involves substantial risks and uncertainties that may adversely affect our business, financial condition and results of operations and cash flows. Some of the more significant challenges and risks relating to an investment in our company include, among other things, the following:
| • | Our business depends on activity within the construction industry and the strength of the local economies in which we operate. |
| • | Our business is cyclical and requires significant working capital to fund operations. |
| • | Weather can materially affect our business, and we are subject to seasonality. |
| • | Our industry is capital intensive and we have significant fixed and semi-fixed costs. Therefore, our earnings are sensitive to changes in volume. |
| • | Within our local markets, we operate in a highly competitive industry. |
| • | The success of our business depends, in part, on our ability to execute on our acquisition strategy, to successfully integrate acquisitions and to retain key employees of our acquired businesses. |
| • | A decline in public infrastructure construction and reductions in governmental funding could adversely affect our operations and results. |
| • | Environmental, health and safety laws and regulations and any changes to, or liabilities arising under, such laws and regulations may have a material adverse effect on our business, financial condition, results of operations and liquidity. |
| • | If we are unable to accurately estimate the overall risks, requirements or costs when we bid on or negotiate contracts that are ultimately awarded to us, we may achieve lower than anticipated profits or incur contract losses. |
| • | The cancellation of a significant number of contracts or our disqualification from bidding for new contracts could have a material adverse effect on our financial position, results of operations and liquidity. |
| • | Our substantial leverage could adversely affect our financial condition, our ability to raise additional capital to fund our operations, our ability to operate our business, our ability to react to changes in the economy or our industry and pay our debts and could divert our cash flow from operations to debt payments. |
| • | Blackstone and its affiliates control us and their interests may conflict with ours or yours in the future. |
Please see “Risk Factors” for a discussion of these and other factors you should consider before making an investment in shares of our Class A common stock.
12
Table of Contents
Implications of Being an Emerging Growth Company
As a company with less than $1.0 billion in revenue during our most recently completed fiscal year as of the initial filing date of the registration statement of which this prospectus forms a part, we qualify as an “emerging growth company” as defined in Section 2(a) of the Securities Act of 1933, as amended (the “Securities Act”), as modified by the Jumpstart Our Business Startups Act of 2012 (the “JOBS Act”). As an emerging growth company, we may take advantage of specified reduced disclosure and other requirements that are otherwise applicable generally to public companies that are not emerging growth companies. These provisions include:
| • | reduced disclosure about our executive compensation arrangements; |
| • | no non-binding stockholder advisory votes on executive compensation or golden parachute arrangements; and |
| • | exemption from the auditor attestation requirement in the assessment of our internal control over financial reporting. |
We may take advantage of these exemptions for up to five years or such earlier time that we are no longer an emerging growth company. We will cease to be an emerging growth company upon the earliest of: (1) the end of the fiscal year following the fifth anniversary of this offering; (2) the last day of the first fiscal year during which our annual gross revenues were $1.0 billion or more; (3) the date on which we have, during the previous three-year period, issued more than $1.0 billion in non-convertible debt securities; or (4) the end of any fiscal year in which the market value of our common stock held by non-affiliates exceeded $700 million as of the end of the second quarter of that fiscal year. We have taken advantage of reduced disclosure regarding executive compensation arrangements in this prospectus, and we may choose to take advantage of some but not all of these reduced disclosure obligations in future filings. If we do, the information that we provide stockholders may be different than you might get from other public companies in which you hold stock.
The JOBS Act permits an emerging growth company such as us to take advantage of an extended transition period to comply with new or revised accounting standards applicable to public companies. As a result, our financial statements may not be comparable to the financial statements of issuers who are required to comply with the effective dates for new or revised accounting standards that are generally applicable to public companies.
13
Table of Contents
The Offering
| Class A common stock offered by Summit Materials, Inc. |
shares (plus up to an additional shares at the option of the underwriters). |
| Class A common stock outstanding after giving effect to this offering |
shares (or shares if all outstanding LP Units held by the limited partners of Summit Holdings were exchanged for newly-issued shares of Class A common stock on a one-for-one basis). |
| Voting power held by holders of Class A common stock after giving effect to this offering |
% (or 100% if all outstanding LP Units held by the limited partners of Summit Holdings were exchanged for newly-issued shares of Class A common stock on a one-for-one basis). |
| Voting power held by Summit Owner Holdco as a holder of all outstanding shares of Class B common stock after giving effect to this offering |
% (or % if all outstanding LP Units held by the limited partners of Summit Holdings were exchanged for newly-issued shares of Class A common stock on a one-for-one basis). If all outstanding LP Units held by the limited partners of Summit Holdings were exchanged for newly-issued shares of Class A common stock on a one-for-one basis and such shares continued to be held by such limited partners, our pre-IPO owners would hold % of the outstanding shares of Class A common stock and an equivalent percentage of the voting power of our common stock eligible to vote in the election of our directors, and, as a result, we would still be a “controlled company” if such limited partners formed a group. See “Organizational Structure—Organizational Structure Following this Offering” and “Management—Controlled Company Exception.” |
| Voting rights |
Each share of our Class A common stock entitles its holder to one vote on all matters to be voted on by stockholders generally. |
| Summit Owner Holdco, an entity that will be owned by our pre-IPO owners and Class B Unitholders of Continental Cement, holds all of the outstanding shares of our Class B common stock. The Class B common stock will entitle Summit Owner Holdco to a number of votes that is equal to the aggregate number of Initial LP Units less the number of such Initial LP Units that, after the IPO Date, have been transferred to Summit Materials, Inc. in accordance with the exchange agreement or are transferred to a holder other than Summit Owner Holdco together with shares of Class B common stock. See “Description of Capital Stock—Common Stock—Class B Common Stock.” |
| Holders of shares of our Class B common stock will vote together with holders of our Class A common stock as a single class on all matters on which stockholders are entitled to vote generally, except as otherwise required by law. |
14
Table of Contents
| Use of proceeds |
We estimate that the net proceeds to Summit Materials, Inc. from this offering, after deducting estimated underwriting discounts, will be approximately $ million (or $ million if the underwriters exercise in full their option to purchase additional shares of Class A common stock). Summit Holdings will bear or reimburse Summit Materials, Inc. for all of the expenses payable by it in this offering, which we estimate will be approximately $ million. |
| We intend to use all of the net proceeds from this offering (including from any exercise by the underwriters of their option to purchase additional shares of Class A common stock) to purchase a number of newly-issued LP Units from Summit Holdings that is equivalent to the number of shares of Class A common stock that we offer and sell in this offering, as described under “Organizational Structure—Offering Transactions.” |
| We intend to cause Summit Holdings to use these proceeds to repay indebtedness, to purchase a portion of the Class B Units of Continental Cement, to make a one-time payment to an affiliate of Blackstone in connection with the termination of our transaction and management fee agreement and for general corporate purposes. See “Use of Proceeds.” |
| Dividend policy |
We have no current plans to pay dividends on our Class A common stock. The declaration, amount and payment of any future dividends on shares of Class A common stock will be at the sole discretion of our board of directors and we may reduce or discontinue entirely the payment of any such dividends at any time. |
| Summit Materials, Inc. is a holding company and will have no material assets other than its ownership of Summit Holdings. We intend to cause Summit Holdings to make distributions to us in an amount sufficient to cover cash dividends, if any, declared by us. If Summit Holdings makes such distributions to Summit Materials, Inc., the other holders of LP Units will be entitled to receive equivalent distributions. |
| Our senior secured credit facilities and our senior notes contain a number of covenants that restrict, subject to certain exceptions, Summit Materials, LLC’s ability to pay dividends to us. See “Description of Certain Indebtedness.” |
| Exchange rights of holders of LP Units |
Prior to this offering we will enter into an exchange agreement with our pre-IPO owners so that they may (subject to the terms of the exchange agreement) exchange their LP Units for shares of Class A common stock of Summit Materials, Inc. on a one-for-one basis, subject to customary conversion rate adjustments for stock splits, stock dividends and reclassifications. See “Certain Relationships and Related Person Transactions—Exchange Agreement.” |
15
Table of Contents
| Tax receivable agreement |
Future exchanges of LP Units for shares of Class A common stock are expected to result in increases in the tax basis of the tangible and intangible assets of Summit Holdings. These increases in tax basis may increase (for tax purposes) depreciation and amortization deductions and therefore reduce the amount of tax that Summit Materials, Inc. would otherwise be required to pay in the future. Prior to the completion of this offering, we will enter into a tax receivable agreement with the holders of LP Units and certain other indirect pre-IPO owners that hold interests in entities (the “Investor Entities”) that may be merged with or contributed to us in the future in accordance with the stockholders’ agreement we will enter into with Blackstone that provides for the payment by Summit Materials, Inc. to exchanging holders of LP Units of 85% of the benefits, if any, that Summit Materials, Inc. is deemed to realize as a result of (i) these increases in tax basis and (ii) our utilization of certain net operating losses of the Investor Entities and certain other tax benefits related to entering into the tax receivable agreement, including tax benefits attributable to payments under the tax receivable agreement. See “Certain Relationships and Related Person Transactions—Tax Receivable Agreement.” |
| Risk factors |
See “Risk Factors” for a discussion of risks you should carefully consider before deciding to invest in our Class A common stock. |
| Proposed trading symbol |
“SUM.” |
| Conflicts of interest |
Blackstone Advisory Partners L.P., which is deemed an affiliate of Blackstone and, therefore, our affiliate, is a member of the Financial Industry Regulatory Authority, Inc. (“FINRA”) and an underwriter in this offering. Accordingly, this offering is being made in compliance with the requirements of Rule 5121 of FINRA (“Rule 5121”). Pursuant to that rule, the appointment of a “qualified independent underwriter” is not required in connection with this offering as the members primarily responsible for managing the public offering do not have a conflict of interest, are not affiliates of any member that has a conflict of interest and meet the requirements of paragraph (f)(12)(E) of Rule 5121. Blackstone Advisory Partners L.P. will not confirm sales of the securities to any account over which it exercises discretionary authority without the specific written approval of the account holder. See “Underwriting (Conflicts of Interest).” |
| Material United States federal income and estate tax consequences to non-U.S. holders |
For a discussion of certain material United States federal income and estate tax considerations that may be relevant to non-U.S. stockholders, see “Material United States Federal Income and Estate Tax Consequences to Non-U.S. Holders.” |
In this prospectus, unless otherwise indicated, the number of shares of Class A common stock outstanding and the other information based thereon does not reflect:
| • | shares of Class A common stock issuable upon exercise of the underwriters’ option to purchase additional shares of Class A common stock from us; |
16
Table of Contents
| • | shares of Class A common stock issuable upon exchange of LP Units that will be held by limited partners of Summit Holdings immediately following this offering; or |
| • | shares of Class A common stock that may be granted under the Summit Materials, Inc. Omnibus Incentive Plan (the “Omnibus Incentive Plan”), including shares of Class A common stock issuable upon the exercise of stock options which are expected to be granted under the Omnibus Incentive Plan at the time of this offering. See “Executive and Director Compensation—Summit Materials, Inc. 2015 Omnibus Incentive Plan.” |
17
Table of Contents
Summary Historical Consolidated Financial and Other Data
The following summary historical consolidated financial and other data of Summit Holdings should be read together with “Organizational Structure,” “Unaudited Pro Forma Condensed Consolidated Financial Information,” “Selected Historical Consolidated Financial Data,” “Management’s Discussion and Analysis of Financial Condition and Results of Operations” and the historical financial statements and related notes thereto included elsewhere in this prospectus. Summit Holdings will be considered our predecessor for accounting purposes, and its consolidated financial statements will be our historical financial statements following this offering. Under U.S. generally accepted accounting principles (“U.S. GAAP”), Summit Holdings is expected to meet the definition of a variable interest entity. Summit Materials, Inc. is expected to be the primary beneficiary of Summit Holdings as a result of its 100% voting power and control over Summit Holdings and as a result of its obligation to absorb losses and its right to receive benefits of Summit Holdings that could potentially be significant to Summit Holdings. Summit Materials, Inc. is expected to consolidate Summit Holdings on its consolidated financial statements and record a noncontrolling interest related to the LP Units held by our pre-IPO owners on its consolidated balance sheets and statements of condition, operations, and comprehensive income (loss).
The summary historical consolidated financial information of Summit Holdings as of December 28, 2013 and December 29, 2012 and for the three years ended December 28, 2013, December 29, 2012 and December 31, 2011 has been derived from the audited consolidated financial statements of Summit Holdings included elsewhere in this prospectus. We have derived the summary historical audited consolidated balance sheet data of Summit Holdings as of December 31, 2011 from Summit Holdings’ consolidated balance sheet as of December 31, 2011, which is not included in this prospectus. The summary historical consolidated financial information of Summit Holdings as of September 27, 2014 and for the nine months ended September 27, 2014 and September 28, 2013 was derived from the unaudited consolidated financial statements of Summit Holdings included elsewhere in this prospectus. The unaudited consolidated financial statements of Summit Holdings have been prepared on the same basis as the audited consolidated financial statements and, in our opinion, have included all adjustments, which include normal recurring adjustments, necessary to present fairly in all material respects our financial position and results of operations. The results for any interim period are not necessarily indicative of the results that may be expected for the full year. Additionally, our historical results are not necessarily indicative of the results expected for any future period.
The unaudited pro forma financial information has been prepared to reflect the issuance of shares of our Class A common stock offered by us in this offering and the other transactions described under “Unaudited Pro Forma Condensed Consolidated Financial Information.” The following unaudited summary pro forma financial information is presented for illustrative purposes only and is not necessarily indicative of the operating results or financial position that would have occurred if the relevant transactions had been consummated on the date indicated, nor is it indicative of future operating results.
| Summit Materials, Inc. | Summit Holdings | |||||||||||||||||||||||||||
| (in thousands) | Pro Forma Nine Months Ended September 27, 2014 |
Pro Forma Year Ended December 28, 2013 |
Nine Months Ended September 27, 2014 |
Nine Months Ended September 28, 2013 |
Year Ended December 28, 2013 |
Year Ended December 29, 2012 |
Year Ended December 31, 2011 |
|||||||||||||||||||||
| Statement of Operations Data: |
||||||||||||||||||||||||||||
| Total revenue |
$ | $ | $ | 870,145 | $ | 677,934 | $ | 916,201 | $ | 926,254 | $ | 789,076 | ||||||||||||||||
| Total cost of revenue (excluding items shown separately below) |
645,934 | 503,198 | 677,052 | 713,346 | 597,654 | |||||||||||||||||||||||
| General and administrative expenses |
105,872 | 107,219 | 142,000 | 127,215 | 95,826 | |||||||||||||||||||||||
| Goodwill impairment |
— | — | 68,202 | — | — | |||||||||||||||||||||||
18
Table of Contents
| Summit Materials, Inc. | Summit Holdings | |||||||||||||||||||||||||||
| (in thousands) | Pro Forma Nine Months Ended September 27, 2014 |
Pro Forma Year Ended December 28, 2013 |
Nine Months Ended September 27, 2014 |
Nine Months Ended September 28, 2013 |
Year Ended December 28, 2013 |
Year Ended December 29, 2012 |
Year Ended December 31, 2011 |
|||||||||||||||||||||
| Depreciation, depletion, amortization and accretion |
63,950 | 54,577 | 72,934 | 68,290 | 61,377 | |||||||||||||||||||||||
| Transaction costs |
7,737 | 3,175 | 3,990 | 1,988 | 9,120 | |||||||||||||||||||||||
|
|
|
|
|
|
|
|
|
|
|
|
|
|
|
|||||||||||||||
| Operating (loss) income |
46,652 | 9,765 | (47,977 | ) | 15,415 | 25,099 | ||||||||||||||||||||||
| Other income, net |
(2,299 | ) | (988 | ) | (1,737 | ) | (1,182 | ) | (21,244 | ) | ||||||||||||||||||
| Loss on debt financings |
— | 3,115 | 3,115 | 9,469 | — | |||||||||||||||||||||||
| Interest expense |
62,555 | 42,380 | 56,443 | 58,079 | 47,784 | |||||||||||||||||||||||
|
|
|
|
|
|
|
|
|
|
|
|
|
|
|
|||||||||||||||
| Loss from continuing operations before taxes |
(13,604 | ) | (34,742 | ) | (105,798 | ) | (50,951 | ) | (1,441 | ) | ||||||||||||||||||
| Income tax (benefit) expense |
(2,498 | ) | (1,782 | ) | (2,647 | ) | (3,920 | ) | 3,408 | |||||||||||||||||||
|
|
|
|
|
|
|
|
|
|
|
|
|
|
|
|||||||||||||||
| Loss from continuing operations |
$ | $ | $ | (11,106 | ) | $ | (32,960 | ) | $ | (103,151 | ) | $ | (47,031 | ) | $ | (4,849 | ) | |||||||||||
|
|
|
|
|
|
|
|
|
|
|
|
|
|
|
|||||||||||||||
| Cash Flow Data: |
||||||||||||||||||||||||||||
| Net cash (used for) provided by: |
||||||||||||||||||||||||||||
| Operating activities |
$ | $ | $ | (10,836 | ) | $ | 123 | $ | 66,412 | $ | 62,279 | $ | 23,253 | |||||||||||||||
| Investing activities |
(405,853 | ) | (105,930 | ) | (111,515 | ) | (85,340 | ) | (192,331 | ) | ||||||||||||||||||
| Financing activities |
408,501 | 97,583 | 32,589 | 7,702 | 146,775 | |||||||||||||||||||||||
| Balance Sheet Data (as of period end): |
||||||||||||||||||||||||||||
| Cash |
$ | $ | 9,995 | $ | 18,183 | $ | 30,697 | $ | 46,056 | |||||||||||||||||||
| Total assets |
1,749,758 | 1,251,060 | 1,284,479 | 1,287,531 | ||||||||||||||||||||||||
| Total debt (including current portion of long-term debt) |
1,091,108 | 688,987 | 639,843 | 608,981 | ||||||||||||||||||||||||
| Capital leases |
28,395 | 8,026 | 3,092 | 3,158 | ||||||||||||||||||||||||
| Total partners’ interest/stockholders’ equity |
294,080 | 286,817 | 385,694 | 439,638 | ||||||||||||||||||||||||
| Redeemable noncontrolling interests |
31,820 | 24,767 | 22,850 | 21,300 | ||||||||||||||||||||||||
| Other Financial Data: |
||||||||||||||||||||||||||||
| Total hard assets(1) |
$ | 1,058,117 | $ | 928,210 | $ | 906,584 | $ | 906,166 | ||||||||||||||||||||
| Adjusted EBITDA(2) |
$ | 112,901 | $ | 62,215 | $ | 91,781 | ||||||||||||||||||||||
| (1) | Defined as the consolidated balance sheet book value as of period end of the sum of (a) net property, plant and equipment and (b) inventories. |
19
Table of Contents
| (2) | EBITDA is defined by us as net loss before interest expense, income tax expense, depreciation, depletion and amortization expense. We evaluate our operating performance using a metric we refer to as “Adjusted EBITDA.” Adjusted EBITDA is defined as EBITDA, as adjusted to exclude accretion, goodwill impairment and loss from discontinued operations. In addition, we use a metric we refer to as “Further Adjusted EBITDA,” which we define as Adjusted EBITDA plus certain non-cash or non-operating items and the EBITDA contribution of certain recent acquisitions, to measure our compliance with debt covenants and to evaluate flexibility under certain restrictive covenants. See “Management’s Discussion and Analysis of Financial Condition and Results of Operations—Liquidity and Capital Resources—Our Long-Term Debt” on pages 95 and 96 for more information. |
We include EBITDA and Adjusted EBITDA in conjunction with our results according to U.S. GAAP because management believes they help to provide a more complete understanding of factors and trends affecting our business than U.S. GAAP measures alone. Management believes these non-U.S. GAAP measures assists our board of directors, management, lenders and investors in comparing our operating performance on a consistent basis because they remove where applicable, the impact of our capital structure, asset base, acquisition accounting, non-cash charges and non-operating items from our operations. In addition, management uses Adjusted EBITDA to evaluate our operational performance as a basis for strategic planning and as a performance evaluation metric.
Despite the importance of these measures in analyzing our business, evaluating our operating performance and determining covenant compliance, as well as the use of adjusted EBITDA measures by securities analysts, lenders and others in their evaluation of companies, Adjusted EBITDA and Further Adjusted EBITDA have limitations as analytical tools, and you should not consider them in isolation, or as a substitute for analysis of our results as reported under U.S. GAAP; nor are Adjusted EBITDA and Further Adjusted EBITDA intended to be measures of liquidity or free cash flow for our discretionary use. Some of the limitations of Adjusted EBITDA and Further Adjusted EBITDA are:
| • | they do not reflect our cash expenditures or future requirements for capital expenditures or contractual commitments; |
| • | they do not reflect changes in, or cash requirements for, our working capital needs; |
| • | they do not reflect the interest expense, or the cash requirements to service interest or principal payments on our debt; |
| • | they do not reflect income tax payments we are required to make; and |
| • | although depreciation and amortization are non-cash charges, the assets being depreciated and amortized often will have to be replaced in the future, and Adjusted EBITDA and Further Adjusted EBITDA do not reflect any cash requirements for such replacements. |
To properly and prudently evaluate our business, we encourage you to review the financial statements included in this prospectus, and not rely on any single financial measure to evaluate our business. We also strongly urge you to review the reconciliation of net income to Adjusted EBITDA set forth below and net income to Further Adjusted EBITDA on page 96. Adjusted EBITDA and Further Adjusted EBITDA, as presented in this prospectus, may differ from and may not be comparable to similarly titled measures used by other companies, because Adjusted EBITDA and Further Adjusted EBITDA are not measures of financial performance under U.S. GAAP and are susceptible to varying calculations.
20
Table of Contents
The following table sets forth a reconciliation of net loss to EBITDA and Adjusted EBITDA for the periods indicated. All of the items included in the reconciliation from net loss to Adjusted EBITDA are either (i) non-cash items (such as depreciation, depletion, amortization and accretion and non-cash compensation expense) or (ii) items that management does not consider in assessing our on-going operating performance (such as income taxes and interest expense). In the case of the non-cash items, management believes that investors can better assess our comparative operating performance if the measures are presented without such items because the measures without such items are less susceptible to variances in actual performance resulting from depreciation, amortization and other non-cash charges and more reflective of other factors that affect operating performance. In the case of the other items, management believes that investors can better assess our operating performance if the measures are presented without these items because their financial impact does not reflect ongoing operating performance.
| (in thousands) | Twelve Months Ended September 27, 2014(a) |
Nine Months Ended September 27, 2014 |
Nine Months Ended September 28, 2013 |
Year Ended December 28, 2013 |
||||||||||||
| Net loss |
$ | (81,212 | ) | $ | (10,750 | ) | $ | (33,217 | ) | $ | (103,679 | ) | ||||
| Interest expense |
76,618 | 62,555 | 42,380 | 56,443 | ||||||||||||
| Income tax benefit |
(3,363 | ) | (2,498 | ) | (1,782 | ) | (2,647 | ) | ||||||||
| Depreciation, depletion and amortization |
81,479 | 63,302 | 54,040 | 72,217 | ||||||||||||
|
|
|
|
|
|
|
|
|
|||||||||
| EBITDA |
$ | 73,255 | $ | 112,609 | $ | 61,421 | $ | 22,334 | ||||||||
|
|
|
|
|
|
|
|
|
|||||||||
| Accretion |
828 | 648 | 537 | 717 | ||||||||||||
| Goodwill impairment |
68,202 | — | — | 68,202 | ||||||||||||
| Discontinued operations(b) |
(85 | ) | (356 | ) | 257 | 528 | ||||||||||
| Adjusted EBITDA |
$ | 142,467 | $ | 112,901 | $ | 62,215 | $ | 91,781 | ||||||||
|
|
|
|
|
|
|
|
|
|||||||||
| (a) | The statement of operations data for the twelve months ended September 27, 2014, which are unaudited, have been calculated by subtracting the data for the nine months ended September 28, 2013 from the data for the year ended December 28, 2013, and adding the data for the nine months ended September 27, 2014. This presentation is not in accordance with U.S. GAAP. However, we believe that this presentation provides useful information to investors regarding our recent financial performance and we view this presentation of the four most recently completed quarters as a key measurement period for investors to assess our historical results. In addition, our management uses trailing four quarter financial information to evaluate our financial performance for ongoing planning purposes, including a continuous assessment of our financial performance in comparison to budgets and internal projections. We also use trailing four quarter financial data to test compliance with covenants under our senior secured credit facilities. See “Management’s Discussion and Analysis of Financial Condition and Results of Operations—Liquidity and Capital Resources—Our Long-Term Debt.” This presentation has limitations as an analytical tool, and you should not consider it in isolation or as a substitute for analysis of our results as reported under U.S. GAAP. |
| (b) | Represents certain concrete paving operations and railroad construction and repair operations that we have exited. |
21
Table of Contents
An investment in shares of our Class A common stock involves risks. You should carefully consider the following information about these risks, together with the other information contained in this prospectus, before investing in shares of our Class A common stock.
Risks Related to Our Industry and Our Business
Industry Risks
Our business depends on activity within the construction industry and the strength of the local economies in which we operate.
We sell most of our construction materials and products and provide all of our paving and related services to the construction industry, so our results are significantly affected by the strength of the construction industry. Demand for our products, particularly in the residential and nonresidential construction markets, could decline if companies and consumers cannot obtain credit for construction projects or if the slow pace of economic activity results in delays or cancellations of capital projects. In addition, federal and state budget issues may continue to hurt the funding available for infrastructure spending, particularly highway construction, which constitutes a significant portion of our business.
Our earnings depend on the strength of the local economies in which we operate because of the high cost to transport our products relative to their price. In recent years, many states have reduced their construction spending due to budget shortfalls resulting from lower tax revenue as well as uncertainty relating to long-term federal highway funding. As a result, there has been a reduction in many states’ investment in infrastructure spending. If economic and construction activity diminishes in one or more areas, particularly in our top revenue-generating markets of Texas, Kansas, Kentucky, Missouri and Utah, our results of operations and liquidity may be materially adversely affected, and there is no assurance that reduced levels of construction activity will not continue to affect our business in the future.
Our business is cyclical and requires significant working capital to fund operations.
Our business is cyclical and requires that we maintain significant working capital to fund our operations. Our ability to generate sufficient cash flow depends on future performance, which will be subject to general economic conditions, industry cycles and financial, business and other factors affecting our operations, many of which are beyond our control. If we are unable to generate sufficient cash to operate our business and service our outstanding debt and other obligations, we may be required, among other things, to further reduce or delay planned capital or operating expenditures, sell assets or take other measures, including the restructuring of all or a portion of our debt, which may only be available, if at all, on unsatisfactory terms.
Weather can materially affect our business, and we are subject to seasonality.
Nearly all of the products we sell and the services we provide are used or performed outdoors. Therefore, seasonal changes and other weather-related conditions can adversely affect our business and operations through a decline in both the use and production of our products and demand for our services. Adverse weather conditions such as extended rainy and cold weather in the spring and fall can reduce demand for our products and reduce sales or render our contracting operations less efficient. Major weather events such as hurricanes, tornadoes, tropical storms and heavy snows with quick rainy melts adversely could affect sales in the near term.
Heavy-side construction materials production and shipment levels follow activity in the construction industry, which typically occurs in the spring, summer and fall. Warmer and drier weather during the second and third quarters of our fiscal year typically result in higher activity and revenue levels during those quarters. The first quarter of our fiscal year has typically lower levels of activity due to the weather conditions. Our second quarter varies greatly with spring rains and wide temperature variations. A cool wet spring increases drying time on projects, which can delay sales in the second quarter, while a warm dry spring may enable earlier project startup.
22
Table of Contents
Our industry is capital intensive and we have significant fixed and semi-fixed costs. Therefore, our earnings are sensitive to changes in volume.
The property and machinery needed to produce our products can be very expensive. Therefore, we need to spend a substantial amount of capital to purchase and maintain the equipment necessary to operate our business. Although we believe that our current cash balance, along with our projected internal cash flows and our available financing resources, will provide sufficient cash to support our currently anticipated operating and capital needs, if we are unable to generate sufficient cash to purchase and maintain the property and machinery necessary to operate our business, we may be required to reduce or delay planned capital expenditures or incur additional debt. In addition, given the level of fixed and semi-fixed costs within our business, particularly at our cement production facility, decreases in volumes can negatively affect our financial position, results of operations and liquidity.
Within our local markets, we operate in a highly competitive industry.
The U.S. construction aggregates industry is highly fragmented with a large number of independent local producers in a number of our markets. Additionally, in most markets, we compete against large private and public infrastructure companies, some of which are also vertically-integrated. Therefore, there is intense competition in a number of the markets in which we operate. This significant competition could lead to lower prices, lower sales volumes and higher costs in some markets, negatively affecting our financial position, results of operations and liquidity. Further, the lack of availability of skilled labor, such as truck drivers, may require us to increase compensation or reduce deliveries, which could negatively affect our financial position, results of operations and liquidity.
Growth Risks
The success of our business depends, in part, on our ability to execute on our acquisition strategy, to successfully integrate acquisitions and to retain key employees of our acquired businesses.
A significant portion of our historical growth has occurred through acquisitions and we will likely enter into acquisitions in the future. We have evaluated and expect to continue to evaluate possible acquisition transactions on an ongoing basis. At any time we may be engaged in discussions or negotiations with respect to several possible acquisitions. From time to time we enter into letters of intent to allow us to conduct due diligence on a confidential basis. At any given time, we may be in preliminary discussions with several potential acquisition targets. There can be no assurance that we will enter into definitive agreements with respect to any contemplated transactions or that they will be completed. Our growth has placed, and will continue to place, significant demands on our management and operational and financial resources. Acquisitions involve risks that the businesses acquired will not perform as expected and that business judgments concerning the value, strengths and weaknesses of businesses acquired will prove incorrect.
Acquisitions may require integration of the acquired companies’ sales and marketing, distribution, engineering, purchasing, finance and administrative organizations. We may not be able to integrate successfully any business we may acquire or have acquired into our existing business and any acquired businesses may not be profitable or as profitable as we had expected. Our inability to complete the integration of new businesses in a timely and orderly manner could increase costs and lower profits. Factors affecting the successful integration of acquired businesses include, but are not limited to, the following:
| • | We may become liable for certain liabilities of any acquired business, whether or not known to us. These risks could include, among others, tax liabilities, product liabilities, environmental liabilities and liabilities for employment practices, and they could be significant. |
| • | Substantial attention from our senior management and the management of the acquired business may be required, which could decrease the time that they have to service and attract customers. |
| • | We may not effectively utilize new equipment that we acquire through acquisitions or otherwise at utilization and rental rates consistent with that of our existing equipment. |
23
Table of Contents
| • | The complete integration of acquired companies depends, to a certain extent, on the full implementation of our financial systems and policies. |
| • | We may actively pursue a number of opportunities simultaneously and we may encounter unforeseen expenses, complications and delays, including difficulties in employing sufficient staff and maintaining operational and management oversight. |
We cannot assure you that we will achieve synergies and cost savings in connection with acquisitions. In addition, many of the businesses that we have acquired and will acquire have unaudited financial statements that have been prepared by the management of such companies and have not been independently reviewed or audited. We cannot assure you that the financial statements of companies we have acquired or will acquire would not be materially different if such statements were audited. Finally, we cannot assure you that we will continue to acquire businesses at valuations consistent with our prior acquisitions or that we will complete future acquisitions at all. We cannot assure you that there will be attractive acquisition opportunities at reasonable prices, that financing will be available or that we can successfully integrate such acquired businesses into our existing operations. In addition, our results of operations from these acquisitions could, in the future, result in impairment charges for any of our intangible assets, including goodwill, or other long-lived assets, particularly if economic conditions worsen unexpectedly. These changes could materially negatively affect our results of operations, financial condition or liquidity.
Our long-term success is dependent upon securing and permitting aggregate reserves in strategically located areas. The inability to secure and permit such reserves could negatively affect our earnings in the future.
Aggregates are bulky and heavy and therefore difficult to transport efficiently. Because of the nature of the products, the freight costs can quickly surpass production costs. Therefore, except for geographic regions that do not possess commercially viable deposits of aggregates and are served by rail, barge or ship, the markets for our products tend to be very localized around our quarry sites and are served by truck. New quarry sites often take a number of years to develop. Our strategic planning and new site development must stay ahead of actual growth. Additionally, in a number of urban and suburban areas in which we operate, it is increasingly difficult to permit new sites or expand existing sites due to community resistance. Therefore, our future success is dependent, in part, on our ability to accurately forecast future areas of high growth in order to locate optimal facility sites and on our ability to either acquire existing quarries or secure operating and environmental permits to open new quarries. If we are unable to accurately forecast areas of future growth, acquire existing quarries or secure the necessary permits to open new quarries, our financial condition, results of operations and liquidity may be materially adversely affected.
Economic Risks
Our business relies on private investment in infrastructure, and a slower than expected recovery may adversely affect our results.
A significant portion of our sales are for projects with non-public owners. Construction spending is affected by developers’ ability to finance projects. The credit environment has negatively affected the U.S. economy and demand for our products in the recent past. Residential and nonresidential construction could decline if companies and consumers are unable to finance construction projects or if an economic recovery is stalled, which could result in delays or cancellations of capital projects. If housing starts and nonresidential projects do not rise steadily with the economic recovery as they historically have when recessions end, sale of our construction materials, downstream products and paving and related services may decline and our financial position, results of operations and liquidity may be materially adversely affected.
24
Table of Contents
A decline in public infrastructure construction and reductions in governmental funding could adversely affect our operations and results.
A significant portion of our revenue is generated from publicly-funded construction projects. As a result, if publicly-funded construction decreases due to reduced federal or state funding or otherwise, our results of operations and liquidity could be negatively affected.
In January 2011, the U.S. House of Representatives passed a new rules package that repealed a transportation law dating back to 1998, which protected annual funding levels from amendments that could reduce such funding. This rule change subjects funding for highways to yearly appropriation reviews. The change in the funding mechanism increases the uncertainty of many state departments of transportation regarding funds for highway projects. This uncertainty could result in states being reluctant to undertake large multi-year highway projects which could, in turn, negatively affect our sales. Moving Ahead for Progress in the 21st Century (“MAP-21”), the existing federal transportation funding program, expired on September 30, 2014, and we are uncertain as to the size and term of the transportation funding program that will follow.
As a result of the foregoing and other factors, we cannot be assured of the existence, amount and timing of appropriations for spending on federal, state or local projects. Federal support for the cost of highway maintenance and construction is dependent on congressional action. In addition, each state funds its infrastructure spending from specially allocated amounts collected from various taxes, typically gasoline taxes and vehicle fees, along with voter-approved bond programs. Shortages in state tax revenues can reduce the amounts spent on state infrastructure projects, even below amounts awarded under legislative bills. In recent years, nearly all states have experienced state-level funding pressures caused by lower tax revenues and an inability to finance approved projects. Delays or cancellations of state infrastructure spending could negatively affect our financial position, results of operations and liquidity because a significant portion of our business is dependent on state infrastructure spending.
Environmental, health and safety laws and regulations and any changes to, or liabilities arising under, such laws and regulations may have a material adverse effect on our business, financial condition, results of operations and liquidity.
We are subject to a variety of federal, state and local laws and regulations relating to, among other things: (i) the release or discharge of materials into the environment; (ii) the management, use, generation, treatment, processing, handling, storage, transport or disposal of hazardous materials, including the management of hazardous waste used as a fuel substitute at our cement kiln in Hannibal, Missouri; and (iii) the protection of public and employee health and safety and the environment. These laws and regulations impose strict liability in some cases without regard to negligence or fault and expose us to liability for the environmental condition of our currently or formerly owned or operated facilities or third-party waste disposal sites, and may expose us to liability for the conduct of others or for our actions, even if such actions complied with all applicable laws at the time these actions were taken. In particular, we may incur remediation costs and other related expenses because our facilities were constructed and operated before the adoption of current environmental laws and the institution of compliance practices or because certain of our processes are regulated. These laws and regulations may also expose us to liability for claims of personal injury or property or natural resource damage related to alleged exposure to, or releases of, regulated or hazardous materials. The existence of contamination at properties we own, lease or operate could also result in increased operational costs or restrictions on our ability to use those properties as intended, including for purposes of mining.
Despite our compliance efforts, there is an inherent risk of liability in the operation of our business, especially from an environmental standpoint, or from time to time, we may be in noncompliance with environmental, health and safety laws and regulations. These potential liabilities or noncompliances could have an adverse effect on our operations and profitability. In many instances, we must have government approvals, certificates, permits or licenses in order to conduct our business, which often require us to make significant capital, operating and maintenance expenditures to comply with environmental, health and safety laws and
25
Table of Contents
regulations. Our failure to obtain and maintain required approvals, certificates, permits or licenses or to comply with applicable governmental requirements could result in sanctions, including substantial fines or possible revocation of our authority to conduct some or all of our operations. Governmental requirements that affect our operations also include those relating to air and water quality, waste management, asset reclamation, the operation and closure of municipal waste and construction and demolition debris landfills, remediation of contaminated sites and worker health and safety. These requirements are complex and subject to frequent change. Stricter laws and regulations, more stringent interpretations of existing laws or regulations or the future discovery of environmental conditions may impose new liabilities on us, reduce operating hours, require additional investment by us in pollution control equipment or impede our opening new or expanding existing plants or facilities. We have incurred, and may in the future incur, significant capital and operating expenditures to comply with such laws and regulations. The cost of complying with such laws may have a material adverse effect on our business, financial condition, results of operations and liquidity. In addition, we have recorded liabilities in connection with our reclamation and landfill closure obligations, but there can be no assurances that the costs of our obligations will not exceed our accruals.
Financial Risks
Difficult and volatile conditions in the credit markets could affect our financial position, results of operations and liquidity.
Demand for our products is primarily dependent on the overall health of the economy, and federal, state and local public infrastructure funding levels. A stagnant or declining economy tends to produce less tax revenue for public infrastructure agencies, thereby decreasing a source of funds available for spending on public infrastructure improvements, which constitute a significant part of our business.
With the slow pace of economic recovery, there is also a likelihood that we will not be able to collect on certain of our accounts receivable from our customers. Although we are protected in part by payment bonds posted by some of our customers, we have experienced payment delays and defaults from some of our customers during the recent economic downturn and subsequent slow recovery. Such delays and defaults could have a material effect on our financial position, results of operations or liquidity.
If we are unable to accurately estimate the overall risks, requirements or costs when we bid on or negotiate contracts that are ultimately awarded to us, we may achieve lower than anticipated profits or incur contract losses.
Even though the majority of our governmental contracts contain certain raw material escalators to protect us from certain price increases, a portion or all of the contracts are often on a fixed cost basis. Pricing on a contract with a fixed unit price is based on approved quantities irrespective of our actual costs and contracts with a fixed total price require that the total amount of work be performed for a single price irrespective of our actual costs. We realize a profit on our contracts only if our revenue exceeds actual costs, which requires that we successfully estimate our costs and then successfully control actual costs and avoid cost overruns. If our cost estimates for a contract are inadequate, or if we do not execute the contract within our cost estimates, then cost overruns may cause us to incur a loss or cause the contract not to be as profitable as we expected. The costs incurred and gross profit realized, if any, on our contracts can vary, sometimes substantially, from our original projections due to a variety of factors, including, but not limited to:
| • | failure to include materials or work in a bid, or the failure to estimate properly the quantities or costs needed to complete a lump sum contract; |
| • | delays caused by weather conditions or otherwise failing to meet scheduled acceptance dates; |
| • | contract or project modifications creating unanticipated costs not covered by change orders; |
| • | changes in availability, proximity and costs of materials, including liquid asphalt, cement, aggregates and other construction materials (such as stone, gravel, sand and oil for asphalt paving), as well as fuel and lubricants for our equipment; |
26
Table of Contents
| • | to the extent not covered by contractual cost escalators, variability and inability to predict the costs of purchasing diesel, liquid asphalt and cement; |
| • | availability and skill level of workers; |
| • | failure by our suppliers, subcontractors, designers, engineers or customers to perform their obligations; |
| • | fraud, theft or other improper activities by our suppliers, subcontractors, designers, engineers, customers or our own personnel; |
| • | mechanical problems with our machinery or equipment; |
| • | citations issued by any governmental authority, including the Occupational Safety and Health Administration (“OSHA”) and Mine Safety and Health Administration (“MSHA”); |
| • | difficulties in obtaining required governmental permits or approvals; |
| • | changes in applicable laws and regulations; |
| • | uninsured claims or demands from third parties for alleged damages arising from the design, construction or use and operation of a project of which our work is part; and |
| • | public infrastructure customers may seek to impose contractual risk-shifting provisions more aggressively, that result in us facing increased risks. |
These factors, as well as others, may cause us to incur losses, which could negatively affect our financial position, results of operations and liquidity.
We may incur material costs and losses as a result of claims that our products do not meet regulatory requirements or contractual specifications.
We provide our customers with products designed to meet building code or other regulatory requirements and contractual specifications for measurements such as durability, compressive strength, weight-bearing capacity and other characteristics. If we fail or are unable to provide products meeting these requirements and specifications, material claims may arise against us and our reputation could be damaged. Additionally, if a significant uninsured, non-indemnified or product-related claim is resolved against us in the future, that resolution may have a material adverse effect on our financial condition, results of operations and liquidity.
The cancellation of a significant number of contracts or our disqualification from bidding for new contracts could have a material adverse effect on our financial position, results of operations and liquidity.
Contracts that we enter into with governmental entities can usually be canceled at any time by them with payment only for the work already completed. In addition, we could be prohibited from bidding on certain governmental contracts if we fail to maintain qualifications required by those entities. A cancellation of an unfinished contract or our disqualification from the bidding process could result in lost revenue and cause our equipment to be idled for a significant period of time until other comparable work becomes available, which could have a material adverse effect on our financial condition, results of operations and liquidity.
Our operations are subject to special hazards that may cause personal injury or property damage, subjecting us to liabilities and possible losses which may not be covered by insurance.
Operating hazards inherent in our business, some of which may be outside our control, can cause personal injury and loss of life, damage to or destruction of property, plant and equipment and environmental damage. We maintain insurance coverage in amounts and against the risks we believe are consistent with industry practice, but this insurance may not be adequate or available to cover all losses or liabilities we may incur in our operations. Our insurance policies are subject to varying levels of deductibles. Losses up to our deductible amounts are accrued based upon our estimates of the ultimate liability for claims incurred and an estimate of
27
Table of Contents
claims incurred but not reported. However, liabilities subject to insurance are difficult to assess and estimate due to unknown factors, including the severity of an injury, the determination of our liability in proportion to other parties, the number of incidents not reported and the effectiveness of our safety programs. If we were to experience insurance claims or costs above our estimates, we might also be required to use working capital to satisfy these claims rather than using working capital to maintain or expand our operations.
Unexpected factors affecting self-insurance claims and reserve estimates could adversely affect our business.
We use a combination of third-party insurance and self-insurance to provide for potential liabilities for workers’ compensation, general liability, vehicle accident, property and medical benefit claims. Although we believe we have minimized our exposure on individual claims, for the benefit of costs savings we have accepted the risk of a large amount of independent multiple material claims arising, which could have a significant effect on our earnings. We estimate the projected losses and liabilities associated with the risks retained by us, in part, by considering historical claims experience, demographic and severity factors and other actuarial assumptions which, by their nature, are subject to a high degree of variability. Among the causes of this variability are unpredictable external factors affecting future inflation rates, discount rates, litigation trends, legal interpretations, benefit level changes and claim settlement patterns. Any such matters could have a material adverse effect on our financial condition, results of operations and liquidity.
Risks Related to Our Indebtedness
Our substantial leverage could adversely affect our financial condition, our ability to raise additional capital to fund our operations, our ability to operate our business, our ability to react to changes in the economy or our industry and pay our debts and could divert our cash flow from operations to debt payments.
We are highly leveraged. As of September 27, 2014 our total debt was approximately $1,091.1 million. Our high degree of leverage could have important consequences, including:
| • | requiring a substantial portion of cash flow from operations to be dedicated to the payment of principal and interest on our indebtedness, thereby reducing our ability to use our cash flow to fund our operations, capital expenditures and pursue future business opportunities; |
| • | increasing our vulnerability to general economic and industry conditions; |
| • | exposing us to the risk of increased interest rates as our borrowings under our senior secured credit facilities are at variable rates of interest; |
| • | restricting us from making strategic acquisitions or causing us to make non-strategic divestitures; |
| • | limiting our ability to obtain additional financing for working capital, capital expenditures, debt service requirements, acquisitions and general corporate or other purposes; and |
| • | limiting our ability to adjust to changing market conditions and placing us at a competitive disadvantage compared to our competitors who are less highly leveraged. |
We are a holding company, and our consolidated assets are owned by, and our business is conducted through, our subsidiaries. Revenues from these subsidiaries are our primary source of funds for debt payments and operating expenses. If our subsidiaries are restricted from making distributions to us, that may impair our ability to meet our debt service obligations or otherwise fund our operations. Moreover, there may be restrictions on payments by subsidiaries to their parent companies under applicable laws, including laws that require companies to maintain minimum amounts of capital and to make payments to stockholders only from profits. As a result, although a subsidiary of ours may have cash, we may not be able to obtain that cash to satisfy our obligation to service our outstanding debt or fund our operations.
28
Table of Contents
Certain of our debt agreements impose significant operating and financial restrictions on us and our subsidiaries, which may prevent us from capitalizing on business opportunities.
The indenture that governs our senior notes and the credit agreement that governs our senior secured credit facilities impose significant operating and financial restrictions on us. These restrictions will limit our ability and/or the ability of our subsidiaries to, among other things:
| • | incur or guarantee additional debt or issue disqualified stock or preferred stock; |
| • | pay dividends (including to us) and make other distributions on, or redeem or repurchase, capital stock; |
| • | make certain investments; |
| • | incur certain liens; |
| • | enter into transactions with affiliates; |
| • | merge or consolidate; |
| • | enter into agreements that restrict the ability of restricted subsidiaries to make dividends or other payments to the issuers; |
| • | designate restricted subsidiaries as unrestricted subsidiaries; and |
| • | transfer or sell assets. |
As a result of these restrictions, we are limited as to how we conduct our business and we may be unable to raise additional debt or equity financing to compete effectively or to take advantage of new business opportunities. The terms of any future indebtedness we may incur could include more restrictive covenants. We cannot assure you that we will be able to maintain compliance with these covenants in the future and, if we fail to do so, that we will be able to obtain waivers from the lenders and/or amend the covenants.
Our failure to comply with the restrictive covenants described above as well as other terms of our other indebtedness and/or the terms of any future indebtedness from time to time could result in an event of default, which, if not cured or waived, could result in our being required to repay these borrowings before their due date. If we are forced to refinance these borrowings on less favorable terms or are unable to refinance these borrowings, our results of operations and financial condition could be adversely affected.
Servicing our indebtedness will require a significant amount of cash. Our ability to generate sufficient cash depends on many factors, some of which are not within our control.
Our ability to make payments on our indebtedness and to fund planned capital expenditures will depend on our ability to generate cash in the future. To a certain extent, this is subject to general economic, financial, competitive, legislative, regulatory and other factors that are beyond our control. If we are unable to generate sufficient cash flow to service our debt and meet our other commitments, we may need to restructure or refinance all or a portion of our debt, sell material assets or operations or raise additional debt or equity capital. We may not be able to effect any of these actions on a timely basis, on commercially reasonable terms or at all, and these actions may not be sufficient to meet our capital requirements. In addition, the terms of our existing or future debt arrangements may restrict us from effecting any of these alternatives.
Despite our current level of indebtedness, we may still be able to incur substantially more debt. This could further exacerbate the risks to our financial condition described above.
We may be able to incur significant additional indebtedness in the future. Although the indenture governing our senior notes and the credit agreement governing our senior secured credit facilities contain restrictions on the incurrence of additional indebtedness, these restrictions are subject to a number of qualifications and exceptions, and we could incur substantial additional indebtedness in compliance with these restrictions. If we incur any
29
Table of Contents
additional indebtedness that ranks equally with the notes, subject to collateral arrangements, the holders of that debt will be entitled to share ratably with you in any proceeds distributed in connection with any insolvency, liquidation, reorganization, dissolution or other winding up of our company. These restrictions also will not prevent us from incurring obligations that do not constitute indebtedness. Our senior secured credit facilities include an uncommitted incremental facility that will allow us the option to increase the amount available under the term loan facility and/or the senior secured revolving credit facility by (i) $135.0 million plus (ii) an additional amount so long as we are in pro forma compliance with a consolidated first lien net leverage ratio. Availability of such incremental facilities will be subject to, among other conditions, the absence of an event of default and pro forma compliance with the financial covenants under our credit agreement and the receipt of commitments by existing or additional financial institutions.
Other Risks
Our success is dependent on our Chief Executive Officer and other key personnel.
Our success depends on the continuing services of our Chief Executive Officer, Mr. Tom Hill, and other key personnel. We believe that Mr. Hill possesses valuable knowledge and skills that are crucial to our success and would be very difficult to replicate. Our senior management team was assembled under the leadership of Mr. Hill. The team was assembled with a view towards substantial growth, and the size and aggregate compensation of the team increased substantially. The associated significant increase in overhead expense could decrease our margins if we fail to grow substantially. Not all of our senior management team resides near or works at our headquarters. The geographic distance of the members of our senior management team may impede the team’s ability to work together effectively. Our success will depend, in part, on the efforts and abilities of our senior management and their ability to work together. We cannot assure you that they will be able to do so.
Over time, our success will depend on attracting and retaining qualified personnel. Competition for senior management is intense, and we may not be able to retain our management team or attract additional qualified personnel. The loss of a member of senior management would require our remaining senior officers to divert immediate attention, which could be substantial or require costly external resources in the short term to fulfilling. The inability to adequately fill vacancies in our senior executive positions on a timely basis could negatively affect our ability to implement our business strategy, which could adversely affect our results of operations and prospects.
We use large amounts of electricity, diesel fuel, liquid asphalt and other petroleum-based resources that are subject to potential reliability issues, supply constraints and significant price fluctuation, which could affect our financial position, operating results and liquidity.
In our production and distribution processes, we consume significant amounts of electricity, diesel fuel, liquid asphalt and other petroleum-based resources. The availability and pricing of these resources are subject to market forces that are beyond our control. Furthermore, we are vulnerable to any reliability issues experienced by our suppliers, which also are beyond our control. Our suppliers contract separately for the purchase of such resources and our sources of supply could be interrupted should our suppliers not be able to obtain these materials due to higher demand or other factors that interrupt their availability. Variability in the supply and prices of these resources could materially affect our financial position, results of operations and liquidity from period to period.
Climate change and climate change legislation or regulations may adversely affect our business.
A number of governmental bodies have introduced or are contemplating legislative and regulatory changes in response to the potential effects of climate change. Such legislation or regulation has and potentially could include provisions for a “cap and trade” system of allowances and credits, among other provisions. The EPA promulgated a mandatory reporting rule covering greenhouse gas emissions from sources considered to be large emitters. The EPA has also promulgated a greenhouse gas emissions permitting rule, referred to as the “Tailoring
30
Table of Contents
Rule” which sets forth criteria for determining which facilities are required to obtain permits for greenhouse gas (“GHG”) emissions pursuant to the U.S. Clean Air Act’s Prevention of Significant Deterioration (“PSD”) and Title V operating permit programs. The U.S. Supreme Court ruled in June 2014 that the EPA exceeded its statutory authority in issuing the Tailoring Rule but upheld the Best Available Control Technology (“BACT”) requirements for GHGs emitted by sources already subject to PSD requirements for other pollutants. Our cement plant and one of our landfills hold Title V Permits. If future modifications to our facilities require PSD review for other pollutants, GHG BACT requirements may also be triggered, which could require significant additional costs.
Other potential effects of climate change include physical effects such as disruption in production and product distribution as a result of major storm events and shifts in regional weather patterns and intensities. There is also a potential for climate change legislation and regulation to adversely affect the cost of purchased energy and electricity.
The effects of climate change on our operations are highly uncertain and difficult to estimate. However, because a chemical reaction inherent to the manufacture of Portland cement releases carbon dioxide, a GHG, cement kiln operations may be disproportionately affected by future regulation of GHGs. Climate change and legislation and regulation concerning GHGs could have a material adverse effect on our financial condition, results of operations and liquidity.
As an “emerging growth company” under the JOBS Act, we are permitted to, and intend to, rely on exemptions from certain disclosure requirements.
As an “emerging growth company” under the JOBS Act, we are permitted to, and intend to, rely on exemptions from certain disclosure requirements. We will cease to be an emerging growth company upon the earliest of: (1) the end of the fiscal year following the fifth anniversary of this offering; (2) the last day of the first fiscal year during which our annual gross revenues were $1.0 billion or more; (3) the date on which we have, during the previous three-year period, issued more than $1.0 billion in non-convertible debt securities; or (4) the end of any fiscal year in which the market value of our common stock held by non-affiliates exceeded $700 million as of the end of the second quarter of that fiscal year.
For so long as we remain an “emerging growth company,” we will not be required to, among other things:
| • | comply with any requirement that may be adopted by the Public Company Accounting Oversight Board regarding a supplement to the auditor’s reporting providing additional information about the audit and the financial statements (auditor discussion and analysis); |
| • | submit certain executive compensation matters to shareholders advisory votes pursuant to the “say on frequency” and “say on pay” provisions (requiring a non-binding shareholder vote to approve compensation of certain executive officers) and “say on golden parachute” provisions (requiring a non-binding shareholder vote to approve golden parachute arrangements for certain executive officers in connection with mergers and certain other business combinations) of the Dodd-Frank Wall Street Reform and Consumer Protection Act of 2010; and |
| • | include detailed compensation discussion and analysis in our filings with the Securities and Exchange Commission (the “SEC”) and instead may provide a reduced level of disclosure concerning executive compensation. |
We have not taken advantage of all of these reduced reporting burdens in this prospectus, although we may do so in future filings with the SEC. The specific implications for us of the JOBS Act are still subject to interpretations and guidance by the SEC and other regulatory agencies. In addition, as our business grows, we may cease to satisfy the conditions of an “emerging growth company.” We are currently evaluating and monitoring developments with respect to these new rules and we cannot assure you that we will be able to take advantage of all of the benefits from the JOBS Act.
31
Table of Contents
In addition, as an “emerging growth company,” we may elect to delay adoption of new or revised accounting standards applicable to public companies until such standards are made applicable to private companies. As a result, our financial statements may not be comparable to the financial statements of issuers who are required to comply with the effective dates for new or revised accounting standards that are applicable to public companies.
We are dependent on information technology. Our systems and infrastructure face certain risks, including cyber security risks and data leakage risks.
We are dependent on information technology systems and infrastructure. Any significant breakdown, invasion, destruction or interruption of these systems by employees, others with authorized access to our systems, or unauthorized persons could negatively affect operations. There is also a risk that we could experience a business interruption, theft of information or reputational damage as a result of a cyber attack, such as an infiltration of a data center, or data leakage of confidential information either internally or at our third-party providers. While we have invested in the protection of our data and information technology to reduce these risks and periodically test the security of our information systems network, there can be no assurance that our efforts will prevent breakdowns or breaches in our systems that could adversely affect our financial condition, results of operations and liquidity.
Labor disputes could disrupt operations of our businesses.
As of September 27, 2014, labor unions represented approximately 5.5% of our total employees, substantially all at Continental Cement. Our collective bargaining agreements for employees generally expire between 2015 and 2018. Although we believe we have good relations with our employees and unions, disputes with our trade unions, or the inability to renew our labor agreements, could lead to strikes or other actions that could disrupt our operations, raise costs, and reduce revenue and earnings in the affected locations.
Risks Related to Our Organizational Structure
Summit Materials, Inc.’s only material asset after completion of this offering will be its interest in Summit Holdings, and it is accordingly dependent upon distributions from Summit Holdings to pay taxes, make payments under the tax receivable agreement and pay dividends.
Summit Materials, Inc. will be a holding company and will have no material assets other than its ownership of LP Units. Summit Materials has no independent means of generating revenue. Summit Materials, Inc. intends to cause Summit Holdings to make distributions to holders of LP Units in an amount sufficient to cover all applicable taxes at assumed tax rates, payments under the tax receivable agreement and dividends, if any, declared by it. Deterioration in the financial condition, earnings or cash flow of Summit Holdings and its subsidiaries for any reason could limit or impair their ability to pay such distributions. Additionally, to the extent that Summit Materials, Inc. needs funds, and Summit Holdings is restricted from making such distributions under applicable law or regulation or under the terms of our financing arrangements, or is otherwise unable to provide such funds, it could materially adversely affect our liquidity and financial condition.
Payments of dividends, if any, will be at the discretion of our board of directors after taking into account various factors, including our business, operating results and financial condition, current and anticipated cash needs, plans for expansion and any legal or contractual limitations on our ability to pay dividends. Any financing arrangement that we enter into in the future may include restrictive covenants that limit our ability to pay dividends. In addition, Summit Holdings is generally prohibited under Delaware law from making a distribution to a limited partner to the extent that, at the time of the distribution, after giving effect to the distribution, liabilities of Summit Holdings (with certain exceptions) exceed the fair value of its assets. Subsidiaries of Summit Holdings are generally subject to similar legal limitations on their ability to make distributions to Summit Holdings.
32
Table of Contents
Summit Materials, Inc. will be required to pay exchanging holders of LP Units and certain other indirect pre-IPO owners for most of the benefits relating to any additional tax depreciation or amortization deductions that we may claim as a result of the tax basis step-up we receive in connection with sales or exchanges of LP Units and related transactions and our utilization of certain net operating losses of the Investor Entities.
Holders of LP Units (other than Summit Materials, Inc.) may, subject to the vesting and minimum retained ownership requirements and transfer restrictions applicable to such holders as set forth in the operating agreement of Summit Holdings, from and after the first anniversary of the date of the completion of this offering (subject to the terms of the exchange agreement), exchange their LP Units for Class A common stock on a one-for-one basis. Notwithstanding the foregoing, Blackstone is generally permitted to exchange LP Units at any time. The exchanges are expected to result in increases in the tax basis of the tangible and intangible assets of Summit Holdings These increases in tax basis may increase (for tax purposes) depreciation and amortization deductions and therefore reduce the amount of tax that Summit Materials, Inc. would otherwise be required to pay in the future, although the Internal Revenue Service (the “IRS”) may challenge all or part of the tax basis increase, and a court could sustain such a challenge.
Prior to the completion of this offering, we will enter into a tax receivable agreement with the holders of LP Units that provides for the payment by Summit Materials, Inc. to exchanging holders of LP Units and certain other indirect pre-IPO owners of 85% of the benefits, if any, that Summit Materials, Inc. is deemed to realize as a result of (i) the increases in tax basis described above and (ii) our utilization of certain net operating losses of the Investor Entities and certain other tax benefits related to entering into the tax receivable agreement, including tax benefits attributable to payments under the tax receivable agreement. This payment obligation is an obligation of Summit Materials, Inc. and not of Summit Holdings. While the actual increase in tax basis and the actual amount and utilization of net operating losses, as well as the amount and timing of any payments under the tax receivable agreement, will vary depending upon a number of factors, including the timing of exchanges, the price of shares of our Class A common stock at the time of the exchange, the extent to which such exchanges are taxable and the amount and timing of our income, we expect that as a result of the size of the transfers and increases in the tax basis of the tangible and intangible assets of Summit Holdings and our possible utilization of net operating losses, the payments that Summit Materials, Inc. may make under the tax receivable agreement will be substantial. The payments under the tax receivable agreement are not conditioned upon continued ownership of us by the holders of LP Units. See “Certain Relationships and Related Person Transactions—Tax Receivable Agreement.”
In certain cases, payments under the tax receivable agreement may be accelerated and/or significantly exceed the actual benefits Summit Materials, Inc. realizes in respect of the tax attributes subject to the tax receivable agreement.
The tax receivable agreement provides that upon certain changes of control, or if, at any time, Summit Materials, Inc. elects an early termination of the tax receivable agreement, Summit Materials, Inc.’s obligations under the tax receivable agreement (with respect to all LP Units whether or not previously exchanged) would be calculated by reference to the value of all future payments that holders of LP Units or other recipients would have been entitled to receive under the tax receivable agreement using certain valuation assumptions, including that Summit Materials, Inc. will have sufficient taxable income to fully utilize the deductions arising from the tax deductions, tax basis and other and other tax attributes subject to the tax receivable agreement and, in the case of an early termination election, that any LP Units that have not been exchanged are deemed exchanged for the market value of the shares of Class A common stock at the time of termination. In addition, holders of LP Units will not reimburse us for any payments previously made under the tax receivable agreement if such tax basis increase and our utilization of certain net operating losses is successfully challenged by the IRS. Summit Materials, Inc.’s ability to achieve benefits from any tax basis increase or net operating losses, and the payments to be made under the tax receivable agreement, will depend upon a number of factors, including the timing and amount of our future income. As a result, even in the absence of a change of control or an election to terminate the tax receivable agreement payments under the tax receivable agreement could be in excess of Summit Materials’ actual cash tax savings.
33
Table of Contents
Accordingly, it is possible that the actual cash tax savings realized by Summit Materials, Inc. may be significantly less than the corresponding tax receivable agreement payments. There may be a material negative effect on our liquidity if the payments under the tax receivable agreement exceed the actual cash tax savings that Summit Materials realizes in respect of the tax attributes subject to the tax receivable agreement and/or distributions to Summit Materials, Inc. by Summit Holdings are not sufficient to permit Summit Materials to make payments under the tax receivable agreement after it has paid taxes and other expenses. Based upon certain assumptions described in greater detail below under “Certain Relationships and Related Person Transactions—Tax Receivable Agreement,” we estimate that if Summit Materials, Inc. were to exercise its termination right immediately following this offering, the aggregate amount of these termination payments would be approximately $ million. The foregoing number is merely an estimate and the actual payments could differ materially. We may need to incur debt to finance payments under the tax receivable agreement to the extent our cash resources are insufficient to meet our obligations under the tax receivable agreement as a result of timing discrepancies or otherwise.
Risks Related to this Offering and Ownership of Our Class A Common Stock
Blackstone and its affiliates control us and their interests may conflict with ours or yours in the future.
Immediately following this offering, Blackstone and its affiliates will hold % of the combined voting power of our Class A and Class B common stock (or % if the underwriters exercise in full their option to purchase additional shares of Class A common stock). Moreover, under our bylaws and the stockholders’ agreement with Blackstone and its affiliates that will be in effect by the completion of this offering, for so long as our existing owners and their affiliates retain significant ownership of us, we will agree to nominate to our board individuals designated by Blackstone, whom we refer to as the “Sponsor Directors.” Even when Blackstone and its affiliates cease to own shares of our stock representing a majority of the total voting power, for so long as Blackstone continues to own a significant percentage of our stock Blackstone will still be able to significantly influence the composition of our board of directors and the approval of actions requiring stockholder approval through its voting power. Accordingly, for such period of time, Blackstone will have significant influence with respect to our management, business plans and policies, including the appointment and removal of our officers. In particular, for so long as Blackstone continues to own a significant percentage of our stock, Blackstone will be able to cause or prevent a change of control of our company or a change in the composition of our board of directors and could preclude any unsolicited acquisition of our company. The concentration of ownership could deprive you of an opportunity to receive a premium for your shares of Class A common stock as part of a sale of our company and ultimately might affect the market price of our Class A common stock.
Blackstone and its affiliates engage in a broad spectrum of activities. In the ordinary course of their business activities, Blackstone and its affiliates may engage in activities where their interests conflict with our interests or those of our stockholders. Our amended and restated certificate of incorporation will provide that none of Blackstone, any of its affiliates or any director who is not employed by us (including any non-employee director who serves as one of our officers in both his director and officer capacities) or his or her affiliates will have any duty to refrain from engaging, directly or indirectly, in the same business activities or similar business activities or lines of business in which we operate. Blackstone also may pursue acquisition opportunities that may be complementary to our business, and, as a result, those acquisition opportunities may not be available to us. In addition, Blackstone may have an interest in us pursuing acquisitions, divestitures and other transactions that, in its judgment, could enhance its investment, even though such transactions might involve risks to you.
Upon the listing of our shares of Class A common stock on the NYSE, we will be a “controlled company” within the meaning of NYSE rules and, as a result, will qualify for, and intend to rely on, exemptions from certain corporate governance requirements. You will not have the same protections afforded to stockholders of companies that are subject to such requirements.
After completion of this offering, affiliates of Blackstone will continue to control a majority of the combined voting power of all classes of our stock entitled to vote generally in the election of directors. As a
34
Table of Contents
result, we will be a “controlled company” within the meaning of the corporate governance standards of the NYSE. Under these rules, a company of which more than 50% of the voting power in the election of directors is held by an individual, group or another company is a “controlled company” and may elect not to comply with certain corporate governance requirements, including the requirements that, within one year of the date of the listing of our Class A common stock:
| • | we have a board that is composed of a majority of “independent directors,” as defined under the rules of such exchange; |
| • | we have a compensation committee that is composed entirely of independent directors; and |
| • | we have a corporate governance and nominating committee that is composed entirely of independent directors. |
Following this offering, we intend to utilize these exemptions. As a result, we do not expect that a majority of the directors on our board will be independent upon completion of this offering. In addition, we do not expect that any of the committees of the board will consist entirely of independent directors. Accordingly, you will not have the same protections afforded to stockholders of companies that are subject to all of the corporate governance requirements of the NYSE.
We will incur increased costs and become subject to additional regulations and requirements as a result of becoming a public company, which could lower our profits or make it more difficult to run our business.
As a public company, we will incur significant legal, accounting and other expenses that we have not incurred as a private company, including costs associated with public company reporting requirements. We also have incurred and will incur costs associated with the Sarbanes-Oxley Act of 2002 (“Sarbanes-Oxley Act”), and related rules implemented by the SEC and the NYSE. The expenses incurred by public companies generally for reporting and corporate governance purposes have been increasing. We expect these rules and regulations to increase our legal and financial compliance costs and to make some activities more time-consuming and costly, although we are currently unable to estimate these costs with any degree of certainty. These laws and regulations also could make it more difficult or costly for us to obtain certain types of insurance, including director and officer liability insurance, and we may be forced to accept reduced policy limits and coverage or incur substantially higher costs to obtain the same or similar coverage. These laws and regulations could also make it more difficult for us to attract and retain qualified persons to serve on our board of directors, our board committees or as our executive officers. Furthermore, if we are unable to satisfy our obligations as a public company, we could be subject to delisting of our Class A common stock, fines, sanctions and other regulatory action and potentially civil litigation.
If we are unable to implement and maintain effective internal control over financial reporting in the future, investors may lose confidence in the accuracy and completeness of our financial reports and the market price of our Class A common stock may be negatively affected.
As a public company, we will be required to maintain internal controls over financial reporting and to report any material weaknesses in such internal controls. In addition, beginning with our second annual report on Form 10-K, we expect we will be required to furnish a report by management on the effectiveness of our internal control over financial reporting, pursuant to Section 404 of the Sarbanes-Oxley Act. Our independent registered public accounting firm is not required to express an opinion as to the effectiveness of our internal control over financial reporting until after we are no longer an “emerging growth company,” as defined in the JOBS Act. At such time, however, our independent registered public accounting firm may issue a report that is adverse in the event it is not satisfied with the level at which our internal control over financial reporting is documented, designed or operating.
The process of designing, implementing, and testing the internal control over financial reporting required to comply with this obligation is time consuming, costly, and complicated. If we identify material weaknesses in our internal control over financial reporting, if we are unable to comply with the requirements of Section 404 of
35
Table of Contents
the Sarbanes-Oxley Act in a timely manner or to assert that our internal control over financial reporting is effective, or if our independent registered public accounting firm is unable to express an opinion as to the effectiveness of our internal control over financial reporting once we are no longer an “emerging growth company,” investors may lose confidence in the accuracy and completeness of our financial reports and the market price of our Class A common stock could be negatively affected, and we could become subject to investigations by the stock exchange on which our securities are listed, the SEC, or other regulatory authorities, which could require additional financial and management resources.
There may not be an active trading market for shares of our Class A common stock, which may cause shares of our Class A common stock to trade at a discount from the initial offering price and make it difficult to sell the shares of Class A common stock you purchase.
Prior to this offering, there has not been a public trading market for shares of our Class A common stock. It is possible that after this offering, an active trading market will not develop or continue or, if developed, that any market will not be sustained, which would make it difficult for you to sell your shares of Class A common stock at an attractive price or at all. The initial public offering price per share of Class A common stock was determined by agreement among us and the representatives of the underwriters, and may not be indicative of the price at which shares of our Class A common stock will trade in the public market after this offering.
The market price of shares of our Class A common stock may be volatile, which could cause the value of your investment to decline.
Even if a trading market develops, the market price of our Class A common stock may be highly volatile and could be subject to wide fluctuations. Securities markets worldwide experience significant price and volume fluctuations. This market volatility, as well as general economic, market or political conditions, could reduce the market price of shares of our Class A common stock regardless of our operating performance. In addition, our operating results could be below the expectations of public market analysts and investors due to a number of potential factors, including variations in our quarterly operating results or dividends, if any, to stockholders, additions or departures of key management personnel, failure to meet analysts’ earnings estimates, publication of research reports about our industry, litigation and government investigations, changes or proposed changes in laws or regulations or differing interpretations or enforcement thereof affecting our business, adverse market reaction to any indebtedness we may incur or securities we may issue in the future, changes in market valuations of similar companies or speculation in the press or investment community, announcements by our competitors of significant contracts, acquisitions, dispositions, strategic partnerships, joint ventures or capital commitments, adverse publicity about the industries we participate in or individual scandals, and in response the market price of shares of our Class A common stock could decrease significantly. You may be unable to resell your shares of Class A common stock at or above the initial public offering price.
In the past few years, stock markets have experienced extreme price and volume fluctuations. In the past, following periods of volatility in the overall market and the market price of a company’s securities, securities class action litigation has often been instituted against these companies. Such litigation, if instituted against us, could result in substantial costs and a diversion of our management’s attention and resources.
Because we have no current plans to pay cash dividends on our Class A common stock, you may not receive any return on investment unless you sell your Class A common stock for a price greater than that which you paid for it.
We have no current plans to pay any cash dividends. The declaration, amount and payment of any future dividends on shares of Class A common stock will be at the sole discretion of our board of directors. Our board of directors may take into account general and economic conditions, our financial condition and results of operations, our available cash and current and anticipated cash needs, capital requirements, contractual, legal, tax and regulatory restrictions and implications on the payment of dividends by us to our stockholders or by our
36
Table of Contents
subsidiaries to us and such other factors as our board of directors may deem relevant. In addition, our ability to pay dividends is limited by our senior secured credit facility and our senior notes and may be limited by covenants of other indebtedness we or our subsidiaries incur in the future. As a result, you may not receive any return on an investment in our Class A common stock unless you sell our Class A common stock for a price greater than that which you paid for it.
Investors in this offering will experience immediate and substantial dilution.
The initial public offering price per share of Class A common stock will be substantially higher than our pro forma net tangible book deficit per share immediately after this offering. As a result, you will pay a price per share of Class A common stock that substantially exceeds the per share book value of our tangible assets after subtracting our liabilities. In addition, you will pay more for your shares of Class A common stock than the amounts paid for the LP Units by our pre-IPO owners. Assuming an offering price of $ per share of Class A common stock, which is the midpoint of the range on the front cover of this prospectus, you will incur immediate and substantial dilution in an amount of $ per share of Class A common stock. See “Dilution.”
You may be diluted by the future issuance of additional Class A common stock in connection with our incentive plans, acquisitions or otherwise.
After this offering we will have approximately shares of Class A common stock authorized but unissued, including approximately shares of Class A common stock issuance upon exchange of LP units that will be held by limited partners of Summit Holdings Our amended and restated certificate of incorporation to become effective immediately prior to the consummation of this offering authorizes us to issue these shares of Class A common stock and options, rights, warrants and appreciation rights relating to Class A common stock for the consideration and on the terms and conditions established by our board of directors in its sole discretion, whether in connection with acquisitions or otherwise. Similarly, the limited partnership agreement of Summit Holdings permits Summit Holdings to issue an unlimited number of additional limited partnership interests of Summit Holdings with designations, preferences, rights, powers and duties that are different from, and may be senior to, those applicable to the LP Units, and which may be exchangeable for shares of our Class A common stock. Additionally, we have reserved an aggregate of shares of Class A common stock and LP Units for issuance under our Omnibus Incentive Plan. See “Executive and Director Compensation—Summit Materials, Inc. Omnibus Incentive Plan.” Any Class A common stock that we issue, including under our Omnibus Incentive Plan or other equity incentive plans that we may adopt in the future, would dilute the percentage ownership held by the investors who purchase Class A common stock in this offering.
If we or our existing investors sell additional shares of our Class A common stock after this offering, the market price of our Class A common stock could decline.
The sale of substantial amounts of shares of our Class A common stock in the public market, or the perception that such sales could occur, could harm the prevailing market price of shares of our Class A common stock. These sales, or the possibility that these sales may occur, also might make it more difficult for us to sell equity securities in the future at a time and at a price that we deem appropriate. Upon completion of this offering we will have a total of shares of our Class A common stock outstanding. Of the outstanding shares, the shares sold in this offering (or shares if the underwriters exercise in full their option to purchase additional shares) will be freely tradable without restriction or further registration under the Securities Act, except that any shares held by our affiliates, as that term is defined under Rule 144 of the Securities Act, may be sold only in compliance with the limitations described in “Shares Eligible for Future Sale.”
The remaining outstanding shares of Class A common stock held by our existing owners and management after this offering (or shares if the underwriters exercise in full their option to purchase additional shares) will be subject to certain restrictions on resale. We, our officers, directors and holders of certain of our outstanding shares of Class A common stock immediately prior to this offering, including
37
Table of Contents
Blackstone, that collectively will own shares of Class A common stock following this offering (or shares of Class A common stock if the underwriters exercise their option to purchase additional shares in full), will sign lock-up agreements with the underwriters that will, subject to certain customary exceptions, restrict the sale of the shares of our common stock held by them for 180 days following the date of this prospectus, subject to extension in the case of an earnings release or material news or a material event relating to us. may, in its sole discretion, release all or any portion of the shares of common stock subject to lock-up agreements. See “Underwriting (Conflicts of Interest)” for a description of these lock-up agreements. Upon the expiration of the lock-up agreements, all of such shares will be eligible for resale in a public market, subject, in the case of shares held by our affiliates, to volume, manner of sale and other limitations under Rule 144. We expect that Blackstone will be considered an affiliate 180 days after this offering based on their expected share ownership (consisting of shares), as well as their board nomination rights. Certain other of our stockholders may also be considered affiliates at that time. However, commencing 180 days following this offering, the holders of these shares of Class A common stock will have the right, subject to certain exceptions and conditions, to require us to register their shares of Class A common stock under the Securities Act, and they will have the right to participate in future registrations of securities by us. Registration of any of these outstanding shares of Class A common stock would result in such shares becoming freely tradable without compliance with Rule 144 upon effectiveness of the registration statement. See “Shares Eligible for Future Sale.”
We intend to file one or more registration statements on Form S-8 under the Securities Act to register shares of our Class A common stock or securities convertible into or exchangeable for shares of our Class A common stock issued pursuant to our Omnibus Incentive Plan. Any such Form S-8 registration statements will automatically become effective upon filing. Accordingly, shares registered under such registration statements will be available for sale in the open market. We expect that the initial registration statement on Form S-8 will cover shares of our Class A common stock.
As restrictions on resale end, the market price of our shares of Class A common stock could drop significantly if the holders of these restricted shares sell them or are perceived by the market as intending to sell them. These factors could also make it more difficult for us to raise additional funds through future offerings of our shares of Class A common stock or other securities.
Anti-takeover provisions in our organizational documents and Delaware law might discourage or delay acquisition attempts for us that you might consider favorable.
Our amended and restated certificate of incorporation and amended and restated bylaws to become effective immediately prior to the consummation of this offering will contain provisions that may make the merger or acquisition of our company more difficult without the approval of our board of directors. Among other things, these provisions:
| • | would allow us to authorize the issuance of undesignated preferred stock in connection with a stockholder rights plan or otherwise, the terms of which may be established and the shares of which may be issued without stockholder approval, and which may include super voting, special approval, dividend, or other rights or preferences superior to the rights of the holders of Class A common stock; |
| • | prohibit stockholder action by written consent from and after the date on which the parties to our stockholders’ agreement cease to beneficially own at least 30% of the total voting power of all then outstanding shares of our capital stock unless such action is recommended by all directors then in office; |
| • | provide that the board of directors is expressly authorized to make, alter, or repeal our bylaws and that our stockholders may only amend our bylaws with the approval of 66 2⁄3% or more in voting power of all outstanding shares of our capital stock, if Blackstone and its affiliates beneficially own less than 30% in voting power of our stock entitled to vote generally in the election of directors; and |
| • | establish advance notice requirements for nominations for elections to our board or for proposing matters that can be acted upon by stockholders at stockholder meetings. |
38
Table of Contents
Further, as a Delaware corporation, we are also subject to provisions of Delaware law, which may impair a takeover attempt that our stockholders may find beneficial. These anti-takeover provisions and other provisions under Delaware law could discourage, delay or prevent a transaction involving a change in control of our company, including actions that our stockholders may deem advantageous, or negatively affect the trading price of our Class A common stock. These provisions could also discourage proxy contests and make it more difficult for you and other stockholders to elect directors of your choosing and to cause us to take other corporate actions you desire.
39
Table of Contents
This prospectus contains forward-looking statements that reflect our current views with respect to, among other things, our operations and financial performance. Forward-looking statements include all statements that are not historical facts. In some cases, you can identify these forward-looking statements by the use of words such as “outlook,” “believes,” “expects,” “potential,” “continues,” “may,” “will,” “should,” “could,” “seeks,” “approximately,” “predicts,” “intends,” “trends,” “plans,” “estimates,” “anticipates” or the negative version of these words or other comparable words. Such forward-looking statements are subject to various risks and uncertainties. Accordingly, there are or will be important factors that could cause actual outcomes or results to differ materially from those indicated in these statements. These factors include but are not limited to those described under “Risk Factors.” These factors should not be construed as exhaustive and should be read in conjunction with the other cautionary statements that are included in this prospectus. We undertake no obligation to publicly update or review any forward-looking statement, whether as a result of new information, future developments or otherwise, except as required by law.
This prospectus includes market and industry data and forecasts that we have derived from independent consultant reports, publicly available information, various industry publications, other published industry sources and our internal data and estimates. Independent consultant reports, industry publications and other published industry sources generally indicate that the information contained therein was obtained from sources believed to be reliable.
Our internal data and estimates are based upon information obtained from trade and business organizations and other contacts in the markets in which we operate and our management’s understanding of industry conditions. Although we believe that such information is reliable, we have not had this information verified by any independent sources.
40
Table of Contents
Existing Organizational Structure
The diagram below depicts our current organizational structure:
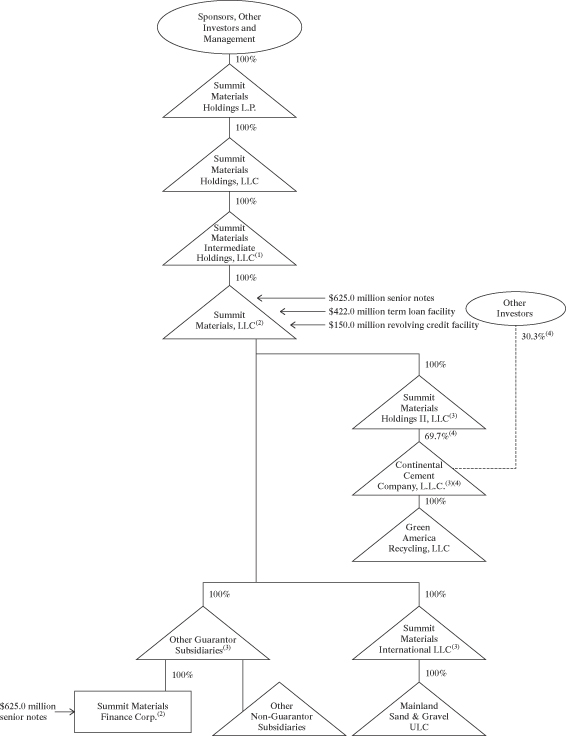
41
Table of Contents
| (1) | Guarantor under our senior secured credit facilities, but not our senior notes. |
| (2) | Summit Materials, LLC and Summit Materials Finance Corp. are the issuers of our senior notes and Summit Materials, LLC is the borrower under our senior secured credit facilities. Summit Materials Finance Corp. was formed in December 2011 solely to act as co-issuer of the senior notes and other indebtedness, has no assets and does not conduct any operations. |
| (3) | Guarantor under our senior notes and guarantor under our senior secured credit facilities. |
| (4) | Pursuant to the terms of the Amended and Restated Limited Liability Company Agreement of Continental Cement, in the absence of a dissolution or liquidation of Continental Cement, Summit Materials Holdings II, LLC (“Summit II”), which holds Class A Units of Continental Cement, and the holders of the Class B Units of Continental Cement are each entitled to receive a percentage of the distributions on a pari passu basis. The percentage received by the holders of the Class B Units relative to Summit II adjusts based on the time period that the Class A Units have been outstanding and whether Summit II has received a certain return on the capital contributions it made to purchase the Class A Units it holds. Summit II’s sharing percentage is generally between 70% and 80%. The holders of the Class B Units collectively share in the remaining distributions not allocated to Summit II. In connection with a dissolution or liquidation of Continental Cement, distributions are made either in the manner set forth above or, if it provides a greater return to Summit II with respect to the Class A Units, Summit II will receive a priority distribution ahead of the Class B Units up to an amount equal to the capital contributions made by Summit II in respect of the Class A Units, plus interest on such capital contributions of 11%, accruing daily and compounding annually from the date of issuance of the Class A Units. Any excess amount to be distributed after the priority payment to Summit II is then made to the holders of the Class B Units. Subject to certain exceptions and conditions, Summit II has the right to require Continental Cement to purchase all, but not less than all, of the Class B Units at any time after May 27, 2016. In addition, subject to certain exceptions and conditions, holders of the Class B Units have the right to require Continental Cement to purchase all, but not less than all, of the Class B Units at a strike price that approximates fair value, including in the event of a change of control of Summit Holdings prior to May 27, 2016, or at any time thereafter. Holders of Class B Units also have certain rights that allow them to rollover their interests in connection with an initial public offering. Upon consummation of this offering, we expect to acquire all of the Class B Units of Continental Cement and that Continental Cement will become a wholly-owned indirect subsidiary of Summit Holdings. See footnote (2) to the diagram included under “—Organizational Structure Following this Offering” below for additional details. |
Organizational Structure Following this Offering
Immediately following this offering, Summit Materials, Inc. is expected to be a holding company, and its sole material asset is expected to be a controlling equity interest in Summit Holdings. As the general partner of Summit Holdings, Summit Materials, Inc. is expected to operate and control all of the business and affairs of Summit Holdings and, through Summit Holdings and its subsidiaries, conduct our business. Under U.S. GAAP, Summit Holdings is expected to meet the definition of a variable interest entity since the voting rights of its investors is not expected to be proportional to their obligations to absorb the expected losses of Summit Holdings. That is, Summit Materials, Inc. is expected to hold 100% of the voting power in Summit Holdings but is expected to initially own less than 50% of the LP Units and our pre-IPO owners are expected to hold no voting rights in Summit Holdings but initially own more than 50% of the LP Units. Summit Materials, Inc. is expected to be the primary beneficiary of Summit Holdings as a result of its 100% voting power and control over Summit Holdings and as a result of its obligation to absorb losses and its right to receive benefits of Summit Holdings that could potentially be significant to Summit Holdings. Summit Materials, Inc. is expected to consolidate Summit Holdings on its consolidated financial statements and record a noncontrolling interest related to the LP Units held by our pre-IPO owners on its consolidated statements of condition, operations, and comprehensive income.
Summit Owner Holdco, an entity that will be owned by our pre-IPO owners and Class B Unitholders of Continental Cement, will initially hold all of the shares of our Class B common stock that will be outstanding upon consummation of this offering. The Class B common stock will entitle (x) Summit Owner Holdco, without
42
Table of Contents
regard to the number of shares of Class B common stock held by it, to a number of votes that is equal to the aggregate number of Initial LP Units less the number of such Initial LP Units that, after the IPO Date, have been transferred to Summit Materials, Inc. in accordance with the exchange agreement or are transferred to a holder other than Summit Owner Holdco together with a share of Class B common stock (or fraction thereof) and (y) each other holder of Class B common stock, without regard to the number of shares of Class B common stock held by such other holder, to a number of votes that is equal to the number of LP Units held by such other holder. At the completion of this offering, our pre-IPO owners will comprise all of the limited partners of Summit Holdings. However, Summit Holdings may in the future admit additional limited partners that would not constitute pre-IPO owners. If at any time the ratio at which LP Units are exchangeable for shares of our Class A common stock changes from one-for-one as described under “Certain Relationships and Related Person Transactions—Exchange Agreement,” for example, as a result of conversion rate adjustments for stock splits, stock dividends or reclassifications, the number of votes to which Class B common stockholders are entitled will be adjusted accordingly. Holders of shares of our Class B common stock will vote together with holders of our Class A common stock as a single class on all matters on which stockholders are entitled to vote generally, except as otherwise required by law.
43
Table of Contents
The diagram below depicts our organizational structure immediately following this offering:
44
Table of Contents
| (1) | The Class B common stock will entitle Summit Owner Holdco, without regard to the number of shares of Class B common stock held by it, to a number of votes that is equal to the aggregate number of Initial LP Units less the number of such Initial LP Units that, after the IPO Date, have been transferred to Summit Materials, Inc. in accordance with the exchange agreement or are transferred to a holder other than Summit Owner Holdco together with a share of Class B common stock (or fraction thereof) and entitle each other holder of Class B common stock, without regard to the number of shares of Class B common stock held by such other holder, to a number of votes that is equal to the number of LP Units held by such holder. |
| (2) | Pursuant to the terms of the Amended and Restated Limited Liability Company Agreement of Continental Cement, a non-wholly-owned indirect subsidiary of Summit Holdings, the Class B Unitholders have the right to elect to rollover their interests in Continental Cement in connection with an initial public offering. In lieu of the Class B Unitholders electing to rollover their interests in connection with this offering, we have entered into a contribution and purchase agreement with the Class B Unitholders whereby, concurrently with the consummation of this offering (w) the Class B Unitholders will contribute 28,571,429 of the Class B Units of Continental Cement to Summit Owner Holdco in exchange for Series A Units of Summit Owner Holdco, (x) the existing general partner of Summit Holdings will contribute to Summit Owner Holdco its right to act as the general partner of Summit Holdings in exchange for Series B Units of Summit Owner Holdco, (y) Summit Owner Holdco will in turn contribute the Class B Units of Continental Cement to Summit Materials, Inc. in exchange for shares of Class A common stock and will contribute to Summit Materials, Inc. its right to act as the general partner of Summit Holdings in exchange for shares of Class B common stock and (z) the Class B Unitholders will deliver the remaining 71,428,571 Class B Units of Continental Cement to Summit Holdings in exchange for a payment to be made by Summit Holdings in the amount of $35.0 million in cash and $15.0 million aggregate principal amount of non-interest bearing notes that will be payable in six aggregate annual installments beginning on the first anniversary of the closing of this offering, of $2.5 million. The number of shares of Class A common stock to be held by Summit Owner Holdco as a result of the foregoing transactions will represent pro forma ownership of 1.469496% of the outstanding LP Units of Summit Holdings immediately prior to giving effect to this offering. As a result of the foregoing transactions, Continental Cement will become a wholly-owned subsidiary of Summit Holdings. Based on aggregate LP Units outstanding after the reclassification of Summit Holdings and prior to giving effect to this offering, Summit Owner Holdco would receive shares of Class A common stock and shares of Class B common stock (representing all outstanding shares of Class B common stock at the time of the consummation of this offering). As of September 27, 2014, Continental Cement had total assets of $368.9 million and for the year ended December 28, 2013 and nine months ended September 27, 2014 generated net income of $9.9 million and $2.0 million, respectively. |
Incorporation of Summit Materials
Summit Materials, Inc. was incorporated as a Delaware corporation on September 23, 2014. Summit Materials, Inc. has not engaged in any business or other activities except in connection with its formation. The certificate of incorporation of Summit Materials authorizes two classes of common stock, Class A common stock and Class B common stock, each having the terms described in “Description of Capital Stock.”
Reclassification and Amendment and Restatement of Limited Partnership Agreement of Summit Materials Holdings L.P.
The capital structure of Summit Holdings currently consists of six different classes of limited partnership interests (Class A-1, Class A-2, Class B-1, Class C, Class D-1 and Class D-2), each of which has different amounts of aggregate distributions above which its holders would share in distributions. Prior to the completion of this offering, the limited partnership agreement of Summit Holdings will be amended and restated to, among other things, modify its capital structure by creating a single new class of units that we refer to as “LP Units.” We refer to this as the “Reclassification.” Immediately following the Reclassification but prior to the Offering Transactions described below, there will be LP Units issued and outstanding.
45
Table of Contents
Pursuant to the limited partnership agreement of Summit Holdings, Summit Materials, Inc. will be the sole general partner of Summit Holdings. Accordingly, Summit Materials, Inc. will have the right to determine when distributions will be made to the holders of LP Units and the amount of any such distributions. If Summit Materials, Inc., as sole general partner, authorizes a distribution, such distribution will be made to holders of LP Units pro rata in accordance with the percentages of their respective limited partnership interests.
The holders of LP Units, including Summit Materials, Inc., will incur U.S. federal, state and local income taxes on their proportionate share of any taxable income of Summit Holdings. Net profits and net losses of Summit Holdings will generally be allocated to its holders (including Summit Materials, Inc.) pro rata in accordance with the percentages of their respective limited partnership interests, except as otherwise required by law. The limited partnership agreement of Summit Holdings provides for cash distributions to the holders of the LP Units if Summit Materials, Inc. determines that the taxable income of Summit Holdings will give rise to taxable income for the holders of LP Units. In accordance with the limited partnership agreement, we intend to cause Summit Holdings to make pro rata cash distributions to the holders of LP Units for purposes of funding their tax obligations in respect of the income of Summit Holdings that is allocated to them. These distributions will only be paid to the extent that other distributions made by Summit Holdings were otherwise insufficient to cover the tax liabilities of holders of LP Units. Generally, these distributions will be computed based on our estimate of the net taxable income of Summit Holdings multiplied by an assumed tax rate equal to the highest effective marginal combined U.S. federal, state and local income tax rate applicable to an individual resident in New York, New York. See “Certain Relationships and Related Person Transactions—Summit Materials Holdings L.P. Amended and Restated Limited Partnership Agreement.”
Exchange Agreement
We and the holders of outstanding LP Units will enter into an exchange agreement at the time of this offering under which they (or certain of their permitted transferees) will have the right, from and after the first anniversary of the date of the completion of this offering (subject to the terms of the exchange agreement), to exchange their LP Units for shares of our Class A common stock on a one-for-one basis, subject to customary conversion rate adjustments for stock splits, stock dividends and reclassifications. The exchange agreement will also provide that a holder of LP Units will not have the right to exchange LP Units if Summit Materials, Inc. determines that such exchange would be prohibited by law or regulation or would violate other agreements with Summit Materials, Inc. or its subsidiaries to which the holder of LP Units may be subject. Summit Materials, Inc. may impose additional restrictions on exchange that it determines to be necessary or advisable so that Summit Holdings is not treated as a “publicly traded partnership” for U.S. federal income tax purposes. As a holder exchanges LP Units for shares of Class A common stock, the number of LP Units held by Summit Materials, Inc. is correspondingly increased as it acquires the exchanged LP Units. Notwithstanding the foregoing, Blackstone is generally permitted to exchange LP Units at any time. See “Certain Relationships and Related Person Transactions—Exchange Agreement.”
Offering Transactions
At the time of the consummation of this offering, Summit Materials, Inc. intends to purchase, for cash, newly-issued LP Units from Summit Holdings at a purchase price per unit equal to the initial public offering price per share of Class A common stock in this offering net of underwriting discounts. At the time of this offering, Summit Materials, Inc. will purchase from Summit Holdings newly-issued LP Units for an aggregate of $ million (or LP Units for an aggregate of $ million if the underwriters exercise in full their option to purchase additional shares of Class A common stock). The issuance and sale of such newly-issued LP Units by Summit Holdings to Summit Materials, Inc. will correspondingly dilute the ownership interests of our pre-IPO owners in Summit Holdings. Accordingly, following this offering Summit Materials, Inc. will hold a number of LP Units that is equal to the number of shares of Class A common stock that it has issued, as a result a single share of Class A common stock will represent (albeit indirectly) the same percentage equity interest in Summit Holdings as a single LP Unit.
46
Table of Contents
Holders of LP Units (other than Summit Materials, Inc.) may, subject to certain conditions and transfer restrictions applicable to such holders as set forth in the operating agreement of Summit Holdings (subject to the terms of the exchange agreement), exchange their LP Units for Class A common stock on a one-for-one basis. The exchanges are expected to result in increases in the tax basis of the tangible and intangible assets of Summit Holdings. These increases in tax basis may increase (for tax purposes) depreciation and amortization deductions and therefore reduce the amount of tax that Summit Materials, Inc. would otherwise be required to pay in the future, although the IRS may challenge all or part of that tax basis increase, and a court could sustain such a challenge. Prior to the completion of this offering, we will enter into a tax receivable agreement with the holders of LP Units that provides for the payment by Summit Materials, Inc. to exchanging holders of LP Units and certain other indirect pre-IPO owners of 85% of the benefits, if any, that Summit Materials, Inc. is deemed to realize as a result of (i) these increases in tax basis and (ii) our utilization of certain net operating losses of the Investor Entities and of certain other tax benefits related to our entering into the tax receivable agreement, including tax benefits attributable to payments under the tax receivable agreement. This payment obligation is an obligation of Summit Materials, Inc. and not of Summit Holdings See “Certain Relationships and Related Person Transactions—Tax Receivable Agreement.”
We refer to the foregoing transactions as the “Offering Transactions.”
As a result of the transactions described above:
| • | the investors in this offering will collectively own shares of our Class A common stock (or shares of Class A common stock if the underwriters exercise in full their option to purchase additional shares of Class A common stock) and Summit Materials, Inc. will hold LP Units (or LP Units if the underwriters exercise in full their option to purchase additional shares of Class A common stock); |
| • | our pre-IPO owners will hold LP Units; |
| • | the investors in this offering will collectively have % of the voting power in Summit Materials, Inc. (or % if the underwriters exercise in full their option to purchase additional shares of Class A common stock); and |
| • | Summit Owner Holdco, an entity owned by our pre-IPO owners and the Class B Unitholders of Continental Cement, will initially hold all of the shares of Class B common stock that will be outstanding upon consummation of this offering, and will have % of the voting power in Summit Materials, Inc. (or % if the underwriters exercise in full their option to purchase additional shares of Class A common stock). |
47
Table of Contents
We estimate that the net proceeds to Summit Materials, Inc. from this offering at an assumed initial public offering price of $ per share, which is the midpoint of the price range set forth on the cover page of this prospectus, after deducting estimated underwriting discounts and commissions, will be approximately $ million (or $ million if the underwriters exercise in full their option to purchase additional shares of Class A common stock). A $1.00 increase or decrease in the assumed initial public offering price of $ per share would increase or decrease, as applicable, the net proceeds to Summit Materials, Inc. from this offering by approximately $ million, assuming the number of shares offered by us remains the same as set forth on the cover page of this prospectus and after deducting the estimated underwriting discounts and commissions. Summit Holdings will bear or reimburse Summit Materials, Inc. for all of the expenses payable by it in this offering, which we estimate will be approximately $ million.
We intend to use all of the net proceeds from this offering (including from any exercise by the underwriters of their option to purchase additional shares of Class A common stock) to purchase a number of newly-issued LP Units from Summit Holdings that is equivalent to the number of shares of Class A common stock that we offer and sell in this offering, as described under “Organizational Structure—Offering Transactions.”
We intend to cause Summit Holdings to use these proceeds as follows: (i) to redeem $ million in aggregate principal amount of the senior notes at a redemption price of 110.5% pursuant to a provision in the indenture governing the senior notes that permits us to redeem up to 35% of the aggregate principal amount of the senior notes with the net cash proceeds of certain equity offerings, plus accrued interest; (ii) to redeem $ million in aggregate principal amount of the senior notes at a redemption price of 100%, plus accrued interest and an applicable premium thereon; (iii) to purchase 71,428,571 Class B Units of Continental Cement; (iv) to pay a one-time termination fee of $ million to an affiliate of Blackstone in connection with the termination of a transaction and management fee agreement; (v) to repay some or all of the then outstanding amounts under our senior secured credit facilities; and (vi) for general corporate purposes. As of September 27, 2014, $625.0 million aggregate principal amount of the senior notes was outstanding. The senior notes mature on January 31, 2020 and have an interest rate of 10.5% per annum. As of September 27, 2014, the applicable interest rate on our senior secured term loan facility, which matures on January 30, 2019, was 5.00%. As of September 27, 2014, the applicable interest rate on our senior secured revolving credit facility, which matures on January 30, 2017, was 4.13%. See “Description of Certain Indebtedness—Senior Notes,” “Description of Certain Indebtedness—Senior Secured Credit Facilities,” “Description of Certain Indebtedness—Senior Secured Credit Facilities—Interest Rate and Fees” and “Certain Relationships and Related Person Transactions—Transaction and Management Fee Agreement.”
Certain of the underwriters and their affiliates are lenders and/or agents under our senior secured credit facilities. As we intend to cause a portion of the proceeds to be used to repay some or all of the then outstanding amounts under such facilities, certain of the underwriters and/or their affiliates will receive their pro rata share of such repayment. See “Underwriting (Conflicts of Interest)—Relationships.”
48
Table of Contents
We have no current plans to pay dividends on our Class A common stock. The declaration, amount and payment of any future dividends on shares of Class A common stock will be at the sole discretion of our board of directors and we may reduce or discontinue entirely the payment of any such dividends at any time. Our board of directors may take into account general and economic conditions, our financial condition and operating results, our available cash and current and anticipated cash needs, capital requirements, contractual, legal, tax and regulatory restrictions and implications on the payment of dividends by us to our stockholders or by our subsidiaries to us, and such other factors as our board of directors may deem relevant.
Summit Materials, Inc. is a holding company and will have no material assets other than its ownership of LP Units in Summit Holdings. We intend to cause Summit Holdings to make distributions to us in an amount sufficient to cover cash dividends, if any, declared by us. If Summit Holdings makes such distributions to Summit Materials, Inc., the other holders of LP Units will also be entitled to receive distributions pro rata in accordance with the percentages of their respective limited partnership interests.
Our senior secured credit facilities and senior notes contain a number of covenants that restrict, subject to certain exceptions, Summit Materials, LLC’s ability to pay dividends to us. See “Description of Certain Indebtedness.”
Any financing arrangements that we enter into in the future may include restrictive covenants that limit our ability to pay dividends. In addition, Summit Holdings is generally prohibited under Delaware law from making a distribution to a limited partner to the extent that, at the time of the distribution, after giving effect to the distribution, liabilities of Summit Holdings (with certain exceptions) exceed the fair value of its assets. Subsidiaries of Summit Holdings are generally subject to similar legal limitations on their ability to make distributions to Summit Holdings.
Because Summit Materials, Inc. must pay taxes and make payments under the tax receivable agreement, any amounts ultimately distributed as dividends to holders of our Class A common stock are expected to be less than the amounts distributed by Summit Holdings to its partners on a per LP Unit basis.
49
Table of Contents
The following table sets forth our consolidated cash and capitalization as of September 27, 2014 for:
| • | Summit Materials Holdings L.P., on an unaudited historical basis; and |
| • | Summit Materials, Inc., on a pro forma basis to give effect to: |
| • | the sale by us of shares of Class A common stock in this offering, at an assumed initial public offering price of $ per share, which is the midpoint of the price range set forth on the cover page of this prospectus; |
| • | the application of net proceeds from this offering as described under “Use of Proceeds,” as if this offering and the application of the net proceeds of this offering had occurred on September 27, 2014; and |
| • | the other transactions described under “Unaudited Pro Forma Condensed Consolidated Financial Information.” |
The information below is illustrative only and our capitalization following this offering will be adjusted based on the actual initial public offering price and other terms of this offering determined at pricing. Cash is not a component of our total capitalization. You should read this table together with the information contained in this prospectus, including “Organizational Structure,” “Use of Proceeds,” “Unaudited Pro Forma Condensed Consolidated Financial Information,” “Management’s Discussion and Analysis of Financial Condition and Results of Operations” and the historical financial statements and related notes thereto included elsewhere in this prospectus.
| September 27, 2014 | ||||||||
| (in thousands, except shares and per share data) | Historical Summit Holdings |
Pro Forma Summit Materials, Inc. |
||||||
| Cash |
$ | 9,995 | $ | |||||
|
|
|
|
|
|||||
| Debt: |
||||||||
| Senior secured credit facilities(1) |
$ | 440,692 | $ | |||||
| Capital leases and other |
28,395 | |||||||
| 10 1⁄2% senior notes due 2020(2) |
625,000 | |||||||
|
|
|
|
|
|||||
| Total debt |
$ | 1,094,087 | $ | |||||
|
|
|
|
|
|||||
| Equity: |
||||||||
| Partners’ interest |
288,232 | |||||||
| Class A common stock, par value $0.01 per share; shares authorized, shares issued and outstanding, as adjusted |
— | |||||||
| Class B common stock, par value $0.01 per share; shares authorized, shares issued and outstanding, as adjusted |
— | |||||||
| Additional paid-in capital |
11,796 | |||||||
| Accumulated other comprehensive loss |
(7,236 | ) | ||||||
| Distributions in excess of accumulated loss |
— | |||||||
|
|
|
|
|
|||||
| Total stockholders’ equity(3) |
292,792 | |||||||
| Non controlling interests |
1,288 | |||||||
|
|
|
|
|
|||||
| Total equity |
294,080 | |||||||
|
|
|
|
|
|||||
| Total capitalization(3) |
$ | 1,388,167 | $ | |||||
|
|
|
|
|
|||||
| (1) | The senior secured credit facilities provide senior secured financing in an amount of $572.0 million, consisting of a $150.0 million five-year revolving credit facility and a $422.0 million seven-year term loan |
50
Table of Contents
| facility. See “Description of Certain Indebtedness—Senior Secured Credit Facilities.” Amount shown represents the principal amount of loans without giving effect to original issue discount. |
| (2) | Represents the aggregate principal amount of senior notes, without giving effect to original issuance discounts or premium to par or commissions to the initial purchasers. |
| (3) | To the extent we change the number of shares of Class A common stock sold by us in this offering from the shares we expect to sell or we change the initial public offering price from the $ per share assumed initial public offering price, representing the midpoint of the price range set forth on the cover page of this prospectus, or any combination of these events occurs, the net proceeds to us from this offering and each of total stockholders’ equity and total capitalization may increase or decrease. A $1.00 increase (decrease) in the assumed initial public offering price per share, assuming no change in the number of shares to be sold, would increase (decrease) the net proceeds that we receive in this offering and each of total stockholders’ equity and total capitalization by approximately $ million. An increase (decrease) of 1,000,000 shares in the expected number of shares to be sold in the offering, assuming no change in the assumed initial offering price per share, would increase (decrease) our net proceeds from this offering and our total stockholders’ equity and total capitalization by approximately $ million. If the underwriters’ option to purchase additional shares is exercised in full, the pro forma amount of each of cash, total cash, additional paid-in capital, total stockholders’ equity, total equity and total capitalization would increase by approximately $ million, after deducting underwriting discounts, and we would have shares of our Class A common stock issued and outstanding, as adjusted. |
51
Table of Contents
If you invest in shares of our Class A common stock, your investment will be immediately diluted to the extent of the difference between the initial public offering price per share of Class A common stock and the pro forma net tangible book value per share of Class A common stock after this offering. Dilution results from the fact that the per share offering price of the shares of Class A common stock is substantially in excess of the pro forma net tangible book value per share attributable to our pre-IPO owners.
Pro forma net tangible book value represents the amount of total tangible assets less total liabilities, and pro forma net tangible book value per share of Class A common stock represents pro forma net tangible book value divided by the number of shares of Class A common stock outstanding, after giving effect to the Offering Transactions and assuming that all of the holders of LP Units in Summit Holdings (other than Summit Materials, Inc.) exchanged their LP Units for newly-issued shares of Class A common stock on a one-for-one basis. Our pro forma net tangible book value as of September 27, 2014, was approximately $ million, or $ per share of Class A common stock.
After giving effect to the sale of shares of Class A common stock in this offering at the initial public offering price per share of $ and the other transactions described under “Organizational Structure” and “Unaudited Pro Forma Condensed Consolidated Financial Information” and assuming that all of the pre-IPO owners exchanged their LP Units for newly-issued shares of Class A common stock on a one-for-one basis, our pro forma as adjusted net tangible book value as of September 27, 2014, would have been $ million, or $ per share of Class A common stock. This represents an immediate increase in net tangible book value of $ per share of Class A common stock to our pre-IPO owners and an immediate dilution in net tangible book value of $ per share of Class A common stock to investors in this offering.
The following table illustrates this dilution on a per share of Class A common stock basis assuming the underwriters do not exercise their option to purchase additional shares of Class A common stock:
| Assumed initial public offering price per share of Class A common stock |
$ | |||||||
| Pro forma net tangible book value per share of Class A common stock as of September 27, 2014 |
$ | |||||||
| Increase in pro forma net tangible book value per share of Class A common stock attributable to the Offering Transactions |
$ | |||||||
|
|
|
|||||||
| Pro forma net tangible book value per share of Class A common stock as of September 27, 2014 after giving effect to this offering and the application of the net proceeds |
$ | |||||||
|
|
|
|||||||
| Dilution in pro forma net tangible book value per share of Class A common stock to investors in this offering |
$ | |||||||
|
|
|
The pro forma information discussed above is for illustrative purposes only. Our net tangible book value following the completion of the offering is subject to adjustment based on the actual offering price of our Class A common stock and other terms of this offering determined at pricing.
52
Table of Contents
The following table summarizes, on the same pro forma basis as of September 27, 2014, the total number of shares of Class A common stock purchased from us, the total cash consideration paid to us and the average price per share of Class A common stock paid by our pre-IPO owners, the Class B Unitholders and by new investors purchasing shares of Class A common stock in this offering, assuming that all of the pre-IPO owners exchanged their LP Units for newly-issued shares of Class A common stock on a one-for-one basis.
| Shares of Class A Common Stock Purchased |
Total Consideration |
Average Price per Share of Class A Common Stock |
||||||||||||||||
| Number | Percent | Amount | Percent | |||||||||||||||
| Pre-IPO owners |
% | $ | % | $ | ||||||||||||||
| Class B Unitholders |
% | $ | % | $ | ||||||||||||||
| Investors in this offering |
% | $ | % | $ | ||||||||||||||
|
|
|
|
|
|
|
|
|
|
||||||||||
| Total |
100.0 | % | $ | 100.0 | % | $ | ||||||||||||
|
|
|
|
|
|
|
|
|
|
||||||||||
If the underwriters’ option to purchase additional shares is exercised in full, (i) the number of shares of Class A common stock held by pre-IPO owners would be , or %, and the number of shares of Class A common stock held by new investors would increase to , or %, of the total number of shares of our Class A common stock outstanding after this offering, respectively, and (ii) the number of LP Units held by the pre-IPO owners would be , or % of the total number of LP Units outstanding after this offering.
53
Table of Contents
UNAUDITED PRO FORMA CONDENSED CONSOLIDATED FINANCIAL INFORMATION
The following unaudited pro forma condensed consolidated financial information has been derived by applying pro forma adjustments to our historical financial statements included elsewhere in this prospectus.
The pro forma adjustments are based on currently available information, accounting judgments and assumptions that we believe are reasonable. The unaudited pro forma condensed consolidated statements of operations and balance sheet are presented for illustrative purposes only and do not purport to represent our results of operations or balance sheet that would actually have occurred had the transactions referred to below been consummated on December 30, 2012 for the unaudited pro forma condensed consolidated statement of operations, as applicable, and on September 27, 2014 for the unaudited pro forma condensed consolidated balance sheet, or to project our results of operations or financial position for any future date or period. The adjustments are described in the notes to the unaudited pro forma condensed consolidated financial information.
The unaudited pro forma condensed consolidated balance sheet as of September 27, 2014 and the unaudited pro forma condensed consolidated statements of operations for the year ended December 28, 2013 and for the nine months ended September 27, 2014 are presented on a pro forma adjusted basis to give effect to the following items:
| • | the sale of shares of our Class A common stock by us in this offering at the initial public offering price of $ per share (the midpoint of the price range set forth on the cover of this prospectus), and the application of $ million of the net proceeds to redeem a portion of the outstanding senior notes and $ million of the net proceeds to repay a portion of the outstanding principal amount of loans under the senior secured credit facilities; and |
| • | the consummation of the Offering Transactions described in “Organizational Structure—Offering Transactions”. |
Following the Offering Transactions described in “Organizational Structure—Offering Transactions,” Summit Materials, Inc. will be subject to U.S. federal income taxes, in addition to state and local taxes with respect to its allocable share of any taxable income of Summit Holdings. As a result, the pro forma statement of income reflects an adjustment to our provision for income taxes to reflect an effective rate of %, which includes provisions for U.S. federal, state and local taxes assuming the highest statutory rate for each taxing jurisdiction.
The unaudited pro forma condensed consolidated financial information presented assumes no exercise by the underwriters of the option to purchase up to an additional shares of Class A common stock from us and that the shares of Class A common stock to be sold in this offering are sold at $ per share, which is the midpoint of the price range on the front cover of this prospectus.
As described in greater detail under “Certain Relationships and Related Person Transactions—Tax Receivable Agreement,” prior to the completion of this offering, we will enter into a tax receivable agreement with the holders of LP Units and certain other indirect pre-IPO owners that provides for the payment by Summit Materials, Inc. to exchanging holders of LP Units of 85% of the cash savings in income tax, if any, that Summit Materials, Inc. realizes as a result of (i) increases in tax basis described in “Certain Relationships and Related Person Transactions—Tax Receivable Agreement” and (ii) our utilization of certain net operating losses of the Investor Entities and certain other benefits related to entering into the tax receivable agreement, including tax benefits attributable to payments under the tax receivable agreement. No such exchanges or other tax benefits have been assumed in the unaudited pro forma financial information and therefore no pro forma adjustment is necessary.
Following the offering, we will incur costs associated with being a U.S. publicly traded company. Such costs will include new or increased expenses for such items as insurance, directors’ fees, accounting work, legal advice and compliance with applicable U.S. regulatory and stock exchange requirements, including costs
54
Table of Contents
associated with compliance with the Sarbanes-Oxley Act and periodic or current reporting obligations under the Securities Exchange Act of 1934, as amended (the “Exchange Act”). No pro forma adjustments have been made to reflect such costs due to the fact that they currently are not objectively determinable.
The unaudited pro forma condensed consolidated financial information is included for informational purposes only and does not purport to reflect our results of operations or financial condition that would have occurred had we operated as a public company during the periods presented. You should read this unaudited pro forma condensed consolidated financial information together with the other information contained in this prospectus, including “Organizational Structure,” “Management’s Discussion and Analysis of Financial Condition and Results of Operations” and our consolidated financial statements and the notes thereto.
55
Table of Contents
Summit Materials, Inc.
Unaudited Pro Forma Condensed Consolidated Balance Sheet
As of September 27, 2014
(in thousands, except per share data)
| Summit Holdings Historical |
Pro Forma Adjustments |
Summit Materials, Inc. Pro Forma |
||||||||||
| Assets | ||||||||||||
| Current assets: |
||||||||||||
| Cash |
$ | 9,995 | $ | $ | ||||||||
| Accounts receivable, net |
179,328 | |||||||||||
| Costs and estimated earnings in excess of billings |
26,542 | |||||||||||
| Inventories |
111,137 | |||||||||||
| Other current assets |
16,157 | (e) | ||||||||||
|
|
|
|
|
|
|
|||||||
| Total current assets |
343,159 | |||||||||||
| Property, plant and equipment, less accumulated depreciation, depletion and amortization |
946,980 | |||||||||||
| Goodwill |
390,338 | |||||||||||
| Intangible assets, less accumulated amortization |
18,026 | |||||||||||
| Other assets |
51,255 | (c) | ||||||||||
|
|
|
|
|
|
|
|||||||
| Total assets |
$ | 1,749,758 | $ | $ | ||||||||
|
|
|
|
|
|
|
|||||||
| Liabilities, Redeemable Noncontrolling Interest and Partners’ Interest |
||||||||||||
| Current liabilities: |
||||||||||||
| Current portion of debt |
$ | 28,187 | $ | (a) | $ | |||||||
| Current portion of acquisition-related liabilities |
20,571 | |||||||||||
| Accounts payable |
87,604 | |||||||||||
| Accrued expenses |
87,513 | |||||||||||
| Billings in excess of costs and estimated earnings |
9,533 | |||||||||||
|
|
|
|
|
|
|
|||||||
| Total current liabilities |
233,408 | |||||||||||
| Long-term debt |
1,062,921 | (a) | ||||||||||
| Acquisition-related liabilities |
41,287 | |||||||||||
| Other noncurrent liabilities |
86,242 | (e) | ||||||||||
|
|
|
|
|
|
|
|||||||
| Total liabilities |
1,423,858 | |||||||||||
|
|
|
|
|
|
|
|||||||
| Redeemable noncontrolling interest |
31,820 | |||||||||||
| Partners’ interests/stockholders’ equity: |
||||||||||||
| Partners’ interests |
518,156 | (b) | ||||||||||
| Accumulated deficit |
(218,128 | ) | (d) | |||||||||
| Accumulated other comprehensive loss |
(7,236 | ) | ||||||||||
|
|
|
|
|
|
|
|||||||
| Partners’ interests |
292,792 | |||||||||||
| Noncontrolling interest |
1,288 | |||||||||||
| Class A common stock, par value $0.01 per share |
— | (b) | ||||||||||
| Class B common stock, par value $0.01 per share |
— | (b) | ||||||||||
| Additional paid-in capital |
— | (b) | ||||||||||
|
|
|
|
|
|
|
|||||||
| Total equity |
294,080 | |||||||||||
|
|
|
|
|
|
|
|||||||
| Total liabilities, redeemable noncontrolling interest and partners’ interests/stockholders’ equity |
$1,749,758 | $ | — | $ | — | |||||||
|
|
|
|
|
|
|
|||||||
| (a) | Reflects the net effect on long-term debt of the receipt of net offering proceeds of $ million with the application of $ million of the net proceeds to redeem a portion of the outstanding senior notes and |
56
Table of Contents
| $ million of the net proceeds to repay a portion of the outstanding principal amount of loans under the senior secured credit facilities. Other accounts impacted in addition to long-term debt include accrued expenses of $ and additional paid-in capital of $ . |
| (b) | Represents an adjustment to stockholders’ equity reflecting (i) par value for Class A and Class B common stock to be outstanding following this offering, (ii) an increase of $ million of additional paid-in capital as a result of net proceeds from this offering, (iii) a decrease of $ million to allocate a portion of Summit Materials, Inc.’s equity to the noncontrolling interest and (iv) the elimination of partners’ capital of $518.2 million upon consolidation. |
| (c) | Represents a $ million write off of deferred financing fees as a result of the $ million redemption of the outstanding senior notes and $ million repayment of a portion of the outstanding principal amount of loans under the senior secured credit facilities. |
| (d) | To adjust accumulated deficit for the $ million of unamortized debt issuance costs related to the existing loans that do not have a continuing effect on us. |
| (e) | Summit Holdings has generated cumulative taxable losses since inception, however, because of Summit Holdings’ tax status as a partnership for U.S. federal, state and local income tax purposes the taxable losses have been allocated to and claimed by the pre-IPO owners. A portion of the cumulative taxable losses were created by deduction related to tax depreciation and amortization of tangible and intangible assets in excess of book depreciation and amortization. This excess depreciation and amortization is expected to reverse in future periods. Following the completion of this offering, Summit Materials, Inc. will be responsible for federal, state and local taxes for taxable income attributable to its share of the taxable income of Summit Holdings. As a result, upon completion of this offering, Summit Materials, Inc. will record a net deferred tax liability of approximately $ related to existing Summit Holdings book/tax differences, principally related to tax depreciation of tangible and intangible assets in excess of book depreciation and amortization, equal to Summit Materials, Inc.’s allocable share of such differences. The net deferred tax asset or (liability) is shown as an adjustment to additional paid-in capital. |
57
Table of Contents
Summit Materials, Inc.
Unaudited Pro Forma Condensed Consolidated Statement of Operations
Nine Months Ended September 27, 2014
(in thousands, except per share data)
| Summit Holdings Historical |
Pro Forma Adjustments |
Summit Materials, Inc. Pro Forma |
||||||||||
| Revenue |
$ | 870,145 | $ | $ | ||||||||
| Cost of revenue |
645,934 | |||||||||||
| General and administrative expenses |
105,872 | |||||||||||
| Depreciation, depletion, amortization and accretion |
63,950 | |||||||||||
| Transaction costs |
7,737 | |||||||||||
|
|
|
|
|
|
|
|||||||
| Operating income |
46,652 | |||||||||||
| Other income, net |
(2,299 | ) | ||||||||||
| Interest expense |
62,555 | (a) | ||||||||||
|
|
|
|
|
|
|
|||||||
| Loss from continuing operations before taxes |
(13,604 | ) | ||||||||||
| Income tax benefit |
(2,498 | ) | (d) | |||||||||
|
|
|
|
|
|
|
|||||||
| Net loss |
(11,106 | ) | ||||||||||
| Net loss attributable to noncontrolling interests |
— | (b) | ||||||||||
|
|
|
|
|
|
|
|||||||
| Net loss attributable to Summit Materials, Inc. |
$ | (11,106 | ) | $ | $ | |||||||
|
|
|
|
|
|
|
|||||||
| Weighted average shares of Class A common stock outstanding |
||||||||||||
| Basic |
— | (c) | ||||||||||
| Diluted |
— | (c) | ||||||||||
| Net income available to Class A common stock |
||||||||||||
| Basic |
— | (c) | ||||||||||
| Diluted |
— | (c) | ||||||||||
| Weighted average shares of Class B common stock outstanding |
||||||||||||
| Basic |
— | |||||||||||
| Diluted |
— | |||||||||||
| Net income available to Class B common stock |
||||||||||||
| Basic |
— | |||||||||||
| Diluted |
— | |||||||||||
| (a) | Reflects reduction in interest expense and related amortization of deferred financing fees and original issuance discount of $ million as a result of the $ million redemption of the outstanding senior notes and $ million repayment of a portion of the outstanding principal amount of loans under the senior secured credit facilities. |
| (b) | Reflects an adjustment to record the % noncontrolling interests, net of tax, that partners of Summit Holdings (other than Summit Materials, Inc.) own in Summit Holdings relating to their LP Units. After this offering, shares of Class A common stock will be outstanding and LP Units will be held by limited partners of Summit Holdings. |
| (c) | Reflects net income attributable to common shareholders divided by weighted average Class A common stock outstanding. |
58
Table of Contents
Basic and diluted weighted average Class A common stock outstanding is calculated as follows:
| Basic and Diluted | ||
| Issuance of shares of Class A common stock in connection with the |
||
| initial public offering |
||
| LP Units(1) |
||
| Weighted average shares of Class A common stock outstanding |
||
|
| ||
| Upon completion of the offering |
||
|
|
| (1) | LP Units may be exchanged for our Class A common stock on a one-for-one basis, subject to customary conversion rate adjustments for splits, unit distributions and reclassifications and compliance with applicable lock-up, vesting and transfer restrictions. If all LP Units were to be exchanged for Class A common stock immediately following the reorganization, fully diluted Class A common stock outstanding would be . In computing the dilutive effect, if any, that the aforementioned exchange would have on earnings per share, we consider that net income available to holders of Class A common stock would increase due to elimination of the noncontrolling interest in consolidated entities associated with the Summit Holdings LP Units (including any tax impact). For the nine months ended September 27, 2014, such exchange is not reflected in diluted earnings per share as the assumed exchange is not dilutive. |
| (d) | Following the Offering Transactions described in “Organizational Structure—Offering Transactions,” Summit Materials, Inc. will be subject to U.S. federal income taxes, in addition to state and local taxes with respect to its allocable share of any taxable income of Summit Holdings. As a result, the pro forma statement of income reflects an adjustment to our provision for income taxes to reflect an effective rate of %, which includes provisions for U.S. federal, state and local taxes assuming the highest statutory rate for each taxing jurisdiction. |
59
Table of Contents
Summit Materials, Inc.
Unaudited Pro Forma Condensed Consolidated Statement of Operations
Year Ended December 28, 2013
(in thousands, except per share data)
| Summit Holdings Historical |
Pro Forma Adjustments |
Summit Materials, Inc. Pro Forma |
||||||||||
| Revenue |
$ | 916,201 | $ | $ | ||||||||
| Cost of revenue |
677,052 | |||||||||||
| General and administrative expenses |
142,000 | |||||||||||
| Goodwill impairment |
68,202 | |||||||||||
| Depreciation, depletion, amortization and accretion |
72,934 | |||||||||||
| Transaction costs |
3,990 | |||||||||||
|
|
|
|
|
|
|
|||||||
| Operating loss |
(47,977 | ) | ||||||||||
| Other income, net |
(1,737 | ) | ||||||||||
| Loss on debt financings |
3,115 | (a) | ||||||||||
| Interest expense |
56,443 | (a) | ||||||||||
|
|
|
|
|
|
|
|||||||
| Loss from continuing operations before taxes |
(105,798 | ) | ||||||||||
| Income tax benefit |
(2,647 | ) | (d) | |||||||||
|
|
|
|
|
|
|
|||||||
| Net loss |
(103,151 | ) | ||||||||||
| Loss attributable to noncontrolling interests |
— | (b) | ||||||||||
|
|
|
|
|
|
|
|||||||
| Net loss attributable to Summit Materials |
$ | (103,151 | ) | $ | $ | |||||||
|
|
|
|
|
|
|
|||||||
| Weighted average shares of Class A common stock outstanding |
||||||||||||
| Basic |
— | (c) | ||||||||||
| Diluted |
— | (c) | ||||||||||
| Net income available to Class A common stock |
||||||||||||
| Basic |
— | (c) | ||||||||||
| Diluted |
— | (c) | ||||||||||
| Weighted average shares of Class B common stock outstanding |
||||||||||||
| Basic |
— | |||||||||||
| Diluted |
— | |||||||||||
| Net income available to Class B common stock |
||||||||||||
| Basic |
— | |||||||||||
| Diluted |
— | |||||||||||
| (a) | Reflects the net reduction in interest expense and related amortization of deferred financing fees and original issuance discount and a loss on debt financing of $ million and $ million, respectively, as a result of the $ million redemption of the outstanding senior notes and $ million repayment of a portion of the outstanding principal amount of loans under the senior secured credit facilities. Other accounts impacted in addition to long-term debt include accrued expenses of $ and additional paid-in capital of $ . |
| (b) | Reflects an adjustment to record the % noncontrolling interests, net of tax, that partners of Summit Holdings (other than Summit Materials, Inc.) own in Summit Holdings relating to their LP Units. After this offering, shares of Class A common stock will be outstanding and LP Units will be held by limited partners of Summit Holdings. |
| (c) | Reflects net income attributable to common shareholders divided by weighted average Class A common stock outstanding. |
60
Table of Contents
Basic and diluted weighted average Class A common stock outstanding is calculated as follows:
| Basic and Diluted | ||
| Issuance of shares of Class A common stock in connection with the |
||
| initial public offering |
||
| LP Units(1) |
||
| Weighted average shares of Class A common stock outstanding |
||
|
| ||
| Upon completion of the offering |
||
|
|
| (1) | LP Units may be exchanged for our Class A common stock on a one-for-one basis, subject to customary conversion rate adjustments for splits, unit distributions and reclassifications and compliance with applicable lock-up, vesting and transfer restrictions. If all LP Units were to be exchanged for Class A common stock immediately following the reorganization, fully diluted Class A common stock outstanding would be . In computing the dilutive effect, if any, that the aforementioned exchange would have on earnings per share, we consider that net income available to holders of Class A common stock would increase due to elimination of the noncontrolling interest in consolidated entities associated with the Summit Holdings LP Units (including any tax impact). For the nine months ended September 27, 2014, such exchange is not reflected in diluted earnings per share as the assumed exchange is not dilutive. |
| (d) | Following the Offering Transactions described in “Organizational Structure—Offering Transactions,” Summit Materials, Inc. will be subject to U.S. federal income taxes, in addition to state and local taxes with respect to its allocable share of any taxable income of Summit Holdings. As a result, the pro forma statement of income reflects an adjustment to our provision for income taxes to reflect an effective rate of %, which includes provisions for U.S. federal, state and local taxes assuming the highest statutory rate for each taxing jurisdiction. |
61
Table of Contents
SELECTED HISTORICAL CONSOLIDATED FINANCIAL DATA
The following selected historical consolidated financial data of Summit Holdings should be read together with “Organizational Structure,” “Unaudited Pro Forma Condensed Consolidated Financial Information,” “Selected Historical Consolidated Financial Data,” “Management’s Discussion and Analysis of Financial Condition and Results of Operations” and the historical financial statements and related notes thereto included elsewhere in this prospectus. Summit Holdings, which commenced operations on August 26, 2009, will be considered our predecessor for accounting purposes, and its consolidated financial statements will be our historical financial statements following this offering. Under U.S. GAAP, Summit Holdings is expected to meet the definition of a variable interest entity.
The selected successor statements of operations data for the three years ended December 28, 2013, December 29, 2012 and December 31, 2011 and the selected balance sheet data as of December 28, 2013 and December 29, 2012 are derived from the audited consolidated financial statements of Summit Holdings included elsewhere in this prospectus. The selected successor balance sheet data as of December 31, 2011 are derived from the audited consolidated financial statements of Summit Holdings not included in this prospectus. The selected statements of operations data for the year ended December 31, 2010 and for the period from August 26, 2009 to December 31, 2009 and the selected balance sheet data as of December 31, 2010 and December 31, 2009 are derived from the unaudited consolidated financial statements of Summit Holdings not included in this prospectus.
The selected historical consolidated financial data as of September 27, 2014 and for the nine months ended September 27, 2014 and September 28, 2013 were derived from the unaudited consolidated financial statements of Summit Holdings included elsewhere in this prospectus. We have prepared our unaudited consolidated financial statements on the same basis as our audited consolidated financial statements and, in our opinion, have included all adjustments, which include normal recurring adjustments, necessary to present fairly in all material respects our financial position and results of operations. The results for any interim period are not necessarily indicative of the results that may be expected for the full year. Additionally, our historical results are not necessarily indicative of the results expected for any future period.
In 2011, we adopted a fiscal year based on a 52-53 week year with each quarter composed of 13 weeks ending on a Saturday.
62
Table of Contents
You should read the following information together with the more detailed information contained in “Management’s Discussion and Analysis of Financial Condition and Results of Operations” and the consolidated financial statements and the accompanying notes appearing elsewhere in this prospectus.
| (in thousands) | Nine Months Ended September 27, 2014 |
Nine Months Ended September 28, 2013 |
Year Ended December 28, 2013 |
Year Ended December 29, 2012 |
Year Ended December 31, 2011 |
Year Ended December 31, 2010 |
Period from August 26, 2009 to December 31, 2009 |
|||||||||||||||||||||
| Statement of Operations Data: |
||||||||||||||||||||||||||||
| Total revenue |
$ | 870,145 | $ | 677,934 | $ | 916,201 | $ | 926,254 | $ | 789,076 | $ | 405,297 | $ | 29,348 | ||||||||||||||
| Total cost of revenue (excluding items shown separately below) |
645,934 | 503,198 | 677,052 | 713,346 | 597,654 | 284,336 | 21,582 | |||||||||||||||||||||
| General and administrative expenses |
105,877 | 107,219 | 142,000 | 127,215 | 95,826 | 48,557 | 4,210 | |||||||||||||||||||||
| Goodwill impairment |
— | — | 68,202 | — | — | — | — | |||||||||||||||||||||
| Depreciation, depletion, amortization and accretion |
63,950 | 54,577 | 72,934 | 68,290 | 61,377 | 33,870 | 3,148 | |||||||||||||||||||||
| Transaction costs |
7,737 | 3,175 | 3,990 | 1,988 | 9,120 | 22,268 | 4,682 | |||||||||||||||||||||
|
|
|
|
|
|
|
|
|
|
|
|
|
|
|
|||||||||||||||
| Operating (loss) income |
46,652 | 9,765 | (47,977) | 15,415 | 25,099 | 16,266 | (4,274) | |||||||||||||||||||||
| Other (income) expense, net |
(2,299) | (988) | (1,737) | (1,182) | (21,244) | 1,583 | 192 | |||||||||||||||||||||
| Loss on debt financings |
— | 3,115 | 3,115 | 9,469 | — | 9,975 | — | |||||||||||||||||||||
| Interest expense |
62,555 | 42,380 | 56,443 | 58,079 | 47,784 | 25,430 | 574 | |||||||||||||||||||||
|
|
|
|
|
|
|
|
|
|
|
|
|
|
|
|||||||||||||||
| Loss from continuing operations before taxes |
(13,604) | (34,742) | (105,798) | (50,951) | (1,441) | (20,722) | (5,040) | |||||||||||||||||||||
| Income tax (benefit) expense |
(2,498) | (1,782) | (2,647) | (3,920) | 3,408 | 2,363 | 216 | |||||||||||||||||||||
|
|
|
|
|
|
|
|
|
|
|
|
|
|
|
|||||||||||||||
| Loss from continuing operations |
$ | (11,106) | $ | (32,960) | $ | (103,151) | $ | (47,031) | $ | (4,849) | $ | (23,085) | $ | (5,256) | ||||||||||||||
|
|
|
|
|
|
|
|
|
|
|
|
|
|
|
|||||||||||||||
| Cash Flow Data: |
||||||||||||||||||||||||||||
| Net cash (used for) provided by: |
||||||||||||||||||||||||||||
| Operating activities |
$ | (10,836) | $ | 123 | $ | 66,412 | $ | 62,279 | $ | 23,253 | $ | (20,529) | $ | 3,897 | ||||||||||||||
| Investing activities |
(405,853) | (105,930) | (111,515) | (85,340) | (192,331) | (500,854) | (48,914) | |||||||||||||||||||||
| Financing activities |
408,501 | 97,583 | 32,589 | 7,702 | 146,775 | 578,855 | 55,896 | |||||||||||||||||||||
| Balance Sheet Data (as of period end): |
||||||||||||||||||||||||||||
| Cash |
$ | 9,995 | $ | 18,183 | $ | 30,697 | $ | 46,056 | $ | 68,359 | $ | 10,877 | ||||||||||||||||
| Total assets |
1,749,758 | 1,251,060 | 1,284,479 | 1,287,531 | 1,104,847 | 113,048 | ||||||||||||||||||||||
| Total debt (including current portion of long-term debt) |
1,091,108 | 688,987 | 639,843 | 608,981 | 559,980 | 28,750 | ||||||||||||||||||||||
| Capital leases |
28,395 | 8,026 | 3,092 | 3,158 | 3,217 | — | ||||||||||||||||||||||
| Total partners’ interest |
294,080 | 286,817 | 385,694 | 439,638 | 349,259 | 37,700 | ||||||||||||||||||||||
| Redeemable noncontrolling interests |
31,820 | 24,767 | 22,850 | 21,300 | 21,300 | — | ||||||||||||||||||||||
| Other Financial Data (as of period end): |
||||||||||||||||||||||||||||
| Total hard assets(1) |
$ | 1,058,117 | $ | 928,210 | $ | 906,584 | $ | 906,166 | $ | 775,457 | $ | 92,309 | ||||||||||||||||
| (1) | Defined as the sum of (a) net property, plant and equipment and (b) inventories. |
63
Table of Contents
MANAGEMENT’S DISCUSSION AND ANALYSIS OF FINANCIAL CONDITION AND RESULTS OF OPERATIONS
You should read the following discussion of our results of operations and financial condition with the “Selected Historical Consolidated Financial Data” section of this prospectus and our audited and unaudited consolidated financial statements and the related notes thereto included elsewhere in this prospectus. This discussion contains forward-looking statements and involves numerous risks and uncertainties, including, but not limited to, those described in the “Risk Factors” section of this prospectus. Our actual results may differ materially from those contained in any forward-looking statements.
The historical consolidated financial information discussed below reflects the historical results of operations and financial position of Summit Holdings and its subsidiaries. The historical consolidated financial information discussed below does not give effect to this offering or the Offering Transactions. See “Organizational Structure” and “Unaudited Pro Forma Condensed Consolidated Financial Information” included elsewhere in this prospectus.
Overview
We are one of the fastest growing heavy-side construction materials companies in the United States, with a 126% increase in revenue between the year ended December 31, 2010 and the year ended December 28, 2013, as compared to an average increase of approximately 17% in revenue reported by our competitors over the same period. Our materials include aggregates, which we supply across the country, with a focus on Texas, Kansas, Kentucky, Missouri and Utah, and cement, which we supply primarily in Missouri, Iowa and Illinois. Within our markets, we offer customers a single-source provider for heavy-side construction materials and related downstream products through our vertical integration. In addition to supplying aggregates to customers, we use our materials internally to produce ready-mixed concrete and asphalt paving mix, which may be sold externally or used in our paving and related services businesses. Our vertical integration creates opportunities to increase aggregates volumes and optimize margin at each stage of production and enables us to provide customers with efficiency gains, convenience and reliability, which we believe gives us a competitive advantage.
Since our first acquisition five years ago, we have received equity commitments of $798.1 million, of which $467.5 million has been deployed. Through the deployed equity and debt financings, we have completed 34 acquisitions, which are organized into eleven operating companies that make up our three distinct operating segments—West, Central and East regions—spanning 17 U.S. states and Vancouver, Canada and 27 metropolitan statistical areas. We believe each of our operating companies has a top three market share position in its local market area achieved through their respective, extensive operating history, averaging over 35 years. Our highly experienced management team, led by our President and Chief Executive Officer, Tom Hill, a 30-year industry veteran, has successfully enhanced the operations of acquired companies by focusing on scale advantages, cost efficiencies and pricing discipline to improve profitability and cash flow.
64
Table of Contents
Our proven and probable aggregates reserves were 2.1 billion tons and 1.6 billion tons as of September 27, 2014 and December 28, 2013, respectively. From time to time, in connection with certain acquisitions, we engage a third party engineering firm to perform an aggregates reserves audit, but we do not perform annual reserve audits. By segment, our estimate of proven and probable reserves for which we have permits for extraction and that we consider to be recoverable aggregates of suitable quality for economic extraction, including the underground mine that was substantially completed in 2014 to support our cement plant, are shown in the table below along with average annual production.
| Aggregate producing sites |
Tonnage of reserves for each general type of aggregate |
Annual production(1) |
Average years until depletion at current production |
Percent of reserves owned and percent leased |
||||||||||||||||||||||||
| Segment |
Hard rock(1) | Sand and gravel(1) |
Owned | Leased(2) | ||||||||||||||||||||||||
| West |
48 | 334,566 | 349,880 | 19,683 | 35 | 34 | % | 66 | % | |||||||||||||||||||
| Central |
61 | 888,441 | 53,442 | 5,632 | 167 | 68 | % | 32 | % | |||||||||||||||||||
| East |
24 | 460,273 | 7,216 | 4,878 | 96 | 39 | % | 61 | % | |||||||||||||||||||
|
|
|
|
|
|
|
|
|
|||||||||||||||||||||
| Total |
133 | 1,683,280 | 410,538 | 30,193 | ||||||||||||||||||||||||
|
|
|
|
|
|
|
|
|
|||||||||||||||||||||
| (1) | Hard rock, sand and gravel and annual production tons are shown in thousands. |
| (2) | Lease terms range from monthly to on-going with an average lease expiry of 2020. |
We operate in 17 U.S. states and Vancouver, Canada, and we currently have assets in 15 states and Vancouver, Canada across our three geographic regions. The map below illustrates our geographic footprint:
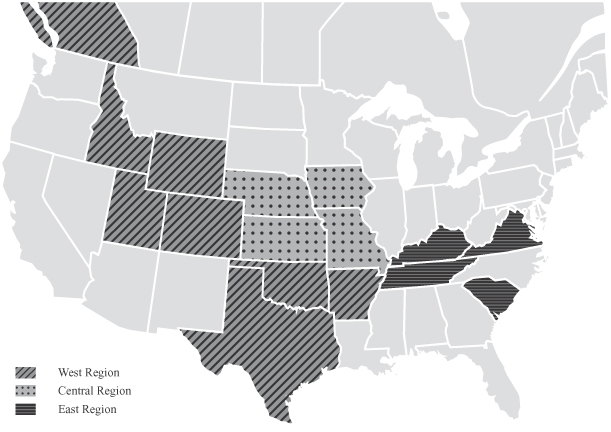
For the nine months ended September 27, 2014 and the year ended December 28, 2013, approximately 53% and 42%, respectively, of our revenue related to residential and nonresidential construction and approximately
65
Table of Contents
47% and 58%, respectively, related to public infrastructure projects. In general, our aggregates, asphalt paving mix and paving businesses are weighted towards public infrastructure projects. Our cement and ready-mixed concrete businesses serve both the private construction and public infrastructure markets.
Private construction includes both residential and nonresidential new construction and the repair and remodel markets. From a macroeconomic view, we see positive indicators for the construction sector, including upward trends in housing starts and construction employment and highway obligations. All of these factors should result in increased construction activity in the private sector. However, we do not expect this recovery to be consistent across the United States. Certain markets, such as Texas, are showing greater, more rapid signs of recovery than other markets.
Public infrastructure includes spending by federal, state and local governments for roads, highways, bridges, airports and other public infrastructure projects. Public infrastructure projects have historically been a relatively stable portion of state and federal budgets. Our acquisitions to date have been primarily focused in states with constitutionally-protected transportation funding sources, which we believe limits our exposure to state and local budgetary uncertainties. Funding for the existing federal transportation funding program, MAP-21, expired on September 30, 2014, and any additional funding or successor programs have yet to be approved. We also continue to monitor the status of the Highway Trust Fund. On August 1, 2014, a Highway Trust Fund extension bill was enacted. The bill provides approximately $10.8 billion of funding, which is expected to last until May 2015. With the nation’s infrastructure aging, we expect U.S. infrastructure spending to grow over the long term, and we believe we are well positioned to capitalize on any such increase.
Business Trends and Conditions
The U.S. heavy-side construction materials industry is composed of four primary sectors: aggregates; cement; ready-mixed concrete; and asphalt paving mix. Each of these materials is widely used in most forms of construction activity. Competition is limited in part by the distance materials can be transported efficiently, resulting in predominantly local or regional operations. Participants in these sectors typically range from small, privately-held companies focused on a single material, product or market to multinational companies that offer a wide array of paving and related materials, products and construction services. We estimate that approximately 65% of the aggregates in the United States are held by private companies.
Our revenue is derived from multiple end-use markets including private residential and nonresidential construction, as well as public infrastructure construction. Residential and nonresidential construction consists of new construction and repair and remodel markets. The construction sectors in the local economies in which we operate have begun to show signs of recovery. However, we could still be affected by any economic stagnation or decline, which could vary by local region and market. Our sales and earnings are sensitive to national, regional and local economic conditions and particularly to cyclical changes in construction spending, especially in the private sector. From a macroeconomic view, we see positive indicators for the construction sector, including upward trends in housing starts, construction employment and highway obligations. All of these factors should result in increased construction activity in the private sector. However, we do not expect this recovery to be consistent across the United States. Certain markets, such as Texas, are showing greater, more rapid signs of recovery. Increased construction activity in the private sector could lead to increased public infrastructure spending in the relatively near future. Public infrastructure includes spending by federal, state and local governments for roads, highways, bridges, airports and other infrastructure projects. Public infrastructure projects have historically been a relatively stable portion of state and federal budgets. Our acquisitions to date have been primarily focused in states with constitutionally-protected transportation funding sources, which we believe limits our exposure to state and local budgetary uncertainties.
Transportation infrastructure projects, driven by both federal and state funding programs, represent a significant share of the U.S. heavy-side construction materials market. Funding for MAP-21 expired on September 30, 2014, and any additional funding or successor programs have yet to be approved. We also continue to monitor the status of the Highway Trust Fund. On August 1, 2014, a Highway Trust Fund extension bill was enacted. The bill provides approximately $10.8 billion of funding, which is expected to last until May
66
Table of Contents
2015. With the nation’s infrastructure aging, we expect U.S. infrastructure spending to grow over the long term, and we believe we are well positioned to capitalize on any such increase.
In addition to federal funding, highway construction and maintenance funding is also available through state, county and local agencies. Our five largest states by revenue (Texas, Kansas, Kentucky, Missouri and Utah, which represented approximately 25%, 20%, 17%, 12% and 11%, respectively, of our total revenue in 2013) each have funds whose revenue sources are constitutionally protected and are dedicated for transportation projects.
| • | Texas Department of Transportation’s budget from 2014 to 2016 is $25.3 billion. |
| • | Kansas has a 10-year $8.2 billion highway bill that was passed in May 2010. |
| • | Kentucky’s biennial highway construction plan has funding of $3.6 billion from July 2014 to June 2016. |
| • | Missouri has an estimated $0.7 billion in annual construction funding committed to essential road and bridge programs through 2017. |
| • | Utah’s transportation investment fund has $3.5 billion committed through 2018. |
Within many of our markets, state and local governments have taken actions to maintain or grow highway funding during a time of uncertainty with respect to federal funding. For example:
| • | The Texas legislature recently passed the largest two-year budget in the history of the Texas Department of Transportation (with growth in both new construction and maintenance). In addition, increased energy sector activity in parts of Texas has driven an increase in private construction demand, which we expect to continue. In particular, Austin and Houston, Texas have seen rapid residential demand expansion, which we expect to provide a stimulus for nonresidential and public infrastructure demand, as job growth has drawn new residents. On November 4, 2014, voters in Texas passed a proposition that is expected to provide between $1.2 billion and $1.7 billion of incremental funding annually to the Texas Department of Transportation. The funds must be used for construction, maintenance, rehabilitation and acquiring right-of-way for public roads. |
| • | Increases in heavy truck registration fees, dedicated sales tax revenue and bond issuances have enabled Kansas to maintain stability in public infrastructure spending. |
| • | We believe that public infrastructure spending in Kentucky, which comprises the majority of our revenue in the state, will remain consistent in the upcoming years. |
| • | We expect primarily maintenance-related public demand in Missouri and Utah, both of which have recently completed large spending programs. |
The table below sets forth additional details regarding the five states our operations focus on, including growth rates as compared to comparable U.S. growth rates:
|
|
Revenue by End Market (1)(2) | Projected Industry Growth by End Market 2013 to 2018(3) |
||||||||||||||||||||||
| Percentage of Our Total Revenue(1) |
Residential and Nonresidential Construction |
Public Infrastructure Construction |
Residential Construction |
Nonresidential Construction |
Public Infrastructure Construction |
|||||||||||||||||||
| State |
||||||||||||||||||||||||
| Texas |
35 | % | 61 | % | 39 | % | 8.9 | % | 6.8 | % | 6.1 | % | ||||||||||||
| Kansas |
18 | % | 41 | % | 59 | % | 11.6 | % | 5.8 | % | 3.4 | % | ||||||||||||
| Kentucky |
12 | % | 11 | % | 89 | % | 12.2 | % | 5.7 | % | 7.2 | % | ||||||||||||
| Utah |
10 | % | 84 | % | 16 | % | 7.5 | % | 6.0 | % | 5.8 | % | ||||||||||||
| Missouri |
10 | % | 72 | % | 28 | % | 10.9 | % | 5.8 | % | 2.8 | % | ||||||||||||
|
|
|
|
|
|
|
|||||||||||||||||||
| Weighted average(4) |
10.0 | % | 6.2 | % | 5.3 | % | ||||||||||||||||||
| United States(3) |
9.1 | % | 5.2 | % | 4.5 | % | ||||||||||||||||||
| (1) | Percentages based on our revenue for the nine months ended September 27, 2014. |
67
Table of Contents
| (2) | Percentages based on our revenue by state the nine months ended September 27, 2014 and management’s estimates as to end markets. |
| (3) | Source: FMI Management Consulting. |
| (4) | Calculated using weighted average based on each state’s percentage contribution to our total revenue. |
In addition to being subject to cyclical changes in the economy, our business is seasonal in nature. Substantially all of our products and services are produced, consumed and performed outdoors. Severe weather, seasonal changes and other weather-related conditions can significantly affect the production and sales volumes of our products. Typically, the highest sales and earnings are in the second and third quarters, and the lowest are in the first and fourth quarters. Winter weather months are generally periods of lower sales as we, and our customers, generally cannot cost-effectively mobilize and demobilize equipment and manpower under adverse weather conditions. Periods of heavy rainfall also adversely affect our work patterns and demand for our products. Our working capital may vary greatly during peak periods, but generally returns to average levels as our operating cycle is completed each fiscal year.
We are subject to commodity price risk with respect to price changes in liquid asphalt and energy, including fossil fuels and electricity for aggregates, cement, ready-mixed concrete and asphalt paving mix production, natural gas for hot mix asphalt production and diesel fuel for distribution vehicles and production related mobile equipment. Liquid asphalt escalator provisions in most of our private and commercial contracts limit our exposure to price fluctuations in this commodity. We often obtain similar escalators on public infrastructure contracts. In addition, we enter into various firm purchase commitments, with terms generally less than one year, for certain raw materials. As a result of the contract escalation clauses and effective use of the firm purchase commitments, commodity prices did not have a material effect on our results of operations in the nine months ended September 27, 2014 as compared to the nine months ended September 28, 2013 or in 2013, as compared to 2012.
Our acquisition strategy requires capital contributions or debt financings. As of September 27, 2014 and December 28, 2013, our long-term borrowings, including the current portion, totaled $1,041.7 million and $695.9 million, respectively, and we incurred $62.6 million and $56.4 million of interest expense in the nine months ended September 27, 2014 and the year ended December 28, 2013, respectively. Although the amounts borrowed and related interest expense are relatively material to us, we have been in compliance with our debt covenants and have made all required principal and interest payments. In addition, our cash flows provided by operating activities were $66.4 million and $62.3 million in the years ended December 28, 2013 and December 29, 2012, respectively, which is net of interest payments. Our senior secured revolving credit facility provides us with up to $150.0 million of borrowings, which has been adequate to fund our seasonal working capital needs and certain acquisitions. As of September 27, 2014, our outstanding borrowings under our senior secured revolving credit facility were $24.0 million. When we have made additional issuances of senior notes to fund acquisitions, we have complied with the incurrence tests in the indenture governing our senior notes. To the extent that a portion of the net proceeds from the offering described herein is used to pay down debt, our interest payments will correspondingly decrease, which will further increase our cash flow provided by operating activities and amounts available for operations and acquisitions.
Financial Highlights—Nine Months Ended September 27, 2014
The principal factors in evaluating our financial condition and operating results for the nine months ended September 27, 2014, as compared to the nine months ended September 28, 2013, are:
| • | Revenue increased $192.2 million in the nine months ended September 27, 2014 as a result of pricing and volume increases across our product lines, which includes volume contributions from acquisitions. |
| • | Our operating earnings improved $36.9 million in the nine months ended September 27, 2014. This improvement in earnings was largely driven by price increases in aggregates, cement and asphalt and volume increases in aggregates, ready-mixed concrete and asphalt. |
68
Table of Contents
| • | In 2014, we increased our long-term debt by $375.0 million with the issuance of additional 10 1⁄2% senior notes due 2020. |
Financial Highlights—Year Ended December 28, 2013
The principal factors in evaluating our financial condition and operating results for the year ended December 28, 2013, as compared to the year ended December 29, 2012, are:
| • | Product revenue increased $4.8 million in 2013 as a result of pricing increases across our product lines, somewhat offset by declines in cement and asphalt volumes. In 2013, we increased our focus on higher-margin, low-volume paving projects, which resulted in increased operating margin, which we define as operating income as a percentage of revenue, but a decrease in asphalt volumes. The following table presents volume and average selling price changes by product: |
| Volume in 2013 Compared to 2012 |
Average Selling Prices in 2013 Compared to 2012 |
|||||||
| Aggregate |
5 | % | 7 | % | ||||
| Cement |
(4 | %) | 3 | % | ||||
| Ready-mixed concrete |
9 | % | 4 | % | ||||
| Asphalt |
(14 | %) | 5 | % | ||||
| • | Service revenue declined $14.9 million in 2013 as a result of the increased focus on higher-margin, lower-volume projects. |
| • | Our operating earnings declined $63.4 million to a loss of $48.0 million in 2013 from income of $15.4 million in 2012. In 2013, we recognized goodwill impairment charges of $68.2 million as a result of uncertainties in the timing of a sustained recovery in the Utah and Kentucky construction markets. |
| • | Our operating earnings improved $4.8 million in 2013 excluding the $68.2 million goodwill impairment recognized in 2013. This improvement in earnings was predominantly driven by the price increases discussed above and higher margins on our paving and related services businesses in 2013. |
| • | Cash provided by operations improved to $66.4 million in 2013, compared to $62.3 million in 2012, as a result of the increase in operating earnings (excluding the goodwill impairment). |
Acquisitions
In addition to our organic growth, we continued to grow our business through acquisitions in 2014 and 2013, completing the following transactions:
| • | On October 3, 2014, we purchased Concrete Supply, which included 10 ready-mixed concrete plants and two sand and gravel sites in Topeka and northeast Kansas, and a ready-mixed concrete plant in western Missouri. |
| • | On September 30, 2014, we acquired all of the outstanding ownership interests in Colorado County Sand & Gravel Co., L.L.C., a Texas limited liability company, M & M Gravel Sales, Inc., a Texas corporation, Marek Materials Co. Operating, Ltd., a Texas limited partnership, and Marek Materials Co., L.L.C., a Texas limited liability company, which collectively supply aggregates to the west Houston, Texas markets. |
| • | On September 19, 2014, we acquired all of the membership interests of Southwest Ready Mix, LLC, which included two ready-mixed concrete plants and serves the downtown and southwest Houston, Texas markets. |
| • | On September 4, 2014, we acquired all of the issued and outstanding shares and certain shareholder notes of Rock Head Holdings Ltd. and B.I.M. Holdings Ltd., which collectively indirectly own all the shares of Mainland Sand and Gravel Ltd., a supplier of construction aggregates to the Vancouver metropolitan area based in Surrey, British Columbia. |
69
Table of Contents
| • | On July 29, 2014, we acquired all of the assets of Canyon Redi-Mix, Inc., and CRM Mixers LP. The acquired assets include two ready-mixed concrete plants, which serve the Permian Basin region of West Texas. |
| • | On June 9, 2014, we acquired all of the membership interests of Buckhorn Materials, LLC, an aggregates quarry in South Carolina, and Construction Materials Group LLC, a sand pit in South Carolina. |
| • | On March 31, 2014, we acquired all of the stock of Troy Vines, Incorporated, an integrated aggregates and ready-mixed concrete business headquartered in Midland, Texas, which serves the Permian Basin region of West Texas. |
| • | On January 17, 2014, we acquired certain aggregates and ready-mixed concrete assets of Alleyton in Houston, Texas, which expands our presence in the Texas market. |
| • | On April 1, 2013, we acquired certain aggregates, ready-mixed concrete and asphalt assets of Lafarge in and around Wichita, Kansas, which expanded our footprint in the Wichita market across our lines of business. |
| • | On April 1, 2013, we acquired the membership interests of Westroc in Utah. The Westroc acquisition expanded our market coverage for aggregates and ready-mixed concrete in Utah. |
Components of Operating Results
Total Revenue
We derive our revenue predominantly by selling heavy-side construction materials and products and providing paving and related services. Heavy-side construction materials consist of aggregates and cement. Products consist of related downstream products, including ready-mixed concrete, asphalt paying mix and concrete products. Paving and related services that we provide are primarily asphalt paving and related services.
Revenue derived from construction materials sales are recognized when risks associated with ownership have passed to unaffiliated customers. Typically this occurs when products are shipped. Product revenue generally includes sales of aggregates, cement and related downstream products and other materials to customers, net of discounts or allowances and taxes, if any.
Revenue derived from paving and related services are recognized on the percentage-of-completion basis, measured by the cost incurred to date compared to estimated total cost of each project. This method is used because management considers cost incurred to be the best available measure of progress on these contracts. Due to the inherent uncertainties in estimating costs, it is at least reasonably possible that the estimates used will change over the life of the contract.
Operating Costs and Expenses
The key components of our operating costs and expenses consist of the following:
Cost of Revenue (excluding items shown separately)
Cost of revenue consists of all production and delivery costs and primarily includes labor, repair and maintenance, utilities, raw materials, fuel, transportation, subcontractor costs and manufacturing overhead. Our cost of revenue is directly affected by fluctuations in commodity energy prices, primarily diesel fuel, liquid asphalt and other petroleum-based resources. As a result, our operating profit margins can be significantly affected by changes in the underlying cost of certain raw materials if they are not recovered through corresponding changes in revenue. We attempt to limit our exposure to changes in commodity energy prices by entering into forward purchase commitments when appropriate. In addition, we have sales price adjustment
70
Table of Contents
provisions that provide for adjustments based on fluctuations outside a limited range in certain energy-related production costs. These provisions are in place for most of our public infrastructure contracts, and we aggressively seek to include similar price adjustment provisions in our private contracts.
Goodwill Impairment
Goodwill impairment charges consist of the amount by which the carrying value of a reporting unit exceeds its fair value, as determined in an annual two-step impairment test. See “—Critical Accounting Policies—Goodwill and Goodwill Impairment.”
General and Administrative Expenses
General and administrative expenses consist primarily of salaries and personnel costs for our sales and marketing, administration, finance and accounting, legal, information systems and human resources employees. Additional expenses include audit, consulting and professional fees, travel, insurance and other corporate expenses.
Transaction Costs
Transaction costs consist primarily of third party accounting, legal, valuation and financial advisory fees incurred in connection with acquisitions.
Depreciation, Depletion, Amortization and Accretion
Our business is capital intensive. We carry property, plant and equipment on our balance sheet at cost, net of applicable depreciation, depletion and amortization. Depreciation on property, plant and equipment is computed on a straight-line basis or based on the economic usage over the estimated useful life of the asset. The general range of depreciable lives by category, excluding mineral reserves, which are depleted based on the units of production method on a site-by-site basis, is as follows:
| Buildings and improvements |
7 - 40 years | |||
| Plant, machinery and equipment |
3 - 40 years | |||
| Truck and auto fleet |
3 - 10 years | |||
| Mobile equipment and barges |
3 - 20 years | |||
| Landfill airspace and improvements |
5 - 60 years | |||
| Other |
2 - 10 years |
Amortization expense is the periodic expense related to leasehold improvements and intangible assets, which were primarily acquired with certain acquisitions. The intangible assets are generally amortized on a straight-line basis over the estimated useful lives of the assets. Leasehold improvements are amortized over the lesser of the life of the underlying asset or the remaining lease term.
Accretion expense is the periodic expense recorded for the accrued mining reclamation liabilities and landfill closure and post-closure liabilities using the effective interest method.
Results of Operations
The following discussion of our results of operations is focused on the key financial measures we use to evaluate the performance of our business from both a consolidated and operating segment perspective. Operating income and margins are discussed in terms of changes in volume, pricing and mix of revenue source (i.e., type of product sales or service revenue). We focus on operating margin, which we define as operating income as a percentage of revenue, as a key metric when assessing the performance of the business, as we believe that analyzing changes in costs in relation to changes in revenue provides more meaningful insight into the results of operations than examining costs in isolation.
71
Table of Contents
Operating income reflects our profit from continuing operations after taking into consideration cost of revenue, general and administrative expenses, depreciation, depletion, amortization and accretion and transaction costs. Cost of revenue generally increases ratably with revenue, as labor, transportation costs and subcontractor costs are recorded in cost of revenue. General and administrative costs as a percentage of revenue vary throughout the year due to the seasonality of our business. Considering the percentage of our historic growth that was derived from acquisitions and our focus on infrastructure development (finance, information technology, legal and human resources), annual general and administrative costs historically grew ratably with revenue. However, we expect the growth in general and administrative costs to stabilize in fiscal 2014 and beyond. Also as a result of our revenue growth occurring primarily through acquisitions, depreciation, depletion, amortization and accretion have generally grown ratably with revenue. As volumes increase, we expect these costs, as a percentage of revenue, to decrease. Our transaction costs fluctuate with the number and size of acquisitions consummated each year.
The table below includes revenue and operating income (loss) by segment for the periods indicated. Operating income (loss) by segment is computed as earnings before interest, taxes and other income / expense.
| Nine months ended | Year ended | |||||||||||||||||||||||||||||||||||||||
| September 27, 2014 | September 28, 2013 | December 28, 2013 | December 29, 2012 | December 31, 2011 | ||||||||||||||||||||||||||||||||||||
| (in thousands) | Total Revenue |
Operating income (loss) |
Total Revenue |
Operating income (loss) |
Total Revenue |
Operating income (loss) |
Total Revenue |
Operating income (loss) |
Total Revenue |
Operating income (loss) |
||||||||||||||||||||||||||||||
| West |
$ | 478,432 | $ | 47,658 | $ | 322,640 | $ | 2,312 | $ | 426,195 | $ | (47,476 | ) | $ | 484,922 | $ | (6,625 | ) | $ | 362,577 | $ | (455 | ) | |||||||||||||||||
| Central |
283,541 | 30,433 | 244,207 | 25,093 | 329,621 | 39,246 | 302,113 | 37,560 | 264,008 | 38,105 | ||||||||||||||||||||||||||||||
| East |
108,172 | (1,925 | ) | 111,087 | 669 | 160,385 | (14,207 | ) | 139,219 | (245 | ) | 162,491 | 2,687 | |||||||||||||||||||||||||||
| Corporate(1) |
— | (29,514 | ) | — | (18,309 | ) | — | (25,540 | ) | — | (15,275 | ) | — | (15,238 | ) | |||||||||||||||||||||||||
|
|
|
|
|
|
|
|
|
|
|
|
|
|
|
|
|
|
|
|
|
|||||||||||||||||||||
| Total |
$ | 870,145 | $ | 46,652 | $ | 677,934 | $ | 9,765 | $ | 916,201 | $ | (47,977 | ) | $ | 926,254 | $ | 15,415 | $ | 789,076 | $ | 25,099 | |||||||||||||||||||
|
|
|
|
|
|
|
|
|
|
|
|
|
|
|
|
|
|
|
|
|
|||||||||||||||||||||
| (1) | Corporate results primarily consist of compensation and office expenses for employees included in our headquarters. The increase in cost is primarily attributable to the strengthening of our infrastructure with respect to finance, information technology, legal and human resources functions and relocation of the headquarters to Denver, Colorado in August 2013. |
Non-U.S. GAAP Performance Measures
We evaluate our operating performance using a metric that we refer to as “Adjusted EBITDA” which is not defined by U.S. GAAP and should not be considered as an alternative to earnings measures defined by U.S. GAAP. We define Adjusted EBITDA as net loss before interest expense, income tax expense, depreciation, depletion and amortization, accretion, goodwill impairment and (income) loss from discontinued operations. We present this metric for the convenience of investment professionals who use such metrics in their analyses. The investment community often uses this metric as an indicator of a company’s ability to incur and service debt, to assess the operating performance of a company’s business and to provide a more consistent comparison of performance from period to period. We use Adjusted EBITDA, among other metrics, to assess the operating performance of our individual segments and the consolidated company. In addition, we use a metric we refer to as “Further Adjusted EBITDA,” which we define as Adjusted EBITDA plus certain non-cash or non-operating items and the EBITDA contribution of certain recent acquisitions, to measure our compliance with debt covenants and to evaluate flexibility under certain restrictive covenants. See “—Liquidity and Capital Resources—Our Long-Term Debt” on pages 95 and 96 for more information.
Adjusted EBITDA is used for certain items to provide a more consistent comparison of performance from period to period. We do not use these metrics as a measure to allocate resources. In addition, non-U.S. GAAP financial measures are not standardized; therefore, it may not be possible to compare such financial measures with other companies’ non-U.S. GAAP financial measures having the same or similar names. We strongly encourage investors to review our consolidated interim and audited financial statements in their entirety and not rely on any single financial measure.
72
Table of Contents
The tables below reconcile our net loss to Adjusted EBITDA and present Adjusted EBITDA by segment for the periods indicated:
| Nine months ended | Year ended | |||||||||||||||||||
| September 27, 2014 |
September 28, 2013 |
December 28, 2013 |
December 29, 2012 |
December 31, 2011 |
||||||||||||||||
| Reconciliation of Net Loss to Adjusted EBITDA |
||||||||||||||||||||
| (in thousands) |
||||||||||||||||||||
| Net loss |
$ | (10,750 | ) | $ | (33,217 | ) | $ | (103,679 | ) | $ | (50,577 | ) | $ | (10,050 | ) | |||||
| Income tax (benefit) expense |
(2,498 | ) | (1,782 | ) | (2,647 | ) | (3,920 | ) | 3,408 | |||||||||||
| Interest expense |
62,555 | 42,380 | 56,443 | 58,079 | 47,784 | |||||||||||||||
| Depreciation, depletion and amortization |
63,302 | 54,040 | 72,217 | 67,665 | 60,687 | |||||||||||||||
| Accretion |
648 | 537 | 717 | 625 | 690 | |||||||||||||||
| Goodwill impairment |
— | — | 68,202 | — | — | |||||||||||||||
| (Income) loss from discontinued operations |
(356 | ) | 257 | 528 | 3,546 | 5,201 | ||||||||||||||
|
|
|
|
|
|
|
|
|
|
|
|||||||||||
| Adjusted EBITDA |
$ | 112,901 | $ | 62,215 | $ | 91,781 | $ | 75,418 | $ | 107,720 | ||||||||||
|
|
|
|
|
|
|
|
|
|
|
|||||||||||
| Adjusted EBITDA by Segment |
||||||||||||||||||||
| (in thousands) |
||||||||||||||||||||
| West |
$ | 71,646 | $ | 19,260 | $ | 28,607 | $ | 14,429 | $ | 36,442 | ||||||||||
| Central |
59,220 | 49,892 | 72,918 | 65,767 | 65,651 | |||||||||||||||
| East |
10,462 | 10,790 | 15,134 | 10,782 | 15,504 | |||||||||||||||
| Corporate(1) |
(28,427 | ) | (17,727 | ) | (24,878 | ) | (15,560 | ) | (9,877 | ) | ||||||||||
|
|
|
|
|
|
|
|
|
|
|
|||||||||||
| Adjusted EBITDA |
$ | 112,901 | $ | 62,215 | $ | 91,781 | $ | 75,418 | $ | 107,720 | ||||||||||
|
|
|
|
|
|
|
|
|
|
|
|||||||||||
| (1) | The decrease in Corporate EBITDA in the nine months ended September 27, 2014 is due to a $3.4 million increase in transaction fees from the increase in 2014 acquisitions, a $3.3 million increase in monitoring fees paid to our Sponsors, which are based on a percentage of earnings and were allocated as a regional expense in 2013, and an increase in labor costs from the infrastructure development in the prior year. |
73
Table of Contents
Consolidated Results of Operations
The table below sets forth our consolidated results of operations for the periods indicated:
| Nine months ended | Year ended | |||||||||||||||||||
| (in thousands) | September 27, 2014 |
September 28, 2013 |
December 28, 2013 |
December 29, 2012 |
December 31, 2011 |
|||||||||||||||
| Total revenue |
$ | 870,145 | $ | 677,934 | $ | 916,201 | $ | 926,254 | $ | 789,076 | ||||||||||
| Total cost of revenue (excluding items shown separately below) |
645,934 | 503,198 | 677,052 | 713,346 | 597,654 | |||||||||||||||
| General and administrative expenses |
105,872 | 107,219 | 142,000 | 127,215 | 95,826 | |||||||||||||||
| Goodwill impairment |
— | — | 68,202 | — | — | |||||||||||||||
| Depreciation, depletion, amortization and accretion |
63,950 | 54,577 | 72,934 | 68,290 | 61,377 | |||||||||||||||
| Transaction costs |
7,737 | 3,175 | 3,990 | 1,988 | 9,120 | |||||||||||||||
|
|
|
|
|
|
|
|
|
|
|
|||||||||||
| Operating (loss) income |
46,652 | 9,765 | (47,977 | ) | 15,415 | 25,099 | ||||||||||||||
| Other income, net |
(2,299 | ) | (988 | ) | (1,737 | ) | (1,182 | ) | (21,244 | ) | ||||||||||
| Loss on debt financings |
— | 3,115 | 3,115 | 9,469 | — | |||||||||||||||
| Interest expense |
62,555 | 42,380 | 56,443 | 58,079 | 47,784 | |||||||||||||||
|
|
|
|
|
|
|
|
|
|
|
|||||||||||
| Loss from continuing operations before taxes |
(13,604 | ) | (34,742 | ) | (105,798 | ) | (50,951 | ) | (1,441 | ) | ||||||||||
| Income tax (benefit) expense |
(2,498 | ) | (1,782 | ) | (2,647 | ) | (3,920 | ) | 3,408 | |||||||||||
|
|
|
|
|
|
|
|
|
|
|
|||||||||||
| Loss from continuing operations |
(11,106 | ) | (32,960 | ) | (103,151 | ) | (47,031 | ) | (4,849 | ) | ||||||||||
| (Income) loss from discontinued operations |
(356 | ) | 257 | 528 | 3,546 | 5,201 | ||||||||||||||
|
|
|
|
|
|
|
|
|
|
|
|||||||||||
| Net loss |
(10,750 | ) | (33,217 | ) | (103,679 | ) | (50,577 | ) | (10,050 | ) | ||||||||||
| Net income attributable to noncontrolling interest |
674 | 1,105 | 3,112 | 1,919 | 695 | |||||||||||||||
|
|
|
|
|
|
|
|
|
|
|
|||||||||||
| Net loss attributable to partners of Summit Holdings. |
$ | (11,424 | ) | $ | (34,322 | ) | $ | (106,791 | ) | $ | (52,496 | ) | $ | (10,745 | ) | |||||
|
|
|
|
|
|
|
|
|
|
|
|||||||||||
Nine months ended September 27, 2014 compared to the nine months ended September 28, 2013
| Nine months ended | Variance | |||||||||||
| ($ in thousands) | September 27, 2014 |
September 28, 2013 |
||||||||||
| Revenue |
$ | 870,145 | $ | 677,934 | 28.4 | % | ||||||
| Operating income |
46,652 | 9,765 | 377.7 | % | ||||||||
| Operating margin |
5.4 | % | 1.4 | % | ||||||||
| Adjusted EBITDA |
$ | 112,901 | $ | 62,215 | 81.5 | % | ||||||
Revenue increased $192.2 million in the nine months ended September 27, 2014, of which $128.7 million resulted from acquisitions and $63.5 million was organic growth.
Of the total $192.2 million revenue increase, $147.5 million was attributable to increased product revenue and $44.7 million was attributable to increased service revenue, which is primarily paving and related services, but also includes certain other revenues earned. Revenue that was not derived from acquisitions during the period or the prior year period (“organic revenue”) increased 9.4% in the nine months ended September 27, 2014. Detail of consolidated percent changes in sales volumes and pricing in the nine months ended September 27, 2014 from the nine months ended September 28, 2013 were as follows:
| Percentage Change in | ||||||||
| Volume | Pricing | |||||||
| Aggregates |
35.1 | % | 2.0 | % | ||||
| Cement |
2.1 | % | 8.5 | % | ||||
| Ready-mixed concrete |
122.9 | % | 3.2 | % | ||||
| Asphalt |
8.7 | % | (0.8 | )% | ||||
74
Table of Contents
Aggregates and ready-mixed concrete volumes were positively affected by the 2014 and 2013 acquisitions. However, the increase in ready-mixed concrete pricing was constrained by different pricing structures in our new markets. The majority of the increase in volumes occurred in Texas, where we have lower average selling prices than we have in our operations outside of Texas. Our cement volumes increased 2.1% due primarily to a shift in customer mix. Cement pricing improved from an overall market increase and from the customer mix shift. Asphalt volume increased 8.7%, while average asphalt pricing declined 0.8%, primarily as a result of product mix despite an increase in underlying prices. Asphalt product mix in 2014 included a higher percentage of base materials, which typically is the lowest priced of our asphalt products.
Revenue for paving and related services increased by $47.1 million, primarily as a result of increased demand for our services in Utah, Texas and Kansas.
As a vertically-integrated company, we include intercompany sales from materials to products and from products to services when assessing the operating results of our business. These intercompany transactions are eliminated in the consolidated financial statements. Prior to eliminations, the revenue change by product/service was as follows:
| Nine months ended | ||||||||||||
| (in thousands) | September 27, 2014 |
September 28, 2013 |
Variance | |||||||||
| Revenue by product:* |
||||||||||||
| Aggregates |
$ | 160,362 | $ | 119,757 | $ | 40,605 | ||||||
| Cement |
66,116 | 59,160 | 6,956 | |||||||||
| Ready-mixed concrete |
189,198 | 82,447 | 106,751 | |||||||||
| Asphalt |
203,944 | 162,485 | 41,459 | |||||||||
| Paving and related services |
390,469 | 343,346 | 47,123 | |||||||||
| Other |
(139,944 | ) | (89,261 | ) | (50,683 | ) | ||||||
|
|
|
|
|
|
|
|||||||
| Total revenue |
$ | 870,145 | $ | 677,934 | $ | 192,211 | ||||||
|
|
|
|
|
|
|
|||||||
| * | Revenue by product includes intracompany sales transferred at market value. The elimination of intracompany transactions is included in Other. |
In the nine months ended September 27, 2014, operating income increased $36.9 million and Adjusted EBITDA increased $50.7 million as a result of increased revenue and a 400 basis point increase in operating margin. The increase in operating margin was primarily attributable to the following:
| Operating margin - September 28, 2013 |
1.4 | % | ||
| General and administrative costs (“G&A”) reduction(1) |
3.6 | % | ||
| Depreciation, depletion, amortization and accretion(2) |
0.8 | % | ||
| 2014 curtailment benefit(3) |
0.1 | % | ||
| 2013 charge to remove barge from waterway(4) |
0.2 | % | ||
| Transaction costs(5) |
(0.5 | )% | ||
| Other |
(0.2 | )% | ||
|
|
|
|||
| Operating margin - September 27, 2014 |
5.4 | % | ||
|
|
|
| (1) | G&A, as a percentage of revenue, declined from 15.8% to 12.2% in the nine months ended September 27, 2014. During 2013, we invested in our infrastructure (finance, information technology, legal and human resources) and expect the decline in G&A, as a percentage of revenue, to stabilize in 2014 and beyond. |
| (2) | The reduction in depreciation, depletion, amortization and accretion, as a percentage of revenue, contributed a 0.8% increase in operating margin in the nine months ended September 27, 2014. Increased investments in |
75
Table of Contents
| depreciable assets through either capital expenditures or business acquisitions generally increase depreciation expense, while assets being fully depreciated or disposed generally decrease depreciation expense. In the nine months ended September 27, 2014, approximately 67% of our revenue growth was attributable to acquisitions, which exceeded the percentage increase in depreciation expense recognized from the acquisitions. As a result, depreciation, depletion, amortization and accretion, as a percentage of revenue, decreased from the nine months ended September 28, 2013 despite an overall increase in depreciable assets. |
| (3) | A $1.3 million curtailment benefit recognized in the nine months ended September 27, 2014 related to a retiree postretirement benefit plan maintained for certain union employees at our cement plant, which was amended to eliminate all future retiree health and life coverage for the remaining union employees, effective January 1, 2014. |
| (4) | A $1.8 million charge was recognized in the nine months ended September 28, 2013 to remove a sunken barge from the Mississippi River. No charges for the barge removal were recognized in 2014. |
| (5) | Partially offsetting these profit improvements were $4.5 million of increased transaction costs in the nine months ended September 27, 2014, as a result of the six acquisitions made in 2014. |
In addition to the items discussed above, approximately $3.1 million of the improvement in Adjusted EBITDA was attributable to the loss on debt financings recognized in the nine months ended September 28, 2013 related to the February 2013 debt repricing.
Other Financial Information
Loss on debt financings
In February 2013, we completed a repricing of our credit facilities, which provide for term loans in an aggregate amount of $422.0 million and revolving credit commitments in an aggregate amount of $150.0 million. The repricing reduced our stated term-loan interest rate by 1.0% and provided additional borrowing capacity of $25.0 million. As a result of the repricing, we recognized a loss of $3.1 million for related bank fees in 2013. Fees associated with the $375.0 million of 10 ½% senior notes issued in 2014 were deferred in other non-current assets and are being amortized over the term of the debt as a charge to interest expense.
Interest expense
Interest expense increased $20.2 million in the nine months ended September 27, 2014 from the comparable period in 2013, due to the additional $375.0 million of 10 ½% senior notes issued in 2014, which were outstanding for a weighted average of 6.1 months during the nine months ended September 27, 2014.
Segment results of operations
West Region
| Nine months ended | Variance | |||||||||||
| ($ in thousands) |
September 27, 2014 |
September 28, 2013 |
||||||||||
| Revenue |
$ | 478,432 | $ | 322,640 | 48.3 | % | ||||||
| Operating income |
47,658 | 2,312 | 1,961.3 | % | ||||||||
| Operating margin |
10.0 | % | 0.7 | % | ||||||||
| Adjusted EBITDA |
$ | 71,646 | $ | 19,260 | 272.0 | % | ||||||
Revenue in the West region increased $155.8 million, or 48%, in the nine months ended September 27, 2014, of which $121.2 million resulted from acquisitions and $34.6 million was organic growth.
76
Table of Contents
Of the total $155.8 million revenue increase, $130.1 million was attributable to product revenue and $25.7 million was attributable to increased service revenue, which is primarily paving and related services, but also includes certain other revenues earned. Organic revenue increased 10.7% in the nine months ended September 27, 2014.
In the nine months ended September 27, 2014, the West region’s aggregates, ready-mixed concrete and asphalt volumes increased and aggregates pricing improved. Ready-mixed concrete pricing declined as a result of the 2014 acquisitions in Texas, as ready-mixed concrete prices in the Texas markets are generally lower than in our markets outside of Texas. Average asphalt pricing declined primarily as a result of product mix, with 2014 volumes including a higher percentage of low-priced base materials, although prices grew. The West region’s percent changes in sales volumes and pricing in the nine months ended September 27, 2014 from the nine months ended September 28, 2013 were as follows:
| Percentage Change in | ||||||||
| Volume | Pricing | |||||||
| Aggregates |
99.0 | % | 5.3 | % | ||||
| Ready-mixed concrete |
230.6 | % | (0.1 | )% | ||||
| Asphalt |
5.9 | % | (1.0 | )% | ||||
Revenue for paving and related services increased by $26.6 million primarily as a result of increased demand for our services in Texas and Utah. Total revenue in Texas and in our Utah-based operations, which includes Idaho, Wyoming and Colorado, increased 73% and 20%, respectively, in the nine months ended September 27, 2014.
As a vertically-integrated company, we include intercompany sales from materials to products and from products to services when assessing the operating results of our business. These intercompany transactions are eliminated in the consolidated financial statements. Prior to eliminations, the revenue change by product/service was as follows:
| Nine months ended | ||||||||||||
| (in thousands) | September 27, 2014 |
September 28, 2013 |
Variance | |||||||||
| Revenue by product:* |
||||||||||||
| Aggregates |
$ | 69,184 | $ | 34,266 | $ | 34,918 | ||||||
| Ready-mixed concrete |
148,444 | 45,142 | 103,302 | |||||||||
| Asphalt |
125,988 | 109,212 | 16,776 | |||||||||
| Paving and related services |
220,304 | 193,660 | 26,644 | |||||||||
| Other |
(85,488 | ) | (59,640 | ) | (25,848 | ) | ||||||
|
|
|
|
|
|
|
|||||||
| Total revenue |
$ | 478,432 | $ | 322,640 | $ | 155,792 | ||||||
|
|
|
|
|
|
|
|||||||
| * | Revenue by product includes intracompany sales transferred at market value. The elimination of intracompany transactions is included in Other. |
77
Table of Contents
In the nine months ended September 27, 2014, the West region’s operating income increased $45.3 million and Adjusted EBITDA increased $52.4 million as a result of increased revenue and an increase in operating margins from 0.7% to 10.0%. The profit improvement was primarily driven by the 2014 acquisitions in the Houston and Midland/Odessa, Texas markets, which contributed $26.3 million of operating income in the nine months ended September 27, 2014, higher aggregates pricing and organic volume growth. The increase in operating margin was primarily attributable to the following:
| Operating margin - September 28, 2013 |
0.7 | % | ||
| G&A reduction(1) |
5.5 | % | ||
| Depreciation, depletion, amortization and accretion(2) |
0.8 | % | ||
| Other(3) |
3.0 | % | ||
|
|
|
|||
| Operating margin - September 27, 2014 |
10.0 | % | ||
|
|
|
| (1) | G&A, as a percentage of revenue, declined from 14.9% to 9.4% in the nine months ended September 27, 2014. The improvement in G&A, as a percentage of revenue, was partially attributable to a $8.8 million decrease at our Utah-based operations from a headcount reduction of 36 employees, which was 20% of the Utah operations’ G&A headcount, and a $4.4 million loss on the disposition of certain assets in Colorado that was recognized in the nine months ended September 28, 2013. |
| (2) | The reduction in depreciation, depletion, amortization and accretion, as a percentage of revenue, contributed a 0.8% increase in operating margin in the nine months ended September 27, 2014. In the nine months ended September 27, 2014, approximately 78% of the West region’s revenue growth was attributable to acquisitions, which exceeded the percentage increase in depreciation expense recognized from the acquisitions. As a result, depreciation, depletion, amortization and accretion, as a percentage of revenue, decreased from the nine months ended September 28, 2013 despite an overall increase in depreciable assets. |
| (3) | The 2014 acquisitions, which were aggregates and ready-mixed concrete businesses, shifted the West region’s product mix significantly from the lower margin services operations to sales of products and materials, which contributed to the increase in operating margin from the nine months ended September 28, 2013. Revenue from paving and related services was 60.0% of the West region’s revenue in the nine months ended September 28, 2013 compared to 46.0% in the nine months ended September 27, 2014. Aggregates and ready-mixed concrete were 14.5% and 31.0%, respectively, of revenue in the nine months ended September 27, 2014 compared to 10.6% and 14.0%, respectively, in the nine months ended September 28, 2013. |
In addition to the items discussed above, approximately $1.6 million of the improvement in Adjusted EBITDA was attributable to the loss on debt financings allocated to the West region in the nine months ended September 28, 2013 related to the February 2013 debt repricing.
Central Region
| Nine months ended | ||||||||||||
| ($ in thousands) | September 27, 2014 |
September 28, 2013 |
Variance | |||||||||
| Revenue |
$ | 283,541 | $ | 244,207 | 16.1 | % | ||||||
| Operating income |
30,433 | 25,093 | 21.3 | % | ||||||||
| Operating margin |
10.7 | % | 10.3 | % | ||||||||
| Adjusted EBITDA |
$ | 59,220 | $ | 49,892 | 18.7 | % | ||||||
Revenue in the Central region increased $39.3 million, or 16.1%, in the nine months ended September 27, 2014, of which $4.9 million resulted from acquisitions and $34.4 million was organic growth.
Of the total $39.3 million revenue increase, $21.1 million was attributable to increased product revenue and $18.2 million was attributable to increased service revenue, which is primarily paving and related services, but also includes certain other revenues earned. Organic revenue increased 7.0% in the nine months ended September 27, 2014.
78
Table of Contents
In the nine months ended September 27, 2014, volumes increased among all of the Central region’s product lines. The increase in aggregates and asphalt volumes are due to strong, primarily organic, demand in our Kansas markets. Cement volumes increased 2.1% and prices increased 8.5% due to overall price improvements and a shift in customer mix. Cement sales in 2014 included a greater percentage of low volume, or retail, sales, which generally are sold at a higher price than sales to high-volume customers. Customer mix varies each year based on demand in the applicable markets. Overall, product pricing increased, while average asphalt pricing declined despite an increase in underlying prices, due to a change in product mix to lower-priced products.
The Central region’s percent changes in sales volumes and pricing in the nine months ended September 27, 2014 from the nine months ended September 28, 2013 were as follows:
| Percentage Change in | ||||||||
| Volume | Pricing | |||||||
| Aggregates |
8.2 | % | 5.5 | % | ||||
| Cement |
2.1 | % | 8.5 | % | ||||
| Ready-mixed concrete |
1.4 | % | 7.7 | % | ||||
| Asphalt |
40.0 | % | (2.3 | )% | ||||
Revenue for paving and related services increased by $20.6 million primarily as a result of increased demand for our services in Kansas.
As a vertically-integrated company, we include intercompany sales from materials to products and from products to services when assessing the operating results of our business. These intercompany transactions are eliminated in the consolidated financial statements. Prior to eliminations, the revenue change by product/service was as follows:
| Nine months ended | ||||||||||||
| (in thousands) | September 27, 2014 |
September 28, 2013 |
Variance | |||||||||
| Revenue by product:* |
||||||||||||
| Aggregates |
$ | 60,535 | $ | 54,453 | $ | 6,082 | ||||||
| Cement |
66,116 | 59,160 | 6,956 | |||||||||
| Ready-mixed concrete |
40,754 | 37,305 | 3,449 | |||||||||
| Asphalt |
26,989 | 18,845 | 8,144 | |||||||||
| Paving and related services |
93,670 | 73,072 | 20,598 | |||||||||
| Other |
(4,523 | ) | 1,372 | (5,895 | ) | |||||||
|
|
|
|
|
|
|
|||||||
| Total revenue |
$ | 283,541 | $ | 244,207 | $ | 39,334 | ||||||
|
|
|
|
|
|
|
|||||||
| * | Revenue by product includes intracompany sales transferred at market value. The elimination of intracompany transactions is included in Other. |
In the nine months ended September 27, 2014, the Central region’s operating income increased $5.3 million and Adjusted EBITDA increased $9.3 million as a result of increased revenue and a 40 basis point increase in operating margins. The increase in operating margin was primarily attributable to the following:
| Operating margin - September 28, 2013 |
10.3 | % | ||
| 2014 curtailment benefit(1) |
0.5 | % | ||
| 2013 charge to remove barge from waterway(2). |
0.6 | % | ||
| 2014 inventory impairment charge(3). |
(0.3 | )% | ||
| Other |
(0.4 | )% | ||
|
|
|
|||
| Operating margin - September 27, 2014 |
10.7 | % | ||
|
|
|
79
Table of Contents
| (1) | A $1.3 million curtailment benefit was recognized in the nine months ended September 27, 2014 related to a retiree postretirement benefit plan maintained for certain union employees at our cement plant, which was amended to eliminate all future retiree health and life coverage for the remaining union employees, effective January 1, 2014. |
| (2) | A $1.8 million charge was recognized in the nine months ended September 28, 2013 to remove a sunken barge from the Mississippi River. No charges for the barge removal were recognized in 2014. |
| (3) | A $0.8 million impairment charge on inventory was recognized in the nine months ended September 27, 2014. |
In addition to the items discussed above, approximately $0.6 million of the improvement in Adjusted EBITDA was attributable to the loss on debt financings allocated to the Central region in the nine months ended September 28, 2013 related to the February 2013 debt repricing.
East Region
| Nine months ended | ||||||||||||
| ($ in thousands) | September 27, 2014 |
September 28, 2013 |
Variance | |||||||||
| Revenue |
$ | 108,172 | $ | 111,087 | (2.6 | )% | ||||||
| Operating (loss) income |
(1,925 | ) | 669 | (387.7 | )% | |||||||
| Operating margin |
(1.8 | )% | 0.6 | % | ||||||||
| Adjusted EBITDA |
$ | 10,462 | $ | 10,790 | (3.0 | )% | ||||||
Revenue in the East region decreased $2.9 million, or 2.6%, in the nine months ended September 27, 2014. Of the total $2.9 million revenue decrease, $3.7 million was from decreased product revenue offset by a $0.8 million increase in service revenue, which is primarily paving and related services, but also includes certain other revenues earned.
Aggregate volumes and pricing and asphalt volumes were stable and asphalt volumes declined slightly. The East region’s percent changes in sales volumes and pricing in the nine months ended September 27, 2014 from the nine months ended September 28, 2013 were as follows:
| Percentage Change in | ||||||||
| Volume | Average Selling Pricing |
|||||||
| Aggregates |
0.0 | % | 0.9 | % | ||||
| Asphalt |
(0.5 | )% | 1.7 | % | ||||
Revenue for paving and related services decreased by $0.1 million primarily as a result of a slight decrease in demand for our services in Kentucky.
80
Table of Contents
As a vertically-integrated company, we include intercompany sales from materials to products and from products to services when assessing the operating results of our business. These intercompany transactions are eliminated in the consolidated financial statements. Prior to eliminations, the revenue change by product/service was as follows:
| Nine months ended | ||||||||||||
| (in thousands) | September 27, 2014 |
September 28, 2013 |
Variance | |||||||||
| Revenue by product:* |
||||||||||||
| Aggregates |
$ | 30,643 | $ | 31,038 | $ | (395 | ) | |||||
| Asphalt |
50,967 | 34,428 | 16,539 | |||||||||
| Paving and related services |
76,495 | 76,614 | (119 | ) | ||||||||
| Other |
(49,933 | ) | (30,993 | ) | (18,940 | ) | ||||||
|
|
|
|
|
|
|
|||||||
| Total revenue |
$ | 108,172 | 111,087 | $ | (2,915 | ) | ||||||
|
|
|
|
|
|
|
|||||||
| * | Revenue by product includes intracompany sales transferred at market value. The elimination of intracompany transactions is included in Other. |
In the nine months ended September 27, 2014, the East region’s operating income (loss) and decreased $2.6 million and Adjusted EBITDA decreased $0.3 million as a result of decreased revenue and a 240 basis point decrease in operating margins. The decrease in operating margin was primarily attributable to the following:
| Operating margin - September 28, 2013 |
0.6 | % | ||
| Depreciation, depletion, amortization and accretion |
0.6 | % | ||
| Transaction costs(1) |
(2.9 | )% | ||
| Other |
(0.1 | )% | ||
|
|
|
|||
| Operating margin - September 27, 2014 |
(1.8 | )% | ||
|
|
|
| (1) | Approximately $1.3 million of transaction costs were recognized in the nine months ended September 27, 2014 related to the 2014 acquisition of Buckhorn Materials. |
We intend to reduce certain operating costs, including G&A, with the objective of generating operating income in the East region in 2015.
Fiscal Year 2013 Compared to 2012
| (in thousands) | 2013 | 2012 | Variance | |||||||||||||
| Total revenue |
$ | 916,201 | $ | 926,254 | $ | (10,053 | ) | (1.1 | )% | |||||||
| Operating (loss) income |
(47,977 | ) | 15,415 | (63,392 | ) | (411.2 | )% | |||||||||
| Operating margin |
(5.2 | )% | 1.7 | % | ||||||||||||
| Adjusted EBITDA |
$ | 91,781 | $ | 75,418 | $ | 16,363 | 21.7 | % | ||||||||
Revenue decreased $10.1 million in 2013 due to a $14.9 million decline in service revenue, partially offset by a $4.8 million increase in product revenue. The $14.9 million decrease in service revenue, which is primarily paving and related services, but also includes certain other revenues earned, was a result of an increased focus on higher-margin, lower-volume paving projects and completion of low-margin projects, such as grading and structural work. In 2012, we completed certain construction projects that provided significant revenue, but at below-average margins, including a project in Austin, Texas that contributed $47.5 million of revenue in 2012. The decreased service revenue primarily occurred in our Utah and Texas operations.
Aggregates and ready-mixed concrete volumes were positively affected from the April 1, 2013 acquisitions of the Lafarge-Wichita assets and Westroc near Salt Lake City, Utah. Our cement volumes decreased 4.1% due
81
Table of Contents
primarily to lower volumes in the fourth quarter of 2013, as compared to the fourth quarter of 2012. Adverse weather in 2013, compared to much dryer weather in 2012, and an increased focus on higher-margin, lower-volume paving projects largely offset the effect of the acquisitions and drove the decline in asphalt volumes.
Detail of consolidated percent changes in sales volumes and pricing from 2012 to 2013 were as follows:
| Percentage Change in |
||||||||
| Volume | Average Selling Price |
|||||||
| Aggregate |
4.5 | % | 7.4 | % | ||||
| Cement |
(4.1 | %) | 3.4 | % | ||||
| Ready-mixed concrete |
9.2 | % | 3.6 | % | ||||
| Asphalt |
(13.8 | %) | 4.8 | % | ||||
Revenue for paving and related services decreased by $26.9 million primarily as a result of the completion of certain construction projects, primarily in Texas, which provided significant revenue, but at below-average margins.
As a vertically-integrated company, we include intercompany sales from materials to products and from products to services when assessing the operating results of our business. These intercompany transactions are eliminated in the consolidated financial statements. Prior to eliminations, the revenue change by product/service was as follows:
| (in thousands) | 2013 | 2012 | Variance | |||||||||
| Revenue by product:* |
||||||||||||
| Aggregates |
$ | 159,019 | $ | 146,991 | $ | 12,028 | ||||||
| Cement |
76,211 | 77,676 | (1,465 | ) | ||||||||
| Ready-mixed concrete |
112,878 | 100,941 | 11,937 | |||||||||
| Asphalt |
219,811 | 242,458 | (22,647 | ) | ||||||||
| Paving and related services |
478,280 | 505,189 | (26,909 | ) | ||||||||
| Other |
(129,998 | ) | (147,001 | ) | 17,003 | |||||||
|
|
|
|
|
|
|
|||||||
| Total revenue |
$ | 916,201 | $ | 926,254 | $ | (10,053 | ) | |||||
|
|
|
|
|
|
|
|||||||
| * | Revenue by product includes intracompany sales transferred at market value. The elimination of intracompany transactions is included in Other. |
In 2013, operating (loss) income decreased $63.4 million and Adjusted EBITDA increased $16.3 million as a result of a 690 basis point decrease in operating margin. The decrease in operating profit and margin was primarily attributable to goodwill impairment charges recognized in 2013. The decrease in operating margin was primarily attributable to the following:
| Operating margin — 2012 |
1.7 | % | ||
| Goodwill impairment(1) |
(7.4 | )% | ||
| 2013 charge to remove barge from waterway(2) |
(0.1 | )% | ||
| Transaction costs(3) |
(0.2 | )% | ||
| 2012 loss on indemnification agreement(4) |
0.9 | % | ||
| Other |
(0.1 | )% | ||
|
|
|
|||
| Operating margin — 2013 |
(5.2 | )% | ||
|
|
|
| (1) | In 2013, we recognized $68.2 million of goodwill impairment charges. Approximately $53.3 million and $14.9 million of the goodwill impairments charges were recognized in our West (Utah) and East (Kentucky) |
82
Table of Contents
| regions, respectively. The goodwill impairment was a result of a decline in the estimated fair value of certain reporting units caused by uncertainties in the timing of a sustained recovery in the Utah and Kentucky construction markets. |
Revenue generated from the Utah-based operations declined 7.2% from $204.1 million in 2012 to $189.4 million in 2013, compared to $215.1 million, or a 5.4% increase, adjusted for acquisitions, that was assumed in the 2012 goodwill impairment analysis. The Utah operations incurred an operating loss of $4.5 million, excluding the goodwill impairment charge, and $13.3 million in 2013 and 2012, respectively, demonstrating an improvement in operating loss, but not yet earning operating income. The fair value estimates used in this assessment were dependent upon assumptions and estimates about the future profitability and other financial metrics of our reporting units, as well as relevant financial data, recent transactions and market valuations of comparable public companies. The increase in cash flows from 2012 to 2013 projected in the 2012 goodwill analysis assumed that an increase in housing permits and infrastructure spending in Utah would result in increased revenue for our operations. However, our revenue, and the private construction and public infrastructure spending, did not increase as projected. In the 2013 goodwill analysis, we assumed that an economic recovery in this market would be delayed beyond 2014, which resulted in a decrease in the overall valuation of the Utah operations. Subsequent to the 2013 goodwill analysis, management determined that certain cost savings measures would be required for 2014, including a reduction in G&A. Any benefits from such cost reductions were not assumed in the 2013 goodwill analysis, as they had not been fully quantified when it was completed. Through the nine months ended September 27, 2014, the Utah-based operations’s earnings have exceeded the 2014 full year earnings that were forecast in the 2013 goodwill analysis. This earnings improvement was driven by $8.8 million of G&A reductions, which was primarily a result of a 20% headcount reduction of Utah’s G&A operations, and a $4.4 million loss on the disposition of certain assets in Colorado that was recognized in the nine months ended September 28, 2013. We believe that the risk of additional impairment of the $36.6 million of the Utah operation’s remaining goodwill is low given that the 2013 analysis assumed a delayed market recovery and did not take into consideration cost cutting measures that could be, and were, implemented in 2014.
The operating loss in the East region, which is the Kentucky reporting unit, improved from a loss of $0.2 million in 2012 to approximately break-even in 2013, excluding the goodwill impairment charge. An operating loss was incurred despite a 15.2% increase in revenue. We had expected revenue growth from public infrastructure projects to exceed that which has been realized and is expected in the near term. We also had expected operating income improvements at a greater rate than was projected at the time the 2013 goodwill analysis was performed.
After recognizing these impairment charges, the goodwill attributable to the Utah and Kentucky reporting units was $36.6 million and zero, respectively. We do not believe material uncertainty that could result in an additional impairment charge exists in these reporting units.
| (2) | In 2013, a $0.8 million charge was recognized to remove a sunken barge from the Mississippi River. |
| (3) | Transaction costs increased $2.0 million in 2013 as a result of the April 1, 2013 Lafarge-Wichita and Westroc acquisitions and costs incurred in advance of the January 17, 2014 Alleyton acquisition. |
| (4) | In 2012, we recognized a $8.0 million loss on an indemnification agreement. |
In addition to the items discussed above, approximately $6.4 million of the improvement in Adjusted EBITDA was attributable to a decrease in the loss on debt financings. In 2013, we recognized a $3.1 million loss related to the February 2013 debt repricing and recognized a $9.5 million loss in 2012 related to the January 2012 financing transactions.
Other Financial Information
Loss on Debt Financings
In February 2013, we completed a repricing of our credit facilities, which provide for term loans in an aggregate amount of $422.0 million and revolving credit commitments in an aggregate amount of $150.0 million (the “senior secured credit facilities”), which reduced our stated term-loan interest rate by 1.0% and provided
83
Table of Contents
additional borrowing capacity of $25.0 million. As a result of the repricing, we recognized a loss of $3.1 million for related bank fees. In January 2012, we refinanced our debt existing at that time, resulting in a net loss of $9.5 million. Both the repricing and the refinancing were accounted for as partial extinguishments.
Discontinued Operations
As part of our strategy to focus on our core business as a heavy-side construction materials company, we have exited certain activities, including certain concrete paving operations, our railroad construction and maintenance operations (the “railroad business”), which involved building and repairing railroad sidings, and our environmental remediation operations (the “environmental remediation business”), which primarily involved the repair of retaining walls along highways in Kentucky and the removal and remediation of underground fuel storage tanks. The concrete paving operations were wound down in the second quarter of 2013, and all assets have been sold. The railroad and environmental remediation businesses were sold in 2012 in separate transactions for aggregate proceeds of $3.1 million.
The results of these operations have been removed from the results of continuing operations for all periods presented. Prior to recognition as discontinued operations, all of these businesses were included in the East region’s operations. Revenue from these discontinued operations was $3.9 million in 2013 and $50.2 million in 2012. The loss from discontinued operations was $0.5 million in 2013 and $3.5 million in 2012.
Segment Results of Operations
West Region
| (in thousands) | 2013 | 2012 | Variance | |||||||||||||
| Total revenue |
$ | 426,195 | $ | 484,922 | $ | (58,727 | ) | (12.1 | )% | |||||||
| Operating loss |
(47,476 | ) | (6,625 | ) | (40,851 | ) | 616.6 | % | ||||||||
| Operating margin |
(11.1 | )% | (1.4 | )% | ||||||||||||
| Adjusted EBITDA |
$ | 28,607 | $ | 14,429 | $ | 14,178 | 98.3 | % | ||||||||
Revenue in the West region decreased $58.7 million in 2013 due to a $6.2 million decline in product revenue and a $52.5 million decline in service revenue, which is primarily paving and related services, but also includes certain other revenues earned. The $52.5 million decrease in paving and related services was a result of an increased focus on higher-margin, lower-volume paving projects and completion of low-margin projects, such as grading and structural work. In 2012, we completed certain construction projects that provided significant revenue, but at below-average margins, including a project in Austin, Texas that contributed $47.5 million of revenue in 2012.
The effect on revenue from the decrease in asphalt volumes was partially offset by improved pricing across our products lines and increased aggregate and ready-mixed concrete volumes from the April 1, 2013 Westroc acquisition. The West region’s percent changes in sales volumes and pricing from 2012 to 2013 were as follows:
| Percentage Change in |
||||||||
| Volume | Average Selling Price |
|||||||
| Aggregate |
2.8 | % | 9.5 | % | ||||
| Ready-mixed concrete |
12.7 | % | 5.8 | % | ||||
| Asphalt |
(24.5 | %) | 7.8 | % | ||||
Revenue for paving and related services decreased by $69.6 million primarily as a result of completing certain construction projects which provided significant revenue, but at below-average margins, including a project in Austin, Texas that contributed $47.5 million of revenue in 2012.
84
Table of Contents
As a vertically-integrated company, we include intercompany sales from materials to products and from products to services when assessing the operating results of our business. These intercompany transactions are eliminated in the consolidated financial statements. Prior to eliminations, the revenue change by product/service was as follows:
| (in thousands) | 2013 | 2012 | Variance | |||||||||
| Revenue by product:* |
||||||||||||
| Aggregates |
$ | 46,645 | $ | 41,409 | $ | 5,236 | ||||||
| Ready-mixed concrete |
61,780 | 52,982 | 8,798 | |||||||||
| Asphalt |
141,271 | 173,571 | (32,300 | ) | ||||||||
| Paving and related services |
259,630 | 329,268 | (69,638 | ) | ||||||||
| Other |
(83,131 | ) | (112,308 | ) | (29,177 | ) | ||||||
|
|
|
|
|
|
|
|||||||
| Total revenue |
$ | 426,195 | $ | 484,922 | $ | (58,727 | ) | |||||
|
|
|
|
|
|
|
|||||||
| * | Revenue by product includes intracompany sales transferred at market value. The elimination of intracompany transactions is included in Other. |
In 2013, the West region’s operating loss increased $40.9 million and Adjusted EBITDA increased $14.2 million as a result of a decrease in operating margin from (1.4)% in 2012 to (11.1)% in 2013. The decrease in operating profit and margin was primarily attributable to a goodwill impairment charge recognized in 2013. The decrease in operating margin was primarily attributable to the following:
| Operating margin – 2012 |
(1.4 | )% | ||
| Goodwill impairment(1) |
(12.5 | )% | ||
| Disposition of certain Colorado assets(2) |
(1.0 | )% | ||
| 2012 loss on indemnification agreement(3) |
1.9 | % | ||
| Other(4) |
1.9 | % | ||
|
|
|
|||
| Operating margin – 2013 |
(11.1 | )% | ||
|
|
|
| (1) | A $53.3 million goodwill impairment charge from a decline in the estimated fair value of our reporting unit based in Utah caused by uncertainties in the timing of a sustained recovery in the Utah construction market. Excluding the goodwill impairment charge, operating earnings improved $12.4 million, and operating margin improved 280 basis points in 2013 from 2012. |
| (2) | A $4.4 million loss in 2013 on the disposition of certain assets in Colorado. |
| (3) | These charges were partially offset by an $8.0 million loss on an indemnification agreement in 2012. |
| (4) | The remaining margin improvement was primarily a result of a shift in product and customer mix. In 2013, we increased our focus on higher margin, lower-volume paving projects and completed certain low-margin projects, such as grading and structural work. In 2012, we completed certain construction projects that provided significant revenue, but at below-average margins, including a project in Austin, Texas that contributed $47.5 million of revenue in 2012. As shown in the table above, revenue from paving and related services was 67.9% of the West region’s revenue in 2012 compared to 60.9% in 2013. Aggregates and ready-mixed concrete were 10.9% and 14.5%, respectively, of 2013 revenue compared to 8.5% and 10.9%, respectively, in 2012. |
In addition to the items discussed above, approximately $1.7 million of the improvement in Adjusted EBITDA was attributable to a reduction in the loss on debt financings allocated to the West region.
85
Table of Contents
Central Region
| (in thousands) | 2013 | 2012 | Variance | |||||||||||||
| Total revenue |
$ | 329,621 | $ | 302,113 | $ | 27,508 | 9.1 | % | ||||||||
| Operating income |
39,246 | 37,560 | 1,686 | 4.5 | % | |||||||||||
| Operating margin |
11.9 | % | 12.4 | % | ||||||||||||
| Adjusted EBITDA |
$ | 72,918 | $ | 65,767 | $ | 7,151 | 10.9 | % | ||||||||
Revenue in the Central region increased $27.5 million in 2013 due to an $8.1 million increase in product revenue and a $19.4 million increase in service revenue, which is primarily paving and related services, but also includes certain other revenues earned.
The acquisition of the Lafarge assets in and around Wichita, Kansas contributed to the increases in aggregates, ready-mixed concrete and asphalt volumes. Asphalt prices decreased 1.9% from 2012 due to a concentration of higher grade asphalt mixes in 2012, which commanded a higher price due to higher material input cost. Cement volumes decreased 4.1% with a 3.4% price increase. Price and volume variances across the Central region’s products increased revenue by $6.4 million and $10.2 million in 2013, respectively. The remaining revenue increase in 2013 was primarily due to paving and related projects.
The Central region’s percent changes in sales volumes and pricing from 2012 to 2013 were as follows:
| Percentage Change in |
||||||||
| Volume | Average Selling Price |
|||||||
| Aggregate |
7.9 | % | 5.5 | % | ||||
| Cement |
(4.1 | %) | 3.4 | % | ||||
| Ready-mixed concrete |
5.6 | % | 1.0 | % | ||||
| Asphalt |
25.9 | % | (1.9 | %) | ||||
The $21.7 million increase in paving and related services was driven by increased demand for our services in Kansas.
As a vertically-integrated company, we include intercompany sales from materials to products and from products to services when assessing the operating results of our business. These intercompany transactions are eliminated in the consolidated financial statements. Prior to eliminations, the revenue change by product/service was as follows:
| (in thousands) | 2013 | 2012 | Variance | |||||||||
| Revenue by product:* |
||||||||||||
| Aggregates |
$ | 72,130 | $ | 67,895 | $ | 4,235 | ||||||
| Cement |
76,211 | 77,676 | (1,465 | ) | ||||||||
| Ready-mixed concrete |
51,098 | 47,959 | 3,139 | |||||||||
| Asphalt |
28,004 | 22,697 | 5,307 | |||||||||
| Paving and related services |
102,542 | 80,882 | 21,660 | |||||||||
| Other |
(364 | ) | 5,004 | (5,368 | ) | |||||||
|
|
|
|
|
|
|
|||||||
| Total revenue |
$ | 329,621 | 302,113 | $ | 27,508 | |||||||
|
|
|
|
|
|
|
|||||||
| * | Revenue by product includes intracompany sales transferred at market value. The elimination of intracompany transactions is included in Other. |
86
Table of Contents
In 2013, the Central region’s operating income increased $1.6 million and Adjusted EBITDA increased $7.2 million as a result of increased revenue, partially offset by a 50 basis point decrease in operating margin. The decrease in operating margin was primarily attributable to the following:
| Operating margin — 2012 |
12.4 | % | ||
| 2013 charge to remove barge from waterway(1) |
(0.2 | )% | ||
| Other |
(0.3 | )% | ||
|
|
|
|||
| Operating margin — 2013 |
11.9 | % | ||
|
|
|
| (1) | A $0.8 million charge was recognized in 2013 to remove a sunken barge from the Mississippi River. |
In addition to the items discussed above, approximately $1.5 million of the improvement in Adjusted EBITDA was attributable to a reduction in the loss on debt financings allocated to the Central region.
East Region
| (in thousands) | 2013 | 2012 | Variance | |||||||||||||
| Total revenue |
$ | 160,385 | $ | 139,219 | $ | 21,166 | 15.2 | % | ||||||||
| Operating loss |
(14,207 | ) | (245 | ) | (13,962 | ) | 5,698.8 | % | ||||||||
| Operating margin |
(8.9 | )% | (0.2 | )% | ||||||||||||
| Adjusted EBITDA |
$ | 15,134 | $ | 10,782 | $ | 4,352 | 40.4 | % | ||||||||
Revenue in the East region increased $21.1 million in 2013 due to a $2.9 million increase in product revenue and an $18.2 million increase in service revenue, which is primarily paving and related services, but also includes certain other revenues earned.
The East region’s percent changes in sales volumes and pricing from 2012 to 2013 were as follows:
| Percentage Change in |
||||||||
| Volume | Average Selling Price |
|||||||
| Aggregate |
1.2 | % | 8.0 | % | ||||
| Asphalt |
9.3 | % | (1.4 | %) | ||||
The $21.1 million increase in paving and related services was driven by increased demand for our services in Kentucky.
As a vertically-integrated company, we include intercompany sales from materials to products and from products to services when assessing the operating results of our business. These intercompany transactions are eliminated in the consolidated financial statements. Prior to eliminations, the revenue change by product/service was as follows:
| (in thousands) | 2013 | 2012 | Variance | |||||||||
| Revenue by product:* |
||||||||||||
| Aggregates |
$ | 40,244 | $ | 37,687 | $ | 2,557 | ||||||
| Asphalt |
50,536 | 46,190 | 4,346 | |||||||||
| Paving and related services |
116,108 | 95,039 | 21,069 | |||||||||
| Other |
(46,503 | ) | (39,697 | ) | (6,806 | ) | ||||||
|
|
|
|
|
|
|
|||||||
| Total revenue |
$ | 160,385 | 139,219 | $ | 21,166 | |||||||
|
|
|
|
|
|
|
|||||||
87
Table of Contents
| * | Revenue by product includes intracompany sales transferred at market value. The elimination of intracompany transactions is included in Other. |
In 2013, the East region’s operating loss increased $14.0 million and Adjusted EBITDA increased $4.4 million as a result of a decrease in operating margin from (0.2)% in 2012 to (8.9)% in 2013. The decrease in operating margin was primarily attributable to the following:
| Operating margin — 2012 |
(0.2 | )% | ||
| Goodwill impairment(1) |
(9.3 | )% | ||
| Other(2) |
0.6 | % | ||
|
|
|
|||
| Operating margin – 2013 |
(8.9 | )% | ||
|
|
|
| (1) | In 2013, we recognized a $14.9 million goodwill impairment charge from a decline in the estimated fair value of the reporting unit caused by uncertainties in the timing of a sustained recovery in the Kentucky construction market. |
| (2) | In 2013, we implemented various cost savings initiatives, including headcount reductions of approximately 60 salaried employees. We intend to continue to reduce operating costs with the objective of generating operating income in the East region. The goodwill impairment charge of $14.9 million is not expected to reoccur and, absent that charge, the operating loss in 2013 would have been operating income. |
In addition to the items discussed above, approximately $2.4 million of the improvement in Adjusted EBITDA was attributable to a reduction in the loss on debt financings allocated to the East region.
Fiscal Year 2012 Compared to 2011
| (in thousands) | 2012 | 2011 | Variance | |||||||||||||
| Total revenue |
$ | 926,254 | $ | 789,076 | $ | 137,178 | 17.4 | % | ||||||||
| Operating income |
15,415 | 25,099 | (9,684 | ) | (38.6 | )% | ||||||||||
| Operating margin |
1.7 | % | 3.2 | % | ||||||||||||
| Adjusted EBITDA |
$ | 75,418 | $ | 107,720 | $ | (32,302 | ) | (30.0 | )% | |||||||
Revenue in 2012 increased to $926.3 million compared to $789.1 million in 2011. Of the total $137.2 million increase in revenue, $161.3 million resulted from increased product revenue, partially offset by a $24.1 million decrease in service revenue, primarily in our Utah, Texas and Kentucky operations as we completed certain low-margin projects from 2011 and began exiting certain construction services. Detail of consolidated percent changes in sales volumes and pricing from 2011 to 2012 were as follows:
| Percentage Change in | ||||||||
| Volume | Average Selling Price |
|||||||
| Aggregates |
20.8 | % | 3.9 | % | ||||
| Cement |
18.0 | % | (2.2 | %) | ||||
| Ready-mixed concrete |
13.7 | % | 5.9 | % | ||||
| Asphalt |
11.8 | % | 10.7 | % | ||||
Volume increased among all of our product lines, primarily driven by acquisitions. Cement volumes increased 18.0%, driven by an increase in large-volume customers, which also contributed to the 2.2% decrease pricing.
Revenue for paving and related services increased by $40.3 million, on a gross basis before intracompany transactions were eliminated, but, as discussed above, total service revenue decreased $24.1 million primarily as a result of decreased demand for our services in Utah, Texas and Kentucky.
88
Table of Contents
As a vertically-integrated company, we include intercompany sales from materials to products and from products to services when assessing the operating results of our business. These intercompany transactions are eliminated in the consolidated financial statements. Prior to eliminations, the revenue change by product/service was as follows:
| (in thousands) | 2012 | 2011 | Variance | |||||||||
| Revenue by product:* |
||||||||||||
| Aggregates |
$ | 146,991 | $ | 116,082 | $ | 30,909 | ||||||
| Cement |
77,676 | 69,664 | 8,012 | |||||||||
| Ready-mixed concrete |
100,941 | 94,302 | 6,639 | |||||||||
| Asphalt |
242,458 | 182,952 | 59,506 | |||||||||
| Paving and related services |
505,189 | 464,866 | 40,323 | |||||||||
| Other |
(147,001 | ) | (138,790 | ) | (8,211 | ) | ||||||
|
|
|
|
|
|
|
|||||||
| Total revenue |
$ | 926,254 | 789,076 | $ | 137,178 | |||||||
|
|
|
|
|
|
|
|||||||
| * | Revenue by product includes intracompany sales transferred at market value. The elimination of intracompany transactions is included in Other. |
In 2012, operating income decreased $9.7 million and Adjusted EBITDA decreased $32.3 million. Operating margin decreased 150 basis points from 2011. The decrease in operating margin was primarily attributable to the following:
| Operating margin – 2011 |
3.2 | % | ||
| 2012 loss on indemnification agreement(1) |
(0.7 | )% | ||
| 2011 landfill closure gain(2) |
(0.4 | )% | ||
| Transaction costs(3) |
0.8 | % | ||
| Other(4) |
(1.2 | )% | ||
|
|
|
|||
| Operating margin – 2012 |
1.7 | % | ||
|
|
|
| (1) | In 2012, we recognized a $8.0 million loss on an indemnification agreement, compared to $1.9 million in 2011. |
| (2) | In 2011, we recognized a $3.4 million gain on the asset reclamation obligation for a landfill in Kansas as a result of revisions to landfill closure plans. |
| (3) | Transaction costs decreased $7.1 million in 2012 compared to 2011 due to a decrease in acquisition activity. We closed eight acquisitions in 2011 with an average purchase price of $23.6 million compared to three in 2012 for an average purchase price of $19.8 million. |
| (4) | Operating income was affected by cost overruns on various projects that were not material individually, or in the aggregate. |
In addition to the items discussed above, Adjusted EBITDA was affected by:
| • | A $9.5 million loss associated with the January 2012 financing transactions. |
| • | In 2011, we recognized $12.1 million of bargain purchase gains on certain acquisitions in the West region. The amount of the bargain purchase gains are equal to the amount by which the fair value of net assets acquired exceeded the consideration transferred. We believe that the resulting bargain purchase gains are reasonable as the sellers were highly motivated. |
| • | In 2011, we recognized a $10.3 million favorable fair value adjustment on contingent consideration, compared to $0.4 million in 2012. The $10.3 million adjustment in 2011 was due primarily to revised estimates of the probability of achieving the specified targets that would require contingent payments related to certain acquisitions. |
89
Table of Contents
As a result of the contract escalation clauses and effective use of the firm purchase commitments discussed above, commodity prices did not have a material effect on our results of operations in 2012, as compared to 2011.
Other Financial Information
Other Income, Net
Other income decreased to $1.2 million in 2012 from $21.2 million in 2011. Included in other income in 2011 were $12.1 million of bargain purchase gains on certain acquisitions in the West region and a $10.3 million gain from fair value adjustments to contingent consideration, compared to a $0.4 million fair value adjustment in 2012.
Loss on Debt Refinancing
We refinanced our long-term debt and accrued interest in January 2012 resulting in a $9.5 million charge, which was accounted for as a partial extinguishment. We did not refinance our long-term debt in 2011.
Interest Expense
Interest expense increased $10.3 million, or 21.5%, to $58.1 million in 2012 compared to $47.8 million in 2011. The increase in our interest expense reflects an increase in our average debt. Our debt, without giving effect to original issuance discount, increased to $648.0 million at December 29, 2012 from $609.0 million at December 31, 2011. In addition, although our outstanding borrowings on our revolver were zero at year-end 2012, we carried an average balance of $36.7 million during 2012. The additional borrowings were primarily used to fund acquisitions ($48.8 million) and seasonal working capital requirements.
Discontinued Operations
The results of our discontinued operations have been removed from the results of continuing operations for all periods presented. Revenue from these discontinued operations was $50.2 million and $49.5 million in 2012 and 2011, respectively. The loss from discontinued operations, inclusive of an immaterial gain on the sale in 2012, was $3.5 million and $5.2 million in 2012 and 2011, respectively.
Segment Results of Operations
West Region
| (in thousands) | 2012 | 2011 | Variance | |||||||||||||
| Total revenue |
$ | 484,922 | $ | 362,577 | $ | 122,345 | 33.7 | % | ||||||||
| Operating loss |
(6,625 | ) | (455 | ) | (6,170 | ) | (1,356.0 | )% | ||||||||
| Operating margin |
(1.4 | )% | (0.1 | )% | ||||||||||||
| Adjusted EBITDA |
$ | 14,429 | $ | 36,442 | $ | (22,013 | ) | (60.4 | )% | |||||||
90
Table of Contents
Revenue in the West region increased $122.3 million, or 33.7%. The majority of the increase is due to a full year of revenue from the six acquisitions that expanded our presence in Utah, Texas and Colorado in 2011. Incremental revenue from businesses acquired in 2011 totaled $147.4 million. These increases were partially offset by volume declines in the Utah market. The West region’s percent changes in sales volumes and pricing from 2011 to 2012 were as follows:
| Percentage Change in | ||||||||
| Volume | Average Selling Price |
|||||||
| Aggregates |
22.7 | % | 5.6 | % | ||||
| Ready-mixed concrete |
4.9 | % | 6.2 | % | ||||
| Asphalt |
25.5 | % | 7.8 | % | ||||
Volume and pricing increased among all of our product lines primarily due to the inclusion of a full year of operations from our 2011 acquisitions and from incremental revenue from our 2012 acquisition.
Revenue for paving and related services increased by $89.2 million primarily as a result of the acquisitions in Austin, Texas, offset by declines in our existing operations in Utah and Texas.
As a vertically-integrated company, we include intercompany sales from materials to products and from products to services when assessing the operating results of our business. These intercompany transactions are eliminated in the consolidated financial statements. Prior to eliminations, the revenue change by product/service was as follows:
| (in thousands) | 2012 | 2011 | Variance | |||||||||
| Revenue by product:* |
||||||||||||
| Aggregates |
$ | 41,409 | $ | 30,900 | $ | 10,509 | ||||||
| Ready-mixed concrete |
52,982 | 46,506 | 6,476 | |||||||||
| Asphalt |
173,571 | 115,301 | 58,270 | |||||||||
| Paving and related services |
329,268 | 240,067 | 89,201 | |||||||||
| Other |
(112,308 | ) | (70,197 | ) | (42,111 | ) | ||||||
|
|
|
|
|
|
|
|||||||
| Total revenue |
$ | 484,922 | 362,577 | $ | 122,345 | |||||||
|
|
|
|
|
|
|
|||||||
| * | Revenue by product includes intracompany sales transferred at market value. The elimination of intracompany transactions is included in Other. |
In 2012, operating income decreased $6.2 million and Adjusted EBITDA decreased $22.0 million as a result of a 130 basis point decrease in operating margin from 2011. The decrease in operating margin was primarily attributable to the following:
| Operating margin – 2011 |
(0.1 | )% | ||
| 2012 loss on indemnification agreement(1) |
(1.3 | )% | ||
| Transaction costs(2) |
0.8 | % | ||
| Other(3) |
(0.8 | )% | ||
|
|
|
|||
| Operating margin – 2012 |
(1.4 | )% | ||
|
|
|
| (1) | In 2012, we recognized a $8.0 million loss on an indemnification agreement, compared to $1.9 million in 2011. |
| (2) | Transaction costs decreased $3.9 million in 2012 compared to 2011 due to a decrease in acquisition activity in the region. |
91
Table of Contents
| (3) | The reduction in depreciation, depletion, amortization and accretion, as a percentage of revenue, contributed a 0.8% increase in operating margin 2012. In 2012, a significant portion of our revenue growth was attributable to acquisitions, which exceeded the percentage increase in depreciation expense recognized from the acquisitions. As a result, depreciation, depletion, amortization and accretion, as a percentage of revenue, decreased from 2011 despite an overall increase in depreciable assets. |
In addition to the items discussed above, Adjusted EBITDA was affected by:
| • | Approximately $3.3 million attributable to the loss allocated to the West region associated with the January 2012 financing transactions. |
| • | In 2011, we recognized $12.1 million of bargain purchase gains on certain acquisitions in the West region. The amount of the bargain purchase gains are equal to the amount by which the fair value of net assets acquired exceeded the consideration transferred. We believe that the resulting bargain purchase gains are reasonable as the sellers were highly motivated. |
| • | In 2011, we recognized a $5.0 million favorable fair value adjustment on contingent consideration, compared to $0.4 million in 2012. The $5.0 million adjustment in 2011 was due primarily to revised estimates of the probability of achieving the specified targets that would require the payment of contingent consideration related to certain acquisitions. |
Central Region
| (in thousands) | 2012 | 2011 | Variance | |||||||||||||
| Total revenue |
$ | 302,113 | $ | 264,008 | $ | 38,105 | 14.4 | % | ||||||||
| Operating income |
37,560 | 38,105 | (545 | ) | (1.4 | )% | ||||||||||
| Operating margin |
12.4 | % | 14.4 | % | ||||||||||||
| Adjusted EBITDA |
$ | 65,767 | $ | 65,651 | $ | 116 | 0.2 | % | ||||||||
Revenue in the Central region increased $38.1 million, or 14.4%, in 2012 to $302.1 million compared to $264.0 million in 2011 due to acquisitions and a $15.4 million increase in cement sales, driven by an 18% increase in cement volumes. Revenue from businesses acquired in 2012 totaled $23.3 million and the incremental revenue in 2012 from businesses acquired in 2011 was $1.5 million. The Central region’s percent changes in sales volumes and pricing from 2011 to 2012 were as follows:
| Percentage Change in | ||||||||
| Volume | Average Selling Price |
|||||||
| Aggregates |
35.6 | % | 4.6 | % | ||||
| Cement |
18.0 | % | (2.2 | %) | ||||
| Ready-mixed concrete |
24.9 | % | 5.7 | % | ||||
| Asphalt |
(30.0 | )% | 10.4 | % | ||||
Aggregate revenue increased $19.6 million in 2012 due to a volume and pricing increase of 35.6% and 4.6%, respectively.
Revenue for paving and related services decreased by $10.5 million primarily as a result of public infrastructure projects in Kansas moving to areas of the state in which we do not have operations.
92
Table of Contents
As a vertically-integrated company, we include intercompany sales from materials to products and from products to services when assessing the operating results of our business. These intercompany transactions are eliminated in the consolidated financial statements. Prior to eliminations, the revenue change by product/service was as follows:
| (in thousands) | 2012 | 2011 | Variance | |||||||||
| Revenue by product:* |
||||||||||||
| Aggregates |
$ | 67,895 | $ | 48,263 | $ | 19,632 | ||||||
| Cement |
77,676 | 69,664 | 8,012 | |||||||||
| Ready-mixed concrete |
47,959 | 36,356 | 11,603 | |||||||||
| Asphalt |
22,697 | 29,379 | (6,682 | ) | ||||||||
| Paving and related services |
80,882 | 91,336 | (10,454 | ) | ||||||||
| Other |
5,004 | (10,990 | ) | 15,994 | ||||||||
|
|
|
|
|
|
|
|||||||
| Total revenue |
$ | 302,113 | 264,008 | $ | 38,105 | |||||||
|
|
|
|
|
|
|
|||||||
| * | Revenue by product includes intracompany sales transferred at market value. The elimination of intracompany transactions is included in Other. |
In 2012, operating income decreased $0.5 million and Adjusted EBITDA increased $0.1 million as a result of a 200 basis point decrease in operating margin from 2011. The decrease in operating margin was primarily attributable to the following:
| Operating margin – 2011 |
14.4 | % | ||
| 2011 Landfill closure gain(1) |
(1.1 | )% | ||
| Other |
(0.9 | )% | ||
|
|
|
|||
| Operating margin – 2012 |
12.4 | % | ||
|
|
|
| (1) | In 2011, we recognized a $3.4 million gain on the asset reclamation obligation for a landfill in Kansas as a result of revisions to landfill closure plans. |
In addition to the items discussed above, Adjusted EBITDA was affected by approximately $2.1 million attributable to the loss allocated to the Central region associated with the January 2012 financing transactions.
East Region
| (in thousands) | 2012 | 2011 | Variance | |||||||||||||
| Total revenue |
$ | 139,219 | $ | 162,491 | $ | (23,272 | ) | (14.3 | )% | |||||||
| Operating (loss) income |
(245 | ) | 2,687 | (2,932 | ) | (109.1 | )% | |||||||||
| Operating margin |
(0.2 | )% | 1.7 | % | ||||||||||||
| Adjusted EBITDA |
$ | 10,782 | $ | 15,504 | $ | (4,722 | ) | (30.5 | )% | |||||||
Our East region’s revenue decreased $23.3 million from $162.5 million in 2011 to $139.2 million in 2012 due to a decline in paving and related activities in Kentucky. The East region’s percent changes in sales volumes and pricing from 2011 to 2012 were as follows:
| Percentage Change in | ||||||||
| Volume | Average Selling Price |
|||||||
| Aggregates |
0.5 | % | 0.9 | % | ||||
| Asphalt |
(1.9 | )% | 23.0 | % | ||||
93
Table of Contents
The increase in asphalt revenue of $7.9 million was impacted by a 23.0% increase in pricing, offset by a 1.9% decline in volumes.
Revenue for paving and related services decreased by $38.4 million primarily as a result of decreased demand for our products in Kentucky.
As a vertically-integrated company, we include intercompany sales from materials to products and from products to services when assessing the operating results of our business. These intercompany transactions are eliminated in the consolidated financial statements. Prior to eliminations, the revenue change by product/service was as follows:
| (in thousands) | 2012 | 2011 | Variance | |||||||||
| Revenue by product:* |
||||||||||||
| Aggregates |
$ | 37,687 | $ | 36,919 | $ | 768 | ||||||
| Asphalt |
46,190 | 38,272 | 7,918 | |||||||||
| Paving and related services |
95,039 | 133,463 | (38,424 | ) | ||||||||
| Other |
(39,697 | ) | (46,163 | ) | 17,906 | |||||||
|
|
|
|
|
|
|
|||||||
| Total revenue |
$ | 139,219 | 162,491 | $ | (23,272 | ) | ||||||
|
|
|
|
|
|
|
|||||||
| * | Revenue by product includes intracompany sales transferred at market value. The elimination of intracompany transactions is included in Other. |
In 2012, operating (loss) income decreased $2.9 million and Adjusted EBITDA decreased $4.7 million as a result of a 190 basis point decrease in operating margin from 2011. The decrease in operating margin was primarily attributable to the following:
| Operating margin – 2011 |
1.7 | % | ||
| Various immaterial items(1) |
(1.9 | )% | ||
|
|
|
|||
| Operating margin – 2012 |
(0.2 | )% | ||
|
|
|
| (1) | Operating income was affected by cost overruns on various projects that were not material individually, or in the aggregate. |
In addition to the items discussed above, Adjusted EBITDA was affected by:
| • | Approximately $3.7 million attributable to the loss allocated to the East region associated with the January 2012 financing transactions. |
| • | In 2011, we recognized a $5.3 million favorable fair value adjustment on contingent consideration due primarily to revised estimates of the probability of achieving the specified targets that would require contingent payments related to certain acquisitions. |
Liquidity and Capital Resources
Our primary sources of liquidity include cash on-hand, cash provided by our operations and amounts available for borrowing under our credit facilities. As of September 27, 2014, we had $6.7 million in cash and working capital of $109.8 million as compared to cash and working capital of $14.9 million and $58.4 million, respectively, at December 28, 2013. Working capital is calculated as current assets less current liabilities. There were no restricted cash balances as of September 27, 2014 or December 28, 2013. Our remaining borrowing capacity on our senior secured revolving credit facility as of September 27, 2014 was $102.7 million, which is net of $23.3 million of outstanding letters of credit, and is fully available to us within the terms and covenant requirements of our credit agreement.
94
Table of Contents
Given the seasonality of our business, we typically experience significant fluctuations in working capital needs and balances throughout the year. Our working capital requirements generally increase during the first half of the year as we build up inventory and focus on repair and maintenance and other set-up costs for the upcoming season. Working capital levels then decrease as the construction season winds down and we enter the winter months, which is when we see significant inflows of cash from the collection of receivables. For example, net cash provided by operating activities in the nine months ended September 28, 2013 was $0.1 million, compared to full year 2013 net cash provided by operating activities of $66.4 million. Net cash used for operating activities in the nine months ended September 27, 2014 was $11.4 million.
We believe we have access to sufficient financial resources from our liquidity sources to fund our business and operations, including contractual obligations, capital expenditures and debt service obligations, for at least the next twelve months. Our growth strategy contemplates future acquisitions for which we believe we have sufficient access to capital. As of September 27, 2014, we had approximately $330.6 million of funding commitments outstanding from our equity sponsors. We do not expect outstanding equity funding commitments will be available to us after consummation of this offering.
Our Long-Term Debt
Please refer to the notes to the consolidated financial statements found elsewhere in this prospectus for detailed information regarding our long-term debt and senior secured revolving credit facility, scheduled maturities of long-term debt and affirmative and negative covenants. Among other things, we are required to maintain a consolidated first lien net leverage ratio that is no greater than 4.50 to 1.00 for the period from July 1, 2014 through June 30, 2015, and 4.25 to 1.00 thereafter. Our first lien net leverage ratio, for purposes of the senior secured credit facility, is calculated following each quarter and is based on information for the most recently ended four fiscal quarters for which internal financial information is available by dividing our consolidated first lien net debt as of the end of such period by our consolidated EBITDA for such period. Consolidated EBITDA for purposes of our senior secured credit facility is calculated in accordance with our presentation of Further Adjusted EBITDA below.
For the twelve months ended September 27, 2014 and December 28, 2013 our consolidated first lien net leverage ratio was 2.36 to 1.00 and 3.43 to 1.00, respectively, based on consolidated first lien net debt of $462.7 million and $440.6 million as of September 27, 2014 and December 28, 2013 respectively, divided by Further Adjusted EBITDA of $196.4 million and $128.5 million for the twelve months ended September 27, 2014 and December 28, 2013, respectively. As of September 27, 2014 and December 28, 2013, we were in compliance with all debt covenants.
95
Table of Contents
The following table sets forth a reconciliation of net loss to Adjusted EBITDA and Further Adjusted EBITDA for the periods indicated. Adjusted EBITDA and Further Adjusted EBITDA are not U.S. GAAP measures and should not be considered in isolation, or as a substitute for our results as reported under U.S. GAAP.
| (in thousands) | Twelve Months Ended September 27, 2014(a) |
Nine Months Ended September 27, 2014 |
Nine Months Ended September 28, 2013 |
Year Ended December 28, 2013 |
||||||||||||
| Net loss |
$ | (81,212 | ) | $ | (10,750 | ) | $ | (33,217 | ) | $ | (103,679 | ) | ||||
| Interest expense |
76,618 | 62,555 | 42,380 | 56,443 | ||||||||||||
| Income tax benefit |
(3,363 | ) | (2,498 | ) | (1,782 | ) | (2,647 | ) | ||||||||
| Depreciation, depletion and amortization |
81,479 | 63,302 | 54,040 | 72,217 | ||||||||||||
| Accretion |
828 | 648 | 537 | 717 | ||||||||||||
| Goodwill impairment |
68,202 | — | — | 68,202 | ||||||||||||
| Discontinued operations(b) |
(85 | ) | (356 | ) | 257 | 528 | ||||||||||
| Adjusted EBITDA |
$ | 142,467 | 112,901 | $ | 62,215 | $ | 91,781 | |||||||||
|
|
|
|
|
|
|
|
|
|||||||||
| Acquisition transaction expenses(c) |
8,552 | 3,175 | 3,990 | |||||||||||||
| Management fees and expenses(d) |
3,908 | 3,255 | 1,967 | 2,620 | ||||||||||||
| Strategic fees and initiatives(e) |
1,487 | 278 | 2,678 | 3,887 | ||||||||||||
| Non-cash compensation(f) |
2,319 | 1,746 | 1,742 | 2,315 | ||||||||||||
| Loss on disposal and impairment of fixed assets(g) |
4,677 | (34 | ) | 7,708 | 12,419 | |||||||||||
| Severance and relocation costs |
1,461 | 749 | 2,043 | 2,755 | ||||||||||||
| Other(h) |
(433 | ) | 438 | 11,001 | 10,130 | |||||||||||
| EBITDA for certain completed acquisitions(i) |
31,418 | 18,012 | (15,002 | ) | (1,596 | ) | ||||||||||
|
|
|
|
|
|
|
|
|
|||||||||
| Further Adjusted EBITDA |
$ | 196,370 | $ | 145,082 | $ | 77,163 | $ | 128,451 | ||||||||
|
|
|
|
|
|
|
|
|
|||||||||
| (a) | The statement of operations data for the twelve months ended September 27, 2014, which are unaudited, have been calculated by subtracting the data for the nine months ended September 28, 2013 from the data for the year ended December 28, 2013, and adding the data for the nine months ended September 27, 2014. This presentation is not in accordance with U.S. GAAP. However, we use trailing four quarter financial data to test compliance with covenants under our senior secured credit facilities. |
| (b) | Represents certain concrete paving operations and railroad construction and repair operations that we have exited. |
| (c) | Represents the transaction expenses associated with past acquisitions and potential acquisitions, consisting primarily of accounting, legal, valuation and financial advisory fees for the acquisitions that were completed in the periods presented. |
| (d) | Represents certain fees paid and expenses reimbursed to affiliates of our Sponsors. See “Certain Relationships and Related Party Transactions—Transaction and Management Fee Agreement.” |
| (e) | Represents incurred “costs of” strategic initiatives we put in place, including costs incurred for finance effectiveness improvements and information technology start-up costs. We cannot assure you that we will achieve the synergies that we anticipate achieving in connection with these strategic initiatives. |
| (f) | Represents non-cash equity-based compensation granted to executives and other members of senior management. |
| (g) | Represents the loss recognized on assets disposed, net of gains realized on asset sales. |
| (h) | Includes non-recurring or one time income and expense that was incurred outside normal operating activities. |
| (i) | Represents the EBITDA for the period from September 29, 2013 to the respective dates of acquisition for the Alleyton, Troy Vines, Buckhorn Materials, Canyon Redi-Mix, Mainland and Southwest Ready Mix acquisitions. This does not reflect the EBITDA estimated to have been generated by Colorado County S&G or Concrete Supply because these acquisitions were completed after September 27, 2014. |
At September 27, 2014 and December 28, 2013, $1,041.7 million and $695.9 million, respectively, of total debt, without giving effect to original issuance discount or premium, were outstanding under our respective debt agreements. Summit Materials, LLC and its indirect wholly-owned subsidiary, Summit Materials Finance Corp. (together, the “Issuers”), have issued $625.0 million aggregate principal amount of 10 1⁄2% senior notes due January 31, 2020 under an indenture dated as of January 30, 2012 (as amended and supplemented, the “Indenture”). We initially issued $250.0 million of senior notes on January 30, 2012. We issued an additional
96
Table of Contents
$260.0 million and $115.0 million of senior notes on January 17, 2014 and September 8, 2014 at a premium over their par value, receiving proceeds of $409.3 million, before payment of fees and expenses. The proceeds from the January and September 2014 issuances were used for the purchase of Alleyton and Mainland, to make payments on the senior secured revolving credit facility and for general corporate purposes.
In addition to the senior notes, Summit Materials, LLC’s senior secured credit facilities provide for term loans in an aggregate amount of $422.0 million and credit commitments under the senior secured revolving credit facility in an aggregate amount of $150.0 million. Summit Materials’ domestic wholly-owned subsidiary companies and its non wholly-owned subsidiary, Continental Cement, are named as guarantors of the senior notes and the senior secured credit facilities. Certain other partially-owned subsidiaries, including a subsidiary of Continental Cement, and the Canadian subsidiary, Mainland, do not guarantee the senior notes. Summit Materials, LLC has pledged substantially all of its assets as collateral for the senior secured credit facilities.
Cash Flows
The following table summarizes our net cash used for or provided by operating, investing and financing activities and our capital expenditures for the periods indicated:
| Nine months ended | Year ended | |||||||||||||||||||
| (in thousands) | September 27, 2014 |
September 28, 2013 |
December 28, 2013 |
December 29, 2012 |
December 31, 2011 |
|||||||||||||||
| Net cash (used for) provided by |
||||||||||||||||||||
| Operating activities |
$ | (10,836 | ) | $ | 123 | $ | 66,412 | $ | 62,279 | $ | 23,253 | |||||||||
| Investing activities |
(405,853 | ) | (105,930 | ) | (111,515 | ) | (85,340 | ) | (192,331 | ) | ||||||||||
| Financing activities |
408,501 | 97,583 | 32,589 | 7,702 | 146,775 | |||||||||||||||
| Cash paid for capital expenditures |
$ | (64,244 | ) | $ | (53,659 | ) | $ | (65,999 | ) | $ | (45,488 | ) | $ | (38,656 | ) | |||||
Operating Activities
During the nine months ended September 27, 2014, cash used in operating activities was $10.8 million primarily as a result of:
| • | Net loss of $10.8 million, adjusted for $69.0 million of non-cash expenses, including $68.0 million of depreciation, depletion, amortization and accretion. |
| • | An increase in accounts receivable and costs and estimated earnings in excess of billings of $69.5 million. In conjunction with the seasonality of our business, the majority of our sales occur in the spring, summer and fall and we typically incur an increase in accounts receivable (net billed and unbilled) during the second and third quarters of each year. This amount is typically converted to cash in the fourth and first quarters. |
| • | Additional investment in inventory of $3.8 million consistent with the seasonality of our business for which our inventory levels typically decrease in the fourth quarter in preparation for the winter slowdown and are then increased during the second quarter in preparation for the increased sales volumes in the spring and summer. |
| • | The timing of payments associated with accounts payable and accrued expenses utilized $12.0 million of cash in conjunction with the build-up of inventory levels and incurrence of repairs and maintenance costs to ready the business for increased sales volumes in the summer and fall. In addition, we made $59.2 million of interest payments in the nine months ended September 27, 2014. |
During the nine months ended September 28, 2013, cash provided by operating activities was $0.1 million primarily as a result of:
| • | Net loss of $33.2 million, adjusted for $69.0 million of non-cash expenses, including $56.8 million of depreciation, depletion, amortization and accretion and $7.7 million of losses on asset dispositions. |
97
Table of Contents
| • | An increase in accounts receivable and costs and estimated earnings in excess of billings of $40.6 million and a decrease in billings in excess of costs and estimated earnings of $2.4 million consistent with the seasonality of our business. |
| • | The timing of payments associated with accounts payable and accrued expenses provided $9.9 million of cash in conjunction with the build-up of inventory levels and incurrence of repairs and maintenance. These cash inflows were affected by increased interest payments. In the nine months ended September 28, 2013, we made interest payments of $45.6 million. |
During the year ended December 28, 2013, cash provided by operating activities was $66.4 million primarily as a result of:
| • | Net loss of $106.8 million, adjusted for non-cash expenses, including $75.9 million of depreciation, depletion, amortization and accretion, a $68.2 million goodwill impairment charge and $12.4 million from net losses on asset disposals. |
| • | Collection of accounts receivable providing $9.9 million of additional cash in 2013 due to an increased focus on processing billings and collecting on outstanding receivables. |
During the year ended December 29, 2012, cash provided by operating activities was $62.3 million primarily as a result of:
| • | Net loss of $52.5 million, adjusted for non-cash expenses, including $72.2 million of depreciation, depletion, amortization and accretion, which increased in 2012 in connection with our 2011 and 2012 acquisitions, and a $9.5 million loss on our January 2012 debt refinancing. |
| • | Collection of accounts receivable and costs and estimated earnings in excess of billings providing $12.1 million of additional cash in 2012 due to an increased focus on processing billings and collecting on outstanding receivables. |
| • | Reduced payments of accounts payable and accrued expenses providing additional cash from operations, on a net basis, of $11.1 million in 2012 due primarily to a $16.0 million increase in accrued interest. Our December 2012 payment was accrued at year-end 2012 and paid in the first quarter of 2013. |
During the year ended December 31, 2011, cash provided by operating activities was $23.3 million primarily as a result of:
| • | Net loss of $10.7 million, adjusted for non-cash expenses, including $65.0 million of depreciation, depletion, amortization and accretion, a $12.1 million bargain purchase gain and a $10.3 million gain on the revaluation of contingent consideration. |
| • | Collection of accounts receivable and costs and estimated earnings in excess of billings providing $13.3 million of additional cash in 2011 due to an increased focus on timely billings and cash collections as compared to the legacy processes of the businesses acquired in 2010. |
| • | Inventory utilizing $12.6 million of cash in 2011 as we increased our inventory balances to support the growth in business activities (revenue increased 94.7% from 2010 to 2011). |
| • | Billings in excess of costs and estimated earnings utilizing $8.2 million of cash in 2011 due to certain contracts that were completed in 2011. |
Investing Activities
During the nine months ended September 27, 2014, cash used for investing activities was $405.9 million, $351.9 million of which related to the 2014 acquisitions of Alleyton, Troy Vines, Buckhorn Materials, Southwest Ready Mix, Colorado Country S&G and Mainland. In addition, we invested $64.2 million in capital expenditures, offset by $9.6 million of proceeds from asset sales, primarily equipment.
98
Table of Contents
During the nine month period ended September 28, 2013, cash used for investing activities was $105.9 million, $60.9 million of which related to the April 1, 2013 acquisitions of certain assets of Lafarge in and around Wichita, Kansas and all of the membership interests of Westroc. In addition, we invested $53.7 million in capital expenditures, offset by $8.6 million of proceeds from asset sales, primarily equipment.
During the year ended December 28, 2013, cash used for investing activities was $111.5 million, $61.6 million of which was used for the April 1, 2013 acquisitions of certain Lafarge assets in and around Wichita, Kansas and all of the membership interests of Westroc near Salt Lake City, Utah. In addition, we invested $66.0 million in capital expenditures, offset by $16.1 million of proceeds from asset sales. Approximately $25.6 million of the capital expenditures were invested in our cement business in Hannibal, Missouri, for continued development of an underground mine ($15.3 million), a cement terminal expansion to store additional cement in St. Louis, Missouri ($2.8 million), as well as improvements made to our cement plant during the scheduled shutdowns. We also invested $6.4 million in a new hot mix asphalt plant in Austin, Texas.
During the year ended 2012, cash used for investing activities was $85.3 million. We paid $48.8 million for three acquisitions, which expanded our presence in certain of our existing markets and $45.5 million for capital expenditures. Approximately half of our 2012 capital expenditures were to replace or maintain equipment and the remaining portion reflects capital investments in the business, the most significant of which is the development of an underground mine at our cement plant. We spent $5.0 million on the underground mine development in 2012.
During the year ended 2011, cash used for investing activities was $192.3 million. We paid $161.1 million for eight acquisitions and $38.7 million for capital expenditures. Six of the eight acquisitions were in the West region through which we entered the western Colorado and Austin, Texas markets as well as expanded our presence in Utah and Idaho.
Financing Activities
During the nine months ended September 27, 2014, cash provided by financing activities was $408.5 million, which was primarily composed of $398.9 million of net borrowings on debt. We issued $375.0 million of senior notes in 2014 at a premium, receiving $409.3 million of aggregate proceeds. The funds from the borrowings were primarily used to purchase Alleyton and Mainland, make payments on the revolving credit facility and for general corporate purposes. In addition, we received equity contributions of $24.4 million and made $5.8 million of payments on our acquisition related liabilities in the nine months ended September 27, 2014.
During the nine months ended September 28, 2013, cash provided by financing activities was $97.6 million, which was primarily composed of $105.8 million net borrowings on the senior secured credit facilities, including proceeds from the February 2013 repricing transaction, through which our outstanding borrowings increased $25.0 million. Approximately $60.9 million of the funds from the borrowings were used on April 1, 2013 to purchase certain assets of Lafarge in and around Wichita, Kansas and of Westroc near Salt Lake City, Utah. The remaining funds have been used to fund seasonal working capital fluctuations. In addition, we made $4.9 million of payments on our acquisition-related liabilities in the nine months ended September 28, 2013.
During the year ended 2013, cash provided by financing activities was $32.6 million, which was primarily composed of $42.4 million in net borrowings on the Revolver and proceeds from the February 2013 repricing transaction, through which our outstanding borrowings increased $25.0 million. Approximately $61.6 million of the funds from the borrowings were used on April 1, 2013 to purchase certain assets of Lafarge in and around Wichita, Kansas and all of the membership interests in Westroc. The remaining funds have been used for seasonal working capital requirements. In addition, we made $9.8 million of payments on our acquisition-related liabilities in 2013.
99
Table of Contents
During the year ended 2012, cash provided by financing activities was $7.7 million, which is primarily composed of $16.5 million of proceeds from the January 2012 financing transactions, offset by $7.5 million of payments on our acquisition-related liabilities.
During the year ended 2011, cash provided by financing activities was $146.8 million. The $103.6 million capital contributions from our member were used to fund certain acquisitions. The remaining cash provided by financing activities primarily reflects the $47.7 million of net proceeds from new debt issuances, which were also used to fund acquisitions, partially offset by $4.6 million of payments on our acquisition-related liabilities.
Cash Paid for Capital Expenditures
We estimate that we will invest between $80.0 million and $85.0 million in capital expenditures in 2014, which we have funded or expect to fund through cash on hand, cash from operations, outside financing arrangements and available borrowings under our senior secured credit facilities. In 2014, we expect to continue investing in Texas, including approximately $6.0 million on installation of a new sand and gravel processing plant near Houston, Texas and $5.9 million to complete the underground mine at our cement plant, which we expect to provide us with access to over 200 years of proven and probable limestone reserves.
We expended approximately $64.2 million and $66.0 million in the nine months ended September 27, 2014 and the year ended December 28, 2013, respectively. A portion of our 2014 and 2013 capital investment related to the development of an underground mine to extract limestone on our Hannibal, Missouri property where our cement plant is located. We spent $5.0 million and $15.3 million on the underground mine development in the nine months ended September 27, 2014 and the year ended December 28, 2013, respectively.
We expended approximately $45.5 million in capital expenditures in 2012 and $38.7 million in 2011. A significant portion of the increase in capital expenditures in 2012 relates to development of the underground mine for our cement plant. We spent $5.0 million on the underground mine development in 2012 compared to $0.2 million in 2011.
Tax Receivable Agreement
Future exchanges of LP Units for shares of Class A common stock are expected to result in increases in the tax basis of the tangible and intangible assets of Summit Holdings. These increases in tax basis may increase (for tax purposes) depreciation and amortization deductions and therefore reduce the amount of tax that Summit Materials, Inc. would otherwise be required to pay in the future. Prior to the completion of this offering, we will enter into a tax receivable agreement with the holders of LP Units and certain other indirect pre-IPO owners that provides for the payment by Summit Materials, Inc. to exchanging holders of LP Units of 85% of the benefits, if any, that Summit Materials, Inc. is deemed to realize as a result of (i) these increases in tax basis and (ii) our utilization of certain net operating losses of the Investor Entities and certain other tax benefits related to entering into the tax receivable agreement, including tax benefits attributable to payments under the tax receivable agreement. The increases in tax basis as a result of an exchange of LP Units for shares of Class A common stock, as well as the amount and timing of any payments under the tax receivable agreement, are difficult to accurately estimate as they will vary depending upon a number of factors, including:
| • | the timing of exchanges—for instance, the increase in any tax deductions will vary depending on the fair market value, which may fluctuate over time, of the depreciable or amortizable assets of Summit Holdings at the time of each exchange; |
| • | the price of shares of our Class A common stock at the time of the exchange—the increase in any tax deductions, as well as the tax basis increase in other assets, of Summit Holdings, is directly proportional to the price of shares of our Class A common stock at the time of the exchange; |
| • | the extent to which such exchanges are taxable—if an exchange is not taxable for any reason, increased deductions will not be available; |
100
Table of Contents
| • | the amount of net operating losses—the amount of net operating losses of the Investor Entities at the time of any applicable merger or contribution transaction will impact the amount and timing of payments under the tax receivable agreement; and |
| • | the amount and timing of our income—Summit Materials, Inc. will be required to pay 85% of the cash tax savings as and when realized, if any. If Summit Materials, Inc. does not have taxable income, Summit Materials, Inc. is not required (absent circumstances requiring an early termination payment) to make payments under the tax receivable agreement for that taxable year because no cash tax savings will have been realized. However, any tax attributes that do not result in realized benefits in a given tax year will likely generate tax attributes that may be utilized to generate benefits in previous or future tax years. The utilization of such tax attributes will result in cash tax savings that will result in payments under the tax receivable agreement. |
We anticipate funding payments under the tax receivable agreement from cash flow from operations of our subsidiaries, available cash and available borrowings under our senior secured revolving credit facility.
Summit Materials, Inc. may elect to terminate the tax receivable agreement early by making an immediate payment equal to the present value of the anticipated future cash tax savings. In determining such anticipated future cash tax savings, the tax receivable agreement includes several assumptions, including (i) that any LP Units that have not been exchanged are deemed exchanged for the market value of the shares of Class A common stock at the time of termination, (ii) Summit Materials, Inc. will have sufficient taxable income in each future taxable year to fully realize all potential tax savings, (iii) the tax rates for future years will be those specified in the law as in effect at the time of termination and (iv) certain non-amortizable assets are deemed disposed of within specified time periods. In addition, the present value of such anticipated future cash tax savings are discounted at a rate equal to LIBOR plus basis points. Assuming that the market value of a share of Class A common stock were to be equal to an assumed initial public offering price per share of Class A common stock in this offering of $ per share, which is the midpoint of the price range set forth on the cover of this prospectus, and that LIBOR were to be %, we estimate that the aggregate amount of these termination payments would be approximately $ if Summit Materials, Inc. were to exercise its termination right immediately following this offering.
As a result of the change in control provisions and the early termination right, Summit Materials, Inc. could be required to make payments under the tax receivable agreement that are greater than or less than the specified percentage of the actual cash tax savings that Summit Materials, Inc. realizes in respect of the tax attributes subject to the tax receivable agreement. In these situations, our obligations under the tax receivable agreement could have a substantial negative impact on our liquidity.
See “Certain Relationships and Related Person Transactions—Tax Receivable Agreement” for additional details.
101
Table of Contents
Contractual Obligations
The following table presents, as of December 28, 2013, our obligations and commitments to make future payments under contracts and contingent commitments (in thousands). The information below does not give effect to this offering or the use of proceeds therefrom.
| Total | 2014 | 2015-2016 | 2017-2018 | Thereafter | ||||||||||||||||
| Short term borrowings and long-term debt, including current portion(1) |
$ | 695,890 | $ | 30,220 | $ | 9,495 | $ | 7,385 | $ | 648,790 | ||||||||||
| Capital lease obligations |
11,001 | 2,069 | 4,042 | 720 | 4,170 | |||||||||||||||
| Operating lease obligations |
18,260 | 4,034 | 6,988 | 4,359 | 2,879 | |||||||||||||||
| Interest payments(2) |
281,096 | 47,398 | 99,360 | 88,099 | 46,239 | |||||||||||||||
| Acquisition-related liabilities |
47,337 | 10,790 | 14,254 | 12,330 | 9,963 | |||||||||||||||
| Royalty payments |
21,937 | 2,044 | 4,039 | 3,480 | 12,374 | |||||||||||||||
| Defined benefit plans(3) |
4,880 | 972 | 2,410 | 1,280 | 218 | |||||||||||||||
| Asset retirement obligation payments |
39,468 | 1,101 | 3,239 | 4,509 | 30,619 | |||||||||||||||
| Other |
9,465 | 3,088 | 3,220 | 3,157 | — | |||||||||||||||
|
|
|
|
|
|
|
|
|
|
|
|||||||||||
| Total contractual obligations(4) |
$ | 1,129,334 | $ | 101,716 | $ | 147,047 | $ | 125,319 | $ | 755,252 | ||||||||||
|
|
|
|
|
|
|
|
|
|
|
|||||||||||
| (1) | We issued an additional $260.0 million and $115.0 million of senior notes due January 2020 on January 17, 2014 and September 8, 2014, respectively. Had these amounts been outstanding at December 28, 2013, total contractual payments on short term borrowings and long-term debt, including current portion, would increase to $1,071 million and payments due after 2018 would increase to $1,024 million. |
| (2) | Future interest payments were calculated using the applicable fixed and floating rates charged by our lenders in effect as of December 28, 2013 and may differ from actual results. |
| (3) | Amounts represent estimated future payments to fund our defined benefit plans. |
| (4) | Any future payouts on the redeemable noncontrolling interest are excluded from total contractual obligations as the expected timing of settlement is not estimable. |
Commitments and Contingencies
We are party to certain legal actions arising from the ordinary course of business activities. Accruals are recorded when the outcome is probable and can be reasonably estimated. While the ultimate results of claims and litigation cannot be predicted with certainty, management expects that the ultimate resolution of all current pending or threatened claims and litigation will not have a material effect on our consolidated results of operations, financial position or liquidity.
We are obligated under an indemnification agreement entered into with the sellers of Harper Contracting for the sellers’ ownership interests in a joint venture agreement. We have the rights to any benefits under the joint venture as well as the assumption of any obligations, but do not own equity interests in the joint venture. The joint venture has incurred significant losses on a highway project in Utah, which have resulted in requests for funding from the joint venture partners and, ultimately, from us. Through September 27, 2014, we have funded $8.8 million, $4.0 million was funded in 2012 and $4.8 million was funded in 2011. As of September 27, 2014 and December 28, 2013, an accrual of $4.3 million was recorded in other noncurrent liabilities for this matter.
In 2013, a dispute with the sellers of Harper Contracting related to the calculation of working capital from the August 2010 acquisition was settled. The working capital dispute was submitted to binding arbitration, the outcome of which resulted in the payment of $1.9 million to the sellers. In addition, various other acquisition-related disputes with the sellers were settled for approximately $0.8 million. The total payments of $2.7 million were made in 2013. There was no material effect to 2013 earnings as a result of these settlements.
102
Table of Contents
In February 2011, we incurred a property loss related to a sunken barge with cement product aboard. In 2013, we recognized $0.8 million of charges for costs to remove the barge from the waterway. As of September 27, 2014 and December 28, 2013, we had $0.4 million and $0.9 million, respectively, included in accrued expenses as management’s best estimate of the remaining costs to remove the barge.
We are obligated under various firm purchase commitments for certain raw materials and services that are in the ordinary course of business. The terms of these agreements are generally less than one year. Management does not expect any significant changes in the market value of these goods and services during the commitment period that would have a material adverse effect on the financial position, results of operations or liquidity of the Company.
Off-Balance Sheet Arrangements
As of September 27, 2014, we had no material off-balance sheet arrangements.
New Accounting Standards
In May 2014, the FASB issued a new accounting standard to improve and converge the financial reporting requirements for revenue from contracts with customers. Accounting Standards Update (“ASU”) No. 2014-09, Revenue from Contracts with Customers, prescribes a five-step model for revenue recognition that will replace most existing revenue recognition guidance in U.S. GAAP. The ASU will supersede nearly all existing revenue recognition guidance under U.S. GAAP and provides that an entity recognize revenue when it transfers promised goods or services to customers in an amount that reflects the consideration to which the entity expects to be entitled in exchange for those goods or services. This update also requires additional disclosure about the nature, amount, timing and uncertainty of revenue and cash flows arising from customer contracts, including significant judgments and changes in judgments, and assets recognized from costs incurred to obtain or fulfill a contract. ASU No. 2014-09 allows for either full retrospective or modified retrospective adoption and will become effective for us in the first quarter of 2017. Early adoption is prohibited. Management is currently assessing the effect that the adoption of this standard will have on the consolidated financial statements.
In April 2014, the FASB issued ASU No. 2014-08, Reporting Discontinued Operations and Disclosures of Disposals of Components of an Entity, which changes the criteria for determining which disposals can be presented as discontinued operations and modifies related disclosure requirements. Under the new guidance, a discontinued operation is defined as a disposal of a component or group of components that is disposed of or is classified as held for sale and “represents a strategic shift that has (or will have) a major effect on an entity’s operations and financial results.” This ASU is effective for fiscal years beginning on or after December 15, 2014, and interim periods within that annual period, with early adoption permitted. We adopted this standard in 2014 with no material effect on our consolidated financial statements.
Emerging Growth Company Status
We are an “emerging growth company” as defined under the JOBS Act and are eligible to take advantage of certain exemptions from various public company reporting requirements. See “Risk Factors—Risks Related to Our Industry and Our Business—Other Risks—As an “emerging growth company” under the JOBS Act, we are permitted to, and intend to, rely on exemptions from certain disclosure requirements.”
Section 107 of the JOBS Act also provides that an “emerging growth company” can take advantage of the extended transition period provided in Section 7(a)(2)(B) of the Securities Act to comply with new or revised accounting standards. In other words, an “emerging growth company” can delay the adoption of certain accounting standards until those standards apply to private companies. As an “emerging growth company,” we may elect to delay adoption of new or revised accounting standards applicable to public companies until such standards are made applicable to private companies. As a result, our financial statements may not be comparable to the financial statements of issuers who are required to comply with the effective dates for new or revised accounting standards that are applicable to public companies.
103
Table of Contents
We will remain an “emerging growth company” until the earliest of: (1) the end of the fiscal year following the fifth anniversary of this offering; (2) the last day of the first fiscal year during which our annual gross revenues were $1.0 billion or more; (3) the date on which we have, during the previous three-year period, issued more than $1.0 billion in non-convertible debt securities; or (4) the end of any fiscal year in which the market value of our common stock held by non-affiliates exceeded $700 million as of the end of the second quarter of that fiscal year.
Critical Accounting Policies
Our management’s discussion and analysis of our financial condition and results of operations is based on our consolidated financial statements, which have been prepared in accordance with U.S. GAAP. The preparation of these consolidated financial statements requires management to make estimates and assumptions that affect the reported amounts of assets and liabilities, disclosure of contingent assets and liabilities at the date of the consolidated financial statements and the reported amounts of revenue and expenses during the reported period.
On an ongoing basis, management evaluates its estimates, including those related to the valuation of accounts receivable, inventories, goodwill, intangibles and other long-lived assets, pension and other postretirement obligations, asset retirement obligations and the noncontrolling interest. We base our estimates and judgments on historical experience and on various other factors that we believe to be reasonable under the circumstances, the results of which form the basis for making judgments about the carrying values of assets and liabilities that are not readily apparent from other sources. Actual results may differ from these estimates under different assumptions or conditions.
Acquisitions—Purchase Price Allocation
We regularly review strategic long-term plans, including potential investments in value-added acquisitions of related or similar businesses, which would increase our market share and/or are related to our existing markets. When an acquisition is completed, our consolidated statement of operations includes the operating results of the acquired business starting from the date of acquisition, which is the date that control is obtained. The purchase price is determined based on the fair value of assets given to and liabilities assumed from the seller as of the date of acquisition. We allocate the purchase price to the fair values of the tangible and intangible assets acquired and liabilities assumed as valued at the date of acquisition. Goodwill is recorded for the excess of the purchase price over the net of the fair value of the identifiable assets acquired and liabilities assumed as of the acquisition date. The estimation of fair values of acquired assets and assumed liabilities is judgmental and requires various assumptions and the amounts and useful lives assigned to depreciable and amortizable assets compared to amounts assigned to goodwill, which is not amortized, can significantly affect the results of operations in the period of and periods subsequent to a business combination.
Fair value is the price that would be received to sell an asset or paid to transfer a liability in an orderly transaction, and therefore represents an exit price. A fair value measurement assumes the highest and best use of the asset by market participants, considering the use of the asset that is physically possible, legally permissible, and financially feasible at the measurement date. We assign the highest level of fair value available to assets acquired and liabilities assumed based on the following options:
| • | Level 1—Quoted prices in active markets for identical assets and liabilities. |
| • | Level 2—Observable inputs, other than quoted prices, for similar assets or liabilities in active markets. |
| • | Level 3—Unobservable inputs, which includes the use of valuation models. |
Level 2 inputs are typically used to estimate the fair value of acquired machinery, equipment and land and assumed liabilities for asset retirement obligations, environmental remediation and compliance obligations and contingencies.
Level 3 inputs are used to estimate the fair value of acquired mineral reserves, mineral interests and separately-identifiable intangible assets.
104
Table of Contents
There is a measurement period after the acquisition date during which we may adjust the amounts recognized for a business combination. Any such adjustments are based on us obtaining additional information that existed at the acquisition date regarding the assets acquired or the liabilities assumed. Measurement period adjustments are generally recorded as increases or decreases to the goodwill recognized in the transaction. Material adjustments are applied retroactively to the date of acquisition and reported retrospectively. The measurement period ends once we have obtained all necessary information that existed as of the acquisition date, but does not extend beyond one year from the date of acquisition. Any adjustments to assets acquired or liabilities assumed beyond the measurement period are recorded in earnings.
We have invested $351.9 million, $61.6 million and $48.8 million in business combinations and allocated this amount to assets acquired and liabilities assumed during the nine months ended September 27, 2014 and the years ended December 28, 2013 and December 29, 2012, respectively.
Goodwill and Goodwill Impairment
Goodwill is tested annually for impairment and in interim periods if certain events occur indicating that the carrying amounts may be impaired. The evaluation involves the use of significant estimates and assumptions and considerable management judgment. Our judgments regarding the existence of impairment indicators and future cash flows are based on operational performance of our businesses, market conditions and other factors. Although there are inherent uncertainties in this assessment process, the estimates and assumptions we use, including estimates of future cash flows, volumes, market penetration and discount rates, are consistent with our internal planning. The estimated future cash flows are derived from internal operating budgets and forecasts for long-term demand and pricing in our industry and markets. If these estimates or their related assumptions change in the future, we may be required to record an impairment charge on all or a portion of our goodwill. Furthermore, we cannot predict the occurrence of future impairment-triggering events nor the affect such events might have on our reported values. Future events could cause us to conclude that impairment indicators exist and that goodwill associated with our acquired businesses are impaired. Any resulting impairment loss could have an adverse effect on our financial position and results of operations.
Under the two-step quantitative impairment test, step one of the evaluation of impairment involves comparing the current fair value of each reporting unit to its carrying value, including goodwill. We use a discounted cash flow (“DCF”) model to estimate the current fair value of our reporting units when testing for impairment, as management believes forecasted cash flows are the best indicator of fair value. A number of significant assumptions and estimates are involved in the application of the DCF model to forecast operating cash flows, including macroeconomic trends in the private construction and public infrastructure industries, the timing of work embedded in our backlog, our performance and profitability under our contracts, our success in securing future sales and the appropriate interest rate used to discount the projected cash flows. Most of these assumptions vary significantly among the reporting units. This discounted cash flow analysis is corroborated by “top-down” analyses, including a market assessment of our enterprise value. We believe the estimates and assumptions used in the valuations are reasonable.
We assessed the fair value of our reporting units in relation to their carrying values as of the first day of the fourth quarter of 2013. Step one of the impairment test concluded that the book values of two of our reporting units, the Utah-based operations in the West region and our one reporting unit in the East region exceeded their estimated fair values. For our remaining reporting units, the estimated fair values were substantially in excess of carrying values ranging from 56% to 182%.
For the Utah-based and East region reporting units, we performed the second step of the goodwill impairment test to measure the amount of the impairment loss, if any. The second step of the test requires the allocation of the reporting unit’s fair value to its assets and liabilities, including any unrecognized intangible assets, in a hypothetical analysis that calculates the implied fair value of goodwill as if the reporting unit was being acquired in a business combination. If the implied fair value of goodwill is less than the carrying value, the difference is recorded as an impairment loss. Based on the results of the step two analyses, we recorded impairment charges to goodwill of
105
Table of Contents
$53.3 million and $14.9 million for the Utah-based and East region reporting units, respectively. After recognizing these impairment charges, the goodwill attributable to the Utah and Kentucky reporting units was $36.6 million and zero, respectively. As of September 27, 2014, we determined that no events or circumstances from September 28, 2013 through September 27, 2014 indicated that a further assessment was necessary.
Impairment of Long-Lived Assets, Excluding Goodwill
We evaluate the carrying value of long-lived assets, including intangible assets subject to amortization, when events and circumstances indicate that the carrying value may not be recoverable. Long-lived assets are material to our total assets (as of December 28, 2013, net property, plant and equipment, represented 66.7% of total assets) and the evaluation involves the use of significant estimates and assumptions and considerable management judgment. Such indicators may include deterioration in general economic conditions, negative developments in equity and credit markets, adverse changes in the markets in which an entity operates, increases in input costs that have a negative effect on earnings and cash flows, or a trend of negative or declining cash flows over multiple periods, among others. A one year increase or decrease in the average useful lives of our property, plant and equipment would have affected 2013 depreciation expense by ($4.5) million or $5.2 million, respectively. An impairment charge could be material to our financial condition and results of operations. The carrying value of long-lived assets is considered impaired when the estimated undiscounted cash flows from such assets are less than their carrying value. In that event, we recognize a loss equal to the amount by which the carrying value exceeds the fair value of the long-lived assets.
Fair value is determined by primarily using a cash flow methodology that requires considerable management judgment and long-term assumptions. Our estimate of net future cash flows is based on historical experience and assumptions of future trends, which may be different from actual results. The goodwill impairment recognized at two reporting units was considered to be an indication that the carrying value of long-lived assets may not be recoverable at those reporting units requiring further evaluation, despite positive cash flows in the year ended December 28, 2013 at both the Utah and Kentucky reporting units.
The net book value of the long-lived assets at the Utah and Kentucky reporting units, as of the first day of the fourth quarter, was $117.3 million and $127.8 million, respectively. The evaluation indicated that the carrying value of the reporting units’ long-lived assets was less than the undiscounted future cash flows, resulting in no impairment of the evaluated long-lived assets. The type of long-lived assets at the reporting units, primarily plant and equipment, when purchased new, had generally increased in value from the date the long-lived assets at these reporting units were purchased. As a result, management does not believe that there is a risk that a material impairment charge will be recognized at these reporting units in the near future.
We also consider the identification of an asset for disposal to be an event requiring evaluation of the asset’s fair value. Fair value is often determined to be the estimated sales price, less selling costs. If the carrying value exceeds the fair value, then an impairment charge is recognized equal to the expected loss on disposal. Throughout 2013, we recognized $12.4 million of net losses on asset dispositions, which include both the net loss on disposed assets and losses on assets identified for disposition in the succeeding twelve months. The losses commonly occur because the cash flows expected from selling the asset are less than the cash flows that could be generated from holding the asset for use.
There were no changes to the useful lives of assets having a material effect on our financial position or results of operations in 2013 or 2012.
Revenue Recognition
We earn revenue from the sale of products, which primarily include aggregates, cement, ready-mixed concrete and asphalt, but also include concrete products and plastics components, and from the provision of services, which are primarily paving and related services, but also include landfill operations, the receipt and disposal of waste, which is converted to fuel used in our cement plant, and underground storage space rental.
106
Table of Contents
Revenue for product sales is recognized when evidence of an arrangement exists, the fee is fixed or determinable, title passes, which generally is when the product is shipped, and collection is reasonably assured. Product revenue generally include sales of aggregates, cement and other materials to customers, net of discounts or allowances, if any, and generally include freight and delivery charges billed to customers. Freight and delivery charges associated with cement sales are recorded on a net basis together with freight costs within cost of sales.
Revenue from the receipt of waste fuels is recognized when the waste is accepted and a corresponding liability is recognized for the costs to process the waste into fuel for the manufacturing of cement or to ship the waste offsite for disposal in accordance with applicable regulations.
We account for revenue and earnings on our long-term paving and related services contracts as service revenue using the percentage-of-completion method of accounting. Under the percentage-of-completion method, we recognize paving and related services revenue as services are rendered. We estimate profit as the difference between total estimated revenue and total estimated cost of a contract and recognize that profit over the life of the contract based on input measures (e.g., costs incurred). We generally measure progress toward completion on long-term paving and related services contracts based on the proportion of costs incurred to date relative to total estimated costs at completion. We include revisions of estimated profits on contracts in earnings under the cumulative catch-up method, under which the effect of revisions in estimates is recognized immediately. If a revised estimate of contract profitability reveals an anticipated loss on the contract, we recognize the loss in the period it is identified.
The percentage-of-completion method of accounting involves the use of various estimating techniques to project costs at completion, and in some cases includes estimates of recoveries asserted against the customer for changes in specifications or other disputes. Contract estimates involve various assumptions and projections relative to the outcome of future events over multiple periods, including future labor productivity and availability, the nature and complexity of the work to be performed, the cost and availability of materials, the effect of delayed performance, and the availability and timing of funding from the customer. These estimates are based on our best judgment. A significant change in one or more of these estimates could affect the profitability of one or more of our contracts. We review our contract estimates regularly to assess revisions in contract values and estimated costs at completion. No material contract adjustments were recognized between 2011 and the nine months ended September 27, 2014.
We recognize revenue arising from claims either as income or as an offset against a potential loss only when the amount of the claim can be estimated reliably and its realization is probable. In evaluating these criteria, we consider the contractual/legal basis for the claim, the cause of any additional costs incurred, the reasonableness of those costs and the objective evidence available to support the claim.
Mining Reclamation Obligations
We incur reclamation obligations as part of our mining activities. Our quarry activities require the removal and relocation of significant levels of overburden to access stone of usable quantity and quality. The same overburden material is used to reclaim depleted mine areas, which must be sloped to a certain gradient and seeded to prevent erosion in the future. Reclamation methods and requirements can differ depending on the quarry and state rules and regulations in existence for certain locations. This differentiation affects the potential obligation required at each individual subsidiary. As of December 28, 2013, our undiscounted reclamation obligations totaled $19.7 million, of which 21.9% is expected to be settled within the next five years and the remaining 78.1% thereafter.
Reclamation costs resulting from the normal use of long-lived assets, either owned or leased, are recognized over the period the asset is in use. The obligation, which cannot be reduced by estimated offsetting cash flows, is recorded at fair value as a liability at the obligating event date and is accreted through charges to operating expenses. The fair value is based on our estimate for a third party to perform the legally required reclamation tasks including a reasonable profit margin. This fair value is also capitalized as part of the carrying amount of the underlying asset and depreciated over the estimated useful life of the asset.
107
Table of Contents
The mining reclamation reserve is based on management’s estimate of future cost requirements to reclaim property at both currently operating and closed quarry sites. Costs are estimated in current dollars and inflated until the expected time of payment using a future estimated inflation rate and then discounted back to present value using a credit-adjusted, risk-free rate on obligations of similar maturity adjusted to reflect our credit rating. We review reclamation obligations at least every three years for a revision to the cost or a change in the estimated settlement date. Additionally, reclamation obligations are reviewed in the period that a triggering event occurs that would result in either a revision to the cost or a change in the estimated settlement date. Examples of events that would trigger a change in the cost include a new reclamation law or amendment to an existing mineral lease. Examples of events that would cause a change in the estimated settlement date include the acquisition of additional reserves or early or delayed closure of a site. Any affect to earnings from cost revisions is included in cost of revenue.
Quantitative and Qualitative Disclosures About Market Risk
We are exposed to certain market risks arising from transactions that are entered into in the normal course of business. Our operations are highly dependent upon the interest rate-sensitive construction industry as well as the general economic environment. Consequently, these marketplaces could experience lower levels of economic activity in an environment of rising interest rates or escalating costs. Management has considered the current economic environment and its potential effect to our business. Demand for aggregates-based products, particularly in the residential and nonresidential construction markets, could decline if companies and consumers are unable to obtain financing for construction projects or if an economic recession causes delays or cancellations to capital projects. Additionally, in preceding years, declining tax revenue, state budget deficits and unpredictable or inconsistent federal funding have negatively affected states’ abilities to finance infrastructure construction projects.
Pension and Other Postretirement Plans
At our cement plant, we sponsor two non-contributory defined benefit pension plans for hourly and salaried employees and healthcare and life insurance benefits for certain eligible retired employees. As of January 2014, the pension plans have been frozen to new participants and the healthcare and life insurance benefit plan has been amended to eliminate all future retiree health and life coverage. Our results of operations are affected by our net periodic benefit cost from these plans, which totaled $1.2 million in 2013. Assumptions that affect this expense include the discount rate and, for the pension plans only, the expected long-term rate of return on assets. Therefore, we have interest rate risk associated with these factors.
The healthcare and life insurance benefit plan are exposed to changes in the cost of healthcare services. A one percentage-point increase or decrease in assumed health care cost trend rates would have affected the accumulated postretirement benefit obligation by approximately $1.3 million or $(1.1) million, respectively, at December 28, 2013.
Commodity and Energy Price Risk
We are subject to commodity price risk with respect to price changes in liquid asphalt and energy, including fossil fuels and electricity for aggregates, cement, ready-mixed concrete and asphalt paving mix production, natural gas for hot mix asphalt production and diesel fuel for distribution vehicles and production related mobile equipment. Liquid asphalt escalators in most of our public infrastructure contracts limit our exposure to price fluctuations in this commodity, and we seek to obtain escalators on private and commercial contracts.
Inflation Risk
Inflation rates in recent years have not been a significant factor in our revenue or earnings due to relatively low inflation and our ability to recover increasing costs by obtaining higher prices for our products through sale price escalators in place for most public infrastructure sector contracts. Inflation risk varies with the level of activity in the construction industry, the number, size and strength of competitors and the availability of products to supply a local market.
108
Table of Contents
Foreign Currency Risk
In September 2014, we expanded our operations into Canada with the acquisition of Mainland. With this expansion, we are subject to foreign currency risk related to changes in the U.S. dollar/Canadian dollar exchange rates. A 10% adverse change in foreign currency rates from September 2014 levels would not materially affect our financial position, results of operations or cash flows.
Variable-Rate Borrowing Facilities
We have $150.0 million of revolving credit commitments and $422.0 million of term loans under the senior secured credit facilities, which bear interest at a variable rate. In February 2013, we entered into amendments to our senior secured credit facilities that, among other things, reduced the applicable margins used to calculate interest rates for term loans under our credit facilities by 1.0% and reduced the applicable margins used to calculate interest rates for $131.0 million of $150.0 million Tranche A revolving credit loans available under the senior secured credit facilities by 1.0%. Had this reduction been in place throughout 2012, our interest expense would have been reduced by $4.4 million. A hypothetical 100-basis-point increase in interest rates on the December 28, 2013 outstanding Revolver borrowings of $26.0 million would increase interest expense by $0.3 million on an annual basis. The interest rate on the term loans has a floor of 1.25%. The rate in effect at December 28, 2013 was 0.25%. As a result, the 100-basis-point increase in the interest rate at December 28, 2013 would not result in a rate greater than the floor rate of 1.25%. Therefore, a hypothetical 100-basis-point increase in the term loans’ interest rate would have no effect on annual interest expense.
109
Table of Contents
Overview
We are one of the fastest growing heavy-side construction materials companies in the United States, with a 126% increase in revenue between the year ended December 31, 2010 and the year ended December 28, 2013, as compared to an average increase of approximately 17% in revenue reported by our competitors over the same period. Our materials include aggregates, which we supply across the country, with a focus on Texas, Kansas, Kentucky, Missouri and Utah, and cement, which we supply primarily in Missouri, Iowa and Illinois. Within our markets, we offer customers a single-source provider for heavy-side construction materials and related downstream products through our vertical integration. In addition to supplying aggregates to customers, we use our materials internally to produce ready-mixed concrete and asphalt paving mix, which may be sold externally or used in our paving and related services businesses. Our vertical integration creates opportunities to increase aggregates volumes and optimize margin at each stage of production and enables us to provide customers with efficiency gains, convenience and reliability, which we believe gives us a competitive advantage.
Since our first acquisition five years ago, we have rapidly become a major participant in the U.S. heavy-side construction materials industry. We believe that, by volume, we are a top 10 aggregates supplier, a top 25 cement producer and a major producer of ready-mixed concrete and asphalt paving mix. Our revenue in 2013 and the first nine months of 2014 was $916.2 million and $870.1 million, respectively, with net losses for the same periods of $103.7 million and $10.8 million, respectively. Our proven and probable aggregates reserves were 2.1 billion tons as of September 27, 2014. In the twelve months ended September 27, 2014 we sold 22.1 million tons of aggregates, 1.0 million tons of cement, 2.3 million cubic yards of ready-mixed concrete and 4.2 million tons of asphalt paving mix across our more than 200 sites and plants.
The rapid growth we have achieved over the last five years has been due in large part to our acquisitions, which we funded with equity commitments that our Sponsors and certain other investors made to Summit Holdings together with debt financing. During this period, we witnessed a cyclical decline and slow recovery in the private construction market and nominal growth in public infrastructure spending. However, the private construction market is beginning to rebound, which we believe signals the outset of a strong growth period in our industry and end markets. We believe we are well positioned to capitalize on this anticipated recovery in order to grow our business and reduce our leverage over time. As of September 27, 2014, our total indebtedness was approximately $1,091.1 million, or $ million on a pro forma basis after giving effect to this offering and the application of the net proceeds.
The private construction market includes residential and nonresidential new construction and the repair and remodel market. According to the National Association of Home Builders, the number of total housing starts in the United States, a leading indicator for our residential business, is expected to grow 57% from 2013 to 2016. In addition, the PCA projects that spending in private nonresidential construction will grow 26% over the same period. The private construction market represented 53% of our revenue for the nine months ended September 27, 2014.
Public infrastructure, which includes spending by federal, state and local governments for roads, highways, bridges, airports and other public infrastructure projects, has been a relatively stable portion of government budgets providing consistent demand to our industry and is projected by the PCA to grow approximately 3% from 2013 to 2016. With the nation’s infrastructure aging, we expect U.S. infrastructure spending to grow over the long term, and we believe we are well positioned to capitalize on any such increase. Despite this projected growth, we do not believe it will be consistent across the United States, but will instead be concentrated in certain regions, like Texas, which represented 35% of our revenue for the nine months ended September 27, 2014 and has consistently shown more growth over the last few years than almost all other major markets. The public infrastructure market represented 47% of our revenue for the nine months ended September 27, 2014.
In addition to the anticipated growth in our end markets, we expect higher volume and pricing in our core product categories. The PCA estimates cement consumption will increase approximately 30% from 2013 to
110
Table of Contents
2016, reflecting rising demand in the major end markets. At the same time, we believe that cement pricing will be driven higher by tightening production capacity in the United States, where the PCA projects consumption will exceed domestic cement capacity by 2017 driven by both increasing demand and by other capacity constraints arising from the PC-MACT regulation, with which compliance is generally required in 2015. Favorable market dynamics can also be seen in aggregates, where volumes decreased from 3.1 billion tons in 2006 to an estimated 2.1 billion tons in 2013, a 34% decline that has been offset by growth in the average price per ton, which increased from $7.37 in 2006 to an estimated $8.94 in 2013, a 21% increase, according to the U.S. Geological Survey. Consistent with these market trends, our cement and aggregates average pricing increased 5% and 3%, respectively, from the year ended December 31, 2010 to the nine months ended September 27, 2014.
Historically, we have sought to supplement organic growth potential with acquisitions, by strategically targeting attractive, new markets or expanding in existing markets. We consider population trends, employment rates, competitive landscape, private construction outlook, public funding and various other factors prior to entering a new market. In addition to analyzing macroeconomic data, we seek to establish a top position in our local markets, which we believe supports our achieving sustainable organic growth and attractive returns. This positioning provides local economies of scale and synergies, which benefit our pricing, costs and profitability. We believe that each of our operating companies has a top three market share position in its local market.
Our acquisition strategy, to date, has helped us to achieve scale and rapid growth, and we believe that significant opportunities remain for growth through acquisition. We estimate that approximately 65% of the U.S. heavy-side construction materials market is privately owned. From this group, our senior management team maintains contact with over 300 private companies. These long-standing relationships, cultivated over decades, have been the primary source for our past acquisitions and, we believe, will be a key driver of our future growth. We believe the value proposition we offer to potential sellers has made us a buyer of choice and has enabled us to largely avoid competitive auctions and instead negotiate directly with sellers at attractive valuations.
Our Regional Platforms
We currently operate across 17 U.S. states and in Vancouver, Canada through our three regional platforms: West; Central; and East. Each of our operating businesses has its own management team that, in turn, reports to a regional president who is responsible for overseeing the operating businesses, developing growth opportunities, implementing best practices and integrating acquired businesses. Acquisitions are an important element of our strategy, as we seek to enhance value through increased scale and cost savings within local markets.
| • | West Region: Our West region includes operations in Texas, the Mountain states of Utah, Colorado, Idaho and Wyoming and in Vancouver, Canada where we supply aggregates, ready-mixed concrete, asphalt paving mix and paving and related services. As of September 27, 2014, the West region controlled approximately 0.7 billion tons of proven and probable aggregates reserves and $363.9 million of hard assets. During the year ended December 28, 2013, approximately 47% of our revenue and approximately 25% of our Adjusted EBITDA, excluding corporate charges, were generated in the West region. In 2014, we continued to expand the West region, with significant growth in Texas through key acquisitions in Houston and the Permian Basin region of West Texas as well as the establishment of a new platform in Vancouver, Canada with our September acquisition of Mainland. |
| • | Central Region: Our Central region extends across the Midwestern United States, most notably in Kansas, Missouri, Nebraska, Iowa and Illinois, where we supply aggregates, cement, ready-mixed concrete, asphalt paving mix and paving and related services. As of September 27, 2014, the Central region controlled approximately 0.9 billion tons of proven and probable aggregates reserves, approximately 0.4 billion of which serve its cement business, and $529.8 million of hard assets. During the year ended December 28, 2013, approximately 36%, of our revenue and approximately 63% of our Adjusted EBITDA, excluding corporate charges, was generated in the Central region. |
111
Table of Contents
Our cement plant, commissioned in 2008, is a highly efficient, technologically advanced, integrated manufacturing and distribution system strategically located near Hannibal, Missouri, 100 miles north of St. Louis along the Mississippi River. We utilize an on-site solid and liquid waste fuel processing facility, which can reduce the plant’s fuel costs by up to 50% and is one of only 12 facilities in the United States with such capabilities. Our cement business primarily serves markets in Missouri, Iowa and Illinois.
| • | East Region: Our East region serves markets in Kentucky, South Carolina, North Carolina, Tennessee and Virginia, where we supply aggregates, asphalt paving mix and paving and related services. As of September 27, 2014, the East region controlled approximately 0.5 billion tons of proven and probable aggregates reserves and $157.8 million of hard assets. During the year ended December 28, 2013, approximately 17% of our revenue and approximately 12% of our Adjusted EBITDA, excluding corporate charges, was generated in the East region. |
Acquisition History
The following table lists acquisitions we have completed since August 2009:
| Company |
Date of Acquisition |
Region | ||
| Hamm |
August 25, 2009 | Central | ||
| Hinkle Contracting Company, LLC |
February 1, 2010 | East | ||
| Cornejo |
April 16, 2010 | Central | ||
| Elmo Greer & Sons, LLC |
April 20, 2010 | East | ||
| Continental Cement |
May 27, 2010 | Central | ||
| Harshman Construction L.L.C. and Harshman Farms, Inc. |
June 15, 2010 | Central | ||
| South Central Kentucky Limestone, LLC |
July 23, 2010 | East | ||
| Harper Contracting |
August 2, 2010 | West | ||
| Kilgore Pavement Maintenance, LLC and Kilgore Properties, LLC |
August 2, 2010 | West | ||
| Con-Agg of MO, L.L.C. |
September 15, 2010 | Central | ||
| Altaview Concrete |
September 15, 2010 | West | ||
| EnerCrest Products, Inc. |
September 28, 2010 | West | ||
| RK Hall |
November 30, 2010 | West | ||
| Triple C Concrete, Inc. |
January 14, 2011 | West | ||
| Elam Construction, Inc. |
March 31, 2011 | West | ||
| Bourbon Limestone Company |
May 27, 2011 | East | ||
| Fischer Quarries, L.L.C. |
May 27, 2011 | Central | ||
| B&B |
June 8, 2011 | West | ||
| Grand Junction Concrete Pipe, Inc. |
June 10, 2011 | West | ||
| Industrial Asphalt |
August 2, 2011 | West | ||
| Ramming Paving |
October 28, 2011 | West | ||
| Norris |
February 29, 2012 | Central | ||
| Kay & Kay |
October 5, 2012 | East | ||
| Sandco |
November 30, 2012 | West | ||
| Lafarge |
April 1, 2013 | Central | ||
| Westroc |
April 1, 2013 | West | ||
| Alleyton |
January 17, 2014 | West | ||
| Troy Vines |
March 31, 2014 | West | ||
| Buckhorn Materials |
June 9, 2014 | East | ||
| Canyon Redi-Mix |
July 29, 2014 | West | ||
| Mainland |
September 4, 2014 | West | ||
| Southwest Ready Mix |
September 19, 2014 | West | ||
| Colorado County S&G |
September 30, 2014 | West | ||
| Concrete Supply |
October 3, 2014 | Central |
112
Table of Contents
Our End Markets
Residential Construction. Residential construction includes single family houses and multi-family units such as apartments and condominiums. Demand for residential construction is influenced by employment prospects, new household formation and mortgage interest rates. In recent years, foreclosures have resulted in an oversupply of available houses, which had dampened the demand for new residential construction in many markets in the United States. However, employment prospects have improved, foreclosure rates have stabilized and demand has begun to grow, although the rate of growth is inconsistent across the United States.
Nonresidential Construction. Nonresidential construction encompasses all privately financed construction other than residential structures. Demand for nonresidential construction is driven by population and economic growth. Population growth spurs demand for stores, shopping centers and restaurants. Economic growth creates demand for projects such as hotels, office buildings, warehouses and factories. The supply of nonresidential construction projects is affected by interest rates and the availability of credit to finance these projects.
Public Infrastructure Construction. Public infrastructure construction includes spending by federal, state and local governments for highways, bridges, airports, schools, public buildings and other public infrastructure projects. Public infrastructure spending has historically been more stable than private sector construction. We believe that public infrastructure spending is less sensitive to interest rate changes and economic cycles and often is supported by multi-year federal and state legislation and programs. A significant portion of our revenue is derived from public infrastructure projects. As a result, the supply of federal and state funding for public infrastructure highway construction significantly affects our public infrastructure end-use business.
Historically, public infrastructure funding has been underpinned by a series of six-year federal highway authorization bills. Federal funds are allocated to the states, which are required to match a portion of the federal funds they receive. Federal highway spending uses funds predominantly from the Federal Highway Trust Fund, which derives its revenue from taxes on diesel fuel, gasoline and other user fees. The dependability of federal funding allows the state departments of transportation to plan for their long term highway construction and maintenance needs. On August 1, 2014, a Highway Trust Fund extension bill was enacted. The bill provides approximately $10.8 billion of funding, which is expected to last until May 2015.
Funding for the existing federal transportation funding program, MAP-21, expired on September 30, 2014, and any additional funding or successor programs have yet to be approved.
Our Competitive Strengths
Leading market positions. We believe each of our operating companies has a top three market share position in its local market area achieved through their respective, extensive operating histories, averaging over 35 years. We believe we are a top 10 supplier of aggregates, a top 25 producer of cement and a major producer of ready-mixed concrete and asphalt paving mix in the United States by volume. We focus on acquiring companies that have leading local market positions in aggregates, which we seek to enhance by building scale with other local aggregates and downstream products and services. The heavy-side construction materials industry is highly local in nature due to transportation costs from the high weight-to-value ratio of the products. Given this dynamic, we believe achieving local market scale provides a competitive advantage that drives growth and profitability for our business. We believe that our ability to prudently acquire, improve and rapidly integrate multiple businesses has enabled, and will continue to enable, us to become market leaders.
Operations positioned to benefit from attractive industry fundamentals. We believe the heavy-side construction materials industry has attractive fundamentals, characterized by high barriers to entry and a stable competitive environment in the majority of markets. Barriers to entry are created by scarcity of raw material resources, limited efficient distribution range, asset intensity of equipment, land required for quarry operations and a time-consuming and complex regulatory and permitting process. According to the April 2014 U.S. Geological Survey, aggregates pricing in the United States had increased in 65 of the previous 70 years, with
113
Table of Contents
growth accelerating since 2002 as continuing resource scarcity in the industry has led companies to focus increasingly on improved pricing strategies. While aggregates volumes decreased 19% from 2.6 billion tons in 2008 to 2.1 billion tons in 2013, average price per ton of aggregates in the United States during this same time period increased 4% from $8.57 in 2008 to $8.95 in 2013. Pricing growth remained strong in 2013, despite volume declines in certain key end markets. Consistent with these market trends, our average aggregates and cement pricing increased 3% and 5%, respectively, from average prices for the year ended December 31, 2010 as compared to average prices for the nine months ended September 27, 2014.
One significant factor that allows for pricing growth in periods of volume declines is that aggregates and asphalt paving mix have significant exposure to public road construction, which has demonstrated growth over the past 30 years, even during times of broader economic weakness. The majority of public road construction spending is funded at the state level through the states’ respective departments of transportation. The five key states in which we operate (Texas, Kansas, Kentucky, Missouri and Utah) have funds with constitutionally-protected revenue sources dedicated for transportation projects. These dedicated, earmarked funding sources limit the negative effect current state deficits may have on public spending. As a result, we believe our business exhibits significantly more stability in profitability than witnessed in most other building product subsectors. We believe these business characteristics have helped mitigate the impact of the challenging economic environment on our profitability. Profits in the heavy-side construction materials industry are relatively stable throughout various economic cycles compared to other businesses in the construction industry, aided by favorable pricing dynamics with historically stable public infrastructure spending.
Vertically-integrated business model. We generate revenue across a spectrum of related products and services. We internally supply over approximately 80% of the aggregates used in the ready-mixed concrete and asphalt paving mixes that we produce and the asphalt paving mix that our paving crews lay. Our vertically-integrated business model enables us to operate as a single source provider of materials and paving and related services, creating cost, convenience and reliability advantages for our customers, while at the same time creating significant cross-marketing opportunities among our interrelated businesses. We believe this creates opportunities to increase aggregates volumes and optimize margin at each stage of production, fosters more stable demand for aggregates through a captive demand outlet, creates a competitive advantage through the efficiency gains, convenience and reliability provided to customers and enhances our acquisition strategy by allowing a greater range of target companies.
Attractive diversity, scale and product portfolio. Our three regional platforms operate across 17 U.S. states and Vancouver, Canada in 27 metropolitan statistical areas. Between the year ended December 31, 2010 and the twelve months ended September 27, 2014, we grew our revenue by 173% and brought substantial additional scale and geographic diversity to our operations. A combination of increased scale and vertical integration enabled us to improve profitability with Adjusted EBITDA margins increasing 330 basis points from 2010 to the twelve months ended September 27, 2014. In the twelve months ended September 27, 2014, 85.2% of EBITDA was derived from materials and products, with 52.5% coming from materials and 32.7% from products, and the remaining 14.8% of EBITDA being derived from services. We have approximately 2.1 billion tons of proven and probable aggregates reserves serving our aggregates and cement business. Assuming production rates in future years are equal to those in 2013, we estimate that the useful life of the proven and probable reserves for our aggregates and cement businesses are over 55 years and 300 years, respectively.
We own a dry process cement plant that was commissioned in 2008. This large capacity plant has technologically advanced manufacturing capabilities and favorable environmental performance compared to older facilities within the industry that will require upgrades to comply with stringent EPA standards coming into effect in the near term. According to PCA forecasts, consumption of cement in the United States is expected to exceed production capacity by the year 2017, creating opportunities for existing cement plants. In addition, our plant is strategically located on the Mississippi River. The U.S. cement industry is regional in nature, with customers typically purchasing material from local sources due to transportation costs. According to the PCA 2014 United States Cement Industry Annual Yearbook, approximately 98% of cement sold in the United States
114
Table of Contents
was shipped to customers by truck in 2012. However, in 2013, as a result of our plant’s strategic location on the Mississippi River, we shipped approximately 15% of our cement sold by barge, which is generally more cost-effective than truck transport.
Proven ability to incorporate new acquisitions and grow businesses. Since July 2009, we have acquired 34 companies, successfully integrating the businesses into three regions through the implementation of operational improvements, industry-proven information technology systems, a comprehensive safety program and best in class management programs. A typical acquisition generally involves retaining the local management team of the acquired business, maintaining operational decisions at the local level and providing strategic insights and leadership directed by our President and Chief Executive Officer, a 30-year industry veteran. These acquisitions have helped us achieve significant revenue growth, from $405.3 million in 2010 to $916.2 million in 2013.
Experienced and proven leadership driving organic growth and acquisition strategy. Our management team, led by Tom Hill, our President and Chief Executive Officer, has a proven track record of creating value. In addition to Mr. Hill, our management team, including corporate and regional operations managers, corporate development, finance executives and other heavy side industry operators, has extensive experience in the industry. Our management team has a track record of executing and successfully integrating acquisitions in the sector. Mr. Hill and his team successfully executed a similar consolidation strategy at another company in the industry, where Mr. Hill led the integration of numerous acquisitions, taking the business from less than $0.3 billion to $7.4 billion in sales from 1992 to 2008 through 173 acquisitions worth approximately $6.3 billion in the aggregate.
Our Business Strategy
Capitalize on expected recovery in U.S. economy and construction markets. The residential and nonresidential markets are starting to show positive growth signs in varying degrees across our markets. The National Association of Home Builders forecasts total housing starts to accelerate to 1.46 million in the United States by 2016, representing a compounded annual growth rate of 16.4% from 2013 to 2016. The American Institute of Architects’ Consensus Construction Forecast projects nonresidential construction to grow 8.1% in 2015. We believe that we have sufficient exposure to the residential and nonresidential end markets to benefit from a potential recovery in all of our markets. In 2013, approximately 85% of our revenue was derived from Texas, Kansas, Kentucky, Missouri and Utah—five key states with attractive construction and growth stories. Across these states, DOT budgets grew a combined 12.9% from 2013 to 2014. Given the nation’s aging infrastructure and considering longstanding historical spending trends, we expect U.S. infrastructure investment to grow over time. We believe we are well positioned to capitalize on any such increase in investment.
Of our markets, Texas is currently experiencing the most active growth. According to the PCA’s October 2014 Regional Construction InVue, total construction spending in Texas increased 20.5% from September 2013 to September 2014 and public construction and nonresidential spending increased 8.2% and 22.6%, respectively, over this same period. We are capitalizing on the growth in the Texas market by significantly increasing our investment there through acquisitions in Houston and the Permian Basin region of west Texas in 2014.
Expand local positions in the most attractive markets through targeted capital investments and bolt-on acquisitions. We plan to expand our business through organic growth and bolt-on acquisitions in each of our local markets. Our acquisition strategy involves acquiring platforms that serve as the foundation for continued incremental and complementary growth via locally situated bolt-on acquisitions to these platforms. We believe that increased local market scale will drive profitable growth. Our existing platform of operations is expected to enable us to grow significantly as we expand in our existing markets. We believe that our balance sheet and liquidity position will support our growth strategy.
Drive profitable growth through strategic acquisitions. Our goal is to become a top-five U.S. heavy-side construction materials company through the successful execution of our acquisition strategy and implementation of best practices to drive organic growth. Based on aggregates sales, in volumes, we believe that we are currently
115
Table of Contents
a top-ten player, which we achieved within five years of our first acquisition. We believe that the relative fragmentation of our industry creates an environment in which we can continue to acquire companies at attractive valuations and increase scale and diversity over time through strategic acquisitions in markets adjacent to our existing markets within the states where we currently operate, as well as into additional states as market and competitive conditions support further growth.
Enhance margins and free cash flow generation through implementation of operational improvements. Our management team includes individuals with decades of experience in our industry and proven success in integrating acquired businesses and organically growing operations. This experience represents a significant source of value to us that has driven Adjusted EBITDA margins up 330 basis points from 2010 to the twelve months ended September 27, 2014. These margin improvements are accomplished through proven profit optimization plans, leveraging information technology and financial systems to control costs, managing working capital, achieving scale-driven purchasing synergies and fixed overhead control and reduction. Our regional presidents, supported by our central operations, risk management and finance and information technology teams, drive the implementation of detailed and thorough profit optimization plans for each acquisition post close, which typically includes, among other things, implementation of a systematic pricing strategy and an equipment utilization analysis that assesses repair and maintenance spending, the health of each piece of equipment and a utilization review to ensure we are maximizing productivity and selling any pieces of equipment that are not needed in the business.
Leverage vertically-integrated and strategically located operations for growth. We believe that our vertical integration of heavy-side construction materials, products and services is a significant competitive advantage that we will leverage to grow share in our existing markets and enter into new markets. A significant portion of materials used to produce our products and provide services to our customers is internally supplied, which enables us to operate as a single source provider of materials, products and paving and related services, creating cost, convenience and reliability advantages for our customers and enabling us to capture additional value throughout the supply chain, while at the same time creating significant cross-marketing opportunities among our interrelated businesses.
Our Industry
The U.S. heavy-side construction materials industry is composed of four primary sectors: aggregates; cement; ready-mixed concrete; and asphalt paving mix. Each of these materials is widely used in most forms of construction activity. Participants in these sectors typically range from small, privately-held companies focused on a single material, product or market to multinational corporations that offer a wide array of construction materials and construction services. Competition is constrained in part by the distance materials can be transported efficiently, resulting in predominantly local or regional operations. Due to the lack of product differentiation, competition for all of our products is predominantly based on price and, to a lesser extent, quality of products and service. As a result, the prices we charge our customers are not likely to be materially different from the prices charged by other producers in the same markets. Accordingly, our profitability is generally dependent on the level of demand for our products and our ability to control operating costs.
Transportation infrastructure projects, driven by both state and federal funding programs, represent a significant share of the U.S. heavy-side construction materials market. In addition to federal funding, highway construction and maintenance funding is also available through state, county and local agencies. Our five largest states by revenue (Texas, Kansas, Kentucky, Missouri and Utah, which represented approximately 25%, 20%, 17%, 12% and 11%, respectively, of our total revenue in 2013) each have funds whose revenue sources are constitutionally protected and may only be spent on transportation projects:
| • | Texas Department of Transportation’s budget from 2014 to 2016 is $25.3 billion. |
| • | Kansas has a 10 year $8.2 billion highway bill that was passed in May 2010. |
116
Table of Contents
| • | Kentucky’s biennial highway construction plan has funding of $3.6 billion from July 2014 to June 2016. |
| • | Missouri has an estimated $0.7 billion in annual construction funding committed to essential road and bridge programs through 2017. |
| • | Utah’s transportation investment fund had $3.0 billion committed through 2018. |
Demand for our products is observed to have low elasticity in relation to prices. We believe this is partially explained by the absence of competitive replacement products and relatively low contribution of our products to total construction costs. We do not believe that increases in our products’ prices are likely to affect the decision to undertake a construction project since these costs usually represent a small portion of total construction costs.
Aggregates
Aggregates are key material components used in the production of cement, ready-mixed concrete and asphalt paving mixes for the residential, nonresidential and public infrastructure markets and are also widely used for various applications and products, such as road and building foundations, railroad ballast, erosion control, filtration, roofing granules and in solutions for snow and ice control. Generally extracted from the earth using surface or underground mining methods, aggregates are produced from natural deposits of various materials such as limestone, sand and gravel, granite and trap rock. Once extracted, processed and graded, aggregates are supplied directly to their end use or incorporated for further processing into construction materials and products, such as cement, ready-mixed concrete and asphalt paving mix.
According to the March 2014 U.S. Geological Survey, approximately 1.3 billion tons of crushed stone with a value of approximately $11.9 billion was produced in the United States in 2013, in line with the 1.3 billion tons produced in 2012. Sand and gravel production was approximately 935 million tons in 2013 valued at approximately $6.7 billion, up from 899 million tons produced in 2012. The U.S. aggregate industry is highly fragmented relative to other building product markets, with numerous participants operating in localized markets and the top ten players controlling approximately 30% of the national market in 2013. In February 2014, the U.S. Geological Survey reported that a total of 1,550 companies operating 4,000 quarries and 91 underground mines produced or sold crushed stone in 2013 in the United States.
Transportation costs are a major variable in determining aggregate pricing and marketing radius. The cost of transporting aggregate products from the plant to the market often equates to or exceeds the sale price of the product at the plant. As a result of the high transportation costs and the large quantities of bulk material that have to be shipped, finished products are typically marketed locally. High transportation costs are responsible for the wide dispersion of production sites. Where possible, heavy-side construction material producers maintain operations adjacent to highly populated areas to reduce transportation costs and enhance margins. However, more recently, rising land values combined with local environmental concerns have been forcing production sites to move further away from the end-use locations.
117
Table of Contents
We believe that the long-term growth of the market for aggregates is predominantly driven by growth in population, employment and households, which in turn affects demand for nonresidential construction, including stores, shopping centers and restaurants and increases transportation infrastructure spending. In recent years, the recession and subsequent slow recovery in the United States has led to a decrease in overall private and public infrastructure construction activity. While short-term demand for aggregates fluctuates with economic cycles, the declines have historically been followed by strong recovery, with each peak establishing a new historical high. In addition, according to the U.S. Geological Survey, during periods of economic decline in which aggregates volumes sold has decreased, prices have historically continued to grow, as illustrated in the following table:
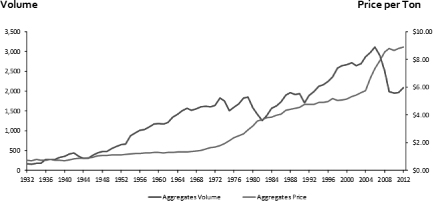
A significant portion of annual demand for aggregates is derived from large public infrastructure and highway construction projects. According to the Montana Contractors’ Association, approximately 38,000 tons of aggregate are required to construct a one mile stretch of a typical four-lane interstate highway. Highways located in markets with significant seasonal temperature variances are particularly vulnerable to freeze-thaw conditions that exert excessive stress on pavement and lead to more rapid surface degradation. Surface maintenance repairs, as well as general highway construction, occur in the warmer months, resulting in a majority of aggregates production and sales in the period from April through November in most states.
Cement
Portland cement, an industry term for the common cement in general use around the world, is made from a combination of limestone, shale, clay, silica and iron ore. It is a fundamental building material consumed in several stages throughout the construction cycle of residential, nonresidential and public infrastructure projects. It is a binding agent that, when mixed with sand or aggregates and water, produces either ready-mixed concrete or mortar and is an important component of other essential construction materials. Cement is sold either in bulk or in bags as branded products, depending on its final user. Few construction projects can take place without utilizing cement somewhere in the design, making it a key ingredient used in the construction industry. The majority of all cement shipments are sent to ready-mixed concrete operators. The remaining shipments are directed to manufacturers of concrete related products such as block and precast. Nearly two-thirds of U.S. consumption occurs between May and November, coinciding with end-market construction activity.
The principal raw materials in cement are a blend of approximately 80% limestone and approximately 5% shale, with the remaining raw materials being clay and iron ore. Generally, the limestone and shale are mined from quarries located on site with the production plant. These core ingredients are blended and crushed into a fine grind and then preheated and ultimately introduced into a kiln heated to about 3,000°F. Under this extreme heat, a chemical transformation occurs uniting the elements to form a new substance with new physical and chemical characteristics. This new substance is called clinker and it is formed into pieces about the size of marbles. The clinker is then cooled and later ground into a fine powder that then is classified as Portland cement.
Cement production in the United States is distributed among 98 production facilities located across 34 states. It is a capital-intensive business with variable costs dominated by raw materials and energy required to
118
Table of Contents
fuel the kiln. Building new plants is challenging given the extensive permitting that is required and significant costs. We estimate new plant construction costs in the United States to be approximately $250-300 per ton, not including costs for property or securing raw materials and the required distribution network. Assuming construction costs of $275 per ton, a 1.25 million ton facility, comparable to our cement plant’s potential annual capacity, would cost approximately $343.8 million to construct.
As reported by the PCA in the 2014 United States Cement Industry Annual Yearbook, consumption is down significantly from the industry peak of approximately 141.1 million tons in 2005 to approximately 90.3 million tons in 2013 because of the decline in U.S. construction activity. U.S. cement consumption has at times outpaced domestic production capacity with the shortfall being supplied with imports, primarily from China, Canada, Greece, Mexico and South Korea. The PCA reports that cement imports have declined since their peak of approximately 39.6 million tons in 2006 to approximately 8.0 million tons in 2013, in a manner indicative of the industry’s general response to the current demand downturn. In addition to the reduction in imports, U.S. excess capacity increased from 5% in 2006 to approximately 32% in 2013 according to the PCA. Our cement plant operated above the industry mean at 86% capacity utilization in 2013 as its markets did not suffer the pronounced demand declines seen in states like Florida, California and Arizona.
On December 20, 2012, the EPA signed the PC-MACT, which in most instances requires compliance in 2015. The PCA had estimated that 18 plants could be forced to close due to the inability to meet PC-MACT standards or because the compliance investment required may not be justified on a financial basis. Our cement plant utilizes alternative fuel (hazardous and non-hazardous) as well as coal, natural gas and petroleum coke and, as a result, is subject to the Hazardous Waste Combustor NESHAP (“HWC-MACT”) standards, rather than PC-MACT standards. Any future costs to comply with the existing HWC-MACT standards are not expected to be material.
Ready-Mixed Concrete
Ready-mixed concrete is one of the most versatile and widely used materials in construction today. Its flexible recipe characteristics allow for an end product that can assume almost any color, shape, texture and strength to meet the many requirements of end users that range from bridges, foundations, skyscrapers, pavements, dams, houses, parking garages, water treatment facilities, airports, tunnels, power plants, hospitals and schools. The versatility of ready-mixed concrete gives engineers significant flexibility when designing these projects.
Cement, coarse aggregate, fine aggregate, water and admixtures are the primary ingredients that constitute a basic ready-mixed concrete. The cement and water are combined and a chemical reaction is produced called hydration. This paste or binder represents between 15 to 20% of the volume of the mix that coats each particle of aggregate and serves as the agent that binds the aggregates together, according to the NRMCA. The aggregates represent 60 to 75% of the mix by volume, with a small portion of volume (5 to 8%) consisting of entrapped air that is generated by using air entraining admixtures. Once fully hydrated, the workable concrete will then harden and take on the shape of the form in which it was placed.
The quality of a concrete mix is generally determined by the weight ratio of water to cement. Higher quality concrete is produced by lowering the water-cement ratio as much as possible without sacrificing the workability of the fresh concrete. Specialty admixtures such as high range water reducers can aid in achieving this condition without sacrificing quality.
Other materials commonly used in the production of ready-mixed concrete include fly-ash, a waste by-product from coal burning power plants, silica fume, a waste by-product generated from the manufacture of silicon and ferro-silicon metals, and ground granulated blast furnace slag, a by-product of the iron and steel manufacturing process. All of these products have cemetitious properties that enhance the strength, durability and permeability of the concrete. These materials are available directly from the producer or via specialist distributors who intermediate between the ready-mixed concrete producers and the users.
119
Table of Contents
Given the high weight-to-value ratio, delivery of ready-mixed concrete is typically limited to a one-hour haul from a production plant location and is further limited by a 90 minute window in which newly-mixed concrete must be poured to maintain quality and performance. As a result of the transportation constraints, the ready-mixed concrete market is highly localized, with an estimated 5,500 ready-mixed concrete plants in the United States according to the NRMCA. According to the NRMCA, 300.9 million cubic yards of ready-mixed concrete was produced in 2013, which is a 4% increase from the 289.8 million cubic yards produced in 2012 but a 34% decrease from the industry peak of 458.3 million cubic yards in 2005.
Asphalt Paving Mix
Asphalt paving mix is the most common roadway material used today. It is a versatile and essential building material that has been used to surface 93% of the more than 2.6 million miles of paved roadways in the United States, according to NAPA.
Typically, asphalt paving mix is placed in three distinct layers to create a flexible pavement structure. These layers consist of a base course, an intermediate or binder course, and a surface or wearing course. These layers vary in thicknesses of three to six inches for base mix, two to four inches for intermediate mix and one to two inches for surface mix.
According to NAPA, the components of asphalt paving mix by weight are approximately 95% aggregates and 5% asphalt cement, a petroleum based product that serves as the binder. The ingredients are then metered, mixed and heated to a temperature in excess of 300° F before being placed in a truck and delivered to the jobsite for final placement.
Asphalt pavement is generally 100% recyclable and reusable and is the most reused and recycled pavement material in the United States. Reclaimed asphalt pavement can be incorporated into new pavement at replacement rates in excess of 30% depending upon the mix and the application of the product. We actively engage in the recycling of previously used asphalt pavement and concrete. This material is crushed and repurposed in the construction cycle. Approximately 68.3 million tons of used asphalt is recycled annually by the industry according to a December 2013 National Asphalt Pavement Association survey.
The use of warm mix asphalt (“WMA”) or “green” asphalt is gaining popularity. The immediate benefit to producing WMA is the reduction in energy consumption required by burning fuels to heat traditional hot mix asphalt (“HMA”) to temperatures in excess of 300°F at the production plant. These high production temperatures are needed to allow the asphalt binder to become viscous enough to completely coat the aggregate in the HMA, have good workability during laying and compaction, and durability during traffic exposure. According to the Federal Highway Administration, WMA can reduce the temperature by 50 to 70°F, resulting in lower emissions, fumes and odors generated at the plant and the paving site.
According to the National Asphalt Pavement Association, there are approximately 4,000 asphalt paving mix plants in the United States and an estimated 350.7 million tons of asphalt paving mix was produced in 2013 which was broadly in line with the estimated 360.3 million tons produced in 2012.
Our Operations
We operate our construction materials and products and paving and related services businesses through local operations and marketing teams, which work closely with our end customers to deliver the products and services that meet each customer’s specific needs for a project. We believe that this strong local presence gives us a competitive advantage by keeping our costs low and allowing us to obtain a unique understanding for the evolving needs of our customers.
We have operations in 17 U.S. states and in Vancouver, Canada. Our business in each region is vertically-integrated. We supply aggregates internally for the production of cement, ready-mixed concrete and asphalt
120
Table of Contents
paving mix, a significant portion of which is used internally by our paving and related services businesses. In the year ended December 28, 2013, approximately 73% of our aggregates production was sold directly to outside customers with the remaining amount being further processed by us and sold as a downstream product. In addition, we operate a municipal waste landfill and a construction and demolition debris landfill in our Central region and we have liquid asphalt terminal operations in our East region.
Approximately 83% of our asphalt paving mix products was installed by our paving and related services businesses in the year ended December 28, 2013. We charge a market price and competitive margin at each stage of the production process in order to optimize profitability across our operations. Our production value chain is illustrated as follows:
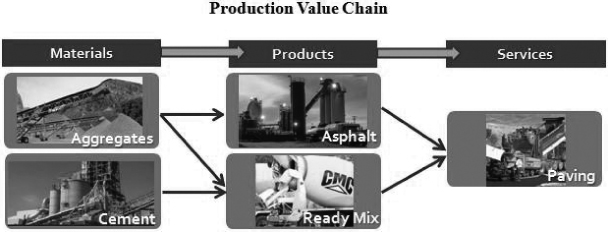
Construction Materials
We are a leading provider of heavy-side construction materials in the markets we serve. Our construction materials operations are composed of aggregates production, including crushed stone and construction sand and gravel, cement and ready-mixed concrete production and asphalt paving mix production.
Our Aggregates Operations
Aggregates Products
We mine limestone, gravel, and other natural resources from 84 crushed stone quarries and 49 sand and gravel deposits throughout the United States. Aggregates are produced mainly from blasting hard rock from quarries and then crushing and screening it to various sizes to meet our customers’ needs. The production of aggregates also involves the extraction of sand and gravel, which requires less crushing, but still requires screening for different sizes. Aggregate production utilizes capital intensive heavy equipment which includes the use of loaders, large haul trucks, crushers, screens and other heavy equipment at quarries.
Once extracted, the minerals are processed and/or crushed on site into crushed stone, concrete and masonry sand, specialized sand, pulverized lime or agricultural lime. The minerals are processed to meet customer specifications or to meet industry standard sizes. Crushed stone is used primarily in ready-mixed concrete, asphalt paving mix, and the construction of road base for highways.
Our extensive network of quarries, plants and facilities, located throughout our three regions, enables us to have a nearby operation to meet the needs of customers in each of our markets.
121
Table of Contents
Aggregates Reserves
Our September 27, 2014 estimate of 2.1 billion tons of proven and probable reserves of recoverable stone, and sand and gravel of suitable quality for economic extraction is based on drilling and studies by geologists and engineers, recognizing reasonable economic and operating restraints as to maximum depth of extraction and permit or other restrictions.
Reported proven and probable reserves include only quantities that are owned or under lease, and for which all required zoning and permitting have been obtained. Of the 2.1 billion tons of proven and probable aggregates reserves, 1.1 billion, or 51%, are located on owned land and 1.0 billion are located on leased land.
Aggregates Sales and Marketing
The cost of transportation from each quarry and the proximity of competitors are key factors that determine the effective market area for each quarry. Each quarry location is unique with regards to demand for each product, proximity to competition and distribution network. Each of our aggregates operations is responsible for the sale and marketing of its aggregates products. Approximately 73% of our aggregates production is sold directly to outside customers and the remaining amount is further processed by us and sold as a downstream product. Even though aggregates are a commodity product, we work to optimize pricing depending on the site location, availability of particular product, customer type, project type and haul cost. We sell aggregates to internal downstream operations at market prices.
Aggregates Competition
The U.S. aggregate industry is highly fragmented with numerous participants operating in localized markets. The February 2014 U.S. Geological Survey reported that a total of 1,550 companies operating 4,000 quarries and 91 underground mines produced or sold crushed stone in 2013 in the United States. This fragmentation is a result of the cost of transporting aggregates, which typically limits producers to a market area within approximately 40 miles of their production facilities.
The primary national players are large vertically-integrated companies, including Vulcan Materials Company, Martin Marietta Materials, Inc., CRH plc, Heidelberg, Lafarge North America Inc. and Cemex, S.A.B. de C.V., that have a combined estimated market share of approximately 30%.
Competitors by region include:
| • | West—CRH plc, Heidelberg Cement plc, Martin Marietta, CEMEX, S.A.B. de C.V., Lafarge and various local suppliers. |
| • | Central—Martin Marietta Materials, Inc., CRH plc, Holcim (US) Inc. and various local suppliers. |
| • | East—CRH plc, Heidelberg Cement plc, Vulcan Materials Company and various local suppliers. |
We believe we have a strong competitive advantage in aggregates through our well located reserves in key markets, high quality reserves and our logistic networks. We further share and implement best practices relating to safety, strategy, sales and marketing, production, and environmental and land management. As a result of our vertical integration and local market knowledge, we have a strong understanding of the needs of our aggregates customers. In addition, our companies have a reputation for responsible environmental stewardship and land restoration, which assists us in obtaining new permits and new reserves.
122
Table of Contents
Our Cement Operations
Cement Products
We operate a highly-efficient, technologically-advanced integrated cement manufacturing and distribution system located near Hannibal, Missouri, 100 miles north of St. Louis along the Mississippi River. We also operate an on-site waste fuel processing facility, which can reduce fuel costs for the plant by up to 50%. Our cement plant is one of only 12 with hazardous waste fuel facilities permitted and operating out of 98 total cement plants in the United States. Our cement plant’s potential capacity is 1.25 million tons per annum. Our cement plant is subject to the HWC-MACT standards. See “—Our Industry—Cement.”
Cement Markets
Cement is a product that is costly to transport. Consequently, the radius within which a typical cement plant in the Midwest is competitive extends for only up to 150 miles from any shipping/distribution point. Cement is distributed to local customers primarily by truck from our Hannibal plant and distribution terminals in St. Louis, Missouri and Bettendorf, Iowa. We also transport cement by inland waterway barges on the Mississippi River to our storage and distribution terminals. In 2013, approximately 15% of our cement sales were delivered by barge. Our location on the Mississippi River extends our market beyond the typical 150 miles, as barge transport is more cost effective than trucking or moving by rail. Our traditional markets include eastern Missouri, southeastern Iowa and central/northwestern Illinois.
Cement Sales and Marketing
Our cement customers are ready-mixed concrete and concrete products producers and contractors within our markets. Sales are made on the basis of competitive prices in each market and, as is customary in the industry, we do not typically enter into long-term sales contracts.
Cement Competition
Construction of cement production facilities is highly capital intensive and requires long lead times to complete engineering design, obtain regulatory permits, acquire equipment and construct a plant. Most U.S. cement producers are owned by large foreign companies operating in multiple international markets. Our largest competitors include Holcim (US) Inc., and Lafarge North America Inc., whose parent companies announced a merger plan in April 2014 that would create the world’s largest cement maker, in addition to Buzzi Unicem USA, Inc. and Eagle Materials Inc. Competitive factors include price, reliability of deliveries, location, quality of cement and support services. With a new cement plant, on-site raw material aggregate supply, a network of cement terminals, and longstanding customer relationships, we believe we are well positioned to serve our customers.
Our Ready-mixed Concrete Operations
Ready-mixed Concrete Products
We believe our West and Central regions are leaders in the supply of ready-mixed concrete in their respective markets. The West region has ready-mixed concrete operations in the Houston and Midland/Odessa, Texas, Salt Lake Valley, Utah, Twin Falls, Idaho and Grand Junction, Colorado markets. Our Central region supplies ready-mixed concrete to the Wichita, Kansas and Columbia, Missouri markets and surrounding areas. We produce ready-mixed concrete by blending aggregates, cement, chemical admixtures in various ratios and water at our concrete production plants and placing the resulting product in ready-mixed concrete trucks where it is then delivered to our customers.
Our aggregates business serves as the primary source of the raw materials for our concrete production, functioning essentially as a supplier to our ready-mixed concrete operations. Different types of concrete include
123
Table of Contents
lightweight concrete, high performance concrete, self-compacting/consolidating concrete and architectural concrete and are used in a variety of activities ranging from building construction to highway paving.
We operated 41 ready-mixed concrete plants and 391 concrete delivery trucks in the West region and 23 ready-mixed concrete plants and 232 concrete delivery trucks in the Central region as of October 3, 2014.
Ready-mixed Concrete Competition
Ready-mixed concrete production requires relatively small amounts of capital to build a concrete batching plant and acquire delivery trucks. As a result, in each local market, we face competition from numerous small producers, as well as other large vertically-integrated companies with facilities in multiple markets. There are approximately 5,500 ready-mixed concrete plants in the United States, and in 2013 the U.S. ready-mixed concrete industry produced approximately 300.9 million cubic yards of ready-mixed concrete according to the NRMCA.
Our ready-mixed concrete operations compete with CEMEX, S.A.B. de C.V. in Texas and CRH plc in Utah and Colorado and various other privately owned competitors in other parts of the West and Central regions.
Competition among ready-mixed concrete suppliers is generally based on product characteristics, delivery times, customer service and price. Product characteristics such as tensile strength, resistance to pressure, durability, set times, ease of placing, aesthetics, workability under various weather and construction conditions as well as environmental effect are the main criteria that our customers consider for selecting their product. Our quality assurance program produces results in excess of design strengths while optimizing material costs. Additionally, we believe our strategic network of locations and superior customer service gives us a competitive advantage relative to other producers.
Our Asphalt Paving Mix Operations
Asphalt Paving Mix Products
Our asphalt paving mix products are produced by first heating carefully measured amounts of aggregates at high temperatures to remove the moisture from the materials in an asphalt paving mix plant. As the aggregates are heated, liquid asphalt is then introduced to coat the aggregates. Depending on the specifications of a particular mix, recycled asphalt may be added to the mix, which lowers the production costs. The aggregates used for production of these products are generally supplied from our quarries or sand and gravel plants. The ingredients are metered, mixed and brought up to a temperature in excess of 300°F before being placed in a truck and delivered to the jobsite for final placement.
As of September 27, 2014, we operated 20 asphalt paving mix plants in the West region, five plants in the Central region and 14 plants in the East region. Approximately 95% of our plants can utilize recycled asphalt pavement.
Asphalt Paving Mix Sales and Marketing
Approximately 83% of the asphalt paving mix we produce is installed by our own paving crews. The rest is sold on a per ton basis to road contractors for the construction of roads, driveways and parking lots, as well as directly to state departments of transportation and local authorities.
Asphalt Paving Mix Competition
According to NAPA, there are approximately 4,000 asphalt paving mix plants in the United States and an estimated 350.7 million tons of asphalt paving mix was produced in 2013. Our asphalt paving mix operations compete with CRH plc and other local suppliers in each of our three regions. Based on availability of internal aggregate supply, quality, operating efficiencies, and location advantages, we believe we are well positioned vis-à-vis our competitors.
124
Table of Contents
Asphalt paving mix is generally applied at high temperatures. Prolonged exposure to air causes the mix to lose temperature and harden. Therefore, delivery is typically within close proximity to the asphalt paving mix plant. Local market demand, proximity to competition, transportation costs and supply of aggregates and liquid asphalt vary widely from market to market. Most of our asphalt operations use a combination of company-owned and hired haulers to deliver materials to job sites.
Asphalt Paving and Related Services
As part of our vertical integration strategy, we provide asphalt paving and related services to both the private and public infrastructure sectors as either a prime or sub-contractor. These services complement our heavy-side construction materials and products businesses by providing a reliable downstream outlet, in addition to our external distribution channels.
Our asphalt paving and related services businesses bid on both private construction and public infrastructure projects in their respective local markets. We only provide paving and related services operations as a complement to our heavy-side construction materials operation, which we believe is a major competitive strength. Factors affecting competitiveness in this business segment include price, estimating abilities, knowledge of local markets and conditions, project management, financial strength, reputation for quality and the availability of machinery and equipment.
Contracts with our customers are primarily fixed unit price or fixed price. Under fixed unit price contracts, we provide materials or services at fixed unit prices (for example, dollars per ton of asphalt placed). While the fixed unit price contract shifts the risk of estimating the quantity of units required for a particular project to the customer, any increase in our unit cost over the bid amount, whether due to inflation, inefficiency, errors in our estimates or other factors, is borne by us unless otherwise provided in the contract. Most of our contracts contain escalators for increases in liquid asphalt prices.
Customers
Our business is not dependent on any single customer or a few customers. Therefore, the loss of any single or particular small number of customers would not have a material adverse effect on any individual respective market in which we operate or on us as a whole. No individual customer accounted for more than 10% of our 2013 revenue.
Seasonality
Use and consumption of our products fluctuate due to seasonality. Nearly all of the products used by us, and by our customers, in the private construction or public infrastructure industries are used outdoors. Our highway operations and production and distribution facilities are also located outdoors. Therefore, seasonal changes and other weather-related conditions, in particular extended rainy and cold weather in the spring and fall and major weather events, such as hurricanes, tornadoes, tropical storms and heavy snows, can adversely affect our business and operations through a decline in both the use of our products and demand for our services. In addition, construction materials production and shipment levels follow activity in the construction industry, which typically occurs in the spring, summer and fall. Warmer and drier weather during the second and third quarters of our fiscal year typically result in higher activity and revenue levels during those quarters. The first quarter of our fiscal year has typically lower levels of activity due to weather conditions.
Backlog
Our products are generally delivered upon receipt of orders or requests from customers, or shortly thereafter. Accordingly, the backlog associated with product sales is converted into revenue within a relatively short period of time. Inventory for products is generally maintained in sufficient quantities to meet rapid delivery requirements of customers. A period over period increase or decrease of backlog does not necessarily result in an
125
Table of Contents
improvement or a deterioration of our business. Our backlog includes only those products and projects for which we have obtained a purchase order or a signed contract with the customer and does not include products purchased and sold or services awarded and provided within the period.
Our paving and related services backlog represents our estimate of revenue that will be realized under the applicable contracts. We generally include a project in backlog at the time it is awarded and funding is in place. Many of our paving and related services are awarded and completed within one year and therefore may not be reflected in our beginning or ending contract backlog. Historically, we have not been materially adversely affected by contract cancellations or modifications. However, in accordance with applicable contract terms, substantially all contracts in our backlog may be cancelled or modified by our customers.
As a vertically-integrated business, approximately 32% of our aggregates sales volume was further processed and sold as a downstream product, such as ready-mixed concrete or asphalt paving mix, or used in our paving and related services business, and approximately 80% of the asphalt paving mix we sold was installed by our own paving crews during the nine months ended September 27, 2014. The following table sets forth our backlog as of the indicated dates:
| (in thousands) | September 27, 2014 |
September 28, 2013 |
December 28, 2013 |
December 29, 2012 |
||||||||||||
| Aggregate (in tons) |
4,548 | 4,672 | 5,153 | 3,881 | ||||||||||||
| Ready-mixed concrete (in cubic yards) |
199 | 196 | 138 | 155 | ||||||||||||
| Asphalt (in tons) |
2,831 | 2,441 | 2,387 | 2,314 | ||||||||||||
| Paving and related services (1) |
$ | 395,465 | $ | 375,561 | $ | 359,263 | 288,673 | |||||||||
| (1) | The dollar value of the construction services backlog includes the value of the aggregate and asphalt tons and ready-mixed concrete cubic yards in backlog that are expected to be sourced internally. |
Intellectual Property
We do not own or have a license or other rights under any patents that are material to our business.
Employees
As of September 27, 2014 we had approximately 4,000 employees, of whom approximately 75% were hourly workers and the remainder were salaried employees. Because of the seasonal nature of our industry, many of our hourly and certain of our full time employees are subject to seasonal layoffs. The scope of layoffs varies greatly from season to season as they are predominantly a function of the type of projects in process and the weather during the late fall through early spring.
Approximately 6.9% of our hourly employees and approximately 0.4% of our full time salaried employees are union members. We believe we enjoy a satisfactory working relationship with our employees and their unions.
Properties
Our headquarters are located in a 16,653 square foot office space, which we lease in Denver, Colorado, under a lease expiring on August 31, 2017.
As of October 3, 2014, we also operated 133 quarries and sand deposits, 39 asphalt paving mix plants and 64 fixed and portable ready-mixed concrete plants and had 50 office locations.
126
Table of Contents
The following chart sets forth specifics of our production and distribution facilities as of October 3, 2014:
| Region |
Property |
Owned/ |
Aggregates |
Asphalt |
Ready |
Cement |
Landfill |
Other* | ||||||||
| West |
DeQueen, Arkansas | Leased | — | X | — | — | — | — | ||||||||
| West |
Kirby, Arkansas | Leased | Sandstone | — | — | — | — | — | ||||||||
| West |
Texarkana, Arkansas | Leased | — | X | — | — | — | — | ||||||||
| West |
Abbotsford, British Columbia | Owned | — | — | — | — | — | X | ||||||||
| West |
Abbotsford, British Columbia | Leased | Granite | — | — | — | — | — | ||||||||
| West |
Abbotsford, British Columbia | Leased | Granite | — | — | — | — | — | ||||||||
| West |
Richmond, British Columbia | Owned/Leased | — | — | — | — | — | X | ||||||||
| West |
Richmond, British Columbia | Leased | — | — | — | — | — | X | ||||||||
| West |
Surrey, British Columbia | Leased | — | — | — | — | — | X | ||||||||
| West |
Surrey, British Columbia | Leased | — | — | — | — | — | X | ||||||||
| West |
Langley, British Columbia | Leased | — | — | — | — | — | X | ||||||||
| West |
Clark, Colorado | Leased | Sand and Gravel | — | — | — | — | — | ||||||||
| West |
Craig, Colorado | Owned | Sand and Gravel | X | — | — | — | — | ||||||||
| West |
Craig, Colorado | Leased | Sand and Gravel | — | — | — | — | — | ||||||||
| West |
Craig, Colorado | Leased | Sand and Gravel | — | — | — | — | — | ||||||||
| West |
Delta, Colorado | Owned/Leased | Sand and Gravel | — | — | — | — | — | ||||||||
| West |
Delta, Colorado | Leased | Sand and Gravel | — | — | — | — | — | ||||||||
| West |
Durango, Colorado | Leased | Sand and Gravel | X | — | — | — | — | ||||||||
| West |
Durango, Colorado | Leased | Sand and Gravel | — | X | — | — | — | ||||||||
| West |
Eagle, Colorado | Leased | — | X | — | — | — | — | ||||||||
| West |
Fruita, Colorado | Leased | Sand and Gravel | — | — | — | — | — | ||||||||
| West |
Grand Junction, Colorado | Owned | Sand and Gravel | — | — | — | — | — | ||||||||
| West |
Grand Junction, Colorado | Owned | Sand and Gravel | — | — | — | — | — | ||||||||
| West |
Grand Junction, Colorado | Owned | — | X | — | — | — | — | ||||||||
| West |
Grand Junction, Colorado | Owned/Leased | Sand and Gravel | — | X | — | — | — | ||||||||
| West |
Grand Junction, Colorado | Leased | Sand and Gravel | — | — | — | — | — | ||||||||
| West |
Grand Junction, Colorado | Owned | — | — | X | — | — | — | ||||||||
| West |
Parachute, Colorado | Leased | Sand and Gravel | — | — | — | — | — | ||||||||
| West |
Parachute, Colorado | Leased | Sand and Gravel | — | — | — | — | — | ||||||||
| West |
Silverton, Colorado | Leased | — | — | X | — | — | — | ||||||||
| West |
Whitewater, Colorado | Leased | Sand and Gravel | — | — | — | — | — | ||||||||
| West |
Whitewater, Colorado | Owned/Leased | Sand and Gravel | — | — | — | — | — | ||||||||
| West |
Whitewater, Colorado | Leased | Sand and Gravel | — | — | — | — | — | ||||||||
| West |
Woody Creek, Colorado | Owned | Sand and Gravel | X | — | — | — | — | ||||||||
| Central |
Bettendorf, Iowa | Owned | — | — | — | X | — | — | ||||||||
| West |
Bliss, Idaho | Owned | Sand and Gravel | — | — | — | — | — | ||||||||
| West |
Burley, Idaho | Owned | Sand and Gravel | — | — | — | — | — | ||||||||
| West |
Jerome, Idaho | Owned | — | — | X | — | — | X | ||||||||
| West |
Rupert, Idaho | Owned | — | — | X | — | — | — | ||||||||
| West |
Rupert, Idaho | Leased | Sand and Gravel | — | — | — | — | — | ||||||||
| West |
Rupert, Idaho | Owned | Sand and Gravel | — | — | — | — | — | ||||||||
| West |
Rupert, Idaho | Owned | Sand and Gravel | — | — | — | — | — | ||||||||
| West |
Twin Falls, Idaho | Owned | — | — | X | — | — | X | ||||||||
| Central |
Andover, Kansas | Owned | — | — | X | — | — | — | ||||||||
| Central |
Chapman, Kansas | Leased | Limestone | — | — | — | — | — | ||||||||
| Central |
Cummings, Kansas | Leased | Limestone | — | — | — | — | — | ||||||||
| Central |
Derby, Kansas | Owned | — | — | — | — | — | X | ||||||||
| Central |
Easton, Kansas | Leased | Limestone | — | — | — | — | — | ||||||||
| Central |
El Dorado, Kansas | Leased | — | — | X | — | — | — | ||||||||
| Central |
El Dorado, Kansas | Owned | — | — | — | — | — | — | ||||||||
| Central |
Emporia, Kansas | Owned | — | — | X | — | — | — | ||||||||
| Central |
Eudora, Kansas | Owned | Limestone | X | — | — | — | — | ||||||||
| Central |
Eudora, Kansas | Leased | Limestone | — | — | — | — | — | ||||||||
| Central |
Eureka, Kansas | Owned | — | — | X | — | — | — | ||||||||
| Central |
Garnett, Kansas | Leased | — | — | X | — | — | — | ||||||||
| Central |
Grantville, Kansas | Leased | Limestone | — | — | — | — | — | ||||||||
| Central |
Herington, Kansas | Leased | Limestone | — | — | — | — | — | ||||||||
| Central |
Highland, Kansas | Leased | Limestone | — | — | — | — | — | ||||||||
| Central |
Holton, Kansas | Leased | Limestone | — | — | — | — | — | ||||||||
| Central |
Holton, Kansas | Owned | — | — | X | — | — | — | ||||||||
| Central |
Howard, Kansas | Owned | — | — | X | — | — | — | ||||||||
| Central |
Lawrence, Kansas | Owned | — | — | — | — | X | — | ||||||||
| Central |
Lawrence, Kansas | Owned | Limestone | — | — | — | — | — | ||||||||
| Central |
Lawrence, Kansas | Owned | Limestone | — | — | — | — | — | ||||||||
| Central |
Lawrence, Kansas | Leased | Limestone | — | — | — | — | — | ||||||||
| Central |
Leavenworth, Kansas | Leased | Limestone | — | — | — | — | — | ||||||||
| Central |
Linwood, Kansas | Owned | Limestone | — | — | — | — | — | ||||||||
| Central |
Moline, Kansas | Leased | Limestone | — | — | — | — | — | ||||||||
| Central |
New Strawn, Kansas | Owned | — | — | X | — | — | — | ||||||||
| Central |
Olsburg, Kansas | Leased | Limestone | — | — | — | — | — | ||||||||
| Central |
Onaga, Kansas | Leased | Limestone | — | — | — | — | — | ||||||||
| Central |
Osage City, Kansas | Leased | Limestone | — | — | — | — | — | ||||||||
| Central |
Osage City, Kansas | Owned | — | — | X | — | — | — | ||||||||
| Central |
Ottawa, Kansas | Owned | — | — | X | — | — | — | ||||||||
| Central |
Oxford, Kansas | Leased | Sand and Gravel | — | — | — | — | — | ||||||||
| Central |
Ozawkie, Kansas | Owned | — | — | X | — | — | — | ||||||||
| Central |
Perry, Kansas | Owned | — | — | — | — | — | X | ||||||||
| Central |
Perry, Kansas | Leased | Limestone | — | — | — | — | — |
127
Table of Contents
| Region |
Property |
Owned/ |
Aggregates |
Asphalt |
Ready |
Cement |
Landfill |
Other* | ||||||||
| Central |
Salina, Kansas | Leased | — | — | X | — | — | — | ||||||||
| Central |
Severy, Kansas | Leased | Limestone | — | — | — | — | — | ||||||||
| Central |
St. Joseph, Kansas | Owned | — | — | X | — | — | — | ||||||||
| Central |
St. Joseph, Kansas | Leased | — | — | — | — | — | X | ||||||||
| Central |
St. Mary’s, Kansas | Leased | Limestone | — | — | — | — | — | ||||||||
| Central |
Tonganoxie, Kansas | Leased | Limestone | — | — | — | — | — | ||||||||
| Central |
Topeka, Kansas | Leased | — | X | — | — | — | — | ||||||||
| Central |
Topeka, Kansas | Leased | — | — | X | — | — | — | ||||||||
| Central |
Topeka, Kansas | Leased | — | — | X | — | — | — | ||||||||
| Central |
Topeka, Kansas | Owned | — | — | — | — | — | X | ||||||||
| Central |
Topeka, Kansas | Leased | Sand and Gravel | — | — | — | — | — | ||||||||
| Central |
Topeka, Kansas | Owned | Sand and Gravel | — | — | — | — | — | ||||||||
| Central |
Troy, Kansas | Leased | Limestone | — | — | — | — | — | ||||||||
| Central |
Washington, Kansas | Leased | Limestone | — | — | — | — | — | ||||||||
| Central |
White City, Kansas | Leased | Limestone | — | — | — | — | — | ||||||||
| Central |
Wichita, Kansas | Owned | — | — | — | — | X | — | ||||||||
| Central |
Wichita, Kansas | Owned | — | — | — | — | X | — | ||||||||
| Central |
Wichita, Kansas | Owned | — | — | X | — | — | — | ||||||||
| Central |
Wichita, Kansas | Owned | — | — | X | — | — | — | ||||||||
| Central |
Wichita, Kansas | Owned | — | — | — | — | — | X | ||||||||
| Central |
Wichita, Kansas | Owned | — | — | — | — | — | — | ||||||||
| Central |
Wichita, Kansas | Owned | — | — | X | — | — | — | ||||||||
| Central |
Wichita, Kansas | Owned | — | — | — | — | — | X | ||||||||
| Central |
Wichita, Kansas | Owned | — | — | — | — | — | X | ||||||||
| Central |
Wichita, Kansas | Owned | — | — | — | — | — | X | ||||||||
| Central |
Wichita, Kansas | Owned | — | X | — | — | — | — | ||||||||
| Central |
Wichita, Kansas | Owned | — | X | — | — | — | — | ||||||||
| Central |
Wichita, Kansas | Owned | — | X | — | — | — | — | ||||||||
| Central |
Wichita, Kansas | Owned | Sand and Gravel | — | — | — | — | — | ||||||||
| Central |
Wichita, Kansas | Leased | Sand and Gravel | — | — | — | — | — | ||||||||
| Central |
Wichita, Kansas | Owned | Sand and Gravel | — | — | — | — | — | ||||||||
| Central |
Wichita, Kansas | Owned | — | — | — | — | — | X | ||||||||
| Central |
Wichita, Kansas | Owned | — | — | — | — | — | — | ||||||||
| Central |
Wichita, Kansas | Owned | — | — | — | — | — | — | ||||||||
| Central |
Wichita, Kansas | Owned | — | — | — | — | — | — | ||||||||
| Central |
Wichita, Kansas | Owned | Sand and Gravel | — | — | — | — | — | ||||||||
| Central |
Winchester, Kansas | Leased | Limestone | — | — | — | — | — | ||||||||
| Central |
Woodbine, Kansas | Leased | Limestone | — | — | — | — | — | ||||||||
| Central |
Woodbine, Kansas | Owned | Limestone | — | — | — | — | — | ||||||||
| East |
Avon, Kentucky | Leased | — | — | — | — | — | X | ||||||||
| East |
Beattyville, Kentucky | Leased | Limestone | X | — | — | — | — | ||||||||
| East |
Bethelridge, Kentucky | Owned | Limestone | X | — | — | — | — | ||||||||
| East |
Burnside, Kentucky | Owned/Leased | Limestone | X | — | — | — | — | ||||||||
| East |
Carrollton, Kentucky | Leased | — | X | — | — | — | — | ||||||||
| East |
Carrollton, Kentucky | Leased | — | — | — | — | — | X | ||||||||
| East |
Carrollton, Kentucky | Owned | — | — | — | — | — | X | ||||||||
| East |
Cave City, Kentucky | Owned | Limestone | — | — | — | — | — | ||||||||
| East |
Cave City, Kentucky | Owned | Limestone | — | — | — | — | — | ||||||||
| East |
Crestwood, Kentucky | Leased | — | X | — | — | — | — | ||||||||
| East |
Flat Lick, Kentucky | Owned | — | X | — | — | — | — | ||||||||
| East |
Glasgow, Kentucky | Leased | — | — | — | — | — | X | ||||||||
| East |
Glasgow, Kentucky | Leased | Limestone | — | — | — | — | — | ||||||||
| East |
Glasgow, Kentucky | Leased | Limestone | — | — | — | — | — | ||||||||
| East |
Horsecave, Kentucky | Owned/Leased | Limestone | — | — | — | — | — | ||||||||
| East |
Jackson, Kentucky | Owned | — | X | — | — | — | — | ||||||||
| East |
Knob Lick, Kentucky | Owned | Limestone | — | — | — | — | X | ||||||||
| East |
Magnolia, Kentucky | Owned | Sand and Gravel | — | — | — | — | — | ||||||||
| East |
Middlesboro, Kentucky | Owned | — | X | — | — | — | — | ||||||||
| East |
Monticello, Kentucky | Owned | Limestone | — | — | — | — | — | ||||||||
| East |
Morehead, Kentucky | Leased | — | X | — | — | — | X | ||||||||
| East |
Paris, Kentucky | Owned | — | — | — | — | — | X | ||||||||
| East |
Paris, Kentucky | Leased/Owned | Limestone | X | — | — | — | X | ||||||||
| East |
Pineville, Kentucky | Leased | Limestone | — | — | — | — | — | ||||||||
| East |
Ravenna, Kentucky | Leased | Limestone | X | — | — | — | — | ||||||||
| East |
Richmond, Kentucky | Owned | — | — | — | — | — | X | ||||||||
| East |
Scottsville, Kentucky | Leased | Limestone | — | — | — | — | — | ||||||||
| East |
Somerset, Kentucky | Leased | Limestone | — | — | — | — | — | ||||||||
| East |
Somerset, Kentucky | Owned/Leased | Limestone | X | — | — | — | X | ||||||||
| East |
Stanton, Kentucky | Owned/Leased | Limestone | X | — | — | — | — | ||||||||
| East |
Tompkinsville, Kentucky | Leased | Limestone | — | — | — | — | — | ||||||||
| East |
West Liberty, Kentucky | Owned | Limestone | X | — | — | — | — | ||||||||
| Central |
Amazonia, Missouri | Owned | Limestone | — | — | — | — | — | ||||||||
| Central |
Barnard, Missouri | Leased | Limestone | — | — | — | — | — | ||||||||
| Central |
Bethany, Missouri | Leased | Limestone | — | — | — | — | — | ||||||||
| Central |
Blythedale, Missouri | Leased | Limestone | — | — | — | — | — | ||||||||
| Central |
Cameron, Missouri | Owned | — | — | — | — | — | X | ||||||||
| Central |
Chesterfield, Missouri | Leased | — | — | — | X | — | — | ||||||||
| Central |
Columbia, Missouri | Leased | Limestone | — | — | — | — | — | ||||||||
| Central |
Columbia, Missouri | Owned | Limestone | — | X | — | — | — | ||||||||
| Central |
Columbia, Missouri | Owned | — | — | — | — | — | X | ||||||||
| Central |
Columbia, Missouri | Owned | — | — | — | — | — | — | ||||||||
| Central |
Columbia, Missouri | Owned | — | — | X | — | — | — | ||||||||
| Central |
Columbia, Missouri | Owned | — | — | X | — | — | — |
128
Table of Contents
| Region |
Property |
Owned/ |
Aggregates |
Asphalt |
Ready |
Cement |
Landfill |
Other* | ||||||||
| Central |
Columbia, Missouri | Owned | — | — | X | — | — | — | ||||||||
| Central |
Columbia, Missouri | Leased | Limestone | — | — | — | — | — | ||||||||
| Central |
Cowgil, Missouri | Leased | Limestone | — | — | — | — | — | ||||||||
| Central |
Dawn, Missouri | Leased | Limestone | — | — | — | — | — | ||||||||
| Central |
Edinburg, Missouri | Leased | Limestone | — | — | — | — | — | ||||||||
| Central |
Gallatin, Missouri | Leased | Limestone | — | — | — | — | — | ||||||||
| Central |
Hannibal, Missouri | Owned | Limestone | — | — | X | — | X | ||||||||
| Central |
Huntsville, Missouri | Owned/Leased | Limestone | — | — | — | — | — | ||||||||
| Central |
Maitland, Missouri | Owned/Leased | Limestone | — | — | — | — | — | ||||||||
| Central |
Mercer, Missouri | Leased | Limestone | — | — | — | — | — | ||||||||
| Central |
Moberly, Missouri | Owned | — | — | X | — | — | — | ||||||||
| Central |
Oregon, Missouri | Leased | Limestone | — | — | — | — | — | ||||||||
| Central |
Owensville, Missouri | Owned | Clay | — | — | X | — | — | ||||||||
| Central |
Pattonsburg, Missouri | Leased | Limestone | — | — | — | — | — | ||||||||
| Central |
Pattonsburg, Missouri | Leased | Limestone | — | — | — | — | — | ||||||||
| Central |
Princeton, Missouri | Leased | Limestone | — | — | — | — | — | ||||||||
| Central |
Ravenwood, Missouri | Leased | Limestone | — | — | — | — | — | ||||||||
| Central |
Savannah, Missouri | Owned/Leased | Limestone | — | — | — | — | — | ||||||||
| Central |
Savannah, Missouri | Leased | — | — | — | — | — | X | ||||||||
| Central |
Sedalia, Missouri | Leased | Limestone | — | — | — | — | — | ||||||||
| Central |
St. Louis, Missouri | Owned | — | — | — | X | — | — | ||||||||
| Central |
Stet, Missouri | Leased | Limestone | — | — | — | — | — | ||||||||
| Central |
Trenton, Missouri | Leased | Limestone | — | — | — | — | — | ||||||||
| Central |
Pawnee City, Nebraska | Leased | Limestone | — | — | — | — | — | ||||||||
| West |
Sawyer, Oklahoma | Owned/Leased | Sandstone | — | — | — | — | — | ||||||||
| East |
Jefferson, South Carolina | Leased | Granite | — | — | — | — | — | ||||||||
| East |
Mt. Croghan, South Carolina | Leased | Sand and Gravel | — | — | — | — | — | ||||||||
| East |
Jellico, Tennessee | Leased | Limestone | — | — | — | — | — | ||||||||
| West |
Altair, Texas | Leased | Sand and Gravel | — | — | — | — | — | ||||||||
| West |
Amarillo, Texas | Leased | — | X | — | — | — | — | ||||||||
| West |
Austin, Texas | Leased | — | — | — | — | — | X | ||||||||
| West |
Austin, Texas | Leased | — | — | — | — | — | — | ||||||||
| West |
Big Springs, Texas | Owned | — | — | X | — | — | — | ||||||||
| West |
Brookshire, Texas | Owned | — | — | X | — | — | — | ||||||||
| West |
Buda, Texas | Leased | Limestone | — | — | — | — | X | ||||||||
| West |
Buda, Texas | Leased | — | X | — | — | — | — | ||||||||
| West |
Buda, Texas | Owned | — | X | — | — | — | — | ||||||||
| West |
Columbus, Texas | Leased | Sand and Gravel | — | — | — | — | — | ||||||||
| West |
Columbus, Texas | Leased | Sand and Gravel | — | — | — | — | — | ||||||||
| West |
Columbus, Texas | Leased | — | — | — | — | — | X | ||||||||
| West |
Crane, Texas | Owned | — | — | X | — | — | — | ||||||||
| West |
Cypress, Texas | Owned | — | — | X | — | — | — | ||||||||
| West |
Denison, Texas | Owned | — | X | — | — | — | — | ||||||||
| West |
Denison, Texas | Owned | — | — | — | — | — | X | ||||||||
| West |
Eagle Lake, Texas | Leased | Sand and Gravel | — | — | — | — | — | ||||||||
| West |
Eagle Lake, Texas | Leased | Sand and Gravel | — | — | — | — | — | ||||||||
| West |
Eagle Lake, Texas | Owned | Sand and Gravel | — | — | — | — | — | ||||||||
| West |
Edna, Texas | Owned | — | — | — | — | — | X | ||||||||
| West |
El Campo, Texas | Owned | — | — | — | — | — | X | ||||||||
| West |
Florence, Texas | Owned | Limestone | — | — | — | — | — | ||||||||
| West |
Florence, Texas | Owned | — | X | — | — | — | — | ||||||||
| West |
Garwood, Texas | Leased | Sand and Gravel | — | — | — | — | — | ||||||||
| West |
Gonzales, Texas | Leased | — | — | — | — | — | X | ||||||||
| West |
Greenville, Texas | Owned | — | X | — | — | — | — | ||||||||
| West |
Greenville, Texas | Owned | — | X | — | — | — | — | ||||||||
| West |
Greenwood, Texas | Leased | Limestone | — | — | — | — | X | ||||||||
| West |
Guthrie, Texas | Leased | — | X | — | — | — | — | ||||||||
| West |
Hartley, Texas | Leased | — | X | — | — | — | — | ||||||||
| West |
Holiday, Texas | Leased | — | — | — | — | — | X | ||||||||
| West |
Houston, Texas | Owned | — | — | X | — | — | — | ||||||||
| West |
Houston, Texas | Owned | — | — | X | — | — | — | ||||||||
| West |
Katy, Texas | Owned | — | — | X | — | — | — | ||||||||
| West |
Manvel, Texas | Owned | — | — | X | — | — | — | ||||||||
| West |
Midland, Texas | Owned | — | — | X | — | — | — | ||||||||
| West |
Midland, Texas | Owned | — | — | X | — | — | — | ||||||||
| West |
Monahans, Texas | Owned | — | — | X | — | — | — | ||||||||
| West |
Monahans, Texas | Owned | — | — | X | — | — | — | ||||||||
| West |
Mount Pleasant, Texas | Leased | — | X | — | — | — | — | ||||||||
| West |
Mustang Ridge, Texas | Owned | — | X | — | — | — | — | ||||||||
| West |
Odessa, Texas | Owned | — | — | X | — | — | — | ||||||||
| West |
Odessa, Texas | Owned | — | — | X | — | — | — | ||||||||
| West |
Paris, Texas | Leased | — | — | — | — | — | X | ||||||||
| West |
Paris, Texas | Owned | — | — | — | — | — | X | ||||||||
| West |
Paris, Texas | Owned | — | X | — | — | — | — | ||||||||
| West |
Pecos, Texas | Leased | — | — | X | — | — | — | ||||||||
| West |
Pyote, Texas | Owned | Sand and Gravel | — | — | — | — | X | ||||||||
| West |
Richmond, Texas | Leased | — | — | — | — | — | X | ||||||||
| West |
Richmond, Texas | Owned | — | — | X | — | — | — | ||||||||
| West |
Rosenberg, Texas | Owned | — | — | X | — | — | — | ||||||||
| West |
Sulphur Springs, Texas | Owned | — | — | — | — | — | X | ||||||||
| West |
Texarkana, Texas | Leased | — | — | — | — | — | X | ||||||||
| West |
Victoria, Texas | Owned | — | — | — | — | — | X | ||||||||
| West |
Waller, Texas | Owned | — | — | X | — | — | — |
129
Table of Contents
| Region |
Property |
Owned/ |
Aggregates |
Asphalt |
Ready |
Cement |
Landfill |
Other* | ||||||||
| West |
American Fork, Utah | Owned | — | — | X | — | — | — | ||||||||
| West |
Aurora, Utah | Owned | — | — | X | — | — | — | ||||||||
| West |
Bluffdale, Utah | Owned | Sand and Gravel | — | X | — | — | — | ||||||||
| West |
Highland, Utah | Leased | Sand and Gravel | — | X | — | — | — | ||||||||
| West |
Manti, Utah | Owned | — | — | X | — | — | — | ||||||||
| West |
Midvale, Utah | Owned | — | — | X | — | — | — | ||||||||
| West |
Mona, Utah | Leased | Sand and Gravel | — | X | — | — | — | ||||||||
| West |
Mona, Utah | Owned | Sand and Gravel | — | — | — | — | — | ||||||||
| West |
Mount Pleasant, Utah | Owned | — | — | X | — | — | — | ||||||||
| West |
Parley’s Canyon, Utah | Leased | Limestone | — | — | — | — | — | ||||||||
| West |
Salt Lake City, Utah | Owned | — | — | X | — | — | — | ||||||||
| West |
Sandy, Utah | Owned | — | — | — | — | — | X | ||||||||
| West |
Springville, Utah | Owned | — | — | X | — | — | — | ||||||||
| West |
Stockton, Utah | Owned | Sand and Gravel | — | — | — | — | — | ||||||||
| West |
Tooele, Utah | Leased | Sand and Gravel | — | — | — | — | — | ||||||||
| West |
Tooele, Utah | Owned | Sand and Gravel | — | — | — | — | — | ||||||||
| West |
West Haven, Utah | Owned | — | — | X | — | — | — | ||||||||
| West |
West Jordan, Utah | Owned | — | — | X | — | — | X | ||||||||
| West |
West Valley City, Utah | Leased | — | — | — | — | — | X | ||||||||
| West |
West Valley City, Utah | Owned | Sand and Gravel | X | X | — | — | — | ||||||||
| East |
Ewing, Virginia | Leased | Limestone | — | — | — | — | — | ||||||||
| West |
Big Piney, Wyoming | Leased | — | — | X | — | — | — | ||||||||
| West |
Evanston, Wyoming | Owned | — | — | X | — | — | — | ||||||||
| West |
Kemmerer, Wyoming | Leased | — | — | X | — | — | — |
| * | Other primarily consists of office space. |
Legal Proceedings
We are party to certain legal actions arising from the ordinary course of business activities. While the ultimate results of claims and litigation cannot be predicted with certainty, management expects that the ultimate resolution of all current pending or threatened claims and litigation will not have a material effect on our consolidated results of operations, financial position or liquidity.
Environmental and Government Regulation
We are subject to federal, state and local laws and regulations relating to the environment and to health and safety, including noise, discharges to air and water, waste management including the management of hazardous waste used as a fuel substitute at our Hannibal, Missouri cement kiln, remediation of contaminated sites, mine reclamation, operation and closure of landfills and dust control and to zoning, land use and permitting. Our failure to comply with such laws and regulations can result in sanctions such as fines or the cessation of part or all of our operations. From time to time, we may also be required to conduct investigation or remediation activities. There also can be no assurance that our compliance costs associated with such laws and regulations or activities will not be significant.
In addition, our operations require numerous governmental approvals and permits. Environmental operating permits are subject to modification, renewal and revocation and can require us to make capital, maintenance and operational expenditures to comply with the applicable requirements. Stricter laws and regulations, or more stringent interpretations of existing laws or regulations, may impose new liabilities on us, reduce operation hours, require additional investment by us in pollution control equipment or impede our opening new or expanding existing plants or facilities. We regularly monitor and review our operations, procedures and policies for compliance with existing environmental laws and regulations, changes in interpretations of existing laws and enforcement policies, new laws that are adopted, and new requirements that we anticipate will be adopted that could affect our operations.
Multiple permits are required for our operations, including those required to operate our cement plant. Applicable permits may include conditional use permits to allow us to operate in certain areas absent zoning approval and operational permits governing, among other matters, air and water emissions, dust, particulate matter and storm water management and control. In addition, we are often required to obtain bonding for future
130
Table of Contents
reclamation costs, most commonly specific to restorative grading and seeding of disturbed surface areas. As of September 27, 2014, we believe we were in substantial compliance with the permitting requirements that are material to the operation of our business.
Like others in our industry, we expend substantial amounts to comply with applicable environmental laws and regulations and permit limitations, which include amounts for pollution control equipment required to monitor and regulate emissions into the environment. Since many of these requirements are likely to be affected by future legislation or rule making by government agencies, and are therefore not quantifiable, it is not possible to accurately predict the aggregate future costs of compliance and their effect on our future results of operations, financial condition or liquidity.
At most of our quarries, we incur reclamation obligations as part of our mining activities. Reclamation methods and requirements can vary depending on the individual site and state regulations. Generally, we are required to grade the mined properties to a certain slope and seed the property to prevent erosion. We record a mining reclamation liability in our consolidated financial statements to reflect the estimated fair value of the cost to reclaim each property including active and closed sites.
Our operations in Kansas include one municipal waste landfill and two construction and demolition debris landfills, one of which has been closed. Among other environmental, health and safety requirements, we are subject to obligations to appropriately close those landfills at the end of their useful lives and provide for appropriate post-closure care. Asset retirement obligations relating to these landfills are recorded in our consolidated financial statements.
Health and Safety
Our facilities and operations are subject to a variety of worker health and safety requirements, particularly those administered by the federal OSHA and MSHA, which may become stricter in the future. Throughout our organization, we strive for a zero-incident safety culture and full compliance with safety regulations. Failure to comply with these requirements can result in sanctions such as fines and penalties and claims for personal injury and property damage. These requirements may also result in increased operating and capital costs in the future. We cannot guarantee that violations of such requirements will not occur, and any violations could result in additional costs.
Worker safety and health matters are overseen by our corporate risk management and safety department as well as operating company level safety managers. We provide leadership and support, comprehensive training, and other tools designed to accomplish health and safety goals, reduce risk, eliminate hazards, and ultimately make our work places safer.
Insurance
Our insurance program is structured using multiple “A” rated insurance carriers, and a variety of deductible amounts. In particular, our workers compensation, general liability and auto liability policies are subject to a $500,000 per occurrence deductible. Losses within these deductibles are accrued for using projections based on past loss history.
We also maintain $50.0 million in combined umbrella insurance. Other policies have smaller deductibles and include property, contractors equipment, contractors pollution and professional, directors and officers, employment practices liability and fiduciary and crime. We also have a separate marine insurance policy for our cement business, which is located adjacent to the Mississippi River and ships cement on the river via barge.
131
Table of Contents
Directors and Executive Officers
The following table sets forth the names, ages and positions of our directors and executive officers as of the date of this prospectus.
| Name |
Age | Position | ||||
| Thomas W. Hill |
58 | President and Chief Executive Officer; Director | ||||
| Howard L. Lance |
59 | Director; Chairman of the Board of Directors | ||||
| Ted A. Gardner |
56 | Director | ||||
| Julia C. Kahr |
36 | Director | ||||
| John R. Murphy |
64 | Director; Audit Committee Chairman | ||||
| Neil P. Simpkins |
48 | Director | ||||
| Anne Lee Benedict |
41 | Chief Legal Officer and Secretary | ||||
| Michael J. Brady |
47 | Executive Vice President | ||||
| M. Shane Evans |
44 | Regional President—West Region | ||||
| Kevin A. Gill |
53 | Chief Human Resources Officer | ||||
| Brian J. Harris |
58 | Chief Financial Officer | ||||
| Damian J. Murphy |
45 | Regional President—Central Region | ||||
| Douglas C. Rauh |
54 | Chief Operating Officer | ||||
Thomas W. Hill is the founder of Summit Materials and has been President and Chief Executive Officer since its inception. He has been a member of the board of directors since August 2009. From 2006 to 2008, he was the Chief Executive Officer of Oldcastle, Inc., the North American arm of CRH plc, one of the world’s leading construction materials companies. Mr. Hill served on the CRH plc Board of Directors from 2002 to 2008 and, from 1992 to 2006, ran the Materials division of Oldcastle. Mr. Hill served as Chairman of the American Road and Transportation Builders Association (“ARTBA”) from 2002 to 2004, during congressional consideration of the multi-year transportation bill “SAFETEA-LU.” Mr. Hill has been Treasurer of both the National Asphalt Pavement Association and the National Stone Association, and he remains active with ARTBA’s Executive Committee. Mr. Hill received a Bachelor of Arts in Economics and History from Duke University and a Masters of Business Administration from Trinity College in Dublin, Ireland.
Howard L. Lance began to serve on our board starting in October 2012 and was formally elected as a director and Chairman in February 2013. He was Chairman of the Board of Directors, President and Chief Executive Officer of Harris Corporation from 2003 to 2011. Before joining Harris Corporation, Mr. Lance was president of NCR Corporation and Chief Operating Officer of its Retail and Financial Group. Previously, he spent 17 years with Emerson Electric Co., where he held senior management positions including Executive Vice President of its Electronics and Telecommunications segment, Chief Executive Officer and director of its Astec electronics subsidiary in Hong Kong, Group Vice President of its Climate Technologies segment and President of its Copeland Refrigeration division. Mr. Lance has a Bachelor of Science degree in Industrial Engineering from Bradley University and a Master of Science degree in Management from the Krannert School of Management at Purdue University.
Ted A. Gardner was elected as a director in August 2009. He is a Managing Partner of Silverhawk. Prior to co-founding Silverhawk in 2005, Mr. Gardner was a Managing Partner of Wachovia Capital Partners (formerly, First Union Capital Partners) from 1989 until 2002. He was a director and Chairman of the Compensation Committee of Kinder Morgan, Inc. from 1999 to 2007 and was a director and the Chairman of the Audit Committee of Encore Acquisition Company from 2001 to 2010. He is currently a director of Kinder Morgan Energy Partners, Spartan Energy Partners and Athlon Energy Inc. Mr. Gardner received a Bachelor of Arts degree in Economics from Duke University and a Juris Doctor and Masters of Business Administration from the University of Virginia.
Julia C. Kahr was elected as a director in August 2009. She is a Managing Director in Blackstone’s Corporate Private Equity group. Since joining Blackstone in 2004, she has been involved in the execution of
132
Table of Contents
Blackstone’s investments in SunGard, Encore Medical, DJ Orthopedics, Summit Materials and Gates Corporation. Before joining Blackstone, she was a Project Leader at the Boston Consulting Group, where she worked with companies in a variety of industries, including health care, financial services, media and entertainment and consumer goods. She is also the sole author of Working Knowledge, a book published by Simon & Schuster in 1998. She currently serves on the Board of Directors of DJ Orthopedics and Gates Corporation and is also a member of the Board of Directors of Episcopal Social Services. Ms. Kahr received a Bachelor of Arts in Classical Civilization from Yale University where she graduated summa cum laude. She received a Masters of Business Administration from Harvard Business School.
John R. Murphy was elected as a director and Chairman of the Audit Committee in February 2012. Mr. Murphy served as Summit Materials’ Interim Chief Financial Officer from January 2013 to May 2013 and from July 2013 to October 2013. He was Senior Vice President and Chief Financial Officer of Smurfit-Stone Container Corporation from 2009 to 2010 and served in various senior management roles from 1998 to 2008, including Chief Financial Officer and Chief Operating Officer and as President and Chief Executive Officer of Accuride Corporation. Accuride Corporation filed for Chapter 11 bankruptcy protection in October 2009 and emerged in 2010. Since 2003, Mr. Murphy has served on the Board of Directors, the Governance Committee and as Chairman of the Audit Committee of O’Reilly Automotive, Inc. He has also served as a director and Audit Committee Chairman of DJO Global Inc. since January 2012. Mr. Murphy was elected as a director and Audit Committee member of Graham Packaging in February 2011. Graham Packaging was subsequently sold in September 2011. Mr. Murphy has a Bachelor of Science degree in Accounting from Pennsylvania State University and a Master of Business Administration degree from the University of Colorado and is a Certified Public Accountant.
Neil P. Simpkins was elected as a director in August 2009. He is a Senior Managing Director of Blackstone’s Corporate Private Equity Group. Since joining Blackstone in 1998, Mr. Simpkins has led the acquisitions of TRW Automotive, Vanguard Health Systems, Team Health, LLC, Apria Healthcare Group, Summit Materials, Emdeon, Inc. and Gates Corporation. Before joining Blackstone, Mr. Simpkins was a Principal at Bain Capital. While at Bain Capital, Mr. Simpkins was involved in the execution of investments in the consumer products, industrial, healthcare and information industries. Prior to joining Bain Capital, Mr. Simpkins was a consultant at Bain & Company in the Asia Pacific region and in London. He currently serves as Lead Director of TRW Automotive and as a Director of Apria Healthcare Group, Gates Corporation and Emdeon, Inc. Mr. Simpkins graduated with honors from Oxford University and received a Masters of Business Administration from Harvard Business School.
Anne Lee Benedict joined Summit Materials in October 2013. Prior to joining Summit Materials, Ms. Benedict was a corporate partner in the Washington, D.C. office of Gibson, Dunn & Crutcher, where she had practiced since 2000. Ms. Benedict’s practice involved a wide range of corporate law matters, including mergers and acquisitions, joint ventures and other strategic transactions, securities offerings, securities regulation and disclosure issues, and corporate governance matters. Ms. Benedict earned a Bachelor of Arts degree in English and Psychology from the University of Michigan and graduated from the University of Pennsylvania Law School.
Michael J. Brady joined Summit Materials in April 2009 as Executive Vice President. Before joining Summit Materials, Mr. Brady was a Senior Vice President at Oldcastle with overall responsibility for acquisitions and business development, having joined the company in 2000. Prior to that, Mr. Brady worked in several operational and general management positions in the paper and packaging industry in Ireland, the United Kingdom and Asia Pacific with the Jefferson Smurfit Group, plc (now Smurfit Kappa Group plc). Mr. Brady has a Bachelor of Engineering (Electrical) and a Master of Engineering Science (Microelectronics) from University College, Cork in Ireland. He earned his Masters of Business Administration degree from INSEAD in Fontainebleau, France.
M. Shane Evans joined Summit Materials as Regional President of the West Region in August 2010 with over 20 years of experience in the construction materials industry. Prior to joining Summit Materials, Mr. Evans
133
Table of Contents
worked at Oldcastle for 12 years, most recently as a Division President. He started his career working in his family’s construction and materials business where he held various operational and executive positions. Mr. Evans has a Bachelor of Science degree from Montana State University.
Kevin A. Gill joined Summit Materials in May 2013 after having been Human Resources Vice President for Guilford Performance Textiles, a Cerberus portfolio company, since November 2008. In this role, he provided Human Resources Leadership that fueled the monetization to Lear Corporation. Prior to Guilford, Mr. Gill held a variety of Human Resources leadership roles with companies such as Honeywell, Citibank and Monsanto Chemical. Mr. Gill holds a Bachelor of Science in Business Administration from Villanova University and a Master of Arts in Industrial Relations from Wayne State in Detroit, Michigan.
Brian J. Harris joined Summit Materials as Chief Financial Officer in October 2013. Prior to joining the Summit Materials, from 2009 to 2013, Mr. Harris served as Executive Vice President and Chief Financial Officer of Bausch & Lomb Holdings Incorporated, a leading global eye health company. From 1990 to 2009, Mr. Harris held positions of increasing responsibility with industrial, automotive, building products and engineering manufacturing conglomerate Tomkins plc, including President of the $2 billion worldwide power transmission business for Gates Corporation, and Senior Vice President for Strategic Business Development and Business Administration, Chief Financial Officer and Secretary of Gates Corporation. Mr. Harris earned his Bachelor of Accountancy from Glasgow University and is qualified as a Scottish Chartered Accountant.
Damian J. Murphy joined Summit Materials as Regional President of the Central Region in August 2009 with over 20 years of experience in the construction materials and mining industries, working with both public and privately held companies. Prior to joining Summit Materials, Mr. Murphy served roles as regional president and company president for Oldcastle starting in 2004. Prior to that Mr. Murphy served as vice president of Aggregate Industries’ Rocky Mountain region, responsible for aggregates and hot mix asphalt production and sales. Before joining Aggregate Industries, Mr. Murphy worked in the mid-Atlantic for a top 10 privately held aggregate supplier and began his career in the industry in Europe. Mr. Murphy holds a Bachelor of Engineering degree with a concentration in Minerals Engineering from the Camborne School of Mines/ Exeter University in the United Kingdom.
Douglas C. Rauh joined Summit Materials as the Regional President of the East Region in January 2012 with over 30 years of experience in the construction materials industry. Effective March 1, 2013, Mr. Rauh, became the Summit Materials’ Chief Operating Officer. Prior to joining Summit Materials, from 2000 to 2012, Mr. Rauh held positions of increasing responsibility with Oldcastle, including President and Chief Executive Officer of The Shelly Co. (“Shelly”), Oldcastle’s operations in Ohio. During Mr. Rauh’s tenure with Shelly, he was an integral part of the team that completed over 30 acquisitions. Mr. Rauh started his career working for his family’s business, Northern Ohio Paving Company (“NOPCO”), where he held roles of increasing responsibility from 1983 to 2000, including Vice President. He attended The Ohio State University and graduated with a Bachelor of Science degree in Business Administration.
There are no family relationships among any of our directors or executive officers.
Composition of the Board of Directors
Our business and affairs are managed under the direction of our board of directors. Following the completion of this offering, we expect our board of directors to initially consist of directors, of whom and will be independent. As of the completion of this offering, our amended and restated certificate of incorporation and amended and restated bylaws will provide for a classified board of directors consisting of three classes of directors, each serving staggered three-year terms, as follows:
| • | Our Class I directors will be , . and , and their terms will expire at the annual meeting of stockholders to be held in 2016. |
134
Table of Contents
| • | Our Class II directors will be , and , and their terms will expire at the annual meeting of stockholders to be held in 2017. |
| • | Our Class III directors will be , and , and their terms will expire at the annual meeting of stockholders to be held in 2018. |
Upon expiration of the term of a class of directors, directors for that class will be elected for three-year terms at the annual meeting of stockholders in the year in which that term expires. Each director’s term continues until the election and qualification of his or her successor or his or her earlier death, resignation or removal. Any increase or decrease in the number of directors will be distributed among the three classes so that, as nearly as possible, each class will consist of one-third of the directors. This classification of our board of directors may have the effect of delaying or preventing changes in control of our Company.
In addition, we intend to enter into a stockholders agreement with affiliates of Blackstone in connection with this offering. This agreement will grant affiliates of Blackstone the right to designate nominees to our board of directors subject to the maintenance of certain ownership requirements in us. See “Certain Relationships and Related Party Transactions—Stockholders’ Agreement” for additional information.
Background and Experience of Directors
When considering whether directors and nominees have the experience, qualifications, attributes or skills, taken as a whole, to enable our board of directors to satisfy its oversight responsibilities effectively in light of our business and structure, the board of directors focuses primarily on each person’s background and experience as reflected in the information discussed in each of the directors’ individual biographies set forth above. We believe that our directors provide an appropriate mix of experience and skills relevant to the size and nature of our business. In particular, the members of our board of directors considered the following important characteristics, among others:
| • | Mr. Hill’s extensive knowledge of our industry and significant experience in leading companies. |
| • | Mr. Lance’s significant management and operational experience from his service in various senior management roles, including as President and Chief Executive Officer of Harris Corporation and President of NCR Corporation. |
| • | Mr. Gardner’s extensive business and leadership experience, including as a Managing Partner of Silverhawk and Managing Partner of Wachovia Capital Partners (formerly, First Union Capital Partners). |
| • | Ms. Kahr’s extensive knowledge of a variety of different industries and her significant financial and investment experience from her involvement in Blackstone, including as Managing Director. |
| • | Mr. Murphy’s extensive financial knowledge, including from his service as Chief Financial Officer of Smurfit-Stone Container Corporation and Accuride Corporation. |
| • | Mr. Simpkins’ significant financial and business experience, including as a Senior Managing Director in the Private Equity Group at Blackstone and Principal at Bain Capital. |
Controlled Company Exception
After the completion of this offering, affiliates of Blackstone, who will be parties to the stockholders’ agreement, will continue to hold more than a majority of the voting power of our common stock eligible to vote in the election of our directors. As a result, we will be a “controlled company” within the meaning of corporate governance standards. Under these corporate governance standards, a company of which more than 50% of the voting power is held by an individual, group or another company is a “controlled company” and may elect not to comply with certain corporate governance standards, including the requirements (1) that a majority of our board
135
Table of Contents
of directors consist of independent directors, (2) that our board of directors have a compensation committee that is composed entirely of independent directors with a written charter addressing the committee’s purpose and responsibilities and (3) that our board of directors have a nominating and corporate governance committee that is composed entirely of independent directors with a written charter addressing the committee’s purpose and responsibilities. For at least some period following this offering, we intend to utilize these exemptions. As a result, immediately following this offering we do not expect that the majority of our directors will be independent or that any committees of the board of directors will be composed entirely of independent directors. Accordingly, you will not have the same protections afforded to stockholders of companies that are subject to all of these corporate governance requirements. In the event that we cease to be a “controlled company” and our shares continue to be listed on the NYSE, we will be required to comply with these provisions within the applicable transition periods.
Board Committees
Our board of directors has established an audit committe. In addition, we anticipate that, prior to the completion of this offering, our board of directors will establish the following committees: a compensation committee; a corporate governance and nominating committee and an executive committee. The composition and responsibilities of each committee are described below. Our board of directors may also establish from time to time any other committees that it deems necessary or desirable. Members serve on these committees until their resignation or until otherwise determined by our board of directors.
Audit Committee
Our audit committee consists of Mr. Murphy, Mr. Gardner and Ms. Kahr, with Mr. Murphy serving as chair. Our audit committee is responsible for, among other things:
| • | selecting and hiring our independent auditors, and approving the audit and non-audit services to be performed by our independent auditors; |
| • | assisting the board of directors in evaluating the qualifications, performance and independence of our independent auditors; |
| • | assisting the board of directors in monitoring the quality and integrity of our financial statements and our accounting and financial reporting; |
| • | assisting the board of directors in monitoring our compliance with legal and regulatory requirements; |
| • | reviewing the adequacy and effectiveness of our internal control over financial reporting processes; |
| • | assisting the board of directors in monitoring the performance of our internal audit function; |
| • | monitoring the performance of our internal audit function; |
| • | reviewing with management and our independent auditors our annual and quarterly financial statements; |
| • | establishing procedures for the receipt, retention and treatment of complaints received by us regarding accounting, internal accounting controls or auditing matters and the confidential, anonymous submission by our employees of concerns regarding questionable accounting or auditing matters; and |
| • | preparing the audit committee report that the rules and regulations of the SEC require to be included in our annual proxy statement. |
The SEC rules and NYSE rules require us to have one independent audit committee member upon the listing of our Class A common stock on the NYSE, a majority of independent directors within 90 days of the effective date of the registration statement and all independent audit committee members within one year of the effective date of the registration statement. qualifies as an independent director under the NYSE governance standards and the independence requirements of Rule 10A-3 of the Exchange Act.
136
Table of Contents
Compensation Committee
Upon completion of this offering, we expect our compensation committee will consist of , and , with serving as chair. The compensation committee will be responsible for, among other things:
| • | reviewing and approving corporate goals and objectives relevant to the compensation of our chief executive officer, evaluating our Chief Executive Officer’s performance in light of those goals and objectives, and, either as a committee or together with the other independent directors (as directed by the board of directors), determining and approving our Chief Executive Officer’s compensation level based on such evaluation; |
| • | reviewing and approving, or making recommendations to the board of directors with respect to, the compensation of our other executive officers, including annual base salary, bonus and equity-based incentives and other benefits; |
| • | reviewing and recommending the compensation of our directors; |
| • | reviewing and discussing annually with management our “Compensation Discussion and Analysis” disclosure required by SEC rules; |
| • | preparing the compensation committee report required by the SEC to be included in our annual proxy statement; and |
| • | reviewing and making recommendations with respect to our equity compensation plans. |
Corporate Governance and Nominating Committee
Upon completion of this offering, we expect our corporate governance and nominating committee will consist of , and , with serving as chair. The corporate governance and nominating committee is responsible for, among other things:
| • | assisting our board of directors in identifying prospective director nominees and recommending nominees to the board of directors; |
| • | overseeing the evaluation of the board of directors and management; |
| • | reviewing developments in corporate governance practices and developing and recommending a set of corporate governance guidelines; and |
| • | recommending members for each committee of our board of directors. |
Executive Committee
Upon completion of this offering, we expect our executive committee will consist of , and , with serving as chair. Our board of directors will delegate all of the power and authority of the full board of directors to the executive committee to act when the board of directors is not in session.
Compensation Committee Interlocks and Insider Participation
We do not presently have a compensation committee. Decisions regarding the compensation of our executive officers have historically been made by the board. Mr. Hill, who is our President and Chief Executive Officer, generally participates in discussions and deliberations of the board regarding executive compensation. Other than Mr. Hill and Mr. Murphy, who served as our Interim Chief Financial Officer from December 18, 2012 to May 12, 2013 and from July 1, 2013 to October 14, 2013, no member of the board was at any time during fiscal years 2013 or 2012, or at any other time, one of our officers or employees.
137
Table of Contents
Upon completion of this offering, the members of our compensation committee will be , and . None of the members of our compensation committee will have at any time been one of our executive officers or employees.
None of our executive officers currently serves, or has served during the last completed fiscal year, as a member of the board of directors or compensation committee (or other committee performing equivalent functions) of any entity that has one or more executive officers serving on our board of directors or compensation committee. We are party to certain transactions with affiliates of Blackstone described in “Certain Relationships and Related Party Transactions.”
Code of Ethics
We will adopt a new Code of Business Conduct and Ethics that applies to all of our officers, directors and employees, including our principal executive officer, principal financial officer, principal accounting officer and controller, or persons performing similar functions, which will be posted on our website. Our Code of Business Conduct and Ethics is a “code of ethics,” as defined in Item 406(b) of Regulation S-K. We will make any legally required disclosures regarding amendments to, or waivers of, provisions of our code of ethics on our website. The information contained on, or accessible from, our website is not part of this prospectus by reference or otherwise.
138
Table of Contents
EXECUTIVE AND DIRECTOR COMPENSATION
Executive Compensation
Introduction
The executive compensation disclosure that follows explains the compensation awarded to, earned by or paid to Thomas W. Hill, our Chief Executive Officer, and Doug C. Rauh and Kevin A. Gill, our two most highly compensated executive officers other than our Chief Executive Officer, for fiscal year 2013. We refer to these individuals in this section as our “named executive officers” or “NEOs.”
Summary Compensation Table
The following table sets forth the compensation and principal positions of our named executive officers as of and for the year ended December 28, 2013 and, as applicable, compensation for the year ended December 29, 2012.
| Name and Principal |
Year | Salary | Bonus(1) | Stock Awards(2) |
Non-Equity Incentive Plan Compensation |
All Other Compensation(3) |
Total | |||||||||||||||||||||
| Thomas W. Hill |
2013 | $ | 525,000 | $ | — | $ | — | $ | 563,850 | $ | 18,665 | $ | 1,107,515 | |||||||||||||||
| President and Chief Executive Officer, Director |
2012 | 510,000 | 267,750 | — | — | 25,594 | 803,344 | |||||||||||||||||||||
| Douglas C. Rauh |
2013 | 475,000 | 29,212 | 103,553 | 382,073 | 68,496 | 1,058,334 | |||||||||||||||||||||
| Chief Operating Officer |
2012 | 450,000 | 550,000 | 838,853 | — | 468,548 | 2,307,401 | |||||||||||||||||||||
| Kevin A. Gill(4) |
2013 | 184,041 | 20,000 | 207,126 | 117,603 | 171,570 | 700,340 | |||||||||||||||||||||
| Chief Human Resource Officer |
||||||||||||||||||||||||||||
| (1) | Reflects the cash bonuses paid to the named executive officers in 2014 and, as applicable, 2013 in respect of their services during the prior year. The amounts of the bonus payments were determined by the Board in its discretion. For more information, see “—Bonus and Non-Equity Incentive Plan Compensation.” The amounts paid in 2012 to Mr. Rauh include a starting bonus of $400,000 paid in a lump sum and a $150,000 discretionary bonus. For more details, see “—Employment Agreements—Douglas C. Rauh.” The amounts paid in 2013 to Mr. Gill include a starting bonus of $20,000 paid in a lump sum. |
| (2) | The amount reported in the Stock Awards column reflects the aggregate grant date fair value computed in accordance with Financial Accounting Standards Board Accounting Standards Codification Topic 718 (“ASC 718”). The assumptions applied in determining the fair value of the stock awards are discussed in Note 19, Employee Long-Term Incentive Plan, to our December 28, 2013 audited consolidated financial statements included elsewhere in this prospectus. This amount reflects our calculation of the value of the awards at the grant date and do not necessarily correspond to the actual value that may ultimately be recognized by the named executive officer. A portion of the shares granted in 2013 and 2012 vest under certain performance conditions, which are not currently deemed probable of occurring, and therefore have not been included in the table above. The unrecognized value of these awards assuming the highest level of performance conditions would be achieved was $111,831 and $176,883 as of December 28, 2013 and December 29, 2012, respectively for Mr. Rauh and $223,676 as of December 28, 2013 for Mr. Gill. |
| (3) | All Other Compensation includes the following items: (a) amounts contributed by Summit Materials, LLC under the Summit Materials, LLC Retirement Plan, (b) payments for term life insurance, (c) car allowances, (d) relocation costs and related tax gross-ups, (e) gym membership costs, (f) country club dues and (g) fuel reimbursement for commuting. Amounts contributed to the Summit Materials, LLC Retirement Plan are matching contributions up to 4% of eligible compensation subject to IRS limits and totaled $10,200 for both Mr. Hill and Mr. Rauh and $6,000 for Mr. Gill in 2013 and $9,800 for each of Mr. Hill and Mr. Rauh in |
139
Table of Contents
| 2012. Matching contributions are immediately vested. For more information, see “—Summit Materials, LLC Retirement Plan.” Payments for term life insurance were as follows: Mr. Hill—$2,451; Mr. Rauh—$1,173 and Mr. Gill—$215 in 2013 and Mr. Hill—$6,719 and Mr. Rauh—$979 in 2012. Payments made by Summit Materials, LLC for car allowances were as follows: Mr. Rauh—$20,851 and Mr. Gill—$7,355 in 2013 and $20,844 for Mr. Rauh in 2012. Payments made by Summit Materials, LLC associated with Mr. Rauh’s relocation were $1,065 in 2013 and $233,393 and $194,457 in 2012 for relocation and the related tax gross-up, respectively, and $88,358 and $69,368 in 2013 associated with Mr. Gill’s relocation and the related tax gross-up, respectively. For more details about the payments made to Mr. Rauh and Mr. Gill, see “—Employment Agreements—Douglas C. Rauh” and “—Employment Agreements—Kevin A. Gill.” |
| (4) | Mr. Gill joined the Company effective May 21, 2013. |
Narrative Disclosure to the Summary Compensation Table
Executive Summary
Overview
Our board has overall responsibility for the compensation program for our named executive officers, which will be delegated to a compensation committee following this offering. Members of the compensation committee will be appointed by our board.
2013 Executive Compensation Structure
Our executive compensation structure consists of three primary components: base salary; annual bonus and non-equity incentives; and grants of Class D interests through our unit interest program.
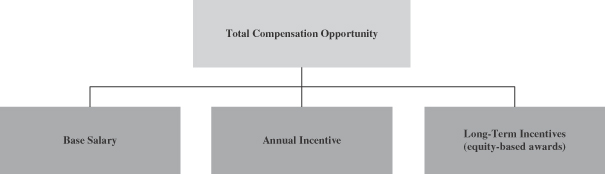
Compensation Program Following This Offering
The design of our compensation program following this offering is expected to evolve as we move from our current private structure to that of a public company. We believe that we will have more flexibility in designing compensation programs to attract, motivate and retain our executives following this offering, including permitting us to regularly compensate executives with non-cash compensation reflective of our stock performance. We anticipate that long-term incentive compensation will be an integral part of our compensation program going forward. In connection with this offering, we will adopt a new omnibus incentive plan. See “—Summit Materials, Inc. Omnibus Incentive Plan.”
We anticipate that our named executive officers will continue to be subject to employment agreements that are substantially similar to their existing employment agreements, which are described in “—Employment
140
Table of Contents
Agreements.” It is also anticipated that our current named executive officers will hold substantially similar positions following the offering.
While we are still in the process of determining specific details of the compensation program that will take effect following the offering, it is anticipated that our compensation program following the offering will be based on the same principles and designed to achieve the same objectives as our current compensation program.
Compensation Program Governance Highlights
| What We Do (Best Practice) |
What We Don’t Do / Don’t Allow | |
| ü Disclose performance goals for 2013 incentive payments |
ü No hedging or pledging of Company stock by executives or directors | |
| ü Set maximum payout caps on our annual incentives |
ü No single-trigger or modified single-trigger change-in-control arrangements | |
| ü Pay for performance with a significant portion of our Chief Executive Officer’s total pay opportunity being performance-based compensation |
ü No change-in-control severance multiple in excess of three times salary and target bonus | |
| ü Limit perquisites and other benefits, as well as related tax gross-ups |
ü No excise tax gross-ups upon a change in control | |
| ü Incorporate general severance and change-in-control provisions that are consistent with market practice, including double-trigger requirements for change-in-control protection |
ü No enhanced retirement formulas | |
| ü Perform an annual compensation risk assessment |
||
Compensation Decision Process
Our board has overall responsibility for the compensation program for our named executive officers, which we anticipate will be delegated to a compensation committee of our board of directors following this offering.
Objectives for NEO Compensation
Our executive compensation program is intended to attract, motivate, and retain executive officers and to align the interests of our executive officers with equity holders’ interests. The board’s objectives for our program include, but are not limited to, the following:
| • | attract and retain talented and experienced executives in our industry; |
| • | recognize and reward executives whose knowledge, skills and performance are critical to our success; |
| • | align the interests of our executive officers and equity holders by motivating executive officers to increase equity holder value and rewarding them when that value increases; and |
| • | compensate our executives in a manner that encourages them to manage our business in such a way that we meet our long-range objectives. |
For our NEOs and select other senior executives, the board employs a “pay-for-performance” philosophy that ties a significant portion of incentive compensation opportunity to our company-wide performance, primarily an EBITDA metric, cash flows, and certain safety metrics. Our long-term incentive compensation is comprised
141
Table of Contents
of time-based and performance-based Class D interests. See “—Bonus and Non-Equity Incentive Plan Compensation” and “—Long-Term Incentives (“LTI”)” for detailed explanations of these plans.
Role of Management and the Board
The board currently approves all compensation for executive officers. Our Chief Executive Officer, Mr. Hill, recommends compensation levels for each NEO, excluding himself, to the board. In making these recommendations, Mr. Hill considers individual experience and performance, financial contribution to the Company and knowledge of executive compensation levels gained through years of experience in our industry. The board reviews and discusses all recommendations prior to approval.
The board is solely responsible for assessing performance of and compensation for Mr. Hill. Management does not make compensation-related recommendations for the Chief Executive Officer. In executive session, without management present, the board reviews Mr. Hill’s compensation and individual performance contributions.
Prior compensation realized does not impact the setting of future pay opportunities.
Role of the Compensation Consultant
Beginning in fall 2013, we retained an independent compensation consultant, Aon Hewitt, to assist us with respect to the bonus and other non-equity incentive plan compensation for 2013 that was paid in 2014. The consultant was retained by and reports to management. Other than Aon Hewitt’s roles and services listed below with respect to compensation consulting, it performs no other services for us.
Aon Hewitt’s specific compensation consultation roles include, but are not limited to, the following:
| • | advise management on executive compensation trends and regulatory developments; |
| • | provide compensation studies for executives and recommendations for executive pay; |
| • | provide advice to management on governance best practices, as well as any other areas of concern or risk; and |
| • | review and comment on disclosure items, including “Executive and Director Compensation” disclosures. |
Aon Hewitt provided management and the board of directors with benchmarking studies, which were used in determining the 2013 bonuses and non-equity incentive plan compensation for executives.
Role of Competitive Market Data
Through 2013, we have not relied on market survey data in making decisions regarding executive compensation. Our board has exercised its discretion in setting both the individual compensation components and the total pay of each of our named executive officers at levels believed to be commensurate with their specific positions and job responsibilities, taking into account the need to retain and motivate our named executive officers to achieve superior levels of performance.
We anticipate that our board and/or a compensation committee may, in the future, more formally benchmark executive compensation against a peer group of comparable companies and may target specific percentile pay levels. We also anticipate that our board and/or compensation committee may make adjustments in executive compensation levels in the future as a result of this more formal benchmarking process.
142
Table of Contents
Considerations Regarding 2013 NEO Compensation
Components of 2013 NEO Compensation
The following table outlines the major components of our 2013 executive compensation program for our NEOs:
| Pay Component |
Purpose |
Characteristics |
Fixed or |
Short or Long-Term | ||||
| Base Salary | Attract and retain executives through market-based pay | Reflects executive’s experience, performance, and the board’s knowledge of executive compensation practices | Fixed | Short-Term | ||||
| Bonus and Non- Equity Incentive Plan Compensation | Encourages achievement of strategic and financial performance metrics that create long-term equity holder value | Based on achievement of predefined performance objectives and an assessment of individual performance | Performance | Short-Term | ||||
| Long-Term Incentives (“LTI”) |
Aligns executives’ long-term compensation with equity holders’ investment interests; creates a retention incentive through multi-year vesting and performance cycles | Value to the executive is based on long-term value creation | Performance | Long-Term | ||||
| Health/Welfare Plans and Retirement Benefits | Provides competitive benefits that promote employee health and productivity and support financial security | Similar to benefits offered to other employees | Fixed | Long-Term | ||||
| Perquisites | Provides business-related benefits, where appropriate | Limited to car allowance, relocation expenses, club memberships and other business related reimbursements. | Fixed | Short-Term | ||||
Base Salary
Annual base salaries compensate our executive officers for fulfilling the requirements of their respective positions and provide them with a level of cash income predictability and stability with respect to a portion of their total compensation. The board determines base salaries for the NEOs and other executives based on a number of factors, including but not limited to, the board’s understanding of executive pay practices, individual performance, Company performance and management recommendations (except for the Chief Executive Officer). The board approved the following base salary amounts for 2013.
| 2013 Base Salary |
||||
| Thomas W. Hill |
$ | 525,000 | ||
| Douglas C. Rauh |
$ | 475,000 | ||
| Kevin A. Gill |
$ | 300,000 | ||
143
Table of Contents
Bonus and Non-Equity Incentive Plan Compensation
Each named executive officer is eligible to earn an annual incentive based upon the achievement of performance targets established by the board within the first three months of each fiscal year.
Annual Incentive Targets. At the start of each fiscal year the board approves annual incentive compensation targets, as a percentage of base salary, based on the board’s understanding of executive pay practices, management’s recommendations and other relevant factors. The 2013 annual incentive targets for our NEOs follow:
| 2013 Target Bonus |
||||
| Thomas W. Hill |
100 | % | ||
| Douglas C. Rauh |
75 | % | ||
| Kevin A. Gill |
60 | % | ||
2013 Annual Incentive Metrics. The performance targets may be based on an EBITDA metric and/or free cash flow targets; however, the board, in its discretion, may adjust such performance targets in any fiscal year to reflect any merger, acquisition or divestiture affected by us during such fiscal year. In fiscal 2013, the performance targets were primarily based on an EBITDA metric, cash flows and safety/discretionary evaluations related primarily to safety and the successful integration of acquired businesses. These may be measured at either the corporate or regional business level. For 2013, the measures were weighted as follows:
| EBITDA Metric |
Cash Flow | Safety/ Discretionary |
||||||||||
| Thomas W. Hill |
60 | % | 20 | % | 20 | % | ||||||
| Douglas C. Rauh |
60 | % | 20 | % | 20 | % | ||||||
| Kevin A. Gill |
60 | % | 20 | % | 20 | % | ||||||
Performance / Payout Scales. The payout opportunities associated with minimum, target, and maximum performance levels are consistent across the EBITDA and cash flow performance metrics. The minimum payout opportunity is 10% of target if the minimum performance level of 91% of goal is achieved. Target is earned if targeted performance is achieved. The maximum payout opportunity is 201% of target if the maximum performance level of 120% of goal is achieved.
2013 Actual Performance. Actual results for the 2013 Bonus and Non-Equity Incentive Plan were certified by the board, as follows, based on the performance goals and funding scales approved in the first quarter of 2013:
| • | EBITDA Metric: The 2013 performance target was $126.1 million. We achieved an EBITDA metric of $127.7 million. The EBITDA metric portion was paid at 101% of target. |
| • | Cash Flow: The 2013 performance target was $13.9 million. We achieved $12.2 million. The Cash Flow portion was paid at 90% of target. |
| • | Safety/Discretionary Metrics: Payouts earned against target were 150%. |
The following table summarizes the 2013 bonuses earned based on actual performance, as compared to the target opportunity for each NEO:
| Incentive Earned |
Target Incentive |
% of Target Earned |
||||||||||
| Thomas W. Hill |
$ | 563,850 | $ | 525,000 | 107 | % | ||||||
| Douglas C. Rauh(1) |
$ | 382,073 | $ | 356,250 | 107 | % | ||||||
| Kevin A. Gill(2) |
$ | 117,603 | (3) | $ | 180,000 | 107 | % | |||||
| (1) | Mr. Rauh received an additional discretionary bonus of $29,752 for performing dual roles as Chief Operating Officer and interim President—East region. |
144
Table of Contents
| (2) | Mr. Gill earned an additional $20,000 as a starting bonus. |
| (3) | Mr. Gill received a prorated bonus award reflecting partial year employment with the Company. |
During fiscal 2012, although our actual EBITDA metric did not meet the target EBITDA metric and thus the named executive officers were not entitled to their cash payments under the bonus plan, the board, in its discretion, determined to make cash bonus payments to Mr. Hill and Mr. Rauh, as disclosed in the footnote to the bonus column of the Summary Compensation Table above. In determining this discretionary cash bonus payment for each named executive officer, the board considered safety, customer satisfaction, product quality and the successful integration of acquired businesses. In addition, the board considered each named executive officer’s effectiveness and contribution to the Company.
Long-Term Incentives (“LTI”)
Certain of our employees, including our named executive officers, received Class D interests in Summit Holdings between 2009 and 2013. The Class D interests provide rights to cash distributions based on a predetermined distribution formula (as provided for in the Third Amended and Restated Limited Partnership Agreement dated December 23, 2013) upon Summit Holdings’ general partner declaring a distribution. Under the limited partnership agreement, these interests would be entitled to distributions as determined by the board on a pro rata basis with the Class B and Class C interests after returns of capital to Class A and Class B holders (Blackstone and other investors) and a preferential distribution to Class C Holders.
We do not anticipate further grants of the Class D interests after this offering. Existing grants will be unitized in connection with this offering. In connection with this offering, we expect that our directors, officers and employees will surrender all vested and unvested Class D interests held by them and receive vested and unvested LP Units pursuant to the Reclassification, as described in “Organizational Structure—Reclassification and Amendment and Restatement of Limited Partnership Agreement of Summit Materials Holdings L.P.,” and stock options. The LP Units and stock options issued in exchange for unvested Class D interests will generally be subject to the same vesting conditions as were applicable to the corresponding Class D interests, as described below. For more information, see “—Outstanding Equity Awards at 2013 Fiscal Year-end.”
Vesting
There are four categories of Class D interests:
| • | Class D-1 U.S. Interests; |
| • | Class D-1 Non-U.S. Interests; |
| • | Class D-2 U.S. Interests; and |
| • | Class D-2 Non-U.S. Interests. |
Generally, 50% of each category of Class D-1 interests vest with the passage of time (“time-vesting interests”) and the remaining 50% of the Class D-1 interests and all Class D-2 interests vest when certain investment returns are achieved by Summit Holdings’ investors (“performance-vesting interests”).
Time vesting interests generally vest as follows: 20% vest on the first anniversary of the grant date and the remaining 80% vest monthly over the four years following the first anniversary of the grant date. The time-vesting interests will become fully vested on an accelerated basis upon a change in control while the employee continues to provide services to us. Any of the time-vesting interests that are unvested upon termination of the employee’s services will be forfeited by the employee.
Performance-vesting interests vest when certain investment returns are achieved by Summit Holdings’ Blackstone-affiliated investors while the employee continues to provide services to us or our subsidiaries. There are two performance levels at which performance-vesting interests generally vest, with performance-vesting interests that are Class D-1 interests vesting if Summit Holdings’ Blackstone-affiliated investors receive a return on invested
145
Table of Contents
capital of 1.75 times their initial investment, and performance-vesting interests that are Class D-2 interests vesting if Summit Holdings’ Blackstone-affiliated investors receive a return on invested capital of 3.00 times their initial investment.
Unvested interests are generally forfeited upon termination of employment by the holder. However, if the employee is terminated without “cause” or resigns due to a “constructive termination” (each as defined in such employee’s employment agreement with us) within 12 months preceding a “change of control” or a “public offering” (each as defined in Summit Holdings’ limited partnership agreement), any performance-vesting interests that would have been eligible to vest in connection with such transaction shall be restored and shall be eligible to vest based on the proceeds of such transaction.
If a holder’s employment is terminated by us for “cause,” or the holder violates a restrictive covenant, any vested Class D interests are automatically forfeited. If a holder’s employment is terminated by us without “cause,” we may, under specified circumstances, repurchase the holder’s vested Class D interests at a price per unit equal to the fair market value of such Class D interests, minus any amounts already distributed to the holder in respect of such Class D interests.
If a holder’s employment terminates as a result of the voluntary resignation of the holder, we may elect to convert all of the employee’s Class D interests into a right to a fixed cash payment capped at a specified amount determined at the time of termination. The fixed cash payment calculated for this purpose is an amount equal to the fair market value of the holder’s vested Class D interests minus any amounts already distributed to the holder in respect of such Class D interests.
Grants of Class D interests are generally awarded at hire and when there are additional Class A and Class B investments. Grants to employees are based on the role and responsibility of the executive. In 2013, the following NEOs were granted Class D interests:
| • | Douglas C. Rauh: 37.2 Class D-time vesting interests and 37.2 Class D-1 performance vesting interests and 11.2 Class D-2 performance vesting interests. Grants were made upon promotion to Chief Operating Officer. |
| • | Kevin A. Gill: 74.3 Class D-time vesting interests and 74.3 Class D-1 performance vesting interests and 22.3 Class D-2 performance vesting interests. Grants were made at hire. |
Conversion of Class D Interests. In connection with the Reclassification, all vested and unvested Class D interests will be converted into vested and unvested LP Units. The number of LP Units delivered in respect of each Class D interest will be determined based the amount of proceeds that would be distributed to such Class D interest if the company were to be sold at a value derived from the initial public offering price, and the intrinsic value of the LP Units issued in respect of each Class D interest will have an intrinsic value equal to the hypothetical proceeds such Class D interest would have received.
Vested Class D interests will be converted into fully vested LP Units and unvested Class D interests will be converted into unvested LP Units, which will be subject to vesting terms substantially similar to those applicable to the unvested Class D interests immediately prior to the Reclassification, as described above. The precise number of LP Units delivered in respect of Class D interests will be based on the initial public offering price. Assuming an offering price of $ per share of Class A common stock, which is the midpoint of the range on the front cover of this prospectus, the aggregate number of vested and unvested LP Units issued to holders of Class D interests would be , and the number of LP Units issued to our named executive offices would be: Mr. Hill, ; Mr. Rauh, ; and Mr. Gill, .
In connection with the Reclassification, we also expect to grant options to purchase Class A shares under the Omnibus Incentive Plan to all holders of Class D interests whose interests are converted in the Reclassification, including each of our named executive officers, in substitution for part of the economic benefit of the Class D interests that is not reflected in the conversion of Class D interests to LP Units. We refer to these stock options as
146
Table of Contents
“leverage restoration options”. The leverage restoration options will have an exercise price per share that will be equal to or higher than the initial public offering price per share, and generally be subject to vesting terms substantially similar to those applicable to the corresponding Class D interests immediately prior to the Reclassification, except that the leverage restoration options that correlate to time-vesting interests will vest over four years, beginning on the Reclassification date, instead of over five years. The precise number of leverage restoration options we grant in respect of each Class D interest will be based on the initial public offering price. Assuming an offering price of $ per share of Class A common stock, which is the midpoint of the range on the front cover of this prospectus, the aggregate number of leverage restoration options granted to holders of Class D interests would be , and the number of leverage restoration options granted to our named executive offices would be: Mr. Hill, ; Mr. Rauh, ; and Mr. Gill, .
In connection with this offering, we also expect to grant options to purchase Class A shares under the Omnibus Incentive Plan to other employees who do not currently hold equity-based incentive awards. These stock options will have an exercise price per share that will be equal to or higher than the initial public offering price per share, and generally be subject to time- and/or performance-based vesting criteria. See “—Summit Materials, Inc. Omnibus Incentive Plan.”
The precise number of stock options we grant to other employees will be based on the initial public offering price. Assuming an offering price of $ per share of Class A common stock, which is the midpoint of the range on the front cover of this prospectus, the aggregate number of stock options granted to other employees would be .
Retirement, Perquisites, and Other Benefits
Members of senior management participate in our other benefit plans on the same terms as other employees. These plans include 401(k) matching contributions, and medical, dental, vision and life insurance. We offer car allowances to certain of our NEOs. Relocation benefits also are reimbursed from time to time, but are individually negotiated when they occur. Additional perquisites include gym memberships, country club dues and fuel cost reimbursement.
Summit Materials, LLC Retirement Plan
We have a qualified contributory retirement plan established to qualify as a deferred salary arrangement under Section 401(k) of the Internal Revenue Code of 1986, as amended (the “Code”). The plan covers all corporate employees, including our named executive officers, who are limited to their annual tax deferred contribution limit as allowed by the IRS and may contribute up to 75% of their gross wages. We provide for matching contributions to the plan, including 100% of pre-tax employee contributions and up to 4% of eligible compensation. Employer contributions vest immediately. Employees outside of the corporate office are covered by a variety of other plans, all of which qualify as deferred salary arrangements under Section 401(k) of the Code.
Limitations on the Deductibility of Compensation
Section 162(m) of the Code generally disallows a federal income tax deduction to public corporations for compensation greater than $1 million paid for any fiscal year to the corporation’s named executive officers other than the Chief Financial Officer. As we are not currently publicly-traded, our board has not previously taken the deductibility limit imposed by Section 162(m) into consideration in setting compensation. We expect that our compensation committee, when formed, will adopt a policy that, where reasonably practicable, will seek to qualify the variable compensation paid to our named executive officers for an exemption from the deductibility limitations of Section 162(m). Until such policy is implemented, the compensation committee may, in its judgment, authorize compensation payments that do not consider the deductibility limit imposed by Section 162(m) when it believes that such payments are appropriate to attract and retain executive talent.
147
Table of Contents
Potential Payments upon Termination or Change of Control
In the event of a termination of employment or change of control, Class D interests are subject to acceleration or extended periods during which the Class D interests have an opportunity to vest, as described in “—Long-Term Incentives (“LTI”)” above, and the named executive officers are entitled to the cash and non-cash severance benefits in accordance with the terms of their employment agreements, as described in “—Employment Agreements.”
Employment Agreements
Messrs. Hill, Rauh, and Gill each have employment agreements. Their employment agreements provide for base salary subject to annual adjustment by the board, an annual incentive award, participation in Company-sponsored broad-based and executive benefit plans and such other compensation as may be approved by the board. Generally, our employment agreements have an initial term of three years, unless earlier terminated or otherwise renewed pursuant to the terms thereof and are automatically extended for successive one-year periods following the expiration of each term unless notice is given by us or the executive not to renew.
Thomas W. Hill
Summit Holdings entered into an employment agreement with Mr. Hill, dated as of July 30, 2009, whereby Mr. Hill serves as the Chief Executive Officer of Summit Holdings and the Chief Executive Officer of the entity that served as the general partner of Summit Holdings prior to the consummation of this offering. Mr. Hill also will continue to serve as a member of the board so long as he serves in the foregoing capacities. Mr. Hill’s employment agreement had an initial term equal to three years commencing on July 30, 2009, which is automatically extended for additional one-year periods, unless Summit Holdings or Mr. Hill provides the other party 60 days’ prior written notice before the next extension date that the employment term will not be so extended. However, if Summit Holdings is dissolved pursuant to the terms of its limited partnership agreement, then the employment term shall automatically and immediately be terminated. On July 30, 2014, Mr. Hill’s employment agreement was automatically extended for an additional year.
Pursuant to the terms of his employment agreement, Mr. Hill’s initial annual base salary was $300,000, which amount is reviewed annually by the board, and may be increased (but not decreased). His base salary in 2013 was $525,000. Mr. Hill is also eligible to earn an annual bonus of up to 100% of his base salary based upon the achievement of performance targets established by the board within the first three months of each fiscal year during the employment term. The board, in its sole discretion, may appropriately adjust such performance targets in any fiscal year to reflect any merger, acquisition or divestiture affected by Summit Holdings during such fiscal year. Mr. Hill is also entitled to participate in Summit Holdings’ employee benefit plans, as in effect from time to time, on the same basis as those benefits are generally made available to other senior executives of Summit Holdings.
If Mr. Hill’s employment is terminated (i) by Summit Holdings with “cause” or (ii) by him other than as a result of a “constructive termination,” (as defined in the employment agreement), he will be entitled to certain accrued amounts. If Mr. Hill’s employment is terminated as a result of his death or “disability” (as defined in the employment agreement), he will be entitled to receive (a) certain accrued amounts and (b) a pro rata portion of the annual bonus, if any, that Mr. Hill would have been entitled to receive, payable when such annual bonus would have otherwise been payable to him had his employment not been terminated. If Mr. Hill’s employment is terminated (i) by Summit Holdings without cause or (ii) by him as a result of a “constructive termination,” subject to his continued compliance with certain restrictive covenants and his non-revocation of a general release of claims, he will be entitled to receive (a) certain accrued amounts, (b) continued payment of his base salary in accordance with Summit Holdings’ normal payroll practices, as in effect on the date of termination of his employment, until 18 months after the date of such termination and (c) an amount equal to one and one-half times his annual bonus in respect of the fiscal year immediately preceding the applicable year of his termination of employment; provided that the aggregate amounts shall be reduced by the present value of any other cash severance or termination benefits payable to him under any other plans, programs or arrangements of Summit Holdings or its affiliates.
148
Table of Contents
In the event (i) Mr. Hill elects not to extend the employment term or (ii) of a “dissolution” with a “negative return” (as such terms are defined in the employment agreement), unless Mr. Hill’s employment is earlier terminated, Mr. Hill’s termination of employment shall be deemed to occur on the close of business on the earlier of the effective date of “dissolution” or the day immediately preceding the next scheduled extension date, and Mr. Hill shall be entitled to receive certain accrued amounts. In the event (i) that Summit Holdings elects not to extend the employment term or (ii) of a “dissolution” with a “positive return” (as such terms are defined in his employment agreement), Mr. Hill shall be treated as terminated without cause effective as of the close of business on the day immediately preceding the next scheduled extension date or the effective date of the “dissolution,” and shall be entitled to receive the amounts and benefits for termination without cause described above.
Pursuant to the terms of his employment agreement, Mr. Hill is subject to the following covenants: (i) a covenant not to disclose confidential information while employed and at all times thereafter; (ii) a covenant not to compete for a period of 18 months following his termination of employment for any reason; and (iii) a covenant not to solicit employees or customers for a period of 18 months following his termination of employment for any reason.
Douglas C. Rauh
Summit Holdings entered into an employment agreement with Douglas C. Rauh, dated as of December 29, 2011, pursuant to which Mr. Rauh became our Regional President, East Region. Effective April 1, 2013, Mr. Rauh assumed the role of our Chief Operating Officer. His employment agreement otherwise remained in effect. Mr. Rauh’s employment agreement has an initial term equal to three years commencing on January 1, 2012 which will be automatically extended for additional one-year periods, unless Summit Holdings or Mr. Rauh provides the other party 60 days’ prior written notice before the next extension date that the employment term will not be so extended. The employment term will automatically and immediately be terminated upon a “dissolution” (as defined in the employment agreement).
Pursuant to the terms of his employment agreement, Mr. Rauh’s annual base salary is $450,000, which amount is reviewed annually by the board, and may be increased (but not decreased). Mr. Rauh’s base salary for 2013 was $475,000. Mr. Rauh is also eligible to earn an annual bonus of up to 60% of his base salary based upon the achievement of performance targets established by the board within the first three months of each fiscal year during the employment term, with a potential bonus of up to 90% of his base salary for extraordinary performance. The board, in its sole discretion, may appropriately adjust such performance targets in any fiscal year to reflect any merger, acquisition or divestiture affected by Summit Holdings during such fiscal year. Notwithstanding the foregoing, Mr. Rauh’s minimum annual bonus for 2012 (payable in 2013) was $150,000. In addition, after Mr. Rauh commenced his employment, Summit Holdings paid Mr. Rauh a starting bonus of $400,000 in a lump sum. Mr. Rauh is entitled to a car allowance in the amount of $1,000 per month for car expenses, in addition to reimbursement from Summit Holdings for Mr. Rauh’s actual expenditures for gasoline, upon submission of appropriate documentation.
The employment agreement further provides that Summit Holdings reimburse Mr. Rauh for any loss suffered by Mr. Rauh in connection with the sale of his residence in Ohio, the actual out of pocket loss incurred by Mr. Rauh on the sale of his residence in Ohio, a gross-up of all income taxes imposed on Mr. Rauh in connection with the reimbursement payment, the cost of up to three visits by Mr. Rauh and his family to the Washington, D.C. area in connection with the search for a new residence, three months of the reasonable rental of a house in the Washington, D.C. area, and reasonable moving expenses incurred by Mr. Rauh in connection with his relocation. These obligations were satisfied by Summit Holdings in 2012 and are included in the amounts reported for Mr. Rauh in 2012 in the “All Other Compensation” column of the Summary Compensation Table. In addition, the agreement provides that Summit Holdings reimburse Mr. Rauh for his out of pocket costs for payment of COBRA continuation premiums in connection with health care insurance covering Mr. Rauh and his family, until such time as Mr. Rauh and his family obtain coverage under Summit Holdings’ health care
149
Table of Contents
insurance plan. These obligations were satisfied by Summit Holdings in 2012 and are also included in the amounts reported for Mr. Rauh in 2012 in the “All Other Compensation” column of the Summary Compensation Table. Mr. Rauh is also entitled to participate in Summit Holdings’ employee benefit plans as in effect from time to time, on the same basis as those benefits are generally made available to other senior executives of Summit Holdings.
If Mr. Rauh’s employment is terminated (i) by Summit Holdings with “cause” (as defined in the employment agreement) or (ii) by him other than as a result of a “constructive termination” (as defined in the employment agreement), he will be entitled to receive (a) certain accrued amounts, (b) a pro rata portion of the annual bonus and (c) certain vested employee benefits, and if Mr. Rauh’s employment is terminated as a result of his death or “disability” (as defined in his employment agreement), he will be entitled to receive (a) certain accrued amounts, (b) a pro rata portion of the annual bonus, if any, that Mr. Rauh would have been entitled to receive, payable when such annual bonus would have otherwise been payable to him had his employment not terminated and (c) the costs of COBRA health continuation coverage for 18 months (or, if shorter, until COBRA coverage ends under Summit Holdings’ group health plan). If Mr. Rauh’s employment is terminated (i) by Summit Holdings without cause or (ii) by him as a result of a “constructive termination” (as defined in his employment agreement), subject to his continued compliance with certain restrictive covenants and his non-revocation of a general release of claims, he will be entitled to receive (a) certain accrued amounts, (b) continued payment of his base salary in accordance with Summit Holdings’ normal payroll practices, as in effect on the date of termination of his employment, until 12 months after the date of such termination (the “Severance Period”), (c) an amount equal to Mr. Rauh’s annual bonus in respect of the fiscal year immediately preceding the applicable year of Mr. Rauh’s termination of employment, payable in equal monthly installments for 18 months after the date of such termination and (d) the costs of COBRA health continuation coverage for the lesser of the Severance Period or 18 months (or, if shorter, until COBRA coverage ends under Summit Holdings’ group health plan); provided that the aggregate amounts shall be reduced by the present value of any other cash severance or termination benefits payable to Mr. Rauh under any other plans, programs or arrangements of Summit Holdings or its affiliates.
In the event (i) Mr. Rauh elects not to extend the employment term or (ii) of a “dissolution” (as such term is defined in his employment agreement) in connection with which the Sponsors do not receive a return on their investment, unless Mr. Rauh’s employment is earlier terminated, Mr. Rauh’s termination of employment shall be deemed to occur on the close of business on the earlier of the effective date of “dissolution” or the day immediately preceding the next scheduled extension date, and Mr. Rauh shall be entitled to receive certain accrued amounts. In the event (i) that Summit Holdings elects not to extend the employment term or (ii) of a “dissolution” in connection with which the Sponsors receive a return on their investment, Mr. Rauh shall be treated as terminated without cause effective as of the close of business on the day immediately preceding the next scheduled extension date or the effective date of the “dissolution,” and shall be entitled to receive the amounts and benefits for termination without cause described above.
Pursuant to the terms of his employment agreement, Mr. Rauh is subject to the following covenants: (i) a covenant not to disclose confidential information while employed and at all times thereafter; (ii) a covenant not to compete for a period of 12 months following his termination of employment for any reason; and (iii) a covenant not to solicit employees or customers for a period of 12 months following his termination of employment for any reason.
Kevin A. Gill
Summit Holdings entered into an employment agreement with Kevin A. Gill, dated as of November 11, 2013, whereby Mr. Gill serves as our Chief Human Resource Officer. Mr. Gill’s employment agreement has an initial term equal to three years commencing on May 21, 2013 which will be automatically extended for additional one-year periods, unless Summit Holdings or Mr. Gill provides the other party 60 days’ prior written notice before the next extension date that the employment term will not be so extended. The employment term will automatically and immediately be terminated upon a “dissolution” (as defined in his employment agreement).
150
Table of Contents
Pursuant to the terms of his employment agreement, Mr. Gill’s initial annual base salary is $300,000, which amount is reviewed annually by the board, and may be increased (but not decreased). Mr. Gill is also eligible to earn an annual bonus of up to 60% of his base salary based upon the achievement of performance targets established by the board within the first three months of each fiscal year during the employment term, with a potential bonus of up to 150% of his base salary for extraordinary performance. The board, in its sole discretion, may appropriately adjust such performance targets in any fiscal year to reflect any merger, acquisition or divestiture affected by Summit Holdings during such fiscal year. The annual bonus would be paid in a cash lump sum during the calendar year immediately following the fiscal year in which it is earned. In addition, after Mr. Gill commenced his employment, Summit Holdings paid Mr. Gill a starting bonus of $20,000 in a lump sum. Mr. Gill is entitled to a car allowance in the amount of $1,000 per month for car expenses.
The employment agreement further provides for reimbursement of three to four months of the reasonable rental of a house in Colorado, the closing costs associated with the sale of his home in North Carolina and any actual out of pocket loss incurred by Mr. Gill on the sale of his residence in North Carolina. These reimbursements are subject to a gross-up of all income taxes imposed on Mr. Gill in connection with the reimbursement payments. In addition, the agreement provides that Summit Holdings reimburse Mr. Gill for his out of pocket costs for payment of COBRA continuation premiums in connection with health care insurance covering Mr. Gill and his family, until such time as Mr. Gill and his family obtain coverage under Summit Holdings’ health care insurance plan. These obligations were satisfied by Summit Holdings in 2013 and are included in the “All Other Compensation” column of the Summary Compensation Table. Mr. Gill is also entitled to participate in Summit Holdings’ employee benefit plans as in effect from time to time, on the same basis as those benefits are generally made available to other senior executives of Summit Holdings.
If Mr. Gill’s employment is terminated (i) by Summit Holdings with “cause” (as defined in the employment agreement) or (ii) by him other than as a result of a “constructive termination” (as defined in the employment agreement), he will be entitled to receive (a) certain accrued amounts, (b) a pro rata portion of the annual bonus and (c) certain vested employee benefits, and if Mr. Gill’s employment is terminated as a result of his death or “disability” (as defined in his employment agreement), he will be entitled to (a) certain accrued amounts, (b) a pro rata portion of the annual bonus, if any, that Mr. Gill would have been entitled to receive, payable when such annual bonus would have otherwise been payable to him had his employment not terminated and (c) the costs of COBRA health continuation coverage for 18 months (or, if shorter, until COBRA coverage ends under Summit Holdings’ group health plan). If Mr. Gill’s employment is terminated (i) by Summit Holdings without cause or (ii) by him as a result of a “constructive termination” (as defined in his employment agreement), subject to his continued compliance with certain restrictive covenants and his non-revocation of a general release of claims, he will be entitled to receive (a) certain accrued amounts, (b) continued payment of his base salary in accordance with Summit Holdings’ normal payroll practices, as in effect on the date of termination of his employment, until 12 months after the date of such termination (the “Severance Period”) and (c) the costs of COBRA health continuation coverage for the lesser of the Severance Period or 18 months (or, if shorter, until COBRA coverage ends under Summit Holdings’ group health plan); provided that the aggregate amounts shall be reduced by the present value of any other cash severance or termination benefits payable to Mr. Gill under any other plans, programs or arrangements of Summit Holdings or its affiliates.
In the event (i) Mr. Gill elects not to extend the employment term or (ii) of a “dissolution” (as such term is defined in his employment agreement) in connection with which the Sponsors do not receive a return on their investment, unless Mr. Gill’s employment is earlier terminated, Mr. Gill’s termination of employment shall be deemed to occur on the close of business on the earlier of the effective date of “dissolution” or the day immediately preceding the next scheduled extension date, and Mr. Gill shall be entitled to receive certain accrued amounts. In the event (i) that Summit Holdings elects not to extend the employment term or (ii) of a “dissolution” in connection with which the Sponsors receive a return on their investment, Mr. Gill shall be treated as terminated without cause effective as of the close of business on the day immediately preceding the next scheduled extension date or the effective date of the “dissolution,” and shall be entitled to receive the amounts and benefits described above.
151
Table of Contents
Pursuant to the terms of his employment agreement, Mr. Gill is subject to the following covenants: (i) a covenant not to compete for a period of 12 months following his termination of employment by Summit Holdings without cause, (ii) a covenant not to disclose confidential information while employed and at all times thereafter; and (iii) a covenant not to solicit employees or customers for a period of 12 months following his termination of employment by Summit Holdings without cause.
Outstanding Equity Awards at 2013 Fiscal Year End
A summary of the outstanding equity awards for each named executive officer as of December 28, 2013 is as follows:
| Stock Awards | ||||||||||||||||||||
| Name |
Grant Date | Number of shares or units of stock that have not vested (#)(1) |
Market value of shares or units of stock that have not vested ($)(2) |
Equity incentive plan awards: Number of unearned shares, units or other rights that have not vested (#)(3) |
Equity incentive plan awards: Market or payout value of unearned shares, units or other rights that have not vested ($)(2) |
|||||||||||||||
| Thomas W. Hill |
08/25/2009 | 20 | 56,929 | 195 | 452,414 | |||||||||||||||
| 02/17/2010 | 52 | 145,560 | 312 | 723,076 | ||||||||||||||||
| 04/16/2010 | 11 | 30,652 | 58 | 135,297 | ||||||||||||||||
| 05/27/2010 | 89 | 247,153 | 407 | 941,758 | ||||||||||||||||
| 06/15/2010 | 10 | 28,288 | 45 | 104,143 | ||||||||||||||||
| 08/02/2010 | 42 | 117,549 | 173 | 401,045 | ||||||||||||||||
| 09/15/2010 | 33 | 92,341 | 123 | 285,683 | ||||||||||||||||
| 11/30/2010 | 5 | 14,944 | 20 | 46,744 | ||||||||||||||||
| 05/27/2011 | 52 | 144,049 | 140 | 322,857 | ||||||||||||||||
| 08/02/2011 | 43 | 118,725 | 107 | 248,216 | ||||||||||||||||
| 10/28/2011 | 27 | 73,863 | 61 | 664,729 | ||||||||||||||||
| Douglas C. Rauh |
01/01/2012 | 134 | 372,780 | 290 | 671,035 | |||||||||||||||
| 08/21/2013 | 37 | 103,553 | 48 | 111,831 | ||||||||||||||||
| Kevin A. Gill |
05/21/2013 | 74 | 207,126 | 97 | 223,676 | |||||||||||||||
| (1) | Reflects time-vesting Class D interests, 20% of which vest on the first anniversary of the grant date and the remaining 80% vest monthly over the four years following the first anniversary of the grant date. The time-vesting interests will become fully vested on an accelerated basis upon a change in control while the employee continues to provide services to us. Any of the time-vesting interests that are unvested upon termination of the employee’s services will be forfeited by the employee. |
| (2) | Reflects the aggregated market values at December 28, 2013 based on the most recent valuation of the Class D interests. |
| (3) | Reflects performance-vesting interests that vest when certain investment returns are achieved by Summit Holdings’ investors while the employee continues to provide services to us or our subsidiaries. |
In connection with this offering, we expect that our directors, officers and employees will surrender all Class D interests held by them and receive LP Units and leverage restoration options (as described above). The number of LP Units and leverage restoration options (as described above) delivered to such Class D interest holders will be determined in a manner intended to replicate the economic benefit provided by the Class D interests based upon the valuation of us derived from the initial public offering price. The LP Units delivered to each Class D interest holder will have approximately the same value as the liquidation value of the Class D interests held by the equity holder immediately prior to such transaction, and the options to purchase Class A shares will restore part of the economic benefit of the Class D interests that is not reflected in the LP Units.
152
Table of Contents
Compensation Program Risk Assessment
The board performed a risk assessment and concluded that our compensation programs are not reasonably likely to have a material adverse effect on us. The following factors mitigate risk associated with our compensation programs:
| • | annual Goal setting process with incentives linked to business results; |
| • | annual performance review process where results are assessed against goals; |
| • | board review of goals, results and incentive amounts; and |
| • | maximum payout opportunity is capped. |
Director Compensation
We do not currently pay our directors who are either employed by us, Blackstone or Silverhawk compensation for their services as directors. In connection with this offering, we expect that our directors who are employed by Blackstone will waive their right to any compensation for their service on the board of directors. Our other directors receive compensation for each quarter serving as a director and equity incentive awards. We may also reimburse our other directors for any reasonable expenses incurred by them in connection with services provided in such capacity.
Howard L. Lance
Howard L. Lance is entitled to an annual cash retainer of $250,000 pursuant to an agreement under which Mr. Lance agreed to serve as a director. In March 2013, Mr. Lance was granted 434.34 Class D-1 interests and 65.2 Class D-2 interests consistent with the terms describe above in “—Long-Term Incentives (“LTI”)” above, except that Mr. Lance’s equity award is subject to vesting based solely on his continued service on the board. Assuming an offering price of $ per share of Class A common stock, which is the midpoint of the range on the front cover of this prospectus, the aggregate number of vested and unvested LP Units issued to Mr. Lance in respect of Class D interests would be , and the number of leverage restoration options would be .
John R. Murphy
John R. Murphy is entitled to an annual cash retainer of $100,000. In addition, Mr. Murphy is entitled to an annual equity grant of $50,000 for his service as director, for which, in 2013, he was granted 8.6 Class D-1 interests and 1.3 Class D-2 interests, consistent with the terms describe above in “—Long-Term Incentives (“LTI”)” above, except that Mr. Murphy’s equity award is subject to vesting based solely on his continued service on the board. Mr. Murphy was compensated $316,274 for his services as our Interim Chief Financial Officer from January 2013 to May 2013 and from July 2013 to October 2013. Assuming an offering price of $ per share of Class A common stock, which is the midpoint of the range on the front cover of this prospectus, the aggregate number of vested and unvested LP Units issued to Mr. Murphy in respect of Class D interests would be , and the number of leverage restoration options would be .
The table below summarizes the compensation paid to non-employee directors for their board service during the year ended December 28, 2013.
| Name |
Fees Earned or Paid in Cash |
Stock Awards(1) |
Total Compensation |
|||||||||
| Howard L. Lance |
$ | 250,000 | $ | 605,047 | $ | 855,047 | ||||||
| John R. Murphy |
100,000 | 12,101 | 112,101 | |||||||||
| Neil P. Simpkins |
— | — | — | |||||||||
| Ted A. Gardner |
— | — | — | |||||||||
| Julia C. Kahr |
— | — | — | |||||||||
153
Table of Contents
| (1) | The amount reported in the Stock Awards column reflects the aggregate grant date fair value of our Class D interests computed in accordance with ASC 718. The assumptions applied in determining the fair value of the stock awards are discussed in Note 19, Employee Long-Term Incentive Plan, to our December 28, 2013 audited consolidated financial statements included elsewhere in this prospectus. This amount reflects our calculation of the value of the awards at the grant date and does not necessarily correspond to the actual value that may ultimately be recognized by the director. |
Summit Materials, Inc. 2015 Omnibus Incentive Plan
In connection with this offering, our board of directors expects to adopt, and our stockholders expect to approve, the Omnibus Incentive Plan prior to the completion of the offering.
Purpose
The purpose of the Omnibus Incentive Plan is to provide a means through which to attract and retain key personnel and to provide a means whereby our directors, officers, employees, consultants and advisors (and prospective directors, officers, employees, consultants and advisors) can acquire and maintain an equity interest in us, or be paid incentive compensation, including incentive compensation measured by reference to the value of our Class A common stock, thereby strengthening their commitment to our welfare and aligning their interests with those of our stockholders.
Administration
The Omnibus Incentive Plan will be administered by the compensation committee of our board of directors or such other committee of our board of directors to which it has delegated power, or if no such committee or subcommittee thereof exists, the board of directors (as applicable, the “Committee”). The Committee has the sole and plenary authority to establish the terms and conditions of any award consistent with the provisions of the Omnibus Incentive Plan. The Committee is authorized to interpret, administer, reconcile any inconsistency in, correct any defect in and/or supply any omission in the Omnibus Incentive Plan and any instrument or agreement relating to, or any award granted under, the Omnibus Incentive Plan; establish, amend, suspend, or waive any rules and regulations and appoint such agents as the Committee deems appropriate for the proper administration of the Omnibus Incentive Plan; and to make any other determination and take any other action that the Committee deems necessary or desirable for the administration of the Omnibus Incentive Plan. Except to the extent prohibited by applicable law or the applicable rules and regulations of any securities exchange or inter-dealer quotation system on which the securities of the Company are listed or traded, the Committee may allocate all or any portion of its responsibilities and powers to any one or more of its members and may delegate all or any part of its responsibilities and powers to any person or persons selected by it in accordance with the terms of the Omnibus Incentive Plan. Any such allocation or delegation may be revoked by the Committee at any time. Unless otherwise expressly provided in the Omnibus Incentive Plan, all designations, determinations, interpretations, and other decisions under or with respect to the Omnibus Incentive Plan or any award or any documents evidencing awards granted pursuant to the Omnibus Incentive Plan are within the sole discretion of the Committee, may be made at any time and are final, conclusive and binding upon all persons or entities, including, without limitation, us, any participant, any holder or beneficiary of any award, and any of our stockholders.
Shares Subject to the Omnibus Incentive Plan
The Omnibus Incentive Plan provides that the total number of shares of Class A common stock that may be issued under the Omnibus Incentive Plan is . Of this amount, the maximum number of Interests for which incentive stock options may be granted is ; the maximum number of shares of Class A common stock for which options or stock appreciation rights may be granted to any individual participant during any single fiscal
154
Table of Contents
year is ; the maximum number of shares for which performance compensation awards denominated in shares may be granted to any individual participant in respect of a single fiscal year is (or if any such awards are settled in cash, the maximum amount may not exceed the fair market value of such shares on the last day of the performance period to which such award relates); the maximum number of shares of Class A common stock granted during a single fiscal year to any non-employee director, taken together with any cash fees paid to such non-employee director during the fiscal year, shall not exceed $ million in total value; and the maximum amount that may be paid to any individual participant for a single fiscal year under a performance compensation award denominated in cash is $ million. Except for substitute awards (as described below), in the event any award terminates, lapses, or is settled without the payment of the full number of shares subject to such award, including as a result of net settlement of the award or as a result of the award being settled in cash, the undelivered shares may be granted again under the Omnibus Incentive Plan, unless the shares are surrendered after the termination of the Omnibus Incentive Plan, and only if stockholder approval is not required under the then-applicable rules of the exchange on which the shares of Class A common stock are listed. Awards may, in the sole discretion of the Committee, be granted in assumption of, or in substitution for, outstanding awards previously granted by an entity directly or indirectly acquired by us or with which we combine (referred to as “substitute awards”), and such substitute awards shall not be counted against the total number of shares that may be issued under the Omnibus Incentive Plan, except that substitute awards intended to qualify as “incentive stock options” shall count against the limit on incentive stock options described above. No award may be granted under the Omnibus Incentive Plan after the tenth anniversary of the effective date (as defined therein), but awards theretofore granted may extend beyond that date.
Options
The Committee may grant non-qualified stock options and incentive stock options under the Omnibus Incentive Plan, with terms and conditions determined by the Committee that are not inconsistent with the Omnibus Incentive Plan; provided that all stock options granted under the Omnibus Incentive Plan are required to have a per share exercise price that is not less than 100% of the fair market value of our Class A common stock underlying such stock options on the date such stock options are granted (other than in the case of options that are substitute awards), and all stock options that are intended to qualify as incentive stock options must be granted pursuant to an award agreement expressly stating that the options are intended to qualify as an incentive stock option, and will be subject to the terms and conditions that comply with the rules as may be prescribed by Section 422 of the Code. The maximum term for stock options granted under the Omnibus Incentive Plan will be ten years from the initial date of grant, or with respect to any stock options intended to qualify as incentive stock options, such shorter period as prescribed by Section 422 of the Code. However, if a non-qualified stock option would expire at a time when trading of shares of Class A common stock is prohibited by our insider trading policy (or “blackout period” imposed by us), the term will automatically be extended to the 30th day following the end of such period. The purchase price for the Class A shares as to which a stock option is exercised may be paid to us, to the extent permitted by law (1) in cash or its equivalent at the time the stock option is exercised, (2) in Class A shares having a fair market value equal to the aggregate exercise price for the shares being purchased and satisfying any requirements that may be imposed by the Committee, or (3) by such other method as the Committee may permit in its sole discretion, including without limitation (A) in other property having a fair market value on the date of exercise equal to the purchase price, (B) if there is a public market for the Class A shares at such time, through the delivery of irrevocable instructions to a broker to sell the shares being acquired upon the exercise of the stock option and to deliver to us the amount of the proceeds of such sale equal to the aggregate exercise price for the Class A shares being purchased, or (C) through a “net exercise” procedure effected by withholding the minimum number of shares needed to pay the exercise price and all applicable required withholding taxes. Any fractional shares of Class A common stock will be settled in cash.
Stock Appreciation Rights
The Committee may grant stock appreciation rights, with terms and conditions determined by the Committee that are not inconsistent with the Omnibus Incentive Plan. Generally, each stock appreciation right will entitle the participant upon exercise to an amount (in cash, Class A shares or a combination of cash and
155
Table of Contents
Class A shares, as determined by the Committee) equal to the product of (1) the excess of (A) the fair market value on the exercise date of one share of Class A common stock, over (B) the strike price per share, times (2) the numbers of shares of Class A common stock covered by the stock appreciation right. The strike price per share of a stock appreciation right will be determined by the Committee at the time of grant but in no event may such amount be less than the fair market value of a share of Class A common stock on the date the stock appreciation right is granted (other than in the case of stock appreciation rights granted in substitution of previously granted awards). The Committee may in its sole discretion substitute, without the consent of the holder or beneficiary of such stock appreciation rights, stock appreciation rights settled in shares of Class A common stock (or settled in shares or cash in the sole discretion of the Committee) for nonqualified stock options.
Restricted Shares and Restricted Stock Units
The Committee may grant restricted shares of our Class A common stock or restricted stock units, representing the right to receive, upon the expiration of the applicable restricted period, one share of Class A common stock for each restricted stock unit, or, in the sole discretion of the Committee, the cash value thereof (or any combination thereof). As to restricted shares of our Class A common stock, subject to the other provisions of the Omnibus Incentive Plan, the holder will generally have the rights and privileges of a stockholder as to such restricted shares of Class A common stock, including, without limitation, the right to vote such restricted shares of Class A common stock and to receive any dividends payable on such restricted shares (except, that if the lapsing of restrictions with respect to such restricted shares of Class A common stock is contingent on satisfaction of performance conditions other than or in addition to the passage of time, any dividends payable on such restricted shares of Class A common stock will be retained, and delivered without interest to the holder of such shares when the restrictions on such shares lapse). To the extent provided in the applicable award agreement, the holder of outstanding restricted stock units will be entitled to be credited with dividend equivalent payments (upon the payment by us of dividends on shares of Class A common stock) either in cash or, at the sole discretion of the Committee, in shares of Class A common stock having a value equal to the amount of such dividends (and interest may, at the sole discretion of the Committee, be credited on the amount of cash dividend equivalents at a rate and subject to such terms as determined by the Committee), which will be payable at the same time as the underlying restricted stock units are settled following the release of restrictions on such restricted stock units.
LP Unit Awards
The Committee may issue awards in the form of LP Units or other classes of partnership units in Summit Holdings established pursuant to Summit Holdings’ agreement of limited partnership. LP Unit awards will be valued by reference to, or otherwise determined by reference to or based on, shares of our Class A common stock. LP Unit awards may be (1) convertible, exchangeable or redeemable for other limited partnership interests in Summit Holdings or shares of our Class A common stock or (2) valued by reference to the book value, fair value or performance of Summit Holdings. Other than to the extent required in connection with the issuance of our Class A common stock, we generally do not expect to issue awards of LP Units under the Omnibus Incentive Plan unless the Committee determines that an award of LP Units is appropriate.
For purposes of calculating the number of shares underlying LP Unit award relative to the total number of shares of our Class A common stock available for issuance under the Omnibus Incentive Plan, the Committee will establish in good faith the maximum number of shares to which a participant receiving LP Unit award may be entitled upon fulfillment of all applicable conditions set forth in the relevant award documentation, including vesting conditions, partnership capital account allocations, value accretion factors, conversion ratios, exchange ratios and other similar criteria. If and when any such conditions are no longer capable of being met, in whole or in part, the number of shares of our Class A common stock underlying such LP Unit award will be reduced accordingly by the Committee, and the number of shares available under the Omnibus Incentive Plan will be increased by one share for each share so reduced. The Committee will determine all other terms of LP Unit
156
Table of Contents
award. The award documentation in respect of LP Unit award may provide that the recipient will be entitled to receive, currently or on a deferred or contingent basis, dividends or dividend equivalents with respect to the number of shares of our Class A common stock underlying the award or other distributions from Summit Holdings prior to vesting (whether based on a period of time or based on attainment of specified performance conditions), as determined at the time of grant by the Committee, in its sole discretion, and the Committee may provide that such amounts (if any) will be deemed to have been reinvested in additional shares of our Class A common stock or other LP Units.
Other Stock-Based or Cash-Based Awards
The Committee may issue unrestricted Class A common stock, rights to receive grants of awards at a future date, or other awards denominated in shares of Class A common stock (including, without limitation, performance shares or performance units) or other awards denominated in cash (including cash bonuses), under the Omnibus Incentive Plan, including performance-based awards, with terms and conditions determined by the Committee that are not inconsistent with the Omnibus Incentive Plan.
Performance Compensation Awards
The Committee may also designate any award as a “performance compensation award” intended to qualify as “performance-based compensation” under Section 162(m) of the Code. The Committee also has the authority to make an award of a cash bonus to any participant and designate such award as a performance compensation award under the Omnibus Incentive Plan. The Committee has sole discretion to select the length of any applicable performance periods, the types of performance compensation awards to be issued, the applicable performance criteria and performance goals, and the kinds and/or levels of performance goals that are to apply. The performance criteria that will be used to establish the performance goals may be based on the attainment of specific levels of our performance (and/or one or more affiliates, divisions or operational and/or business units, product lines, brands, business segments, administrative departments, or any combination of the foregoing) and are limited to the specific criteria that are enumerated in the Omnibus Incentive Plan. Any one or more of the performance criteria may be stated as a percentage of another performance criteria, or used on an absolute or relative basis to measure our performance as a whole or any of our divisions or operational and/or business units, product lines, brands, business segments, administrative departments or any combination thereof, as the Committee may deem appropriate, or any of the above performance criteria may be compared to the performance of a selected group of comparison companies, or a published or special index that the Committee, in its sole discretion, deems appropriate, or as compared to various stock market indices. Unless otherwise determined by the Committee at the time a performance compensation award is granted, the Committee shall, during the first 90 days of a performance period (or, within any other maximum period allowed under Section 162(m) of the Code), or at any time thereafter to the extent the exercise of such authority at such time would not cause the performance compensation awards granted to any participant for such performance period to fail to qualify as “performance-based compensation” under Section 162(m) of the Code, specify adjustments or modifications to be made to the calculation of a performance goal for such performance period, based on and in order to appropriately reflect the following events: (1) asset write-downs; (2) litigation, claims, judgments or settlements; (3) the effect of changes in tax laws, accounting principles, or other laws or regulatory rules affecting reported results; (4) any reorganization and restructuring programs; (5) extraordinary nonrecurring items as described in Accounting Standards Codification Topic 225-20 (or any successor pronouncement thereto) and/or in management’s discussion and analysis of financial condition and results of operations appearing in our annual report to stockholders for the applicable year; (6) acquisitions or divestitures; (7) any other specific, unusual or nonrecurring events, or objectively determinable category thereof; (8) foreign exchange gains and losses; (9) discontinued operations and nonrecurring charges; (10) a change in our fiscal year; (11) accruals for payments to be made in respect of the Omnibus Incentive Plan or other specified compensation arrangements; and (12) any other changes in capital structure (or similar events) specified in the Omnibus Incentive Plan.
Following the completion of a performance period, the Committee will review and certify in writing whether, and to what extent, the performance goals for the performance period have been achieved and, if so,
157
Table of Contents
calculate and certify in writing that amount of the performance compensation awards earned for the period based upon the performance formula. In determining the actual amount of an individual participant’s performance compensation award for a performance period, the Committee has the discretion to reduce or eliminate the amount of the performance compensation award consistent with Section 162(m) of the Code. Unless otherwise provided in the applicable award agreement, the Committee does not have the discretion to (A) grant or provide payment in respect of performance compensation awards for a performance period if the performance goals for such performance period have not been attained; or (B) increase a performance compensation award above the applicable limitations set forth in the Omnibus Incentive Plan.
Effect of Certain Events on Omnibus Incentive Plan and Awards
In the event of (a) any dividend (other than regular cash dividends) or other distribution (whether in the form of cash, shares of Class A common stock, other securities or other property), recapitalization, stock split, reverse stock split, reorganization, merger, consolidation, split-up, split-off, spin-off, combination, repurchase or exchange of our shares of Class A common stock or other securities, issuance of warrants or other rights to acquire our shares of Class A common stock or other securities, or other similar corporate transaction or event (including, without limitation, a change in control, as defined in the Omnibus Incentive Plan) that affects the shares of Class A common stock, or (b) unusual or nonrecurring events (including, without limitation, a change in control) affecting us, any affiliate, or the financial statements of us or any affiliate, or changes in applicable rules, rulings, regulations or other requirements of any governmental body or securities exchange or inter-dealer quotation system, accounting principles or law, such that in either case an adjustment is determined by the Committee in its sole discretion to be necessary or appropriate, then the Committee must make any such adjustments in such manner as it may deem equitable, including, without limitation, any or all of: (i) adjusting any or all of (A) the share limits applicable under the Omnibus Incentive Plan with respect to the number of awards which may be granted hereunder, (B) the number of our shares of common stock or other securities which may be delivered in respect of awards or with respect to which awards may be granted under the Omnibus Incentive Plan and (C) the terms of any outstanding award, including, without limitation, (1) the number of shares of Class A common stock subject to outstanding awards or to which outstanding awards relate, (2) the exercise price or strike price with respect to any award or (3) any applicable performance measures; (ii) providing for a substitution or assumption of awards, accelerating the exercisability of, lapse of restrictions on, or termination of, awards or providing for a period of time for participants to exercise outstanding awards prior to the occurrence of such event; and (iii) cancelling any one or more outstanding awards and causing to be paid to the holders holding vested awards (including any awards that would vest as a result of the occurrence of such event but for such cancellation) the value of such awards, if any, as determined by the Committee (which if applicable may be based upon the price per share of Class A common stock received or to be received by other holders of our Class A common stock in such event), including without limitation, in the case of options and stock appreciation rights, a cash payment equal to the excess, if any, of the fair market value of the shares of Class A common stock subject to the option or stock appreciation right over the aggregate exercise price thereof. For the avoidance of doubt, the Committee may cancel any stock option or stock appreciation right for no consideration if the fair market value of the shares subject to such option or stock appreciation right is less than or equal to the aggregate exercise price or strike price of such stock option or stock appreciation right.
Nontransferability of Awards
An award will not be transferable or assignable by a participant, other than by will or by the laws of descent and distribution and any such purported assignment, alienation, pledge, attachment, sale, transfer or encumbrance will be void and unenforceable against us or any affiliate. However, the Committee may, in its sole discretion, permit awards (other than incentive stock options) to be transferred, including transfers to a participant’s family members, any trust established solely for the benefit of a participant or such participant’s family members, any partnership or limited liability company of which a participant, or such participant and such participant’s family members, are the sole member(s), and a beneficiary to whom donations are eligible to be treated as “charitable contributions” for tax purposes.
158
Table of Contents
Amendment and Termination
The board of directors may amend, alter, suspend, discontinue, or terminate the Omnibus Incentive Plan or any portion thereof at any time; provided, that no such amendment, alteration, suspension, discontinuation or termination may be made without stockholder approval if (1) such approval is necessary to comply with any regulatory requirement applicable to the Omnibus Incentive Plan or for changes in GAAP to new accounting standards, (2) it would materially increase the number of securities which may be issued under the Omnibus Incentive Plan (except for adjustments in connection with certain corporate events), or (3) it would materially modify the requirements for participation in the Omnibus Incentive Plan; provided, further, that any such amendment, alteration, suspension, discontinuance or termination that would materially and adversely affect the rights of any participant or any holder or beneficiary of any award shall not to that extent be effective without such individual’s consent. The Committee may also, to the extent consistent with the terms of any applicable award agreement, waive any conditions or rights under, amend any terms of, or alter, suspend, discontinue, cancel or terminate, any award granted or the associated award agreement, prospectively or retroactively, subject to the consent of the affected participant if any such waiver, amendment, alteration, suspension, discontinuance, cancellation or termination would materially and adversely affect the rights of any Participant with respect to such award; provided, further, that without stockholder approval, except as otherwise permitted in the Omnibus Incentive Plan, (1) no amendment or modification may reduce the exercise price of any option or the strike price of any stock appreciation right, (2) the Committee may not cancel any outstanding option or stock appreciation right and replace it with a new option or stock appreciation right (with a lower exercise price or strike price, as the case may be) or other award or cash payment that is greater than the value of the cancelled option or stock appreciation right, and (3) the Committee may not take any other action which is considered a “repricing” for purposes of the stockholder approval rules of any securities exchange or inter-dealer quotation system on which our securities are listed or quoted.
Dividends and Dividend Equivalents
The Committee in its sole discretion may provide part of an award with dividends or dividend equivalents, on such terms and conditions as may be determined by the Committee in its sole discretion; provided, that no dividends or dividend equivalents shall be payable in respect of outstanding (1) options or stock appreciation rights or (2) unearned performance compensation awards or other unearned awards subject to performance conditions (other than or in addition to the passage of time and other than awards structured as restricted stock) (although dividends or dividend equivalents may be accumulated in respect of unearned awards and paid within 15 days after such awards are earned and become earned, payable or distributable).
Clawback/Forfeiture
An award agreement may provide that the Committee may in its sole discretion cancel such award if the participant, while employed by or providing services to us or any affiliate or after termination of such employment or service, violates a non-competition, non-solicitation or non-disclosure covenant or agreement or otherwise has engaged in or engages in other detrimental activity that is in conflict with or adverse to the interests of any affiliate, including fraud or conduct contributing to any financial restatements or irregularities, as determined by the Committee in its sole discretion. The Committee may also provide in an award agreement that if the participant otherwise has engaged in or engages in any activity referred to in the preceding sentence, the participant will forfeit any gain realized on the vesting or exercise of such award, and must repay the gain to us. The Committee may also provide in an award agreement that if the participant receives any amount in excess of what the participant should have received under the terms of the award for any reason (including without limitation by reason of a financial restatement, mistake in calculations or other administrative error), then the participant shall be required to repay any such excess amount to us. Without limiting the foregoing, all awards shall be subject to reduction, cancellation, forfeiture or recoupment to the extent necessary to comply with applicable law.
159
Table of Contents
CERTAIN RELATIONSHIPS AND RELATED PERSON TRANSACTIONS
The agreements described in this section, or forms of such agreements as they will be in effect at the time of this offering, are filed as exhibits to the registration statement of which this prospectus forms a part, and the following descriptions are qualified by reference thereto.
Exchange Agreement
We will enter into an exchange agreement with the holders of LP Units pursuant to which each holder of LP Units (and certain permitted transferees thereof) may, from and after the first anniversary of the date of the completion of this offering (subject to the terms of the exchange agreement) exchange their LP Units for shares of Class A common stock of Summit Materials, Inc. on a one-for-one basis, subject to customary conversion rate adjustments for stock splits, stock dividends and reclassifications. Notwithstanding the foregoing, Blackstone is generally permitted to exchange LP Units at any time. The exchange agreement also provides that a holder of LP Units will not have the right to exchange LP Units if Summit Materials, Inc. determines that such exchange would be prohibited by law or regulation or would violate other agreements with Summit Materials, Inc. or its subsidiaries to which such holder may be subject. Summit Materials, Inc. may impose additional restrictions on exchange that it determines to be necessary or advisable so that Summit Holdings is not treated as a “publicly traded partnership” for U.S. federal income tax purposes. As a holder exchanges LP Units for shares of Class A common stock, the number of LP Units held by Summit Materials, Inc. is correspondingly increased as it acquires the exchanged LP Units. In accordance with the exchange agreement, any holder other than Summit Owner Holdco who surrenders all of its LP Units for exchange must concurrently surrender all shares of Class B common stock held by it (including fractions thereof) to Summit Materials, Inc.
Registration Rights Agreements
We will enter into one or more registration rights agreements with our pre-IPO owners pursuant to which we will grant them, their affiliates and certain of their transferees the right, under certain circumstances and subject to certain restrictions, to require us to register under the Securities Act the offering of shares of Class A common stock delivered in exchange for LP Units. Under the registration rights agreement, we will agree to register the exchange of LP Units for shares of Class A common stock by our pre-IPO owners. In addition, Blackstone will have the right to request an unlimited number of “demand” registrations, the Class B Unitholders will have the right to request one “demand” registration and Blackstone, certain other pre-IPO owners and the Class B Unitholders will have customary “piggyback” registration rights.
Tax Receivable Agreement
Holders of LP Units (other than Summit Materials, Inc.) may, subject to certain conditions, from and after the first anniversary of the date of the completion of this offering (subject to the terms of the exchange agreement), exchange their LP Units for shares of Class A common stock of Summit Materials, Inc. on a one-for-one basis. Summit Holdings intends to make an election under Section 754 of the Code effective for each taxable year in which an exchange of LP Units for shares of Class A common stock occurs, which is expected to result in increases to the tax basis of the tangible and intangible assets of Summit Holdings at the time of an exchange of LP Units. These increases in tax basis may reduce the amount of tax that Summit Materials, Inc. would otherwise be required to pay in the future. These increases in tax basis may also decrease gains (or increase losses) on future dispositions of certain capital assets to the extent tax basis is allocated to those capital assets. In addition, in the event the Investor Entities exercise their right to merge with us or be contributed to us (as described below under “—Stockholders’ Agreement,” we may be entitled to utilize the Investor Entities’ net operating losses, if any. The IRS may challenge all or part of the tax basis increase and increased deductions or net operating losses, and a court could sustain such a challenge.
Prior to the completion of this offering, we will enter into a tax receivable agreement with the holders of LP Units and certain other indirect pre-IPO owners that provides for the payment by Summit Materials, Inc. to exchanging holders of LP Units of 85% of the cash savings in income tax, if any, that Summit Materials, Inc. realizes as a result of (i) the increases in tax basis described above and (ii) our utilization of certain net operating
160
Table of Contents
losses of the Investor Entities described above and certain other tax benefits related to entering into the tax receivable agreement, including tax benefits attributable to payments under the tax receivable agreement. This payment obligation is an obligation of Summit Materials, Inc. and not of Summit Holdings. Summit Materials, Inc. expects to benefit from the remaining 15% of cash savings, if any, in income tax it realizes. For purposes of the tax receivable agreement, the cash savings in income tax will be computed by comparing the actual income tax liability of Summit Materials, Inc. (calculated with certain assumptions) to the amount of such taxes that Summit Materials, Inc. would have been required to pay had there been no increase to the tax basis of the assets of Summit Holdings as a result of the exchanges and no utilization of net operating losses of the Investor Entities and had Summit Materials, Inc. not entered into the tax receivable agreement. The term of the tax receivable agreement will continue until all such tax benefits have been utilized or expired, unless Summit Materials, Inc. exercises its right to terminate the tax receivable agreement for an amount based on the agreed payments remaining to be made under the agreement (as described in more detail below) or Summit Materials, Inc. breaches any of its material obligations under the tax receivable agreement in which case all obligations generally will be accelerated and due as if Summit Materials, Inc. had exercised its right to terminate the tax receivable agreement. Estimating the amount of payments that may be made under the tax receivable agreement is by its nature imprecise, insofar as the calculation of amounts payable depends on a variety of factors. The increases in tax basis as a result of an exchange, as well as the amount and timing of any payments under the tax receivable agreement, will vary depending upon a number of factors, including:
| • | the timing of exchanges—for instance, the increase in any tax deductions will vary depending on the fair market value, which may fluctuate over time, of the depreciable or amortizable assets of Summit Holdings at the time of each exchange; |
| • | the price of shares of our Class A common stock at the time of the exchange—the increase in any tax deductions, as well as the tax basis increase in other assets, of Summit Holdings, is directly proportional to the price of shares of our Class A common stock at the time of the exchange; |
| • | the extent to which such exchanges are taxable—if an exchange is not taxable for any reason, increased deductions will not be available; |
| • | the amount of net operating losses—the amount of net operating losses of the Investor Entities at the time of any applicable merger or contribution transaction will impact the amount and timing of payments under the tax receivable agreement; and |
| • | the amount and timing of our income—Summit Materials, Inc. will be required to pay 85% of the cash tax savings as and when realized, if any. If Summit Materials, Inc. does not have taxable income, Summit Materials, Inc. is not required (absent circumstances requiring an early termination payment) to make payments under the tax receivable agreement for that taxable year because no cash tax savings will have been realized. However, any tax attributes that do not result in realized benefits in a given tax year will likely generate tax attributes that may be utilized to generate benefits in previous or future tax years. The utilization of such tax attributes will result in cash tax savings that will result in payments under the tax receivable agreement. |
We anticipate that we will account for the effects of these increases in tax basis and payments for such increases under the tax receivable agreement arising from future exchanges as follows:
| • | we will record an increase in deferred tax assets for the estimated income tax effects of the increases in tax basis based on enacted federal and state tax rates at the date of the exchange; |
| • | to the extent we estimate that we will not realize the full benefit represented by the deferred tax asset, based on an analysis that will consider, among other things, our expectation of future earnings, we will reduce the deferred tax asset with a valuation allowance; and |
| • | we will record 85% of the estimated realizable tax benefit (which is the recorded deferred tax asset less any recorded valuation allowance) as an increase to the liability due under the tax receivable agreement and the remaining 15% of the estimated realizable tax benefit as an increase to additional paid-in capital. |
161
Table of Contents
All of the effects of changes in any of our estimates after the date of the exchange will be included in net income. Similarly, the effect of subsequent changes in the enacted tax rates will be included in net income.
We expect that as a result of the size of the increases in the tax basis of the tangible and intangible assets of Summit Holdings and our possible utilization of net operating losses, the payments that we may make under the tax receivable agreement will be substantial. There may be a material negative effect on our liquidity if, as a result of timing discrepancies or otherwise, the payments under the tax receivable agreement exceed the actual cash tax savings that Summit Materials, Inc. realizes in respect of the tax attributes subject to the tax receivable agreement and/or distributions to Summit Materials, Inc. by Summit Holdings are not sufficient to permit Summit Materials, Inc. to make payments under the tax receivable agreement after it has paid taxes. Late payments under the tax receivable agreement generally will accrue interest at an uncapped rate equal to LIBOR plus basis points. The payments under the tax receivable agreement are not conditioned upon continued ownership of us by holders of LP Units.
In addition, the tax receivable agreement provides that upon certain changes of control, Summit Materials, Inc.’s (or its successor’s) obligations with respect to exchanged or acquired LP Units (whether exchanged or acquired before or after such transaction) and other recipients would be based on certain assumptions, including that Summit Materials, Inc. would have sufficient taxable income to fully utilize the deductions arising from the tax deductions, tax basis and other tax attributes subject to the tax receivable agreement.
Furthermore, Summit Materials, Inc. may elect to terminate the tax receivable agreement early by making an immediate payment equal to the present value of the anticipated future cash tax savings. In determining such anticipated future cash tax savings, the tax receivable agreement includes several assumptions, including (i) that any LP Units that have not been exchanged are deemed exchanged for the market value of the shares of Class A common stock at the time of termination, (ii) Summit Materials, Inc. will have sufficient taxable income in each future taxable year to fully realize all potential tax savings, (iii) the tax rates for future years will be those specified in the law as in effect at the time of termination and (iv) certain non-amortizable assets are deemed disposed of within specified time periods. In addition, the present value of such anticipated future cash tax savings are discounted at a rate equal to LIBOR plus basis points. Assuming that the market value of a share of Class A common stock were to be equal to an assumed initial public offering price per share of Class A common stock in this offering of $ per share, which is the midpoint of the price range set forth on the cover of this prospectus, and that LIBOR were to be %, we estimate that the aggregate amount of these termination payments would be approximately $ if Summit Materials, Inc. were to exercise its termination right immediately following this offering.
As a result of the change in control provisions and the early termination right, Summit Materials, Inc. could be required to make payments under the tax receivable agreement that are greater than or less than the specified percentage of the actual cash tax savings that Summit Materials, Inc. realizes in respect of the tax attributes subject to the tax receivable agreement. In these situations, our obligations under the tax receivable agreement could have a substantial negative impact on our liquidity.
Decisions made by our pre-IPO owners may influence the timing and amount of payments that are received by an exchanging or selling existing owner under the tax receivable agreement. For example, the earlier disposition of assets following an exchange or acquisition transaction generally will accelerate payments under the tax receivable agreement and increase the present value of such payments, and the disposition of assets before an exchange or acquisition transaction will increase an existing owner’s tax liability without giving rise to any rights of an existing owner to receive payments under the tax receivable agreement.
Payments under the tax receivable agreement will be based on the tax reporting positions that we will determine. Summit Materials, Inc. will not be reimbursed for any payments previously made under the tax receivable agreement if the tax basis increases or our utilization of net operating losses are successfully challenged by the IRS, although such amounts may reduce our future obligations, if any, under the tax receivable agreement. As a result, in certain circumstances, payments could be made under the tax receivable agreement in excess of the Summit Materials, Inc.’s cash tax savings.
162
Table of Contents
Stockholders’ Agreement
In connection with this offering, we intend to enter into a stockholders’ agreement with Blackstone. This agreement will require us to, among other things, nominate a number of individuals designated by Blackstone for election as our directors at any meeting of our stockholders (each a “Sponsor Director”) such that, upon the election of each such individual, and each other individual nominated by or at the direction of our board of directors or a duly-authorized committee of the board, as a director of our company, the number of Sponsor Directors serving as directors of our company will be equal to: (1) if our pre-IPO owners and their affiliates together continue to beneficially own at least 50% of the shares of our common stock entitled to vote generally in the election of our directors as of the record date for such meeting, the lowest whole number that is greater than 50% of the total number of directors comprising our board of directors; (2) if our pre-IPO owners and their affiliates together continue to beneficially own at least 40% (but less than 50%) of the shares of our common stock entitled to vote generally in the election of our directors as of the record date for such meeting, the lowest whole number that is at least 40% of the total number of directors comprising our board of directors; (3) if our pre-IPO owners and their affiliates together continue to beneficially own at least 30% (but less than 40%) of the total shares of our common stock entitled to vote generally in the election of our directors as of the record date for such meeting, the lowest whole number that is at least 30% of the total number of directors comprising our board of directors; (4) if our pre-IPO owners and their affiliates together continue to beneficially own at least 20% (but less than 30%) of the total shares of our common stock entitled to vote generally in the election of our directors as of the record date for such meeting, the lowest whole number that is at least 20% of the total number of directors comprising our board of directors; and (5) if our pre-IPO owners and their affiliates together continue to beneficially own at least 5% (but less than 20%) of the total shares of our common stock entitled to vote generally in the election of our directors as of the record date for such meeting, the lowest whole number that is at least 10% of the total number of directors comprising our board of directors. For so long as the stockholders’ agreement remains in effect, Sponsor Directors may be removed only with the consent of Blackstone. In the case of a vacancy on our board created by the removal or resignation of a Sponsor Director, the stockholders’ agreement will require us to nominate an individual designated by our Sponsor for election to fill the vacancy. The above-described provisions of the stockholders’ agreement will remain in effect until Blackstone is no longer entitled to nominate a Sponsor Director pursuant to the stockholders’ agreement, unless Blackstone requests that it terminate at an earlier date.
The stockholders’ agreement also: (1) requires us to cooperate with Blackstone in connection with certain future pledges, hypothecations or grants of security interest in any or all of the shares of Class A common stock or LP Units held by Blackstone, including to banks or financial institutions as collateral or security for loans, advances or extensions of credit; and (2) entitles the Investor Entities to require us to implement either (x) the contribution of interests in the Investor Entities for an aggregate number of shares of Class A common stock that is equal to the number of LP Units held by such Investor Entity along with any rights holders of interests in the Investor Entity are entitled to under the tax receivable agreement following such contribution or (y) the merger of the applicable Investor Entity into Summit Materials, Inc. with Summit Materials, Inc. surviving in exchange for a number of shares of Class A common stock that is equal to the number of LP Units along with any rights holders of interests in the Investor Entity are entitled to under the tax receivable agreement following such contribution.
Summit Materials Holdings L.P. Amended and Restated Limited Partnership Agreement
As a result of the Reclassification and Offering Transactions, Summit Materials, Inc. will hold LP Units in Summit Holdings and will be the sole general partner of Summit Holdings. Accordingly, Summit Materials, Inc. will operate and control all of the business and affairs of Summit Holdings and, through Summit Holdings and its operating entity subsidiaries, conduct our business.
Pursuant to the limited partnership agreement of Summit Holdings as it will be in effect at the time of this offering, Summit Materials, Inc. has the right to determine when distributions will be made to holders of LP Units and the amount of any such distributions. If a distribution is authorized, such distribution will be made to the holders of LP Units pro rata in accordance with the percentages of their respective limited partnership interests.
163
Table of Contents
The holders of LP Units, including Summit Materials, Inc., will incur U.S. federal, state and local income taxes on their proportionate share of any taxable income of Summit Holdings. Net profits and net losses of Summit Holdings will generally be allocated to its holders (including Summit Materials, Inc.) pro rata in accordance with the percentages of their respective limited partnership interests, except as otherwise required by law. The limited partnership agreement of Summit Holdings provides for cash distributions, which we refer to as “tax distributions,” to the holders of the LP Units if Summit Materials, Inc., as the general partner of Summit Holdings, determines that the taxable income of Summit Holdings will give rise to taxable income for the holders of LP Units. In accordance with the limited partnership agreement, we intend to cause Summit Holdings to make tax distributions to the holders of LP Units for purposes of funding their tax obligations in respect of the income of Summit Holdings that is allocated to them. These tax distributions will only be paid to the extent that other distributions made by Summit Holdings were otherwise insufficient to cover the tax liabilities of holders of LP Units. Generally, these tax distributions will be computed based on our estimate of the net taxable income of Summit Holdings multiplied by an assumed tax rate equal to the highest effective marginal combined U.S. federal, state and local income tax rate applicable to an individual resident in New York, New York.
The limited partnership agreement of Summit Holdings will also provide that substantially all expenses incurred by or attributable to Summit Materials, Inc. (such as expenses incurred in connection with this offering), but not including obligations incurred under the tax receivable agreement by Summit Materials, Inc., income tax expenses of Summit Materials, Inc. and payments on indebtedness incurred by Summit Materials, Inc., will be borne by Summit Holdings.
Transaction and Management Fee Agreement
In connection with the formation of Summit Holdings, Summit Holdings entered into a transaction and management fee agreement with Blackstone Management Partners L.L.C. (“BMP”). Under this agreement, BMP (including through its affiliates) agreed to provide monitoring, advisory and consulting services relating to Summit Holdings and its subsidiaries. In consideration for the services, Summit Holdings pays, or causes to be paid, to BMP a management fee equal to the greater of $300,000 or 2.0% of Summit Holdings’ consolidated EBITDA, as defined in the transaction and management fee agreement, for the immediately preceding fiscal year. BMP is not obligated to provide any other services to Summit Holdings absent express agreement. Under the management fee agreement, for the years ended December 28, 2013, December 29, 2012 and December 31, 2011, Summit Holdings paid BMP management fees of $2.6 million, $2.1 million and $3.0 million, respectively, and incurred $3.3 million during the nine months ended September 27, 2014 related to fees earned during the period.
In addition to the management fee, in consideration of BMP undertaking financial and structural analysis, due diligence investigations, corporate strategy and other advice and negotiation assistance necessary to enable Summit Holdings and its subsidiaries to undertake acquisitions, Summit Holdings pays BMP a transaction fee equal to (x) 1.0% of the aggregate enterprise value of any acquired entity or (y) if such transaction is structured as an asset purchase or sale, 1.0% of the consideration paid for or received in respect of the assets acquired or disposed of. In addition, Summit Holdings has agreed to indemnify BMP and its affiliates against liabilities relating to the services contemplated by the transaction and management fee agreement and reimburses BMP and its affiliates for out-of-pocket expenses incurred in connection with providing such services.
Under the transaction and management fee agreement, BMP is permitted to, and has, assigned a portion of the fees to which it is entitled to receive from Summit Holdings to Silverhawk Summit, L.P. and to certain members of management. No transaction fees were paid in 2013 or 2012 and $0.8 million was paid in 2011. During the nine months ended September 27, 2014, we paid BMP $3.5 million, under this agreement and paid immaterial amounts to Silverhawk Summit, L.P. and to other equity holders.
In connection with this offering, the parties intend to terminate the transaction and management fee agreement, provided that the provisions relating to indemnification and certain other provisions will survive termination. In connection with such termination, Summit Holdings will pay BMP total fees of approximately $ million.
164
Table of Contents
Commercial Transactions with Sponsor Portfolio Companies
Our Sponsors and their respective affiliates have ownership interests in a broad range of companies. We have entered and may in the future enter into commercial transactions in the ordinary course of our business with some of these companies, including the sale of goods and services and the purchase of goods and services. None of these transactions or arrangements has been or is expected to be material to us.
Other Transactions
Blackstone Advisory Partners L.P., an affiliate of The Blackstone Group L.P., served as an initial purchaser of $13.0 million principal amount of the senior notes issued in January 2014 and received compensation in connection therewith. Blackstone Advisory Partners L.P. was an initial purchaser of $5.75 million principal amount of senior notes issued in September 2014 and received compensation in connection with that offering as well.
In addition to the fees paid to BMP pursuant to the agreements described above, we reimburse BMP for direct expenses incurred, which were not material in the nine months ended September 27, 2014 or in the years ended December 28, 2013, December 29, 2012 or December 31, 2011.
In the nine months ended September 27, 2014, we sold certain assets associated with the production of concrete blocks, including inventory and equipment, to a related party for $2.3 million and sold a ready-mixed concrete plant to a related party in exchange for the related party performing the required site reclamation, estimated at approximately $0.2 million.
We purchased equipment from a noncontrolling member of Continental Cement for approximately $2.3 million, inclusive of $0.1 million of interest, in 2011, which was paid for in 2012.
We earned revenue of $0.6 million, $7.9 million and $8.6 million and incurred costs of $0.2 million, $0.2 million and $0.7 million in connection with several transactions with unconsolidated affiliates for the years ended December 28, 2013, December 29, 2012 and December 31, 2011, respectively. As of December 28, 2013 and December 29, 2012, accounts receivable from affiliates was $0.4 million and $1.9 million. The Company had an immaterial amount of revenue from unconsolidated affiliates during the nine months ended September 27, 2014.
Cement sales to companies owned by certain noncontrolling members of Continental Cement were approximately $4.7 million, $12.7 million, $12.5 million and $9.5 million for the nine months ended September 27, 2014 and the years ended December 28, 2013, December 29, 2012 and December 31, 2011, respectively, and accounts receivables due from these parties were approximately $0.5 million, $0.2 million and $1.0 million as of September 27, 2014, December 28, 2013 and December 29, 2012, respectively.
We paid $0.7 million of interest to a noncontrolling member of Continental Cement in the nine months ended September 27, 2014 on a related party note. The principal balance on the note was repaid in January 2012.
Statement of Policy Regarding Transactions with Related Persons
Prior to the completion of this offering, our board of directors will adopt a written statement of policy regarding transactions with related persons, which we refer to as our “related person policy.” Our related person policy requires that a “related person” (as defined as in paragraph (a) of Item 404 of Regulation S-K) must promptly disclose to our Chief Legal Officer any “related person transaction” (defined as any transaction that is anticipated would be reportable by us under Item 404(a) of Regulation S-K in which we were or are to be a participant and the amount involved exceeds $120,000 and in which any related person had or will have a direct or indirect material interest) and all material facts with respect thereto. The Chief Legal Officer will then promptly communicate that information to our board of directors. No related person transaction will be executed without the approval or ratification of our board of directors or a duly authorized committee of our board of directors. It is our policy that directors interested in a related person transaction will recuse themselves from any vote on a related person transaction in which they have an interest.
165
Table of Contents
Indemnification of Directors and Officers
Our bylaws provide that we will indemnify our directors and officers to the fullest extent permitted by the Delaware General Corporation Law (“DGCL”). In addition, our certificate of incorporation will provide that our directors will not be liable for monetary damages for breach of fiduciary duty to the fullest extent permitted by the DGCL.
There is no pending litigation or proceeding naming any of our directors or officers to which indemnification is being sought, and we are not aware of any pending or threatened litigation that may result in claims for indemnification by any director or officer.
166
Table of Contents
The following tables set forth information regarding the beneficial ownership of shares of our Class A common stock and of LP Units by (1) each person known to us to beneficially own more than 5% of any class of the outstanding voting securities of Summit Materials, Inc., (2) each of our directors and named executive officers and (3) all of our directors and executive officers as a group.
The percentage of beneficial ownership of shares of our Class A common stock and of LP Units outstanding before the Offering Transactions set forth below is based on the number of shares of our Class A common stock and of LP Units to be issued and outstanding immediately prior to the consummation of this offering after giving effect to the Reclassification. The percentage of beneficial ownership of our Class A common stock and of LP Units after the Offering Transactions set forth below is based on shares of our Class A common stock and of LP Units to be issued and outstanding immediately after the Offering Transactions. Beneficial ownership is determined in accordance with the rules and regulations of the SEC.
| Class A Common Stock Beneficially Owned(1) | LP Units Beneficially Owned(1) | Combined Voting Power(2)(3) | ||||||||||||||||||||||||||
| Number |
Percentage | Number |
Percentage | Percentage | ||||||||||||||||||||||||
| Name of Beneficial Owner |
|
Prior to the Offering Transactions |
After the Offering Transactions Assuming Underwriters’ Option is Not Exercised |
After the Offering Transactions Assuming Underwriters’ Option is Exercised in Full |
|
Prior to the Offering Transactions |
After the Offering Transactions Assuming Underwriters’ Option is Not Exercised |
After the Offering Transactions Assuming Underwriters’ Option is Exercised in Full |
Prior to the Offering Transactions |
After the Offering Transactions Assuming Underwriters’ Option is Not Exercised |
After the Offering Transactions Assuming Underwriters’ Option is Exercised in Full | |||||||||||||||||
| Blackstone Funds(4) |
— | — | — | |||||||||||||||||||||||||
| Thomas W. Hill |
— | — | — | |||||||||||||||||||||||||
| Howard L. Lance |
||||||||||||||||||||||||||||
| Ted A. Gardner |
||||||||||||||||||||||||||||
| Julia C. Kahr(5) |
— | — | — | |||||||||||||||||||||||||
| John R. Murphy |
— | — | — | |||||||||||||||||||||||||
| Neil P. Simpkins(6) |
— | — | — | |||||||||||||||||||||||||
| Douglas C. Rauh |
— | — | — | |||||||||||||||||||||||||
| Kevin A. Gill |
— | — | — | |||||||||||||||||||||||||
| Directors and executive officers as a group (13 persons) |
— | — | — | |||||||||||||||||||||||||
| * | Represents less than 1%. |
| (1) | Subject to the terms of the exchange agreement, the LP Units are exchangeable for shares of our Class A common stock on a one-for-one basis. See “Certain Relationships and Related Person Transactions—Exchange Agreement.” Beneficial ownership of LP Units reflected in this table has not been also reflected as beneficial ownership of shares of our Class A common stock for which such units may be exchanged. Percentage of LP Units after the Offering Transactions treats LP Units held by Summit Materials, Inc. as outstanding. |
| (2) | Represents percentage of voting power of the Class A common stock and Class B common stock of Summit Materials, Inc. voting together as a single class. See “Description of Capital Stock—Common Stock.” |
| (3) | Summit Owner Holdco, an entity owned by our pre-IPO owners and Class B Unitholders of Continental Cement, will initially hold all of the issued and outstanding shares of our Class B common stock that will be outstanding upon consummation of this offering. The Class B common stock will provide Summit Owner Holdco, with a number of votes that is equal to the aggregate number of Initial LP Units less the number of such Initial LP Units that, after the IPO Date, have been transferred to Summit Materials, Inc. in accordance with the exchange agreement or are transferred to a holder other than Summit Owner Holdco together with a share of Class B common stock (or fraction thereof). |
| (4) | Includes LP Units directly held by Blackstone Capital Partners (Cayman) V NQ L.P., LP Units directly held by Blackstone Capital Partners (Cayman) NQ V-AC L.P., LP Units directly held by Blackstone Family Investment Partnership (Cayman) V NQ L.P. and LP Units directly held by Blackstone Participation Partnership (Cayman) V NQ L.P. (together, the “Blackstone Funds”). The general partner of each of Blackstone Capital Partners (Cayman) V NQ L.P. and Blackstone Capital Partners (Cayman) NQ V-AC L.P. is Blackstone Management Associates (Cayman) V-NQ L.P. A general partner of each of Blackstone Management Associates (Cayman) V-NQ L.P., Blackstone Family Investment Partnership (Cayman) V NQ L.P. and Blackstone Participation Partnership (Cayman) V NQ L.P. is BCP V - NQ GP L.L.C. The sole member of BCP V - NQ GP L.L.C. is Blackstone Holdings II L.P. The general partner of Blackstone Holdings II L.P. is Blackstone Holdings I/II GP Inc. The sole shareholder of Blackstone Holdings I/II GP Inc. is The Blackstone Group L.P. The general partner of The Blackstone Group L.P. is Blackstone Group Management L.L.C. Blackstone Group Management L.L.C. is wholly owned by Blackstone’s senior managing directors and controlled by its founder, Stephen A. Schwarzman. |
Each of such persons disclaims beneficial ownership of the shares of the LP Units directly held by the Blackstone Funds (other than the Blackstone Funds to the extent of their direct holdings). The address of each of the entities listed in this footnote is c/o The Blackstone Group L.P., 345 Park Avenue, New York, New York 10154.
| (5) | Ms. Kahr is a Managing Director of The Blackstone Group. Ms. Kahr disclaims beneficial ownership of any shares owned directly or indirectly by the Blackstone Funds. |
| (6) | Mr. Simpkins is a Senior Managing Director of The Blackstone Group. Mr. Simpkins disclaims beneficial ownership of any shares owned directly or indirectly by the Blackstone Funds. |
167
Table of Contents
The foregoing table assumes an offering price of $ per share of Class A common stock, which is the midpoint of the range on the front cover of this prospectus. However, the precise number of LP Units issued to existing owners would differ from that presented in the table above if the actual initial public offering price per share differs from this assumed price.
For example, if the initial offering price per share of Class A common stock in this offering is $ , which is the low point of the price range indicated on the front cover of this prospectus, the beneficial ownership of LP Units of the identified holders would be as follows:
| Name of Beneficial Owner |
Prior to the Offering Transactions |
After the Offering Transactions Assuming Underwriters’ Option is Not Exercised |
After the Offering Transactions Assuming Underwriters’ Option is Exercised in Full | |||
| Blackstone Funds |
||||||
| Thomas W. Hill |
||||||
| Howard L. Lance |
||||||
| Ted A. Gardner |
||||||
| Julia C. Kahr |
||||||
| John R. Murphy |
||||||
| Neil P. Simpkins |
||||||
| Douglas C. Rauh |
||||||
| Kevin A. Gill |
||||||
| All directors, director nominees and executive officers as a group (8 persons) |
Conversely, if the initial offering price per share of Class A common stock in this offering is $ , which is the high point of the price range indicated on the front cover of this prospectus, the beneficial ownership of LP Units of the identified holders would be as follows:
| Name of Beneficial Owner |
Prior to the Offering Transactions |
After the Offering Transactions Assuming Underwriters’ Option is Not Exercised |
After the Offering Transactions Assuming Underwriters’ Option is Exercised in Full | |||
| Blackstone Funds |
||||||
| Thomas W. Hill |
||||||
| Howard L. Lance |
||||||
| Ted A. Gardner |
||||||
| Julia C. Kahr |
||||||
| John R. Murphy |
||||||
| Neil P. Simpkins |
||||||
| Douglas C. Rauh |
||||||
| Kevin A. Gill |
||||||
| All directors, director nominees and executive officers as a group (8 persons) |
168
Table of Contents
DESCRIPTION OF CERTAIN INDEBTEDNESS
Senior Secured Credit Facilities
On January 30, 2012, Summit Materials, LLC (the “Borrower”) entered into senior secured credit facilities with Bank of America, N.A. and Citigroup Global Markets Inc., as joint lead arrangers, Merrill Lynch, Pierce, Fenner & Smith Incorporated, Citigroup Global Markets Inc., UBS Securities LLC, Barclays Capital Inc., Credit Suisse Securities (USA) LLC and Deutsche Bank Securities Inc., as joint bookrunners, Bank of America, N.A., as administrative agent, collateral agent, letter of credit issuer and swing line lender, Citigroup Global Markets Inc., as syndication agent and Barclays Bank plc and Regions Bank, as co-documentation agents.
The senior secured credit facilities provides for term debt in an aggregate amount of $422.0 million, which matures January 30, 2019, and revolving credit commitments in an aggregate amount of $150.0 million, which matures January 30, 2017. The Borrower is required to make principal repayments of 0.25% of borrowings under the term debt on the last business day of each March, June, September and December. The revolving credit facility includes capacity available for letters of credit and for borrowings on same-day notice referred to as the swingline loans.
The current outstanding principal amount of term debt and applicable interest rate reflect the terms of a repricing the Borrower consummated on February 5, 2013. The repricing, among other things: (i) reduced the applicable margins used to calculate interest rates for term loans under the senior secured credit facilities by 1.0%; (ii) reduced the applicable margins used to calculate interest rates for $131.0 million of tranche A revolving credit loans available under the senior secured credit facilities by 1.0% (with no reductions to the applicable margins for the remaining $19.0 million of available revolving credit loans); (iii) increased term loans borrowed under the term loan facility by $25.0 million with the same terms as the existing term loans (bringing total term loan borrowings to approximately $422.0 million); (iv) included a requirement that the Borrower pay a fee equal to 1.0% of the principal amount of term loans repaid in connection with certain repricing or refinancing transactions within six months after February 5, 2013; and (v) created additional flexibility under the financial maintenance covenants, which are tested quarterly, by increasing the applicable maximum Consolidated First Lien Net Leverage Ratio and reducing the applicable minimum Interest Coverage Ratio (each as defined in the credit agreement governing the senior secured credit facilities).
On January 16, 2014, the Borrower entered into a second amendment to the senior secured credit facilities that, among other things: (i) permitted the incurrence of the outstanding notes; (ii) included a requirement that the Borrower pay a fee equal to 1.0% of the principal amount of term loans repaid in connection with certain repricing or refinancing transactions within six months after January 16, 2014 and (iii) increased the total leverage ratio and senior secured net leverage ratio in connection with the future incurrence of indebtedness.
The senior secured credit facilities include an uncommitted incremental facility that allow us the option to increase the amount available under the term loan facility and/or the revolving credit facility by (i) $135.0 million and (ii) an additional amount so long as the Borrower is in pro forma compliance with a consolidated first lien net leverage ratio of no greater than 3.50:1.00. Availability of such incremental facilities will be subject to, among other conditions, the absence of an event of default and pro forma compliance with the financial covenants under the credit agreement and the receipt of commitments by existing or additional financial institutions.
We intend to use a portion of the proceeds of this offering to repay some or all of the then outstanding amounts under our senior secured credit facilities.
Interest Rate and Fees
Borrowings under the senior secured credit facilities will bear interest at a rate per annum equal to an applicable margin plus, at the Borrower’s option, either (i) a base rate determined by reference to the highest of (a) the Federal Funds rate plus 0.50%, (b) the prime rate of Bank of America, N.A. and (c) the British Bankers
169
Table of Contents
Association LIBOR Rate (subject to a LIBOR floor of 1.25% in the case of the term loan facility) plus 1.00% or (ii) a British Bankers Association LIBOR rate (subject to a LIBOR floor of 1.25% in the case of the term debt) determined by reference to Reuters two business days prior to the interest period relevant to such borrowing adjusted for certain additional costs. The applicable margin for the term debt is 3.75% in the case of LIBOR loans and 2.75% in the case of base rate loans. The applicable margin on the revolving credit facility is 3.50% in the case of LIBOR loans and 2.50% in the case of base rate loans (or 4.50% and 3.50% in the case of the $19.0 million of available revolving credit loans discussed above, for which no reductions to margins were made) and will be subject to one 25 basis point step-down upon the Borrower attaining a consolidated first lien net leverage ratio of 2.50:1.00.
In addition to paying interest on outstanding principal under the senior secured credit facilities, the Borrower is required to pay a commitment fee to the lenders under the revolving credit facility in respect of the unutilized commitments thereunder. The Borrower is also required to pay customary letter of credit and agency fees.
Mandatory Prepayments
The credit agreement governing the senior secured credit facilities requires us to prepay outstanding term debt, subject to certain exceptions, with:
| • | commencing with the fiscal year ended December 29, 2012, 50% (which percentage will be reduced to 25% and 0% upon the Borrower attaining certain consolidated first lien net leverage ratios) of annual excess cash flow less the principal amount of certain debt prepayments; |
| • | 100% of the net proceeds from certain asset sales and casualty and condemnation proceeds, subject to certain threshold amounts of net proceeds and, if no default exists, to a 100% reinvestment right if reinvested or committed to be reinvested within 12 months of receipt so long as any committed reinvestment is actively reinvested within 18 months of receipt; and |
| • | 100% of the net proceeds from issuances or incurrence of certain debt, other than proceeds from debt permitted to be incurred under the credit agreement governing the senior secured credit facilities. |
The Borrower may apply the foregoing mandatory prepayments to the term loan in direct order of maturity.
Voluntary Prepayments
The Borrower may voluntarily repay outstanding loans under the senior secured credit facilities at any time without premium or penalty; provided that voluntary prepayments of LIBOR rate loans made on a date other than the last day of an interest period applicable thereto shall be subject to customary breakage costs.
In addition, with respect to certain repricings or refinancings of the term debt within six months after January 16, 2014, the Borrower will be required to pay a fee equal to 1.0% of the principal amount of term debt that is repriced or refinanced.
Amortization and Final Maturity
The Borrower is required to make scheduled quarterly payments each equal to 0.25% of the original principal amount of the term debt made on the initial closing date, with the balance due on January 30, 2019. The Borrower will not be required to make any scheduled payments under the revolving credit facility. The principal amounts outstanding under the revolving credit facility will be due and payable on January 30, 2017.
Guarantee and Security
All obligations under the senior secured credit facilities are unconditionally guaranteed by Summit Materials Intermediate Holdings, LLC, and each existing and future direct or indirect wholly-owned domestic restricted subsidiary of the Borrower (other than certain immaterial subsidiaries, subsidiaries that are precluded
170
Table of Contents
by law, regulation or contractual obligation from guaranteeing the obligations and certain subsidiaries excluded via customary exceptions) and by the Borrower’s non-wholly-owned subsidiary Continental Cement (collectively, the “Credit Agreement Guarantors”).
All obligations under the senior secured credit facilities, and the guarantees of those obligations, will be secured by substantially all of the following assets of the Borrower and each subsidiary that is a Credit Agreement Guarantor, subject to certain exceptions:
| • | a pledge of 100% of the capital stock of the Borrower and 100% of the capital stock of each material domestic subsidiary that is directly owned by the Borrower or one of the subsidiary Credit Agreement Guarantors, promissory notes and any other instruments evidencing indebtedness owned by the Borrower or one of the subsidiary Credit Agreement Guarantors and 65% of the capital stock of each wholly-owned foreign subsidiary that is, in each case, directly owned by the Borrower or one of the subsidiary Credit Agreement Guarantors; and |
| • | a security interest in, and mortgages on, substantially all tangible and intangible assets (above a materiality threshold in the case of mortgages) of the Borrower and each subsidiary Credit Agreement Guarantor. |
Certain Covenants and Events of Default
The senior secured credit facilities contain a number of covenants that, among other things, restrict, subject to certain exceptions, the Borrower and its restricted subsidiaries’ ability to:
| • | incur additional indebtedness or guarantees; |
| • | create liens on assets; |
| • | change its fiscal year; |
| • | enter into sale and leaseback transactions; |
| • | engage in mergers or consolidations; |
| • | sell assets; |
| • | pay dividends and make other restricted payments; |
| • | make investments, loans or advances; |
| • | repay subordinated indebtedness; |
| • | make certain acquisitions; |
| • | engage in certain transactions with affiliates; and |
| • | change its lines of business. |
In addition, the senior secured credit facilities require the Borrower to maintain a quarterly maximum consolidated first lien net leverage ratio and a quarterly minimum interest coverage ratio.
The credit agreement governing the senior secured credit facilities also contains certain customary representations and warranties, affirmative covenants and events of default (including, among others, an event of default upon a change of control). If an event of default occurs, the lenders under the senior secured credit facilities will be entitled to take various actions, including the acceleration of amounts due under the senior secured credit facilities and all actions permitted to be taken by a secured creditor.
171
Table of Contents
Senior Notes
On January 30, 2012, the Issuers issued $250.0 million aggregate principal amount of senior notes due January 31, 2020. On January 17, 2014 and September 8, 2014, the Issuers issued an additional $260.0 million and $115.0 million aggregate principal amount, respectively, of senior notes. The senior notes have substantially the same terms and vote as one class under the indenture pursuant to which they were issued, provided that the senior notes issued on September 8, 2014 are subject to a registration rights agreement and the Issuers may be required to pay additional interest to holders of the senior notes issued on September 8, 2014 if the Issuers fail to satisfy their obligations under such registration rights agreement.
The senior notes bear interest at a rate of 10.5% per year, payable semi-annually in arrears on January 31 and July 31. The Issuers’ obligations under the senior notes are guaranteed on a senior unsecured basis by all of Summit Materials, LLC’s existing and future wholly-owned domestic restricted subsidiaries that guarantee its senior secured credit facilities and by its non-wholly-owned subsidiary Continental Cement.
At any time prior to January 31, 2016, the Issuers may redeem some or all of the senior notes at a redemption price equal to 100.000% of the principal amount thereof, plus the applicable premium as of the redemption date under the terms of the indenture and accrued and unpaid interest. The redemption price during each of the twelve-month periods following January 31, 2016 and January 31, 2017 and at any time after January 31, 2018 is 105.250%, 102.625% and 100.000% of the principal amount plus accrued and unpaid interest thereon, respectively. In addition, at any time prior to January 31, 2015, the Issuers may redeem up to 35% of the senior notes from the proceeds of certain equity offerings at a redemption price equal to 110.500% plus accrued and unpaid interest thereon.
Upon the occurrence of a change of control or upon the sale of certain assets in which the Issuers do not apply the proceeds as required, the holders of the senior notes will have the right to require the Issuers to make an offer to repurchase each holder’s senior notes at a price equal to 101% (in the case of a change of control) or 100% (in the case of an asset sale) of their principal amount, plus accrued and unpaid interest.
The senior notes contain covenants limiting, among other things, Summit Materials, LLC’s and the guarantor subsidiaries’ ability to incur additional indebtedness or issue certain preferred shares, pay dividends, redeem stock or make other distributions, make certain investments, sell or transfer certain assets, create liens, consolidate, merge, sell or otherwise dispose of all or substantially all of Summit Materials, LLC’s assets, enter into certain transactions with affiliates, and designate subsidiaries as unrestricted subsidiaries. The senior notes also contain customary events of default.
172
Table of Contents
In connection with this offering, we will amend and restate our certificate of incorporation and our bylaws. The following is a description of the material terms of, and is qualified in its entirety by, our amended and restated certificate of incorporation and amended and restated bylaws, each of which will be in effect upon the consummation of this offering, the forms of which are filed as exhibits to the registration statement of which this prospectus forms a part. Under “Description of Capital Stock,” “we,” “us,” “our” and “our company” refer to Summit Materials, Inc. and not to any of its subsidiaries.
Our purpose is to engage in any lawful act or activity for which corporations may now or hereafter be organized under the DGCL. Upon the consummation of this offering, our authorized capital stock will consist of shares of Class A common stock, par value $0.01 per share, shares of Class B common stock, par value $0.01 per share and shares of preferred stock, par value $0.01 per share. Unless our board of directors determines otherwise, we will issue all shares of our capital stock in uncertificated form.
Common Stock
Class A Common Stock
Holders of shares of our Class A common stock are entitled to one vote for each share held of record on all matters on which stockholders are entitled to vote generally, including the election or removal of directors elected by our stockholders generally. The holders of our Class A common stock do not have cumulative voting rights in the election of directors.
Holders of shares of our Class A common stock are entitled to receive dividends when, as and if declared by our board of directors out of funds legally available therefor, subject to any statutory or contractual restrictions on the payment of dividends and to any restrictions on the payment of dividends imposed by the terms of any outstanding preferred stock.
Upon our liquidation, dissolution or winding up and after payment in full of all amounts required to be paid to creditors and to the holders of preferred stock having liquidation preferences, if any, the holders of shares of our Class A common stock will be entitled to receive pro rata our remaining assets available for distribution.
All shares of our Class A common stock that will be outstanding at the time of the completion of the offering will be fully paid and non-assessable. The Class A common stock will not be subject to further calls or assessments by us. Holders of shares of our Class A common stock do not have preemptive, subscription, redemption or conversion rights. There will be no redemption or sinking fund provisions applicable to the Class A common stock. The rights powers, preferences and privileges of our Class A common stock will be subject to those of the holders of any shares of our preferred stock or any other series or class of stock we may authorize and issue in the future.
Class B Common Stock
The Class B common stock will entitle (x) Summit Owner Holdco, without regard to the number of shares of Class B common stock held by it, to a number of votes that is equal to the aggregate number of Initial LP Units less the number of such Initial LP Units that, after the IPO Date, have been transferred to Summit Materials, Inc. in accordance with the exchange agreement or are transferred to a holder other than Summit Owner Holdco together with a share of Class B common stock (or fraction thereof) and (y) each other holder of Class B common stock, without regard to the number of shares of Class B common stock held by such other holder, to a number of votes that is equal to the number of LP Units held by such holder. If at any time the ratio at which LP Units are exchangeable for shares of our Class A common stock changes from one-for-one as described under “Certain Relationships and Related Person Transactions—Exchange Agreement,” for example, as a result of a conversion rate adjustment for stock splits, stock dividends or reclassifications, the number of votes to which Class B common stockholders are entitled will be adjusted accordingly. The holders of our Class B common stock do not have cumulative voting rights in the election of directors.
173
Table of Contents
Holders of shares of our Class B common stock will vote together with holders of our Class A common stock as a single class on all matters on which stockholders are entitled to vote generally, except as otherwise required by law.
Holders of our Class B common stock do not have any right to receive dividends or to receive a distribution upon a liquidation, dissolution or winding up of Summit Materials, Inc.
Any holder of Class B common stock other than Summit Owner Holdco that does not also hold LP Units is required to surrender any such shares of Class B common stock (including fractions thereof) to Summit Materials, Inc.
Preferred Stock
No shares of preferred stock will be issued or outstanding immediately after the offering contemplated by this prospectus. Our amended and restated certificate of incorporation authorizes our board of directors to establish one or more series of preferred stock (including convertible preferred stock). Unless required by law or any stock exchange, the authorized shares of preferred stock will be available for issuance without further action by the holders of our Class A or Class B common stock. Our board of directors is able to determine, with respect to any series of preferred stock, the powers (including voting powers), preferences and relative, participating, optional or other special rights, and the qualifications, limitations or restrictions thereof, including, without limitation:
| • | the designation of the series; |
| • | the number of shares of the series, which our board of directors may, except where otherwise provided in the preferred stock designation, increase (but not above the total number of authorized shares of the class) or decrease (but not below the number of shares then outstanding); |
| • | whether dividends, if any, will be cumulative or non-cumulative and the dividend rate of the series; |
| • | the dates at which dividends, if any, will be payable; |
| • | the redemption or repurchase rights and price or prices, if any, for shares of the series; |
| • | the terms and amounts of any sinking fund provided for the purchase or redemption of shares of the series; |
| • | the amounts payable on shares of the series in the event of any voluntary or involuntary liquidation, dissolution or winding-up of our affairs; |
| • | whether the shares of the series will be convertible into shares of any other class or series, or any other security, of us or any other entity, and, if so, the specification of the other class or series or other security, the conversion price or prices or rate or rates, any rate adjustments, the date or dates as of which the shares will be convertible and all other terms and conditions upon which the conversion may be made; |
| • | restrictions on the issuance of shares of the same series or of any other class or series; and |
| • | the voting rights, if any, of the holders of the series. |
We could issue a series of preferred stock that could, depending on the terms of the series, impede or discourage an acquisition attempt or other transaction that some, or a majority, of the holders of our common stock might believe to be in their best interests or in which the holders of our common stock might receive a premium over the market price of the shares of our common stock. Additionally, the issuance of preferred stock may adversely affect the rights of holders of our common stock by restricting dividends on the common stock, diluting the voting power of the common stock or subordinating the liquidation rights of the common stock. As a result of these or other factors, the issuance of preferred stock could have an adverse impact on the market price of our Class A common stock.
174
Table of Contents
Dividends
The DGCL permits a corporation to declare and pay dividends out of “surplus” or, if there is no “surplus,” out of its net profits for the fiscal year in which the dividend is declared and/or the preceding fiscal year. “Surplus” is defined as the excess of the net assets of the corporation over the amount determined to be the capital of the corporation by its board of directors. The capital of the corporation is typically calculated to be (and cannot be less than) the aggregate par value of all issued shares of capital stock. Net assets equals the fair value of the total assets minus total liabilities. The DGCL also provides that dividends may not be paid out of net profits if, after the payment of the dividend, remaining capital would be less than the capital represented by the outstanding stock of all classes having a preference upon the distribution of assets. Declaration and payment of any dividend will be subject to the discretion of our board of directors.
We have no current plans to pay dividends on our Class A common stock. Any decision to declare and pay dividends in the future will be made at the sole discretion of our board of directors and will depend on, among other things, our results of operations, cash requirements, financial condition, contractual restrictions and other factors that our board of directors may deem relevant. Because we are a holding company and have no direct operations, we will only be able to pay dividends from funds we receive from our subsidiaries. In addition, our ability to pay dividends will be limited by covenants in our existing indebtedness and may be limited by the agreements governing other indebtedness we or our subsidiaries incur in the future. See “Description of Certain Indebtedness.”
Annual Stockholder Meetings
Our amended and restated bylaws provide that annual stockholder meetings will be held at a date, time and place, if any, as exclusively selected by our board of directors. To the extent permitted under applicable law, we may conduct meetings by remote communications, including by webcast.
Anti-Takeover Effects of Our Amended and Restated Certificate of Incorporation and Amended and Restated Bylaws and Certain Provisions of Delaware Law
Our amended and restated certificate of incorporation, amended and restated bylaws and the DGCL contain provisions, which are summarized in the following paragraphs, that are intended to enhance the likelihood of continuity and stability in the composition of our board of directors. These provisions are intended to avoid costly takeover battles, reduce our vulnerability to a hostile or abusive change of control and enhance the ability of our board of directors to maximize stockholder value in connection with any unsolicited offer to acquire us. However, these provisions may have an anti-takeover effect and may delay, deter or prevent a merger or acquisition of the Company by means of a tender offer, a proxy contest or other takeover attempt that a stockholder might consider in its best interest, including those attempts that might result in a premium over the prevailing market price for the shares of common stock held by stockholders.
Authorized but Unissued Capital Stock
Delaware law does not require stockholder approval for any issuance of shares that are authorized and available for issuance. However, the listing requirements of the NYSE, which would apply so long as our Class A common stock remains listed on the NYSE, require stockholder approval of certain issuances equal to or exceeding 20% of the then outstanding voting power of our capital stock or then outstanding number of shares of Class A common stock. These additional shares may be used for a variety of corporate purposes, including future public offerings, to raise additional capital or to facilitate acquisitions.
Our board of directors may generally issue shares of one or more series of preferred stock on terms calculated to discourage, delay or prevent a change of control of the Company or the removal of our management. Moreover, our authorized but unissued shares of preferred stock will be available for future
175
Table of Contents
issuances in one or more series without stockholder approval and could be utilized for a variety of corporate purposes, including future offerings to raise additional capital, to facilitate acquisitions and employee benefit plans.
One of the effects of the existence of authorized and unissued and unreserved Class A common stock or preferred stock may be to enable our board of directors to issue shares to persons friendly to current management, which issuance could render more difficult or discourage an attempt to obtain control of our company by means of a merger, tender offer, proxy contest or otherwise, and thereby protect the continuity of our management and possibly deprive our stockholders of opportunities to sell their shares of Class A common stock at prices higher than prevailing market prices.
Classified Board of Directors
Our amended and restated certificate of incorporation provides that our board of directors will be divided into three classes of directors, with the classes to be as nearly equal in number as possible, and with the directors serving three-year terms. As a result, approximately one-third of our board of directors will be elected each year. The classification of directors will have the effect of making it more difficult for stockholders to change the composition of our board of directors. Our amended and restated certificate of incorporation and amended and restated bylaws provide that, subject to any rights of holders of preferred stock to elect additional directors under specified circumstances, the number of directors will be fixed from time to time exclusively pursuant to a resolution adopted by the board of directors with a maximum of 15 directors.
Business Combinations
We have opted out of Section 203 of the DGCL; however, our amended and restated certificate of incorporation contains similar provisions providing that we may not engage in certain “business combinations” with any “interested stockholder” for a three-year period following the time that the stockholder became an interested stockholder, unless:
| • | prior to such time, our board of directors approved either the business combination or the transaction which resulted in the stockholder becoming an interested stockholder; |
| • | upon consummation of the transaction that resulted in the stockholder becoming an interested stockholder, the interested stockholder owned at least 85% of our voting stock outstanding at the time the transaction commenced, excluding certain shares; or |
| • | at or subsequent to that time, the business combination is approved by our board of directors and by the affirmative vote of holders of at least 66 2⁄3% of our outstanding voting stock that is not owned by the interested stockholder. |
Generally, a “business combination” includes a merger, asset or stock sale or other transaction resulting in a financial benefit to the interested stockholder. Subject to certain exceptions, an “interested stockholder” is a person who, together with that person’s affiliates and associates, owns, or within the previous three years owned, 15% or more of our outstanding voting stock. For purposes of this section only, “voting stock” has the meaning given to it in Section 203 of the DGCL.
Under certain circumstances, this provision will make it more difficult for a person who would be an “interested stockholder” to effect various business combinations with us for a three-year period. This provision may encourage companies interested in acquiring us to negotiate in advance with our board of directors because the stockholder approval requirement would be avoided if our board of directors approves either the business combination or the transaction which results in the stockholder becoming an interested stockholder. These provisions also may have the effect of preventing changes in our board of directors and may make it more difficult to accomplish transactions which stockholders may otherwise deem to be in their best interests.
176
Table of Contents
Our amended and restated certificate of incorporation provides that Blackstone and its affiliates, and any of their respective direct or indirect transferees and any group as to which such persons are a party, do not constitute “interested stockholders” for purposes of this provision.
Removal of Directors; Vacancies and Newly Created Directorships
Under the DGCL, unless otherwise provided in our amended and restated certificate of incorporation, directors serving on a classified board may be removed by the stockholders only for cause. Our amended and restated certificate of incorporation provides that directors may be removed with or without cause upon the affirmative vote of a majority in voting power of all outstanding shares of stock entitled to vote generally in the election of directors, voting together as a single class; provided, however, at any time when Blackstone and its affiliates beneficially own in the aggregate, less than 30% of the voting power of all outstanding shares of our stock entitled to vote generally in the election of directors, directors may only be removed for cause, and only upon the affirmative vote of holders of at least 66 2⁄3% of the voting power of all the then outstanding shares of stock entitled to vote generally in the election of directors, voting together as a single class. In addition, our amended and restated certificate of incorporation also provides that, subject to the rights granted to one or more series of preferred stock then outstanding or the rights granted under the stockholders’ agreement with Blackstone, any vacancies on our board of directors, and any newly created directorships, will be filled only by the affirmative vote of a majority of the directors then in office, even if less than a quorum, by a sole remaining director or by the stockholders; provided, however, at any time when Blackstone and its affiliates beneficially own, in the aggregate, less than 30% of voting power of the stock of the Company entitled to vote generally in the election of directors, any newly-created directorship on the board of directors that results from an increase in the number of directors and any vacancy occurring in the board of directors may only be filled by a majority of the directors then in office, although less than a quorum, or by a sole remaining director (and not by the stockholders).
No Cumulative Voting
Under Delaware law, the right to vote cumulatively does not exist unless the certificate of incorporation specifically authorizes cumulative voting. Our amended and restated certificate of incorporation does not authorize cumulative voting. Therefore, stockholders holding a majority in voting power of the shares of our stock entitled to vote generally in the election of directors will be able to elect all our directors.
Special Stockholder Meetings
Our amended and restated certificate of incorporation provides that special meetings of our stockholders may be called at any time only by or at the direction of the board of directors or the chairman of the board of directors; provided, however, at any time when Blackstone and its affiliates beneficially own, in the aggregate, at least 30% in voting power of the stock entitled to vote generally in the election of directors, special meetings of our stockholders shall also be called by the board of directors or the chairman of the board of directors at the request of Blackstone and its affiliates. Our amended and restated bylaws prohibit the conduct of any business at a special meeting other than as specified in the notice for such meeting. These provisions may have the effect of deterring, delaying or discouraging hostile takeovers, or changes in control or management of the Company.
Director Nominations and Stockholder Proposals
Our amended and restated bylaws establish advance notice procedures with respect to stockholder proposals and the nomination of candidates for election as directors, other than nominations made by or at the direction of the board of directors or a committee of the board of directors. In order for any matter to be “properly brought” before a meeting, a stockholder will have to comply with advance notice requirements and provide us with certain information. Generally, to be timely, a stockholder’s notice must be received at our principal executive offices not less than 90 days nor more than 120 days prior to the first anniversary date of the immediately
177
Table of Contents
preceding annual meeting of stockholders. Our amended and restated bylaws also specify requirements as to the form and content of a stockholder’s notice. These provisions will not apply to Blackstone and its affiliates so long as the stockholders’ agreement remains in effect. Our amended and restated bylaws allow the chairman of the meeting at a meeting of the stockholders to adopt rules and regulations for the conduct of meetings which may have the effect of precluding the conduct of certain business at a meeting if the rules and regulations are not followed. These provisions may also defer, delay or discourage a potential acquirer from conducting a solicitation of proxies to elect the acquirer’s own slate of directors or otherwise attempting to influence or obtain control of the Company.
Stockholder Action by Written Consent
Pursuant to Section 228 of the DGCL, any action required to be taken at any annual or special meeting of the stockholders may be taken without a meeting, without prior notice and without a vote if a consent or consents in writing, setting forth the action so taken, is or are signed by the holders of outstanding stock having not less than the minimum number of votes that would be necessary to authorize or take such action at a meeting at which all shares of our stock entitled to vote thereon were present and voted, unless our amended and restated certificate of incorporation provides otherwise. Our amended and restated certificate of incorporation will preclude stockholder action by written consent at any time when Blackstone and its affiliates own, in the aggregate, less than 30% in voting power of our stock entitled to vote generally in the election of directors.
Supermajority Provisions
Our amended and restated certificate of incorporation and amended and restated bylaws provide that the board of directors is expressly authorized to make, alter, amend, change, add to, rescind or repeal, in whole or in part, our bylaws without a stockholder vote in any matter not inconsistent with the laws of the State of Delaware or our amended and restated certificate of incorporation. For as long as Blackstone and its affiliates beneficially own, in the aggregate, at least 30% in voting power of our stock entitled to vote generally in the election of directors, any amendment, alteration, change, addition or repeal of our bylaws by our stockholders requires the affirmative vote of a majority in voting power of the outstanding shares of our stock present in person or represented by proxy at the meeting and entitled to vote on such amendment, alteration, rescission or repeal. At any time when Blackstone and its affiliates beneficially own, in the aggregate, less than 30% in voting power of our stock entitled to vote generally in the election of directors, any amendment, alteration, rescission or repeal of our bylaws by our stockholders requires the affirmative vote of the holders of at least 66 2⁄3% in voting power of all the then outstanding shares of stock entitled to vote thereon, voting together as a single class.
The DGCL provides generally that the affirmative vote of a majority of the outstanding shares entitled to vote thereon, voting together as a single class, is required to amend a corporation’s certificate of incorporation, unless the certificate of incorporation requires a greater percentage.
Our amended and restated certificate of incorporation provides that at any time when Blackstone and its affiliates beneficially own, in the aggregate, less than 30% in voting power of our stock entitled to vote generally in the election of directors, the following provisions in our amended and restated certificate of incorporation may be amended, altered, repealed or rescinded only by the affirmative vote of the holders of at least 66 2⁄3% in voting power all the then outstanding shares of our stock entitled to vote thereon, voting together as a single class:
| • | the provision requiring a 66 2⁄3% supermajority vote for stockholders to amend our amended and restated bylaws; |
| • | the provisions providing for a classified board of directors (the election and term of our directors); |
| • | the provisions regarding resignation and removal of directors; |
| • | the provisions regarding competition and corporate opportunities; |
| • | the provisions regarding entering into business combinations with interested stockholders; |
| • | the provisions regarding stockholder action by written consent; |
178
Table of Contents
| • | the provisions regarding calling special meetings of stockholders; |
| • | the provisions regarding filling vacancies on our board of directors and newly-created directorships; |
| • | the provisions eliminating monetary damages for breaches of fiduciary duty by a director; and |
| • | the amendment provision requiring that the above provisions be amended only with a 66 2⁄3% supermajority vote. |
The combination of the classification of our board of directors, the lack of cumulative voting and the supermajority voting requirements will make it more difficult for our existing stockholders to replace our board of directors as well as for another party to obtain control of us by replacing our board of directors. Because our board of directors has the power to retain and discharge our officers, these provisions could also make it more difficult for existing stockholders or another party to effect a change in management.
These provisions may have the effect of deterring hostile takeovers or delaying or preventing changes in control of us or our management, such as a merger, reorganization or tender offer. These provisions are intended to enhance the likelihood of continued stability in the composition of our board of directors and its policies and to discourage certain types of transactions that may involve an actual or threatened acquisition of our company. These provisions are designed to reduce our vulnerability to an unsolicited acquisition proposal. The provisions are also intended to discourage certain tactics that may be used in proxy fights. However, such provisions could have the effect of discouraging others from making tender offers for our shares and, as a consequence, they also may inhibit fluctuations in the market price of our shares that could result from actual or rumored takeover attempts. Such provisions may also have the effect of preventing changes in management.
Dissenters’ Rights of Appraisal and Payment
Under the DGCL, with certain exceptions, our stockholders will have appraisal rights in connection with a merger or consolidation of our company. Pursuant to the DGCL, stockholders who properly request and perfect appraisal rights in connection with such merger or consolidation will have the right to receive payment of the fair value of their shares as determined by the Delaware Court of Chancery.
Stockholders’ Derivative Actions
Under the DGCL, any of our stockholders may bring an action in our name to procure a judgment in our favor, also known as a derivative action, provided that the stockholder bringing the action is a holder of our shares at the time of the transaction to which the action relates or such stockholder’s stock thereafter devolved by operation of law.
Exclusive Forum
Our amended and restated certificate of incorporation provides that unless we consent to the selection of an alternative forum, the Court of Chancery of the State of Delaware shall, to the fullest extent permitted by law, be the sole and exclusive forum for any (i) derivative action or proceeding brought on behalf of our company, (ii) action asserting a claim of breach of a fiduciary duty owed by any director, officer or employee of our company to our company or our company’s stockholders, (iii) action asserting a claim against our company or any director or officer of our company arising pursuant to any provision of the DGCL or our amended and restated certificate of incorporation or our amended and restated bylaws, or (iv) action asserting a claim against our company governed by the internal affairs doctrine. Any person or entity purchasing or otherwise acquiring any interest in shares of capital stock of our company shall be deemed to have notice of and consented to the forum provisions in our amended and restated certificate of incorporation. However, it is possible that a court could find our forum selection provision to be inapplicable or unenforceable.
179
Table of Contents
Conflicts of Interest
Delaware law permits corporations to adopt provisions renouncing any interest or expectancy in certain opportunities that are presented to the corporation or its officers, directors or stockholders. Our amended and restated certificate of incorporation, to the maximum extent permitted from time to time by Delaware law, renounces any interest or expectancy that we have in, or right to be offered an opportunity to participate in, specified business opportunities that are from time to time presented to our officers, directors or stockholders or their respective affiliates, other than those officers, directors, stockholders or affiliates who are our or our subsidiaries’ employees. Our amended and restated certificate of incorporation provides that, to the fullest extent permitted by law, none of Blackstone, Silverhawk or any of their respective affiliates or any director who is not employed by us (including any non-employee director who serves as one of our officers in both his director and officer capacities) or his or her affiliates will have any duty to refrain from (i) engaging in a corporate opportunity in the same or similar lines of business in which we or our affiliates now engage or propose to engage or (ii) otherwise competing with us or our affiliates. In addition, to the fullest extent permitted by law, in the event that Blackstone, Silverhawk or any non-employee director acquires knowledge of a potential transaction or other business opportunity which may be a corporate opportunity for itself or himself or its or his affiliates or for us or our affiliates, such person will have no duty to communicate or offer such transaction or business opportunity to us or any of our affiliates and they may take any such opportunity for themselves or offer it to another person or entity. Our amended and restated certificate of incorporation does not renounce our interest in any business opportunity that is expressly offered to a non-employee director solely in his or her capacity as a director or officer of the Company. To the fullest extent permitted by law, no business opportunity will be deemed to be a potential corporate opportunity for us unless we would be permitted to undertake the opportunity under our amended and restated certificate of incorporation, we have sufficient financial resources to undertake the opportunity and the opportunity would be in line with our business.
Limitations on Liability and Indemnification of Officers and Directors
The DGCL authorizes corporations to limit or eliminate the personal liability of directors to corporations and their stockholders for monetary damages for breaches of directors’ fiduciary duties, subject to certain exceptions. Our amended and restated certificate of incorporation includes a provision that eliminates the personal liability of directors for monetary damages to the corporation or its stockholders for any breach of fiduciary duty as a director, except to the extent such exemption from liability or limitation thereof is not permitted under the DGCL. The effect of these provisions is to eliminate the rights of us and our stockholders, through stockholders’ derivative suits on our behalf, to recover monetary damages from a director for breach of fiduciary duty as a director, including breaches resulting from grossly negligent behavior. However, exculpation does not apply to any breaches of the director’s duty of loyalty, any acts or omissions not in good faith or that involve intentional misconduct or knowing violation of law, any authorization of dividends or stock redemptions or repurchases paid or made in violation of the DGCL, or for any transaction from which the director derived an improper personal benefit.
Our amended and restated bylaws generally provide that we must indemnify and advance expenses to our directors and officers to the fullest extent authorized by the DGCL. We also are expressly authorized to carry directors’ and officers’ liability insurance providing indemnification for our directors, officers and certain employees for some liabilities. We believe that these indemnification and advancement provisions and insurance are useful to attract and retain qualified directors and executive officers.
The limitation of liability, indemnification and advancement provisions in our amended and restated certificate of incorporation and amended and restated bylaws may discourage stockholders from bringing a lawsuit against directors for breach of their fiduciary duty. These provisions also may have the effect of reducing the likelihood of derivative litigation against directors and officers, even though such an action, if successful, might otherwise benefit us and our stockholders. In addition, your investment may be adversely affected to the extent we pay the costs of settlement and damage awards against directors and officers pursuant to these indemnification provisions.
180
Table of Contents
There is currently no pending material litigation or proceeding involving any of our directors, officers or employees for which indemnification is sought.
Indemnification Agreements
We intend to enter into an indemnification agreement with each of our directors and executive officers as described in “Certain Relationships and Related Person Transactions—Indemnification of Officers and Directors.” Insofar as indemnification for liabilities arising under the Securities Act may be permitted to directors or executive officers, we have been informed that in the opinion of the SEC such indemnification is against public policy and is therefore unenforceable.
Transfer Agent and Registrar
The transfer agent and registrar for shares of our Class A common stock will be .
Listing
We intend to apply to have our Class A common stock approved for listing on the NYSE under the symbol “SUM.”
181
Table of Contents
MATERIAL UNITED STATES FEDERAL INCOME AND ESTATE
TAX CONSEQUENCES TO NON-U.S. HOLDERS
The following is a summary of certain United States federal income and estate tax consequences to non-U.S. holders, defined below, of the purchase, ownership and disposition of shares of our Class A common stock as of the date hereof. Except where noted, this summary deals only with shares of Class A common stock purchased in this offering that are held as capital assets by a non-U.S. holder.
A “non-U.S. holder” means a beneficial owner of shares of our Class A common stock that, for United States federal income tax purposes, is not any of the following:
| • | an individual who is a citizen or resident of the United States; |
| • | a corporation (or any other entity treated as a corporation for United States federal income tax purposes) created or organized in or under the laws of the United States, any state thereof or the District of Columbia; |
| • | an estate the income of which is subject to United States federal income taxation regardless of its source; or |
| • | a trust if it (1) is subject to the primary supervision of a court within the United States and one or more United States persons have the authority to control all substantial decisions of the trust or (2) has a valid election in effect under applicable United States Treasury regulations to be treated as a United States person. |
This summary is based upon provisions of the United States Internal Revenue Code of 1986, as amended, or the Code, applicable United States Treasury regulations, rulings and judicial decisions, all as of the date hereof. Those authorities are subject to different interpretations and may be changed, perhaps retroactively, so as to result in United States federal income and estate tax consequences different from those summarized below. This summary does not address all aspects of United States federal income and estate taxes and does not deal with foreign, state, local, alternative minimum or other tax considerations that may be relevant to non-U.S. holders in light of their particular circumstances. In addition, this summary does not represent a detailed description of the United States federal income and estate tax consequences applicable to you if you are subject to special treatment under the United States federal income tax laws (including if you are a United States expatriate, financial institution, insurance company, tax-exempt organization, trader, broker or dealer in securities, “controlled foreign corporation,” “passive foreign investment company,” a partnership or other pass-through entity for United States federal income tax purposes (or an investor in such a pass-through entity)), a person who acquired shares of our Class A common stock as compensation or otherwise in connection with the performance of services, or a person who has acquired shares of our Class A common stock as part of a straddle, hedge, conversion transaction or other integrated investment). We cannot assure you that a change in law will not alter significantly the tax considerations that we describe in this summary.
If any entity or arrangement treated as a partnership for United States federal income tax purposes holds shares of our Class A common stock, the tax treatment of a partner will generally depend upon the status of the partner and the activities of the partnership. If you are a partner of a partnership holding shares of our Class A common stock, you should consult your tax advisors.
If you are considering the purchase of shares of our Class A common stock, you should consult your own tax advisors concerning the particular United States federal income and estate tax consequences to you of the ownership and disposition of the shares of Class A common stock, as well as the consequences to you arising under the laws of any other applicable taxing jurisdiction in light of your particular circumstances.
182
Table of Contents
Dividends
Cash distributions on shares of our Class A common stock will constitute dividends for United States federal income tax purposes to the extent paid from our current or accumulated earnings and profits, as determined under United States federal income tax principles. To the extent those distributions exceed both our current and our accumulated earnings and profits, they will constitute a return of capital and will first reduce your tax basis in our Class A common stock, but not below zero, and then will be treated as gain from the sale of stock.
Dividends paid to a non-U.S. holder generally will be subject to withholding of United States federal income tax at a 30% rate, or such lower rate as may be specified by an applicable income tax treaty. However, dividends that are effectively connected with the conduct of a trade or business by the non-U.S. holder within the United States (and, if required by an applicable income tax treaty, are attributable to a United States permanent establishment) generally will not be subject to such withholding tax, provided certain certification and disclosure requirements are satisfied. Instead, such dividends generally will be subject to United States federal income tax on a net income basis in the same manner as if the non-U.S. holder were a United States person as defined under the Code. A corporate non-U.S. holder may be subject to an additional “branch profits tax” at a 30% rate (or such lower rate as may be specified by an applicable income tax treaty) on earnings and profits attributable to such dividends that are effectively connected with its United States trade or business (and, if an income tax treaty applies, are attributable to its United States permanent establishment).
A non-U.S. holder of shares of our Class A common stock who wishes to claim the benefit of an applicable treaty rate and avoid backup withholding, as discussed below, for dividends will be required (a) to complete the applicable IRS Form W-8 and certify under penalty of perjury that such holder is not a United States person as defined under the Code and is eligible for treaty benefits or (b) if shares of our Class A common stock are held through certain foreign intermediaries, to satisfy the relevant certification requirements of applicable United States Treasury regulations. Special certification and other requirements apply to certain non-U.S. holders that are pass-through entities rather than corporations or individuals.
A non-U.S. holder of shares of our Class A common stock eligible for a reduced rate of United States withholding tax pursuant to an income tax treaty may obtain a refund of any excess amounts withheld by timely filing an appropriate claim for refund with the IRS.
Gain on Disposition of Class A Common Stock
Subject to discussions below of the backup withholding tax and “FATCA’’ legislation, any gain realized by a non-U.S. holder on the disposition of shares of our Class A common stock generally will not be subject to United States federal income tax unless:
| • | the gain is effectively connected with a trade or business of the non-U.S. holder in the United States (and, if required by an applicable income tax treaty, is attributable to a United States permanent establishment of the non-U.S. holder); |
| • | the non-U.S. holder is an individual who is present in the United States for 183 days or more in the taxable year of that disposition, and certain other conditions are met; or |
| • | we are or have been a “United States real property holding corporation” for United States federal income tax purposes. |
In the case of a non-U.S. holder described in the first bullet point above, any gain will be subject to United States federal income tax on a net income basis generally in the same manner as if the non-U.S. holder were a United States person as defined under the Code, and a non-U.S. holder that is a foreign corporation may also be subject to the branch profits tax equal to 30% of its effectively connected earnings and profits attributable to such gain (or, if an income tax treaty applies, at such lower rate as may be specified by the treaty on its gains
183
Table of Contents
attributable to its United States permanent establishment). Except as otherwise provided by an applicable income tax treaty, an individual non-U.S. holder described in the second bullet point above will be subject to a 30% tax on any gain derived from the sale, which may be offset by certain United States source capital losses, even though the individual is not considered a resident of the United States under the Code.
We have not determined whether we are a “United States real property holding corporation” for United States federal income tax purposes. If we are or become a “United States real property holding corporation,” so long as shares of our Class A common stock continues to be regularly traded on an established securities market, only a non-U.S. holder who holds or held (at any time during the shorter of the five year period preceding the date of disposition or the holder’s holding period) more than 5% of shares of our Class A common stock will be subject to United States federal income tax on the disposition of shares of our Class A common stock.
Federal Estate Tax
Shares of our Class A common stock that are owned (or treated as owned) by an individual who is not a citizen or resident of the United States (as specially defined for United States federal estate tax purposes) at the time of death will be included in such individual’s gross estate for United States federal estate tax purposes, unless an applicable estate or other tax treaty provides otherwise, and therefore may be subject to United States federal estate tax.
Information Reporting and Backup Withholding
We must report annually to the IRS and to each non-U.S. holder the amount of dividends paid to such holder and the tax withheld with respect to such dividends, regardless of whether withholding was required. Copies of the information returns reporting such dividends and withholding may also be made available to the tax authorities in the country in which the non-U.S. holder resides under the provisions of an applicable income tax treaty or agreement.
A non-U.S. holder will be subject to backup withholding for dividends paid to such holder unless such holder certifies under penalty of perjury that it is not a United States person as defined under the Code (and the payor does not have actual knowledge or reason to know that such holder is a United States person as defined under the Code), or such holder otherwise establishes an exemption.
Information reporting and, depending on the circumstances, backup withholding will apply to the proceeds of a sale of shares of our Class A common stock within the United States or conducted through certain United States-related financial intermediaries, unless the beneficial owner certifies under penalty of perjury that it is not a United States person as defined under the Code (and the payor does not have actual knowledge or reason to know that the beneficial owner is a United States person as defined under the Code), or such owner otherwise establishes an exemption.
Backup withholding is not an additional tax. Any amounts withheld under the backup withholding rules may be allowed as a refund or a credit against a non-U.S. holder’s United States federal income tax liability provided the required information is timely furnished to the IRS.
Additional FATCA Withholding Requirements
Under Section 1471 through 1474 of the Code (such Sections commonly referred to as “FATCA”), a 30% United States federal withholding tax may apply to any dividends paid on our Class A common stock, and, for a disposition of our common stock occurring after December 31, 2016, the gross proceeds from such disposition, in each case paid to (i) a “foreign financial institution” (as specifically defined in the Code) which does not provide sufficient documentation, typically on IRS Form W-8BEN-E, evidencing either (x) an exemption from FATCA,
184
Table of Contents
or (y) its compliance (or deemed compliance) with FATCA (which may alternatively be in the form of compliance with an intergovernmental agreement with the United States) in a manner that avoids withholding, or (ii) a “non-financial foreign entity” (as specifically defined in the Code) which does not provide sufficient documentation, typically on IRS Form W-8BEN-E, evidencing either (x) an exemption from FATCA, or (y) adequate information regarding certain substantial United States beneficial owners of such entity (if any). If a dividend payment is both subject to withholding under FATCA and subject to the withholding tax discussed above under “—Dividends,” the withholding under FATCA may be credited against, and therefore reduce, such other withholding tax. You should consult your own tax advisor regarding these requirements and whether they may be relevant to your ownership and disposition of our Class A common stock.
185
Table of Contents
The following is a summary of certain considerations associated with the purchase of the Class A common stock by employee benefit plans that are subject to Title I of the Employee Retirement Income Security Act of 1974, as amended (“ERISA”), plans, individual retirement accounts and other arrangements that are subject to Section 4975 of the Code or provisions under any other federal, state, local, non-U.S. or other laws or regulations that are similar to such provisions of the Code or ERISA (collectively, “Similar Laws”), and entities whose underlying assets are considered to include “plan assets” of any such plan, account or arrangement (each, a “Plan”).
Prohibited Transaction Issues
Section 406 of ERISA and Section 4975 of the Code prohibit ERISA Plans from engaging in specified transactions involving plan assets with persons or entities who are “parties in interest,” within the meaning of ERISA, or “disqualified persons,” within the meaning of Section 4975 of the Code, unless an exemption is available. A party in interest or disqualified person who engaged in a non-exempt prohibited transaction may be subject to excise taxes and other penalties and liabilities under ERISA and the Code. In addition, the fiduciary of the ERISA Plan that engaged in such a non-exempt prohibited transaction may be subject to penalties and liabilities under ERISA and the Code.
The acquisition of the Class A common stock by an ERISA Plan with respect to which we are considered a party in interest or a disqualified person may constitute or result in a direct or indirect prohibited transaction under Section 406 of ERISA and/or Section 4975 of the Code, unless the investment is acquired and held in accordance with an applicable statutory, class or individual prohibited transaction exemption. In this regard, the U.S. Department of Labor (the “DOL”) has issued prohibited transaction class exemptions, or “PTCEs,” that may apply to the acquisition of the Class A common stock. These class exemptions include, without limitation, PTCE 84-14 respecting transactions determined by independent qualified professional asset managers, PTCE 90-1 respecting insurance company pooled separate accounts, PTCE 91-38 respecting bank collective investment funds, PTCE 95-60 respecting life insurance company general accounts and PTCE 96-23 respecting transactions determined by in-house asset managers. There can be no assurance that all of the conditions of any such exemptions will be satisfied.
Plan Asset Issues
ERISA and the regulations (the “Plan Asset Regulations”) promulgated under ERISA by the DOL generally provide that when an ERISA Plan acquires an equity interest in an entity that is neither a “publicly-offered security” nor a security issued by an investment company registered under the Investment Company Act, the ERISA Plan’s assets include both the equity interest and an undivided interest in each of the underlying assets of the entity unless it is established either that less than 25% of the total value of each class of equity interest in the entity is held by “benefit plan investors” as defined in Section 3(42) of ERISA or that the entity is an “operating company,” as defined in the Plan Asset Regulations. Although no assurances can be given, we believe that we qualify as an “operating company”.
In addition, although no assurances can be given, it is anticipated that the Class A common stock will qualify for the exemption for a “publicly-offered security”. For purposes of the Plan Asset Regulations, a “publicly offered security” is a security that is (a) “freely transferable”, (b) part of a class of securities that is “widely held,” and (c) (i) sold to the ERISA Plan as part of an offering of securities to the public pursuant to an effective registration statement under the Securities Act and the class of securities to which such security is a part is registered under the Exchange Act within 120 days after the end of the fiscal year of the issuer during which the offering of such securities to the public has occurred, or (ii) is part of a class of securities that is registered under Section 12 of the Exchange Act. We intend to effect such a registration under the Securities Act and Exchange Act. The Plan Asset Regulations provide that a security is “widely held” only if it is part of a class of
186
Table of Contents
securities that is owned by 100 or more investors independent of the issuer and one another. A security will not fail to be “widely held” because the number of independent investors falls below 100 subsequent to the initial offering thereof as a result of events beyond the control of the issuer. The Plan Asset Regulations provide that whether a security is “freely transferable” is a factual question to be determined on the basis of all the relevant facts and circumstances. It is anticipated that the Class A common stock will be “widely held” and will be “freely transferable,” each within the meaning of the Plan Asset Regulations, although no assurance can be given in this regard.
Plan Asset Consequences
If the assets of the Issuer were deemed to be “plan assets” under ERISA, this would result, among other things, in (i) the application of the prudence and other fiduciary responsibility standards of ERISA to investments made by the Issuer, and (ii) the possibility that certain transactions in which the Issuer might seek to engage could constitute “prohibited transactions” under ERISA and the Code.
Because of the foregoing, the Class A common stock should not be purchased or held by any person investing “plan assets” of any Plan, unless such purchase and holding will not constitute a non-exempt prohibited transaction under ERISA and the Code or similar violation of any applicable Similar Laws.
Accordingly, by acceptance of the Class A common stock, each purchaser and subsequent transferee of the Class A common stock will be deemed to have represented and warranted that either (i) no portion of the assets used by such purchaser or transferee to acquire the Class A common stock constitutes assets of any Plan or (ii) the purchase of the Class A common stock by such purchaser or transferee will not constitute a non-exempt prohibited transaction under Section 406 of ERISA or Section 4975 of the Code or similar violation under any applicable Similar Laws.
The foregoing discussion is general in nature and is not intended to be all-inclusive. Due to the complexity of these rules and the penalties that may be imposed upon persons involved in non-exempt prohibited transactions, it is particularly important that fiduciaries, or other persons considering purchasing the Class A common stock on behalf of, or with the assets of, any Plan, consult with their counsel regarding the potential applicability of ERISA, Section 4975 of the Code and any Similar Laws to such investment and whether an exemption would be applicable to the purchase and holding of the Class A common stock.
187
Table of Contents
SHARES ELIGIBLE FOR FUTURE SALE
Prior to this offering, there has been no public market for shares of our Class A common stock. We cannot predict the effect, if any, future sales of shares of Class A common stock, or the availability for future sale of shares of Class A common stock, will have on the market price of shares of our Class A common stock prevailing from time to time. The sale of substantial amounts of shares of our Class A common stock in the public market, or the perception that such sales could occur, could harm the prevailing market price of shares of our Class A common stock and could impair our future ability to raise capital through the sale of our equity or equity related securities at a time and price that we deem appropriate.
Currently, no shares of our Class A common stock are outstanding and shares of our Class B common stock are outstanding, all of which are owned by Summit Owner Holdco.
Upon completion of this offering we will have a total of shares of our Class A common stock outstanding (or shares of Class A common stock if the underwriters exercise in full their option to purchase additional shares of Class A common stock). All of these shares of Class A common stock will have been sold in this offering and will be freely tradable without restriction or further registration under the Securities Act by persons other than our “affiliates.” Under the Securities Act, an “affiliate” of an issuer is a person that directly or indirectly controls, is controlled by or is under common control with that issuer.
In addition, subject to certain limitations and exceptions, pursuant to the terms of an exchange agreement we will enter into with our pre-IPO owners, holders of LP Units may, from and after the first anniversary of the completion of this offering (subject to the terms of the exchange agreement), exchange LP Units for shares of our Class A common stock on a one-for-one basis, subject to customary conversion rate adjustments for stock splits, stock dividends and reclassifications. Notwithstanding the foregoing, Blackstone is generally permitted to exchange LP Units at any time. Upon consummation of this offering, our pre-IPO owners will hold LP Units, all of which will be exchangeable for shares of our Class A common stock. The shares of Class A common stock we issue upon such exchanges would be “restricted securities” as defined in Rule 144 unless we register such issuances. However, we will enter into one or more registration rights agreements with our pre-IPO owners that will require us to register under the Securities Act these shares of Class A common stock. See “—Registration Rights” and “Certain Relationships and Related Person Transactions—Registration Rights Agreements.”
In addition, shares of Class A common stock may be granted under our Omnibus Incentive Plan. See “Executive and Director Compensation—Summit Materials, Inc. Omnibus Incentive Plan.” We intend to file one or more registration statements on Form S-8 under the Securities Act to register shares of Class A common stock or securities convertible into or exchangeable for shares of Class A common stock issued under or covered by our Omnibus Incentive Plan. Any such Form S-8 registration statements will automatically become effective upon filing. Accordingly, shares of Class A common stock registered under such registration statements will be available for sale in the open market. We expect that the initial registration statement on Form S-8 will cover shares of Class A common stock.
Our certificate of incorporation authorizes us to issue additional shares of Class A common stock and options, rights, warrants and appreciation rights relating to Class A common stock for the consideration and on the terms and conditions established by our board of directors in its sole discretion. In accordance with the DGCL and the provisions of our certificate of incorporation, we may also issue preferred stock that has designations, preferences, rights, powers and duties that are different from, and may be senior to, those applicable to shares of Class A common stock. See “Description of Capital Stock.” Similarly, the limited partnership agreement of Summit Holdings permits Summit Holdings to issue an unlimited number of additional limited partnership interests of Summit Holdings with designations, preferences, rights, powers and duties that are different from, and may be senior to, those applicable to the LP Units, and which may be exchangeable for shares of our Class A common stock.
188
Table of Contents
Registration Rights
We will enter into one or more registration rights agreements with our pre-IPO owners pursuant to which we will grant them, their affiliates and certain of their transferees the right, under certain circumstances and subject to certain restrictions, to require us to register under the Securities Act shares of Class A common stock delivered in exchange for LP Units. Under the registration rights agreement, we will agree to register the exchange of LP Units for shares of Class A common stock by our pre-IPO owners. In addition, Blackstone will have the right to request an unlimited number of “demand” registrations the Class B Unitholders will have the right to request one “demand” registration, and Blackstone, certain other pre-IPO owners and the Class B Unitholders will have customary “piggyback” registration rights.
Lock-Up Agreements
We have agreed, subject to enumerated exceptions, that we will not offer, sell, contract to sell, pledge or otherwise dispose of, directly or indirectly, or file with the SEC a registration statement under the Securities Act relating to, any shares of our Class A common stock or securities convertible into or exchangeable or exercisable for any shares of our Class A common stock, or publicly disclose the intention to make any such offer, sale, pledge, disposition or filing, without the prior written consent of Citigroup Global Markets Inc. and Goldman, Sachs & Co. for a period of 180 days after the date of this prospectus.
Our officers, directors and each of our pre-IPO owners has agreed, subject to enumerated exceptions, that they will not offer, sell, contract to sell, pledge or otherwise dispose of, directly or indirectly, any shares of our Class A common stock or securities convertible into or exchangeable or exercisable for any shares of our Class A common stock, enter into a transaction that would have the same effect, or enter into any swap, hedge or other arrangement that transfers, in whole or in part, any of the economic consequences of ownership of our Class A common stock, whether any of these transactions are to be settled by delivery of our Class A common stock or other securities, in cash or otherwise, or publicly disclose the intention to make any such offer, sale, pledge or disposition, or to enter into any transaction, swap, hedge or other arrangement, without, in each case, the prior written consent of Citigroup Global Markets Inc. and Goldman, Sachs & Co. for a period of 180 days after the date of this prospectus. See “Underwriting(Conflicts of Interest)–No Sales of Similar Securities.”
Rule 144
In general, under Rule 144, as currently in effect, a person who is not deemed to be our affiliate for purposes of Rule 144 or to have been one of our affiliates at any time during the three months preceding a sale and who has beneficially owned the shares of Class A common stock proposed to be sold for at least six months, including the holding period of any prior owner other than our affiliates, is entitled to sell those shares of Class A common stock without complying with the manner of sale, volume limitation or notice provisions of Rule 144, subject to compliance with the public information requirements of Rule 144. If such a person has beneficially owned the shares of Class A common stock proposed to be sold for at least one year, including the holding period of any prior owner other than our affiliates, then that person is entitled to sell those shares of Class A common stock without complying with any of the requirements of Rule 144. In general, six months after the effective date of the registration statement of which this prospectus forms a part, under Rule 144, as currently in effect, our affiliates or persons selling shares of Class A common stock on behalf of our affiliates are entitled to sell, within any three-month period, a number of shares of Class A common stock that does not exceed the greater of (1) 1% of the number of shares of Class A common stock then outstanding and (2) the average weekly trading volume of the shares of Class A common stock during the four calendar weeks preceding the filing of a notice on Form 144 with respect to that sale. Sales under Rule 144 by our affiliates or persons selling shares of Class A common stock on behalf of our affiliates are also subject to certain manner of sale provisions and notice requirements and to the availability of current public information about us.
189
Table of Contents
UNDERWRITING (CONFLICTS OF INTEREST)
Citigroup Global Markets Inc. and Goldman, Sachs & Co. are acting as representatives of each of the underwriters named below. Subject to the terms and conditions of the underwriting agreement, the underwriters named below have severally agreed to purchase from us the following respective number of shares of our Class A common stock at a public offering price less the underwriting discounts and commissions set forth on the cover page of this prospectus:
| Underwriter |
Number of Shares | |
| Citigroup Global Markets Inc. |
||
| Goldman, Sachs & Co. |
||
| Barclays Capital Inc. |
||
| Deutsche Bank Securities Inc. |
||
| Merrill Lynch, Pierce, Fenner &
Smith |
||
| RBC Capital Markets, LLC |
||
| Blackstone Advisory Partners L.P. |
||
| BB&T Capital Markets, a division
of |
||
| Stephens Inc. |
||
| Sterne, Agee & Leach, Inc. |
||
| Stifel, Nicolaus & Company, Incorporated |
||
|
| ||
| Total |
||
|
|
The underwriting agreement provides that the underwriters’ obligation to purchase shares of Class A common stock depends on the satisfaction of the conditions contained in the underwriting agreement including:
| • | the obligation to purchase all of the shares of our Class A common stock offered hereby (other than those shares of our Class A common stock covered by their option to purchase additional shares as described below), if any of the shares are purchased; |
| • | the representations and warranties made by us to the underwriters are true; |
| • | there is no material change in our business or the financial markets; and |
| • | we deliver customary closing documents to the underwriters. |
The offering of the shares by the underwriters is subject to receipt and acceptance and subject to the underwriters’ right to reject any order in whole or in part.
Commissions and Expenses
The following table summarizes the underwriting discounts and commissions we will pay to the underwriters. These amounts are shown assuming both no exercise and full exercise of the underwriters’ option to purchase additional shares. The underwriting fee is the difference between the initial offering price to the public and the amount the underwriters pay us for the shares.
| Per Share | Total | |||||||
| No Exercise |
Full Exercise |
No Exercise |
Full Exercise | |||||
| Public offering price |
||||||||
| Underwriting discounts and commissions |
||||||||
| Proceeds, before expenses, to us |
||||||||
190
Table of Contents
The representatives of the underwriters have advised us that the underwriters propose to offer the shares of Class A common stock directly to the public at the public offering price on the cover of this prospectus and to selected dealers, which may include the underwriters, at such offering price less a selling concession not in excess of $ per share. The underwriters may allow, and the selected dealers may re-allow, a discount from the concession not in excess of $ per share to brokers and dealers. After the offering, the representatives may change the offering price and other selling terms.
The expenses of the offering that are payable by us are estimated to be approximately $ (excluding underwriting discounts and commissions), including up to $ in connection with the qualification of the offering with FINRA by counsel to the underwriters.
Option to Purchase Additional Shares
We have granted the underwriters an option exercisable for 30 days after the date of this prospectus, to purchase, from time to time, in whole or in part, up to an aggregate of shares of our Class A common stock at the public offering price less underwriting discounts and commissions. To the extent the underwriters exercise this option, each underwriter will be committed, so long as the conditions of the underwriting agreement are satisfied, to purchase a number of additional shares of our Class A common stock proportionate to that underwriter’s initial commitment as indicated in the preceding table, and we will be obligated to sell the additional shares to the underwriters.
No Sales of Similar Securities
We, our executive officers and directors and holders of our common stock have agreed not to sell or transfer any common stock or securities convertible into, exchangeable for, exercisable for, or repayable with common stock, for 180 days after the date of this prospectus without first obtaining the written consent of Citigroup Global Markets Inc. and Goldman, Sachs & Co. Specifically, we and these other persons have agreed, with certain limited exceptions, not to offer, sell, contract to sell, pledge, grant any option to purchase, make any short sale or otherwise dispose of any common stock, or any options or warrants to purchase any common stock, or any securities convertible into, exchangeable for or that represent the right to receive common stock, whether now owned or hereinafter acquired, owned directly by us or these other persons (including holding as a custodian) or with respect to which we or such other persons has beneficial ownership within the rules and regulations of the SEC. We and such other persons have agreed that these restrictions expressly preclude us and such other persons from engaging in any hedging or other transaction which is designed to or which reasonably could be expected to lead to or result in a sale or disposition of our or such other persons’ common stock if such common stock would be disposed of by someone other than us or such other persons. Prohibited hedging or other transactions includes any short sale or any purchase, sale or grant of any right (including without limitation any put or call option) with respect to any of our or such other persons’ common stock or with respect to any security that includes, relates to, or derives any significant part of its value from such common stock.
The restrictions described in the paragraph above do not apply to:
| • | the transfer by a security holder of shares of common stock or any securities convertible into, exchangeable for, exerciseable for, or repayable with common stock (1) by will or intestacy, (2) as a bona fide gift or gifts, (3) to any trust, partnership, limited liability company or other entity for the direct or indirect benefit of a security holder or the immediate family of such security holder, (4) to any immediate family member or other dependent of the security holder, (5) as a distribution to limited partners, members or stockholders of the security holder, (6) to the security holder’s affiliates or to any investment fund or other entity controlled or managed by the security holder, (7) in connection with the exchange of LP Units for shares of common stock, (8) to a nominee or custodian of a person or entity to whom a disposition or transfer would be permissible under clauses (1) through (6) above, (9) pursuant to an order of a court or regulatory agency, (10) from an executive officer of ours or our parent entities upon death, disability or termination of employment, in each case, of such executive |
191
Table of Contents
| officer, (11) in connection with transactions by any person other than us relating to shares of common stock issued in this offering acquired in open market transactions after the completion of the offering so long as no filing under Section 16 of the Exchange Act is required or be voluntarily made and/or (12) with the prior written consent of Citigroup Global Markets Inc. and Goldman, Sachs & Co. In the case of each transfer or distribution pursuant to clauses (2) through (8) and (9) above, (i) each donee, trustee, distributee or transferee, as the case may be, must agree to be bound in writing by the restrictions described in the paragraph above and (ii) any such transfer or distribution does not involve a disposition for value, other than with respect to any such transfer or distribution for which the transferor or distributor receives (A) equity interests of such transferee or (B) such transferee’s interests in the transferor. In the case of each transfer or distribution pursuant to clauses (2) through (7), if any filing under Section 16 of the Exchange Act is required or voluntarily made (i) the security holder must provide Citigroup Global Markets Inc. and Goldman, Sachs & Co. prior written notice informing them of such filing and (ii) such filing must disclose that such donee, trustee, distributee or transferee, as the case may be, agrees to be bound in writing by the restrictions described in the paragraph above; |
| • | if the security holder is a corporation, the corporation may transfer our capital stock to any wholly-owned subsidiary of such corporation; provided, however, that in any such case, it is a condition to the transfer that the transferee execute an agreement stating that the transferee is receiving and holding such capital stock subject to the provisions of the lock-up agreement and there will be no further transfer of such capital stock except in accordance with the lock-up agreement, and provided further that any such transfer must not involve a disposition for value; |
| • | the sale of the security holder’s shares pursuant to the underwriting agreement; |
| • | the establishment by a security holder of a trading plan pursuant to Rule 10b5-1 under the Exchange Act, provided that no transfers occur under such plan during the lock-up period and no public announcement or filing is required or voluntarily made by any person in connection therewith other than general disclosure in our periodic reports to the effect that our directors and officers may enter into such trading plans from time to time; and/or |
| • | the delivery of shares of stock and/or LP Units to holders of interests in our company as contemplated by this prospectus. |
In the event that either (x) during the last 17 days of the lock-up period referred to above, we issue an earnings release or material news or a material event relating to us occurs or (y) prior to the expiration of the lock-up period, we announce that we will release earnings results or become aware that material news or a material event will occur during the 15-day period beginning on the last day of the lock-up period, the restrictions described above will continue to apply until the expiration of the 18-day period beginning on the issuance of the earnings release or the occurrence of the material news or material event, unless Citigroup Global Markets Inc. and Goldman, Sachs & Co. waive, in writing, such extension.
Offering Price Determination
Prior to this offering, there has been no public market for our Class A common stock. The initial public offering price will be negotiated between us and the representatives. In determining the initial public offering price of our Class A common stock, the representatives will consider:
| • | the history and prospects for the industry in which we compete; |
| • | our financial information; |
| • | the ability of our management, present stage of development and our business potential and earning prospects; |
| • | the prevailing securities markets at the time of this offering; and |
| • | the recent market prices of, and the demand for, publicly traded shares of generally comparable companies. |
192
Table of Contents
Indemnification
We have agreed to indemnify the several underwriters against certain liabilities, including liabilities under the Securities Act, liabilities arising from breaches of the representations and warranties contained in the underwriting agreement and to contribute to payments that the underwriters may be required to make for these liabilities.
Stabilization, Short Positions and Penalty Bids
The underwriters may engage in stabilizing transactions, short sales and purchases to cover positions created by short sales, and penalty bids or purchases for the purpose of pegging, fixing or maintaining the price of our Class A common stock, in accordance with Regulation M under the Exchange Act.
| • | Stabilizing transactions permit bids to purchase the underlying security so long as the stabilizing bids do not exceed a specified maximum. |
| • | A short position involves a sale by the underwriters of shares in excess of the number of shares the underwriters are obligated to purchase in the offering, which creates the syndicate short position. This short position may be either a covered short position or a naked short position. In a covered short position, the number of shares involved in the sales made by the underwriters in excess of the number of shares they are obligated to purchase is not greater than the number of shares that they may purchase by exercising their option to purchase additional shares. In a naked short position, the number of shares involved is greater than the number of shares in their option to purchase additional shares. The underwriters may close out any short position by either exercising their option to purchase additional shares, in whole or in part, and/or purchasing shares in the open market. In determining the source of shares to close out the short position, the underwriters will consider, among other things, the price of shares available for purchase in the open market as compared to the price at which they may purchase shares through their option to purchase additional shares. A naked short position is more likely to be created if the underwriters are concerned that there could be downward pressure on the price of the shares in the open market after pricing that could adversely affect investors who purchase in the offering. |
| • | Syndicate covering transactions involve purchases of our Class A common stock in the open market after the distribution has been completed in order to cover syndicate short positions. |
| • | Penalty bids permit the representatives to reclaim a selling concession from a syndicate member when the common stock originally sold by the syndicate member is purchased in a stabilizing or syndicate covering transaction to cover syndicate short positions. |
These stabilizing transactions, syndicate covering transactions and penalty bids may have the effect of raising or maintaining the market price of our Class A common stock or preventing or retarding a decline in the market price of our common stock. As a result, the price of our Class A common stock may be higher than the price that might otherwise exist in the open market. These transactions may be effected on the or otherwise and, if commenced, may be discontinued at any time.
Neither we nor any of the underwriters make any representation or prediction as to the direction or magnitude of any effect that the transactions described above may have on the price of our Class A common stock. In addition, neither we nor any of the underwriters make representation that the underwriters will engage in these stabilizing transactions or that any transaction, once commenced, will not be discontinued without notice.
Electronic Distribution
In connection with the offering, certain of the underwriters or securities dealers may distribute prospectuses by electronic means, such as e-mail. In addition, certain of the underwriters may facilitate Internet distribution for this offering to certain of its Internet subscription customers. Such underwriters may allocate a limited number of shares for sale to its online brokerage customers. A prospectus in electronic format is being made available on Internet web sites maintained by one or more of the bookrunners of this offering and may be made available on web sites maintained by other underwriters. Other than the prospectus in electronic format, the
193
Table of Contents
information on any underwriter’s web site and any information contained in any other web site maintained by an underwriter is not part of the prospectus or the registration statement of which the prospectus forms a part.
Listing
We intend to list our Class A common stock on the NYSE under the symbol “SUM.”
Discretionary Sales
The underwriters have informed us that they do not intend to confirm sales to discretionary accounts that exceed 5% of the total number of shares offered by them.
Stamp Taxes
Purchasers of the shares of our Class A common stock offered in this prospectus may be required to pay stamp taxes and other charges under the laws and practices of the country of purchase, in addition to the offering price listed on the cover page of this prospectus. Accordingly, we urge you to consult a tax advisor with respect to whether you may be required to pay those taxes or charges, as well as any other tax consequences that may arise under the laws of the country of purchase.
Conflicts of Interest
Blackstone Advisory Partners L.P., which is deemed an affiliate of Blackstone and, therefore, our affiliate, is a member of FINRA and an underwriter in this offering. Accordingly, this offering is being made in compliance with the requirements of Rule 5121. Pursuant to that rule, the appointment of a “qualified independent underwriter” is not required in connection with this offering as the members primarily responsible for managing the public offering do not have a conflict of interest, are not affiliates of any member that has a conflict of interest and meet the requirements of paragraph (f)(12)(E) of Rule 5121. Blackstone Advisory Partners L.P. will not confirm sales of the securities to any account over which it exercises discretionary authority without the specific written approval of the account holder.
Other Relationships
The underwriters and their respective affiliates are full service financial institutions engaged in various activities, which may include securities trading, commercial and investment banking, financial advisory, investment management, investment research, principal investment, hedging, financing and brokerage activities. Certain of the underwriters and their respective affiliates have, from time to time, performed, and may in the future perform, various financial advisory and investment banking services for us, for which they may receive customary fees and expenses. In particular, Merrill Lynch, Pierce, Fenner & Smith Incorporated, Citigroup Global Markets Inc., Barclays Capital Inc. and Deutsche Bank Securities Inc. were joint bookrunners, an affiliate of Merrill Lynch, Pierce, Fenner & Smith Incorporated was administrative agent, collateral agent, letter of credit issuer and swing line lender, an affiliate of Barclays Capital Inc. was co-documentation agent and Citigroup Global Markets Inc. was syndication agent and, together with an affiliate of Merrill Lynch, Pierce, Fenner & Smith Incorporated, were joint lead arrangers under our $422 million senior secured term loan and $150 million senior revolving credit facility. As we intend to use a portion of the proceeds to repay some or all of the then outstanding amounts under our senior secured credit facilities, certain of the underwriters and/or their affiliates will receive their pro rata share of such repayment. Merrill Lynch, Pierce, Fenner & Smith Incorporated, Citigroup Global Markets Inc., Deutsche Bank Securities Inc., Barclays Capital Inc. and Blackstone Advisory Partners L.P., an affiliate of Blackstone, were initial purchasers under $250 million, $260 million and $115 million aggregate principal amounts of our senior notes issued on January 30, 2012, January 17, 2014 and September 8, 2014, respectively.
194
Table of Contents
In the ordinary course of business, the underwriters and their respective affiliates may make or hold a broad array of investments including serving as counterparties to certain derivative and hedging arrangements and actively trade debt and equity securities (or related derivative securities) and financial instruments (including bank loans) for their own account and for the accounts of their customers, and such investment and securities activities may involve securities and/or instruments of the issuer. The underwriters and their respective affiliates may also make investment recommendations and/or publish or express independent research views in respect of such securities or instruments and may at any time hold, or recommend to clients that they acquire, long and/or short positions in such securities and instruments.
Notice to Prospective Investors in the European Economic Area
In relation to each Member State of the European Economic Area which has implemented the Prospectus Directive (each, a “Relevant Member State”), with effect from and including the date on which the Prospectus Directive is implemented in that Relevant Member State, no offer of shares may be made to the public in that Relevant Member State other than:
| • | to any legal entity which is a qualified investor as defined in the Prospectus Directive; |
| • | to fewer than 100 or, if the Relevant Member State has implemented the relevant provision of the 2010 PD Amending Directive, 150, natural or legal persons (other than qualified investors as defined in the Prospectus Directive), as permitted under the Prospectus Directive, subject to obtaining the prior consent of the representatives; or |
| • | in any other circumstances falling within Article 3(2) of the Prospectus Directive, provided that no such offer of shares shall require the Company or the representatives to publish a prospectus pursuant to Article 3 of the Prospectus Directive or supplement a prospectus pursuant to Article 16 of the Prospectus Directive. |
Each person in a Relevant Member State (other than a Relevant Member State where there is a Permitted Public Offer) who initially acquires any shares or to whom any offer is made will be deemed to have represented, acknowledged and agreed that (A) it is a “qualified investor” within the meaning of the law in that Relevant Member State implementing Article 2(1)(e) of the Prospectus Directive, and (B) in the case of any shares acquired by it as a financial intermediary, as that term is used in Article 3(2) of the Prospectus Directive, the shares acquired by it in the offering have not been acquired on behalf of, nor have they been acquired with a view to their offer or resale to, persons in any Relevant Member State other than “qualified investors” as defined in the Prospectus Directive, or in circumstances in which the prior consent of the representatives has been given to the offer or resale. In the case of any shares being offered to a financial intermediary as that term is used in Article 3(2) of the Prospectus Directive, each such financial intermediary will be deemed to have represented, acknowledged and agreed that the shares acquired by it in the offer have not been acquired on a non-discretionary basis on behalf of, nor have they been acquired with a view to their offer or resale to, persons in circumstances which may give rise to an offer of any shares to the public other than their offer or resale in a Relevant Member State to qualified investors as so defined or in circumstances in which the prior consent of the representatives has been obtained to each such proposed offer or resale.
The Company, the representatives and their affiliates will rely upon the truth and accuracy of the foregoing representation, acknowledgement and agreement.
This prospectus has been prepared on the basis that any offer of shares in any Relevant Member State will be made pursuant to an exemption under the Prospectus Directive from the requirement to publish a prospectus for offers of shares. Accordingly any person making or intending to make an offer in that Relevant Member State of shares which are the subject of the offering contemplated in this prospectus may only do so in circumstances in which no obligation arises for the Company or any of the underwriters to publish a prospectus pursuant to Article 3 of the Prospectus Directive in relation to such offer. Neither the Company nor the underwriters have authorized, nor do they authorize, the making of any offer of shares in circumstances in which an obligation arises for the Company or the underwriters to publish a prospectus for such offer.
195
Table of Contents
For the purpose of the above provisions, the expression “an offer to the public” in relation to any shares in any Relevant Member State means the communication in any form and by any means of sufficient information on the terms of the offer and the shares to be offered so as to enable an investor to decide to purchase or subscribe the shares, as the same may be varied in the Relevant Member State by any measure implementing the Prospectus Directive in the Relevant Member State and the expression “Prospectus Directive” means Directive 2003/71/EC (including the 2010 PD Amending Directive, to the extent implemented in the Relevant Member States) and includes any relevant implementing measure in the Relevant Member State and the expression “2010 PD Amending Directive” means Directive 2010/73/EU.
Notice to Prospective Investors in the United Kingdom
Each underwriter agrees that:
| • | it has only communicated or caused to be communicated and will only communicate or cause to be communicated an invitation or inducement to engage in investment activity (within the meaning of Section 21 of the FSMA) received by it in connection with the issue or sale of the shares in circumstances in which Section 21(1) of the FSMA does not apply to the Company; and |
| • | it has complied and will comply with all applicable provisions of the FSMA with respect to anything done by it in relation to the shares in, from or otherwise involving the United Kingdom. |
Notice to Prospective Investors in Hong Kong
The shares may not be offered or sold by means of any document other than (i) in circumstances which do not constitute an offer to the public within the meaning of the Companies Ordinance (Cap.32, Laws of Hong Kong), or (ii) to “professional investors” within the meaning of the Securities and Futures Ordinance (Cap.571, Laws of Hong Kong) and any rules made thereunder, or (iii) in other circumstances which do not result in the document being a “prospectus” within the meaning of the Companies Ordinance (Cap.32, Laws of Hong Kong), and no advertisement, invitation or document relating to the shares may be issued or may be in the possession of any person for the purpose of issue (in each case whether in Hong Kong or elsewhere), which is directed at, or the contents of which are likely to be accessed or read by, the public in Hong Kong (except if permitted to do so under the laws of Hong Kong) other than with respect to shares which are or are intended to be disposed of only to persons outside Hong Kong or only to “professional investors” within the meaning of the Securities and Futures Ordinance (Cap. 571, Laws of Hong Kong) and any rules made thereunder.
Notice to Prospective Investors in Singapore
This prospectus has not been registered as a prospectus with the Monetary Authority of Singapore. Accordingly, this prospectus and any other document or material in connection with the offer or sale, or invitation for subscription or purchase, of the shares may not be circulated or distributed, nor may the shares be offered or sold, or be made the subject of an invitation for subscription or purchase, whether directly or indirectly, to persons in Singapore other than (i) to an institutional investor under Section 274 of the Securities and Futures Act, Chapter 289 of Singapore (the “SFA”), (ii) to a relevant person, or any person pursuant to Section 275(1A), and in accordance with the conditions, specified in Section 275 of the SFA or (iii) otherwise pursuant to, and in accordance with the conditions of, any other applicable provision of the SFA.
Where the shares are subscribed or purchased under Section 275 by a relevant person which is: (a) a corporation (which is not an accredited investor) the sole business of which is to hold investments and the entire share capital of which is owned by one or more individuals, each of whom is an accredited investor; or (b) a trust (where the trustee is not an accredited investor) whose sole purpose is to hold investments and each beneficiary is an accredited investor, shares, debentures and units of shares and debentures of that corporation or the beneficiaries’ rights and interest in that trust shall not be transferable for six months after that corporation or that trust has acquired the shares under Section 275 except: (1) to an institutional investor under Section 274 of the SFA or to a relevant person, or any person pursuant to Section 275(1A), and in accordance with the conditions, specified in Section 275 of the SFA; (2) where no consideration is given for the transfer; or (3) by operation of law.
196
Table of Contents
Notice to Prospective Investors in Japan
The securities have not been and will not be registered under the Financial Instruments and Exchange Law of Japan (the Financial Instruments and Exchange Law) and each underwriter has agreed that it will not offer or sell any securities, directly or indirectly, in Japan or to, or for the benefit of, any resident of Japan (which term as used herein means any person resident in Japan, including any corporation or other entity organized under the laws of Japan), or to others for re-offering or resale, directly or indirectly, in Japan or to a resident of Japan, except pursuant to an exemption from the registration requirements of, and otherwise in compliance with, the Financial Instruments and Exchange Law and any other applicable laws, regulations and ministerial guidelines of Japan.
Notice to Prospective Investors in Switzerland
The shares may not be publicly offered in Switzerland and will not be listed on the SIX Swiss Exchange (“SIX”) or on any other stock exchange or regulated trading facility in Switzerland. This document has been prepared without regard to the disclosure standards for issuance prospectuses under art. 652a or art. 1156 of the Swiss Code of Obligations or the disclosure standards for listing prospectuses under art. 27 ff. of the SIX Listing Rules or the listing rules of any other stock exchange or regulated trading facility in Switzerland. Neither this document nor any other offering or marketing material relating to the shares or the offering may be publicly distributed or otherwise made publicly available in Switzerland.
Neither this document nor any other offering or marketing material relating to the offering, the Company or the shares have been or will be filed with or approved by any Swiss regulatory authority. In particular, this document will not be filed with, and the offer of shares will not be supervised by, the Swiss Financial Market Supervisory Authority FINMA (FINMA), and the offer of shares has not been and will not be authorized under the Swiss Federal Act on Collective Investment Schemes (“CISA”). The investor protection afforded to acquirers of interests in collective investment schemes under the CISA does not extend to acquirers of shares.
Notice to Prospective Investors in Australia
No placement document, prospectus, product disclosure statement or other disclosure document has been lodged with the Australian Securities and Investments Commission (“ASIC”), in relation to the offering. This prospectus does not constitute a prospectus, product disclosure statement or other disclosure document under the Corporations Act 2001 (the “Corporations Act”), and does not purport to include the information required for a prospectus, product disclosure statement or other disclosure document under the Corporations Act.
Any offer in Australia of the shares may only be made to persons (the “Exempt Investors”) who are “sophisticated investors” (within the meaning of section 708(8) of the Corporations Act), “professional investors” (within the meaning of section 708(11) of the Corporations Act) or otherwise pursuant to one or more exemptions contained in section 708 of the Corporations Act so that it is lawful to offer the shares without disclosure to investors under Chapter 6D of the Corporations Act.
The shares applied for by Exempt Investors in Australia must not be offered for sale in Australia in the period of 12 months after the date of allotment under the offering, except in circumstances where disclosure to investors under Chapter 6D of the Corporations Act would not be required pursuant to an exemption under section 708 of the Corporations Act or otherwise or where the offer is pursuant to a disclosure document which complies with Chapter 6D of the Corporations Act. Any person acquiring shares must observe such Australian on-sale restrictions.
This prospectus contains general information only and does not take account of the investment objectives, financial situation or particular needs of any particular person. It does not contain any securities recommendations or financial product advice. Before making an investment decision, investors need to consider whether the information in this prospectus is appropriate to their needs, objectives and circumstances, and, if necessary, seek expert advice on those matters.
197
Table of Contents
The validity of the shares of Class A common stock will be passed upon for us by Simpson Thacher & Bartlett LLP, New York, New York. Certain legal matters in connection with this offering will be passed upon for the underwriters by Davis Polk & Wardwell LLP, New York, New York. An investment vehicle comprised of selected partners of Simpson Thacher & Bartlett LLP, members of their families, related persons and others owns an interest representing less than 1% of the capital commitments of funds affiliated with The Blackstone Group L.P.
The balance sheet of Summit Materials, Inc. as of September 26, 2014 has been included herein in reliance on the report of KPMG LLP, independent registered public accounting firm, appearing elsewhere herein, and upon the authority of said firm as experts in accounting and auditing.
The consolidated financial statements of Summit Materials Holdings L.P. as of December 28, 2013 and December 29, 2012, and for the years ended December 28, 2013 and December 29, 2012 have been included herein in reliance on the report of KPMG LLP, independent registered public accounting firm, appearing elsewhere herein, and upon the authority of said firm as experts in accounting and auditing.
The consolidated statements of operations, comprehensive (loss) income, changes in redeemable noncontrolling interest and partners’ interest, and cash flows of Summit Materials Holdings L.P. and subsidiaries for the year ended December 31, 2011 included in this prospectus have been audited by Deloitte & Touche LLP, an independent registered public accounting firm, as stated in their report appearing herein. Such consolidated financial statements have been included in reliance upon the report of such firm given upon their authority as experts in accounting and auditing.
CHANGE IN INDEPENDENT REGISTERED PUBLIC ACCOUNTING FIRM
On June 15, 2012, the board of directors of the then general partner of Summit Materials Holdings L.P., dismissed Deloitte & Touche LLP (“Deloitte”) as the independent registered public accounting firm of Summit Materials, LLC and Subsidiaries and on August 7, 2012, engaged KPMG LLP (“KPMG”). Deloitte’s reports on the financial statements of Summit Materials, LLC and Subsidiaries for the periods specified in such reports did not contain an adverse opinion or disclaimer of opinion and were not qualified or modified as to uncertainty, audit scope or accounting principles. There were (i) no disagreements with Deloitte on any matter of accounting principles or practices, financial statement disclosure, or auditing scope or procedures, which disagreements, if not resolved to the satisfaction of Deloitte, would have caused Deloitte to make reference to the subject matter of the disagreements in connection with its reports and (ii) no reportable events of the type listed in paragraphs (A) through (D) of Item 304(a)(1)(v) of Regulation S-K issued by the SEC, in connection with the audit of the financial statements of Summit Materials, LLC and Subsidiaries for the 2011 period audited by Deloitte through the replacement of Deloitte with KPMG.
Neither we nor anyone acting on our behalf consulted with KPMG at any time prior to their retention by us with respect to (i) the application of accounting principles to a specified transaction, either completed or proposed, or the type of audit opinion that might be rendered on the Summit Materials, LLC and Subsidiaries financial statements, and neither a written report was provided to us nor oral advice was provided that KPMG concluded was an important factor considered by us in reaching a decision as to the accounting, auditing or financial reporting issue or (ii) any matter that was the subject of a disagreement or reportable events set forth in Item 304(a)(1)(iv) and (v), respectively, of Regulation S-K.
198
Table of Contents
WHERE YOU CAN FIND MORE INFORMATION
We have filed with the SEC a registration statement on Form S-1 under the Securities Act with respect to the shares of Class A common stock offered by this prospectus. This prospectus, filed as part of the registration statement, does not contain all of the information set forth in the registration statement and its exhibits and schedules, portions of which have been omitted as permitted by the rules and regulations of the SEC. For further information about us and shares of our Class A common stock, we refer you to the registration statement and to its exhibits and schedules. Statements in this prospectus about the contents of any contract, agreement or other document are not necessarily complete and in each instance we refer you to the copy of such contract, agreement or document filed as an exhibit to the registration statement. Anyone may inspect the registration statement and its exhibits and schedules without charge at the public reference facilities the SEC maintains at 100 F Street, N.E., Washington, D.C. 20549. You may obtain copies of all or any part of these materials from the SEC upon the payment of certain fees prescribed by the SEC. You may obtain further information about the operation of the SEC’s Public Reference Room by calling the SEC at 1-800-SEC-0330. You may also inspect these reports and other information without charge at a website maintained by the SEC. The address of this site is http://www.sec.gov.
Upon completion of this offering, we will become subject to the informational requirements of the Exchange Act, and will be required to file reports and other information with the SEC. You will be able to inspect and copy these reports and other information at the public reference facilities maintained by the SEC at the address noted above. You also will be able to obtain copies of this material from the Public Reference Room of the SEC as described above, or inspect them without charge at the SEC’s website. We intend to make available to our Class A common stockholders annual reports containing consolidated financial statements audited by an independent registered public accounting firm.
199
Table of Contents
| Page | ||||
| Audited Balance Sheet of Summit Materials, Inc. |
||||
| Report of KPMG LLP, Independent Registered Public Accounting Firm |
F-2 | |||
| F-3 | ||||
| F-4 | ||||
| Audited Consolidated Financial Statements of Summit Materials Holdings L.P. and Subsidiaries |
||||
| Report of KPMG LLP, Independent Registered Public Accounting Firm |
F-5 | |||
| Report of Deloitte & Touche LLP, Independent Registered Public Accounting Firm |
F-6 | |||
| Consolidated Balance Sheets as of December 28, 2013 and December 29, 2012 |
F-7 | |||
| F-8 | ||||
| F-9 | ||||
| F-10 | ||||
| F-11 | ||||
| F-12 | ||||
| Unaudited Consolidated Financial Statements of Summit Materials Holdings L.P. and Subsidiaries |
||||
| Consolidated Balance Sheets as of September 27, 2014 (Unaudited) and December 28, 2013 |
F-40 | |||
| F-41 | ||||
| F-42 | ||||
| F-43 | ||||
| F-44 | ||||
| F-45 | ||||
F-1
Table of Contents
Report of Independent Registered Public Accounting Firm
The Board of Directors
of Summit Materials, Inc.:
We have audited the accompanying balance sheet of Summit Materials, Inc. (the Company) as of September 26, 2014. This balance sheet is the responsibility of the Company’s management. Our responsibility is to express an opinion on this balance sheet based on our audit.
We conducted our audit in accordance with the standards of the Public Company Accounting Oversight Board (United States). Those standards require that we plan and perform the audit to obtain reasonable assurance about whether the balance sheet is free of material misstatement. An audit includes examining, on a test basis, evidence supporting the amounts and disclosures in the balance sheet and notes thereto. An audit also includes assessing the accounting principles used and significant estimates made by management, as well as evaluating the overall balance sheet presentation. We believe that our audit provides a reasonable basis for our opinion.
In our opinion, the balance sheet referred to above presents fairly, in all material respects, the financial position of Summit Materials, Inc. as of September 26, 2014, in conformity with U.S. generally accepted accounting principles.
/s/ KPMG LLP
Denver, Colorado
October 8, 2014
F-2
Table of Contents
Summit Materials, Inc.
September 26, 2014
| Assets |
||||
| Total assets |
$ | — | ||
|
|
|
|||
| Stockholder’s equity |
||||
| Stockholder’s Equity |
||||
| Class A common stock, par value $0.01 per share, 1,000 shares authorized, none issued and outstanding |
— | |||
| Class B common stock, par value $0.01 per share, 1,000 shares authorized, none issued and outstanding |
— | |||
|
|
|
|||
| Total stockholder’s equity |
$ | — | ||
|
|
|
|||
See notes to the balance sheet.
F-3
Table of Contents
Summit Materials, Inc.
(1) ORGANIZATION
Summit Materials, Inc. (the “Company”) was formed as a Delaware corporation on September 23, 2014. The Company’s fiscal year is based on a 52-53 week year with each quarter composed of 13 weeks ending on a Saturday. The 53-week year occurs approximately once every seven years. The additional week in the 53-week year will be included in the fourth quarter. The Company’s 2014 fiscal year end is on December 27, 2014.
The Company was formed for the purpose of completing certain reorganization and spin-off transactions in order to be the parent of and carry on the business of Summit Materials Holdings L.P. and the related subsidiaries held by Summit Materials Holdings L.P. In connection with the completion of an offering of equity securities by the Company, the Company will contribute cash to Summit Materials Holdings L.P. in exchange for a minority interest.
(2) SUMMARY OF SIGNIFICANT ACCOUNTING POLICIES
Basis of Accounting—The balance sheet has been prepared in accordance with U.S. generally accepted accounting principles. Separate statements of operations, comprehensive income, cash flows and stockholder’s equity have not been presented as there have been no activities during the period from September 23, 2014 (date of inception) and September 26, 2014.
Use of Estimates—The preparation of financial statements in conformity with U.S. generally accepted accounting principles requires management to make estimates and assumptions that affect the reported amounts of assets and liabilities and disclosure of contingent assets and liabilities at the date of the balance sheet. Actual results could differ from those estimates.
(3) STOCKHOLDER’S EQUITY
On September 23, 2014, the Company was authorized to issue 1,000 shares of $0.01 par value Class A common stock and 1,000 shares of $0.01 par value Class B common stock. The authorized shares have not been issued. The Company’s board of directors is expressly authorized to provide for the issuance of all or any of the shares of the two classes of common stock.
(4) SUBSEQUENT EVENTS
We have evaluated subsequent events through October 8, 2014, the date the financial statements were available to be issued.
F-4
Table of Contents
Report of Independent Registered Public Accounting Firm
The Board of Directors and Partners
of Summit Materials Holdings L.P.:
We have audited the accompanying consolidated balance sheets of Summit Materials Holdings L.P. and subsidiaries as of December 28, 2013 and December 29, 2012, and the related consolidated statements of operations, comprehensive (loss) income, cash flows, and changes in redeemable noncontrolling interest and partners’ interest for the years ended December 28, 2013 and December 29, 2012. These consolidated financial statements are the responsibility of the Company’s management. Our responsibility is to express an opinion on these consolidated financial statements based on our audits.
We conducted our audits in accordance with the standards of the Public Company Accounting Oversight Board (United States). Those standards require that we plan and perform the audit to obtain reasonable assurance about whether the financial statements are free of material misstatement. An audit includes examining, on a test basis, evidence supporting the amounts and disclosures in the financial statements. An audit also includes assessing the accounting principles used and significant estimates made by management, as well as evaluating the overall financial statement presentation. We believe that our audits provide a reasonable basis for our opinion.
In our opinion, the consolidated financial statements referred to above present fairly, in all material respects, the financial position of Summit Materials Holdings L.P. and subsidiaries as of December 28, 2013 and December 29, 2012, and the results of their operations and their cash flows for each of the years in the two-year period ended December 28, 2013, in conformity with U.S. generally accepted accounting principles.
/s/ KPMG LLP
McLean, Virginia
October 8, 2014
F-5
Table of Contents
REPORT OF INDEPENDENT REGISTERED PUBLIC ACCOUNTING FIRM
The Board of Directors and Partners
of Summit Materials Holdings L.P.
We have audited the accompanying consolidated statements of operations, comprehensive (loss) income, changes in redeemable noncontrolling interest and partners’ interest, and cash flows of Summit Materials Holdings L.P. and Subsidiaries (the “Company”) for the year ended December 31, 2011. These financial statements are the responsibility of the Company’s management. Our responsibility is to express an opinion on these financial statements based on our audit.
We conducted our audit in accordance with the standards of the Public Company Accounting Oversight Board (United States). Those standards require that we plan and perform the audit to obtain reasonable assurance about whether the financial statements are free of material misstatement. The Company is not required to have, nor were we engaged to perform, an audit of its internal control over financial reporting. Our audit included consideration of internal control over financial reporting as a basis for designing audit procedures that are appropriate in the circumstances, but not for the purpose of expressing an opinion on the effectiveness of the Company’s internal control over financial reporting. Accordingly, we express no such opinion. An audit also includes examining, on a test basis, evidence supporting the amounts and disclosures in the financial statements, assessing the accounting principles used and significant estimates made by management, as well as evaluating the overall financial statement presentation. We believe that our audit provides a reasonable basis for our opinion.
In our opinion, such consolidated financial statements present fairly, in all material respects, the changes in redeemable noncontrolling interest and partners’ interest of Summit Materials Holdings L.P. and Subsidiaries’ and the results of their operations and cash flows for the year ended December 31, 2011 in conformity with accounting principles generally accepted in the United States of America.
/s/ DELOITTE & TOUCHE LLP
McLean, Virginia
October 8, 2014
F-6
Table of Contents
SUMMIT MATERIALS HOLDINGS L.P. AND SUBSIDIARIES
Consolidated Balance Sheets
December 28, 2013 and December 29, 2012
(In thousands, except partners’ interest amounts)
| December 28, 2013 |
December 29, 2012 |
|||||||
| Assets |
||||||||
| Current assets: |
||||||||
| Cash |
$ | 18,183 | $ | 30,697 | ||||
| Accounts receivable, net |
99,337 | 100,298 | ||||||
| Costs and estimated earnings in excess of billings |
10,767 | 11,575 | ||||||
| Inventories |
96,432 | 92,977 | ||||||
| Other current assets |
13,181 | 10,068 | ||||||
|
|
|
|
|
|||||
| Total current assets |
237,900 | 245,615 | ||||||
| Property, plant and equipment, net |
831,778 | 813,607 | ||||||
| Goodwill |
127,038 | 179,120 | ||||||
| Intangible assets, net |
15,147 | 8,606 | ||||||
| Other assets |
39,197 | 37,531 | ||||||
|
|
|
|
|
|||||
| Total assets |
$ | 1,251,060 | $ | 1,284,479 | ||||
|
|
|
|
|
|||||
| Liabilities, Redeemable Noncontrolling Interest and Partners’ Interest |
||||||||
| Current liabilities: |
||||||||
| Current portion of debt |
$ | 30,220 | $ | 4,000 | ||||
| Current portion of acquisition-related liabilities |
10,635 | 9,525 | ||||||
| Accounts payable |
72,104 | 61,634 | ||||||
| Accrued expenses |
57,251 | 49,822 | ||||||
| Billings in excess of costs and estimated earnings |
9,263 | 6,926 | ||||||
|
|
|
|
|
|||||
| Total current liabilities |
179,473 | 131,907 | ||||||
| Long-term debt |
658,767 | 635,843 | ||||||
| Acquisition-related liabilities |
23,756 | 23,919 | ||||||
| Other noncurrent liabilities |
77,480 | 84,266 | ||||||
|
|
|
|
|
|||||
| Total liabilities |
939,476 | 875,935 | ||||||
|
|
|
|
|
|||||
| Commitments and contingencies (see note 13) |
||||||||
| Redeemable noncontrolling interest |
24,767 | 22,850 | ||||||
| Partners’ interest: |
||||||||
| Class A interests, 31,261 interests authorized, issued and outstanding as of December 28, 2013 and December 29, 2012 |
463,010 | 463,010 | ||||||
| Class B interests, 1,220 interests authorized, issued and outstanding as of December 28, 2013 and December 29, 2012 |
19,000 | 19,000 | ||||||
| Class C interests, 363 interests authorized, issued and outstanding as of December 28, 2013 and December 29, 2012 |
— | — | ||||||
| Class D interests, 9,889 and 8,565 interests authorized, issued and outstanding as of December 28, 2013 and December 29, 2012, respectively |
— | — | ||||||
| Additional paid-in capital |
8,152 | 5,840 | ||||||
| Accumulated deficit |
(198,511 | ) | (94,085 | ) | ||||
| Accumulated other comprehensive loss |
(6,045 | ) | (9,130 | ) | ||||
|
|
|
|
|
|||||
| Partners’ interest |
285,606 | 384,635 | ||||||
| Noncontrolling interest |
1,211 | 1,059 | ||||||
|
|
|
|
|
|||||
| Total partners’ interest |
286,817 | 385,694 | ||||||
|
|
|
|
|
|||||
| Total liabilities, redeemable noncontrolling interest and partners’ interest |
$ | 1,251,060 | $ | 1,284,479 | ||||
|
|
|
|
|
|||||
See accompanying notes to consolidated financial statements.
F-7
Table of Contents
SUMMIT MATERIALS HOLDINGS L.P. AND SUBSIDIARIES
Consolidated Statements of Operations
Years ended December 28, 2013, December 29, 2012 and December 31, 2011
(In thousands)
| 2013 | 2012 | 2011 | ||||||||||
| Revenue: |
||||||||||||
| Product |
$ | 593,570 | $ | 588,762 | $ | 427,419 | ||||||
| Service |
322,631 | 337,492 | 361,657 | |||||||||
|
|
|
|
|
|
|
|||||||
| Total revenue |
916,201 | 926,254 | 789,076 | |||||||||
|
|
|
|
|
|
|
|||||||
| Cost of revenue (excluding items shown separately below): |
||||||||||||
| Product |
430,172 | 444,569 | 317,360 | |||||||||
| Service |
246,880 | 268,777 | 280,294 | |||||||||
|
|
|
|
|
|
|
|||||||
| Total cost of revenue |
677,052 | 713,346 | 597,654 | |||||||||
|
|
|
|
|
|
|
|||||||
| General and administrative expenses |
142,000 | 127,215 | 95,826 | |||||||||
| Goodwill impairment |
68,202 | — | — | |||||||||
| Depreciation, depletion, amortization and accretion |
72,934 | 68,290 | 61,377 | |||||||||
| Transaction costs |
3,990 | 1,988 | 9,120 | |||||||||
|
|
|
|
|
|
|
|||||||
| Operating (loss) income |
(47,977 | ) | 15,415 | 25,099 | ||||||||
| Other (income), net |
(1,737 | ) | (1,182 | ) | (21,244 | ) | ||||||
| Loss on debt financings |
3,115 | 9,469 | — | |||||||||
| Interest expense |
56,443 | 58,079 | 47,784 | |||||||||
|
|
|
|
|
|
|
|||||||
| Loss from continuing operations before taxes |
(105,798 | ) | (50,951 | ) | (1,441 | ) | ||||||
| Income tax (benefit) expense |
(2,647 | ) | (3,920 | ) | 3,408 | |||||||
|
|
|
|
|
|
|
|||||||
| Loss from continuing operations |
(103,151 | ) | (47,031 | ) | (4,849 | ) | ||||||
| Loss from discontinued operations |
528 | 3,546 | 5,201 | |||||||||
|
|
|
|
|
|
|
|||||||
| Net loss |
(103,679 | ) | (50,577 | ) | (10,050 | ) | ||||||
| Net income attributable to noncontrolling interest |
3,112 | 1,919 | 695 | |||||||||
|
|
|
|
|
|
|
|||||||
| Net loss attributable to partners of Summit Materials Holdings, LP |
$ | (106,791 | ) | $ | (52,496 | ) | $ | (10,745 | ) | |||
|
|
|
|
|
|
|
|||||||
See accompanying notes to consolidated financial statements.
F-8
Table of Contents
SUMMIT MATERIALS HOLDINGS L.P. AND SUBSIDIARIES
Consolidated Statements of Comprehensive (Loss) Income
Years ended December 28, 2013, December 29, 2012 and December 31, 2011
(In thousands)
| 2013 | 2012 | 2011 | ||||||||||
| Net loss |
$ | (103,679 | ) | $ | (50,577 | ) | $ | (10,050 | ) | |||
| Other comprehensive income (loss): |
||||||||||||
| Pension and postretirement liability adjustment |
4,407 | (3,648 | ) | (5,675 | ) | |||||||
|
|
|
|
|
|
|
|||||||
| Comprehensive loss |
(99,272 | ) | (54,225 | ) | (15,725 | ) | ||||||
| Less comprehensive income (loss) attributable to the noncontrolling interest |
4,434 | 824 | (675 | ) | ||||||||
| Comprehensive loss attributable to partners of |
||||||||||||
|
|
|
|
|
|
|
|||||||
| Summit Materials Holdings L.P. |
$ | (103,706 | ) | $ | (55,049 | ) | $ | (15,050 | ) | |||
|
|
|
|
|
|
|
|||||||
See accompanying notes to consolidated financial statements.
F-9
Table of Contents
SUMMIT MATERIALS HOLDINGS L.P. AND SUBSIDIARIES
Consolidated Statements of Cash Flows
Years ended December 28, 2013, December 29, 2012 and December 31, 2011
(In thousands)
| 2013 | 2012 | 2011 | ||||||||||
| Cash flow from operating activities: |
||||||||||||
| Net loss |
$ | (103,679 | ) | $ | (50,577 | ) | $ | (10,050 | ) | |||
| Adjustments to reconcile net loss to net cash provided by operating activities: |
||||||||||||
| Depreciation, depletion, amortization and accretion |
75,927 | 72,179 | 64,983 | |||||||||
| Financing fee amortization |
3,256 | 3,266 | 2,335 | |||||||||
| Share-based compensation expense |
2,315 | 2,533 | 2,484 | |||||||||
| Deferred income tax benefit |
(4,408 | ) | (3,468 | ) | (1,974 | ) | ||||||
| Net loss on asset disposals |
12,419 | 2,564 | 2,349 | |||||||||
| Goodwill impairment |
68,202 | — | — | |||||||||
| Bargain purchase gain |
— | — | (12,133 | ) | ||||||||
| Revaluation of asset retirement obligations |
— | — | (3,420 | ) | ||||||||
| Revaluation of contingent consideration |
— | (409 | ) | (10,344 | ) | |||||||
| Loss on debt financings |
2,989 | 9,469 | — | |||||||||
| Other |
(1,098 | ) | (465 | ) | 894 | |||||||
| Decrease (increase) in operating assets, net of acquisitions: |
||||||||||||
| Account receivable |
9,884 | 5,201 | 13,901 | |||||||||
| Inventories |
499 | (1,726 | ) | (12,643 | ) | |||||||
| Costs and estimated earnings in excess of billings |
196 | 6,931 | (613 | ) | ||||||||
| Other current assets |
(453 | ) | 3,494 | (4,823 | ) | |||||||
| Other assets |
(1,708 | ) | 1,189 | (1,016 | ) | |||||||
| Increase (decrease) in operating liabilities, net of acquisitions: |
||||||||||||
| Accounts payable |
4,067 | (6,076 | ) | 6,612 | ||||||||
| Accrued expenses |
(742 | ) | 17,175 | (6,455 | ) | |||||||
| Billings in excess of costs and estimated earnings |
1,998 | 2,589 | (8,209 | ) | ||||||||
| Other liabilities |
(3,252 | ) | (1,590 | ) | 1,375 | |||||||
|
|
|
|
|
|
|
|||||||
| Net cash provided by operating activities |
66,412 | 62,279 | 23,253 | |||||||||
|
|
|
|
|
|
|
|||||||
| Cash flow from investing activities: |
||||||||||||
| Acquisitions, net of cash acquired |
(61,601 | ) | (48,757 | ) | (161,073 | ) | ||||||
| Purchases of property, plant and equipment |
(65,999 | ) | (45,488 | ) | (38,656 | ) | ||||||
| Proceeds from the sale of property, plant and equipment |
16,085 | 8,836 | 7,157 | |||||||||
| Other |
— | 69 | 241 | |||||||||
|
|
|
|
|
|
|
|||||||
| Net cash used for investing activities |
(111,515 | ) | (85,340 | ) | (192,331 | ) | ||||||
|
|
|
|
|
|
|
|||||||
| Cash flow from financing activities: |
||||||||||||
| Capital contributions by partners |
— | — | 103,630 | |||||||||
| Net proceeds from debt issuance |
230,817 | 713,361 | 96,748 | |||||||||
| Payments on long-term debt |
(188,424 | ) | (697,438 | ) | (49,000 | ) | ||||||
| Payments on acquisition-related liabilities |
(9,801 | ) | (7,519 | ) | (4,593 | ) | ||||||
| Other |
(3 | ) | (702 | ) | (10 | ) | ||||||
|
|
|
|
|
|
|
|||||||
| Net cash provided by financing activities |
32,589 | 7,702 | 146,775 | |||||||||
|
|
|
|
|
|
|
|||||||
| Net decrease in cash |
(12,514 | ) | (15,359 | ) | (22,303 | ) | ||||||
| Cash—beginning of period |
30,697 | 46,056 | 68,359 | |||||||||
|
|
|
|
|
|
|
|||||||
| Cash—end of period |
$ | 18,183 | $ | 30,697 | $ | 46,056 | ||||||
|
|
|
|
|
|
|
|||||||
See accompanying notes to consolidated financial statements.
F-10
Table of Contents
SUMMIT MATERIALS HOLDINGS L.P. AND SUBSIDIARIES
Consolidated Statements of Changes in Redeemable Noncontrolling Interest and Partners’ Interest
Years ended December 28, 2013, December 29, 2012 and December 31, 2011
(In thousands, except partners’ interest amounts)
| Partners’ Interests | Class A | Class B | Additional Paid-in Capital |
Accumulated deficit |
Accumulated other comprehensive loss |
Noncontrolling interest |
Total partners’ interest |
Redeemable noncontrolling interest |
||||||||||||||||||||||||||||||||||||||||
| Class A | Class B | Class C | Class D | |||||||||||||||||||||||||||||||||||||||||||||
| Balance—December 31, 2010 |
25,329 | 1,103 | 302 | 6,502 | $ | 361,880 | $ | 17,000 | $ | 979 | $ | (29,555 | ) | $ | (2,272 | ) | $ | 1,227 | $ | 349,259 | $ | 21,300 | ||||||||||||||||||||||||||
| Contributed capital |
5,976 | 117 | — | — | 101,630 | 2,000 | — | — | — | — | 103,630 | — | ||||||||||||||||||||||||||||||||||||
| Accretion / Redemption value adjustment |
— | — | — | — | — | — | — | (632 | ) | — | — | (632 | ) | 632 | ||||||||||||||||||||||||||||||||||
| Issuance of Class C and Class D interests |
— | — | 70 | 1,993 | — | — | — | — | — | — | — | — | ||||||||||||||||||||||||||||||||||||
| Net (loss) income |
— | — | — | — | — | — | — | (10,745 | ) | — | (43 | ) | (10,788 | ) | 738 | |||||||||||||||||||||||||||||||||
| Other comprehensive loss |
— | — | — | — | — | — | — | — | (4,305 | ) | — | (4,305 | ) | (1,370 | ) | |||||||||||||||||||||||||||||||||
| Share-based compensation |
— | — | — | — | — | — | 2,484 | — | — | — | 2,484 | — | ||||||||||||||||||||||||||||||||||||
| Payment of dividends |
— | — | — | — | — | — | — | — | — | (10 | ) | (10 | ) | — | ||||||||||||||||||||||||||||||||||
|
|
|
|
|
|
|
|
|
|
|
|
|
|
|
|
|
|
|
|
|
|
|
|
|
|||||||||||||||||||||||||
| Balance—December 31, 2011 |
31,305 | 1,220 | 372 | 8,495 | 463,510 | 19,000 | 3,463 | (40,932 | ) | (6,577 | ) | 1,174 | 439,638 | 21,300 | ||||||||||||||||||||||||||||||||||
| Accretion / Redemption value adjustment |
— | — | — | — | — | — | — | (657 | ) | — | — | (657 | ) | 657 | ||||||||||||||||||||||||||||||||||
| Issuance (redemption) of Class C and Class D interests |
— | — | (9 | ) | 70 | — | — | — | — | — | — | — | — | |||||||||||||||||||||||||||||||||||
| Net (loss) income |
— | — | — | — | — | — | — | (52,496 | ) | — | (69 | ) | (52,565 | ) | 1,988 | |||||||||||||||||||||||||||||||||
| Other comprehensive loss |
— | — | — | — | — | — | — | — | (2,553 | ) | — | (2,553 | ) | (1,095 | ) | |||||||||||||||||||||||||||||||||
| Repurchase of partners’ interest |
(44 | ) | — | — | — | (500 | ) | — | (156 | ) | — | — | — | (656 | ) | — | ||||||||||||||||||||||||||||||||
| Share-based compensation |
— | — | — | — | — | — | 2,533 | — | — | — | 2,533 | — | ||||||||||||||||||||||||||||||||||||
| Payment of dividends |
— | — | — | — | — | — | — | — | — | (46 | ) | (46 | ) | — | ||||||||||||||||||||||||||||||||||
|
|
|
|
|
|
|
|
|
|
|
|
|
|
|
|
|
|
|
|
|
|
|
|
|
|||||||||||||||||||||||||
| Balance—December 29, 2012 |
31,261 | 1,220 | 363 | 8,565 | 463,010 | 19,000 | 5,840 | (94,085 | ) | (9,130 | ) | 1,059 | 385,694 | 22,850 | ||||||||||||||||||||||||||||||||||
| Accretion / Redemption value adjustment |
— | — | — | — | — | — | — | 2,365 | — | — | 2,365 | (2,365 | ) | |||||||||||||||||||||||||||||||||||
| Issuance of Class C and Class D interests |
— | — | — | 1,324 | — | — | — | — | — | — | — | — | ||||||||||||||||||||||||||||||||||||
| Net (loss) income |
— | — | — | — | — | — | — | (106,791 | ) | — | 152 | (106,639 | ) | 2,960 | ||||||||||||||||||||||||||||||||||
| Other comprehensive gain |
— | — | — | — | — | — | — | — | 3,085 | — | 3,085 | 1,322 | ||||||||||||||||||||||||||||||||||||
| Repurchase of partners’ interest |
— | — | — | — | — | — | (3 | ) | — | — | — | (3 | ) | — | ||||||||||||||||||||||||||||||||||
| Share-based compensation |
— | — | — | — | — | — | 2,315 | — | — | — | 2,315 | — | ||||||||||||||||||||||||||||||||||||
|
|
|
|
|
|
|
|
|
|
|
|
|
|
|
|
|
|
|
|
|
|
|
|
|
|||||||||||||||||||||||||
| Balance—December 28, 2013 |
31,261 | 1,220 | 363 | 9,889 | $ | 463,010 | $ | 19,000 | $ | 8,152 | $ | (198,511 | ) | $ | (6,045 | ) | $ | 1,211 | $ | 286,817 | $ | 24,767 | ||||||||||||||||||||||||||
|
|
|
|
|
|
|
|
|
|
|
|
|
|
|
|
|
|
|
|
|
|
|
|
|
|||||||||||||||||||||||||
See accompanying notes to consolidated financial statements.
F-11
Table of Contents
NOTES TO CONSOLIDATED FINANCIAL STATEMENTS
(In thousands, except partners’ interest amounts)
(1) Summary of Organization and Significant Accounting Policies
Summit Materials Holdings L.P. (“Summit Materials” or the “Company”) is a vertically-integrated, heavy-side construction materials company. Across its subsidiaries, it is engaged in the manufacturing and sale of aggregates, cement, ready-mixed concrete and asphalt paving mix. It is also engaged in road paving and related construction services. Summit Materials owns and operates quarries, sand and gravel pits, a cement plant, cement distribution terminals, asphalt plants, ready–mixed concrete plants and landfill sites. The operations of Summit Materials are conducted primarily across 14 states, with the most significant portion of the Company’s revenue generated in Texas, Kansas, Kentucky, Missouri and Utah.
Summit Materials’ majority owners are certain investment funds affiliated with Blackstone Capital Partners V L.P. (“BCP”). Summit Materials has a number of subsidiaries that have individually made a number of acquisitions through 2013. The Company is organized by geographic region and has three operating segments, which are also its reporting segments: the Central; West; and East regions.
Noncontrolling interests represent a 30% redeemable ownership in Continental Cement Company, L.L.C. (“Continental Cement”) and a 20% ownership in Ohio Valley Asphalt, LLC. In 2013, Continental Cement changed its fiscal year from a calendar year to a 52-53 week year with each quarter composed of 13 weeks ending on a Saturday, consistent with Summit Materials’ fiscal year. The 53-week year occurs approximately once every seven years. The additional week in the 53-week year will be included in the fourth quarter. Continental Cement’s fiscal year end in 2013 was December 28 compared to the calendar year ended December 31 in 2012 and 2011. The effect of this change to Summit Materials’ financial position, results of operations and liquidity was immaterial.
Principles of Consolidation—The consolidated financial statements include the accounts of the Company and its majority owned subsidiaries. All intercompany balances and transactions have been eliminated. The Company attributes consolidated partners’ interests and net income separately to the controlling and noncontrolling interests. The Company accounts for investments in entities for which it has an ownership of 20% to 50% using the equity method of accounting.
Use of Estimates—The consolidated financial statements of the Company have been prepared in conformity with U.S. generally accepted accounting principles, which require management to make estimates and assumptions that affect the reported amounts and disclosures in the consolidated financial statements. These estimates and the underlying assumptions affect the amounts of assets and liabilities reported, disclosures about contingent assets and liabilities and reported amounts of revenue and expenses. Such estimates include the valuation of accounts receivable, inventories, goodwill, intangible and other long-lived assets, pension and other postretirement obligations, asset retirement obligations and the redeemable noncontrolling interest. Estimates also include revenue earned and costs to complete open contracts. Management evaluates its estimates and assumptions on an ongoing basis using historical experience and other factors, including the current economic environment. Management adjusts such estimates and assumptions when circumstances dictate. As future events and their effects cannot be determined with precision, actual results could differ significantly from estimates made. Changes in estimates, including those resulting from continuing changes in the economic environment, will be reflected in the Company’s consolidated financial statements in the period in which the change in estimate occurs.
Business and Credit Concentrations—The majority of Summit Materials’ customers are located in Texas, Kansas, Kentucky, Missouri and Utah. Summit Materials’ accounts receivable consist primarily of amounts due from customers within these areas. Collection of these accounts is, therefore, dependent on the economic conditions in the aforementioned states. However, credit granted within Summit Materials’ trade areas has been granted to a wide variety of customers. No single customer accounted for more than 10% of revenue in 2013,
F-12
Table of Contents
2012 or 2011. Management does not believe that any significant concentrations of credit exist with respect to individual customers or groups of customers.
Accounts Receivable—Accounts receivable are stated at the amount management expects to collect from outstanding balances. Management provides for probable uncollectible amounts through a charge to earnings and a credit to a valuation allowance based on its assessment of the collectability of individual accounts. In establishing the allowance, management considers historical losses adjusted to take into account current market conditions and its customers’ financial condition, the amount of receivables in dispute, the current receivables aging and current payment terms. Balances that remain outstanding after reasonable collection efforts are exercised are written off through a charge to the valuation allowance.
The balances billed but not paid by customers, pursuant to retainage provisions included in contracts, will be due upon completion of the contracts.
Revenue and Cost Recognition—Revenue for product sales are recognized when evidence of an arrangement exists, the fee is fixed or determinable, title passes, which is generally when the product is shipped, and collection is reasonably assured. Product revenue includes sales of aggregates, cement and other materials to customers, net of discounts, allowances or taxes, as applicable. Internal product sales are eliminated from service revenue in the consolidated statements of operations.
Revenue from construction contracts are included in service revenue and are recognized under the percentage-of-completion accounting method. The percent complete is measured by the cost incurred to date compared to the estimated total cost of each project. This method is used as management considers expended cost to be the best available measure of progress on these contracts, the majority of which are completed within one year, but may occasionally extend beyond one year. Inherent uncertainties in estimating costs make it at least reasonably possible that the estimates used will change within the near term and over the life of the contracts.
Contract costs include all direct material and labor costs and those indirect costs related to contract performance and completion. Provisions for estimated losses on uncompleted contracts are made in the period in which such losses are estimable. General and administrative costs are charged to expense as incurred.
Changes in job performance, job conditions and estimated profitability, including those arising from contract penalty provisions and final contract settlements, may result in revisions to costs and income. Such revisions are recognized in the period in which they are determined. An amount equal to contract costs incurred that are attributable to claims is included in revenue when realization is probable and the amount can be reliably estimated.
Costs and estimated earnings in excess of billings are composed principally of revenue recognized on contracts (on the percentage-of-completion method) for which billings had not been presented to customers because the amount were not billable under the contract terms at the balance sheet date. In accordance with the contract terms, the unbilled receivables at December 28, 2013 will be billed in 2014. Billings in excess of costs and estimated earnings represent billings in excess of revenue recognized.
Revenue from the receipt of waste fuels is classified as service revenue and is based on fees charged for the waste disposal, which are recognized when the waste is accepted.
Inventories—Inventories consist of stone removed from quarries and processed for future sale, cement, raw materials and finished concrete blocks. Inventories are valued at the lower of cost or market and are accounted for on a first-in first-out basis or an average cost basis. If items become obsolete or otherwise unusable or if quantities exceed what is projected to be sold within a reasonable period of time, they will be charged to costs of production in the period that the items are designated as obsolete or excess inventory. Stripping costs are costs of removing overburden and waste material to access aggregate materials and are recognized in cost of revenue in the same period as the revenue from the sale of the inventory.
F-13
Table of Contents
Property, Plant and Equipment, net—Property, plant and equipment are recorded at cost, less accumulated depreciation, depletion and amortization. Expenditures for additions and improvements that significantly add to the productive capacity or extend the useful life of an asset are capitalized. Repair and maintenance costs that do not substantially add to the productive capacity or extend the useful life of the asset are expensed as incurred.
Landfill airspace is included in property, plant and equipment at cost and is amortized based on utilization of the asset. Management reassesses the landfill airspace capacity with any changes in value recorded in cost of revenue. Capitalized landfill costs include expenditures for the acquisition of land and related airspace, engineering and permitting costs, cell construction costs and direct site improvement costs.
Upon disposal, the cost and related accumulated depreciation are removed from the Company’s accounts and any gain or loss is included in general and administrative expenses.
Depreciation on property, plant and equipment, including assets subject to capital leases, is computed on a straight-line basis or based on the economic usage over the estimated useful life of the asset. The estimated useful lives are generally as follows:
| Buildings and improvements |
7—40 years | |
| Plant, machinery and equipment |
20—40 years | |
| Mobile equipment and barges |
15—20 years | |
| Office equipment |
3—6 years | |
| Truck and auto fleet |
5—10 years | |
| Landfill airspace and improvements |
5—60 years | |
| Other |
2—10 years |
Depletion of mineral reserves is calculated for proven and probable reserves by the units of production method on a site-by-site basis. Leasehold improvements are amortized on a straight-line basis over the lesser of the asset’s useful life or the remaining lease term.
The Company reviews the carrying value of property, plant and equipment for impairment whenever events or circumstances indicate that the carrying value of an asset may not be recoverable from the estimated future cash flows expected to result from its use and eventual disposition. Such indicators may include, among others, deterioration in general economic conditions, adverse changes in the markets in which an entity operates, increases in input costs that have a negative effect on earnings and cash flows or a trend of negative or declining cash flows over multiple periods.
Property, plant and equipment is tested for impairment at the lowest level for which identifiable cash flows are largely independent of the cash flows of other assets. As a result, the property, plant and equipment impairment test is at a significantly lower level than the level at which goodwill is tested for impairment. In markets where the Company does not produce downstream products (e.g., ready-mixed concrete, asphalt paving mix and paving and related services), the lowest level of largely independent identifiable cash flows is at the individual aggregates operation or a group of aggregates operations collectively serving a local market or the cement operations, as a whole. Conversely, in vertically-integrated markets, the cash flows of the downstream and upstream businesses are not largely independently identifiable and the vertically-integrated operations are considered the lowest level of largely independent identifiable cash flows.
In addition, assets are assessed for impairment charges when identified for disposition. Projected losses from disposition are recognized in the period in which they become estimable, which may be in advance of the actual disposition. The net loss from asset dispositions recognized in general and administrative expenses in fiscal years 2013, 2012 and 2011 was $12.4 million, $2.6 million and $2.3 million, respectively. No material impairment charges have been recognized on assets held for use in 2013, 2012 or 2011. The losses are commonly a result of the cash flows expected from selling the asset being less than the expected cash flows that could be generated from holding the asset for use.
F-14
Table of Contents
Accrued Mining and Landfill Reclamation—The mining reclamation reserve and financial commitments for landfill closure and post-closure activities are based on management’s estimate of future cost requirements to reclaim property at both currently operating and closed sites. Estimates of these obligations have been developed based on management’s interpretation of current requirements and proposed regulatory changes and are intended to approximate fair value. Costs are estimated in current dollars, inflated until the expected time of payment, using an inflation rate of 2.5%, and then discounted back to present value using a credit-adjusted, risk-free rate on obligations of similar maturity, adjusted to reflect the Company’s credit rating. Changes in the credit-adjusted, risk-free rate do not change recorded liabilities. However, subsequent increases in the recognized obligations are measured using a current credit-adjusted, risk-free rate. Decreases in the recognized obligations are measured at the initial credit-adjusted, risk-free rate.
Significant changes in inflation rates or the amount or timing of future cost estimates typically result in both (1) a current adjustment to the recorded liability (and corresponding adjustment to the asset) and (2) a change in accretion of the liability and depreciation of the asset to be recorded prospectively over the remaining capacity of the unmined quarry or landfill.
Intangible Assets—The Company’s intangible assets are primarily composed of lease agreements, reserve rights and trade names. The assets related to lease agreements are a result of the submarket royalty rates paid under agreements, primarily, for extracting aggregate. The values were determined as of the respective acquisition dates by a comparison of market-royalty rates to contract-royalty rates. The reserve rights relate to aggregate reserves to which the Company has the rights of ownership, but do not own the reserves. The intangible assets are amortized on a straight-line basis over the lives of the leases. Continental Cement’s trade name composes the majority of the remaining intangible assets. The following table shows intangible assets by type and in total:
| December 28, 2013 | December 29, 2012 | |||||||||||||||||||||||
| Gross Carrying Amount |
Accumulated Amortization |
Net Carrying Amount |
Gross Carrying Amount |
Accumulated Amortization |
Net Carrying Amount |
|||||||||||||||||||
| Leases |
$ | 10,430 | $ | (1,604 | ) | $ | 8,826 | $ | 8,940 | $ | (1,092 | ) | $ | 7,848 | ||||||||||
| Reserve rights |
5,890 | (221 | ) | 5,669 | — | — | — | |||||||||||||||||
| Trade names |
1,020 | (368 | ) | 652 | 1,020 | (262 | ) | 758 | ||||||||||||||||
|
|
|
|
|
|
|
|
|
|
|
|
|
|||||||||||||
| Total intangible assets |
$ | 17,340 | $ | (2,193 | ) | $ | 15,147 | $ | 9,960 | $ | (1,354 | ) | $ | 8,606 | ||||||||||
|
|
|
|
|
|
|
|
|
|
|
|
|
|||||||||||||
Amortization expense in 2013, 2012 and 2011 was $0.8 million, $0.6 million and $0.5 million, respectively. The estimated amortization expense for intangible assets for each of the next five years and thereafter is as follows:
| 2014 |
$ | 897 | ||
| 2015 |
897 | |||
| 2016 |
897 | |||
| 2017 |
893 | |||
| 2018 |
893 | |||
| Thereafter |
10,670 | |||
|
|
|
|||
| Total |
$ | 15,147 | ||
|
|
|
Goodwill—Goodwill represents the purchase price paid in excess of the fair value of net tangible and intangible assets acquired. Goodwill recorded in connection with the Company’s acquisitions is primarily attributable to the expected profitability, assembled workforces of the acquired businesses and the synergies expected to arise after the Company’s acquisition of those businesses. Goodwill is not amortized, but is tested annually for impairment as of the first day of the fourth quarter and whenever events or circumstances indicate that goodwill may be impaired. The test for goodwill impairment is a two-step process to first identify potential goodwill impairment for each reporting unit and then, if necessary, measure the amount of the impairment loss. Goodwill is tested for
F-15
Table of Contents
impairment based on the Company’s operating companies, which management has determined to be the Company’s reporting units, which are one level below its segments in the Central and West regions. The East region is considered to be a single reporting unit.
Income Taxes—As a limited partnership, Summit Materials’ federal and state income tax attributes are generally passed to its partners. However, certain of the Company’s subsidiaries are taxable entities, the provisions for which are included in the consolidated financial statements. For the Company’s taxable entities, deferred income tax assets and liabilities are computed for differences between the tax basis and financial statement amounts that will result in taxable or deductible amounts in the future based on enacted tax laws and rates applicable to the periods in which the differences are expected to affect taxable income. A valuation allowance is recognized for deferred tax assets if it is more likely than not that some portion or all of the net deferred tax assets will not be realized.
The Company evaluates the tax positions taken on income tax returns that remain open to examination by the respective tax authorities from prior years and positions expected to be taken on the current year tax returns to identify uncertain tax positions. Interest and penalties are recorded in income tax expense.
Fair Value Measurements—The fair value accounting guidance establishes the following fair value hierarchy that prioritizes the inputs used to measure fair value:
| Level 1 | — | Unadjusted quoted prices for identical assets or liabilities in active markets. | ||
| Level 2 | — | Inputs other than Level 1 that are based on observable market data, either directly or indirectly. These include quoted prices for similar assets or liabilities in active markets, quoted prices for identical assets or liabilities in inactive markets, inputs that are observable that are not prices and inputs that are derived from or corroborated by observable markets. | ||
| Level 3 | — | Valuations developed from unobservable data, reflecting the Company’s own assumptions, which market participants would use in pricing the asset or liability. | ||
Assets and liabilities measured at fair value in the consolidated balance sheets as of year-end 2013 and 2012 are as follows:
| 2013 | 2012 | |||||||
| Accrued expenses: |
||||||||
| Current portion of contingent consideration |
$ | — | $ | 746 | ||||
| Acquisition- related liabilities |
||||||||
| Contingent consideration |
$ | 1,908 | $ | 1,908 | ||||
Certain acquisitions made by the Company require the payment of additional consideration contingent upon the achievement of specified operating results, referred to as contingent consideration or earn-out obligations. These payments will not be made if earn-out thresholds are not achieved. No material earn-out payments have been made to date.
Summit Materials records contingent consideration at fair value on the acquisition date and then measures its fair value each reporting period. Any adjustments to fair value are recognized in earnings in the period identified. Management of the Company determines the appropriate policies and procedures to be used when determining the fair value of contingent consideration. Its fair values are based on unobservable inputs, or Level 3 assumptions, including projected probability-weighted cash payments and an 8.4% discount rate, which reflects the Company’s credit risk. Changes in fair value may occur as a result of a change in actual or projected cash payments, the probability weightings applied by the Company to projected payments or a change in the discount rate. Significant increases or decreases in any of these inputs in isolation could result in a significantly lower, or higher, fair value measurement. In 2012 and 2011, we recognized reductions to contingent consideration of
F-16
Table of Contents
$0.4 million and $10.3 million, respectively. Approximately $5.0 million and $5.3 million of the $10.3 million reduction in contingent consideration was recognized in the West and East regions, respectively, and was due primarily to revised estimates of the probability of achieving specified targets as a result of profit margins on certain legacy paving and related services contracts being less than projected on the respective acquisition date. The acquisitions to which the contingent consideration related were Kilgore Pavement Maintenance, LLC and Kilgore Properties, LLC and R.K. Hall Construction, Ltd. RHMB Capital, L.L.C., Hall Materials, Ltd., B&H Contracting, L.P., RKH Capital, L.L.C. and Hinkle Contracting Company, LLC.
Financial Instruments—The Company’s financial instruments include certain acquisition-related liabilities (deferred consideration and noncompete obligations) and debt. The fair value of the deferred consideration and noncompete obligations approximate their carrying value of $28.3 million and $4.2 million, respectively, as of December 28, 2013 and $23.4 million and $7.4 million, respectively, as of December 29, 2012. The fair value was determined based on Level 3 inputs of the fair value hierarchy, including the cash payment terms in the purchase agreements and a discount rate reflecting the Company’s credit risk.
The fair value of long-term debt was approximately $696.5 million and $670.7 million as of December 28, 2013 and December 29, 2012, respectively, compared to its carrying value of $663.0 million and $639.8 million, respectively. Fair value was determined based on Level 2 inputs of the fair value hierarchy, including observable inputs, specifically quoted prices for these instruments in inactive markets. The fair value of Company’s revolving credit facility approximated its carrying value of $26.0 million at December 28, 2013.
(2) Acquisitions
The Company has acquired a number of entities since its formation in 2009, which were financed through a combination of debt and contributions from investors. The operations of each acquisition have been included in the Company’s consolidated results of operations since the respective dates of the acquisitions. The Company measures all assets acquired and liabilities assumed at their acquisition-date fair value.
2013 Acquisitions
West region
| • | On April 1, 2013, the Company acquired all of the membership interests of Westroc, LLC, an aggregates and ready-mixed concrete provider near Salt Lake City, Utah, with borrowings under the Company’s senior secured revolving credit facility. |
Central region
| • | On April 1, 2013, the Company acquired certain aggregates, ready-mixed concrete and asphalt assets of Lafarge North America, Inc. in and around Wichita, Kansas, with borrowings under the Company’s senior secured revolving credit facility. |
2012 Acquisitions
West region
| • | On November 30, 2012, the Company acquired all of the stock of Sandco, Inc., an aggregates and ready-mixed concrete business in Colorado, with cash on-hand. |
Central region
| • | On February 29, 2012, the Company acquired certain assets of Norris Quarries, LLC, an aggregates business in northwest Missouri, with proceeds from debt, including the Company’s senior secured revolving credit facility. |
F-17
Table of Contents
East region
| • | On October 5, 2012, the Company acquired certain assets of Kay & Kay Contracting, LLC, an aggregates, asphalt and paving business in Kentucky, with cash on-hand. |
2011 Acquisitions
West region
| • | On January 14, 2011, the Company acquired all of the stock of Triple C Concrete, Inc. in Idaho, financed with cash raised from the December 2010 refinancing. |
| • | On March 31, 2011, the Company acquired Elam Construction, Inc. in Colorado, financed with cash from the December 2010 refinancing. |
| • | On June 6, 2011, the Company acquired B & B Resources, Inc. using cash funded through a combination of debt and funds provided by the Company’s partners. |
| • | On June 10, 2011, the Company acquired the stock of Grand Junction Pipe, Inc. using funds provided by the Company’s partners. |
| • | On August 2, 2011, the Company, acquired the stock of Asphalt Paving Company of Austin, L.L.C. and certain of its Affiliates (“Asphalt Paving”) in Texas with funds provided by the Company’s partners. |
| • | On October 28, 2011, the Company acquired the stock of JD Ramming, Inc., RTI Hot Mix, Inc., RTI Equipment, Inc. and Ramming Transportation, Inc. in Texas funded through a combination of debt, cash on hand and funds provided by the Company’s partners. |
Central region
| • | On May 27, 2011, the Company acquired the membership interests of Fischer Quarries, L.L.C. using funds provided by the Company’s partners. |
East region
| • | On May 27, 2011, the Company acquired the remaining 50% interest in a joint venture it had with Bourbon Limestone, Company using funds provided by the Company’s partners. |
Pro Forma Financial Information—The following unaudited supplemental pro forma information presents the financial results as if the 2012 acquisitions occurred on January 1, 2011. This supplemental pro forma information has been prepared for comparative purposes and does not purport to be indicative of what would have occurred had the acquisitions been made on January 1, 2011, nor is it indicative of any future results. The 2013 acquisitions were not material individually or in the aggregate.
| Year ended | ||||||||
| December 28, 2013 | December 29, 2012 | |||||||
| Revenue |
$ | 916,201 | $ | 976,797 | ||||
| Net loss |
(103,679 | ) | (45,976 | ) | ||||
F-18
Table of Contents
The purchase price allocation for all acquisitions has been finalized. The following table summarizes aggregated information regarding the fair values of the assets acquired and liabilities assumed as of the respective acquisition dates in 2013, 2012 and 2011:
| 2013 | 2012 | 2011 | ||||||||||
| Financial assets |
$ | 8,302 | $ | 1,397 | $ | 50,036 | ||||||
| Inventories |
3,954 | 6,988 | 22,329 | |||||||||
| Property, plant and equipment |
40,580 | 21,543 | 125,187 | |||||||||
| Other assets |
52 | 1,330 | 4,811 | |||||||||
| Intangible assets(1) |
7,428 | 3,172 | 2,708 | |||||||||
| Financial liabilities |
(6,164 | ) | (944 | ) | (27,304 | ) | ||||||
| Other long-term liabilities |
(1,050 | ) | (364 | ) | (17,503 | ) | ||||||
|
|
|
|
|
|
|
|||||||
| Net assets acquired |
53,102 | 33,122 | 160,264 | |||||||||
| Goodwill |
16,120 | 26,230 | 36,189 | |||||||||
|
|
|
|
|
|
|
|||||||
| Total purchase price |
69,222 | 59,352 | 196,453 | |||||||||
|
|
|
|
|
|
|
|||||||
| Noncash transactions: |
||||||||||||
| Acquisition related liabilities |
(7,902 | ) | (10,547 | ) | (7,603 | ) | ||||||
| Other |
281 | (48 | ) | (20,212 | ) | |||||||
|
|
|
|
|
|
|
|||||||
| Total noncash transactions |
(7,621 | ) | (10,595 | ) | (27,815 | ) | ||||||
|
|
|
|
|
|
|
|||||||
| Net cash paid for acquisitions |
$ | 61,601 | $ | 48,757 | $ | 168,638 | ||||||
|
|
|
|
|
|
|
|||||||
| (1) | Intangible assets acquired in 2013 related to aggregate reserves to which the Company has the rights of ownership, but does not own the reserves ($5.9 million) and the differential between contractual lease rates and market rates for leases of aggregate reserves and office space. The acquired intangible assets in total, the reserve rights and the lease assets have weighted-average lives of 18 years, 20 years and 11 years, respectively. |
(3) Goodwill
As of December 28, 2013, the Company had eight reporting units with goodwill for which the annual goodwill impairment test was completed. The first step of the goodwill impairment test employed by the Company compares the fair value of the reporting units to their carrying values. The Company estimated the fair value of its reporting units in connection with its annual assessments of impairment on first day of the fourth quarter in 2013 using both the income approach (a discounted cash flow technique) and the market approach (a market multiple technique). These valuation methods use unobservable, or Level 3, assumptions, including, but not limited to, assumptions related to future profitability, cash flows, and discount rates, as well as valuation multiples derived from comparable publicly traded companies that are applied to the operating performance of the reporting unit. These estimates are based upon historical trends, management’s knowledge and experience and overall economic factors, including projections of future earnings potential. Developing discounted future cash flow estimates in applying the income approach requires management to evaluate its intermediate to longer-term strategies for each reporting unit, including, but not limited to, estimates about revenue growth, acquisition strategies, operating margins, capital requirements, inflation and working capital management. The development of appropriate rates to discount the estimated future cash flows of each reporting unit requires the selection of risk premiums, which can materially affect the present value of estimated future cash flows. Selection of an appropriate peer group under the market approach involves judgment, and an alternative selection of guideline companies could yield materially different market multiples. Significant increases or decreases in any of these inputs in isolation could result in a significant lower, or higher, fair value measurement.
During the annual test performed as of the first day of the fourth quarter of 2013, management concluded that the estimated fair value of the Utah-based operations in the West region and of the East region were less than their
F-19
Table of Contents
respective carrying values. The estimated fair value of these operating units was estimated by applying a 50 percent weighting to both the discounted cash flow valuation and the market assessment, a discount rate of 11.0% and internal growth projections.
The second step of the test requires the allocation of the reporting unit’s fair value to its assets and liabilities, including any unrecognized intangible assets, in a hypothetical analysis that calculates the implied fair value of goodwill as if the reporting unit were being acquired in a business combination. If the implied fair value of goodwill is less than the carrying value, the difference is recorded as an impairment loss. Based on the step two analysis, the Company recognized goodwill impairment charges of $68.2 million in the year ended December 28, 2013, as a result of uncertainties in the timing of a sustained recovery in the construction industry. After recognition of the goodwill impairment charges, the fair values of these reporting units’ goodwill recognized as of December 28, 2013 were:
| 2013 | ||||
| Goodwill: |
||||
| Utah operations in the West region |
$ | 36,589 | ||
| East region |
— | |||
No impairment charges were recognized prior to 2013.
The following table presents goodwill by reportable segments and in total:
| West | Central | East | Total | |||||||||||||
| Beginning Balance- December 31, 2011 |
$ | 91,598 | $ | 53,585 | $ | 8,192 | $ | 153,375 | ||||||||
| Acquisitions |
(205 | ) | 19,204 | 6,746 | 25,745 | |||||||||||
|
|
|
|
|
|
|
|
|
|||||||||
| Balance, December 29, 2012 |
91,393 | 72,789 | 14,938 | 179,120 | ||||||||||||
| Acquisitions |
16,120 | — | — | 16,120 | ||||||||||||
| Impairment |
(53,264 | ) | — | (14,938 | ) | (68,202 | ) | |||||||||
|
|
|
|
|
|
|
|
|
|||||||||
| Balance, December 28, 2013 |
$ | 54,249 | $ | 72,789 | $ | — | $ | 127,038 | ||||||||
|
|
|
|
|
|
|
|
|
|||||||||
(4) Discontinued Operations
The Company’s discontinued operations include a railroad construction and repair business (referred to herein as railroad), environmental remediation operations and certain concrete paving operations. The railroad business involved building and repairing railroad sidings. The environmental remediation operations primarily involved the repair of retaining walls along highways in Kentucky and the removal and remediation of underground fuel storage tanks. The railroad and environmental remediation operations were sold in 2012 in separate transactions for aggregate proceeds of $3.1 million. The concrete paving operations were wound down in the second quarter of 2013 and, as of March 7, 2014, all assets have been sold. The results of these operations have been removed from the results of continuing operations for all periods presented. Prior to recognition as discontinued operations, all of these businesses were included in the East region’s operations.
Debt and interest expense were not allocated to these businesses since there was no debt specifically attributable to the operations. The discontinued businesses are organized within a limited liability company that passes its tax attributes for federal and state tax purposes to its parent company and is generally not subject to federal or state income tax. The railroad, environmental remediation and concrete paving businesses’ revenue and loss before income tax expense, including an immaterial gain on sale, in fiscal years 2013, 2012 and 2011 are summarized below:
| 2013 | 2012 | 2011 | ||||||||||
| Total revenue |
$ | 3,884 | $ | 50,152 | $ | 49,537 | ||||||
| Loss from discontinued operations before income tax expense |
528 | 3,546 | 5,201 | |||||||||
F-20
Table of Contents
(5) Accounts Receivable, Net
Accounts receivable, net consists of the following as of year-end 2013 and 2012:
| 2013 | 2012 | |||||||
| Trade accounts receivable |
$ | 85,188 | $ | 88,637 | ||||
| Retention receivables |
15,966 | 13,181 | ||||||
| Receivables from related parties |
202 | 1,871 | ||||||
| Other |
— | — | ||||||
|
|
|
|
|
|||||
| Accounts receivable |
101,356 | 103,689 | ||||||
| Less: Allowance for doubtful accounts |
(2,019 | ) | (3,391 | ) | ||||
|
|
|
|
|
|||||
| Accounts receivable, net |
$ | 99,337 | $ | 100,298 | ||||
|
|
|
|
|
|||||
Retention receivables are amounts earned by the Company, but held by customers until projects have been fully completed or near completion. Amounts are expected to be billed and collected within a year.
(6) Inventories
Inventories consist of the following as of year-end 2013 and 2012:
| 2013 | 2012 | |||||||
| Aggregate stockpiles |
$ | 70,300 | $ | 62,872 | ||||
| Finished goods |
11,207 | 9,342 | ||||||
| Work in process |
2,623 | 2,679 | ||||||
| Raw materials |
12,302 | 18,084 | ||||||
|
|
|
|
|
|||||
| Total |
$ | 96,432 | $ | 92,977 | ||||
|
|
|
|
|
|||||
(7) Property, Plant and Equipment, net
Property, plant and equipment, net consist of the following as of year-end 2013 and 2012:
| 2013 | 2012 | |||||||
| Land (mineral bearing) and asset retirement costs |
$ | 107,007 | $ | 106,135 | ||||
| Land (non-mineral bearing) |
81,331 | 69,560 | ||||||
| Buildings and improvements |
77,535 | 78,168 | ||||||
| Plants, machinery and equipment |
553,113 | 512,429 | ||||||
| Mobile equipment and barges |
117,828 | 106,404 | ||||||
| Office equipment |
10,001 | 5,116 | ||||||
| Truck and auto fleet |
19,165 | 19,399 | ||||||
| Landfill airspace and improvements |
46,841 | 46,841 | ||||||
| Construction in progress |
29,560 | 20,734 | ||||||
| Other |
1,779 | 5,134 | ||||||
|
|
|
|
|
|||||
| Property, plant and equipment |
1,044,160 | 969,920 | ||||||
| Less accumulated depreciation, depletion and amortization |
(212,382 | ) | (156,313 | ) | ||||
|
|
|
|
|
|||||
| Property, plant and equipment, net |
$ | 831,778 | $ | 813,607 | ||||
|
|
|
|
|
|||||
Depreciation, depletion and amortization expense of property, plant and equipment was $71.4 million, $68.6 million and $61.8 million for the years ended December 28, 2013, December 29, 2012 and December 31, 2011, respectively.
F-21
Table of Contents
Property, plant and equipment at year-end 2013 and 2012 include $11.3 million (net of $1.3 million accumulated amortization) and $3.1 million (net of $0.2 million accumulated amortization), respectively, of capital leases for certain equipment and a building. Approximately $2.1 million of the future obligations associated with the capital leases are included in accrued expenses and the present value of the remaining capital lease payments is included in other noncurrent liabilities on the consolidated balance sheets. Future minimum rental commitments under long-term capital leases are $2.1 million, $1.1 million, $2.9 million, $0.4 million and $0.4 million for the years ended 2014, 2015, 2016, 2017 and 2018, respectively.
(8) Debt
Debt as of year-end 2013 and 2012 are summarized as follows:
| 2013 | 2012 | |||||||
| Senior secured revolving credit facility due 2017 |
$ | 26,000 | $ | — | ||||
|
|
|
|
|
|||||
| Long-term debt: |
||||||||
| $250.0 million senior notes, net of discount of $4.0 million at December 28, 2013 and $4.7 million at December 29, 2012 |
$ | 245,971 | $ | 245,303 | ||||
| $419.9 million senior secured credit term loan facility net of discount of $2.9 million at December 28, 2013 and $3.5 million at December 29, 2012 |
417,016 | 394,540 | ||||||
|
|
|
|
|
|||||
| Total |
662,987 | 639,843 | ||||||
| Current portion of long-term debt |
4,220 | 4,000 | ||||||
|
|
|
|
|
|||||
| Long-term debt |
$ | 658,767 | $ | 635,843 | ||||
|
|
|
|
|
|||||
Accrued interest expense on long-term debt as of year-end 2013 and 2012 was $17.1 million and $19.7 million, respectively, and is included in accrued expenses on the consolidated balance sheets.
The total contractual payments of long-term debt for the five years subsequent to December 28, 2013 are as follows:
| 2014 |
$ | 4,220 | ||
| 2015 |
4,220 | |||
| 2016 |
5,275 | |||
| 2017 |
4,220 | |||
| 2018 |
3,165 | |||
| Thereafter |
648,790 | |||
|
|
|
|||
| Total |
669,890 | |||
| Less: Original issue discount |
(6,903 | ) | ||
|
|
|
|||
| Total debt |
$ | 662,987 | ||
|
|
|
The Company’s wholly-owned subsidiaries, Summit Materials, LLC and Summit Materials Finance Corp. issued $250.0 million aggregate principal amount of 10 1⁄2% Senior Notes due January 31, 2020 (“Senior Notes”) under an indenture dated January 30, 2012 (as amended and supplemented, the “Indenture”). In addition to the Senior Notes, Summit Materials, LLC has credit facilities which provide for term loans in an aggregate amount of $422.0 million and revolving credit commitments in an aggregate amount of $150.0 million (the “Senior Secured Credit Facilities”). The debt was initially issued with an original issuance discount of $9.5 million, which was recorded as a reduction to debt and is being accreted as interest expense over the term of the debt. As a result of these transactions, $9.5 million of financing fees were charged to earnings in the year ended December 29, 2012.
F-22
Table of Contents
Senior Notes—The Senior Notes bear interest at 10.5% per year, payable semi-annually in arrears; interest payments commenced on July 31, 2012. The Indenture contains covenants limiting, among other things, Summit Materials, LLC and its restricted subsidiaries’ ability to incur additional indebtedness or issue certain preferred shares, pay dividends, redeem stock or make other distributions, make certain investments, sell or transfer certain assets, create liens, consolidate, merge, sell or otherwise dispose of all or substantially all of Summit Materials, LLC and its restricted subsidiaries’ assets, enter into certain transactions with affiliates, and designate subsidiaries as unrestricted subsidiaries. The Indenture also contains customary events of default. As of December 28, 2013 and December 29, 2012, the Company was in compliance with all covenants.
Senior Secured Credit Facilities—Under the Senior Secured Credit Facilities, Summit Materials, LLC has entered into term loans totaling $422.0 million with required principal repayments of 0.25% of term debt due on the last business day of each March, June, September and December. In February 2013, Summit Materials, LLC consummated a repricing, which included additional borrowings of $25.0 million, an interest rate reduction of 1.0% and a deferral of the March 2013 principal payment. The unpaid principal balance is due in full on the maturity date, which is January 30, 2019. As a result of this repricing, $3.1 million of financing fees were charged to earnings in the year ended December 28, 2013. These restrictions also will not prevent Summit Materials, LLC from incurring obligations that do not constitute indebtedness. The senior secured credit facilities include an uncommitted incremental facility that will allow us the option to increase the amount available under the term loan facility and/or the senior secured revolving credit facility by (i) $135.0 million plus (ii) an additional amount so long as we are in pro forma compliance with a consolidated first lien net leverage ratio. The term loans bear interest per annum equal to, at Summit Materials, LLC’s option, either (i) a base rate determined by reference to the highest of (a) the federal funds rate plus 0.50%, (b) the prime rate of Bank of America, N.A. and (c) the British Bankers Association London Interbank Offered Rate (“LIBOR”) plus 1.00%, subject to a base rate floor of 2.25%, plus an applicable margin of 2.75% for base rate loans, or (ii) a LIBOR rate determined by reference to Reuters prior to the interest period relevant to such borrowing adjusted for certain additional costs, subject to a LIBOR floor of 1.25% plus an applicable margin of 3.75% for LIBOR rate loans. The interest rate in effect at December 28, 2013 was 5.0%.
Under the Senior Secured Credit Facilities, Summit Materials, LLC has revolving credit commitments of $150.0 million. The revolving credit facility matures on January 30, 2017 and bears interest per annum equal to, at Summit Materials, LLC’s option, either (i) a base rate determined by reference to the highest of (a) the federal funds rate plus 0.50%, (b) the prime rate of Bank of America, N.A. and (c) LIBOR plus 1.00%, plus an applicable margin of 2.5% for base rate loans or (ii) a LIBOR rate determined by reference to Reuters prior to the interest period relevant to such borrowing adjusted for certain additional costs plus an applicable margin of 3.5% for LIBOR rate loans. The interest rate in effect at December 28, 2013 was 4.4%.
There was $26.0 million outstanding under the revolver facility as of December 28, 2013, leaving remaining borrowing capacity of $105.7 million, which is net of $18.3 million of outstanding letters of credit. The outstanding letters of credit are renewed annually and support required bonding on construction projects and Summit Materials, LLC’s insurance liabilities.
Summit Materials, LLC must adhere to certain financial covenants related to its debt and interest leverage ratios, as defined in the Senior Secured Credit Facilities. The consolidated first lien net leverage ratio, reported each quarter, should be no greater than 4.75:1.0 from January 1, 2013 through June 30, 2014; 4.50:1.0 from July 1, 2014 through June 30, 2015, and 4.25:1.0 thereafter. The interest coverage ratio must be at least 1.70:1.0 from January 1, 2013 through December 31, 2014 and 1.85:1.0 thereafter. As of December 28, 2013 and December 29, 2012, Summit Materials, LLC was in compliance with all covenants. Summit Materials, LLC’s 100 percent-owned subsidiary companies and its non wholly-owned subsidiary, Continental Cement, are subject to certain exclusions and exceptions are named as subsidiary guarantors of the Senior Notes and the Senior Secured Credit Facilities. In addition, Summit Materials, LLC has pledged substantially all of its assets as collateral, subject to certain exclusions and exceptions, for the Senior Secured Credit Facilities.
F-23
Table of Contents
As of December 28, 2013 and December 29, 2012, $11.5 million and $12.6 million, respectively, of deferred financing fees were being amortized over the term of the debt using the effective interest method.
(9) Partners’ Interest
Summit Materials’ majority owners are certain investment funds affiliated with Blackstone Capital Partners V L.P. The limited partnership interests of the Company consist of Class A-1 Interests, Class A-2 Interests, Class B-1 Interests, Class C Interests and Class D-1 Interests and Class D-2 Interests:
| • | Class A-1 Interests: equity interests that receive a preferential distribution up to their unreturned capital contribution and then participate in the residual earnings of the Company after other classes of Partners’ Interests receive their specified preferential distributions. |
| • | Class A-2 Interests: equity interests that are issuable only upon the exchange of Class B-1 Interests, Class C Interests and Class D-1 Interests or Class D-1 Interests for Class A-2 Interests following any transfer of any such interests (other than transfers to certain permitted transferees) and have similar economic rights as Class A-1 Interests. No Class A-2 Interests have been issued to date. |
| • | Class B-1 Interests: equity interests that have similar economic rights as Class A-1 Interests. |
| • | Class C Interests: equity interests that have been issued to certain start-up partners. Class C Interests are entitled to preferential distributions after preferential distributions to the Class A and B-1 Interests and then participate in the residual earnings of the Company after other classes of Partners’ Interests receive their specified preferential distributions. The value of Class C Interests are not significant to the consolidated financial statements. |
| • | Class D-1 Interests and Class D-2 Interests: equity interests that are subject to vesting schedules and other conditions including certain transfer restrictions and put and call rights applicable only to employees or the other holders thereof. Once vested, the D-1 and D-2 Interests participate in the residual earnings of the Company after other classes of Partners’ Interests receive their specified preferential distributions. |
Business affairs of the Company are managed by the Board of Directors (“Board”) of the general partner, which is controlled by the Class A interest holders. As of December 28, 2013, the Board was composed of six directors.
(10) Income Taxes
For the years ended 2013, 2012 and 2011, income taxes consist of the following:
| 2013 | 2012 | 2011 | ||||||||||
| Provision for income taxes: |
||||||||||||
| Current |
$ | 1,761 | $ | (452 | ) | $ | 5,382 | |||||
| Deferred |
(4,408 | ) | (3,468 | ) | (1,974 | ) | ||||||
|
|
|
|
|
|
|
|||||||
| Income tax (benefit) expense |
$ | (2,647 | ) | $ | (3,920 | ) | $ | 3,408 | ||||
|
|
|
|
|
|
|
|||||||
F-24
Table of Contents
The effective tax rate on pre-tax income differs from the U.S. statutory rate due to the following:
| 2013 | 2012 | 2011 | ||||||||||
| Income tax benefit at federal statutory tax rate |
$ | (37,160 | ) | $ | (19,074 | ) | $ | (6,895 | ) | |||
| Book loss not subject to income tax |
32,801 | 16,167 | 13,790 | |||||||||
| State and local income taxes |
130 | (90 | ) | 666 | ||||||||
| Depletion expense |
(411 | ) | (377 | ) | (372 | ) | ||||||
| Domestic production activities deduction |
— | — | (273 | ) | ||||||||
| Goodwill impairment |
1,046 | — | — | |||||||||
| Bargain purchase gain |
— | — | (4,250 | ) | ||||||||
| Effective rate change |
— | (532 | ) | 627 | ||||||||
| Valuation allowance |
729 | 36 | (360 | ) | ||||||||
| Other |
218 | (50 | ) | 475 | ||||||||
|
|
|
|
|
|
|
|||||||
| Income tax (benefit) provision |
$ | (2,647 | ) | $ | (3,920 | ) | $ | 3,408 | ||||
|
|
|
|
|
|
|
|||||||
The following table summarizes the components of the net deferred income tax liability as of year-end 2013 and 2012:
| 2013 | 2012 | |||||||
| Deferred tax assets (liabilities): |
||||||||
| Mining reclamation reserve |
$ | 1,502 | $ | 1,449 | ||||
| Accelerated depreciation |
(33,146 | ) | (34,733 | ) | ||||
| Net operating loss |
2,227 | 2,134 | ||||||
| Capital losses on securities |
997 | 989 | ||||||
| Landfill closure reserve |
(63 | ) | (30 | ) | ||||
| Working capital (e.g., accrued compensation, prepaid assets) |
2,399 | 3,101 | ||||||
|
|
|
|
|
|||||
| Deferred tax liabilities, net |
(26,084 | ) | (27,090 | ) | ||||
| Less valuation allowance on loss carryforwards |
(1,826 | ) | (1,025 | ) | ||||
|
|
|
|
|
|||||
| Total |
$ | (27,910 | ) | $ | (28,115 | ) | ||
|
|
|
|
|
|||||
| Included in accompanying consolidated balance sheets under the following captions: |
||||||||
| Other current assets |
$ | 2,316 | $ | 2,275 | ||||
| Other noncurrent liability |
(30,226 | ) | (30,390 | ) | ||||
|
|
|
|
|
|||||
| Total |
$ | (27,910 | ) | $ | (28,115 | ) | ||
|
|
|
|
|
|||||
In assessing the realizability of deferred tax assets as of year-end 2013 and 2012, management considers whether it is more likely than not that some portion or all of the deferred tax assets will not be realized. The ultimate realization of deferred tax assets is dependent upon the generation of future taxable income during the periods in which those temporary differences become deductible (including the effect of available carryback and carryforward periods), projected future taxable income and tax-planning strategies in making this assessment. Management anticipates the deferred income tax asset related to losses on securities and net operating losses will not be fully utilized before their expiration in 2014; therefore, a valuation allowance has been recorded as of year-end 2013 and 2012. In 2011, $0.8 million of capital loss was carried back for a tax benefit recovery of $0.3 million. The remaining capital loss of $1.0 million is not expected to be utilized; therefore, the remaining balance has been fully reserved in the valuation allowance as of year-end 2013. At December 28, 2013, the Company has net operating loss carryforwards for federal and state income tax purposes of $5.2 million and $0.7 million, respectively, which are available to offset future federal and state taxable income, if any, through 2033.
F-25
Table of Contents
The Company does not have any uncertain tax positions as of December 28, 2013. Tax years from 2010 to 2013 remain open and subject to audit by federal and state tax authorities. No income tax expense or benefit was recognized in other comprehensive loss in 2013, 2012 or 2011.
(11) Employee Benefit Plans
Deferred Compensation Plan—The Company sponsors employee 401(k) savings plans for all salaried employees and certain union employees. The plans provide for various required and discretionary Company matches of employees’ eligible compensation contributed to the plans. The expense for all defined contribution plans amounted to $2.3 million, $2.2 million and $1.9 million for the years ended December 28, 2013, December 29, 2012 and December 31, 2011, respectively.
Defined Benefit and Other Postretirement Benefits Plans—The Company’s subsidiary, Continental Cement, sponsors two noncontributory defined benefit pension plans for hourly and salaried employees. The salaried employee pension plan was closed to new participants and frozen in January 2000 and the hourly employee pension plan was closed to new participants in May 2003 and frozen in January 2014. Pension benefits for certain eligible hourly employees are based on a monthly pension factor for each year of credited service. Pension benefits for certain eligible salaried employees are generally based on years of service and average eligible compensation.
Continental Cement also sponsors unfunded healthcare and life insurance benefits plan for certain eligible retired employees. Effective January 1, 2012, the Company eliminated all future retiree health and life coverage for active salaried, nonunion hourly and certain union employees that retire on or after January 1, 2012. Effective January 1, 2014, the plan was amended to eliminate all future retiree health and life coverage for the remaining union employees.
The funded status of the pension and other postretirement benefit plans is recognized in the consolidated balance sheets as the difference between the fair value of plan assets and the benefit obligations. For defined benefit pension plans, the benefit obligation is the projected benefit obligation (“PBO”) and for the other postretirement benefit plans, the benefit obligation is the accumulated postretirement benefit obligation (“APBO”). The PBO represents the actuarial present value of benefits expected to be paid upon retirement based on estimated future compensation levels. However, since the plans’ participants are not subject to future compensation increases, the plans’ PBO equals the APBO. The APBO represents the actuarial present value of postretirement benefits attributed to employee services already rendered. The fair value of plan assets represents the current market value of assets held by an irrevocable trust fund for the sole benefit of participants. The measurement of the benefit obligations are based on the Company’s estimates and actuarial valuations. These valuations reflect the terms of the plan and use participant-specific information, such as compensation, age and years of service, as well as certain assumptions that require significant judgment, including estimates of discount rates, expected return on plan assets, rate of compensation increases, interest-crediting rates and mortality rates.
The Company uses its fiscal year-end as the measurement date for its defined benefit pension and other postretirement benefit plans.
F-26
Table of Contents
Obligations and Funded Status—The following information is as of year-end 2013 and 2012 and for the years ended December 28, 2013, December 29, 2012 and December 31, 2011:
| 2013 | 2012 | |||||||||||||||
| Pension benefits |
Other benefits |
Pension benefits |
Other benefits |
|||||||||||||
| Change in benefit obligations: |
||||||||||||||||
| Beginning of period |
$ | 28,674 | $ | 15,810 | $ | 26,514 | $ | 14,467 | ||||||||
| Service cost |
295 | 236 | 276 | 207 | ||||||||||||
| Interest cost |
963 | 513 | 1,055 | 585 | ||||||||||||
| Actuarial (gain) loss |
(2,674 | ) | (1,048 | ) | 2,347 | 1,597 | ||||||||||
| Special termination benefits |
— | 39 | — | — | ||||||||||||
| Benefits paid |
(1,614 | ) | (1,395 | ) | (1,518 | ) | (1,046 | ) | ||||||||
|
|
|
|
|
|
|
|
|
|||||||||
| End of period |
25,644 | 14,155 | 28,674 | 15,810 | ||||||||||||
|
|
|
|
|
|
|
|
|
|||||||||
| Change in fair value of plan assets: |
||||||||||||||||
| Beginning of period |
17,863 | — | 16,639 | — | ||||||||||||
| Actual return on plan assets |
1,512 | — | 1,205 | — | ||||||||||||
| Employer contributions |
1,313 | 1,395 | 1,537 | 1,046 | ||||||||||||
| Benefits paid |
(1,614 | ) | (1,395 | ) | (1,518 | ) | (1,046 | ) | ||||||||
|
|
|
|
|
|
|
|
|
|||||||||
| End of period |
19,074 | — | 17,863 | — | ||||||||||||
|
|
|
|
|
|
|
|
|
|||||||||
| Funded status of plans |
$ | (6,570 | ) | $ | (14,155 | ) | $ | (10,811 | ) | $ | (15,810 | ) | ||||
|
|
|
|
|
|
|
|
|
|||||||||
| Current liabilities |
$ | — | $ | (1,268 | ) | $ | — | $ | (1,055 | ) | ||||||
| Noncurrent liabilities |
(6,570 | ) | (12,887 | ) | (10,811 | ) | (14,755 | ) | ||||||||
|
|
|
|
|
|
|
|
|
|||||||||
| Liability recognized |
$ | (6,570 | ) | $ | (14,155 | ) | $ | (10,811 | ) | $ | (15,810 | ) | ||||
|
|
|
|
|
|
|
|
|
|||||||||
| Amounts recognized in accumulated other comprehensive income: |
||||||||||||||||
| Net actuarial loss |
$ | 4,831 | $ | 4,139 | $ | 8,056 | $ | 5,501 | ||||||||
| Prior service cost |
— | (1,346 | ) | — | (1,526 | ) | ||||||||||
|
|
|
|
|
|
|
|
|
|||||||||
| Total amount recognized |
$ | 4,831 | $ | 2,793 | $ | 8,056 | $ | 3,975 | ||||||||
|
|
|
|
|
|
|
|
|
|||||||||
F-27
Table of Contents
The amount recognized in accumulated other comprehensive income (“AOCI”) is the actuarial loss and prior service cost, which has not yet been recognized in periodic benefit cost, adjusted for amounts allocated to the redeemable noncontrolling interest. At December 28, 2013, the actuarial loss expected to be amortized from AOCI to periodic benefit cost in 2014 is $0.1 million and $0.2 million for the pension and postretirement obligations, respectively.
| 2013 | 2012 | 2011 | ||||||||||||||||||||||
| Pension benefits |
Other benefits |
Pension benefits |
Other benefits |
Pension benefits |
Other benefits |
|||||||||||||||||||
| Amounts recognized in other comprehensive (gain) loss: |
||||||||||||||||||||||||
| Net actuarial (gain) loss |
$ | (2,838 | ) | $ | (1,048 | ) | $ | 2,444 | $ | 1,597 | $ | 4,066 | $ | 3,390 | ||||||||||
| Prior service cost |
— | 180 | — | — | — | (1,705 | ) | |||||||||||||||||
| Amortization of prior year service cost |
— | — | — | 180 | — | — | ||||||||||||||||||
| Amortization of (gain) loss |
(387 | ) | (314 | ) | (261 | ) | (312 | ) | (5 | ) | (71 | ) | ||||||||||||
|
|
|
|
|
|
|
|
|
|
|
|
|
|||||||||||||
| Total amount recognized |
$ | (3,225 | ) | $ | (1,182 | ) | $ | 2,183 | $ | 1,465 | $ | 4,061 | $ | 1,614 | ||||||||||
|
|
|
|
|
|
|
|
|
|
|
|
|
|||||||||||||
| Components of net periodic benefit cost: |
||||||||||||||||||||||||
| Service cost |
$ | 295 | $ | 236 | $ | 276 | $ | 207 | $ | 275 | $ | 227 | ||||||||||||
| Interest cost |
963 | 513 | 1,055 | 585 | 1,161 | 710 | ||||||||||||||||||
| Amortization of loss |
387 | 314 | 262 | 312 | 5 | 69 | ||||||||||||||||||
| Expected return on plan assets |
(1,348 | ) | — | (1,301 | ) | (180 | ) | (1,400 | ) | — | ||||||||||||||
| Special termination benefits |
— | 39 | — | — | — | — | ||||||||||||||||||
| Amortization of prior service credit |
— | (180 | ) | — | — | — | — | |||||||||||||||||
|
|
|
|
|
|
|
|
|
|
|
|
|
|||||||||||||
| Net periodic benefit cost |
$ | 297 | $ | 922 | $ | 292 | $ | 924 | $ | 41 | $ | 1,006 | ||||||||||||
|
|
|
|
|
|
|
|
|
|
|
|
|
|||||||||||||
Assumptions—Weighted-average assumptions used to determine the benefit obligations as of year-end 2013 and 2012 are:
| 2013 | 2012 | |||||||
| Pension benefits |
Other benefits |
Pension benefits |
Other benefits | |||||
| Discount rate |
4.21% - 4.46% | 4.33% | 3.30% - 3.57% | 3.41% | ||||
| Expected long-term rate of return on plan assets |
7.50% | N/A | 7.50% | N/A | ||||
Weighted-average assumptions used to determine net periodic benefit cost for years ended December 28, 2013, December 29, 2012 and December 31, 2011:
| 2013 | 2012 | 2011 | ||||||||||
| Pension benefits |
Other benefits |
Pension benefits |
Other benefits |
Pension benefits |
Other benefits | |||||||
| Discount rate |
3.30% - 3.57% | 3.41% | 3.89% - 4.07% | 4.00% | 4.94% - 5.12.% | 5.07% | ||||||
| Expected long-term rate of return on plan assets |
7.50% | N/A | 7.50% | N/A | 8.50% | N/A | ||||||
The expected long-term return on plan assets is based upon the Plans’ consideration of historical and forward-looking returns and the Company’s estimation of what a portfolio, with the target allocation described below, will earn over a long-term horizon. The discount rate is derived using the Citigroup Pension Discount Curve.
F-28
Table of Contents
Assumed health care cost trend rates are 9% grading to 7% and 9% grading to 7% as of year-end 2013 and 2012, respectively. Assumed health care cost trend rates have a significant effect on the amounts reported for the Company’s post retirement medical and life plans. A one percentage-point change in assumed health care cost trend rates would have the following effects as of year-end 2013 and 2012:
| 2013 | 2012 | |||||||||||||||
| Increase | Decrease | Increase | Decrease | |||||||||||||
| Total service cost and interest cost components |
$ | 66 | $ | (55 | ) | $ | 73 | $ | (63 | ) | ||||||
| Estimated APBO |
1,251 | (1,073 | ) | 1,555 | (1,331 | ) | ||||||||||
Plan Assets—The defined benefit pension plans’ (the “Plans”) investment strategy is to minimize investment risk while generating acceptable returns. The Plans currently invest a relatively high proportion of the plan assets in fixed income securities, while the remainder is invested in equity securities, cash reserves and precious metals. The equity securities are diversified into funds with growth and value investment strategies. The target allocation for plan assets is as follows: equity securities – 30%; fixed income securities –63%; cash reserves –5%; and precious metals –2%. The Plans’ current investment allocations are within the tolerance of the target allocation. The Company had no Level 3 investments as of or for the years ended December 28, 2013 and December 29, 2012.
At year-end 2013 and 2012, the Plans’ assets were invested predominantly in fixed-income securities and publicly traded equities, but may invest in other asset classes in the future subject to the parameters of the investment policy. The Plans’ investments in fixed-income assets include U.S. Treasury and U.S. agency securities and corporate bonds. The Plans’ investments in equity assets include U.S. and international securities and equity funds. The Company estimates the fair value of the Plans’ assets using various valuation techniques and, to the extent available, quoted market prices in active markets or observable market inputs. The descriptions and fair value methodologies for the Plans’ assets are as follows:
Fixed Income Securities—Corporate and government bonds are classified as Level 2 assets, as they are either valued at quoted market prices from observable pricing sources at the reporting date or valued based upon comparable securities with similar yields and credit ratings.
Equity Securities—Equity securities are valued at the closing market price reported on a U.S. exchange where the security is actively traded and are therefore classified as Level 1 assets.
Cash—The carrying amounts of cash approximate fair value due to the short-term maturity.
Precious Metals—Precious metals are valued at the closing market price reported on a U.S. exchange where the security is actively traded and are therefore classified as Level 1 assets.
F-29
Table of Contents
The fair value of the Company’s pension plans’ assets by asset class and fair value hierarchy level as of year-end 2013 and 2012 are as follows:
| 2013 | ||||||||||||
| Total fair value |
Quoted prices in active markets for identical assets (Level 1) |
Observable inputs (Level 2) |
||||||||||
| Cash |
$ | 1,665 | $ | 1,665 | $ | — | ||||||
| Precious metals |
358 | 358 | — | |||||||||
| Equity securities: |
||||||||||||
| U.S. Large cap value |
1,221 | 1,221 | — | |||||||||
| U.S. Large cap growth |
1,536 | 1,536 | — | |||||||||
| U.S. Mid cap value |
600 | 600 | — | |||||||||
| U.S. Mid cap growth |
603 | 603 | — | |||||||||
| U.S. Small cap value |
610 | 610 | — | |||||||||
| U.S. Small cap growth |
599 | 599 | — | |||||||||
| International |
889 | 889 | — | |||||||||
| Fixed income securities: |
||||||||||||
| Intermediate—government |
1,647 | — | 1,647 | |||||||||
| Intermediate—corporate |
3,138 | — | 3,138 | |||||||||
| Short-term—government |
2,168 | — | 2,168 | |||||||||
| Short-term—corporate |
4,040 | — | 4,040 | |||||||||
|
|
|
|
|
|
|
|||||||
| Total |
$ | 19,074 | $ | 8,081 | $ | 10,993 | ||||||
|
|
|
|
|
|
|
|||||||
| 2012 | ||||||||||||
| Total fair value |
Quoted prices in active markets for identical assets (Level 1) |
Observable inputs (Level 2) |
||||||||||
| Cash |
$ | 1,656 | $ | 1,656 | $ | — | ||||||
| Equity securities: |
||||||||||||
| U.S. Large cap value |
1,063 | 1,063 | — | |||||||||
| U.S. Large cap growth |
1,037 | 1,037 | — | |||||||||
| U.S. Mid cap value |
542 | 542 | — | |||||||||
| U.S. Mid cap growth |
536 | 536 | — | |||||||||
| U.S. Small cap value |
546 | 546 | — | |||||||||
| U.S. Small cap growth |
539 | 539 | — | |||||||||
| International |
1,134 | 1,134 | — | |||||||||
| Fixed income securities: |
||||||||||||
| Intermediate—government |
1,247 | — | 1,247 | |||||||||
| Intermediate—corporate |
4,402 | — | 4,402 | |||||||||
| Short-term—government |
2,038 | — | 2,038 | |||||||||
| Short-term—corporate |
3,123 | — | 3,123 | |||||||||
|
|
|
|
|
|
|
|||||||
| Total |
$ | 17,863 | $ | 7,053 | $ | 10,810 | ||||||
|
|
|
|
|
|
|
|||||||
Cash Flows—The Company expects to contribute approximately $1.0 million and $1.3 million in 2014 to its pension plans and other postretirement benefit plans, respectively.
F-30
Table of Contents
The estimated benefit payments for each of the next five years and the five-year period thereafter are as follows:
| Pension benefits |
Other benefits |
|||||||
| 2014 |
$ | 1,694 | $ | 1,269 | ||||
| 2015 |
1,704 | 1,109 | ||||||
| 2016 |
1,739 | 1,130 | ||||||
| 2017 |
1,737 | 963 | ||||||
| 2018 |
1,774 | 1,018 | ||||||
| 2019—2023 |
8,667 | 4,512 | ||||||
|
|
|
|
|
|||||
| Total |
$ | 17,315 | $ | 10,001 | ||||
|
|
|
|
|
|||||
(12) Accrued Mining and Landfill Reclamation
The Company has asset retirement obligations arising from regulatory requirements to perform certain reclamation activities at the time that certain quarries and landfills are closed, which are primarily included in other noncurrent liabilities on the consolidated balance sheets. The current portion of the liabilities, $0.5 million and $0.4 million as of December 28, 2013 and December 29, 2012, respectively, is included in accrued and other liabilities on the consolidated balance sheets. The liability was initially measured at fair value and subsequently is adjusted for accretion expense, payments and changes in the amount or timing of the estimated cash flows. The corresponding asset retirement costs are capitalized as part of the carrying amount of the related long-lived asset and depreciated over the asset’s remaining useful life. The following table presents the activity for the asset retirement obligations for the years ended December 28, 2013 and December 29, 2012:
| 2013 | 2012 | |||||||
| Beginning balance |
$ | 14,844 | $ | 13,328 | ||||
| Acquired obligations |
286 | 364 | ||||||
| Change in cost estimate |
721 | 604 | ||||||
| Settlement of reclamation obligations |
(1,201 | ) | (77 | ) | ||||
| Additional liabilities incurred |
414 | — | ||||||
| Accretion expense |
717 | 625 | ||||||
|
|
|
|
|
|||||
| Ending balance |
$ | 15,781 | $ | 14,844 | ||||
|
|
|
|
|
|||||
(13) Commitments and Contingencies
Litigation and Claims—Summit Materials is party to certain legal actions arising from the ordinary course of business activities. In the opinion of management, these actions are without merit or the ultimate disposition, if any, resulting from them will not have a material effect on Summit Materials’ consolidated financial position, results of operations or liquidity. Summit Materials’ policy is to record legal fees as incurred.
The Company is obligated under an indemnification agreement entered into with the sellers of Harper Contracting, Inc., Harper Sand and Gravel, Inc., Harper Excavating, Inc., Harper Ready Mix Company, Inc. and Harper Investments, Inc. (collectively, “Harper”) for the sellers’ ownership interests in a joint venture agreement. Summit Materials has the rights to any benefits under the joint venture as well as the assumption of any obligations, but does not own equity interests in the joint venture. The joint venture has incurred significant losses on a highway project in Utah, which have resulted in requests for funding from the joint venture partners and ultimately from the Company. Through year-end 2013, the Company has funded $8.8 million, $4.0 million in 2012 and $4.8 million in 2011. In 2012 and 2011, the Company recognized losses on the indemnification agreement of $8.0 million and $1.9 million, respectively, which are included in general and administrative expenses. As of year-end 2013 and 2012, an accrual of $4.3 million was recorded in other noncurrent liabilities as management’s best estimate of future funding obligations.
F-31
Table of Contents
In February 2011, the Company incurred a property loss related to a sunken barge with cement product aboard. In the year-ended December 28, 2013, the Company recognized $0.8 million of charges for lost product aboard the barge and costs to remove the barge from the waterway. As of December 28, 2013 and December 29, 2012, $0.9 million is included in accrued expenses as management’s best estimate of the remaining costs to remove the barge.
Environmental Remediation—Summit Materials’ mining operations are subject to and affected by federal, state and local laws and regulations relating to the environment, health and safety and other regulatory matters. These operations require environmental operating permits, which are subject to modification, renewal and revocation. Summit Materials regularly monitors and reviews its operations, procedures and policies for compliance with these laws and regulations. Despite these compliance efforts, risk of environmental liability is inherent in the operation of Summit Materials’ business, as it is with other companies engaged in similar businesses and there can be no assurance that environmental liabilities will not have a material adverse effect on Summit Materials’ consolidated financial position, results of operations or liquidity.
Other—During the course of business, there may be revisions to project costs and conditions that can give rise to change orders. Revisions can also result in claims we might make against the customer or a subcontractor to recover project variances that have not been satisfactorily addressed through change orders with the customer. As of year-end 2013 and 2012, unapproved change orders and claims were $3.2 million ($0.5 million in costs and estimated earnings in excess of billings and $2.7 million in other assets) and $4.8 million ($1.6 million in costs and estimated earnings in excess of billings and $3.2 million in other assets), respectively.
The Company is obligated under various firm purchase commitments for certain raw materials and services that are in the ordinary course of business. Management does not expect any significant changes in the market value of these goods and services during the commitment period that would have a material adverse effect on the financial position, results of operations, and cash flows of the Company. The terms of the purchase commitments are generally less than one year.
(14) Related Party Transactions
The Company incurred management fees paid to Blackstone Management Partners L.L.C. (“BMP”) totaling $2.6 million, $2.1 million and $3.0 million in 2013, 2012 and 2011, respectively, under terms of an agreement dated July 30, 2009, between the Company and BMP. Under the terms of the agreement, BMP is permitted to, and has, assigned a portion of the fees to which it is entitled to receive to Silverhawk Summit, L.P. and to certain members of management. The fees were paid for consultancy services related to acquisition activities and are included in general and administrative expenses.
The Company purchased equipment from a noncontrolling member of Continental Cement for approximately $2.3 million, inclusive of $0.1 million of interest, in 2011, which was paid for in 2012.
Summit Materials earned revenue of $0.6 million, $7.9 million and $8.6 million and incurred costs of $0.2 million, $0.2 million and $0.7 million in connection with several transactions with unconsolidated affiliates for the years ended December 28, 2013, December 29, 2012 and December 31, 2011, respectively. As of December 28, 2013 and December 29, 2012, accounts receivable from affiliates was $0.4 million and $1.9 million, respectively, and accounts payable to affiliates was zero and $0.2 million, respectively.
Cement sales to companies owned by certain noncontrolling members of Continental Cement were approximately $12.7 million, $12.5 million and $9.5 million for the years ended December 28, 2013, December 29, 2012 and December 2011, respectively, and accounts receivable due from these parties were approximately $0.2 million and $1.0 million as of December 28, 2013 and December 29, 2012, respectively.
As of year-end 2013 and 2012, the Company had accrued interest payments of $0.7 million and $2.1 million, respectively, due to a certain noncontrolling member for a related-party note, which is expected to be paid in 2014. The principal balance on the note was repaid as part of the January 2012 financing transactions.
F-32
Table of Contents
(15) Acquisition-Related Liabilities
A number of acquisition-related liabilities have been recorded subject to terms in the relevant purchase agreements. There are three main categories of such obligations, deferred consideration, noncompete payments and earn-out obligations. Noncompete payments have been accrued where certain former owners of newly acquired companies have entered into standard noncompete arrangements. Subject to terms and conditions stated in these noncompete agreements, payments are generally made over a five-year period. Deferred consideration is purchase price consideration paid in the future as agreed to in the purchase agreement and is not contingent on future events. Deferred consideration is scheduled to be paid in years ranging from 5 to 20 years in either monthly, quarterly or annual installments. The remaining payments due under these noncompete and deferred consideration agreements are as follows:
| 2014 |
$ | 10,790 | ||
| 2015 |
6,742 | |||
| 2016 |
5,950 | |||
| 2017 |
5,910 | |||
| 2018 |
5,370 | |||
| Thereafter |
9,963 | |||
| Total scheduled payments |
44,725 | |||
|
|
|
|||
| Present value adjustments |
(12,242 | ) | ||
|
|
|
|||
| Total noncompete obligations and deferred consideration |
$ | 32,483 | ||
|
|
|
Accretion on the deferred consideration and noncompete obligations is recorded in interest expense.
(16) Supplemental Cash Flow Information
Supplemental cash flow information for the years ended December 28, 2013, December 29, 2012 and December 31, 2011 is as follows:
| 2013 | 2012 | 2011 | ||||||||||
| Cash payments: |
||||||||||||
| Interest |
$ | 52,001 | $ | 36,357 | $ | 41,790 | ||||||
| Income taxes |
457 | 799 | 5,608 | |||||||||
| Non cash financing activities: |
||||||||||||
| Acquisitions |
$ | (7,619 | ) | $ | (10,595 | ) | $ | (27,815 | ) | |||
F-33
Table of Contents
(17) Leasing Arrangements
Rent expense, including short-term rentals, during the years ended December 28, 2013, December 29, 2012 and December 31, 2011 was $4.0 million, $3.5 million and $4.3 million, respectively. The Company has lease agreements associated with quarry facilities under which royalty payments are made. The payments are generally based on tons sold in a particular period; however, certain agreements have minimum annual payments. Royalty expense recorded in cost of revenue during the years ended December 28, 2013, December 29, 2012 and December 31, 2011 was $4.5 million, $3.9 million and $3.1 million, respectively. Minimum contractual commitments under long-term operating leases, which primarily relate to land, plant and equipment and under royalty agreements as of December 28, 2013, are as follows:
| Operating Leases |
Royalty Agreements |
|||||||
| 2014 |
$ | 4,034 | $ | 2,044 | ||||
| 2015 |
3,890 | 2,065 | ||||||
| 2016 |
3,098 | 1,974 | ||||||
| 2017 |
2,376 | 2,047 | ||||||
| 2018 |
1,983 | 1,434 | ||||||
(18) Redeemable Noncontrolling Interest
The Company owns 100 Class A Units of Continental Cement, which represent an approximately 70% economic interest and have a preference in liquidation to the Class B Units. Continental Cement issued 100,000,000 Class B Units in May 2010, which remain outstanding and represent an approximately 30% economic interest.
Continental Cement’s Class A Units include a cumulative distribution preference which requires, to the extent distributions are authorized by its Board of Directors, Continental Cement Class A Units receive, prior to any distributions to the Class B Unit holders, a priority return of 11% accruing daily and compounding annually on each anniversary of the date of issuance to Class A Unit holders. To the extent the priority return is not made in a given year, the amount of the priority return will increase the liquidation preference of the Class A Units up to an 80% allowable sharing percentage in distributions and liquidation proceeds. The Company holds all the Class A Units. No distributions are currently anticipated.
The Continental Cement Amended and Restated Limited Liability Company Agreement (as amended, the “LLC Agreement”) provides the Company with a call right that allows the Company to require Continental Cement to call the Class B Units held by the owners of Continental Cement (the “Rollover Members”) prior to the Company’s investment in Class A Units of the Company, at a strike price that approximates fair value. The call right is exercisable after May 2016 either in anticipation of an initial public offering of the Company or if an initial public offering of the Company has already occurred. The Rollover Members also have a put right that allows them to put the Class B Units to Continental Cement, at a strike price that approximates fair value. The put right is exercisable prior to May 2016 upon a sale of control of the Company or at any time after May 2016. Finally, the LLC Agreement includes transfer restrictions that prohibit the Rollover Members from transferring their Class B Units to third parties without the consent of the board of directors of Continental Cement.
Because the Class B Units can be put to Continental Cement by the Rollover Members in the future based on the passage of time, which can be accelerated upon the occurrence of a contingent event, Summit Materials’ noncontrolling interest is classified in temporary equity. The redemption value is based upon the estimated fair value of Continental Cement, which is valued using Level 3 inputs. Summit Materials elected to accrete changes in the redemption value of the noncontrolling interest over the period from the date of issuance to the earliest anticipated redemption date of the instrument, which is currently May 2016, using an interest method. The accretion is as an adjustment to the consolidated accumulated deficit. The redemption value of the redeemable noncontrolling interest as of year-end 2013 and 2012 approximated its carrying value.
F-34
Table of Contents
(19) Employee Long Term Incentive Plan
Certain employees of the Company hold Class D interests in the Company that provide rights to cash distributions based on a predetermined distribution formula upon the Company’s general partner declaring a distribution.
Certain of the Class D interests vest with the passage of time (time-vesting interests) and the remaining vest when certain investment returns are achieved by certain of the Company’s investors (performance-vesting interests). Of the time-vesting-interests, 20% vest on the first anniversary and the remaining 80% vest monthly over a period of four years following the first anniversary date. Interests that are not vested in accordance with their terms within eight years are automatically forfeited without consideration.
Performance-vesting interests vest when certain investment returns are achieved by the Company’s investors affiliated with the Blackstone Group L.P. (“Blackstone”) while the employee continues to provide services to us or our subsidiaries. There are two performance levels at which performance-vesting interests generally vest, with performance-vesting interests that are Class D-1 interests vesting if the Company’s Blackstone-affiliated investors receive a return on invested capital of 1.75 times their initial investment, and performance-vesting interests that are Class D-2 interests vesting if the Company’s Blackstone-affiliated investors receive a return on invested capital of 3.00 times their initial investment.
If the employee leaves the Company, the Company can (1) purchase the vested Class D interests for a lump sum payment provided certain conditions have been met or (2) elect to convert all of the employee’s Class D interests into a right to receive future distributions capped at a termination amount. The termination amount is determined as an amount equal to the fair market value of the Class D interest holder’s vested interests minus any amounts already distributed to the Class D interest holders respective of those Class D interest plus interest on the difference between such fair market value and amounts already distributed. The fair value of the time-vesting Class D interests granted in 2013, 2012 and 2011 totaled $1.6 million, $1.1 million and $3.4 million, respectively. The weighted-average grant-date fair value in 2013, 2012 and 2011 was $2,786, $3,761 and $3,876, respectively. The following table summarizes information for the Class D interests:
| Time-vesting Interests | Performance-vesting Interests |
|||||||||||||||
| Number of units |
Weighted average grant- date fair value per unit |
Number of units |
Weighted average grant- date fair value per unit |
|||||||||||||
| Beginning balance—December 29, 2012 |
1,692 | $ | 3,864 | 4,202 | $ | 3,087 | ||||||||||
| Granted |
584 | 2,786 | 759 | 2,314 | ||||||||||||
| Vested |
(772 | ) | 3,896 | — | — | |||||||||||
| Forfeited |
(2 | ) | 3,893 | (5 | ) | 3,176 | ||||||||||
| Cancelled |
(61 | ) | 2,208 | (79 | ) | 1,388 | ||||||||||
|
|
|
|
|
|||||||||||||
| Balance—December 28, 2013 |
1,441 | 4,877 | ||||||||||||||
|
|
|
|
|
|||||||||||||
The estimated fair value at December 28, 2013 of interests vested during 2013 was $2.2 million. As of year-end 2013 and 2012, the cumulative amount of interests vested total 2,531 and 1,732, respectively. The fair value of the Class D interests is estimated as of the grant date using Monte Carlo simulations, which requires the input of subjective assumptions, including the expected volatility and the expected term. The following table presents the weighted average assumptions used to estimate the fair value of grants in 2013, 2012 and 2011:
| 2013 | 2012 | 2011 | ||||
| Class D Units |
||||||
| Risk-free interest rate |
0.50% | 1.62% | 1.71% - 2.39% | |||
| Dividend yield |
None | None | None | |||
| Volatility |
58% | 47% | 42% - 49% | |||
| Expected term |
4 years | 6 - 8 years | 6 - 8 years |
F-35
Table of Contents
The risk-free rate is based on the yield at the date of grant of a U.S. Treasury security with a maturity period approximating the expected term. As the Company has no plans to issue regular dividends, a dividend yield of zero was used. The volatility assumption is based on reported data of a peer group of publically traded companies for which historical information was available adjusted for the Company’s capital structure. The expected term is based on expectations about future exercises and represents the period of time that the interests granted are expected to be outstanding.
Compensation expense for time-vesting interests granted is based on the grant-date fair value. The Company recognizes these compensation costs on a straight-line basis over the service period, which is generally the vesting period of the award. A forfeiture rate assumption is factored into the compensation cost based on historical forfeitures. Compensation expense for performance-vesting interests would be recognized based on the grant date fair value. However, no compensation expense has been recognized for the performance-vesting interests, as management does not believe it is currently probable that certain investment returns, the performance criteria, will be achieved.
Share-based compensation expense, which is recognized in general and administrative expenses, totaled $2.3 million, $2.5 million and $2.5 million in the years ended December 28, 2013, December 29, 2012 and December 31, 2011, respectively. As of December 28, 2013, unrecognized compensation cost totaled $4.6 million. The weighted average remaining contractual term over which the unrecognized compensation cost is to be recognized is 2.6 years as of year-end 2013.
(20) Segment Information
The Company has determined that it has three operating segments, which are its reportable segments: Central; West; and East regions. These segments are consistent with the Company’s management reporting structure. The operating results of each segment are regularly reviewed and evaluated separately by the Chief Executive Officer, the Company’s Chief Operating Decision Maker (“CODM”). The CODM primarily evaluates the performance of its segments and allocates resources to them based on a segment profit metric that we call Adjusted EBITDA, which is computed as earnings from continuing operations before interest, taxes, depreciation, depletion, amortization, accretion and goodwill impairment. In addition, certain items such as management fees are excluded from the calculation of segment profit.
Each region has several acquired subsidiaries that are engaged in various activities including quarry mining, aggregate production and contracting. Assets employed by segment include assets directly identified with those operations. Corporate assets consist primarily of cash, property, plant and equipment for corporate operations and other assets not directly identifiable with a reportable business segment. The accounting policies applicable to each segment are consistent with those used in the consolidated financial statements.
The following tables display selected financial data for the Company’s reportable business segments for the following fiscal years:
| 2013 | 2012 | 2011 | ||||||||||
| Revenue: |
||||||||||||
| West region |
$ | 426,195 | $ | 484,922 | $ | 362,577 | ||||||
| Central region |
329,621 | 302,113 | 264,008 | |||||||||
| East region |
160,385 | 139,219 | 162,491 | |||||||||
|
|
|
|
|
|
|
|||||||
| Total revenue |
$ | 916,201 | $ | 926,254 | $ | 789,076 | ||||||
|
|
|
|
|
|
|
|||||||
F-36
Table of Contents
| 2013 | 2012 | 2011 | ||||||||||
| Adjusted EBITDA |
||||||||||||
| West region |
$ | 28,607 | $ | 14,429 | $ | 36,442 | ||||||
| Central region |
72,918 | 65,767 | 65,651 | |||||||||
| East region |
15,134 | 10,782 | 15,504 | |||||||||
| Corporate and other(1) |
(24,878 | ) | (15,560 | ) | (9,877 | ) | ||||||
|
|
|
|
|
|
|
|||||||
| Total reportable segments and corporate |
91,781 | 75,418 | 107,720 | |||||||||
| Interest expense |
56,443 | 58,079 | 47,784 | |||||||||
| Depreciation, depletion, amortization and accretion |
72,934 | 68,290 | 61,377 | |||||||||
| Goodwill impairment |
68,202 | — | — | |||||||||
|
|
|
|
|
|
|
|||||||
| Loss from continuing operations before taxes |
$ | (105,798 | ) | $ | (50,951 | ) | $ | (1,441 | ) | |||
|
|
|
|
|
|
|
|||||||
| (1) | Corporate results primarily consist of compensation and office expenses for employees included in the Company’s headquarters and transaction costs. |
| 2013 | 2012 | 2011 | ||||||||||
| Cash paid for capital expenditures: |
||||||||||||
| West region |
$ | 21,856 | $ | 14,993 | $ | 9,256 | ||||||
| Central region |
33,030 | 20,996 | 20,078 | |||||||||
| East region |
7,753 | 8,736 | 9,311 | |||||||||
|
|
|
|
|
|
|
|||||||
| Total reportable segments |
62,639 | 44,725 | 38,645 | |||||||||
| Corporate and other |
3,360 | 763 | 11 | |||||||||
|
|
|
|
|
|
|
|||||||
| Total capital expenditures |
$ | 65,999 | $ | 45,488 | $ | 38,656 | ||||||
|
|
|
|
|
|
|
|||||||
| 2013 | 2012 | 2011 | ||||||||||
| Depreciation, depletion, amortization and accretion: |
||||||||||||
| West region |
$ | 24,167 | $ | 23,771 | $ | 19,706 | ||||||
| Central region |
33,808 | 30,215 | 27,646 | |||||||||
| East region |
14,493 | 14,223 | 13,938 | |||||||||
|
|
|
|
|
|
|
|||||||
| Total reportable segments |
72,468 | 68,209 | 61,290 | |||||||||
| Corporate and other |
466 | 81 | 87 | |||||||||
|
|
|
|
|
|
|
|||||||
| Total depreciation, depletion, amortization and accretion |
$ | 72,934 | $ | 68,290 | $ | 61,377 | ||||||
|
|
|
|
|
|
|
|||||||
| 2013 | 2012 | 2011 | ||||||||||
| Total assets: |
||||||||||||
| West region |
$ | 383,544 | $ | 428,115 | $ | 451,017 | ||||||
| Central region |
657,421 | 610,003 | 587,341 | |||||||||
| East region |
192,486 | 224,603 | 238,018 | |||||||||
|
|
|
|
|
|
|
|||||||
| Total reportable segments |
1,233,451 | 1,262,721 | 1,276,376 | |||||||||
| Corporate and other |
17,609 | 21,758 | 11,155 | |||||||||
|
|
|
|
|
|
|
|||||||
| Total assets |
$ | 1,251,060 | $ | 1,284,479 | $ | 1,287,531 | ||||||
|
|
|
|
|
|
|
|||||||
F-37
Table of Contents
| 2013 | 2012 | 2011 | ||||||||||
| Revenue by product:* |
||||||||||||
| Aggregates |
$ | 159,019 | $ | 146,991 | $ | 116,082 | ||||||
| Cement |
76,211 | 77,676 | 69,664 | |||||||||
| Ready-mixed concrete |
112,878 | 100,941 | 94,302 | |||||||||
| Asphalt |
219,811 | 242,458 | 182,952 | |||||||||
| Construction and paving |
478,280 | 505,189 | 464,866 | |||||||||
| Other |
(129,998 | ) | (147,001 | ) | (138,790 | ) | ||||||
|
|
|
|
|
|
|
|||||||
| Total revenue |
$ | 916,201 | $ | 926,254 | $ | 789,076 | ||||||
|
|
|
|
|
|
|
|||||||
| * | Revenue by product includes intracompany sales transferred at market value. The elimination of intracompany transactions is included in Other. |
(21) Subsequent Events
The Company has evaluated subsequent events through October 8, 2014, the date the financial statements were available to be issued.
Senior Notes—On September 8, 2014 and January 17, 2014, Summit Materials, LLC and Summit Materials Finance Corp. issued and sold $115.0 million and $260.0 million, respectively, aggregate principal amount of their 10 1⁄2% Senior Notes due 2020 (the “Additional Notes”), which mature on January 31, 2020, pursuant to an indenture governing the $250.0 million aggregate principal amount of 10 1⁄2% Senior Notes due 2020 that were issued on January 30, 2012 (the “Existing Notes”). The Additional Notes are treated as a single series with the Existing Notes and have substantially the same terms as those of the Existing Notes. The Additional Notes and the Existing Notes will vote as one class under the Indenture.
Acquisitions—On October 3, 2014, the Company acquired the stock of Concrete Supply of Topeka, Inc. and all of the membership interests of Penny’s Concrete and Ready Mix, L.L.C. and Builders Choice Concrete Company of Missouri, L.L.C.
On September 30, 2014, the Company acquired all of the outstanding ownership interests in Colorado County Sand & Gravel Co., L.L.C., a Texas limited liability company, M & M Gravel Sales, Inc., a Texas corporation, Marek Materials Co. Operating, Ltd., a Texas limited partnership, and Marek Materials Co., L.L.C., a Texas limited liability company, (collectively the “Colorado County S&G”). Colorado County S&G provide aggregates to the West Houston, Texas market.
On September 19, 2014, the Company acquired all of the membership interests of Southwest Ready-Mix LLC, which included two ready-mixed concrete plants and serves the downtown and southwest Houston, Texas markets.
On September 4, 2014, the Company acquired all of the issued and outstanding shares and certain shareholder notes of Rock Head Holdings Ltd. and B.I.M. Holdings Ltd., which collectively indirectly own all the shares of Mainland Sand and Gravel Ltd. Mainland Sand and Gravel Ltd., based in Surrey, British Columbia, is a supplier of construction aggregates to the Vancouver metropolitan area.
On July 29, 2014, the Company acquired all of the assets of Canyon Redi-Mix, Inc., and CRM Mixers LP. The acquired assets include two ready-mixed plants, which serve the Permian Basin region of West Texas.
On June 9, 2014, the Company acquired all of the membership interests of Buckhorn Materials, LLC, an aggregates quarry in South Carolina, and Construction Materials Group LLC, a sand pit in South Carolina.
F-38
Table of Contents
On March 31, 2014, the Company acquired all of the stock of Troy Vines, Incorporated, an integrated aggregates and ready-mixed concrete business headquartered in Midland, Texas, which serves the Permian Basin region of West Texas.
On January 17, 2014, the Company completed its acquisition of Alleyton Resource Corporation, a Texas corporation, and Colorado Gulf, LP, a Texas limited partnership, and certain real property from Barten Shepard Investments, LP, a Texas limited partnership (“BSI”), collectively, referred to as “Alleyton”, for approximately $179.25 million, with an additional $30.75 million in deferred and contingent payments. The Alleyton acquisition consideration was funded through a portion of the net proceeds from the issue and sale of the Additional Notes.
F-39
Table of Contents
SUMMIT MATERIALS HOLDINGS L.P. AND SUBSIDIARIES
(In thousands, except partners’ interest amounts)
| September 27, | December 28, | |||||||
| 2014 | 2013 | |||||||
| (unaudited) | (audited) | |||||||
| Assets | ||||||||
| Current assets: |
||||||||
| Cash |
$ | 9,995 | $ | 18,183 | ||||
| Accounts receivable, net |
179,328 | 99,337 | ||||||
| Costs and estimated earnings in excess of billings |
26,542 | 10,767 | ||||||
| Inventories |
111,137 | 96,432 | ||||||
| Other current assets |
16,157 | 13,181 | ||||||
|
|
|
|
|
|||||
| Total current assets |
343,159 | 237,900 | ||||||
| Property, plant and equipment, less accumulated depreciation, depletion and amortization (September 27, 2014—$261,614 and December 28, 2013—$212,382) |
946,980 | 831,778 | ||||||
| Goodwill |
390,338 | 127,038 | ||||||
| Intangible assets, less accumulated amortization (September 27, 2014—$2,743 and December 28, 2013—$2,193) |
18,026 | 15,147 | ||||||
| Other assets |
51,255 | 39,197 | ||||||
|
|
|
|
|
|||||
| Total assets |
$ | 1,749,758 | $ | 1,251,060 | ||||
|
|
|
|
|
|||||
| Liabilities, Redeemable Noncontrolling Interest and Partners’ Interest | ||||||||
| Current liabilities: |
||||||||
| Current portion of debt |
$ | 28,187 | $ | 30,220 | ||||
| Current portion of acquisition-related liabilities |
20,571 | 10,635 | ||||||
| Accounts payable |
87,604 | 72,104 | ||||||
| Accrued expenses |
87,513 | 57,251 | ||||||
| Billings in excess of costs and estimated earnings |
9,533 | 9,263 | ||||||
|
|
|
|
|
|||||
| Total current liabilities |
233,408 | 179,473 | ||||||
| Long-term debt |
1,062,921 | 658,767 | ||||||
| Acquisition-related liabilities |
41,287 | 23,756 | ||||||
| Other noncurrent liabilities |
86,242 | 77,480 | ||||||
|
|
|
|
|
|||||
| Total liabilities |
1,423,858 | 939,476 | ||||||
|
|
|
|
|
|||||
| Commitments and contingencies (see note 10) |
||||||||
| Redeemable noncontrolling interest |
31,820 | 24,767 | ||||||
| Partners’ interest: |
||||||||
| Class A interests, 31,502 and 31,261 interests authorized, issued and outstanding September 27, 2014 and December 28, 2013 |
466,610 | 463,010 | ||||||
| Class B interests, 2,607 and 1,220 interests authorized, issued and outstanding September 27, 2014 and December 28, 2013 |
39,750 | 19,000 | ||||||
| Class C interests, 381 and 363 interests authorized, issued and outstanding September 27, 2014 and December 28, 2013 |
— | — | ||||||
| Class D interests, 9,478 and 9,889 interests authorized, issued and outstanding as of September 27, 2014 and December 28, 2013, respectively |
— | — | ||||||
| Additional paid-in capital |
11,796 | 8,152 | ||||||
| Accumulated deficit |
(218,128 | ) | (198,511 | ) | ||||
| Accumulated other comprehensive loss |
(7,236 | ) | (6,045 | ) | ||||
|
|
|
|
|
|||||
| Partners’ interest |
292,792 | 285,606 | ||||||
| Noncontrolling interest |
1,288 | 1,211 | ||||||
|
|
|
|
|
|||||
| Total partners’ interest |
294,080 | 286,817 | ||||||
|
|
|
|
|
|||||
| Total liabilities, redeemable noncontrolling interest and partners’ interest |
$ | 1,749,758 | $ | 1,251,060 | ||||
|
|
|
|
|
|||||
See notes to unaudited consolidated financial statements.
F-40
Table of Contents
SUMMIT MATERIALS HOLDINGS L.P. AND SUBSIDIARIES
Unaudited Consolidated Statements of Operations
(In thousands)
| Nine months ended | ||||||||
| September 27, | September 28, | |||||||
| 2014 | 2013 | |||||||
| Revenue: |
||||||||
| Product |
$ | 594,800 | $ | 447,343 | ||||
| Service |
275,345 | 230,591 | ||||||
|
|
|
|
|
|||||
| Total revenue |
870,145 | 677,934 | ||||||
|
|
|
|
|
|||||
| Cost of revenue (excluding items shown separately below): |
||||||||
| Product |
429,576 | 327,536 | ||||||
| Service |
216,358 | 175,662 | ||||||
|
|
|
|
|
|||||
| Total cost of revenue |
645,934 | 503,198 | ||||||
|
|
|
|
|
|||||
| General and administrative expenses |
105,872 | 107,219 | ||||||
| Depreciation, depletion, amortization and accretion |
63,950 | 54,577 | ||||||
| Transaction costs |
7,737 | 3,175 | ||||||
|
|
|
|
|
|||||
| Operating income |
46,652 | 9,765 | ||||||
| Other income, net |
(2,299 | ) | (988 | ) | ||||
| Loss on debt financings |
— | 3,115 | ||||||
| Interest expense |
62,555 | 42,380 | ||||||
|
|
|
|
|
|||||
| Loss from continuing operations before taxes |
(13,604 | ) | (34,742 | ) | ||||
| Income tax benefit |
(2,498 | ) | (1,782 | ) | ||||
|
|
|
|
|
|||||
| Loss from continuing operations |
(11,106 | ) | (32,960 | ) | ||||
| (Income) loss from discontinued operations |
(356 | ) | 257 | |||||
|
|
|
|
|
|||||
| Net loss |
(10,750 | ) | (33,217 | ) | ||||
| Net income attributable to noncontrolling interest |
674 | 1,105 | ||||||
|
|
|
|
|
|||||
| Net loss attributable to partners of Summit Materials Holdings L.P. |
$ | (11,424 | ) | $ | (34,322 | ) | ||
|
|
|
|
|
|||||
See notes to unaudited consolidated financial statements.
F-41
Table of Contents
SUMMIT MATERIALS HOLDINGS L.P. AND SUBSIDIARIES
Unaudited Consolidated Statements of Comprehensive Loss
(In thousands)
| Nine months ended | ||||||||
| September 27, | September 28, | |||||||
| 2014 | 2013 | |||||||
| Net loss |
$ | (10,750 | ) | $ | (33,217 | ) | ||
| Other comprehensive (loss) income: |
||||||||
| Postretirement curtailment adjustment |
(1,346 | ) | — | |||||
| Postretirement liability adjustment |
2,164 | — | ||||||
| Foreign currency translation adjustment |
(1,764 | ) | — | |||||
|
|
|
|
|
|||||
| Other comprehensive loss |
(946 | ) | — | |||||
|
|
|
|
|
|||||
| Comprehensive loss |
(11,696 | ) | (33,217 | ) | ||||
| Less comprehensive income attributable to the noncontrolling interest |
919 | 1,105 | ||||||
|
|
|
|
|
|||||
| Comprehensive loss attributable to partners of Summit Materials Holdings L.P. |
$ | (12,615 | ) | $ | (34,322 | ) | ||
|
|
|
|
|
|||||
See notes to unaudited consolidated financial statements.
F-42
Table of Contents
SUMMIT MATERIALS HOLDINGS L.P. AND SUBSIDIARIES
Unaudited Consolidated Statements of Cash Flows
(In thousands)
| Nine months ended | ||||||||
| September 27, 2014 |
September 28, 2013 |
|||||||
| Cash flow from operating activities: |
||||||||
| Net loss |
$ | (10,750 | ) | $ | (33,217 | ) | ||
| Adjustments to reconcile net loss to net cash (used in) provided by operating activities: |
||||||||
| Depreciation, depletion, amortization and accretion |
67,972 | 56,825 | ||||||
| Financing fee amortization |
495 | 2,450 | ||||||
| Share-based compensation expense |
1,746 | 1,743 | ||||||
| Deferred income tax benefit |
(525 | ) | (2,685 | ) | ||||
| Net (gain) loss on asset disposals |
(219 | ) | 7,709 | |||||
| Loss on debt financings |
— | 2,989 | ||||||
| Other |
(463 | ) | (79 | ) | ||||
| (Increase) decrease in operating assets, net of acquisitions: |
||||||||
| Accounts receivable, net |
(54,463 | ) | (18,797 | ) | ||||
| Inventories |
(3,843 | ) | 700 | |||||
| Costs and estimated earnings in excess of billings |
(15,009 | ) | (21,836 | ) | ||||
| Other current assets |
(3,910 | ) | (1,046 | ) | ||||
| Other assets |
(675 | ) | (800 | ) | ||||
| Increase (decrease) in operating liabilities, net of acquisitions: |
||||||||
| Accounts payable |
9,433 | 10,919 | ||||||
| Accrued expenses |
2,578 | (1,020 | ) | |||||
| Billings in excess of costs and estimated earnings |
270 | (2,421 | ) | |||||
| Other liabilities |
(3,473 | ) | (1,311 | ) | ||||
|
|
|
|
|
|||||
| Net cash (used in) provided by operating activities |
(10,836 | ) | 123 | |||||
|
|
|
|
|
|||||
| Cash flow from investing activities: |
||||||||
| Acquisitions, net of cash acquired |
(351,941 | ) | (60,913 | ) | ||||
| Purchases of property, plant and equipment |
(64,244 | ) | (53,659 | ) | ||||
| Proceeds from the sale of property, plant and equipment |
9,575 | 8,642 | ||||||
| Other |
757 | — | ||||||
|
|
|
|
|
|||||
| Net cash used for investing activities |
(405,853 | ) | (105,930 | ) | ||||
|
|
|
|
|
|||||
| Cash flow from financing activities: |
||||||||
| Proceeds from investment by partners |
24,350 | — | ||||||
| Proceeds from debt issuances |
657,217 | 217,681 | ||||||
| Payments on long-term debt |
(258,337 | ) | (111,884 | ) | ||||
| Payments on acquisition-related liabilities |
(5,807 | ) | (4,923 | ) | ||||
| Financing costs |
(8,834 | ) | (3,291 | ) | ||||
| Other |
(88 | ) | — | |||||
|
|
|
|
|
|||||
| Net cash provided by financing activities |
408,501 | 97,583 | ||||||
|
|
|
|
|
|||||
| Net decrease in cash |
(8,188 | ) | (8,224 | ) | ||||
| Cash—beginning of period |
18,183 | 30,697 | ||||||
|
|
|
|
|
|||||
| Cash—end of period |
$ | 9,995 | $ | 19,207 | ||||
|
|
|
|
|
|||||
See notes to unaudited consolidated financial statements.
F-43
Table of Contents
SUMMIT MATERIALS HOLDINGS L.P. AND SUBSIDIARIES
Unaudited Consolidated Statements of Changes in Redeemable Noncontrolling Interest and Partners’ Interest
(In thousands)
| Partners’ Interests | Additional Paid-in Capital |
Accumulated deficit |
Accumulated other comprehensive loss |
Noncontrolling interest |
Total partners’ interest |
Redeemable noncontrolling interest |
||||||||||||||||||||||||||||||||||||||||||
| Class A | Class B | Class C | Class D | Class A | Class B | |||||||||||||||||||||||||||||||||||||||||||
| Balance—December 28, 2013 |
31,261 | 1,220 | 363 | 9,889 | $ | 463,010 | $ | 19,000 | $ | 8,152 | $ | (198,511 | ) | $ | (6,045 | ) | $ | 1,211 | $ | 286,817 | $ | 24,767 | ||||||||||||||||||||||||||
| Contributed capital |
241 | 1,387 | — | — | 3,600 | 20,750 | — | — | — | — | 24,350 | — | ||||||||||||||||||||||||||||||||||||
| Accretion/ redemption value adjustment |
— | — | — | — | — | — | — | (6,211 | ) | — | — | (6,211 | ) | 6,211 | ||||||||||||||||||||||||||||||||||
| Net issuance (redemption) of Class C and Class D Interests |
— | — | 18 | (411 | ) | — | — | — | — | — | — | — | — | |||||||||||||||||||||||||||||||||||
| Net (loss) income |
— | — | — | — | — | — | — | (11,424 | ) | — | 77 | (11,347 | ) | 597 | ||||||||||||||||||||||||||||||||||
| Other comprehensive income |
— | — | — | — | — | — | — | — | (1,191 | ) | — | (1,191 | ) | 245 | ||||||||||||||||||||||||||||||||||
| Repurchase of partners’ interest |
— | — | — | — | — | — | (88 | ) | — | — | — | (88 | ) | — | ||||||||||||||||||||||||||||||||||
| Share-based compensation |
— | — | — | — | — | — | 3,732 | (1,982 | ) | — | — | 1,750 | — | |||||||||||||||||||||||||||||||||||
|
|
|
|
|
|
|
|
|
|
|
|
|
|
|
|
|
|
|
|
|
|
|
|
|
|||||||||||||||||||||||||
| Balance—September 27, 2014 |
31,502 | 2,607 | 381 | 9,478 | $ | 466,610 | $ | 39,750 | $ | 11,796 | $ | (218,128 | ) | $ | (7,236 | ) | $ | 1,288 | $ | 294,080 | $ | 31,820 | ||||||||||||||||||||||||||
|
|
|
|
|
|
|
|
|
|
|
|
|
|
|
|
|
|
|
|
|
|
|
|
|
|||||||||||||||||||||||||
| Balance—December 29, 2012 |
31,261 | 1,220 | 363 | 8,565 | $ | 463,010 | $ | 19,000 | $ | 5,840 | $ | (94,085 | ) | $ | (9,130 | ) | $ | 1,059 | $ | 385,694 | $ | 22,850 | ||||||||||||||||||||||||||
| Accretion/redemption value adjustment |
— | — | — | — | — | — | — | 509 | — | — | 509 | (509 | ) | |||||||||||||||||||||||||||||||||||
| Net issuance of Class C and Class D Interests |
— | — | — | 1,348 | — | — | — | — | — | — | — | — | ||||||||||||||||||||||||||||||||||||
| Net (loss) income |
— | — | — | — | — | — | — | (34,322 | ) | — | 146 | (34,176 | ) | 959 | ||||||||||||||||||||||||||||||||||
| Share-based compensation |
— | — | — | — | — | — | 1,114 | — | — | — | 1,114 | — | ||||||||||||||||||||||||||||||||||||
|
|
|
|
|
|
|
|
|
|
|
|
|
|
|
|
|
|
|
|
|
|
|
|
|
|||||||||||||||||||||||||
| Balance—September 28, 2013 |
31,261 | 1,220 | 363 | 9,913 | $ | 463,010 | $ | 19,000 | $ | 6,954 | $ | (127,898 | ) | $ | (9,130 | ) | $ | 1,205 | $ | 353,141 | $ | 23,300 | ||||||||||||||||||||||||||
|
|
|
|
|
|
|
|
|
|
|
|
|
|
|
|
|
|
|
|
|
|
|
|
|
|||||||||||||||||||||||||
See notes to unaudited consolidated financial statements.
F-44
Table of Contents
NOTES TO UNAUDITED CONSOLIDATED FINANCIAL STATEMENTS
(Tables in thousands, except partners’ interest amounts)
1. SUMMARY OF ORGANIZATION AND SIGNIFICANT ACCOUNTING POLICIES
Summit Materials Holdings L.P. (“Summit Materials”) is a vertically integrated heavy-side construction materials company. Summit Materials, through its subsidiaries (collectively, the “Company”), it is engaged in the production and sale of aggregates, cement, ready-mixed concrete, asphalt paving mix and concrete products. The Company owns and operates quarries, sand and gravel pits, a cement plant, cement distribution terminals, ready-mixed concrete plants, asphalt plants and landfill sites. It is also engaged in paving and related services. The Company is organized by geographic region and has three operating segments, which are also its reporting segments: the West; Central; and East regions.
Summit Materials majority owners are certain investment funds affiliated with Blackstone Capital Partners V L.P.
The consolidated financial statements of the Company include the accounts of Summit Materials and its wholly and non-wholly owned subsidiaries. All significant intercompany balances and transactions have been eliminated.
Basis of Presentation—These unaudited consolidated financial statements were prepared in accordance with U.S. generally accepted accounting principles (“U.S. GAAP”) for interim financial information, without audit, pursuant to the rules and regulations of the Securities and Exchange Commission. Certain information and footnote disclosures typically included in financial statements prepared in accordance with U.S. GAAP have been condensed or omitted pursuant to such rules and regulations. These unaudited consolidated financial statements should be read in conjunction with the Company’s audited consolidated financial statements and the notes thereto as of and for the year ended December 28, 2013. The Company continues to follow the accounting policies set forth in those consolidated financial statements. Management believes that these consolidated interim financial statements include all adjustments, normal and recurring in nature, that are necessary to present fairly the financial position of the Company as of September 27, 2014, the results of operations and cash flows for the nine months ended September 27, 2014 and September 28, 2013.
The Company’s fiscal year is based on a 52-53 week year with each quarter composed of 13 weeks ending on a Saturday. The 53-week year occurs approximately once every seven years. The additional week in the 53-week year will be included in the fourth quarter. The Company’s third quarter ended on September 27 and September 28 in 2014 and 2013, respectively. In 2013, Continental Cement Company, L.L.C. (“Continental Cement”), an indirect majority owned subsidiary of Summit Materials, changed its fiscal year to be consistent with the Company’s fiscal year. Prior to fiscal 2013, Continental Cement’s fiscal year was based on the calendar year with quarter-end dates of March 31, June 30, September 30 and December 31. The effect of this change to the Company’s financial position, results of operations and liquidity was immaterial.
Substantially all of the Company’s products and services are produced, consumed and performed outdoors, primarily in the spring, summer and fall. Seasonal changes and other weather-related conditions can affect the production and sales volumes of its products and delivery of its services. Therefore, the financial results for any interim period are not necessarily indicative of the results expected for the full year. Furthermore, the Company’s sales and earnings are sensitive to national, regional and local economic conditions and to cyclical changes in construction spending, among other factors.
Use of Estimates—Preparation of these consolidated financial statements in conformity with U.S. GAAP requires management to make estimates and assumptions. These estimates and the underlying assumptions affect the amounts of assets and liabilities reported, disclosures about contingent assets and liabilities and reported amounts of revenue and expenses. Such estimates include the valuation of accounts receivable,
F-45
Table of Contents
inventories, goodwill, intangibles and other long-lived assets, pension and other postretirement obligations and asset retirement obligations. Estimates also include revenue earned on contracts and costs to complete contracts. Most of the Company’s paving and related services are performed under fixed unit-price contracts with state and local governmental entities. Management regularly evaluates its estimates and assumptions based on historical experience and other factors, including the current economic environment. Management adjusts such estimates and assumptions when circumstances dictate. As future events and their effects cannot be determined with precision, actual results can differ significantly from estimates made. Changes in estimates, including those resulting from continuing changes in the economic environment, are reflected in the Company’s consolidated financial statements when the change in estimate occurs.
Business and Credit Concentrations—The Company’s operations are conducted primarily across 17 U.S. states and in Vancouver, Canada, with the most significant revenue generated in Texas, Kansas, Kentucky, Utah and Missouri. The Company’s accounts receivable consist primarily of amounts due from customers within these areas. Therefore, collection of these accounts is dependent on the economic conditions in the aforementioned states, as well as specific situations affecting individual customers. Credit granted within the Company’s trade areas has been granted to many customers, and management does not believe that any significant concentrations of credit exist with respect to individual customers or groups of customers. No single customer accounted for more than 10% of total revenue in the nine months ended September 27, 2014 and September 28, 2013.
Fair Value Measurements—Certain acquisitions made by the Company require the payment of contingent amounts of purchase consideration. These payments are contingent on specified operating results being achieved in periods subsequent to the acquisition and will not be made if earn-out thresholds are not achieved. Contingent consideration obligations are measured at fair value each reporting period, and any adjustments to fair value are recognized in earnings in the period identified. As of September 27, 2014 and December 28, 2013, contingent consideration obligations of $3.8 million and $1.9 million, respectively, were included in the non-current portion of acquisition-related liabilities and, as of September 27, 2014, $2.5 million was included in the current portion of acquisition related liabilities. The increase in contingent consideration obligations from December 28, 2013 relates to the January 17, 2014 acquisition of Alleyton Resource Corporation, Colorado Gulf, LP and certain assets of Barten Shepard Investments, LP (collectively, “Alleyton”).
The fair value of the contingent consideration obligations approximated their carrying value of $6.3 million and $1.9 million as of September 27, 2014 and December 28, 2013, respectively. The fair values are based on unobservable, or Level 3, inputs, including projected probability-weighted cash payments and an 11.0% discount rate, which reflects a market discount rate. Changes in fair value may occur as a result of a change in actual or projected cash payments, the probability weightings applied by the Company to projected payments or a change in the discount rate. Significant increases or decreases in any of these inputs in isolation could result in a lower, or higher, fair value measurement. There were no material valuation adjustments to contingent consideration obligations in the nine months ended September 27, 2014 or September 28, 2013.
Financial Instruments—The Company’s financial instruments include certain acquisition-related liabilities (deferred consideration and noncompete obligations) and debt. The fair value of the deferred consideration and noncompete obligations approximate their carrying value of $49.1 million and $6.5 million, respectively, as of September 27, 2014, and $28.3 million and $4.2 million, respectively, as of December 28, 2013. The $23.1 million net increase in the deferred consideration and noncompete obligations relate to the acquisitions completed in 2014. The fair value was determined based on unobservable, or Level 3 inputs, including the cash payment terms in the purchase agreements and a discount rate reflecting the Company’s credit risk.
The fair value of long-term debt approximated $1,104.2 million and $696.5 million as of September 27, 2014 and December 28, 2013, respectively, compared to its carrying value of $1,041.7 million and $663.0 million, respectively. Fair value was determined based on observable, or Level 2 inputs, such as interest rates, bond yields and quoted prices in inactive markets.
F-46
Table of Contents
Redeemable Noncontrolling Interest— Continental Cement’s Class A Units represent a 70% economic interest in that business and the Class B Units represent a 30% economic interest. The holders of the Class B Units have a put option that allows them to put the Class B Units to Continental Cement’s parent company, a wholly-owned subsidiary of Summit Materials, at a strike price that approximates fair value. The put option is exercisable upon a sale of Summit Materials Holdings L.P. or at any time after May 2016. As a consequence of the put option, the Class B Units are classified in temporary equity. The initial redemption value of the Class B Units was based upon the estimated fair value of Continental Cement at the date the Class A Units were indirectly acquired by Summit Materials (May 2010). At that time, the Company elected to accrete changes in the redemption value from the date of issuance to the earliest anticipated redemption date, which is assumed to be May 2016. The accretion is recognized through an adjustment to accumulated deficit and increased in 2014 consistent with the redemption value increase to an estimated $65.1 million. In the nine months ended September 27, 2014 2014, the Company performed an indirect valuation of the noncontrolling interest. The valuation was based on unobservable, or Level 3, inputs, including an assumption on the timing of settlement and projected cash flows. A significant change in these inputs could result in a material increase, or decrease, in the redemption value of the noncontrolling interest.
2. ACQUISITIONS
The Company completed a number of immaterial acquisitions during 2014 and 2013. The operating results of the acquired businesses have been included in the Company’s results of operations since the respective dates of the acquisitions. Assets acquired and liabilities assumed are measured at their acquisition-date fair value. Goodwill recognized in connection with the acquisitions is primarily attributable to the expected profitability, assembled workforces and operational infrastructure of the acquired businesses and the synergies expected to result after integration of those acquired businesses. The purchase price allocation for the 2014 acquisitions has not been finalized due to the recent timing of the acquisitions.
2014 Acquisitions
West region
| • | On September 19, 2014, the Company acquired all of the membership interests of Southwest Ready-Mix LLC, which included two ready-mixed concrete plants and serves the downtown and southwest Houston, Texas markets. The acquisition was funded with borrowings under the Company’s revolving credit facility. |
| • | On September 4, 2014, the Company acquired all of the issued and outstanding shares and certain shareholder notes of Rock Head Holdings Ltd. and B.I.M. Holdings Ltd., which collectively indirectly owned all of Mainland Sand and Gravel Ltd.’s shares. The surviving entity, Mainland Sand & Gravel ULC. (“Mainland”), based in Surrey, British Columbia, is a supplier of aggregates to the Vancouver metropolitan area. The acquisition was funded with a portion of the proceeds from the September 8, 2014 issue and sale of $115.0 million aggregate principal amount of 10 1⁄2% senior notes due 2020. |
| • | On July 29, 2014, we acquired all of the assets of Canyon Redi-Mix, Inc. and CRM Mixers LP. The acquired assets include two ready-mixed concrete plants, which serve the Permian Basin region of West Texas. The acquisition was funded with borrowings under the Company’s revolving credit facility. |
| • | On March 31, 2014, the Company acquired all of the stock of Troy Vines, Inc., an integrated aggregates and ready-mixed concrete business headquartered in Midland, Texas, which serves the Permian Basin region of West Texas. The acquisition was funded with cash on hand. |
| • | On January 17, 2014, the Company acquired all of the membership interests of Alleyton Resource Corporation, Colorado Gulf, LP and certain assets of Barten Shepard Investments, LP, an aggregates and ready-mixed concrete business in Houston, Texas. The Alleyton acquisition was funded with a portion of the proceeds from the January 17, 2014 issue and sale of $260.0 million aggregate principal amount of 10 1⁄2% senior notes due 2020. |
F-47
Table of Contents
East region
| • | On June 9, 2014, the Company acquired all of the membership interests of Buckhorn Materials LLC, an aggregates quarry in South Carolina, and Construction Materials Group LLC, a sand pit in South Carolina. The acquisition was funded with borrowings under the Company’s revolving credit facility. |
Revenue and net income from these acquisitions in the nine months ended September 27, 2014 was $119.9 million and $24.2 million, respectively, of which $102.5 million and $23.2 million, respectively, was attributable to Alleyton and Southwest Ready Mix. Southwest Ready Mix was integrated with Alleyton on the day it was acquired such that disaggregated financial data is not available.
2013 Acquisitions
West region
| • | On April 1, 2013, the Company acquired all of the membership interests of Westroc, LLC, an aggregates and ready-mixed concrete provider near Salt Lake City, Utah, with borrowings under the Company’s revolving credit facility. |
Central region
| • | On April 1, 2013, the Company acquired certain aggregates, ready-mixed concrete and asphalt assets of Lafarge North America, Inc. in and around Wichita, Kansas, with borrowings under the Company’s revolving credit facility. |
Pro Forma Financial Information (unaudited)—The following unaudited supplemental pro forma information presents the financial results as if the 2014 and 2013 acquisitions occurred on the first day of fiscal year 2013 and 2012, respectively. This supplemental pro forma information has been prepared for comparative purposes and does not purport to be indicative of what would have occurred had the 2014 and 2013 acquisitions been made on the first day of fiscal year 2013 or 2012, respectively, nor is it indicative of any future results. The pro forma effect on revenue in the nine months ended September 28, 2013 was $8.6 million and $199.9 million from 2013 and 2014 acquisitions, respectively, and was ($3.4) million and $33.7 million, respectively, on net loss.
| Nine months ended | ||||||||
| September 27, 2014 |
September 28, 2013 |
|||||||
| Revenue |
$ | 954,686 | $ | 886,432 | ||||
| Net income (loss) |
1,231 | (27,106 | ) | |||||
The following table summarizes aggregated information regarding the fair values of the assets acquired and liabilities assumed in conjunction with the 2014 and 2013 acquisitions:
| Alleyton January 17, 2014 |
Nine months ended September 27, 2014 (excluding Alleyton) |
Year ended December 28, 2013 |
||||||||||
| Financial assets |
$ | 14,247 | $ | 15,925 | $ | 8,302 | ||||||
| Inventories |
2,560 | 7,531 | 3,954 | |||||||||
| Property, plant and equipment |
48,197 | 54,247 | 40,580 | |||||||||
| Intangible assets |
— | 3,398 | 7,428 | |||||||||
| Other assets |
2,595 | 1,277 | 52 | |||||||||
| Financial liabilities |
(8,977 | ) | (12,215 | ) | (6,164 | ) | ||||||
| Other long-term liabilities |
(990 | ) | (7,012 | ) | (1,050 | ) | ||||||
|
|
|
|
|
|
|
|||||||
| Net assets acquired |
57,632 | 63,151 | 53,102 | |||||||||
| Goodwill |
147,006 | 117,365 | 16,120 | |||||||||
|
|
|
|
|
|
|
|||||||
| Purchase price |
204,638 | 180,516 | 69,222 | |||||||||
|
|
|
|
|
|
|
|||||||
| Acquisition related liabilities—not contingent |
(18,108 | ) | (7,138 | ) | (7,902 | ) | ||||||
| Acquisition related liabilities— contingent |
(4,015 | ) | — | — | ||||||||
| Other |
(762 | ) | (3,190 | ) | 281 | |||||||
|
|
|
|
|
|
|
|||||||
| Net cash paid for acquisitions |
$ | 181,753 | $ | 170,188 | $ | 61,601 | ||||||
|
|
|
|
|
|
|
|||||||
F-48
Table of Contents
3. GOODWILL
Changes in the carrying amount of goodwill, by reportable segment, from December 28, 2013 to September 27, 2014 are summarized as follows:
| West | Central | East | Total | |||||||||||||
| Balance, December 28, 2013 |
$ | 54,249 | $ | 72,789 | $ | — | $ | 127,038 | ||||||||
| Acquisitions |
238,211 | — | 26,160 | 264,371 | ||||||||||||
| Foreign currency translation adjustments |
(1,071 | ) | — | — | (1,071 | ) | ||||||||||
|
|
|
|
|
|
|
|
|
|||||||||
| Balance, September 27, 2014 |
$ | 291,389 | $ | 72,789 | $ | 26,160 | $ | 390,338 | ||||||||
|
|
|
|
|
|
|
|
|
|||||||||
4. ACCOUNTS RECEIVABLE, NET
Accounts receivable, net consisted of the following as of September 27, 2014 and December 28, 2013:
| September 27, 2014 |
December 28, 2013 |
|||||||
| Trade accounts receivable |
$ | 168,436 | $ | 85,188 | ||||
| Retention receivables |
11,429 | 15,966 | ||||||
| Receivables from related parties |
1,650 | 202 | ||||||
|
|
|
|
|
|||||
| Accounts receivable |
181,515 | 101,356 | ||||||
| Less: Allowance for doubtful accounts |
(2,187 | ) | (2,019 | ) | ||||
|
|
|
|
|
|||||
| Accounts receivable, net |
$ | 179,328 | $ | 99,337 | ||||
|
|
|
|
|
|||||
Retention receivables are amounts earned by the Company but held by customers until paving and related service contracts and projects are near completion or fully completed. Amounts are expected to be billed and collected within one year.
5. INVENTORIES
Inventories consisted of the following as of September 27, 2014 and December 28, 2013:
| September 27, 2014 |
December 28, 2013 |
|||||||
| Aggregate stockpiles |
$ | 79,961 | $ | 70,300 | ||||
| Finished goods |
13,083 | 11,207 | ||||||
| Work in process |
2,214 | 2,623 | ||||||
| Raw materials |
15,879 | 12,302 | ||||||
|
|
|
|
|
|||||
| Total |
$ | 111,137 | $ | 96,432 | ||||
|
|
|
|
|
|||||
6. ACCRUED EXPENSES
Accrued expenses consisted of the following as of September 27, 2014 and December 28, 2013:
| September 27, 2014 |
December 28, 2013 |
|||||||
| Interest |
$ | 16,105 | $ | 17,294 | ||||
| Payroll and benefits |
19,173 | 16,368 | ||||||
| Capital lease obligations |
17,413 | 2,068 | ||||||
| Insurance |
10,505 | 7,445 | ||||||
| Taxes(1) |
8,235 | 4,168 | ||||||
| Professional fees |
3,445 | 2,352 | ||||||
| Other(2) |
12,637 | 7,556 | ||||||
|
|
|
|
|
|||||
| Total |
$ | 87,513 | $ | 57,251 | ||||
|
|
|
|
|
|||||
F-49
Table of Contents
| (1) | Consists primarily of real estate, personal property and sales taxes. |
| (2) | Consists primarily of subcontractor and working capital settlement accruals. |
7. DEBT
Debt consisted of the following as of September 27, 2014 and December 28, 2013:
| September 27, 2014 |
December 28, 2013 |
|||||||
| Revolving credit facility |
$ | 23,967 | $ | 26,000 | ||||
|
|
|
|
|
|||||
| Long-term debt: |
||||||||
| $625.0 million senior notes, including a $27.9 million net premium at September 27, 2014 and $250 million senior notes, net of $4.0 million discount at December 28, 2013 |
652,861 | 245,971 | ||||||
| $416.7 million credit facility, term loan, net of $2.4 million and $2.9 million discount at September 27, 2014 and December 28, 2013, respectively |
414,280 | 417,016 | ||||||
|
|
|
|
|
|||||
| Total |
1,067,141 | 662,987 | ||||||
| Current portion of long-term debt |
4,220 | 4,220 | ||||||
|
|
|
|
|
|||||
| Long-term debt |
$ | 1,062,921 | $ | 658,767 | ||||
|
|
|
|
|
|||||
The contractual payments of long-term debt, including current maturities, for the five years subsequent to September 27, 2014, are as follows:
| 2014 (three months) |
$ | 1,055 | ||
| 2015 |
5,275 | |||
| 2016 |
4,220 | |||
| 2017 |
4,220 | |||
| 2018 |
3,165 | |||
| 2019 |
398,790 | |||
| Thereafter |
625,000 | |||
|
|
|
|||
| Total |
1,041,725 | |||
| Plus: Original issue net premium |
25,416 | |||
|
|
|
|||
| Total debt |
$ | 1,067,141 | ||
|
|
|
Senior Notes—The Company’s wholly-owned subsidiaries, Summit Materials, LLC and Summit Materials Finance Corp. (“Finance Corp.” and, together with Summit Materials, LLC, the “Issuers”), are co-issuers of the 10 1⁄2% Senior Notes due January 31, 2020 (the “Senior Notes”) that have been issued under an indenture dated as of January 30, 2012 (as amended and supplemented, the “Indenture”). The Senior Notes bear interest at 10.5% per year, payable semi-annually in arrears. The Indenture contains covenants limiting, among other things, the ability of Summit Materials, LLC and its restricted subsidiaries to incur additional indebtedness or issue certain preferred shares, pay dividends, redeem stock or make other distributions, make certain investments, sell or transfer certain assets, create liens, consolidate, merge, sell or otherwise dispose of all or substantially all of Summit Materials, LLC’s assets, enter into certain transactions with affiliates, and designate subsidiaries as unrestricted subsidiaries. The Indenture also contains customary events of default.
The Issuers issued $250.0 million aggregate principal amount of Senior Notes (the “Existing Notes”) in January 2012. On January 17, 2014 and September 8, 2014, the Issuers issued an additional $260.0 million
F-50
Table of Contents
and $115.0 million, respectively, aggregate principal amount of Senior Notes (the “Additional Notes”), receiving proceeds of $409.3 million, before payment of fees and expenses and including a $34.3 million premium. The proceeds from the sale of the Additional Notes were used for the purchases of Alleyton and Mainland, to make payments on Summit Materials, LLC’s revolver and for general corporate purposes. The Additional Notes are treated as a single series with the Existing Notes and have substantially the same terms as those of the Existing Notes. The Additional Notes and the Existing Notes vote as one class under the Indenture.
Senior Secured Credit Facilities—Summit Materials, LLC has senior secured credit facilities (the “Senior Secured Credit Facilities”) providing for term loans in an aggregate amount of $422.0 million (the “Term Debt”) and revolving credit commitments in an aggregate amount of $150.0 million. Summit Materials, LLC is required to make principal repayments of 0.25% of borrowings under the Term Debt on the last business day of each March, June, September and December. The current outstanding principal amount of Term Debt and applicable interest rate reflect the terms of a repricing consummated by Summit Materials, LLC in February 2013, which included additional borrowings of $25.0 million, an interest rate reduction of 1.0% and a deferral of the March 2013 principal payment. The unpaid principal balance of Term Debt is due in full on the maturity date, which is January 30, 2019. On January 16, 2014, the Senior Secured Credit Facilities were amended to allow for the issuance of $260.0 million of additional senior notes.
The revolving credit facility matures on January 30, 2017 and bears interest per annum equal to an applicable margin of 3.25% plus, at Summit Material, LLC’s option, either (i) a base rate determined by reference to the highest of (a) the federal funds rate plus 0.50%, (b) the prime rate of Bank of America, N.A. and (c) the British Bankers Association London Interbank Offered Rate (“LIBOR”) plus 1.00% or (ii) a British Bankers Association LIBOR rate determined by reference to Reuters prior to the interest period relevant to such borrowing adjusted for certain additional costs. As of September 27, 2014, the borrowing capacity under the revolving credit facility was $102.7 million, which is net of $23.3 million of outstanding letters of credit. The outstanding letters of credit are renewed annually and support required bonding on construction projects and Summit Materials, LLC’s insurance liabilities.
Summit Materials, LLC must adhere to certain financial covenants, including a first lien net leverage ratio and an interest leverage ratio, related to its borrowings under the Senior Secured Credit Facilities. The consolidated first lien net leverage ratio, reported each quarter, should be no greater than 4.75:1.0 from April 1, 2012 through June 30, 2014; 4.50:1.0 from July 1, 2014 to June 30, 2015, and 4.25:1.0 thereafter. The interest coverage ratio must be at least 1.70:1.0 from January 1, 2013 to December 31, 2014 and 1.85:1.0 thereafter. As of September 27, 2014 and December 28, 2013, Summit Materials, LLC was in compliance with all covenants applicable to the Senior Notes and the Senior Secured Credit Facilities.
Summit Materials, LLC’s domestic wholly-owned subsidiary companies and its non-wholly-owned subsidiary, Continental Cement, are named as issuers or guarantors, as applicable, of the Senior Notes and the Senior Secured Credit Facilities. In addition, Summit Materials, LLC has pledged substantially all of its assets as collateral for the Senior Secured Credit Facilities.
Accrued interest on long-term debt as of September 27, 2014 and December 28, 2013 was $15.9 million and $16.5 million, respectively. Interest expense related to the debt totaled $56.4 million and $37.5 million for the nine months ended September 27, 2014 and September 28, 2013, respectively. As of September 27, 2014 and December 28, 2013, $17.9 million and $11.5 million, respectively, of deferred financing fees were being amortized over the term of the debt using the effective interest method.
F-51
Table of Contents
8. ACCUMULATED OTHER COMPREHENSIVE LOSS
The changes in each component of accumulated other comprehensive loss consisted of the following:
| Change in retirement plans |
Foreign currency translation adjustments |
Accumulated other comprehensive loss |
||||||||||
| Balance—December 28, 2013 |
$ | (6,045 | ) | $ | — | $ | (6,045 | ) | ||||
| Postretirement curtailment adjustment |
(942 | ) | — | (942 | ) | |||||||
| Postretirement liability adjustment |
1,515 | — | 1,515 | |||||||||
| Foreign currency translation adjustment |
— | (1,764 | ) | (1,764 | ) | |||||||
|
|
|
|
|
|
|
|||||||
| Balance—September 27, 2014 |
$ | (5,472 | ) | $ | (1,764 | ) | $ | (7,236 | ) | |||
|
|
|
|
|
|
|
|||||||
9. INCOME TAXES
Summit Materials is a limited partnership and passes its tax attributes for federal and state tax purposes to its partners and is generally not subject to federal or state income tax. However, certain subsidiary entities file federal and state income tax returns due to their status as C corporations. The provision for income taxes is primarily composed of federal, state and local income taxes for the subsidiary entities that have C corporation status.
The effective income tax rate for these entities differs from the statutory federal rate primarily due to (1) tax depletion expense in excess of the expense recorded under U.S. GAAP, (2) state income taxes and the effect of graduated tax rates and (3) certain non-recurring items, such as differences in the treatment of transaction costs, which are often not deductible for tax purposes.
As of September 27, 2014 and December 28, 2013, the Company has not recognized any liabilities for uncertain tax positions. The Company records interest and penalties as a component of the income tax provision. No material interest or penalties were recognized in income tax expense for the nine months ended September 27, 2014 and September 28, 2013.
10. COMMITMENTS AND CONTINGENCIES
The Company is party to certain legal actions arising from the ordinary course of business activities. Accruals are recorded when the outcome is probable and can be reasonably estimated. While the ultimate results of claims and litigation cannot be predicted with certainty, management expects that the ultimate resolution of all pending or threatened claims and litigation will not have a material effect on the Company’s consolidated results of operations, financial position or liquidity. The Company’s policy is to record legal fees as incurred.
Litigation and Claims—The Company is obligated under an indemnification agreement entered into with the sellers of Harper Contracting, Inc., Harper Sand and Gravel, Inc., Harper Ready Mix Company, Inc. and Harper Investments, Inc. (collectively, “Harper”) for the sellers’ ownership interests in a joint venture agreement. The Company has the rights to any benefits under the joint venture as well as the assumption of any obligations, but does not own equity interests in the joint venture. The joint venture incurred significant losses on a highway project in Utah, which resulted in requests for funding from the joint venture partners and, ultimately, from the Company. Through September 27, 2014, the Company has funded $8.8 million, of which $4.0 million was funded in 2012 and $4.8 million was funded in 2011. As of September 27, 2014 and December 28, 2013, an accrual of $4.3 million was recorded in other noncurrent liabilities for this matter.
During the ordinary course of business, there may be revisions to project costs and conditions that can give rise to change orders on construction contracts. Revisions can also result in claims made against a customer
F-52
Table of Contents
or subcontractor to recover project variances that have not been satisfactorily addressed through change orders with a customer. As of September 27, 2014 and December 28, 2013, unapproved change orders and claims totaled $3.9 million ($0.5 million in costs and estimated earnings in excess of billings, $1.2 million in accounts receivable and $2.2 million in other assets) and $3.2 million ($0.5 million in costs and estimated earnings in excess of billings and $2.7 million in other assets), respectively.
Environmental Remediation—The Company’s operations are subject to and affected by federal, state and local laws and regulations relating to the environment, health and safety and other regulatory matters. These operations require environmental operating permits, which are subject to modification, renewal and revocation. Management regularly monitors and reviews its operations, procedures and policies for compliance with these laws and regulations. Despite these compliance efforts, risk of environmental liability is inherent in the operation of the Company’s business, as it is with other companies engaged in similar businesses, and there can be no assurance that environmental liabilities will not have a material adverse effect on the Company’s consolidated financial position, results of operations or liquidity in the future.
Other—In February 2011, the Company incurred a property loss related to a sunken barge with cement product aboard. During the nine months ended September 28, 2013, the Company recorded a $1.8 million charge for costs to remove the barge from the waterway. As of September 27, 2014 and December 28, 2013, the Company had $0.4 million and $0.9 million, respectively, included in accrued expenses as management’s best estimate of the remaining costs to remove the barge.
In the ordinary course of business, the Company enters into various firm purchase commitments for certain raw materials and services. The terms of the purchase commitments are generally less than one year. Management does not expect any significant changes in the market value of these goods and services during the commitment period that would have a material adverse effect on the financial position, results of operations or liquidity of the Company.
11. SUPPLEMENTAL CASH FLOW INFORMATION
Supplemental cash flow information is as follows:
| Nine months ended | ||||||||
| September 27, 2014 |
September 28, 2013 |
|||||||
| Cash payments: |
||||||||
| Interest |
$ | 59,179 | $ | 45,558 | ||||
| Income taxes |
1,345 | 653 | ||||||
12. SEGMENT INFORMATION
The Company has determined that it has three operating segments, which are its reportable segments: the West; Central; and East regions. These segments are consistent with the Company’s management reporting structure. Each region’s operations consist of various activities related to the production, distribution and sale of heavy-side construction materials, products and the provision of paving and related services. The operating results of each segment are regularly reviewed and evaluated separately by the Chief Executive Officer, the Company’s Chief Operating Decision Maker (“CODM”). The CODM primarily evaluates the performance of its segments and allocates resources to them based on a segment profit metric that we call Adjusted EBITDA, which is computed as earnings from continuing operations before interest, taxes, depreciation, depletion, amortization, accretion and goodwill impairment. In addition, certain items such as management fees are excluded from the calculation of segment profit. Assets employed by segment include assets directly identified with those operations. Corporate assets consist primarily of cash, property, plant and equipment for corporate operations and other assets not directly identifiable with a reportable business segment. The
F-53
Table of Contents
accounting policies applicable to each segment are consistent with those used in preparing the consolidated financial statements. The following tables display selected financial data for the Company’s reportable segments:
| Nine months ended | ||||||||
| September 27, 2014 |
September 28, 2013 |
|||||||
| Revenue: |
||||||||
| West region |
$ | 478,432 | $ | 322,640 | ||||
| Central region |
283,541 | 244,207 | ||||||
| East region |
108,172 | 111,087 | ||||||
|
|
|
|
|
|||||
| Total revenue |
$ | 870,145 | $ | 677,934 | ||||
|
|
|
|
|
|||||
| Nine months ended | ||||||||
| September 27, 2014 |
September 28, 2013 |
|||||||
| Adjusted EBITDA: |
||||||||
| West region |
$ | 71,646 | $ | 19,260 | ||||
| Central region |
59,220 | 49,892 | ||||||
| East region |
10,462 | 10,790 | ||||||
| Corporate and other |
(28,427 | ) | (17,727 | ) | ||||
|
|
|
|
|
|||||
| Total reportable segments and corporate |
112,901 | 62,215 | ||||||
| Interest expense |
62,555 | 42,380 | ||||||
| Depreciation, depletion, amortization and accretion |
63,950 | 54,577 | ||||||
|
|
|
|
|
|||||
| Income (loss) from continuing operations before taxes |
$ | (13,604 | ) | $ | (34,742 | ) | ||
|
|
|
|
|
|||||
| Nine months ended | ||||||||
| September 27, 2014 |
September 28, 2013 |
|||||||
| Cash paid for capital expenditures: |
||||||||
| West region |
$ | 25,496 | $ | 17,912 | ||||
| Central region |
28,485 | 26,581 | ||||||
| East region |
6,590 | 7,045 | ||||||
|
|
|
|
|
|||||
| Total reportable segments |
60,571 | 51,538 | ||||||
| Corporate and other |
3,673 | 2,121 | ||||||
|
|
|
|
|
|||||
| Total capital expenditures |
$ | 64,244 | $ | 53,659 | ||||
|
|
|
|
|
|||||
| Nine months ended | ||||||||
| September 27, 2014 |
September 28, 2013 |
|||||||
| Depreciation, depletion, amortization and accretion: |
||||||||
| West region |
$ | 23,569 | $ | 18,443 | ||||
| Central region |
28,061 | 25,084 | ||||||
| East region |
11,272 | 10,848 | ||||||
|
|
|
|
|
|||||
| Total reportable segments |
62,902 | 54,375 | ||||||
| Corporate and other |
1,048 | 202 | ||||||
|
|
|
|
|
|||||
| Total depreciation, depletion, amortization and accretion |
$ | 63,950 | $ | 54,577 | ||||
|
|
|
|
|
|||||
F-54
Table of Contents
| September 27, 2014 |
December 28, 2013 |
|||||||
| Total assets: |
||||||||
| West region |
$ | 799,319 | $ | 383,544 | ||||
| Central region |
687,219 | 657,421 | ||||||
| East region |
236,033 | 192,486 | ||||||
|
|
|
|
|
|||||
| Total reportable segments |
1,722,571 | 1,233,451 | ||||||
| Corporate and other |
27,187 | 17,609 | ||||||
|
|
|
|
|
|||||
| Total |
$ | 1,749,758 | $ | 1,251,060 | ||||
|
|
|
|
|
|||||
| Nine months ended | ||||||||
| September 27, 2014 |
September 28, 2013 |
|||||||
| Revenue by product:* |
||||||||
| Aggregates |
$ | 160,362 | $ | 119,757 | ||||
| Cement |
66,116 | 59,160 | ||||||
| Ready-mixed concrete |
189,198 | 82,447 | ||||||
| Asphalt |
203,944 | 162,485 | ||||||
| Paving and related services |
390,469 | 343,346 | ||||||
| Other |
(139,944 | ) | (89,261 | ) | ||||
|
|
|
|
|
|||||
| Total revenue |
$ | 870,145 | $ | 677,934 | ||||
|
|
|
|
|
|||||
| * | Revenue by product includes intracompany sales transferred at market value. The elimination of intracompany transactions is included in Other. |
13. RELATED PARTY TRANSACTIONS
The Company incurred certain management fees due to Blackstone Management Partners L.L.C. (“BMP”) totaling $3.3 million and $2.0 million during the nine months ended September 27, 2014 and September 28, 2013, respectively. Under the terms of an agreement with Summit Materials Holdings L.P. and BMP, BMP provides monitoring, advisory and consulting services to the Company. In consideration for these services, the Company pays BMP the greater of $300,000 or 2.0% of the Company’s annual consolidated profit, as defined in the agreement. The management fees paid pursuant to this agreement are included in general and administrative expenses.
BMP also undertakes financial and structural analysis, due diligence investigations, corporate strategy and other advisory services and negotiation assistance related to acquisitions for which the Company pays BMP a transaction fee equal to 1.0% of the aggregate enterprise value of any acquired entity or, if such transaction is structured as an asset purchase or sale, 1.0% of the consideration paid for or received in respect of the assets acquired or disposed. Under the terms of the agreement, BMP is permitted to assign, and has assigned, a portion of the fees to which it is entitled to Silverhawk Summit, L.P. and to certain other equity investors. During the nine months ended September 27, 2014, the Company paid BMP $3.5 million under this agreement and paid immaterial amounts to Silverhawk Summit, L.P. and to other equity investors. The acquisition-related fees paid pursuant to this agreement are included in transaction costs.
Blackstone Advisory Partners L.P., an affiliate of The Blackstone Group L.P., served as an initial purchaser of $13.0 million principal amount of the notes issued in January 2014 and $5.75 million principal amount of the notes issued in September 2014 and received compensation in connection therewith.
In addition to the fees paid to BMP pursuant to the agreements described above, the Company reimburses BMP for direct expenses incurred, which were not material in the nine months ended September 27, 2014 and September 28, 2013.
F-55
Table of Contents
Cement sales to companies owned by a noncontrolling member of Continental Cement were approximately $10.9 million and $10.0 million during the nine months ended September 27, 2014 and September 28, 2013, respectively. Accounts receivables due from the noncontrolling member were $0.5 million and $0.2 million as of September 27, 2014 and December 28, 2013, respectively. In addition, as of December 28, 2013, the Company had accrued interest payments of $0.7 million due to a certain noncontrolling member for a related party note, which the Company paid in the first quarter of 2014. The principal balance on the note was repaid in January 2012.
In the nine months ended September 27, 2014, the Company sold certain assets associated with the production of concrete blocks, including inventory and equipment, to a related party for $2.3 million and sold a ready-mixed concrete plant to a related party in exchange for the related party performing the required site reclamation, estimated at approximately $0.2 million.
14. SUBSEQUENT EVENTS
On October 3, 2014, the Company acquired the stock of Concrete Supply of Topeka, Inc. and all of the membership interests of Penny’s Concrete and Ready Mix, L.L.C. and Builders Choice Concrete Company of Missouri, L.L.C.
On September 30, 2014, the Company acquired all of the outstanding ownership interests in Colorado County Sand & Gravel Co., L.L.C., a Texas limited liability company, M & M Gravel Sales, Inc., a Texas corporation, Marek Materials Co. Operating, Ltd., a Texas limited partnership, and Marek Materials Co., L.L.C., a Texas limited liability company (collectively “Colorado County S&G”). Colorado County S&G provide aggregates to the West Houston, Texas market.
* * *
F-56
Table of Contents
Table of Contents
Shares
Summit Materials, Inc.
Class A Common Stock
Preliminary Prospectus
Citigroup
Goldman, Sachs & Co.
BofA Merrill Lynch
Barclays
Deutsche Bank Securities
RBC Capital Markets
Through and including the 25th day after the date of this prospectus, all dealers that effect transactions in shares of our Class A common stock, whether or not participating in this offering, may be required to deliver a prospectus. This is in addition to the dealers’ obligations to deliver a prospectus when acting as underwriters and with respect to their unsold allotments or subscriptions.
Table of Contents
PART II
INFORMATION NOT REQUIRED IN PROSPECTUS
| ITEM 13. | OTHER EXPENSES OF ISSUANCE AND DISTRIBUTION. |
The following table sets forth the expenses payable by the Registrant expected to be incurred in connection with the issuance and distribution of the shares of Class A common stock being registered hereby (other than underwriting discounts and commissions). All of such expenses are estimates, other than the filing and listing fees payable to the Securities and Exchange Commission, the Financial Industry Regulatory Authority, Inc. and the NYSE.
| Filing Fee—Securities and Exchange Commission |
$ | 11,620 | ||
| Fee—Financial Industry Regulatory Authority, Inc. |
$ | 15,500 | ||
| Listing Fee—NYSE |
$ | 25,000 | ||
| Fees and Expenses of Counsel |
* | |||
| Printing Expenses |
* | |||
| Fees and Expenses of Accountants |
* | |||
| Transfer Agent and Registrar’s Fees |
* | |||
| Miscellaneous Expenses |
* | |||
|
|
|
|||
| Total |
* | |||
|
|
|
| * | To be provided by amendment. |
| ITEM 14. | INDEMNIFICATION OF DIRECTORS AND OFFICERS. |
Section 102(b)(7) of the Delaware General Corporation Law, or DGCL, allows a corporation to provide in its certificate of incorporation that a director of the corporation will not be personally liable to the corporation or its stockholders for monetary damages for breach of fiduciary duty as a director, except where the director breached the duty of loyalty, failed to act in good faith, engaged in intentional misconduct or knowingly violated a law, authorized the payment of a dividend or approved a stock repurchase in violation of Delaware corporate law or obtained an improper personal benefit. Our amended and restated certificate of incorporation will provide for this limitation of liability.
Section 145 of the DGCL, or Section 145, provides, among other things, that a Delaware corporation may indemnify any person who was, is or is threatened to be made, party to any threatened, pending or completed action, suit or proceeding, whether civil, criminal, administrative or investigative (other than an action by or in the right of such corporation), by reason of the fact that such person is or was an officer, director, employee or agent of such corporation or is or was serving at the request of such corporation as a director, officer, employee or agent of another corporation or enterprise. The indemnity may include expenses (including attorneys’ fees), judgments, fines and amounts paid in settlement actually and reasonably incurred by such person in connection with such action, suit or proceeding, provided such person acted in good faith and in a manner he or she reasonably believed to be in or not opposed to the corporation’s best interests and, with respect to any criminal action or proceeding, had no reasonable cause to believe that his or her conduct was illegal. A Delaware corporation may indemnify any persons who were or are a party to any threatened, pending or completed action or suit by or in the right of the corporation by reason of the fact that such person is or was a director, officer, employee or agent of another corporation or enterprise. The indemnity may include expenses (including attorneys’ fees) actually and reasonably incurred by such person in connection with the defense or settlement of such action or suit, provided such person acted in good faith and in a manner he or she reasonably believed to be in or not opposed to the corporation’s best interests, provided further that no indemnification is permitted without judicial approval if the officer, director, employee or agent is adjudged to be liable to the corporation. Where an officer or director is successful on the merits or otherwise in the defense of any action referred to above, the corporation must indemnify him against the expenses which such officer or director has actually and reasonably incurred.
II-1
Table of Contents
Section 145 further authorizes a corporation to purchase and maintain insurance on behalf of any person who is or was a director, officer, employee or agent of the corporation or is or was serving at the request of the corporation as a director, officer, employee or agent of another corporation or enterprise, against any liability asserted against him and incurred by him in any such capacity, or arising out of his or her status as such, whether or not the corporation would otherwise have the power to indemnify him or her under Section 145.
Our amended and restated bylaws will provide that we must indemnify our directors and officers to the fullest extent authorized by the DGCL and must also pay expenses incurred in defending any such proceeding in advance of its final disposition upon delivery of an undertaking, by or on behalf of an indemnified person, to repay all amounts so advanced if it should be determined ultimately that such person is not entitled to be indemnified under our amended and restated bylaws or otherwise.
The indemnification rights set forth above shall not be exclusive of any other right which an indemnified person may have or hereafter acquire under any statute, provision of our amended and restated certificate of incorporation, our amended and restated bylaws, agreement, vote of stockholders or disinterested directors or otherwise.
We expect to maintain standard policies of insurance that provide coverage (1) to our directors and officers against loss rising from claims made by reason of breach of duty or other wrongful act and (2) to us with respect to indemnification payments that we may make to such directors and officers.
The proposed form of Underwriting Agreement to be filed as Exhibit 1.1 to this Registration Statement provides for indemnification to our directors and officers by the underwriters against certain liabilities.
| ITEM 15. | RECENT SALES OF UNREGISTERED SECURITIES. |
None.
| ITEM 16. | EXHIBITS AND FINANCIAL STATEMENT SCHEDULES. |
| Exhibit No. |
Description | |
| 1.1 | Form of Underwriting Agreement. | |
| 3.1* | Form of Amended and Restated Certificate of Incorporation of the Registrant. | |
| 3.2* | Form of Amended and Restated By-Laws of the Registrant. | |
| 4.1 | Indenture, dated as of January 30, 2012, among Summit Materials, LLC, Summit Materials Finance Corp., the guarantors named therein and Wilmington Trust, National Association, as trustee (incorporated by reference to Exhibit 4.1 of Summit Materials, LLC’s Registration Statement on Form S-4, filed March 27, 2013 (File No. 333-187556)). | |
| 4.2 | First Supplemental Indenture, dated as of March 13, 2012, among Norris Quarries, LLC and Wilmington Trust, National Association, as trustee (incorporated by reference to Exhibit 4.2 of Summit Materials, LLC’s Registration Statement on Form S-4, filed March 27, 2013 (File No. 333-187556)). | |
| 4.3 | Second Supplemental Indenture, dated as of January 17, 2014, among Summit Materials, LLC, Summit Materials Finance Corp., the guarantors named therein and Wilmington Trust, National Association, as trustee (incorporated by reference to Exhibit 4.4 filed with Summit Materials, LLC’s Current Report on Form 8-K, filed January 23, 2014 (File No. 333-187556)). | |
| 4.4 | Third Supplemental Indenture, dated as of February 21, 2014, among Alcomat, LLC, Alleyton Resource Company, LLC, Alleyton Services Company, LLC and Wilmington Trust, National Association, as trustee (incorporated by reference to Exhibit 4.4 of Summit Materials, LLC’s Annual Report on Form 10-K, filed March 7, 2014 (File No. 333-187556)). | |
II-2
Table of Contents
| Exhibit No. |
Description | |
| 4.5 | Fourth Supplemental Indenture, dated as of July 30, 2014, between Buckhorn Materials, LLC and Wilmington Trust, National Association, as trustee (incorporated by reference to Exhibit 4.1 of Summit Materials, LLC’s Quarterly Report on Form 10-Q, filed August 6, 2014 (File No. 333-187556)). | |
| 4.6 | Fifth Supplemental Indenture, dated as of September 2, 2014, between Troy Vines, Incorporated, Summit Materials International, LLC and Wilmington Trust, National Association, as trustee (incorporated by reference to Exhibit 4.3 filed with Summit Materials, LLC’s Current Report on Form 8-K, filed September 9, 2014 (File No. 333-187556)). | |
| 4.7 | Sixth Supplemental Indenture, dated as of September 8, 2014, among Summit Materials, LLC, Summit Materials Finance Corp., the guarantors named therein and Wilmington Trust, National Association, as trustee (incorporated by reference to Exhibit 4.4 filed with Summit Materials, LLC’s Current Report on Form 8-K, filed September 9, 2014 (File No. 333-187556)). | |
| 4.8 | Form of 10.5% Senior Note due 2020 (included in Exhibit 4.1). | |
| 4.9 | Registration Rights Agreement, dated as of September 8, 2014, among Summit Materials, LLC, Summit Materials Finance Corp., the guarantors named therein, Merrill Lynch, Pierce, Fenner & Smith Incorporated and the several other initial purchasers (incorporated by reference to Exhibit 4.5 filed with Summit Materials, LLC’s Current Report on Form 8-K, filed September 9, 2014 (File No. 333-187556)). | |
| 5.1* | Opinion of Simpson Thacher & Bartlett LLP. | |
| 10.1* | Form of Fourth Amended and Restated Limited Partnership Agreement of Summit Materials Holdings L.P. | |
| 10.2* | Form of Tax Receivable Agreement. | |
| 10.3* | Form of Exchange Agreement. | |
| 10.4 | Form of Stockholders’ Agreement. | |
| 10.5 | Form of Registration Rights Agreement. | |
| 10.6*† | Form of Omnibus Incentive Plan. | |
| 10.7*† | Form of Restricted LP Unit Agreement. | |
| 10.8*† | Form of Stock Option Agreement (Leverage Restoration Options). | |
| 10.9 | Credit Agreement, dated as of January 30, 2012, by and among Summit Materials, LLC, Merrill Lynch, Pierce, Fenner & Smith Incorporated and Citigroup Global Markets Inc., as joint lead arrangers, Merrill Lynch, Pierce, Fenner & Smith Incorporated, Citigroup Global Markets Inc., UBS Securities LLC, Barclays Capital, Credit Suisse Securities (USA) LLC and Deutsche Bank Securities Inc., as joint bookrunners, Bank of America, N.A., as administrative agent, collateral agent and swing line lender, Bank of America, N.A., as letter of credit issuer, and Citigroup Global Markets Inc., as syndication agent (incorporated by reference to Exhibit 10.1 of Summit Materials, LLC’s Amendment No. 1 to the Registration Statement on Form S-4, filed May 3, 2013 (File No. 333-187556)). | |
| 10.10 | Amendment No. 1, dated as of February 5, 2013, to the Credit Agreement, dated as of January 30, 2012, by and among Summit Materials, LLC, Bank of America, N.A. as sole lead arranger, and Bank of America, N.A. and Citigroup Global Markets Inc., as joint bookrunners (incorporated by reference to Exhibit 10.2 of Summit Materials, LLC’s Registration Statement on Form S-4, filed March 27, 2013 (File No. 333-187556)). | |
II-3
Table of Contents
| Exhibit No. |
Description | |
| 10.11 | Amendment No. 2, dated as of January 16, 2014, to the Credit Agreement, dated as of January 30, 2012, by and among Summit Materials, LLC, the guarantors party thereto, Bank of America, N.A., as administrative agent, collateral agent, L/C issuer and swing line lender and the other parties thereto (incorporated by reference to Exhibit 10.1 filed with Summit Materials, LLC’s Current Report on Form 8-K, filed January 23, 2014 (File No. 333-187556)). | |
| 10.12 | Tranche A Revolving Credit Commitment Conversion Agreement, dated as of February 11, 2013, under the Credit Agreement, dated as of January 30, 2012, among Summit Materials, LLC, the guarantors party thereto, the several banks and other financial institutions or entities from time to time parties to the Credit Agreement, Bank of America, N.A., as administrative agent, collateral agent, L/C issuer and swing line lender and the other parties thereto (incorporated by reference to Exhibit 10.3 of Summit Materials, LLC’s Registration Statement on Form S-4, filed March 27, 2013 (File No. 333-187556)). | |
| 10.13 | Security Agreement, dated as of January 30, 2012, by and among the grantors identified therein and Bank of America, N.A., as collateral agent (incorporated by reference to Exhibit 10.4 of Summit Materials, LLC’s Registration Statement on Form S-4, filed March 27, 2013 (File No. 333-187556)). | |
| 10.14 | Acquisition Agreement, dated as of December 5, 2013, among Alleyton Resource Corporation, Colorado Gulf, LP, Texas CGC, LLC, Barten Shepard Investments, LP, TBGSI Corp., the individuals signatory thereto and Summit Materials, LLC. (incorporated by reference to Exhibit 10.6 of Summit Materials, LLC’s Annual Report on Form 10-K, filed March 7, 2014 (File No. 333-187556)). | |
| 10.15 | Amendment dated January 14, 2014, to Acquisition Agreement, dated as of December 5, 2013, among Alleyton Resource Corporation, Colorado Gulf, LP, Texas CGC, LLC, Barten Shepard Investments, LP, TBGSI Corp., the individuals signatory thereto and Summit Materials, LLC. (incorporated by reference to Exhibit 10.7 of Summit Materials, LLC’s Annual Report on Form 10-K, filed March 7, 2014 (File No. 333-187556)). | |
| 10.16† | Form of Management Interest Subscription Agreement for executive officers (incorporated by reference to Exhibit 10.8 of Summit Materials, LLC’s Annual Report on Form 10-K, filed March 7, 2014 (File No. 333-187556)). | |
| 10.17† | Form of Management Interest Subscription Agreement for directors (incorporated by reference to Exhibit 10.9 of Summit Materials, LLC’s Annual Report on Form 10-K, filed March 7, 2014 (File No. 333-187556)). | |
| 10.18† | Employment Agreement, dated July 30, 2009, by and between Summit Materials Holdings L.P. and Thomas W. Hill (incorporated by reference to Exhibit 10.5 of Summit Materials, LLC’s Registration Statement on Form S-4, filed March 27, 2013 (File No. 333-187556)). | |
| 10.19† | Employment Agreement, dated December 29, 2011, by and between Summit Materials Holdings L.P. and Douglas C. Rauh (incorporated by reference to Exhibit 10.6 of Summit Materials, LLC’s Registration Statement on Form S-4, filed March 27, 2013 (File No. 333-187556)). | |
| 10.20† | Employment Agreement, dated November 11, 2013, by and between Summit Materials Holdings L.P. and Kevin A. Gill (incorporated by reference to Exhibit 10.12 of Summit Materials, LLC’s Annual Report on Form 10-K, filed March 7, 2014 (File No. 333-187556)). | |
| 10.21† | Employment Agreement, dated May 20, 2013, by and between Summit Materials Holdings L.P. and Julio Ramirez (incorporated by reference to Exhibit 10.7 Summit Materials, LLC’s Registration Statement on Form S-4, filed May 24, 2013 (File No. 333-187556)). | |
| 10.22† | Agreement and Release between Summit Materials Holdings L.P. and Julio Ramirez, Chief Financial Officer (incorporated by reference to Exhibit 10.1 of Summit Materials, LLC’s Quarterly Report on Form 10-Q, filed November 6, 2013 (File No. 333-187556)). | |
II-4
Table of Contents
| Exhibit No. |
Description | |
| 10.23† | Compensation Arrangement between Summit Materials Holdings L.P. and John Murphy, Interim Chief Financial Officer (incorporated by reference to Exhibit 10.2 of Summit Materials, LLC’s Quarterly Report on Form 10-Q, filed November 6, 2013 (File No. 333-187556)). | |
| 10.24† | Employment Agreement, dated as of December 3, 2013, between Summit Materials Holdings L.P. and Brian J. Harris (incorporated by reference to Exhibit 10.1 of Summit Materials, LLC’s Current Report on Form 8-K/A, filed December 4, 2013 (File No. 333-187556)). | |
| 10.25* | Contribution and Purchase Agreement | |
| 16 | Letter regarding change in certifying accountant. | |
| 21* | Subsidiaries of the Registrant. | |
| 23.1 | Consent of KPMG LLP, Independent Registered Public Accounting Firm. | |
| 23.2 | Consent of KPMG LLP, Independent Registered Public Accounting Firm. | |
| 23.3 | Consent of Deloitte & Touche LLP, Independent Registered Public Accounting Firm. | |
| 23.4* | Consent of Simpson Thacher & Bartlett LLP (included as part of its opinion filed as Exhibit 5.1 hereto). | |
| 24 | Power of Attorney (included in signature pages of this registration statement). | |
| * | To be filed by amendment. |
| † | Management contract or compensatory plan or arrangement. |
| ITEM 17. | UNDERTAKINGS |
| (1) | The undersigned registrant hereby undertakes to provide to the underwriter at the closing specified in the underwriting agreements certificates in such denominations and registered in such names as required by the underwriter to permit prompt delivery to each purchaser. |
| (2) | Insofar as indemnification for liabilities arising under the Securities Act of 1933 may be permitted to directors, officers and controlling persons of the registrant pursuant to the foregoing provisions, or otherwise, the registrant has been advised that in the opinion of the Securities and Exchange Commission such indemnification is against public policy as expressed in the Securities Act of 1933 and is, therefore, unenforceable. In the event that a claim for indemnification against such liabilities (other than the payment by the registrant of expenses incurred or paid by a director, officer or controlling person of the registrant in the successful defense of any action, suit or proceeding) is asserted by such director, officer or controlling person in connection with the securities being registered, the registrant will, unless in the opinion of its counsel the matter has been settled by controlling precedent, submit to a court of appropriate jurisdiction the question of whether such indemnification by it is against public policy as expressed in the Securities Act of 1933 and will be governed by the final adjudication of such issue. |
| (3) | The undersigned Registrant hereby undertakes that: |
| (A) | For purposes of determining any liability under the Securities Act of 1933, the information omitted from the form of prospectus filed as part of this registration statement in reliance upon Rule 430A and contained in a form of prospectus filed by the registrant pursuant to Rule 424(b) (1) or (4) or 497(h) under the Securities Act shall be deemed to be part of this registration statement as of the time it was declared effective. |
| (B) | For the purpose of determining any liability under the Securities Act of 1933, each post-effective amendment that contains a form of prospectus shall be deemed to be a new registration statement relating to the securities offered therein, and the offering of such securities at that time shall be deemed to be the initial bona fide offering thereof. |
II-5
Table of Contents
SIGNATURES
Pursuant to the requirements of the Securities Act, the registrant has duly caused this Registration Statement to be signed on its behalf by the undersigned, thereunto duly authorized, in the City of Denver, State of Colorado, on December 18, 2014.
| SUMMIT MATERIALS, INC. | ||
| By: | /s/ Thomas W. Hill | |
| Name: | Thomas W. Hill | |
| Title: | President and Chief Executive Officer | |
POWER OF ATTORNEY
Each person whose signature appears below hereby constitutes and appoints Anne Lee Benedict, Anthony Keenan and Jennifer Rose, and each of them, any of whom may act without joinder of the other, the individual’s true and lawful attorneys-in-fact and agents, with full power of substitution and resubstitution, for the person and in his or her name, place and stead, in any and all capacities, to sign this Registration Statement and any or all amendments, including post-effective amendments to the Registration Statement, including a prospectus or an amended prospectus therein and any Registration Statement for the same offering that is to be effective upon filing pursuant to Rule 462 under the Securities Act, and all other documents in connection therewith to be filed with the Securities and Exchange Commission, granting unto said attorneys-in-fact and agents, and each of them, full power and authority to do and perform each and every act and thing requisite and necessary to be done in and about the premises, as fully to all intents and purposes as he or she might or could do in person, hereby ratifying and confirming all that said attorneys-in-fact as agents or any of them, or their substitute or substitutes, may lawfully do or cause to be done by virtue hereof.
Pursuant to the requirements of the Securities Act of 1933, as amended, this registration statement and power of attorney have been signed by the following persons in the capacities indicated on the 18th day of December, 2014.
| Signature |
Title(s) | |
| /s/ Thomas W. Hill Thomas W. Hill |
President and Chief Executive Officer (Principal Executive Officer); Director | |
| /s/ Brian J. Harris Brian J. Harris |
Chief Financial Officer (Principal Financial and Accounting Officer) | |
| /s/ Howard L. Lance Howard L. Lance |
Director | |
| /s/ Ted A. Gardner Ted A. Gardner |
Director | |
| /s/ Julia C. Kahr Julia C. Kahr |
Director | |
| /s/ John R. Murphy John R. Murphy |
Director | |
| /s/ Neil P. Simpkins Neil P. Simpkins |
Director | |
II-6
Table of Contents
EXHIBIT INDEX
| Exhibit No. |
Description | |
| 1.1 | Form of Underwriting Agreement. | |
| 3.1* | Form of Amended and Restated Certificate of Incorporation of the Registrant. | |
| 3.2* | Form of Amended and Restated By-Laws of the Registrant. | |
| 4.1 | Indenture, dated as of January 30, 2012, among Summit Materials, LLC, Summit Materials Finance Corp., the guarantors named therein and Wilmington Trust, National Association, as trustee (incorporated by reference to Exhibit 4.1 of Summit Materials, LLC’s Registration Statement on Form S-4, filed March 27, 2013 (File No. 333-187556)). | |
| 4.2 | First Supplemental Indenture, dated as of March 13, 2012, among Norris Quarries, LLC and Wilmington Trust, National Association, as trustee (incorporated by reference to Exhibit 4.2 of Summit Materials, LLC’s Registration Statement on Form S-4, filed March 27, 2013 (File No. 333-187556)). | |
| 4.3 | Second Supplemental Indenture, dated as of January 17, 2014, among Summit Materials, LLC, Summit Materials Finance Corp., the guarantors named therein and Wilmington Trust, National Association, as trustee (incorporated by reference to Exhibit 4.4 filed with Summit Materials, LLC’s Current Report on Form 8-K, filed January 23, 2014 (File No. 333-187556)). | |
| 4.4 | Third Supplemental Indenture, dated as of February 21, 2014, among Alcomat, LLC, Alleyton Resource Company, LLC, Alleyton Services Company, LLC and Wilmington Trust, National Association, as trustee (incorporated by reference to Exhibit 4.4 of Summit Materials, LLC’s Annual Report on Form 10-K, filed March 7, 2014 (File No. 333-187556)). | |
| 4.5 | Fourth Supplemental Indenture, dated as of July 30, 2014, between Buckhorn Materials, LLC and Wilmington Trust, National Association, as trustee (incorporated by reference to Exhibit 4.1 of Summit Materials, LLC’s Quarterly Report on Form 10-Q, filed on August 6, 2014 (File No. 333-187556)). | |
| 4.6 | Fifth Supplemental Indenture, dated as of September 2, 2014, between Troy Vines, Incorporated, Summit Materials International, LLC and Wilmington Trust, National Association, as trustee (incorporated by reference to Exhibit 4.3 filed with Summit Materials, LLC’s Current Report on Form 8-K, filed September 9, 2014 (File No. 333-187556)). | |
| 4.7 | Sixth Supplemental Indenture, dated as of September 8, 2014, among Summit Materials, LLC, Summit Materials Finance Corp., the guarantors named therein and Wilmington Trust, National Association, as trustee (incorporated by reference to Exhibit 4.4 filed with Summit Materials, LLC’s Current Report on Form 8-K, filed September 9, 2014 (File No. 333-187556)). | |
| 4.8 | Form of 10.5% Senior Note due 2020 (included in Exhibit 4.1). | |
| 4.9 | Registration Rights Agreement, dated as of September 8, 2014, among Summit Materials, LLC, Summit Materials Finance Corp., the guarantors named therein, Merrill Lynch, Pierce, Fenner & Smith Incorporated and the several other initial purchasers (incorporated by reference to Exhibit 4.5 filed with Summit Materials, LLC’s Current Report on Form 8-K, filed September 9, 2014 (File No. 333-187556)). | |
| 5.1* | Opinion of Simpson Thacher & Bartlett LLP. | |
| 10.1* | Form of Fourth Amended and Restated Limited Partnership Agreement of Summit Materials Holdings L.P. | |
| 10.2* | Form of Tax Receivable Agreement. | |
| 10.3* | Form of Exchange Agreement. | |
| 10.4 | Form of Stockholders’ Agreement. | |
II-7
Table of Contents
| Exhibit No. |
Description | |
| 10.5 | Form of Registration Rights Agreement. | |
| 10.6*† | Form of Omnibus Incentive Plan. | |
| 10.7*† | Form of Restricted LP Unit Agreement. | |
| 10.8*† | Form of Stock Option Agreement (Leverage Restoration Options). | |
| 10.9 | Credit Agreement, dated as of January 30, 2012, by and among Summit Materials, LLC, Merrill Lynch, Pierce, Fenner & Smith Incorporated and Citigroup Global Markets Inc., as joint lead arrangers, Merrill Lynch, Pierce, Fenner & Smith Incorporated, Citigroup Global Markets Inc., UBS Securities LLC, Barclays Capital, Credit Suisse Securities (USA) LLC and Deutsche Bank Securities Inc., as joint bookrunners, Bank of America, N.A., as administrative agent, collateral agent and swing line lender, Bank of America, N.A., as letter of credit issuer, and Citigroup Global Markets Inc., as syndication agent (incorporated by reference to Exhibit 10.1 of Summit Materials, LLC’s Amendment No. 1 to the Registration Statement on Form S-4, filed May 3, 2013 (File No. 333-187556)). | |
| 10.10 | Amendment No. 1, dated as of February 5, 2013, to the Credit Agreement, dated as of January 30, 2012, by and among Summit Materials, LLC, Bank of America, N.A. as sole lead arranger, and Bank of America, N.A. and Citigroup Global Markets Inc., as joint bookrunners (incorporated by reference to Exhibit 10.2 of Summit Materials, LLC’s Registration Statement on Form S-4, filed March 27, 2013 (File No. 333-187556)). | |
| 10.11 | Amendment No. 2, dated as of January 16, 2014, to the Credit Agreement, dated as of January 30, 2012, by and among Summit Materials, LLC, the guarantors party thereto, Bank of America, N.A., as administrative agent, collateral agent, L/C issuer and swing line lender and the other parties thereto (incorporated by reference to Exhibit 10.1 filed with Summit Materials, LLC’s Current Report on Form 8-K, filed January 23, 2014 (File No. 333-187556)). | |
| 10.12 | Tranche A Revolving Credit Commitment Conversion Agreement, dated as of February 11, 2013, under the Credit Agreement, dated as of January 30, 2012, among Summit Materials, LLC, the guarantors party thereto, the several banks and other financial institutions or entities from time to time parties to the Credit Agreement, Bank of America, N.A., as administrative agent, collateral agent, L/C issuer and swing line lender and the other parties thereto (incorporated by reference to Exhibit 10.3 of Summit Materials, LLC’s Registration Statement on Form S-4, filed March 27, 2013 (File No. 333-187556)). | |
| 10.13 | Security Agreement, dated as of January 30, 2012, by and among the grantors identified therein and Bank of America, N.A., as collateral agent (incorporated by reference to Exhibit 10.4 of Summit Materials, LLC’s Registration Statement on Form S-4, filed March 27, 2013 (File No. 333-187556)). | |
| 10.14 | Acquisition Agreement, dated as of December 5, 2013, among Alleyton Resource Corporation, Colorado Gulf, LP, Texas CGC, LLC, Barten Shepard Investments, LP, TBGSI Corp., the individuals signatory thereto and Summit Materials, LLC. (incorporated by reference to Exhibit 10.6 of Summit Materials, LLC’s Annual Report on Form 10-K, filed March 7, 2014 (File No. 333-187556)). | |
| 10.15 | Amendment dated January 14, 2014, to Acquisition Agreement, dated as of December 5, 2013, among Alleyton Resource Corporation, Colorado Gulf, LP, Texas CGC, LLC, Barten Shepard Investments, LP, TBGSI Corp., the individuals signatory thereto and Summit Materials, LLC. (incorporated by reference to Exhibit 10.7 of Summit Materials, LLC’s Annual Report on Form 10-K, filed March 7, 2014 (File No. 333-187556)). | |
| 10.16† | Form of Management Interest Subscription Agreement for executive officers (incorporated by reference to Exhibit 10.8 of Summit Materials, LLC’s Annual Report on Form 10-K, filed March 7, 2014 (File No. 333-187556)). | |
II-8
Table of Contents
| Exhibit No. |
Description | |
| 10.17† | Form of Management Interest Subscription Agreement for directors (incorporated by reference to Exhibit 10.9 of Summit Materials, LLC’s Annual Report on Form 10-K, filed March 7, 2014 (File No. 333-187556)). | |
| 10.18† | Employment Agreement, dated July 30, 2009, by and between Summit Materials Holdings L.P. and Thomas W. Hill (incorporated by reference to Exhibit 10.5 of Summit Materials, LLC’s Registration Statement on Form S-4, filed March 27, 2013 (File No. 333-187556)). | |
| 10.19† | Employment Agreement, dated December 29, 2011, by and between Summit Materials Holdings L.P. and Douglas C. Rauh (incorporated by reference to Exhibit 10.6 of Summit Materials, LLC’s Registration Statement on Form S-4, filed March 27, 2013 (File No. 333-187556)). | |
| 10.20† | Employment Agreement, dated November 11, 2013, by and between Summit Materials Holdings L.P. and Kevin A. Gill (incorporated by reference to Exhibit 10.12 of Summit Materials, LLC’s Annual Report on Form 10-K, filed March 7, 2014 (File No. 333-187556)). | |
| 10.21† | Employment Agreement, dated May 20, 2013, by and between Summit Materials Holdings L.P. and Julio Ramirez (incorporated by reference to Exhibit 10.7 Summit Materials, LLC’s Registration Statement on Form S-4, filed May 24, 2013 (File No. 333-187556)). | |
| 10.22† | Agreement and Release between Summit Materials Holdings L.P. and Julio Ramirez, Chief Financial Officer (incorporated by reference to Exhibit 10.1 of Summit Materials, LLC’s Quarterly Report on Form 10-Q, filed November 6, 2013 (File No. 333-187556)). | |
| 10.23† | Compensation Arrangement between Summit Materials Holdings L.P. and John Murphy, Interim Chief Financial Officer (incorporated by reference to Exhibit 10.2 of Summit Materials, LLC’s Quarterly Report on Form 10-Q, filed November 6, 2013 (File No. 333-187556)). | |
| 10.24† | Employment Agreement, dated as of December 3, 2013, between Summit Materials Holdings L.P. and Brian J. Harris (incorporated by reference to Exhibit 10.1 of Summit Materials, LLC’s Current Report on Form 8-K/A, filed December 4, 2013 (File No. 333-187556)). | |
| 10.25* | Contribution and Purchase Agreement. | |
| 16 | Letter regarding change in certifying accountant. | |
| 21* | Subsidiaries of the Registrant. | |
| 23.1 | Consent of KPMG LLP, Independent Registered Public Accounting Firm. | |
| 23.2 | Consent of KPMG LLP, Independent Registered Public Accounting Firm. | |
| 23.3 | Consent of Deloitte & Touche LLP, Independent Registered Public Accounting Firm. | |
| 23.4* | Consent of Simpson Thacher & Bartlett LLP (included as part of its opinion filed as Exhibit 5.1 hereto). | |
| 24 | Power of Attorney (included in signature pages of this registration statement). | |
| * | To be filed by amendment. |
| † | Management contract or compensatory plan or arrangement. |
II-9