Attached files
| file | filename |
|---|---|
| 8-K - 8-K - NAVISTAR INTERNATIONAL CORP | d837915d8k.htm |
| EX-99.1 - EX-99.1 - NAVISTAR INTERNATIONAL CORP | d837915dex991.htm |
 Q4 EARNINGS PRESENTATION
December 16, 2014
Exhibit 99.2 |
 2
NYSE: NAV
Q4 2014 Earnings –
12/16/2014
Safe Harbor
Statement
Information provided and statements contained in this report that are
not purely historical are forward- looking statements within
the meaning of Section 27A of the Securities Act of 1933, as amended,
Section 21E of the Securities Exchange Act of 1934, as amended, and the
Private Securities Litigation Reform Act of 1995. Such
forward-looking statements only speak as of the date of this report and the
Company
assumes
no
obligation
to
update
the
information
included
in
this
report.
Such
forward-
looking statements include information concerning our possible or
assumed future results of operations, including descriptions of
our business strategy. These statements often include words such as “believe,”
“expect,”
“anticipate,”
“intend,”
“plan,”
“estimate,”
or similar expressions. These statements are not
guarantees of performance or results and they involve risks,
uncertainties, and assumptions. For a further description of
these factors, see the risk factors set forth in our filings with the Securities and
Exchange Commission, including our annual report on Form 10-K for
the fiscal year ended October 31, 2014. Although we believe that
these forward-looking statements are based on reasonable assumptions,
there are many factors that could affect our actual financial results
or results of operations and could cause actual results to
differ materially from those in the forward-looking statements. All future written
and oral forward-looking statements by us or persons acting on our
behalf are expressly qualified in their entirety by the
cautionary statements contained or referred to above. Except for our ongoing
obligations to disclose material information as required by the federal
securities laws, we do not have any obligations or intention to
release publicly any revisions to any forward-looking statements to
reflect events or circumstances in the future or to reflect the
occurrence of unanticipated events. |
 3
NYSE: NAV
Q4 2014 Earnings –
12/16/2014
Other Cautionary Notes
The financial information herein contains audited and unaudited
information and has been prepared by management in good faith
and based on data currently available to the Company.
Certain
non-GAAP
measures
are
used
in
this
presentation
to
assist
the
reader
in
understanding
our
core manufacturing business.
We believe this information is useful and relevant to assess and
measure
the
performance
of
our
core
manufacturing
business
as
it
illustrates
manufacturing
performance.
It
also
excludes
financial
services
and
other
items
that
may
not
be
related
to
the
core
manufacturing business or underlying results. Management often uses
this information to assess and measure
the
underlying
performance
of
our
operating
segments.
We
have
chosen
to
provide
this
supplemental information to investors, analysts, and other interested
parties to enable them to perform additional analyses of
operating results. The non-GAAP numbers are reconciled to the most
appropriate GAAP number in the appendix of this presentation.
|
 NYSE: NAV
4
TH
QUARTER 2014 RESULTS
Troy Clarke, President & CEO |
 5
NYSE: NAV
Q4 2014 Earnings –
12/16/2014
Our New Leadership Team
Walter Borst
Executive Vice
President and
Chief Financial
Officer
Bill Kozek
President,
Truck & Parts
Troy Clarke
President and
Chief Executive
Officer
Persio Lisboa
President,
Operations |
 6
NYSE: NAV
Q4 2014 Earnings –
12/16/2014
Agenda
Overview
Troy Clarke
Financial Results
Walter Borst
Summary
Troy Clarke |
 7
NYSE: NAV
Q4 2014 Earnings –
12/16/2014
•
Hit Q4 adjusted EBITDA guidance
•
Truck sales up quarter-over-quarter
•
Declining warranty spend
•
Over-performed on structural cost savings target
•
Over-achieved on manufacturing cost improvements
•
Realized significant material cost savings
•
Challenging economy in Brazil
•
Maintained strong cash balances
4th Quarter Summary |
 8
NYSE: NAV
Q4 2014 Earnings –
12/16/2014
•
Strong Class 6-8 truck and bus industry
•
Rebuilding sales and market share: one of our highest priorities
•
Making progress towards exiting 2015 at our 8-10% adjusted EBITDA
margin goal 4th Quarter Summary |
 NYSE: NAV
FINANCIAL RESULTS
Walter Borst, Executive Vice President & CFO
|
 10
NYSE: NAV
Q4 2014 Earnings –
12/16/2014
Income Statement Summary
Note:
This slide contains non-GAAP information; please see the
REG G in appendix for a detailed reconciliation.
(A) Amounts attributable to Navistar International
Corporation. $ in millions, except per share
Quarters Ended
October 31
2014
2013
Traditional Chargeouts
16,800
13,700
Sales and Revenues
$3,008
$2,751
EBITDA
$66
($227)
Income (Loss) from Continuing Operations, Net of Tax
(A)
($72)
($153)
Diluted Loss Per Share from Continuing Operations
(A)
($0.88)
($1.90) |
 11
NYSE: NAV
Q4 2014 Earnings –
12/16/2014
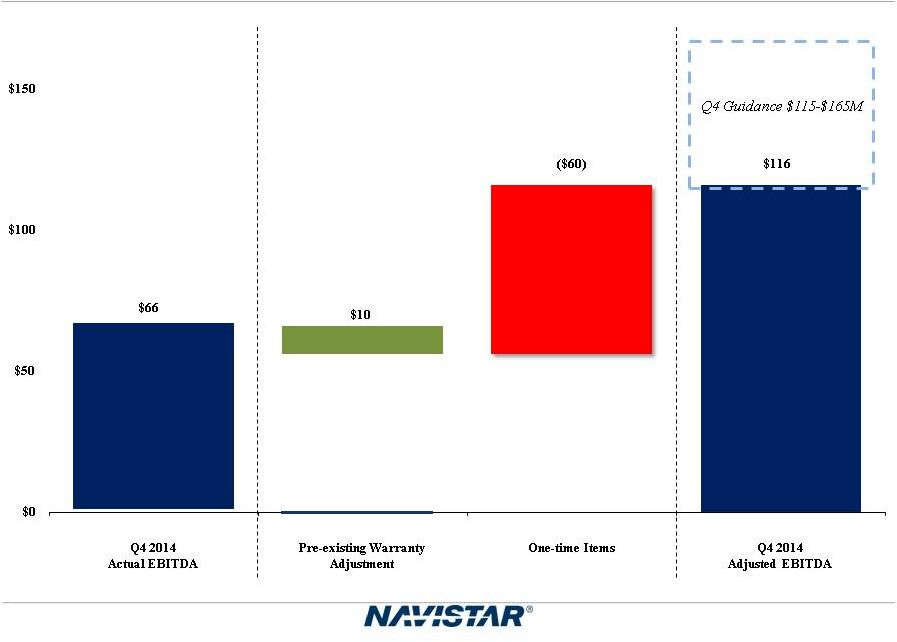
Q4 2014 EBITDA
$ in millions
Note:
This slide contains non-GAAP information; please see the
REG G in appendix for a detailed reconciliation.
* Excluding pre-existing warranty and one-time items.
11
NYSE: NAV
Q4 2014 Earnings –
12/16/2014 |
 12
NYSE: NAV
Q4 2014 Earnings –
12/16/2014
Q4 2014 Segment Results
Segment Results:
North America Truck
($55)
($355)
North America Parts
$143
$147
Global Operations
($33)
($6)
Financial Services
$26
$17
Quarters Ended
October 31
2014
2013
$ in millions |
 13
NYSE: NAV
Q4 2014 Earnings –
12/16/2014
Drive to Deliver Metrics
(millions)
13
NYSE: NAV
Q4 2014 Earnings –
12/16/2014 |
 14
Q4 2014 Earnings –
12/16/2014
Q4 2014 Manufacturing Cash Update
$ in millions
*Guidance as provided on 9/3/2014 **Cash balance includes
marketable securities ^ Excluding one-time items
and pre-existing warranty ^^Includes incremental
$91 million NFC intercompany loan Note:
This slide contains non-GAAP information; please see the
REG G in appendix for a detailed reconciliation.
Guidance*
Actual
Q3 2014 Manufacturing Cash Balance**
$1,098
$1,098
Consolidated Adjusted EBITDA
^
$115 -
$165
$116
Capex/Cash Interest/Pension & OPEB Funding
($170) -
($185)
($176)
Change in Net Working Capital/Debt
Payments/Other
($43) -
$22
($20)
Q4 2014 Manufacturing Cash Balance**
$1,000-1,100
$1,018
^^ |
 15
Q4 2014 Earnings –
12/16/2014
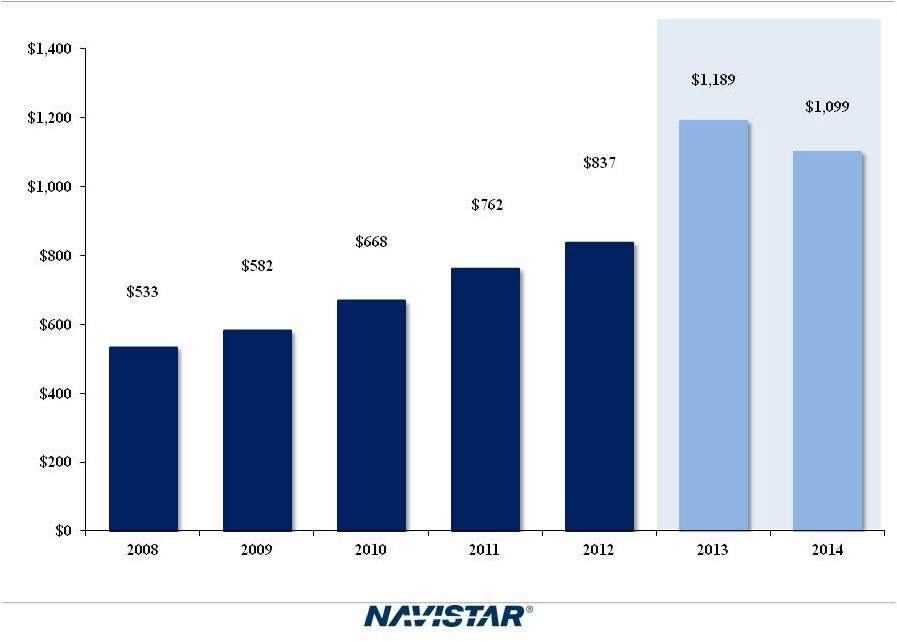
Historical Q1 Manufacturing Cash Levels
$ in millions
* Cash balance includes marketable securities.
** Excluding one-time items and pre-existing warranty
Note:
This slide contains non-GAAP information; please see the
REG G in appendix for a detailed reconciliation.
Turnaround Period
15
Q4 2014 Earnings –
12/16/2014 |
 16
Q4 2014 Earnings –
12/16/2014
Guidance: Q1 2015 Manufacturing Cash
$ in millions
* Cash balance includes marketable securities.
** Excluding one-time items and pre-existing warranty
Note:
This slide contains non-GAAP information; please see the
REG G in appendix for a detailed reconciliation.
Q1 2015
Guidance
Q4 2014 Manufacturing Cash Balance*
$1,018
Consolidated Adjusted EBITDA**
$0 -
$50
Capex/Cash Interest/Pension & OPEB Funding
($160) -
($170)
Change in Net Working Capital/Debt Payments/Other
($158) -
($98)
Q1 2015 Manufacturing Cash Balance*
$700 -
$800 |
 17
NYSE: NAV
Q4 2014 Earnings –
12/16/2014
Long-term EBITDA Goals
4 Pronged Action Plan to Improve EBITDA
Volume
Material
Structural
Warranty
increase
cost savings
cost savings
cost reductions
* As shown in the fourth quarter earnings presentation on
12/20/13 2014
Actual
2015 Exiting &
Long Term*
Class 6 -
8 Truck & Bus industry
342,100
325 -
350,000
Class 6 -
8 Truck & Bus combined market share
17.5%
22 -
24%
Material cost
Decreased
5% decrease
Structural cost savings
$311 million
< 10% of sales
Warranty expense
3.7%
4 ppt decrease
versus 7.7% in 2013
Exiting Adjusted EBITDA Margin
3.9%
8 –
10% |
 18
NYSE: NAV
Q4 2014 Earnings –
12/16/2014
•
In 2015, we expect:
•
Class 6 -
8 truck & bus industry of 350,000 to 380,000 units
•
Pension and OPEB expense flat to 2014
•
Pension cash contributions of $148 million
•
Capital expenditures of $150 million
•
Manufacturing interest expense down ~5%
Additional Insights into 2015 |
 19
NYSE: NAV
Q4 2014 Earnings –
12/16/2014
•
2014 Accomplishments:
•
Grew revenue each consecutive quarter
•
Lowered break-even point by reducing structural costs and
warranty expense
•
Managed cash balances
•
Extended debt maturity profile
•
2015 exiting adjusted EBITDA goal of 8-10%: on track
Summing It Up |
 20
NYSE: NAV
Q4 2014 Earnings –
12/16/2014
2015 Analyst Day
February 4, 2015
World Headquarters
2701 Navistar Drive, Lisle, IL |
 NYSE: NAV
APPENDIX |
 22
NYSE: NAV
Q4 2014 Earnings –
12/16/2014
Navistar Financial Corporation
Highlights
•
Financial Services Segment profit of $97 million for 2014, $26 million
for Q4 •
Total U.S. financing availability of $307 million as of October 31,
2014 •
Financial Services Debt/Equity Leverage of 3.2:1
•
Dealer funding facility issued November 2014 for $250 million
Retail Notes
Bank Facility
•
$840 million facility ($500 million
revolver and $340 million term
loan matures in December 2016)
–
Funding for retail notes,
wholesale notes, retail accounts,
and dealer open accounts
•
On balance sheet
•
NFSC wholesale trust as of
October 2014
–
$950 million funding facility
–
Variable portion matures March
2015
–
Term portions mature January
2015 and September 2015
•
On balance sheet
•
Broader product offering
•
Enhanced ability to support large
fleets
•
Better access to less expensive
capital |
 23
NYSE: NAV
Q4 2014 Earnings –
12/16/2014
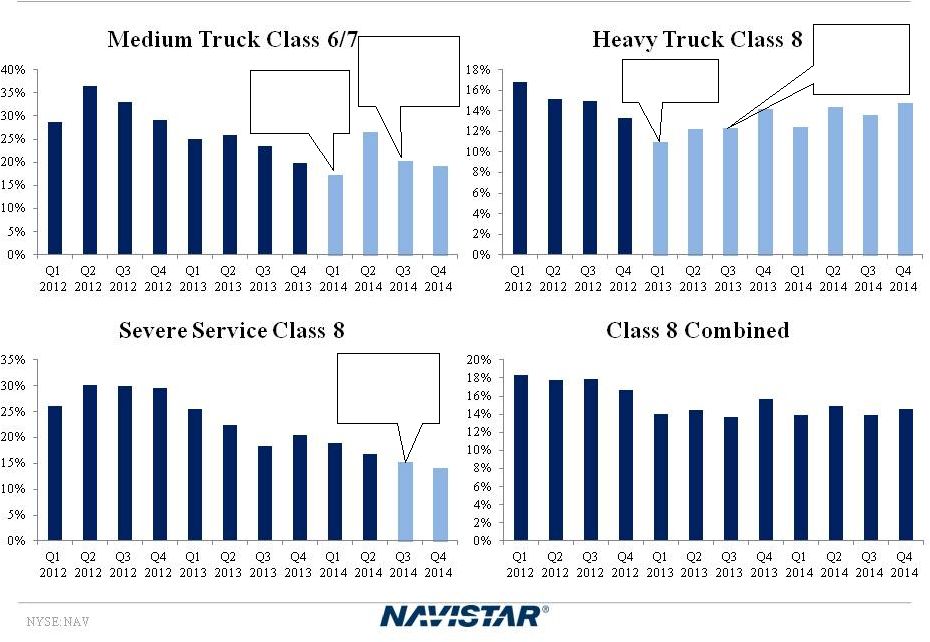
Retail Market Share in Commercial Vehicle Segments
Class 6/7
Medium-Duty
Retail Market Share:
Q4 2014: 19%
Q3 2014: 20%
Class 8
Severe Service
Retail Market Share:
Q4 2014: 14%
Q3 2014: 15%
Class 8
Heavy
Retail Market Share:
Q4 2014: 15%
Q3 2014: 14%
Combined Class 8
Retail Market Share:
Q4 2014: 15% / Q3 2014: 14%
School Bus
B/C/D
Retail Market Share
(A)
:
Q4 2014: 39%
Q3 2014: 31%
(A)
The Company uses bus registration data from Polk to report U.S. and
Canada School bus retail market deliveries. Additionally, the
School bus retail market deliveries include buses classified as B, C, and D and are being
reported on a one-month lag. These changes are reflected in
all periods presented. (B)
Retail
delivery
market
share
for
2012
was
updated
to
reflect
the
impact
of
excluding
units
related
to
discontinued
operations.
(C)
Retail delivery market share includes CAT-branded units sold to
Caterpillar under our North America supply agreement.
2014
2013
2012
Traditional Markets (U.S. and Canada)
School
buses
(A)
35
%
37
%
41
%
Class
6
and
7
medium
trucks
(B)
21
%
24
%
32
%
Class 8 heavy trucks
14
%
12
%
15
%
Class
8
severe
service
trucks
(C)
16
%
22
%
29
%
Total Traditional Markets
17
%
18
%
22
%
Combined class 8 trucks
14
%
15
%
18
% |
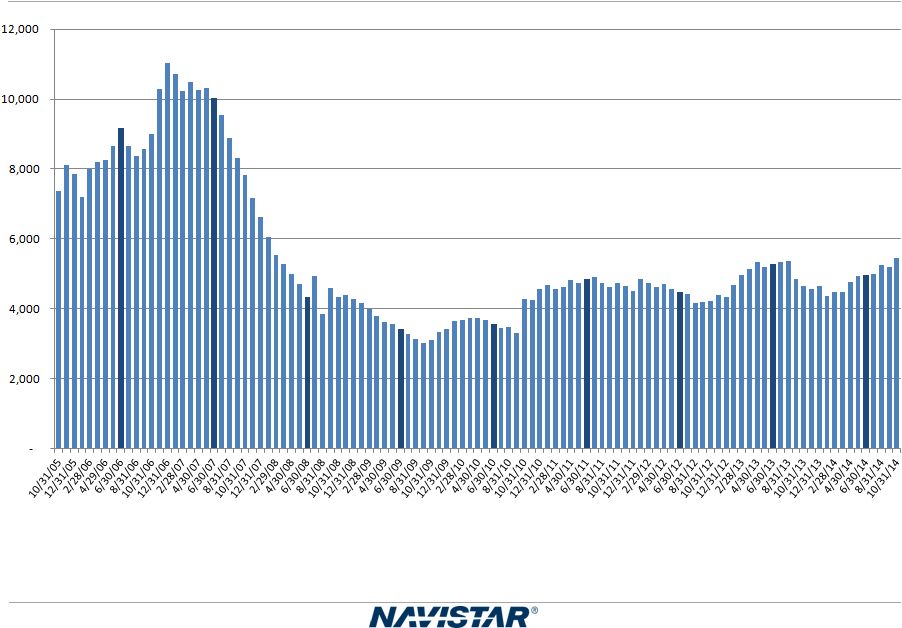
 24
Q4 2014 Earnings –
12/16/2014
U.S. and Canada Class 6-8 Retail Market Share
Launched
DuraStar with
Cummins ISB
Launched
ProStar with
Cummins ISX
Launched
ProStar with
MaxxForce
13L with SCR
Launched
WorkStar with
MaxxForce
9/10 SCR
Launched
DuraStar
with
MaxxForce
9/10 SCR
24
Q4 2014 Earnings –
12/16/2014 |
 25
NYSE: NAV
Q4 2014 Earnings –
12/16/2014
Worldwide Truck Chargeouts
We define chargeouts as trucks that have been invoiced to customers.
The units held in dealer inventory represent the principal difference between retail
deliveries
and
chargeouts.
This
table
summarizes
our
approximate
worldwide
chargeouts
from
our
continuing
operations.
We
define
our
“traditional”
markets
to
include
U.S.
and
Canada
School
bus
and
Class
6
through
8
medium
and
heavy
truck.
Our
“traditional”
markets
include
CAT-branded
units
sold
to
Caterpillar
under
our
North
America
supply
agreement.
Three Months Ended
Oct 31,
%
Change
Years Ended
Oct 31,
%
Change
(in units)
2014
2013
Change
2014
2013
Change
Traditional Markets (U.S. and
Canada)
School buses .........................................
3,100
2,300
800
35
%
10,800
9,500
1,300
14
%
Class 6 and 7 medium trucks .............
3,800
2,700
1,100
41
%
16,000
14,700
1,300
9
%
Class 8 heavy trucks ............................
7,400
6,100
1,300
21
%
26,000
21,100
4,900
23
%
Class 8 severe service trucks..............
2,500
2,600
(100)
(4)
%
8,700
9,800
(1,100)
(11
)%
Total Traditional markets ........................
16,800
13,700
3,100
23
%
61,500
55,100
6,400
12
%
Military vehicles ..................................
-
-
-
0
%
100
800
(700)
(88
)%
Expansion markets
(A)
...........................
8,600
8,100
500
6
%
28,400
28,500
(100)
(0
)%
Total worldwide units
(B)
............................
25,400
21,800
3,600
17
%
90,000
84,400
5,600
7
%
Combined Class 8 trucks ....................
9,900
8,700
1.200
14
%
34,700
30,900
3,800
12
%
(A)
Includes: chargeouts related to Blue Diamond Truck ("BDT") of
3,400 units and 3,200 units during the three months ended October 31, 2014 and 2013,
respectively,
and
11,000
and
9,900
units
during
the
fiscal
years
2014
and
2013.
(B)
Excludes: All RV towable units which were related to the Bison Coach
trailer business sold in October 2013 and (ii) all units related to Monaco and WCC,
both of which have been classified as discontinued operations. There
were no units related to RV towables, Monaco, or WCC in 2014. |
 26
NYSE: NAV
Q4 2014 Earnings –
12/16/2014
Three Months Ended
Oct 31,
%
Change
Years Ended
Oct 31,
%
Change
(in units)
2014
2013
Change
2014
2013
Change
OEM sales-South America...........................
22,600
28,800
(6,200)
(22
)%
89,100
116,200
(27,100)
(23
)%
Intercompany sales ..................................
8,800
13,400
(4,600)
(34
)%
37,900
59,900
(22,000)
(37
)%
Other OEM sales .....................................
3,400
2,500
900
36
%
11,700
9,300
2,400
26
%
Total sales .........................................
34,800
44,700
(9,900)
(22
)%
138,700
185,400
(46,700)
(25
)%
Worldwide Engine Shipments
Engine Shipments |
 27
NYSE: NAV
Q4 2014 Earnings –
12/16/2014
U.S. and Canada Dealer Stock Inventory*
*Includes U.S. and Canada Class 4-8 and school bus inventory, but
does not include U.S. IC Bus. |
 28
NYSE: NAV
Q4 2014 Earnings –
12/16/2014
Frequently Asked Questions
Q1:
What is included in Corporate and Eliminations?
A:
The primary drivers of Corporate and Eliminations are Corporate
SG&A, pension and OPEB expense (excluding amounts allocated
to the segments), annual incentive, manufacturing interest expense, and
the elimination of intercompany sales and profit between
segments.
Q2:
What is included in your equity in loss of non-consolidated
affiliates? A:
Equity in loss of non-consolidated affiliates is derived from our
ownership interests in partially-owned affiliates that are not
consolidated.
Q3:
What is your net income attributable to non-controlling
interests? A:
Net income attributable to non-controlling interests is the result
of the consolidation of subsidiaries in which we do not own 100%,
and is primarily comprised of Ford's non-controlling interest in
our Blue Diamond Parts joint venture. Q4:
What are your expected 2015 and beyond pension funding
requirements? A:
Future contributions are dependent upon a number of factors,
principally the changes in values of plan assets, changes in interest
rates and the impact of any funding relief currently under
consideration. In 2014, we contributed $164 million to meet the minimum
required contributions for all plans. In August 2014, the Highway and
Transportation Funding Act of 2014, which included an extension
of the pension funding interest rate relief, was signed into law. As a result, we lowered our funding expectations. We
expect to contribute $148 million to our pension plans during
2015. We currently expect that from 2016 through 2017, the
Company
will
be
required
to
contribute
at
least
$100
million
per
year
to
the
plans,
depending
on
asset
performance
and
discount
rates. |
 29
NYSE: NAV
Q4 2014 Earnings –
12/16/2014
Frequently Asked Questions
Q5:
What is your expectation for future cash tax payments?
A:
Our cash tax payments are expect to remain low in 2015 and will
gradually increase as we utilize available net operating losses
(NOLs) and tax credits in future years.
Q6:
What is the current balance of net operating losses as compared to other
deferred tax assets? A:
As of October 31, 2014 the Company has deferred tax assets for U.S.
federal NOLs valued at $870 million, state NOLs valued at
$144
million,
and
foreign
NOLs
valued
at
$199
million,
for
a
total
undiscounted
cash
value
of
$1,213
million.
In
addition
to
NOLs,
the Company has deferred tax assets for accumulated tax credits of $256
million and other deferred tax assets of $1.9 billion
resulting
in
net
deferred
tax
assets
before
valuation
allowances
of
approximately
$3.4
billion.
Of
this
amount,
$3.2
billion
is
subject
to a valuation allowance at the end of FY2014.
Q7:
How does your FY 2014 Class 8 industry outlook compare to ACT Research?
A:
U.S. and Canadian Class 8 Truck Sales
Reconciliation
to
ACT
-
Retail
Sales
2014
ACT*
257,700
CY to FY adjustment
(10,418)
Total (ACT comparable Class 8 to Navistar)
247,282
Navistar Industry Retail Deliveries Combined Class 8 Trucks
235,000
240,000
Navistar difference from ACT
12,282
7,282
*Source:
ACT
N.A.
Commercial
Vehicle
Outlook
-
November
2014
5.0%
2.9%
Reconciliation to ACT -
Retail Sales
2015
ACT*
287,700
CY to FY adjustment
(77)
Total (ACT comparable Class 8 to Navistar)
287,623
Navistar Industry Retail Deliveries Combined Class 8 Trucks
250,000
280,000
Navistar difference from ACT
37,623
7,623
*Source:
ACT
N.A.
Commercial
Vehicle
Outlook
-
November
2014
13.1%
2.7% |
 30
NYSE: NAV
Q4 2014 Earnings –
12/16/2014
Frequently Asked Questions
Q8:
What is your manufacturing interest expense for Fiscal Year 2015?
A:
Manufacturing interest for 2015 is forecasted to be down approximately
5% compared to 2014. For reference, interest expense was $243
million and $251 million for FY 2014 and 2013, respectively.
Q9:
What should we assume for capital expenditures in Fiscal Year 2014?
A:
Capital expenditures for 2015 is forecasted to be around $150 million.
In comparison, capital expenditures were $88 million and $167
million for FY 2014 and 2013, respectively. |
 31
NYSE: NAV
Q4 2014 Earnings –
12/16/2014
Outstanding Debt Balances
(in millions)
October 31,
2014
October 31,
2013
Manufacturing operations
Senior Secured Term Loan Credit Facility, as Amended, due 2017, net of
unamortized discount of $3 and $4, respectively
...............................................................................................
$
694
$
693
8.25% Senior Notes, due 2021, net of unamortized discount of $20 and
$22, respectively ..........
1,180
1,178
3.00% Senior Subordinated Convertible Notes, due 2014, net of
unamortized discount of $26 ... —
544
4.50% Senior Subordinated Convertible Notes, due 2018, net of
unamortized discount of $19 and $23, respectively
.....................................................................................................................
181
177
4.75% Senior Subordinated Convertible Notes, due 2019, net of
unamortized discount of $40 ... 371
—
Debt of majority-owned dealerships
.............................................................................................
30
48
Financing arrangements and capital lease
obligations...................................................................
54
77
Loan Agreement related to 6.5% Tax Exempt Bonds, due 2040
................................................... 225
225
Promissory Note
............................................................................................................................
10
20
Financed lease
obligations.............................................................................................................
184
218
Other
..............................................................................................................................................
29
39
Total Manufacturing operations debt
.....................................................................................
2,958
3,219
Less: Current portion
.....................................................................................................................
100
658
Net long-term Manufacturing operations debt
.......................................................................
$
2,858
$
2,561
(in millions)
October 31,
2014
October 31,
2013
Financial Services operations
Asset-backed debt issued by consolidated SPEs, at fixed and
variable rates, due serially through 2019
.................................................................................................................................
$
914
$
778
Bank revolvers, at fixed and variable rates, due dates from 2014
through 2020 ........................... 1,242
1,018
Commercial paper, at variable rates, program matures in 2015
.................................................... 74
21
Borrowings secured by operating and finance leases, at various rates,
due serially through 2018
...............................................................................................................................................
36
49
Total Financial Services operations debt
................................................................................
2,266
1,866
Less: Current portion
.....................................................................................................................
1,195
505
Net long-term Financial Services operations debt
.................................................................
$
1,071
$
1,361
|
 32
NYSE: NAV
Q4 2014 Earnings –
12/16/2014
SEC Regulation G Non-GAAP Reconciliation
SEC Regulation G Non-GAAP Reconciliation
The financial measures presented below are unaudited and not in
accordance with, or an alternative for, financial measures
presented in accordance with U.S. generally accepted accounting
principles ("GAAP"). The non-GAAP financial information
presented herein should be considered supplemental to, and not as a
substitute for, or superior to, financial measures calculated in
accordance with GAAP and are reconciled to the most appropriate GAAP
number below. Earnings (loss) Before Interest, Income Taxes,
Depreciation, and Amortization (“EBITDA”):
We define EBITDA as our consolidated net income (loss) from continuing
operations attributable to Navistar International Corporation,
net of tax, plus manufacturing interest expense, income taxes, and depreciation and amortization. We believe EBITDA
provides meaningful information to the performance of our business and
therefore we use it to supplement our GAAP reporting. We have
chosen to provide this supplemental information to investors, analysts and other interested parties to enable them to perform
additional analyses of operating results.
Adjusted EBITDA:
We believe that adjusted EBITDA, which excludes certain identified
items that we do not consider to be part of our ongoing business,
improves the comparability of year to year results, and is
representative of our underlying performance. Management uses this
information to assess and measure the performance of our operating
segments. We have chosen to provide this supplemental
information to investors, analysts and other interested parties to
enable them to perform additional analyses of operating results, to
illustrate the results of operations giving effect to the non-GAAP
adjustments shown in the below reconciliations, and to provide an
additional measure of performance.
Manufacturing Cash, Cash Equivalents, and Marketable Securities:
Manufacturing cash, cash equivalents, and marketable securities
represents the Company’s consolidated cash, cash equivalents, and
marketable securities excluding cash, cash equivalents, and marketable
securities of our financial services operations. We include
marketable securities with our cash and cash equivalents when assessing
our liquidity position as our investments are highly liquid in
nature. We have chosen to provide this supplemental information to
investors, analysts and other interested parties to enable them to
perform additional analyses of our ability to meet our operating
requirements, capital expenditures, equity investments, and financial
obligations.
Structural costs
consists of Selling, general and administrative expenses and
Engineering and product development costs. |
 33
NYSE: NAV
Q4 2014 Earnings –
12/16/2014
SEC Regulation G Non-GAAP Reconciliations
Manufacturing segment cash and cash equivalents and marketable securities
reconciliation: 2008
2009
2010
2011
2012
2013
2014
(in millions)
Jan. 31,
Jan. 31,
Jan. 31,
Jan. 31,
Jan. 31,
Jan. 31,
Jan. 31,
Apr 30,
Jul. 31,
Oct. 31,
Manufacturing Operations:
Cash and cash equivalents ............
$
512
$
433
$
618
$
372
$
418
$
438
$
503
$
563
$
517
$
440
Marketable securities ....................
21
149
50
390
419
751
596
497
581
578
Manufacturing Cash and cash
equivalents and Marketable
$
533
$
582
$
668
$
762
$
837
$
1,189
$
1,099
$
1,060
$
1,098
$
1,018
Financial Services Operations:
Cash and cash equivalents ............
$
82
$
64
$
72
$
27
$
70
$
59
$
46
$
31
$
30
$
57
Marketable securities ....................
—
—
—
20
20
20
34
37
37
27
Financial Services Cash and cash
equivalents and Marketable
$
82
$
64
$
72
$
47
$
90
$
79
$
80
$
68
$
67
$
84
Consolidated Balance Sheet
Cash and cash equivalents ............
$
594
$
497
$
690
$
399
$
488
$
497
$
549
$
594
$
547
$
497
Marketable securities ....................
21
149
50
410
439
771
630
534
618
605
Consolidated Cash and cash
equivalents and Marketable
$
615
$
646
$
740
$
809
$
927
$
1,268
$
1,179
$
1,128
$
1,165
$
1,102
|
 34
NYSE: NAV
Q4 2014 Earnings –
12/16/2014
Quarter Ended
October 31, 2014
(in millions)
EBITDA (reconciled above)
................................................................................................................................
$
66
Less significant items of:
Adjustments to pre-existing warranties*
.......................................................................................................
(10
)
Brazil truck business actions*
.......................................................................................................................
29
Foundry actions*
...........................................................................................................................................
27
Other restructuring charges and strategic initiatives*
...................................................................................
4
50
Adjusted EBITDA ................................................................................................
..............................................
$
116
SEC Regulation G Non-GAAP Reconciliations
Earnings (loss) before interest, taxes, depreciation, and amortization
("EBITDA") reconciliation Quarters
Ended Years Ended
October 31,
October 31,
(in millions)
2014
2013
2014
2013
Loss
from
continuing
operations
attributable
to
NIC,
net
of
tax…………………………
$
(72
)
$
(153)
$
(622
)
$
(857)
Plus:
Depreciation
and
amortization
expense……………………………………………..
76
87
332
417
Manufacturing
interest
expense
(A)
…………………………………………...........…
61
63
243
251
Less:
Income
tax
benefit
(expense)………………………………………………………..
(1
)
224
(26
)
171
EBITDA………………………………………………………………………………….
$
66
$
(227)
$
(21
)
$
(360)
______________________
Quarters
Ended
October 31,
Years Ended
October 31,
(in millions)
2014
2013
2014
2013
Interest
Expense………………………………………………………….………....
80
81
$
314
$
321
Less:
Financial
services
interest
expense………………….…………………..……………
19
18
71
70
Manufacturing
interest
expense...…………………………………………………….
$
61
$
63
$
243
$
251
Adjusted EBITDA reconciliation:
______________________
* For more detail on the items noted, please see slides 35-36
footnotes (B), (C), (D), and (G) (A)
Manufacturing
interest
expense
is
the
net
interest
expense
primarily
generated
for
borrowings
that
support
the
manufacturing
and
corporate
operations, adjusted to eliminate intercompany interest expense with
our Financial Services segment. The following table reconciles Manufacturing
interest expense to the consolidated interest expense:
|
 35
NYSE: NAV
Q4 2014 Earnings –
12/16/2014
Quarters
Ended October 31,
Year Ended October 31,
(in millions)
2014
2013
2014
2013
Expense (income):
Brazil engine reporting unit impairment charges
(A)
$
—
$
—
$
149
$
—
Adjustments to pre-existing warranties
(B)
(10)
152
55
404
Brazil truck business actions
(C)
29
—
29
—
Foundry actions
(D)
27
—
27
—
Continental Mixer asset impairment
(E)
—
—
19
—
Canadian FSCO Tribunal Ruling
(F)
—
—
14
—
Restructuring charges and other strategic initiatives
(G)
4
—
22
25
Brazilian tax adjustments
(H)
(16)
—
13
—
North America asset impairment charges
(I)
—
80
—
97
Monaco RV divestiture
(J)
—
—
—
24
Charges for non-conformance penalties
(K)
—
7
2
36
Accelerated depreciation
(L)
—
2
—
41
Mahindra Joint Ventures divestiture
(M)
—
—
—
(26)
Intraperiod tax allocation
(N)
—
(220)
—
(220)
Legal settlement
(O)
—
—
—
(35)
Bison divestiture
(P)
—
—
—
(16)
Significant Items Included Within Our Results
______________________
(A)
In the second quarter of 2014, the Global Operations segment recorded
asset impairment charges of $149 million for the impairment of certain
intangible assets of our Brazilian engine reporting unit.
(B)
Adjustments to pre-existing warranties reflect changes in our
estimate of warranty costs for products sold in prior periods.
(C)
In the fourth quarter of 2014 our Global Operations segment recorded
approximately $29 million in charges to the right size the Brazil Truck business
these charge primarily related to inventory.
(D)
In the fourth quarter of 2014 the North America Truck segment recorded
$11 million of charges related to our anticipated exit from our Indianapolis,
Indiana foundry facility and certain assets in our Waukesha, Wisconsin
foundry operations which were impaired and certain other charges were
recorded.
The
charges
included
$13
million
of
restructuring
charges,
$7
million
of
fixed
asset
impairment
charges
and
$7
million
of
charges
for
inventory reserves.
(E)
In 2014 , the North America Truck segment recorded impairment charges
related to certain amortizing intangible assets and long-lived assets which
were determined to be fully impaired.
(F)
In
the
third
quarter
of
2014,
the
North
America
Truck
segment
recorded
$14
million
of
charges
related
to
the
2011
closure
of
its
Chatham,
Ontario
plant,
based on a ruling received from the Financial Services Tribunal in
Ontario Canada. |
 36
NYSE: NAV
Q4 2014 Earnings –
12/16/2014
Significant Items Included Within Our Results
(G)
In 2014 the Company recorded additional restructuring charges related to
cost reduction actions that included a reduction-in-force in the U.S and Brazil. In
2013 the Company recorded additional restructuring charges related to
cost reduction actions that included a reduction-in-force in the U.S.
(H)
In the second quarter of 2014, our evaluation of the realizability of
our Brazilian deferred tax assets resulted in a determination that a valuation allowance
was required. As a result, we recorded an income tax expense of $29
million, reflecting the establishment of the valuation allowance, and the tax impact of
the impairment of certain intangible assets. In the fourth quarter of
2014, we recorded an offsetting benefit of $16 million to reflect a tax law change in
Brazil
that
allowed
us
to
utilize
a
portion
of
the
net
operating
loss
carryforwards
to
satisfy
other
taxes.
(I)
In 2013, the North America Truck segment recognized asset impairment
charges consisting of: $77 million related to the impairment of the North America
Truck segment's entire goodwill balance, which was recorded in the
fourth quarter of 2013, and $20 million which were primarily the result of our ongoing
evaluation
of
our
portfolio
of
assets
to
validate
their
strategic
and
financial
fit,
which
led
to
the
discontinuation
of
certain
engineering
programs
related
to
products that were determined to be outside of our core operations or
not performing to our expectations. (J)
In
May
2013,
the
Company
divested
substantially
all
of
its
interest
in
the
operations
of
Monaco.
As
a
result
of
the
divestiture,
charges
of
$24
million
relating
to
the
impairment
of
certain
assets
and
the
expected
loss
from
the
divestiture
were
recognized
and
are
included
in
the
Loss
from
discontinued
operations.
(K)
The North America Truck segment recorded charges for
non-conformance penalties, primarily for certain 13L engine sales.
(L)
Of the total charges for accelerated depreciation in 2013, $21 million,
which included the $2 million recognized in the fourth quarter of 2013, were primarily
related to certain assets affected by the discontinuation of certain
engine programs, particularly the MaxxForce15L, and $20 million was related to certain
assets related to the closure of our Garland Facility.
(M)
In
the
second
quarter
of
2013,
the
Company
sold
its
stake
in
the
Mahindra
Joint
Ventures
to
Mahindra
for
$33
million
and
the
Global
Operations
segment
recognized a gain of $26 million.
(N)
In the fourth quarter of 2013, the Company met the criteria necessary
to apply the exception within the intraperiod tax allocation rules, since it incurred a
loss
from
continuing
operations
and
income
was
recognized
in
both
Total
other
comprehensive
income
(loss)
and
Additional
paid
in
capital.
As
a
result,
an
income
tax
benefit
of
$220
million
was
recorded
in
Income
tax
benefit
(expense)
related
to
continuing
operations
and
an
offsetting
tax
expense
of
$212
million and $8 million in Total other comprehensive income (loss)
and Additional paid in capital, respectively.
(O)
In
the
first
quarter
of
2013
as
a
result
of
the
legal
settlement
with
Deloitte
and
Touche
LLP,
the
Company
received
cash
proceeds
of
$35
million.
(P)
In the first quarter of 2013, as a result of the divestiture of Bison
the company recognized a gain of $16 million. The above items,
except for the Brazilian tax adjustments, did not have a material impact on taxes due to the valuation allowances on our U.S. and Brazil deferred
tax assets. |