Attached files
| file | filename |
|---|---|
| 8-K - 8-K - Colfax CORP | a2015financialoutlook.htm |
FINANCIAL OUTLOOK & SUMMARY SCOTT BRANNAN | SVP and CFO STEVE SIMMS | President and CEO Journey Toward Excellence
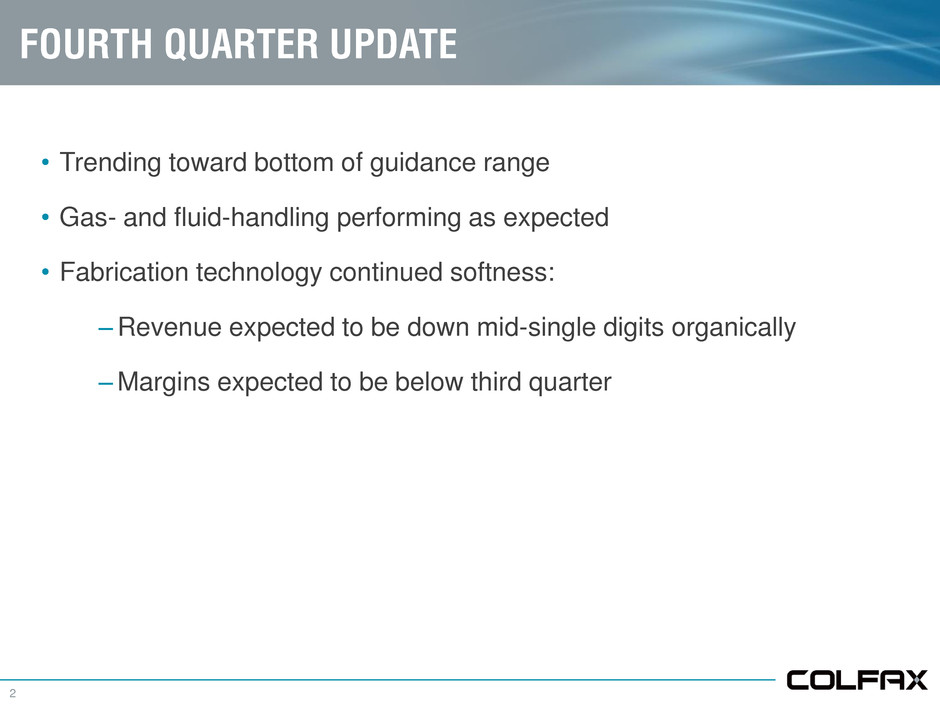
2 FOURTH QUARTER UPDATE • Trending toward bottom of guidance range • Gas- and fluid-handling performing as expected • Fabrication technology continued softness: –Revenue expected to be down mid-single digits organically –Margins expected to be below third quarter
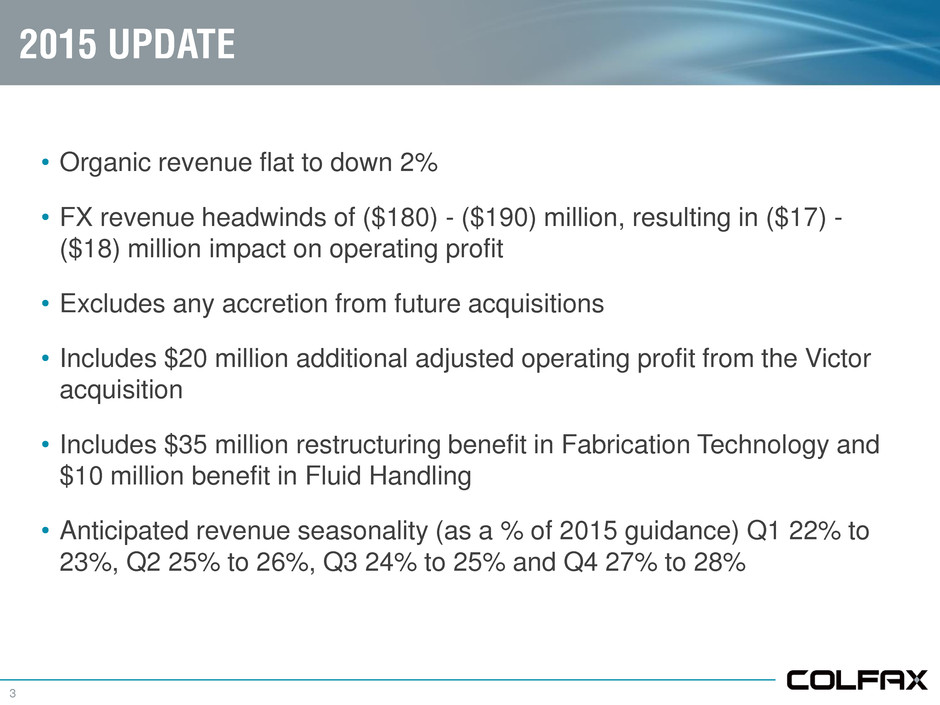
3 2015 UPDATE • Organic revenue flat to down 2% • FX revenue headwinds of ($180) - ($190) million, resulting in ($17) - ($18) million impact on operating profit • Excludes any accretion from future acquisitions • Includes $20 million additional adjusted operating profit from the Victor acquisition • Includes $35 million restructuring benefit in Fabrication Technology and $10 million benefit in Fluid Handling • Anticipated revenue seasonality (as a % of 2015 guidance) Q1 22% to 23%, Q2 25% to 26%, Q3 24% to 25% and Q4 27% to 28%
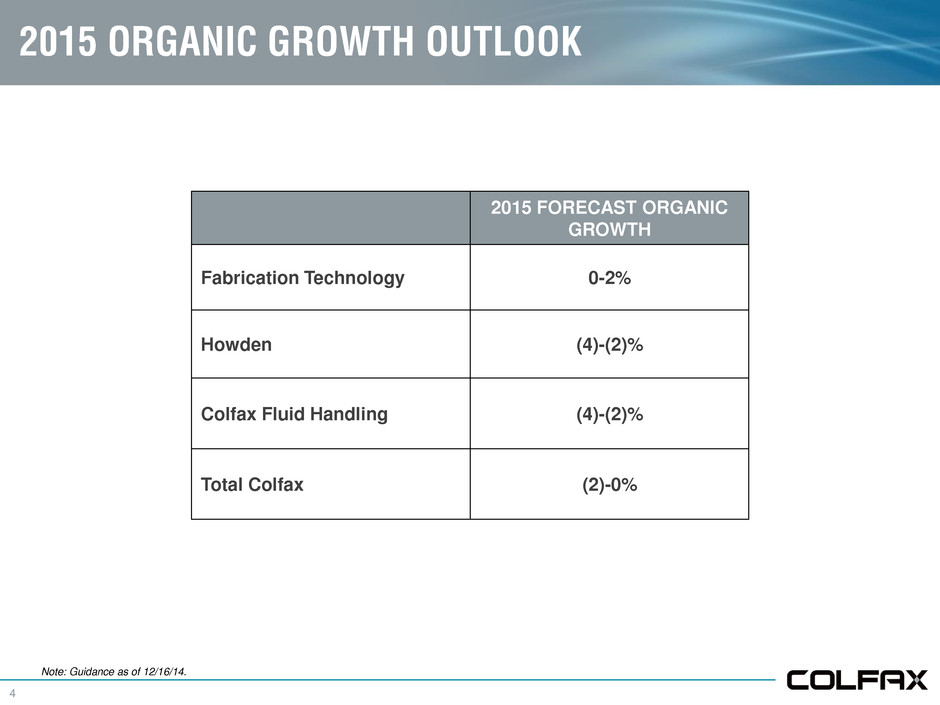
4 2015 ORGANIC GROWTH OUTLOOK 2015 FORECAST ORGANIC GROWTH Fabrication Technology 0-2% Howden (4)-(2)% Colfax Fluid Handling (4)-(2)% Total Colfax (2)-0% Note: Guidance as of 12/16/14.
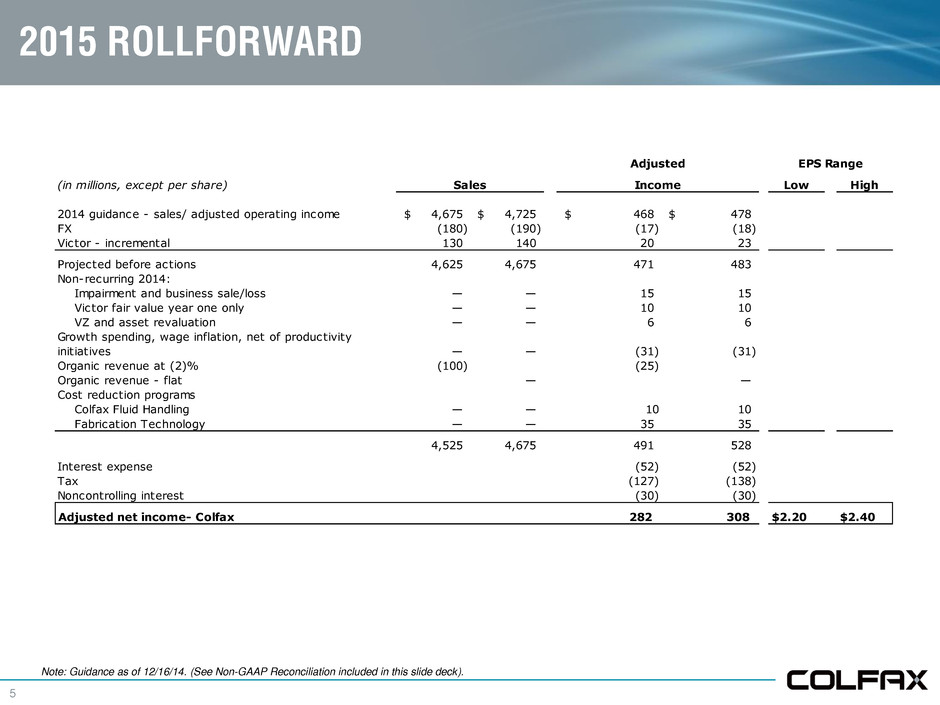
5 2015 ROLLFORWARD (in millions, except per share) Low High 2014 guidance - sales/ adjusted operating income 4,675$ 4,725$ 468$ 478$ FX (180) (190) (17) (18) Victor - incremental 130 140 20 23 Projected before actions 4,625 4,675 471 483 Non-recurring 2014: Impairment and business sale/loss — — 15 15 Victor fair value year one only — — 10 10 VZ and asset revaluation — — 6 6 Growth spending, wage inflation, net of productivity initiatives — — (31) (31) Organic revenue at (2)% (100) (25) Organic revenue - flat — — Cost reduction programs Colfax Fluid Handling — — 10 10 Fabrication Technology — — 35 35 4,525 4,675 491 528 Interest expense (52) (52) Tax (127) (138) Noncontrolling interest (30) (30) Adjusted net income- Colfax 282 308 $2.20 $2.40 Adjusted EPS Range Sales Income Note: Guidance as of 12/16/14. (See Non-GAAP Reconciliation included in this slide deck).
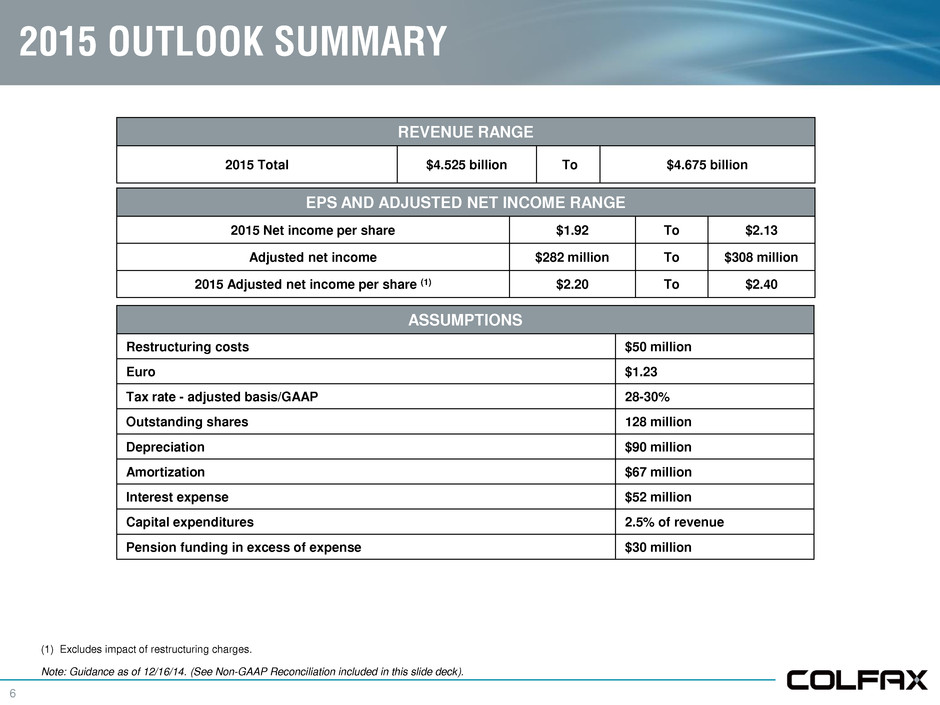
6 2015 OUTLOOK SUMMARY REVENUE RANGE 2015 Total $4.525 billion To $4.675 billion EPS AND ADJUSTED NET INCOME RANGE 2015 Net income per share $1.92 To $2.13 Adjusted net income $282 million To $308 million 2015 Adjusted net income per share (1) $2.20 To $2.40 ASSUMPTIONS Restructuring costs $50 million Euro $1.23 Tax rate - adjusted basis/GAAP 28-30% Outstanding shares 128 million Depreciation $90 million Amortization $67 million Interest expense $52 million Capital expenditures 2.5% of revenue Pension funding in excess of expense $30 million (1) Excludes impact of restructuring charges. Note: Guidance as of 12/16/14. (See Non-GAAP Reconciliation included in this slide deck).
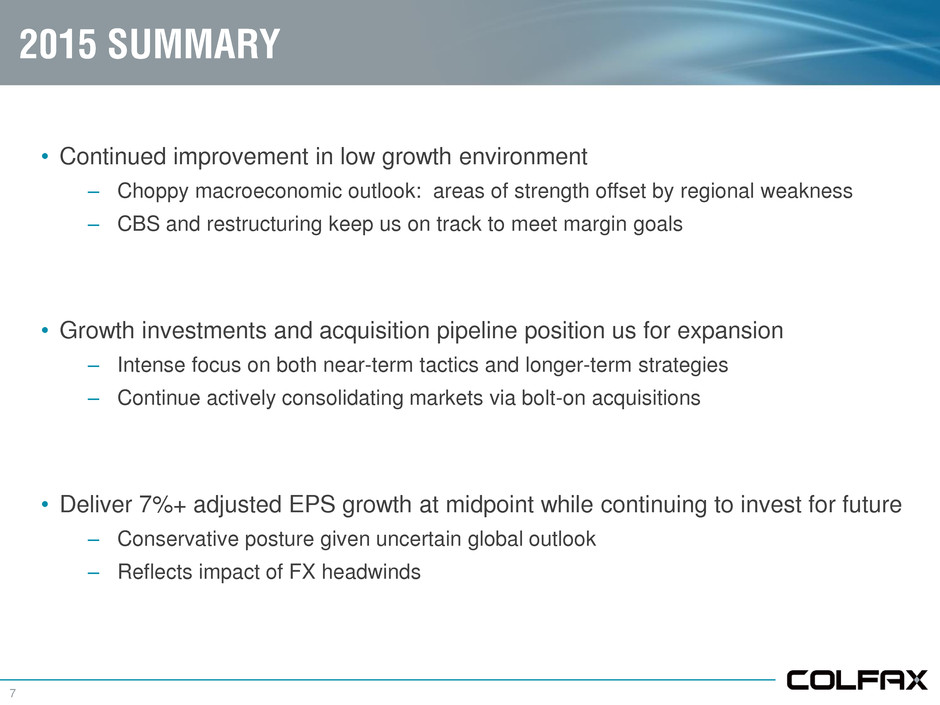
7 2015 SUMMARY • Continued improvement in low growth environment – Choppy macroeconomic outlook: areas of strength offset by regional weakness – CBS and restructuring keep us on track to meet margin goals • Growth investments and acquisition pipeline position us for expansion – Intense focus on both near-term tactics and longer-term strategies – Continue actively consolidating markets via bolt-on acquisitions • Deliver 7%+ adjusted EPS growth at midpoint while continuing to invest for future – Conservative posture given uncertain global outlook – Reflects impact of FX headwinds
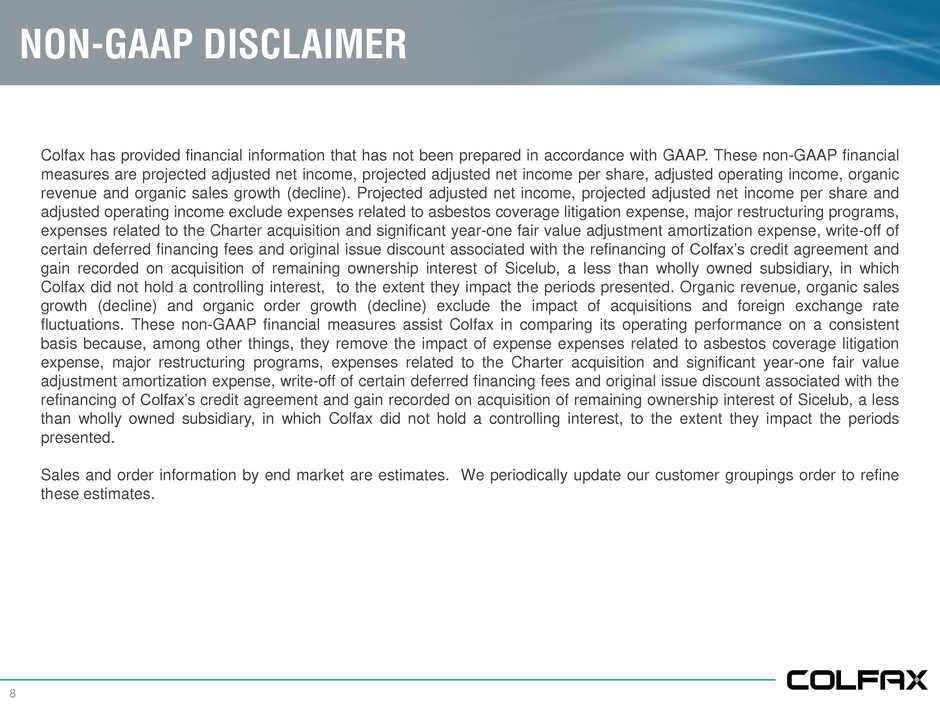
8 NON-GAAP DISCLAIMER Colfax has provided financial information that has not been prepared in accordance with GAAP. These non-GAAP financial measures are projected adjusted net income, projected adjusted net income per share, adjusted operating income, organic revenue and organic sales growth (decline). Projected adjusted net income, projected adjusted net income per share and adjusted operating income exclude expenses related to asbestos coverage litigation expense, major restructuring programs, expenses related to the Charter acquisition and significant year-one fair value adjustment amortization expense, write-off of certain deferred financing fees and original issue discount associated with the refinancing of Colfax’s credit agreement and gain recorded on acquisition of remaining ownership interest of Sicelub, a less than wholly owned subsidiary, in which Colfax did not hold a controlling interest, to the extent they impact the periods presented. Organic revenue, organic sales growth (decline) and organic order growth (decline) exclude the impact of acquisitions and foreign exchange rate fluctuations. These non-GAAP financial measures assist Colfax in comparing its operating performance on a consistent basis because, among other things, they remove the impact of expense expenses related to asbestos coverage litigation expense, major restructuring programs, expenses related to the Charter acquisition and significant year-one fair value adjustment amortization expense, write-off of certain deferred financing fees and original issue discount associated with the refinancing of Colfax’s credit agreement and gain recorded on acquisition of remaining ownership interest of Sicelub, a less than wholly owned subsidiary, in which Colfax did not hold a controlling interest, to the extent they impact the periods presented. Sales and order information by end market are estimates. We periodically update our customer groupings order to refine these estimates.
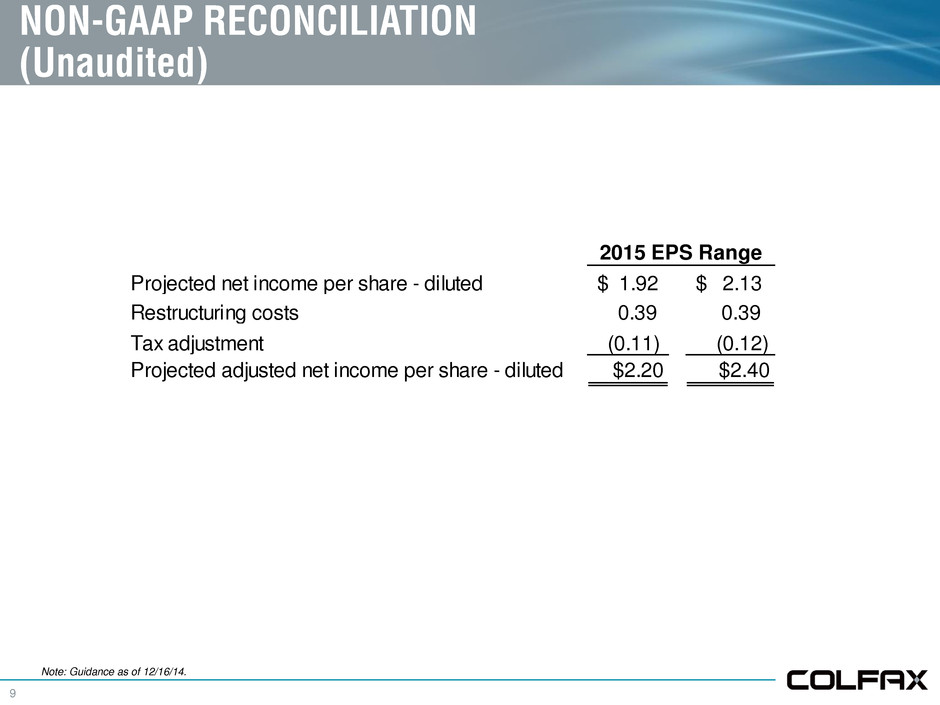
9 NON-GAAP RECONCILIATION (Unaudited) Projected net income per share - diluted $ 1.92 $ 2.13 Restructuring costs 0.39 0.39 Tax adjustment (0.11) (0.12) Projected adjusted net income per share - diluted $2.20 $2.40 2015 EPS Range Note: Guidance as of 12/16/14.
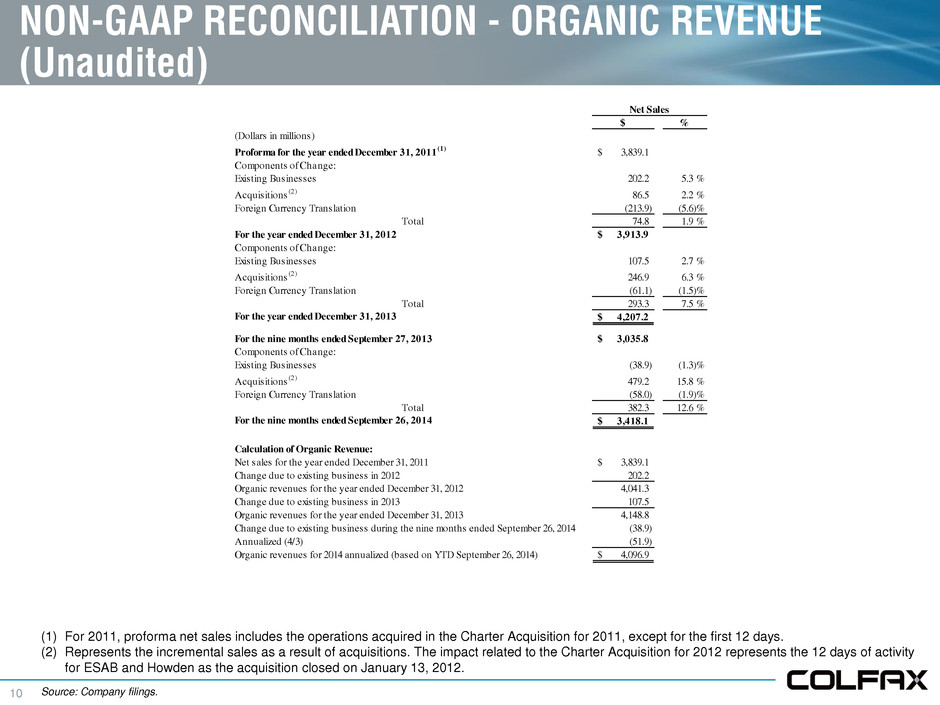
10 NON-GAAP RECONCILIATION - ORGANIC REVENUE (Unaudited) $ % (Dollars in millions) Proforma for the year ended December 31, 2011 (1) 3,839.1$ Components of Change: Existing Businesses 202.2 5.3 % Acquisitions (2) 86.5 2.2 % Foreign Currency Translation (213.9) (5.6)% Total 74.8 1.9 % For the year ended December 31, 2012 3,913.9$ Components of Change: Existing Businesses 107.5 2.7 % Acquisitions (2) 246.9 6.3 % Foreign Currency Translation (61.1) (1.5)% Total 293.3 7.5 % For the year ended December 31, 2013 4,207.2$ For the nine months ended September 27, 2013 3,035.8$ Components of Change: Existing Businesses (38.9) (1.3)% Acquisitions (2) 479.2 15.8 % Foreign Currency Translation (58.0) (1.9)% Total 382.3 12.6 % For the nine months ended September 26, 2014 3,418.1$ Calculation of Organic Revenue: Net sales for the year ended December 31, 2011 3,839.1$ Change due to existing business in 2012 202.2 Organic revenues for the year ended December 31, 2012 4,041.3 Change due to existing business in 2013 107.5 Organic revenues for the year ended December 31, 2013 4,148.8 Change due to existing business during the nine months ended September 26, 2014 (38.9) Annualized (4/3) (51.9) Organic revenues for 2014 annualized (based on YTD September 26, 2014) 4,096.9$ Net Sales Source: Company filings. (1) For 2011, proforma net sales includes the operations acquired in the Charter Acquisition for 2011, except for the first 12 days. (2) Represents the incremental sales as a result of acquisitions. The impact related to the Charter Acquisition for 2012 represents the 12 days of activity for ESAB and Howden as the acquisition closed on January 13, 2012.
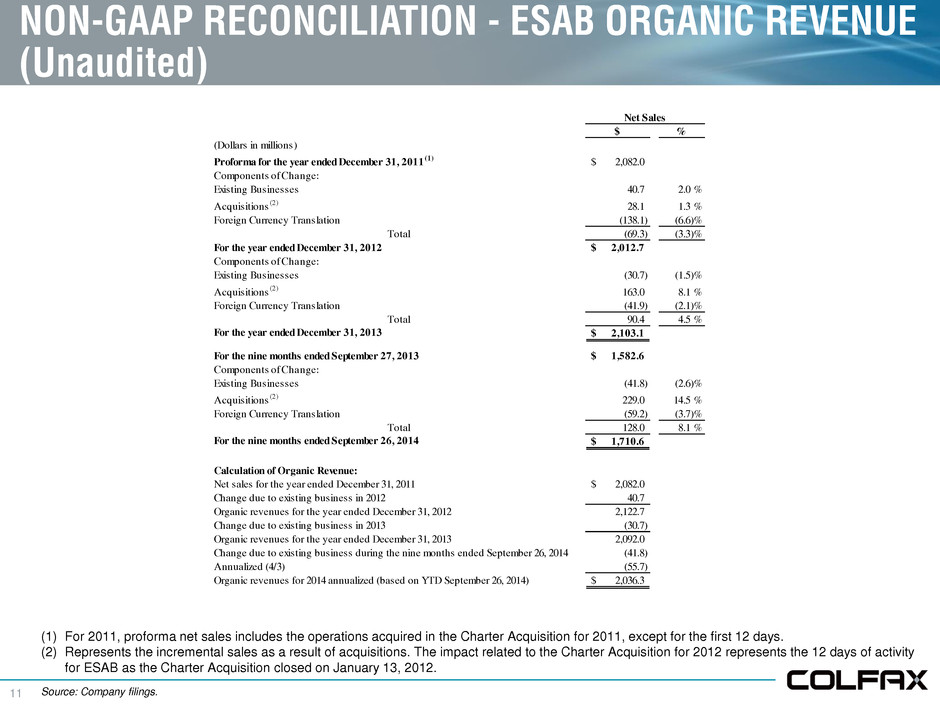
11 NON-GAAP RECONCILIATION - ESAB ORGANIC REVENUE (Unaudited) Source: Company filings. (1) For 2011, proforma net sales includes the operations acquired in the Charter Acquisition for 2011, except for the first 12 days. (2) Represents the incremental sales as a result of acquisitions. The impact related to the Charter Acquisition for 2012 represents the 12 days of activity for ESAB as the Charter Acquisition closed on January 13, 2012. $ % (Dollars in millions) Proforma for the year ended December 31, 2011 (1) 2,082.0$ Components of Change: Existing Businesses 40.7 2.0 % Acquisitions (2) 28.1 1.3 % Foreign Currency Translation (138.1) (6.6)% Total (69.3) (3.3)% For the year ended December 31, 2012 2,012.7$ Components of Change: Existing Businesses (30.7) (1.5)% Acquisitions (2) 163.0 8.1 % Foreign Currency Translation (41.9) (2.1)% Total 90.4 4.5 % For the year ended December 31, 2013 2,103.1$ For the nine months ended September 27, 2013 1,582.6$ Components of Change: Existing Businesses (41.8) (2.6)% Acquisitions (2) 229.0 14.5 % Foreign Currency Translation (59.2) (3.7)% Total 128.0 8.1 % For the nine months ended September 26, 2014 1,710.6$ Calculation of Organic Revenue: Net sales for the year ended December 31, 2011 2,082.0$ Change due to existing business in 2012 40.7 Organic revenues for the year ended December 31, 2012 2,122.7 Change due to existing business in 2013 (30.7) Organic revenues for the year ended December 31, 2013 2,092.0 Change due to existing business during the nine months ended September 26, 2014 (41.8) Annualized (4/3) (55.7) Organic revenues for 2014 annualized (based on YTD September 26, 2014) 2,036.3$ Net Sales
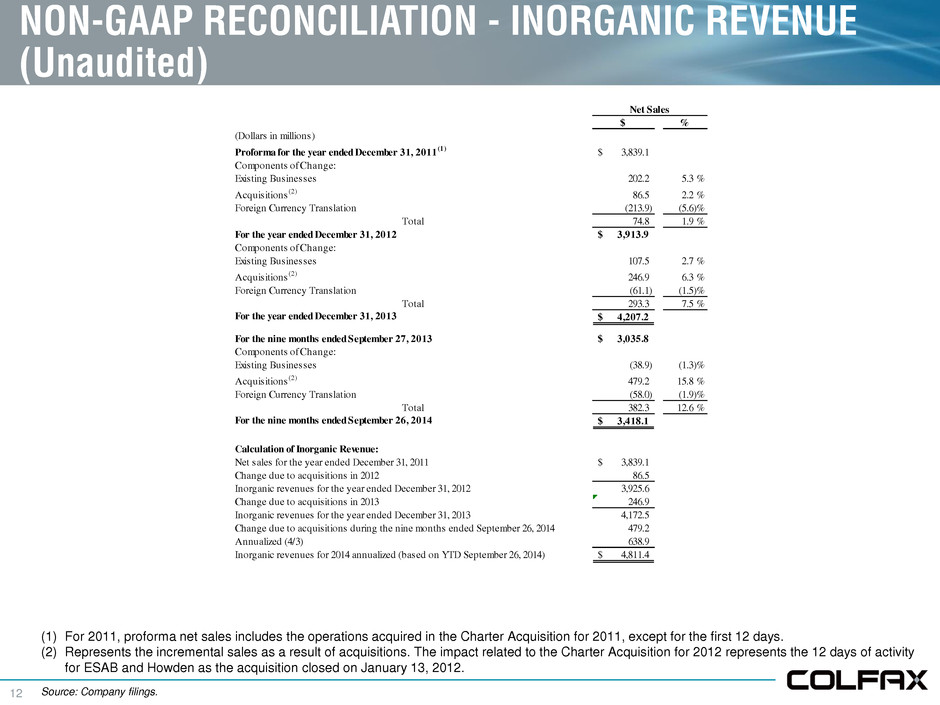
12 NON-GAAP RECONCILIATION - INORGANIC REVENUE (Unaudited) Source: Company filings. $ % (Dollars in millions) Proforma for the year ended December 31, 2011 (1) 3,839.1$ Components of Change: Existing Businesses 202.2 5.3 % Acquisitions (2) 86.5 2.2 % Foreign Currency Translation (213.9) (5.6)% Total 74.8 1.9 % For the year ended December 31, 2012 3,913.9$ Components of Change: Existing Businesses 107.5 2.7 % Acquisitions (2) 246.9 6.3 % Foreign Currency Translation (61.1) (1.5)% Total 293.3 7.5 % For the year ended December 31, 2013 4,207.2$ For the nine months ended September 27, 2013 3,035.8$ Components of Change: Existing Businesses (38.9) (1.3)% Acquisitions (2) 479.2 15.8 % Foreign Currency Translation (58.0) (1.9)% Total 382.3 12.6 % For the nine months ended September 26, 2014 3,418.1$ Calculation of Inorganic Revenue: Net sales for the year ended December 31, 2011 3,839.1$ Change due to acquisitions in 2012 86.5 Inorganic revenues for the year ended December 31, 2012 3,925.6 Change due to acquisitions in 2013 246.9 Inorganic revenues for the year ended December 31, 2013 4,172.5 Change due to acquisitions during the nine months ended September 26, 2014 479.2 Annualized (4/3) 638.9 Inorganic revenues for 2014 annualized (based on YTD September 26, 2014) 4,811.4$ Net Sales (1) For 2011, proforma net sales includes the operations acquired in the Charter Acquisition for 2011, except for the first 12 days. (2) Represents the incremental sales as a result of acquisitions. The impact related to the Charter Acquisition for 2012 represents the 12 days of activity for ESAB and Howden as the acquisition closed on January 13, 2012.
