Attached files
| file | filename |
|---|---|
| 8-K - 8-K - VERIFONE SYSTEMS, INC. | form8-kitems20290112152014.htm |
| EX-99.1 - PRESS RELEASE, DATED DECEMBER 15, 2014 - VERIFONE SYSTEMS, INC. | ex991q42014pressrelease.htm |

FINANCIAL RESULTS December 15, 2014 For the Fourth Quarter Ended October 31, 2014 Exhibit 99.2

Today’s discussion may include “forward-looking statements” within the meaning of the Private Securities Litigation Reform Act of 1995. Such statements relate to future events and expectations and involve known and unknown risks and uncertainties. Verifone’s actual results or actions may differ materially from those projected in the forward-looking statements. For a summary of the specific risk factors that could cause results to differ materially from those expressed in the forward-looking statements, please refer to Verifone’s filings with the Securities and Exchange Commission, including its annual report on Form 10-K and quarterly reports on Form 10-Q. Verifone is under no obligation to, and expressly disclaims any obligation to, update or alter its forward-looking statements, whether as a result of new information, future events, changes in assumptions or otherwise. FORWARD-LOOKING STATEMENTS

NON-GAAP FINANCIAL MEASURES 3 With respect to any Non-GAAP financial measures presented in the information, reconciliations of Non-GAAP to GAAP financial measures may be found in Verifone’s quarterly earnings release as filed with the Securities and Exchange Commission as well as the Appendix to these slides. Management uses Non-GAAP financial measures only in addition to and in conjunction with results presented in accordance with GAAP. Management believes that these Non-GAAP financial measures help it to evaluate Verifone’s performance and to compare Verifone’s current results with those for prior periods as well as with the results of peer companies. These Non-GAAP financial measures contain limitations and should be considered as a supplement to, and not as a substitute for, or superior to, disclosures made in accordance with GAAP.

INTRODUCTION Paul Galant CEO

WHAT WE ACHIEVED IN FY14 5 Restored top line growth; improved YOY profitability Earning back client trust; recapturing share Progress executing Top Three Verifone Initiatives Transformed people platform; attracted world class talent Began transformation into a global product company for Terminal Solutions, Payment as a Service & Commerce Enablement

Q4 FINANCIAL RESULTS: KEY TAKEAWAYS 6 CONTINUED STRONG FINANCIAL PERFORMANCE • 5 consecutive quarters of sequential growth • 13% year-over-year revenue growth in Q4 • 300+ bps increase in operating profit margins to 13.9% • Improved balance sheet metrics • Healthy free cash flow RECORD RESULTS IN NORTH AMERICA • 20% year-over-year revenue growth in Q4 • Momentum in all market segments (Tier 1, SMB, Petro and Taxi) GLOBAL GROWTH ACROSS ALL MARKETS • 5% growth and improved competitive position in EMEA • Strong growth in Turkey and Nigeria • 16% growth in Latin America • Significant win in Mexico with BBVA • 24% growth in Asia

EXECUTING ON THE TOP THREE VERIFONE INITIATIVES 7 What we’ve accomplished Where we started Product Portfolio Management R&D Re-Engineering Cost Optimization • 1200+ product SKUs • Redundant, one-off customizations • Fragmentation, complexity, slow deployments • Legacy products • Too many platforms • 75 global R&D sites • Needed efficiency to self-fund the execution of transformation and next chapter strategy • Implemented Global Product Mgmt • Reduced SKUs by 60% to ~500 • Reduced platforms from 13 to 8 • Addressed portfolio gaps • Divested non-core businesses • Consolidating R&D sites from 75 to 34 (incl.10 global centers of excellence) • Unifying development environment • Consolidating gateways • Implemented R&D planning tool • Initiated 100 cost-savings projects • Reduced headcount by ~500 • Began 20% data center consolidation • Reduced suppliers by 23% • Closed 19 of 130 facilities • Liquidated 16 of 132 legal entities • Refinanced debt with $1.3B agreement
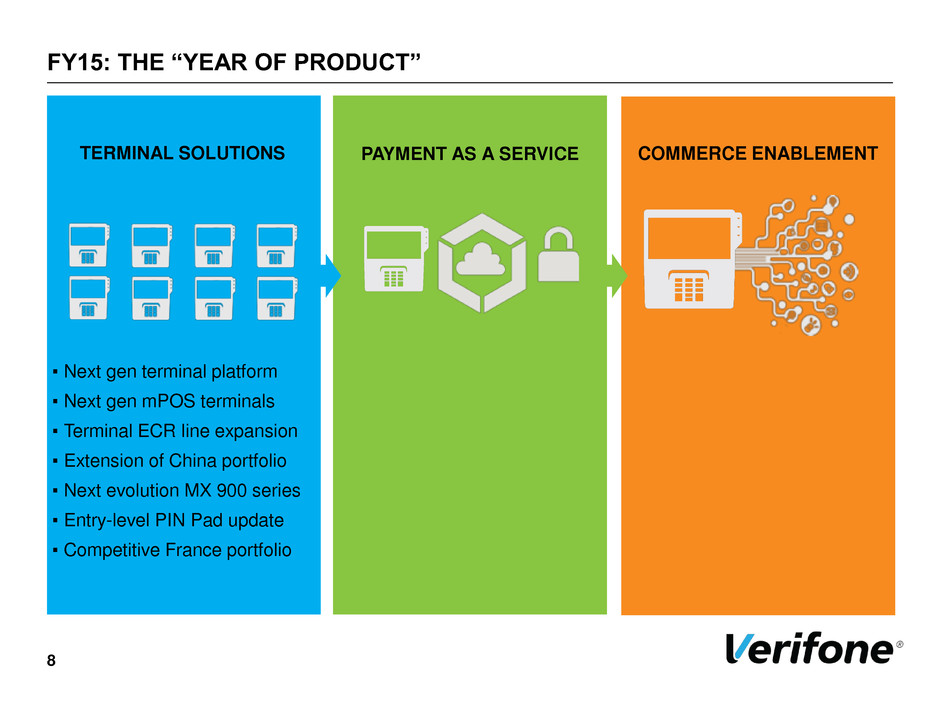
FY15: THE “YEAR OF PRODUCT” 8 PAYMENT AS A SERVICE COMMERCE ENABLEMENT TERMINAL SOLUTIONS ▪ Next gen terminal platform ▪ Next gen mPOS terminals ▪ Terminal ECR line expansion ▪ Extension of China portfolio ▪ Next evolution MX 900 series ▪ Entry-level PIN Pad update ▪ Competitive France portfolio

COMMERCE ENABLEMENT FY15: THE “YEAR OF PRODUCT” 9 PAYMENT AS A SERVICE TERMINAL SLUTIONS TERMINAL SOLUTIONS ▪ Enhance infrastructure ▪ Expand functionality ▪ Grow in new markets ▪ Accelerate convergence of e- commerce, m-commerce and brick & mortar solutions ▪ Invest in global terminal estate management solution ▪ Expand secure commerce architecture ▪ Next gen terminal platform ▪ Next gen mPOS terminals ▪ Terminal ECR line expansion ▪ Extension of China portfolio ▪ Next evolution MX 900 series ▪ Entry-level PIN Pad update ▪ Competitive France portfolio

COMMERCE ENABLEMENT FY15: THE “YEAR OF PRODUCT” 10 PAYMENT AS A SERVICE TERMINAL SLUTIONS TERMINAL SOLUTIONS ▪ Enhance infrastructure ▪ Expand functionality ▪ Grow in new markets ▪ Accelerate convergence of e- commerce, m-commerce and brick & mortar solutions ▪ Invest in global terminal estate management solution ▪ Expand secure commerce architecture ▪ Next gen terminal platform ▪ Next gen mPOS terminals ▪ Terminal ECR line expansion ▪ Extension of China portfolio ▪ Next evolution MX 900 series ▪ Entry-level PIN Pad update ▪ Competitive France portfolio ▪ Extend media platform ▪ Expand position in value added services ▪ Replicate online experiences inside the store ▪ Enable Verifone and 3rd party applications ▪ Advance cloud POS offerings

Q4 FINANCIAL RESULTS AND GUIDANCE Marc Rothman CFO
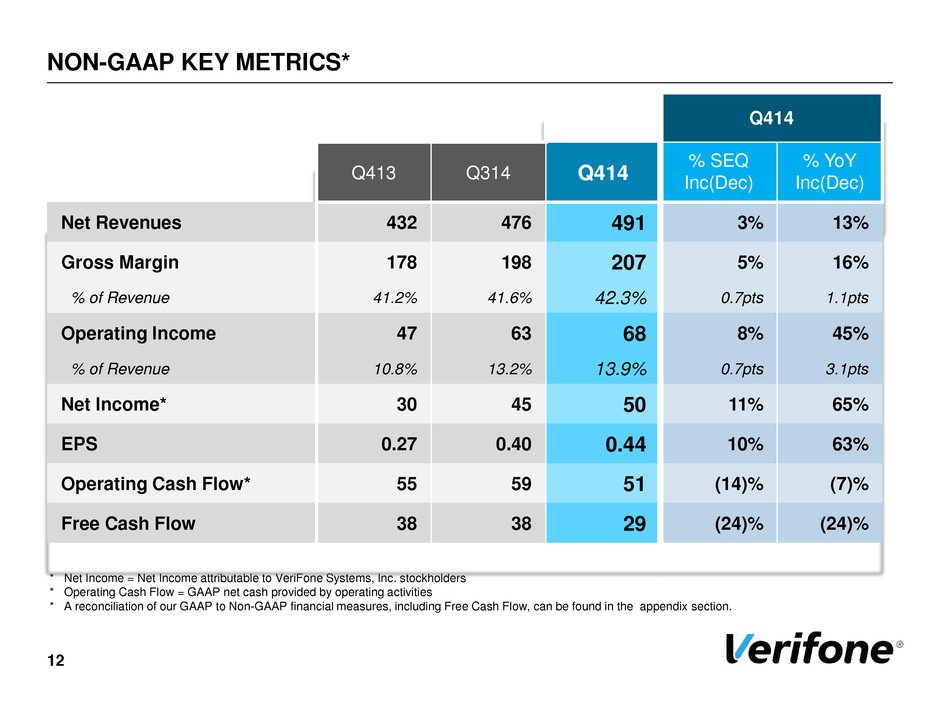
NON-GAAP KEY METRICS* 12 * Net Income = Net Income attributable to VeriFone Systems, Inc. stockholders * Operating Cash Flow = GAAP net cash provided by operating activities * A reconciliation of our GAAP to Non-GAAP financial measures, including Free Cash Flow, can be found in the appendix section. Q414 Q413 Q314 Q414 % SEQ Inc(Dec) % YoY Inc(Dec) Net Revenues 432 476 491 3% 13% Gross Margin 178 198 207 5% 16% % of Revenue 41.2% 41.6% 42.3% 0.7pts 1.1pts Operating Income 47 63 68 8% 45% % of Revenue 10.8% 13.2% 13.9% 0.7pts 3.1pts Net Income* 30 45 50 11% 65% EPS 0.27 0.40 0.44 10% 63% Operating Cash Flow* 55 59 51 (14)% (7)% Free Cash Flow 38 38 29 (24)% (24)%

$ in millions NON-GAAP NET REVENUES PROFILE* Q414 Q413 Q314 Q414 % SEQ Inc(Dec) % YoY Inc(Dec) Organic YoY Growth Organic YoY Constant Currency Growth North America 124 130 149 15% 20% 20% 20% LAC 71 89 82 (8)% 16% 16% 20% EMEA 180 190 189 (1)% 5% 5% 7% Asia-Pacific 57 67 70 4% 24% 24% 23% TOTAL 432 476 491 3% 13% 13% 15% Q314 Q414 Q413 NA 29% ASIA-PAC 13% LAC 16% EMEA 42% NA 27% ASIA-PAC 14% LAC 19% EMEA 40% NA 30% ASIA-PAC 14% LAC 17% EMEA 39% * A reconciliation of our GAAP to Non-GAAP Net Revenues can be found in the appendix section 13

NON-GAAP NET REVENUES AND GROSS MARGIN* 14 * A reconciliation of our GAAP to Non-GAAP Net revenues and gross margin can be found in the appendix section $ in millions Q413 Q314 Q414 System Solutions 38.3% 41.3% 41.5% Services 45.5% 42.1% 43.6% Total Gross Margin % 41.2% 41.6% 42.3% Q413 Q314 Q414 System Solutions 259 299 311 Services 173 177 180 Total Net Revenues 432 476 491 Services % of Total Net Revenues 40% 37% 37% $ in millions % of Revenue

NON-GAAP OPERATING EXPENSES* 15 * A reconciliation of our GAAP to Non-GAAP operating expenses can be found in the appendix section $ in millions Q413 Q314 Q414 Research and Development 44 46 47 % of Revenue 10% 10% 10% Sales and Marketing 48 47 50 % of Revenue 11% 10% 10% General and Administrative 39 42 42 % of Revenue 9% 9% 9% Total Operating Expenses 131 135 139 % of Revenue 30% 28% 28%

TOTAL CASH, GROSS DEBT AND NET DEBT 16 Total Cash ($ in millions) 477 506 309 268 249 230 264 250 Q113 Q213 Q313 Q413 Q114 Q214 Q314 Q414 Gross Debt ($ in millions) 1292 1279 1119 1036 1001 940 924 883 Q113 Q213 Q313 Q413 Q114 Q214 Q314 Q414 883 As of October 31, 2014: $883M Outstanding Debt: – Short-term of $32M – Long-term of $851M Credit Ratings: – S&P . . . BB- – Moody’s . . . Ba3 Net Debt ($ in millions) 815 773 810 768 752 710 660 633 Q113 Q213 Q313 Q413 Q114 Q214 Q314 Q414 633

Q413 Q314 Q414 $ Days $ Days $ Days Accounts Receivables, net 284 59 299 57 306 56 Inventories, net 139 55 113 37 124 38 Accounts Payable 117 41 143 46 161 51 Cash Conversion Cycle 73 48 43 $ in millions, except days Notes: Accounts Receivable Days is calculated as Accounts Receivable, net divided by Non-GAAP Total Net Revenues * 90 days Inventory Days is calculated as Average Inventory, net divided by Non-GAAP Total Cost of Net Revenues * 90 days Accounts Payable Days is calculated as Accounts Payable divided by Non-GAAP Total Cost of Net Revenues * 90 days Cash Conversion Cycle is calculated as Accounts Receivable Days plus Inventory Days less Accounts Payable Days A reconciliation of our GAAP to Non-GAAP total net revenues and GAAP to Non-GAAP total cost of net revenues can be found in the appendix section. BALANCE SHEET SELECT DATA 17 Improved Cash Conversion Cycle by 5 days

WORKING CAPITAL TREND 18 Working Capital Performance* 22.6% 20.1% 19.7% 17.7% 15.7% 14.3% 14.1% 13.7% 10.0% 12.0% 14.0% 16.0% 18.0% 20.0% 22.0% 24.0% Q113 Q213 Q313 Q413 Q114 Q214 Q314 Q414 Percent of S a le s Q/Q changes • Improved metrics in AR Y/Y changes • AR increased $22M • Inventory decreased $14M • AP increased $45M * Working Capital Performance, as % of Non-GAAP Total Net Revenues = working capital / quarterly non-GAAP Total Net Revenues annualized * Working Capital = AR + Inventory – AP * A reconciliation of our GAAP to Non-GAAP total net revenues can be found in the appendix section.

CASH FLOW 19 53 79 49 55 32 57 59 51 Q113 Q213 Q313 Q413 Q114 Q214 Q314 Q414 Operating Cash Flow* 51 33 58 31 38 11 36 38 29 Q113 Q213 Q313 Q413 Q114 Q214 Q314 Q414 Free Cash Flow* 29 ($ in millions) ($ in millions) Operating Cash Flow: $51M Free Cash Flow: $29M * Operating Cash Flow = GAAP net cash provided by operating activities. Free Cash Flow is a non-GAAP financial measure. * A reconciliation of our GAAP net cash provided by operating activities to Free Cash Flow can be found in the appendix section. CapEx: $22M
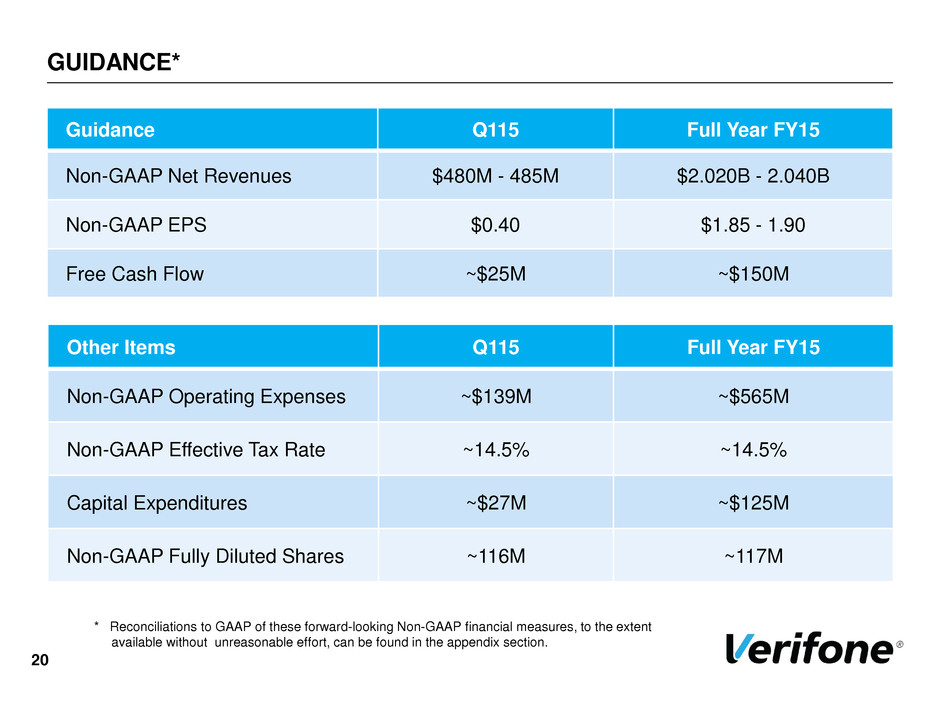
20 Guidance Q115 Full Year FY15 Non-GAAP Net Revenues $480M - 485M $2.020B - 2.040B Non-GAAP EPS $0.40 $1.85 - 1.90 Free Cash Flow ~$25M ~$150M Other Items Q115 Full Year FY15 Non-GAAP Operating Expenses ~$139M ~$565M Non-GAAP Effective Tax Rate ~14.5% ~14.5% Capital Expenditures ~$27M ~$125M Non-GAAP Fully Diluted Shares ~116M ~117M * Reconciliations to GAAP of these forward-looking Non-GAAP financial measures, to the extent available without unreasonable effort, can be found in the appendix section. GUIDANCE*

Q&A SESSION

CONCLUSION Paul Galant CEO

APPENDIX

RECONCILIATION OF GAAP TO NON-GAAP KEY METRICS Q414 24 (1) Net income (loss) per share is calculated by dividing the Net income (loss) attributable to VeriFone Systems, Inc. stockholders by the Weighted average number of shares. See explanatory notes for A, D-G at the end of the appendix. 24

RECONCILIATION OF GAAP TO NON-GAAP KEY METRICS Q314 25 (1) Net income (loss) per share is calculated by dividing the Net income (loss) attributable to VeriFone Systems, Inc. stockholders by the Weighted average number of shares. See explanatory notes for A, D-G at the end of the appendix.

RECONCILIATION OF GAAP TO NON-GAAP KEY METRICS Q413 26 (1) Net income (loss) per share is calculated by dividing the Net income (loss) attributable to VeriFone Systems, Inc. stockholders by the Weighted average number of shares. See explanatory notes for A, D-G at the end of the appendix. (In millions, except per share data and percentages) Note Net revenues Gross margin Gross margin percentage Operating income (loss) Net income (loss) attributable to VeriFone Systems, Inc. stockholders Three Months Ended October 31, 2013 GAAP $ 431.2 $ 164.0 38.0 % $ (15.8 ) $ (247.7 ) Adjustments: Amortization of step-down in deferred services net revenues at acquisition A 1.1 1.1 1.1 1.1 Amortization of purchased intangible assets D — 11.4 35.9 35.9 Other merger, acquisition and divestiture related expenses D — 0.7 3.5 4.2 Stock based compensation E — 0.8 16.9 16.9 Other charges and income F — — 5.0 4.9 Income tax effect of non-GAAP exclusions and adjustment to cash basis tax rate F — — — 215.0 Non-GAAP $ 432.3 $ 178.0 41.2 % $ 46.6 $ 30.3 Weighted average number of shares used in computing net income (loss) per share: Net income (loss) per share attributable to VeriFone Systems, Inc. stockholders (1) Basic Diluted Basic Diluted GAAP 109.5 109.5 $ (2.26 ) $ (2.26 ) Adjustment for diluted shares G — 2.2 Non-GAAP 109.5 111.7 $ 0.28 $ 0.27

RECONCILIATION OF GAAP TO NON-GAAP GROSS MARGIN 27 See explanatory notes for A, D-F at the end of the appendix (In millions, except percentages) Note System solutions net revenues Services net revenues Total net revenues Total cost of net revenues System solutions gross margin Services gross margin Total gross margin Three Months Ended October 31, 2014 GAAP $ 310.9 $ 179.6 $ 490.5 $ 294.0 $ 119.8 $ 76.7 $ 196.5 Amortization of step-down in deferred services net revenues at acquisition A — 0.2 0.2 — — 0.2 0.2 Other acquisition, divestiture and restructure related, net D — — — (10.8 ) 9.5 1.3 10.8 Stock based compensation E — — — (0.7 ) 0.5 0.2 0.7 Other charges and income F — — — 0.8 (0.8 ) — (0.8 ) Non-GAAP $ 310.9 $ 179.8 $ 490.7 $ 283.3 $ 129.0 $ 78.4 $ 207.4 Percentage of total net revenues 63.4 % 36.6 % 57.7 % 41.5 % 43.6 % 42.3 % Three Months Ended July 31, 2014 GAAP $ 299.4 $ 176.5 $ 475.9 $ 293.1 $ 112.6 $ 70.2 $ 182.8 Amortization of step-down in deferred services net revenues at acquisition A — 0.5 0.5 — — 0.5 0.5 Other acquisition, divestiture and restructure related, net D — — — (12.5 ) 10.2 2.3 12.5 Stock based compensation E — — — (0.5 ) 0.3 0.2 0.5 Other charges and income F — — — (1.9 ) 0.5 1.4 1.9 Non-GAAP $ 299.4 $ 177.0 $ 476.4 $ 278.2 $ 123.6 $ 74.6 $ 198.2 Percentage of total net revenues 62.8 % 37.2 % 58.4 % 41.3 % 42.1 % 41.6 % Three Months Ended October 31, 2013 GAAP $ 259.4 $ 171.8 $ 431.2 $ 267.2 $ 88.2 $ 75.8 $ 164.0 Amortization of step-down in deferred services net revenues at acquisition A — 1.1 1.1 — — 1.1 1.1 Other acquisition, divestiture and restructure related, net D — — — (12.1 ) 10.6 1.5 12.1 Stock based compensation E — — — (0.8 ) 0.5 0.3 0.8 Non-GAAP $ 259.4 $ 172.9 $ 432.3 $ 254.3 $ 99.3 $ 78.7 $ 178.0 Percentage of total net revenues 60.0 % 40.0 % 58.8 % 38.3 % 45.5 % 41.2 %

RECONCILIATION OF GAAP TO NON-GAAP OPERATING EXPENSES 28 See explanatory notes for D-F at the end of the appendix (In millions, except percentages) Not e Research and development Sales and marketing General and administrative Total Three Months Ended October 31, 2014 GAAP $ 50.0 $ 56.3 $ 50.6 $ 156.9 Other acquisition, divestiture and restructure related, net D (0.3 ) (0.2 ) (1.3 ) (1.8 ) Stock based compensation E (2.8 ) (4.9 ) (4.6 ) (12.3 ) Cost of debt refinancing F — — — — Other charges and income F — (0.8 ) (2.8 ) (3.6 ) Non-GAAP $ 46.9 $ 50.4 $ 41.9 $ 139.2 As a percentage of Non-GAAP Net Revenues 10 % 10 % 9 % 28 % Three Months Ended July 31, 2014 GAAP $ 53.2 $ 54.1 $ 58.5 $ 165.8 Other acquisition, divestiture and restructure related, net D (4.8 ) (2.0 ) (2.7 ) (9.5 ) Stock based compensation E (2.1 ) (5.6 ) (5.0 ) (12.7 ) Cost of debt refinancing F — — (4.1 ) (4.1 ) Other charges and income F — 0.7 (4.9 ) (4.2 ) Non-GAAP $ 46.3 $ 47.2 $ 41.8 $ 135.3 As a percentage of Non-GAAP Net Revenues 10 % 10 % 9 % 28 % Three Months Ended October 31, 2013 GAAP $ 45.8 $ 54.8 $ 54.3 $ 154.9 Other acquisition, divestiture and restructure related, net D (0.4 ) (0.1 ) (2.3 ) (2.8 ) Stock based compensation E (1.1 ) (5.7 ) (9.3 ) (16.1 ) Other charges and income F — (0.5 ) (4.1 ) (4.6 ) Non-GAAP $ 44.3 $ 48.5 $ 38.6 $ 131.4 As a percentage of Non-GAAP Net Revenues 10 % 11 % 9 % 30 %

RECONCILIATION OF GAAP TO NON-GAAP NET REVENUES 29 See explanatory notes for A-C at the end of the appendix.

RECONCILIATION OF OPERATING CASH FLOW TO FREE CASH FLOW 30 See explanatory notes for H at the end of the appendix.

RECONCILIATION OF NET REVENUES GUIDANCE 31 31 See explanatory notes for A at the end of the appendix.

EXPLANATORY NOTES TO RECONCILIATIONS OF GAAP TO NON-GAAP ITEMS 32 Note A: Non-GAAP net revenues. Non-GAAP net revenues exclude the fair value decrease (step-down) in deferred revenue at acquisition. Note B: Non-GAAP organic net revenues. Verifone determines non-GAAP organic net revenues by deducting net revenues from businesses acquired in the past 12 months from non-GAAP net revenues. Net revenues from businesses acquired in the past 12 months consists of net revenues derived from the sales channels of acquired resellers and distributors, and net revenues from System solutions and Services attributable to businesses acquired in the 12 months preceding the respective financial quarter(s). For acquisitions of small businesses that are integrated within a relatively short time after the close of the acquisition, we assume quarterly net revenues attributable to such acquired businesses during the 12 months following acquisition remain at the same level as in the first full quarter after the acquisition closed. Note C: Non-GAAP organic net revenues at constant currency. Verifone determines non-GAAP organic net revenues at constant currency by recomputing non-GAAP organic net revenues denominated in currencies other than U.S. Dollars in the current fiscal period using average exchange rates for that particular currency during the corresponding financial period of the prior year. Verifone uses this non-GAAP measure to evaluate performance on a comparable basis excluding the impact of foreign currency fluctuations. Note D: Merger, Acquisition and Divestiture Related. Verifone adjusts certain revenues and expenses for items that are the result of merger, acquisitions and divestitures. Acquisition related adjustments include the amortization of purchased intangible assets, fixed asset fair value adjustments, contingent consideration adjustments, incremental costs associated with acquisitions, acquisition integration expenses, loss on financial instruments entered into to fix the acquisition purchase price in U.S. dollars when it is payable in foreign currencies and fair value increase (step-up) of inventory on acquisition, changes in estimate on contingencies that existed at the time of acquisition or collectability of associated notes receivable and gains on divestitures, as well as the net revenues, cost of net revenues and operating expenses for the three months ended January 31, 2013, that are attributable to divested assets and business operations. Note E: Stock-Based Compensation. Our non-GAAP financial measures eliminate the effect of expense for stock-based compensation. Note F: Other Charges and Income. Verifone excludes certain revenue, expenses and other income (expense) that are the result of unique or unplanned events, such as litigation settlement and loss contingency expense, certain costs incurred in connection with senior executive management changes, certain personnel and outside professional service fees incurred on initiatives to transform, streamline and centralize our global operations, restructure and impairment charges related to certain exit activities initiated as part of our global transformation initiatives and gain or loss on financial transactions, such as the accelerated amortization of capitalized debt issuance costs due to the early repayment of debt and penalties due to customers related to the July 2012 fire that occurred in one of our repair and staging facilities in Brazil. In addition, income taxes are adjusted for the tax effect of the adjusting items related to our non-GAAP financial measures and to reflect our estimate of cash taxes on a non-GAAP basis. Under GAAP our Income tax provision (benefit) as a percentage of Income (loss) before income taxes was (5.3)% for the fiscal quarter ended October 31, 2014, (25.5)% for the fiscal quarter ended July 31, 2014, (790.2)% for the fiscal quarter ended October 31, 2013, 8.6% for the year ended October 31, 2014 and 175.8% for the year ended October 31, 2013. For non-GAAP purposes, we used a 14.5% rate for the fiscal quarters ended October 31, 2014 and July 31, 2014, as well as the year period ended October 31, 2014, and we used a 14.0% rate for the fiscal quarter and year ended October 31, 2013. These non-GAAP tax rates reflect our estimate of cash tax payments as a percentage of Income (loss) before income taxes for the corresponding periods. Note G: Non-GAAP diluted shares. Diluted non-GAAP weighted average shares include additional shares that are dilutive for non-GAAP computations of earnings per share in periods when we have a non-GAAP net income and a GAAP basis net loss. Note H: Free Cash Flow. Verifone determines free cash flow as net cash provided by operating activities less capital expenditures.
